developing smart grouted sand columns for real
TRANSCRIPT


DEVELOPING SMART GROUTED SAND COLUMNS FOR REAL
TIME MONITORING OF THE STABILITY, SEEPAGE AND RAPID
DRAWDOWN IN EARTH DAMS
A Thesis
Presented to
the Faculty of the Department of Civil & Environmental Engineering
University of Houston
In Partial Fulfillment
of the Requirements for the Degree
Master of Science
in Civil Engineering
by
Halil Ibrahim Kula
December 2016

DEVELOPING SMART GROUTED SAND COLUMNS FOR REAL
TIME MONITORING OF THE STABILITY, SEEPAGE AND RAPID
DRAWDOWN IN EARTH DAMS
________________________ Halil Ibrahim Kula
Approved: ___________________________________ Chair of the Committee Cumaraswamy Vipulanandan, Professor, Civil and Environmental Engineering
Committee Members: ___________________________________
Yi-Lung Mo, Professor, Civil and Environmental Engineering
___________________________________ Gino J. Lim, Professor, Industrial Engineering
_____________________________ ___________________________________ Suresh K. Khator, Associate Dean, Roberto Ballarini, Professor and Chair, Cullen College of Engineering Civil and Environmental Engineering

iv
ACKNOWLEDGEMENTS
I would like to express my greatest gratitude to my supervisor, Dr. C. Vipulanandan, who
directed all stages of my research program with his professional guidance and academic advice.
This work could not be successfully completed without him. I would also like to thank Dr. Yi-Lung
Mo and Dr. Gino J. Lim for their participation of the defense committee.
Appreciation is also expressed to GEM Group members for their help. Thank you for your
encouragement and your beneficial discussions that provided me the strength to move forward.
I would like to send my deepest gratitude to my family, Ramazan and Necla Kula. Thank
you for your love and moral support. Lastly, I appreciate the General Directorate of State Hydraulic
Works (DSI), Turkey, for financial support.

v
DEVELOPING SMART GROUTED SAND COLUMNS FOR REAL
TIME MONITORING OF THE STABILITY, SEEPAGE AND RAPID
DRAWDOWN IN EARTH DAMS
An Abstract
of a
Presented to
the Faculty of the Department of Civil & Environmental Engineering
University of Houston
In Partial Fulfillment
of the Requirements for the Degree
Master of Science
in Civil Engineering
by
Halil Ibrahim Kula
December 2016

vi
ABSTRACT
The reservoir drawdown can negatively affect the upstream slope stability of earth dams
due to removal of the balancing hydraulic forces acting on the dams during undrained condition in
the soil. Therefore, monitoring upstream slope during rapid drawdown is an important task in terms
of stability. Having lower wetting zone inside the earth dam using low permeability materials can
provide a good design for earth dams and prevent possible failures which is related to seepage
problems.
In this study, acrylamide grouted sand was used to monitor upstream slope during rapid
drawdown and control the seepage inside the earth dam. To better characterize the behavior, over
140 grouted sand specimens were prepared with different particle size of sands. Particle size,
gradation, and compaction affected the compressive strength of grouted sands. The compressive
strength of the grouted sands varied from 240 kPa to 775 kPa after 7 days of moist curing. Also,
the curing time after 3 days did not affect the mechanical properties of the grouted sands. Nonlinear
Vipulanandan p-q constitutive model was used to predict the mechanical behavior of acrylamide
grouted sands. The permeability of grouted sand was 10-12 m/sec, and it was not affected by grain
size distribution and particle size.
Electrical resistivity was identified as the sensing and monitoring property for the
acrylamide grouted sands. The acrylamide grouted sand with and without conductive filler were
piezoresistive. Electrical resistivity change was identified as the sensing and monitoring property
for the acrylamide grouted sands. 0.1% conductive filler (CF) was added to make the grouted sands
very sensitive under water submerged and moist conditions. Adding CF increased piezoresistivity
from 10% to 21%. Nonlinear Vipulanandan p-q constitutive model was used to predict the
piezoresistive behavior of the grouted sands. Assigning acrylamide grouted sand to upstream face
decreased phreatic line in the earth dam and seepage quantity and increased the stability of earth
dam twice compare to clay core.

vii
In this study, the potential use of grouted sand in installation was numerically investigated
using an earth dam 2-D model. Seepage and stability analysis were performed during rapid
drawdown condition and change in shear stress were quantified. Shear stress change was used to
check the piezoresistivity of acrylamide grouted sand columns used in the model embankment.
Based on the changes in the electrical resistivity for real-time monitoring, location for the
piezoresistive grouted sand columns were identified.

viii
TABLE OF CONTENTS
ACKNOWLEDGEMENTS ............................................................................................................ iv
ABSTRACT .................................................................................................................................... vi
TABLE OF CONTENTS .............................................................................................................. viii
LIST OF FIGURES ........................................................................................................................ xi
TABLE OF CONTENTS .............................................................................................................. xiii
CHAPTER 1 INTRODUCTION ............................................................................................... 1
General ......................................................................................................................................... 1
Objectives .................................................................................................................................... 2
Organization ................................................................................................................................. 2
CHAPTER 2 BACKGROUND AND LITERATURE REVIEW .............................................. 3
Introduction .................................................................................................................................. 3
Main Functions of Dams .............................................................................................................. 4
History of the Dams ..................................................................................................................... 4
Types of Dams ............................................................................................................................. 5
Embankment Dams .................................................................................................................. 6
The forces acting on dams ........................................................................................................... 7
Water Pressure ......................................................................................................................... 7
Dam Weight ............................................................................................................................. 8
Earthquakes .............................................................................................................................. 9
Ice ............................................................................................................................................. 9
Failures and Damages in Earth Dams .......................................................................................... 9
Seepage in Earth Dams and the Importance of Seepage in Dam`s Body .............................. 10

ix
Monitoring for Earth Dams ........................................................................................................ 11
Instrumentation in Earthfill Dams ......................................................................................... 12
Acrylamide Grout ...................................................................................................................... 16
History of Acrylamide Grout ................................................................................................. 16
Working Properties of Acrylamide Grout .............................................................................. 16
Seepage and Stability Analysis in Earthfill Dams ..................................................................... 18
Seepage Analysis ................................................................................................................... 18
Stability Analysis ................................................................................................................... 20
Summary .................................................................................................................................... 22
CHAPTER 3 MATERIALS AND METHODS ....................................................................... 23
Materials .................................................................................................................................... 23
Acrylamide Grout .................................................................................................................. 23
Sand ....................................................................................................................................... 24
Specimen Preparation and Testing Method ............................................................................... 25
Preparing Grout Solution ........................................................................................................... 25
Grouted Sand Samples Preparation........................................................................................ 26
Test Methods .......................................................................................................................... 26
Modeling .................................................................................................................................... 29
Stress-Strain Model ................................................................................................................ 29
Piezoresistivity Model ........................................................................................................... 30
Summary .................................................................................................................................... 30
CHAPTER 4 GROUTED SAND BEHAVIOR ....................................................................... 32

x
Permeability of Grouted Sands .............................................................................................. 32
Mechanical Properties of Grouted Sand ................................................................................ 33
Impedance Model................................................................................................................... 40
Summary ................................................................................................................................ 46
CHAPTER 5 SEEPAGE CONTROL AND MONITORING IN EARTH DAMS ........................ 48
Introduction ................................................................................................................................ 48
Dam Model and Material Properties .......................................................................................... 49
Modeling and Analysis .......................................................................................................... 50
Results and Discussions ............................................................................................................. 56
Effect of Mesh Size on Leakage Flow Rate and Phreatic Line .............................................. 56
Effect of Slope on Miminum Factor of Safety ....................................................................... 56
Effect of Unsaturated Shear Strength of Soil on Factor of Safety ......................................... 58
Monitoring Shear Stress in Earth Dam .................................................................................. 61
Seepage Control in the Earth Dam ......................................................................................... 63
Summary ................................................................................................................................ 66
CHAPTER 6 CONCLUSIONS AND RECOMMENDATIONS ................................................. 67
Conclusions ................................................................................................................................ 67
Recommendations ...................................................................................................................... 69
REFERENCES .............................................................................................................................. 70
xi
LIST OF FIGURES
Figure 2-1:Typical Main Components of Dam ................................................................................ 3
Figure 2-2:Applications for Earth Dams .......................................................................................... 4
Figure 2-3:Earthfill and Rockfill Dams (a) Homogeneous Earth Dam, (b) Rockfill Dam with a
Centrally Located Core, (c) Rockfill Dam with a Inclined Core Clay Earth, and (d) Rockfill Dam
with a Facing .................................................................................................................................... 8
Figure 2-4:Suggested Locations for Piezometers in Earthfill Dams .............................................. 13
Figure 2-5:Locations for Inclinometers in Earth Dams ................................................................ 14
Figure 2-6:Locations for Settlement Cells in Earthfill Dams ........................................................ 14
Figure 2-7:Location for Extensometers ......................................................................................... 15
Figure 2-8:Location for Pressure cells ........................................................................................... 15
Figure 3-1:Particle Size Distribution of the Selected Sand ............................................................ 25
Figure 3-2:Mixing Procedure for Acrylamide Grout. .................................................................... 26
Figure 3-3:Setup for Preparing Grouted Sands .............................................................................. 27
Figure 3-4:Compression Test Machine and Grouted Sand Samples ............................................. 28
Figure 3-5:LCR Meter for Piezoresistivity Measurements ............................................................ 29
Figure 4-1:The effect of D10 on the Permeability of Sands and Grouted Sands ............................ 32
Figure 4-2:The effect of Curing Condition on the Stress-Strain relationship of Grouted Sands. .. 34
Figure 4-3:Effect of Curing Time on the Compressive Strength ................................................... 35
Figure 4-4:Effect of Density on the Compressive Strengths of Grouted Sand .............................. 36
Figure 4-5:Model Prediction of Stress-Strain Behavior of Grouted Sands ................................... 36
Figure 4-6:Influence of Curing Time on Strain of Grouted Sands ................................................ 37
Figure 4-7:Influence of Curing Time on Modulus of Grouted Sands ............................................ 38
Figure 4-8:Influence of Effective Grain size on the Elasticity Modulus of Grouted Sand ............ 39
Figure 4-9:Shear Strength Parameters for Acrylamide Grouted Sands ........................................ 40
xii
Figure 4-10:Equivalent Circuit for Case1 ...................................................................................... 42
Figure 4-11:Equivalent Circuit for Case 2 ..................................................................................... 42
Figure 4-12:Comparison of Typical Responses of Equivalent Circuits for Case 1 and Case 2 ..... 42
Figure 4-13:Monitoring Setting Time for Acrylamide Grouted Sands .......................................... 43
Figure 4-14:Stress-resistivity Relationship and Model Prediction of Grouted Sands ................... 44
Figure 4-15: Stress-resistivity Relationship and Model Prediction of Grouted Sands .................. 45
Figure 4-16:Effect of Moisture on Weight Change of Acrylamide Grouted Sand ....................... 45
Figure 4-17:Effect of Moisture Content on Weight Change of Grouted Sand .............................. 46
Figure 5-1:Dam Geometry ............................................................................................................. 50
Figure 5-2:Soil Water Characteristic Curve for Unsaturated Shear Strength Parameters for
Earth Materials ............................................................................................................................... 52
Figure 5-3:Earth Dam with Mesh and Boundary Conditions for Steady-state Analysis ............... 54
Figure 5-4:Critical Trial Surfaces for Rapid Drawdown Condition .............................................. 55
Figure 5-5:Effect of Mesh Size on Phreatic Line Level ................................................................ 57
Figure 5-6:Effect of Upstream Slope on Minimum Factor of Safety for Rapid Drawdown ......... 58
Figure 5-7:Effect of Unsaturated Shear Strength of Soil on Minimum Factor of Safety .............. 59
Figure 5-8:Effect of Rapid Drawdown Rate on Min. Factor of Safety .......................................... 60
Figure 5-9:Effect of Friction Angle on Min. Factor of Safety ....................................................... 60
Figure 5-10:Locations for Monitoring Shear Stress in Earth Dam After Rapid Drawdown
Condition. ...................................................................................................................................... 61
Figure 5-11:Shear Stress Change After Rapid Drawdown ........................................................... 62
Figure 5-12:Monitoring Shear Stress in Earth Dam During Rapid Drawdown ............................. 62
Figure 5-13:Selected Locations in the Earth Dam for Acrylamide Grouted Sand (a), (b), (c), and
(d) ................................................................................................................................................... 64
Figure 5-14:Seepage Quantity Changes for Different Locations of Grouted Sands ................... 65
Figure 5-15:Effect of Acrylamide Grouted Sand on Phreatic Line in the Earth Dam (a) (b) ........ 65

xiii
TABLE OF CONTENTS
Table 2-1:Classification of Dams .................................................................................................... 6
Table 2-2:Number of Embankment Dams Around the World During Different Time Periods ..... 6
Table 2-3:Applications of Acrylamide Grout to Stop Water Leak. ............................................... 17
Table 3-1:Summary of Sand Properties ......................................................................................... 24
Table 3-2:Unit weight and Strength of Grouted Sand Specimens ................................................. 27
Table 4-1:Weight and Density Change of Grouted Sands for Different Curing Methods. ............ 33
Table 4-2:Density of the Acrylamide Grouted Sands .................................................................... 35
Table 4-3:Stress-Strain Model Parameters .................................................................................... 36
Table 5-1:Minimum Factor of Safety Values for Earth dams by USACE, 2003 ........................... 48
Table 5-2:Selected Earth Dams for Model .................................................................................... 49
Table 5-3:Recommended Material Types for Zoned Earthfill Dams by Bureau of
Reclamation. .................................................................................................................................. 50
Table 5-4:Values for Shear Strength of Soil Materials by USCS .................................................. 51
Table 5-5:Material Properties for Earth Dam ................................................................................ 52
Table 5-6:Effect of Mesh Size on Seepage Quantity ..................................................................... 56
Table 5-7:Effect of Upstream Slope on Minimum Factor of Safety Under Three Conditional. .... 57
Table 5-8:Stability of Earth Dam after Using Grouted Sand For Upstream face (1m) ................. 66

1
CHAPTER 1 INTRODUCTION
General
Earth dam is an artificial barrier that is constructed to retain water. Dams are mainly
constructed for retention of water in a confined and used for water supply, flood control, irrigation,
energy production, recreation and fishing (ICOLD). They are mainly classified into four parts
according to their structure types (Ersayin, 2006). These are gravity, buttress, embankment and
arch dams. Dams which are built using earth materials, are commonly referred to earthfill dams.
There are 11.192 earthfill dams around the world according to Foster (2000).
When it comes to designing embankment dams, stability and seepage control are required
for dam safety. When there is no enough or suitable clay material in the dam area, embankment
dams are constructed with two permeable shells and with impermeable core in the middle (Athani,
2015). The reasons for failures in embankment dams are generally referred to following reasons
such as; seepage failure, piping through dam body, hydraulic failure and structural damage due to
earthquake effect (Osuji, S.O., 2015).
Designing, planning, and constructing of a dam requires great attention and care. Even
dams are constructed according to criteria or standards, continuous monitoring during the lifetime
of the dams must be a factor to be considered. Physical parameters which are related to
deformations, stress, and water level must be monitored. The measurements made along with visual
inspection and supervision, can provide early warning of any type of failure.
One of the main problem with earth dam is seepage. Seepage line which is referred to as
phreatic line is used to understand the degree of seepage. The phreatic line level in the dams affects
the stability of the dam (Osuji, S.O., 2015). Since saturation zone which is below this line will have
positive hydrostatic pressure, the flow will reduce the shear strength of the soil due to pore-water
pressure (Osuji, S.O., 2015).

2
Polymeric grouts have been used for stopping water leaks in cracks and fractures and also
stabilizing earth materials for decades (Drochytka, 2016). The advantages of the chemical grout are
having low viscosity to minimize the pumping pressure, controllable gelling time, ability to make
the medium impermeable with enough strength (Ozgurel, 2005).
Objectives
The overall objective of this study is to investigate the behavior of acrylamide grouted
sands used for earth dams. The specific objectives of this study are:
a) To study the effect of particle size and distribution on the mechanical, permeability and
sensing properties (piezoresistivity, moisture content) of acrylamide grouted sands.
b) To investigate the effectiveness of acrylamide grouted sand in earth dam for real-time
monitoring and seepage control.
Organization
This thesis is organized into 6 chapters. In chapter 2, literature review related to the
monitoring systems and seepage problem are summarized. Methods of monitoring earth dams and
seepage control methods are documented. In Chapter 3, materials used for preparing the acrylamide
grouted sand samples and experimental procedures are broadly discussed. It also provides the
necessary theory and information about the testing methods used. Chapter 4 addresses the
mechanical, permeability and piezoresistivity behavior of acrylamide grouted sands when various
particle size and distribution sands are used. Chapter 5 focuses on the model verification of
monitoring dam and controlling seepage line in the earth dam using acrylamide grout. Chapter 6
summarizes the conclusions that have been reached from this study, and recommendations for
future research.
.
3
CHAPTER 2 BACKGROUND AND LITERATURE REVIEW
Introduction
Dams are a hydraulic structure that is build to store water in the river. Generally it is
constructed of earth and rock materials and they have to be designed to make the most effective
use with reasonable cost (Ersayin, 2006). Moreover, dams are constructed for several uses such as
water supply, irrigation, flood control and produce hydroelectric power (Novak, 2001). They are
mainly classified into four parts according to their structure types. In order to select a type of dam,
there are some factors are considered such as site conditions, topography, geology and foundation
conditions, material available, environmental and economic situation (USACE, 2004). Around
52% of the world`s dams are located in China, 16% in the United States, and 6% in Japan (Bequette,
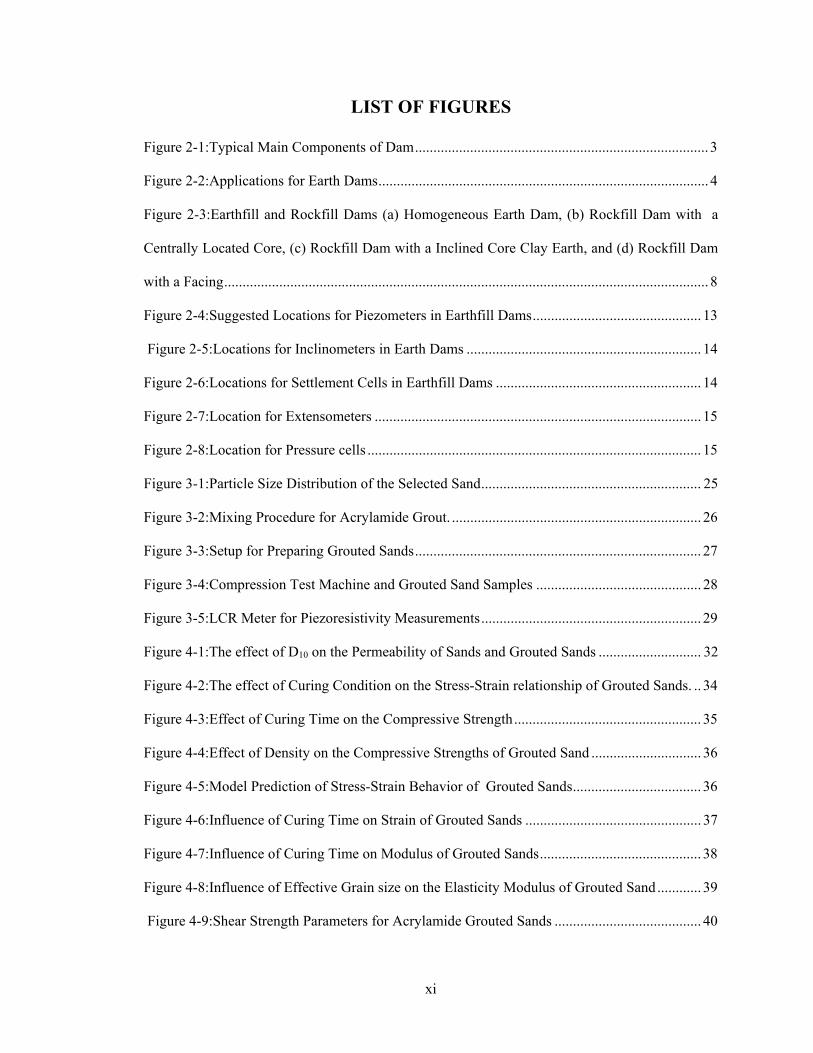
1997). Main components of a typical dam is shown in Figure 2-1.
Figure 2-1:Typical Main Components of Dam
Water reservoir
Crest of dam
Left abutment
Right abutment
Spillway
Downstream toe
Upstream slope
Downstream slope

4
All dams are designed and constructed to meet specific criteria and standards. First, locally
available materials are important factor to construct a dam. Second, the dam must stand stable under
all conditions, during construction and in operation. The most important another thing is to control
seepage in the dam body and its` foundation. Thus, stability of the dam against slope failure and
seepage control in the dam are an essential components for the design.
Main Functions of Dams
According to International Commision on Large Dams (ICOLD), main functions of dams
can be summarized as follows: water supply, flood control, water storage, producing electricity,
irrigation, and recreation. Figure 2-2 shows the percentage applications for earth dams.
Figure 2-2:Applications for Earth Dams
History of the Dams
The history of building earth dams is much older than concrete type of dams (Narita, 2000).
According to reliable records, the first dam was built in Jordan 5,000 years ago to supply drinking
10%
10%
13%
17%
Irrigation
Flood control
Recreation
Hydropower
48%
Water Supply
Navigation and Fish farming

5
water in the city of Jaw (Ersayin, 2006). A large dam was built by an Arabian king called Lokman
about 1700 B.C. and it collapsed due to flooding (Ersayin, 2006). The oldest existing dams in
Europe which were constructed before 1586 are the Almanza and Alicante dams in Spain (Ersayin,
2006). Earth dams which has the height of more than 15m are called “high dams“ according to
International Commision on Large Dams (ICOLD). According to existing dams records, about
14000 high dams have been constructed up to the 2000, and 70% of dams are earth type of dam
(Narita, 2000). Therefore, a last report has noted that among around 1000 of high dams constructed
in recent two years, 80 percent of them are earth dams (Narita, 2000). In the United States, there is
an organization called The World Register of Dams (WRD) that is registering dams in the world.
According to its` 2011 records there are 37.500 dams are high dams. For each dam, they have more
than 30 statistical information. Moreover, the WRD is an important source of information for
scientifical work, statistical evaluations, design, and construction for earth dams (Mai, 2004).
Types of Dams
Basically, dams are classified on the structure types, usage purposes and materials of
construction (Ersayin, 2006). According to their structures, they can be classified four categories
such as gravity dams, arch dams, buttress dams and embankment dams. Classification of the dams
are summarized in Table 2-2.

6
Table 2-1:Classification of Dams
Embankment Dams
Embankment dams can be divided into two types as earthfill and rockfill dams. Foster
(2000) have reported that there are 11.192 embankment dams were constructed up to 1986.
Moreover, up to 1986 62% of dams are designed with zoned earthfill dam. Table 2-1 has showed
the number of embankment dams that were constructed up to 1986. Figure 2-3 has showed different
type of embankment dams.
Table 2-2:Number of Embankment Dams Around the World During Different Time Periods
Foster (2000)
Embankment types Before 1900
1900‐1930
1930‐1950
1950‐1970
1970‐1986
All years
Homogeneous earthfill 101 172 444 1641 1320 3469
Zoned earthfill 240 573 641 2439 2728 6939
concrete face earthfill and rockfill 22 73 82 355 352 783
Total 363 818 1167 4335 4400 11192
According to structure On the basis of the materials of
construction
According to usage purposes
1-) Gravity Dams 2-) Arch Dams 3-) Buttress Dams 4-) Embankment Dams a-) Earth Dams b-) Rockfill Dams
1-)Masonry Dams a-) Stone and Brick Dams b-) Concrete Dams c-) Reinforced Concrete Dams 2-) Filling Dams a-) Earthfill Dams b-) Rockfill Dams 3-) Masonry and Filling Dams 4-) Framed Dams a-) Steel Dams b-) Timber Dams
1-) Dams for drinking water 2-) Dams for Industrial water 3-) Dams for Irrigation 4-) Dams for flood control 5-)Dams for hydroelectric power 6-) Cofferdams

7
Earthfill dams
An earth dam is constructed partly or completely using pervious material which consist of
clay, silt or mixture of clay, silt and gravel. In order to construct an economical dam, materials are
taken from available excavation in a site. Homogeneous earthfill dams are constructed using similar
materials. This type of dam has to have enough permeability to control seepage inside the dam and
the slope must be relatively flat for stability (DSI, 2012). Moreover, in order to prevent leakage in
the core, filter zone is constructed to transfer water to upstream (DSI,2012).
Homogeneous earthfill dam is generally constructed for dam which is less than 30m in
height. However, if dam has to be constructed with higher than 30 m, filter design must be
performed to drop phreatic line in upstream and downstream zones (DSI, 2012).
Rockfill Dams
This type of dam is constructed with a mass of dumped rock. Impermeable layer can be
provided by clay core, inclined core or facing. Filter layers are performed on the clay core upstream
and downstream face. Clay core is supported by shell zones. There are three type of rockfill dams
such as rockfill dam with a centrally located core, rockfill dam with an inclined core and rockfill
dam with a facing (DSI, 2012).
The forces acting on dams
Main forces are acting on the dams can be summarized as follows.
Water Pressure
Water pressure is on the upstream face of the structure. There is an important factor that
must be included in the also when silt builds up the lower part of the upstream side the dam, it
moves as a liquid that is denser than water (Ersayin, 2006).

8
Figure 2-3:Earthfill and Rockfill Dams (a) Homogeneous Earth Dam, (b) Rockfill Dam with a Centrally Located Core, (c) Rockfill Dam with a Inclined Core Clay Earth, and (d) Rockfill Dam with a Facing
Dam Weight
The weight of the dam itself is another force that acts on the dam structures. Moreover,
exterrior forces that are coming from bridges or gates are add weight to the dam.
1.0
2.5
1.0
2.5
1.0
1.0
1.0
2.5
2.5
2.5
1.0
1.0
1.0
2.5
2.5
2.5
35 m

9
Earthquakes
The horizontal and vertical seismic forces must be taken into consideration when designing
a dam. When earthquake occurs toward upstream to downstream, soil and water pressure increases
towards downstream. Additionally, weight of the dam caused ineartial forces to downstream in the
horizontal direction. In order to calculate earthquake forces, intensity of earthquake must be known.
Its value is typically expressed in terms of the acceleration of gravity.
Ice
Ice pressure, temperature and ice thickness is calculated based on the growth rate (Berkun,
2005). Temperature changes in the dam and ice thickness can be estimated from from
meteorological data. Ice pressure depending on the climate and the location of the dam reservoir
can be varied 0 – 75 t/m (Berkun, 2005).
Failures and Damages in Earth Dams
Internal erosion and piping resulting from seepage are the biggest problems affecting the
stability of earthfill dams (Fattah, 2014). According to Foster (2000) investigation, piping causes
43% of failures in the earth dams. Also, the same study showed that 66% of piping problems was
due to seepage in the dam body.
Due to improper designs, faulty constructions, lack of maintance, and natural cases , earth
dams may fail. Piping, concentrated leak erosion, contact erosion and suffusion has the reasons of
internal erosion (ICOLD 2012). Several different types of failures and damages of earthfill dams
have been summarized as shown in Table 2-3 and Figure 2-2. There are three factors that cause to
failures of earthen dams (Garg, 2006). These are as follows:
Hydraulic failure
Seepage failure
Structural failure

10
Hydraulic failure has caused about 40% of earth dam failures (Osuji, S.O., 2015). The hydraulic
failure is due to over topping, erosion of upstream face and downstream toe that was seen in the
New Orleans during hurricane Katrina. Uncontrolled seepage through dam body of its foundation
may lead to piping or sloughing (Osuji, O.S., 2015). More than 1/3 of earth dams have failed due
to piping (Garg, 2006). Structural failures are generally caused by shear failure which is causing
sliding and this failure has caused about 25% of the dam failures (Garg, 2006).
Seepage in Earth Dams and the Importance of Seepage in Dam`s Body
The most important thing that affects dam stability negatively is the seepage problem. This
seepage can make dam`s body weak and cause a sudden failure due to piping or sloughing. An
earthfill dam`s body stops water flow inside the dam from upstream to downstream. However, even
using impermeable zone inside the dam body, there will be some water seeps into dam`s body and
the flow goes out from downstream of body slope until it meets an impermeable zone (Ersayin,
2006). So if the water level at the upstream is lowered rapidly, saturated soil in the upstream may
become unstable. This issue has to be considered when designing an earth dam. Generally, earthfill
dams are designed pervious and some seepage flow through the dam body must be considered.
Phreatic Line in Earth Dams
Phreatic line is defined as the line below which there is a saturated soil which has positive
hydrostatic pressures above this line has negative pressures and the hydrostatic pressure on this line
is equal to atmospheric pressure. So there is a pore water pressure under this line. According to
seepage analysis, there are several reasons that affect the value of water pore pressure. These factors
include, permeability of soil, and load on soil. Hence below the phreatic line the effective weight
of soil is decreased, and thus reduces shear strength of the soil due to positive pore water pressure
then soil will tend to move (Osuji, O.S., 2015). This process called piping. Piping usually occurs
near the downstream toe of a dam when seepage excessive (Linsley and Franzini, 1964). Hence
there is need to improve the stability of the embankment below the phreatic line.

11
Methods of Seepage Control
All earth and rockfill dams will be subject to seepage through the foundations, abutments,
and embankments (Osuji, O.S., 2015). To prevent excessive uplift pressures, unstability of the
upstream and downstream slope, piping through the dam body or foundation and erosion of material
is necessary for seepage control. There are at least three methods that can be used to control seepage
in dam body such as vertical and horizontal drains, flat slopes without drains and impermeable
zonation (Osuji, O.S., 2015). Upstream impervious barriers, cutoffs, downstream seepage berms,
relief wells, and trench drains are also control seepage methods for foundation of the dam (EM,
2004).
Monitoring for Earth Dams
Determining the performance of earthfill dams is related to the weight of the dam body,
stress and deformation resulting from hydrostatic pressure and seepage quantity (Taymaz, and
Yildiz, 1993). The purpose behind monitoring and maintance is for the earth dams and also ensure
the general stability of dam during construction or end of the construction, and ensure there is no
internal erosion or piping resulting from seepage during the service life. Measurements made for
monitoring earthfill dams can be as follows (EM-1110-2-1004, EM-1110-2-1908).
Horizontal-vertical deformations
Determining ground water level and pore water pressure
Shear and total stress and strain measurements
Seepage quantities measurements
Seismic movements
Visual measurements
Phreatic surface line

12
Instrumentation in Earthfill Dams
Dams are large structures and they have to be monitored with instruments in there lifespan
(DSI, 2012). Needed data and instrumentation must be carefully planned to acquire the needed data.
Information that instrumentation gives can be summarized as follows;
Description of site condition before construction.
Ensuring proper materials used.
Ensuring proper construction and design followed.
Verifying design and analysis assumptions.
Observation of geologic and structural abnormal performance that is known
Transferring data for future structures.
Instruments used in earth dams can be summarized as follows:
Piezometers
It is used for monitoring seepage in the foundation of dam, ground water level,
effectiveness of cutoff wall, and measuring pore water pressure in the foundation. Suggested
locations are shown in Figure 2-5. (DSI, 2012). Moreover, accuracy of piezometers is ± 0.5%
according to DSI.
Inclinometers
It is used for monitoring lateral earth movements, detecting movement of downstream of
earth fill dam, particularly impounding, monitoring stability of upstream during and after
impounding as shown in Figure 2-5. (Knight, 2016). Moreover depth, direction, magnitude and rate
of movement can be taken from inclinometers. Inclinometers help to locate shear zone and identify
whether shear is planner of circular. It can be located center of the crest or center of upstream slope.
Accuracy of inclinometers is ±2 mm per 25 m.

13
Figure 2-4:Suggested Locations for Piezometers in Earthfill Dams
As shown in Figure 2.4, the place named Y shows to check placement of fill, monitor
porewater pressure to find shear strength. Z shows to control placement of fill, monitor pwp to find
shear strength and measure uplift pressure and monitor seepage. X shows to control placement of
fill and monitor seepage.
Settlement cell
As shown in Figure 2-6, it is located upstream, downstream slope and core of the dam
(DSI, 2012). It is applicable for three direction to measure deformations. It is used for monitoring
consolidation during construction and long term settlement in the foundation of the fill. Accuracy
of settlement cells is ± 0.5%.
Extensometers
It is located in the toe of the upstream as shown in Figure 2-7. (Knight, 2016). It is used
for monitoring vertical deformations in the dam body. Accuracy of extensometers is ± 0.25%.
Reservoir
Earth fillEarth fill
Crest of dam
Cutoff
Y Y Y
Y Y Y
Core
Z Z Z Z
Z Z Z Z
X X
X
X X
X
X X
X

14
Figure 2-5:Locations for Inclinometers in Earth Dams
Figure 2-6:Locations for Settlement Cells in Earthfill Dams
Pressure Cells
It is used for measuring settlements and pressures in the dam body. It determines
distribution, magnitude and direction of the total stress. It is located interface between foundation
and dam body as shown in Figure 2-8. (DSI, 2012). Accuracy of pressure cells is ± 0.5%.
Reservoir
Inclinometers
Cutoff
Core Potential slip surfaces
X X X
X X
X X X X X
X X
X X X

15
Figure 2-7:Location for Extensometers
Figure 2-8:Location for Pressure cells
Drones
High-tech drones are used for detecting damages on the dam such as cracks and gate
misalignments on the spillway or energy tunnels (Asctec, 2016).
X
X
X
X
X

16
Acrylamide Grout
Acrylamide monomer is produced and used as aqueous solution. While preparing the
acrylamide as grout, water and other chemical are added. It includes catalyst, activators,
accelerators and inhibitors. When acrylamide grout gels it becomes to impervious to water. As
shown in Table 2-3, it has been used in geotechnical applications such as stopping leaks in pipes;
earth, concrete dams; tunnels.
History of Acrylamide Grout
Acrylamide grout was introduced to USA in 1958 by AM-9, and it has been in USA for
different purposes such as soil stabilization, leak control in pipes, concrete, earth dams and tunnels.
Weidebang (2000) reported that acrylamide grout usage in USA was 43% among the other
chemical grouts.
Working Properties of Acrylamide Grout
Viscosity and setting time
Tallard and Caron (1977) reported that the viscosity of acrylamide gourt is 1.2 cP at 20 C.
Before it becomes gel, the viscosity of acrylamide grout doesn`t change, after becoming gel it
rapidly set. Tallord and Caron (1977) offered basic test for determining gelling time for acrylamide
grouts. According to this test, setting time was defined when the grout can no longer be transferred
from one container to another container. AM-9 Manual (2014) reported that setting time for
acrylamide grout can be controlled from 5 seconds to 10 hours.
Strength and permeability
Ozgurel (2005) reported that compressive strength of grouted sands varied from 290 kPa
to 820 kPa for different size sands. Gonzalez (2005) reported that the average of friction angle of
acrylamide grouted sands is 10 and cohesion is 366 kPa. Ozgurel (2005) showed that permeability

17
of grouted sands is 10-10 cm/sec. Moreover, due to limited information about mechanical
properties and permeability behavior of acrylamide grouted sands will be discussed in Chapter 4.
PH and Chemical Resistance
Uncatalyzed acrylamide grout solution has 4.5 to 5 pH (Avanti, 2014). The solution pH
may affect the setting time of acrylamide grout and solution (Avanti, 2014). It should be in the
range of 7 to 11. When it comes to chemical resistance, Karol (1990) showed that it has a good
resistance for many chemical except for strong acids.
Table 2-3:Applications of Acrylamide Grout to Stop Water Leak.
References Project/Location Problems Remarks AM-9 Chemical Grout Manual
Indian Kill Reservoir Heavy seepage was noted in the downstream toe after impounding.
Acrylamide grout was used to stop leaks in the dam. Soil stabilization was provided and made an impermeable barrier.
Narduzzo (2003)
Toronto Subway Tunnel Because water level was above the tunnel, water infiltration problem occurred in the tunnel.
Total of 1,724,000 liters of acrylamide chemical grout were injected to seal 30,000 m2 area of bored tunnel. The result was satisfied.
AM-9 Chemical Grout Manual
Tailing Dam in Argentina
Leakage Problem in the foundation.
Cement based did not prevent the leakage rate that was desired, then acrylamide grout was used. 7 years after the project was completed, there was no seepage noted in the zone.
AM-9 Chemical Grout Manual
Geehi River, Snowy Mountains, Australia
There was fissures and large voids on the rock which is located on the upper right abutment.
Permeability under dam was decreased to a adequate value.
AM-9 Chemical Grout Manual
Tsurata Dam, Kagoshima Prefecture, Japan
Seepage problem in dam body
Gel times varied from 20 to 50 minutes. Acrylamide grout reduced the permeability by a factor of 20 to as much as 100.
AM-9 Chemical Grout Manual
Oak Ridge National Laboratory
Radioactive waste leakage due to groundwater migration.
Permeability reduced to 10-8 m/sec
18
Seepage and Stability Analysis in Earthfill Dams
Seepage Analysis
One of the important factor for the failure of earth dams is the seepage in the body and
foundation. So it is essential to control leakage inside the dam and foundation. Leakage in dams,
caused water waste and, make the slope stability weak. Thus, seepage analysis is the first step and
important analysis for design. According to General Directorate of State Hydraulic Works, Turkey,
2012 guidance for earth dam design book, seepage analysis can be done for two reasons. One of
these is to control seepage in earthfill zone. Before slope stability analysis, phreatic surface in
earthfill must be determined for rapid drawdown and state-state conditions. Second is to control
seepage in foundation. The reason of this, seepage condition in the foundation must be investigated.
Seepage analyses generally is done by using finite element method and software which can model
flow of water. In these analyses, Darcy law is based (DSI, 2012 Guidance Book).
There are two types of seepage analysis. One of them is steady state analysis where water
flow rate and water pressures do not change with time. The easiness of this analysis is that ignores
the time domain and it simplifies the equations. On the other hand, in transient analysis pressure
changes with time. It provides more accurate results when soil conditions are modeled, however, it
is more complex than steady-state analyses.
Seepage through dam is an important task to analyze especially if dam has multiple zones.
Moreover, in order to analyze seepage through dam the best method is finite element method. Using
high permeability materials, having short seepage paths, cracks and fissures, and uneven
settlements inside the earth dam can cause excess seepage quantity (Fattah, 2014). This discharge
can be mitigated by using soils of low permeability, placing core in earth structures, cut-off in the
foundations, and by increasing the seepage paths by placing upstream drains.
Kasim and Fei (2002) tried to simulate the seepage flow through an earthfill dam. In order
to study seepage behavior in the dams, homogeneous and zoned earthfill dams were designed and

19
three sets of parametric studies on long-term steady state flow were conducted. One of them was a
case study, which was analysis of steady state seepage condition for Kuala Yong Dam. The
calculations of seepage quantitiy of core and downstream section were made. According to results,
the dischaege quantitiy changed linearly with maximum seepage velocity. Moreover after
introducing hydraulic conductivity function in seepage analysis, relationship between maximum
seepage velocity and flux quantity was non-linear.
Noori and Ismaeel (2009) used a finite element method software named SEEP/W to
determine the quantitiy of seepage, the level of phreatic surface line, the pore water pressure
distribution of Duhok dam. Moreover, the effect of the ratio of permeability in the vertical and
horizontal (Kx/Ky) was investigated. Results showed that increasing Kx/Ky increased seepage
quantitiy.
Seepage Theory
Seep/w which has finite element method will be used in this study. This program solves partial
differential equations for 2-D steady-state and transient seepage shown in Equation 2.1 and 2.2
using finite element method.
Steady-State Analysis
0x y
H Hk k Q
x x y y
, (2.1)
where, kx, ky = coefficient of permeability in (x, y) directions, H= total head of water and equal to
w
pz
, P= pore water pressure, w = unit weight of water, z= elevation head above sea level,
Q=applied boundary flux

20
Transient Analysis
x x
H Hk k Q
x x y y t
, (2.2)
where, θ=volumetric water content; and t=time
The difference between two analysis is that right side has volumetric content function with time for
transient analysis.
Boundary Conditions
There are four boundry conditions for unconfined seepage problems ;
1. Impervious boundry
0H
n
, (2.3)
where, n = vertical direction of the boundry.
2. Entrance and exits: also called reservoir boundaries or submerged permeable boundaries
H= h1 and (2.4)
H= h2, (2.5)
where, h1 and h2 are heads of water at entrance and exit, respectively.
3. Surface of seepage
H= y. (2.6)
4. Line of seepage
H= y and (2.7)
0H
n
. (2.8)
Stability Analysis
A factor of safety is used to evaluate the stability of the dam. The factor of safety is

21
fFS
, (2.9)
where, FS = Factor of Safety f =failure shear strength of the soil=shear stress of the soil.
There are two methods for stability analyses. One of them is limit equilibrium methods. This
method utilizes the Mohr-Coulomb expression to determine the shear strength f along the sliding
surface. There are several methods developed for stability analysis. The first method was
introduced by Fellenius (1936), attributed to the ordinary method of slices known as Swedish
method. Bishop (1955) advanced this method introducing base normal force that interslice forces
are horizontal. This method satisfies only moment equilibrium consider normal forces but not shear
between the slices. Later, Morgenstern-Price (1965), Spencer (1967), Sarma (1973) made further
contributions with different assumptions for the interslice forces. Montenster-Price (1965) method
satisfies both force and moment equilibrium. Other method is Finite element method which is
applicable for more conditions and is able to get informations about the soil movements, strains,
and stresses.
Fellenius (Swedish) Method
The factor of safety for steady state seepage condition can be calculated as follows:
1
1
` ( cos ) tan `
sin
n
i i i i ii
n
i ii
c L W a u LFS
W a
. (2.10)
Simplified Bishop Method
1
1
1( ` ( ) tan `)
sin
n
i i i ii ai
n
i ii
c b W u bm
FSw a
, (2.11)
where, tan sin
cos iai i
am a
FS

22
c`=effective soil cohesion
L= Length of the bottom of the slice,
b=width of the slice and equal to (L cosa)
u=pore water pressure
W=weight of the slice,
a= inclination of the bottom of the slice
=effective friction angle
Summary
Based on literature review following observations are advanced:
(1) Number of earth dams are quite high and many of them were constructed before 1986. Water
leaks are big problem for these dams due to their ages. Because of internal erosion risk, they
are needed to be rehabilitated.
(2) Current instruments to monitor earth dam can be damaged by consolidation of soil during
construction of earth dam. Measurements from these instruments can mislead experts after
construction.
(3) To simulate real condition in earth dams in terms of seepage, transient analysis is required
for dam stability.
(4) Acrylamide grout has been used in geotechnical applications for decades to control water
leaks, however, better characterization is needed. Performance of acrylamide grout must be
investigated and documented.

23
CHAPTER 3 MATERIALS AND METHODS
Introduction
Acrylamide based grouts which have low viscosities, setting time, and adequate strength
can be defined as an ideal grout (Karol, 1990). Because initial viscosity close to water and they can
be penetrated into soil with permeability coefficient as low as 10-4 cm/s (Karol, 1990). They have
been used in many applications such as stopping leaks in sewer systems, preventing water in
tunnels, dams and other underground structures, and usage of these grouts date back 1950s
(Ozgurel, 2005). Not only, acrylamide based grouts create an impermeable layer but also provide
a soil stabilization. There are some cases that it was used in dams and tunnels. One of examples is
Toronto Subway Tunnel which is one of the largest public transportation systems in North America.
the problem in this tunnel was that groundwater level was above the tunnel roof. So, around
1,724,000 liters of acrylamide chemical grout was used to seal water leaks in the tunnel. Narduzzo
(2003) reported the successful usage of acrylamide grout in this application.
This chapter summarizes the materials used and the testing methods to investigate mechanical,
permeability and piezoresistivity behavior of acrylamide grouted sand.
Materials
Acrylamide Grout
In this study AV-100 (Avanti Grout International, Texas) which is commercially available
grout and having the same viscosity as water was used. It is a water soluable grout and blend of
acrylamide monomer with methylene bisacrylmide. In order to obtain grout solution, catalysts and
activators are used. The activator called triethanolamine (TEA) which was a viscous colorless
liquid starts the polymerization reaction of the chemical grout (Avanti, 2013). It is added to the
grout tank containing AV-100 solution. When it is blended with ethylene glycol, it reduces its
freezing temperature from 70 F to 0 F. (Avanti, 2013). The catalyst called ammonium persulfate

24
was a white crystalline powder and is finer than AV-100. It is an initiator that triggers the
polymerization reaction (Avanti, 2013). It is added to the catalyst solution. There are some
chemicals that can improve some properties of acrylamide grouts. They can be summarized as
follows:
1. AV-105 Ethlene glycol: It used for protecting aginst freezing and dehydration.
2. AV-257 Icoset: It is used for increasing tensile and compressive strength.
3. Potassium Ferricyanide (KFe): It is used for extending gelling time.
Sand
Commercially available silica sand was used to obtain grouted sand specimens. Four
different sands were used and named as S.1, S.2, S.3, S.4. Moreover, they were characterized based
on their particle size distribution. The experimental results of particle size distribution tests are
summarized in Table 3-1. Typical grain size distribution for the sand is shown in Figure 3-1.
Table 3-1:Summary of Sand Properties
Selected Sand Properties S.1 S.2 S.3 S.4 d10 (mm) 0.8 0.63 0.29 0.1 d30 (mm) 1.3 0.65 0.42 0.2 d50 (mm) 2.01 0.66 0.61 0.27 d60 (mm) 2.36 0.7 0.65 0.3 d90 (mm) 4 0.9 1 0.42 Cu 2.95 1.11 2.24 3.00 Cc 0.9 0.96 0.93 1.33 USCS SP SP SP SP
Remarks Largest SandParticles
Uniform sand particles
Medium Sand Particles
Fine Sand Particles

25
Figure 3-1:Particle Size Distribution of the Selected Sand
Specimen Preparation and Testing Method
Preparing Grout Solution
Since Acrylamide grout had two components of aqueous solution, two tanks were prepared.
One tank was an aqueous solution of AV-100 and the activator which is AV-101, whereas the other
was an aqueous solution of the catalyst. The amount of AV-100 was 10% by weight of the total
solution. Catalyst and activator amount was kept same amount. 0.5% of catalyst and activator was
used to obtain grout solution. Playing with the amount of catalyst and activator, setting time can be
arranged for desired time. After preparing two tanks, they were mixed together and poured to
chamber for grouting with air pressure. The mixing procedure is shown in Figure 3-2.
0
0.2
0.4
0.6
0.8
1
0.01 0.1 1 10
Percent Finer, P (%)
Grain size, d(mm)
Sand1
Sand2
Sand3
Sand4
S.3
S.2
S.4
S.1

26
+ =
Figure 3-2:Mixing Procedure for Acrylamide Grout.
Grouted Sand Samples Preparation
All the grouted sand specimens were prepared in split cylindrical Teflon molds 10.2 cm (4
in.) in length and 3.8 cm (1.5 in.) in diameter. In order to keep the sand in the mold, Teflon filters
were used at the bottom and top of the molds. Moreover, preventing grout leakage inside the split
molds was challenged. For this problem, silicon was applied to inside and outside of the molds.
The grouting apparatus has shown in Figure 3-3. It has a hydraulic system for injecting the grout
from chamber into the molds and split cylinder molds. Conductive fillers were added into soil
before grouting. Three specimens were prepared for each set. The dense samples were compacted
with 15 hammer blows and the loose sand specimens were prepared without compaction just by
pouring sand into the molds.
Grout solution was injected from bottom to up around 1 min. under 1 psi. To obtain fully
grouted sand specimens, grout was allowed to flow through the column until no airbuble occurred
from the top of the mold. The unit weight for dense and loose sand grouted sands was summarized
in Table 3-2.
Test Methods
Permeability Test
Nine grouted sand named S.1, S.2 and S.4 were used for constant head permeability test
according to CIGMAT Standart GR7-02 (Standard Test for Permeability of Grouts and Grouted
Tank A
Aqueous solution
10% AV-100
0.5% AV-101
Tank B
Aqueous solution
0.5% AV-102
Aqueous
Grout
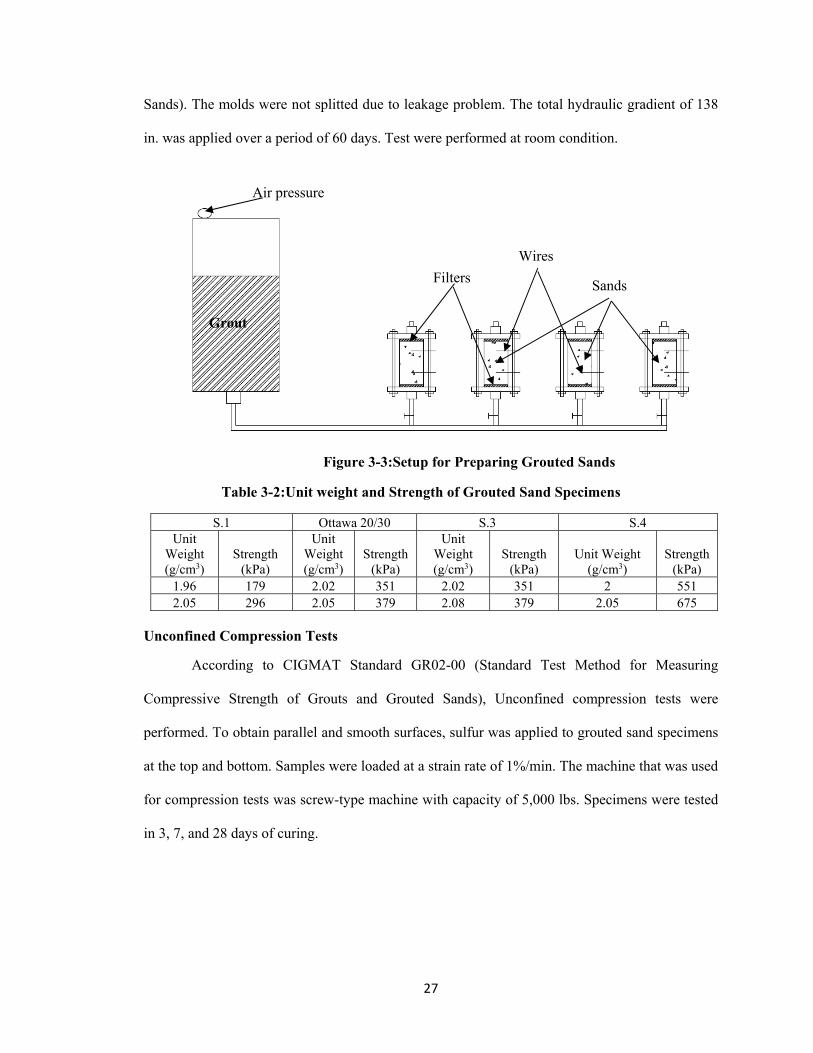
Solution
27
Sands). The molds were not splitted due to leakage problem. The total hydraulic gradient of 138
in. was applied over a period of 60 days. Test were performed at room condition.
Figure 3-3:Setup for Preparing Grouted Sands
Table 3-2:Unit weight and Strength of Grouted Sand Specimens
S.1 Ottawa 20/30 S.3 S.4 Unit
Weight (g/cm3)
Strength (kPa)
Unit Weight(g/cm3)
Strength(kPa)
Unit Weight (g/cm3)
Strength(kPa)
Unit Weight (g/cm3)
Strength(kPa)
1.96 179 2.02 351 2.02 351 2 551 2.05 296 2.05 379 2.08 379 2.05 675
Unconfined Compression Tests
According to CIGMAT Standard GR02-00 (Standard Test Method for Measuring
Compressive Strength of Grouts and Grouted Sands), Unconfined compression tests were
performed. To obtain parallel and smooth surfaces, sulfur was applied to grouted sand specimens
at the top and bottom. Samples were loaded at a strain rate of 1%/min. The machine that was used
for compression tests was screw-type machine with capacity of 5,000 lbs. Specimens were tested
in 3, 7, and 28 days of curing.
Grout
Grout Flow
Air pressure
Grout
Wires
Filters Sands

28
Figure 3-4:Compression Test Machine and Grouted Sand Samples
Curing Conditions
Fine grouted sand specimen was used to investigate the effect of curing condition on the
mechanical properties of grouted sand. Three specimens were prepared for each set and cured at
relative humidity of 50±5 % and room temperature of 23±2. Three curing condition were
investigated such as by keeping them in Ziploc bags, by leaving them in the air and by placing in
containers filled with water.
Gelling time
Gelling time was defined when there is no flow in the grout. In order to determine setting
time, the grout mix was placed in a cup and the cup was tilted to 45. When there is no movement
in the grout, that time was determined as a setting time. Sunder (2012) developed a model that
estimates gelling time in his PhD thesis and CIGMAT 8-09 has given this procedure.
Water absorption
According to CIGMAT GR 3-00 standard procedure, water absorption properties were
investigated for grouted sand specimens. Specimens were submerged in containers and weight
change with time was observed for one week.
29
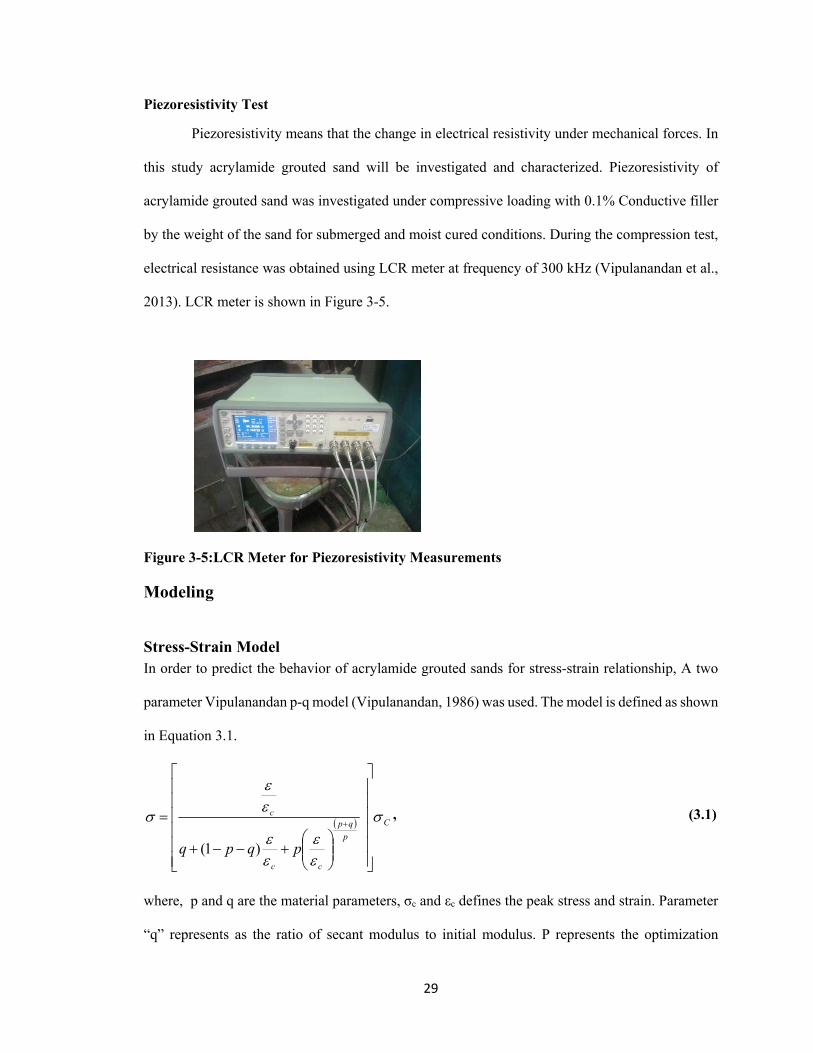
Piezoresistivity Test
Piezoresistivity means that the change in electrical resistivity under mechanical forces. In
this study acrylamide grouted sand will be investigated and characterized. Piezoresistivity of
acrylamide grouted sand was investigated under compressive loading with 0.1% Conductive filler
by the weight of the sand for submerged and moist cured conditions. During the compression test,
electrical resistance was obtained using LCR meter at frequency of 300 kHz (Vipulanandan et al.,
2013). LCR meter is shown in Figure 3-5.
Figure 3-5:LCR Meter for Piezoresistivity Measurements
Modeling
Stress-Strain Model In order to predict the behavior of acrylamide grouted sands for stress-strain relationship, A two
parameter Vipulanandan p-q model (Vipulanandan, 1986) was used. The model is defined as shown
in Equation 3.1.
C
p
qp
cc
c
pqpq
)1(
, (3.1)
where, p and q are the material parameters, σc and εc defines the peak stress and strain. Parameter
“q” represents as the ratio of secant modulus to initial modulus. P represents the optimization

30
parameter which is calculated by minimizing the error in estimating the relationship curve.
Moreover, the equation is valid by providing 0<q<1and (p+q)/q 0.
Piezoresistivity Model
In order to predict piezoresitivity behavior of acrylamide grouted sand, Vipulanandan p-q
model (Vipulanandan, 1986) can be used. The model is defined in Equation 3.2.
2 2
2
max
0
2 2 2 2
0 0
(1 )
p q
p
x
q p q x p x
, (3.2)
where, max represents the maximum stress at failure, 0
is the piezoresistivity of the
acrylamide grouted sand under peak stress,
is the piezoresisvity at any stress and p2 and q2
are material parameters.
Summary
Based on literature review following observations are advanced:
1- Mechanical behavior of acrylamide grouted sand was investigated under different curing
conditions. Effect of sand gradation and type on mechanical and permeability behavior of
grouted sands will be investigated.

31
2- AC measurements was performed with 300 kHz using LCR meter to measure the electrical
resistance.
3- Conductive filler was added to increase the piezoresistivity of acrylamide grouted sands.
4- The proposed Vipulanandan p-q model was used for piezoresistivity and stress-strain
relationship of grouted sands.

32
CHAPTER 4 GROUTED SAND BEHAVIOR
Permeability of Grouted Sands
Nine grouted sand samples using S.1, S.2 and S.4 sands were used for constant head
permeability tests over period of 60 days with total hydraulic head of 138 in. Whereas, before
grouting the permeability of sands was 10-4 m/sec, after grouting grouted sands permeability
reduced to 10-12 m/sec. Gradation of the sands and the different particle size did not affect the
permeability of grouted sand. Permeabilities of sand and grouted sand is shown in Figure 4-1.
Figure 4-1:The effect of D10 on the Permeability of Sands and Grouted Sands
1.0E‐11
1.0E‐10
1.0E‐09
1.0E‐08
1.0E‐07
1.0E‐06
1.0E‐05
1.0E‐04
1.0E‐03
1.0E‐02
1.0E‐01
0 0.2 0.4 0.6 0.8 1
Perm
eab
ility, K
(cm
/s)
Effect Grain Size, d10 (mm)
S.1 Sand
S.2 Sand
S.4 Sand
S.1 Grouted Sand
S.2 Grouted Sand
S.4 Grouted Sand

33
Mechanical Properties of Grouted Sand
Curing Conditions on the Mechanical Behaviour
Sample was the finest sand used to investigate the effect of curing condition on the
mechanical properties of acrylamide grouted sands. The sample in water for twenty-eight days
reduced the compressive strength of grouted sands. Compressive strength of grouted sand cured in
air at room condition was 525 kPa. The water cured grouted sand compressive strength was 435
kPa, %17 reduction compared to air was obtained. Moist cured specimens compressive strength
was 690 kPa, %58 higher compared to water cured specimens. Weight change for moist cured
specimens was 0%. Water cured specimen weight increased due to absorption of water, 2% increase
was observed. The sample in air loss the weight and reduction was 1.5%. Weight and density
change for different curing methods are shown in Table 4-1. Elasticity modulus of water cured
specimens reduced by 18% from 55 MPa to 45 MPa after 28 days curing. The elasticity modulus
of air cured specimens was 96 MPa and it was 40% higher than moist cured specimens. When it
comes to failure strain, submerged curing specimens was 2.14% and it was 23% higher compared
to moist cured specimens. Air cured specimens failure strain was 3.5%. The influence of curing
conditions on the mechanical properties of grouted sands is shown in Figure 4-2.
Table 4-1:Weight and Density Change of Grouted Sands for Different Curing Methods.
Curing Method
Initial Weight (gr)
Volume(cm3)
Density (gr/cm3)
Weight after 28 days (gr)
Density after 28 days (gr/cm3)
Weight Change (%)
Density Change (%)
Moist cured 193.2 94 2.05 193.5 2.05 0% 0% Water Cured 194.9 94.55 2.06 196.8 2.1 2% 1.90% Air Cured 196.6 96.04 2.06 193.65 2.01 -1.50% -2.40%

34
Figure 4-2:The effect of Curing Condition on the Stress-Strain relationship of Grouted Sands.
Strength
Grading of sand affected the modulus, strength and shape of the stress-strain. Decrease in
particle size of the sand increased the compressive strength of grouted sands. Moreover, Figure 4-
3 showed that the compressive strength was not affected after 3, 7, and 28 days curing. The
compressive strength of the grouted sands varied from 240 kPa to 775 kPa. As shown in Figure 4-
4, when sand was in dense state compressive strength was the highest for all type of sands. Coarsest
sand named S.1 had the highest compressive strength change after compaction, 40% increase was
observed. Finest sand named S.4. compressive strength was 567 kPa in loose state, then it increased
up to 690 kPa. This is due to increasing in density of grouted sand. Density of the grouted sand is
0
100
200
300
400
500
600
700
800
0 0.5 1 1.5 2 2.5 3 3.5 4 4.5
Compressive Stress, σ
, (kPa)
Axial Strain, ɛ (%)
Submerged Cured
Moist Cured
Air cured
E (air cured) = 96 MPaE (moist cured) = 55 MPaE (Submerged) = 45 MPa

35
shown in Table 4-2. Increase in compressive strength was 18% for finest grouted sand after
compaction. Stress-strain curves of seven days moist cured grouted sand specimens and model
prediction are shown in Figure 4-5. Parameters for stress-strain relationship of acrylamide grouted
sands are shown in Table 4-3.
Figure 4-3:Effect of Curing Time on the Compressive Strength
Table 4-2:Density of the Acrylamide Grouted Sands
S.1 (Coarsest sand) Ottawa 20/30 S.3 (medium sand) S.4 (fine sand) Unit
Weight (g/cm3)
Strength(KPa)
Unit Weight(g/cm3)
Strength (KPa)
Unit Weight (g/cm3)
Strength (KPa)
Unit Weight (g/cm3)
Strength(KPa)
Loose 1.96 179 2.02 351 2.02 351 2 551 Dense 2.05 296 2.05 379 2.08 379 2.05 675
Failure Strain
Whereas the failure strain was affected by the size of sand, curing time did not change the
failure strain. The effect of curing time on failure strain is shown in Figure 4-6. According to results,
the average failure strain varied from 1.71% to 2.25% under compacted condition. Uniform grouted
200
300
400
500
600
700
800
0 5 10 15 20 25 30
Compressive Strength (kPa)
Curing Time (days)
S.2 Sand (410±30 kPa)
S.3 Sand (545± 70 kPa)
S.4 Sand (675 ± 100 kPa)
S.1 Sand (305±60 kPa)

36
sand named S.2 sand had the highest average strain failure. Average compressive failure strain of
finest grouted sand named S.4 was 1.8% and it was 20% less than uniform sand. This is due to
amount of grout injected. Shear type of failure was observed for many specimens, except S.1 which
is coarsest sand and had cone type of failure for some specimens.
Figure 4-4:Effect of Density on the Compressive Strengths of Grouted Sand
Table 4-3:Stress-Strain Model Parameters
Sands (p-q) Stress-Strain Model Parameters
p q S.1 0.2 0.85 S.2 0.43 0.61 S.3 0.6 0.75 S.4 0.4 0.75
0
100
200
300
400
500
600
700
800
Compressive Strength (kPa)
Loose
Dense
S.1 S.2 S.3 S.4
+40%
+10%
+36%
+40%

37
Figure 4-5:Model Prediction of Stress-Strain Behavior of Grouted Sands
Figure 4-6:Influence of Curing Time on Strain of Grouted Sands
0
100
200
300
400
500
600
700
0 0.5 1 1.5 2 2.5 3 3.5
Stress (kPa)
Strain (%)
S.1
S.2
S.3
S.4
Model
Curing time: 7 days
1.5
1.75
2
2.25
2.5
2.75
0 5 10 15 20 25 30
Axial Strain, ɛ (%)
Curing Time (days)
S.1
S.2
S.3
S.4
S.3 Sand (1.71%±0.15%)
S.4 Sand (1.87%±0.1%)
S.1 Sand (1.95%±0.1%)
S.2 Sand (2.25%±0.35%)

38
Modulus
As shown in Figure 4-7, Elasticity modulus of the grouted sands did not change with curing
time. According to results, when the sand particle size became finer elasticity modulus of grouted
sand increased. The average of grouted sand elasticity modulus was around 35 MPa for coarsest
particles, whereas the fines particle modulus was about 56 MPa (S.1). It can be seen that elasticity
modulus of finest particles was 138% higher than coarsest particles. Elasticity modulus of grouted
sands change with effective grain size is shown in Figure 4-8. Decrease in effective grain size
increased the elasticity modulus of grouted sand. As shown in Figure 4-8, elasticity modulus of
finest grouted sand named S.4 was 17 MPa in loose state. However, elasticity modulus of finest
grouted sand was 56 MPa after compaction. The increase in elasticity modulus was 229% for finest
grouted sand. According to results, average elasticity modulus of grouted sands was 46 MPa for
denser samples.
Figure 4-7:Influence of Curing Time on Modulus of Grouted Sands
25000
30000
35000
40000
45000
50000
55000
60000
0 5 10 15 20 25 30
Ela
stic
ity
Mo
du
lus,
E (
kPa)
Curing Time, t (days)
S.1
S.2
S.3
S.4
S.1 Sand E =34450 ± 4450 kPa
S.2 Sand E =42700 ± 6100kPa
S.4 Sand E =55700 ± 5500 kPa
S.3 Sand E =49600 ± 700 kPa

39
Figure 4-8:Influence of Effective Grain size on the Elasticity Modulus of Grouted Sand
Shear Strength Parameters for Acrylamide Grouted Sands
Parametric study was carried out to find shear strength parameters of the grouted sands.
Shear strength parameters can be found from unconfined compressive strength values using
equation (4.1). Gonzales (2005) reported that range of friction angle of the grouted sand varied
from 10° to 15°. According to these values, cohesion of the grouted sands varied from 241 kPa to
325 kPa.
, (4.1)
where, = unconfined compressive strength of the grouted sands,
C= cohesion of the grouted sands,
= friction angle of the grouted sands.
0
10000
20000
30000
40000
50000
60000
70000
80000
0 0.1 0.2 0.3 0.4 0.5 0.6 0.7 0.8 0.9
Elasticity M
odulus (kPa)
Effective Grain Size d10 (mm)
Loose
Dense

40
Figure 4-9:Shear Strength Parameters for Acrylamide Grouted Sands
Impedance Model
Equivalent Circuit.
It is significant to determine appropriate equivalent circuit to define the electrical properties
of a material to characterize its performance with time. However, it is difficult to choose a correct
equivalent circuit. Researchers adopt a circut depending on their expectation of material behavior
from study to overcome this difficulty.
In this study, different possible equivalent circuits were analyzed to find a suitable
equivalent circuit to represent grouted sands.
0
5
10
15
20
25
30
35
40
45
50
100 150 200 250 300 350
Friction Angle (°)
Cohesion (kPa)
705kPa
575kPa
639kPa

41
Case 1: General Bulk Material –Capacitance and Resistance
The contacts were connected in series, and both the contacts and the bulk material were
represented using a capacitor and a resistor connected in parallel as shown in Figure 4.10 for Case1.
In the equivalent circuit for Case 1, Rb and Cb are resistance and capacitance of the bulk material,
respectively; and Rc and Cc are resistance and capacitance of the contacts, respectively. Both
contacts are represented with the same resistance (Rc) and capacitance (Cc), as they are identical.
Total impedance of the equivalent circuit for Case 1 (Z1) can be represented as
222
2
222
2
2222221 1
)(
1
)(2
1
)(2
1
)()(
bb
bb
cc
cc
cc
c
bb
b
CR
CR
CR
CRj
CR
R
CR
RZ
, (4.2)
where ω is the angular frequency of the applied signal. When the frequency of the applied signal is
very low, ω → 0, Z1 = Rb + 2Rc, and when it is very high, ω → ∞, Z1= 0.
Case 2: Special Bulk Material - Resistance Only
Case 2 is a special case of Case 1 in which the capacitance of the bulk material (Cb) is
assumed to be negligible as shown in Figure 4.11. The total impedance of the equivalent circuit for
Case 2 (Z2) is
222
2
2222 1
)(2
1
)(2)()(
cc
cc
cc
cb CR
CRj
CR
RRZ
.
When the frequency of the applied signal is very low, ω → 0, Z2 = Rb + 2Rc, and when it is very
high, ω → ∞, Z2 = Rb (Error! Reference source not found.).
(4.3)

42
Rc
Cc
Rc
CcCb
Rb
Figure 4-10:Equivalent Circuit for Case1
Rc
Cc
Rb
Rc
Cc
Figure 4-11:Equivalent Circuit for Case 2
Figure 4-12:Comparison of Typical Responses of Equivalent Circuits for Case 1 and Case 2
The shape of the curves shown in Error! Reference source not found. is very much
influenced by material response and the two probe instruments used for monitoring. Testing of
grouted sand showed that Case 2 represented their behavior and hence the bulk material properties
can be represented by resistivity and characterized at a frequency of 300 kHz using the two probes.
Piezoresistivity Behaviour of Grouted Sand
Piezoresistivity of grouted sand was investigated under submerged and moist cured
conditions. Uniform and finest grouted sand named S.4 and S.2 were used and 0%, 0.1% CF was
added to sand before grouting to investigate the effect of CF on piezoresistivity. Setting time for
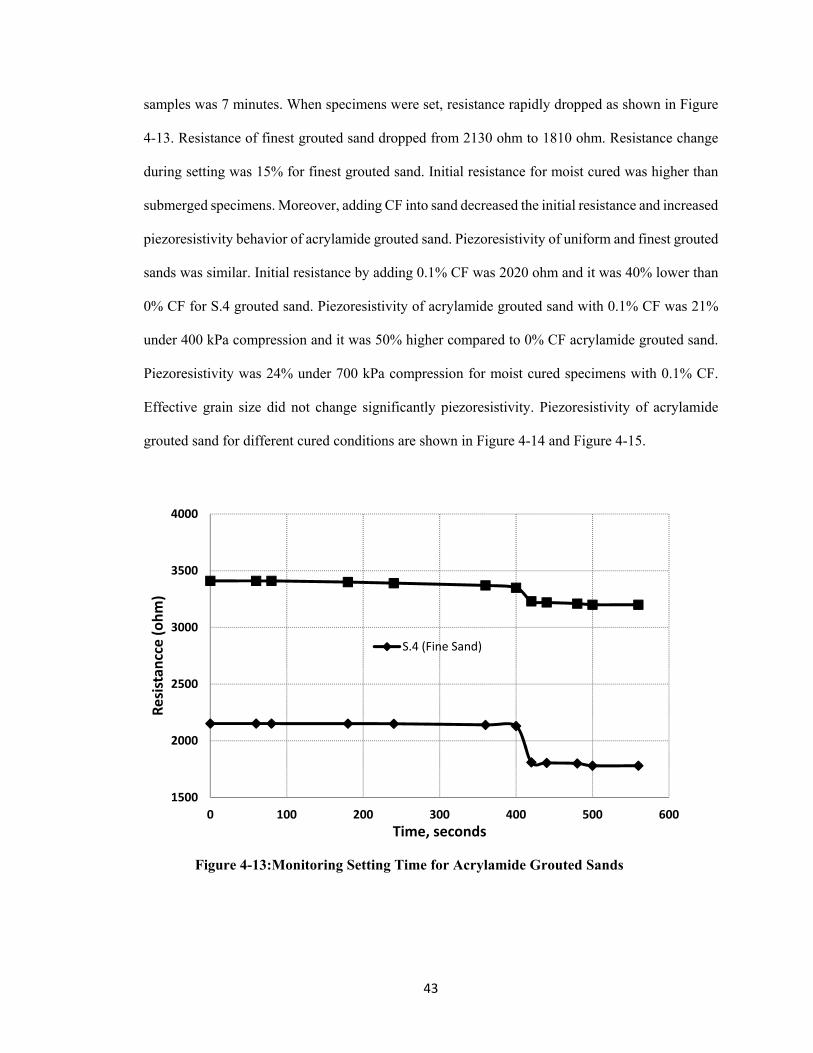
43
samples was 7 minutes. When specimens were set, resistance rapidly dropped as shown in Figure
4-13. Resistance of finest grouted sand dropped from 2130 ohm to 1810 ohm. Resistance change
during setting was 15% for finest grouted sand. Initial resistance for moist cured was higher than
submerged specimens. Moreover, adding CF into sand decreased the initial resistance and increased
piezoresistivity behavior of acrylamide grouted sand. Piezoresistivity of uniform and finest grouted
sands was similar. Initial resistance by adding 0.1% CF was 2020 ohm and it was 40% lower than
0% CF for S.4 grouted sand. Piezoresistivity of acrylamide grouted sand with 0.1% CF was 21%
under 400 kPa compression and it was 50% higher compared to 0% CF acrylamide grouted sand.
Piezoresistivity was 24% under 700 kPa compression for moist cured specimens with 0.1% CF.
Effective grain size did not change significantly piezoresistivity. Piezoresistivity of acrylamide
grouted sand for different cured conditions are shown in Figure 4-14 and Figure 4-15.
Figure 4-13:Monitoring Setting Time for Acrylamide Grouted Sands
1500
2000
2500
3000
3500
4000
0 100 200 300 400 500 600
Resistan
cce (ohm)
Time, seconds
S.4 (Fine Sand)
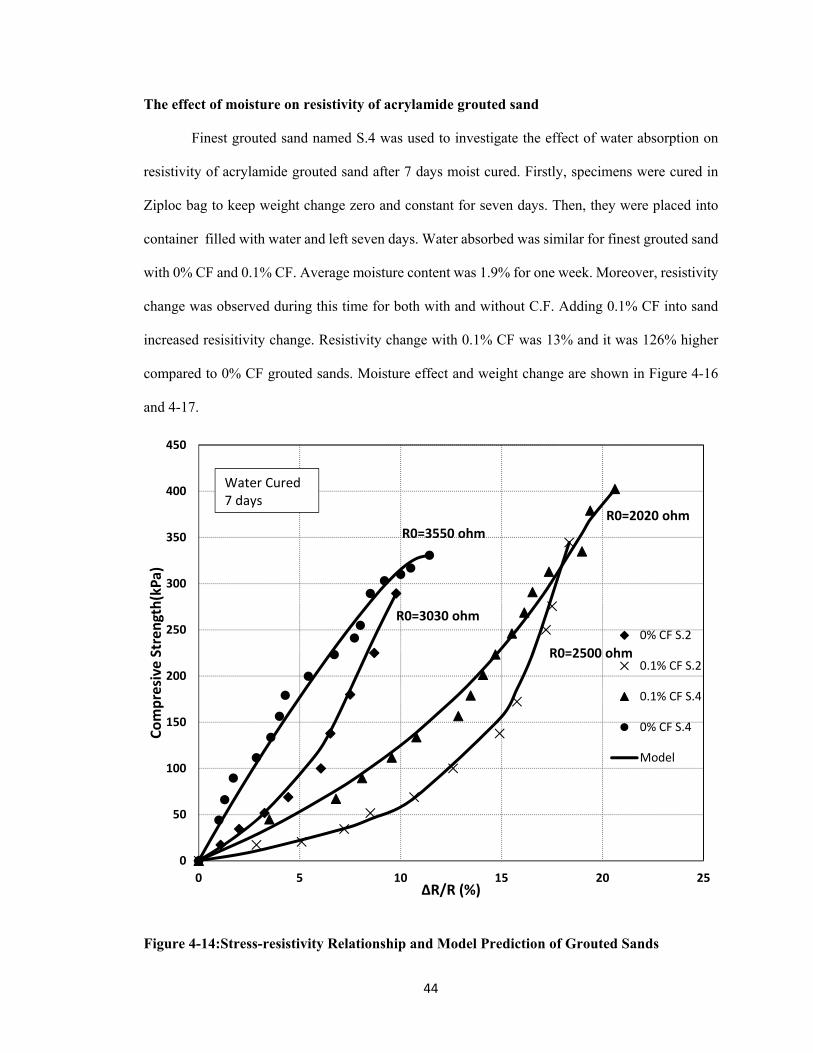
44
The effect of moisture on resistivity of acrylamide grouted sand
Finest grouted sand named S.4 was used to investigate the effect of water absorption on
resistivity of acrylamide grouted sand after 7 days moist cured. Firstly, specimens were cured in
Ziploc bag to keep weight change zero and constant for seven days. Then, they were placed into
container filled with water and left seven days. Water absorbed was similar for finest grouted sand
with 0% CF and 0.1% CF. Average moisture content was 1.9% for one week. Moreover, resistivity
change was observed during this time for both with and without C.F. Adding 0.1% CF into sand
increased resisitivity change. Resistivity change with 0.1% CF was 13% and it was 126% higher
compared to 0% CF grouted sands. Moisture effect and weight change are shown in Figure 4-16
and 4-17.
Figure 4-14:Stress-resistivity Relationship and Model Prediction of Grouted Sands
Water Cured 7 days
0
50
100
150
200
250
300
350
400
450
0 5 10 15 20 25
Compresive Strength(kPa)
∆R/R (%)
0% CF S.2
0.1% CF S.2
0.1% CF S.4
0% CF S.4
Model
R0=2020 ohm
R0=2500 ohm
R0=3030 ohm
R0=3550 ohm
Water Cured7 days

45
Figure 4-15: Stress-resistivity Relationship and Model Prediction of Grouted Sands
Figure 4-16:Effect of Moisture on Weight Change of Acrylamide Grouted Sand
0
100
200
300
400
500
600
700
800
0 5 10 15 20 25
Compressive Strength (kPa)
∆R/R (%)
0% CF (Fine Sand)
0.1% CF (FineSand)Model
Moist Cured7 days
0
0.5
1
1.5
2
2.5
0 2 4 6 8 10 12 14 16
Weight Chan
ge, Δ
W/W
, (%)
Time , (days)
0.1% CF (Fine Sand)
0% CF (Fine Sand)
ΔW=0 (Moist Cured)
Submerged

46
Figure 4-17:Effect of Moisture Content on Weight Change of Grouted Sand
Summary
The summary of experimental study is as follows.
1. The permeability of grouted sand was 10-12 m/sec, and it was not affected by grain size
distribution and particle size.
2. Unconfined compressive strength was affected by the density, particle size and gradation.
Strength of grouted sands increased when particles are finer. The compressive strength of the
grouted sands varied from 240 kPa to 775 kPa. Moreover, curing time after 3 days did not
affect the mechanical properties of grouted. P-q model can be used to predict the mechanical
behavior of acrylamide grouted sands.
3. Failure strain and elasticity modulus of acrylamide grouted sands were not influenced by the
curing time after 3 days. Average failure strain varied from 1.7% to 2.25% for the grouted
sands for 7 days moist cured. Elastisite modulus of the grouted sands varied from 35 kPa to 56
kPa.
0
2
4
6
8
10
12
14
0 2 4 6 8 10 12 14 16
Resistivity Chan
ge, Δ
ρ/ρ
(%)
Time (days)
0% CF (Fine Sand)
0.1% CF (Fine Sand)
ΔW=0 (Moist Cured)
Submerged
Submerged

47
4. The acrylamide grouted sand with and without conductive filler were pizoresistive. Adding
conductive filler into the sand increased the sensitivity of the grouted sands.The average change
in resistance change at peak compressive stress was 21% for submerged specimens and 24%
for moist cured specimens.

48
CHAPTER 5 SEEPAGE CONTROL AND MONITORING IN EARTH
DAMS
Introduction
Some of the geotechnical engineering problems includes consolidation, heave, collapse and
dramatic change in shear strength are directly associated with the behavior of unsaturated soils
(Suhail, 2008). The stability of the embankment slope is related to its geometry, material properties
and the forces acting on it (Griffith, 2000). Nowadays, numerical simulations are used to analyze
stability of dams (Sakamoto T, 2002). Designers should provide an adequate factor of safety in
their analysis of slope stability for their design (Suhail, 2008). This is significant to make sure that
the designed slopes are safe and to prevent under critical conditions (Suhail, 2008). Table 5-1
summarizes the values of factor of safety used for earth dam design.
Earth dams may become saturated by leakage flow during a long term high reservoir level.
If the reservoir pool drawdown is faster than the pore water can dissipate, excess pore water
pressures can reduce the stability of the earth dam. This is called drawdown and that is common in
the earth dams (USACE). One of the most severe loading conditions is rapid drawdown condition
in the earth dams (Zomorodian, 2010). Rapid drawdown can bring about a temporary increase in
pore water pressure and the increased seepage forces may cause to slope instability and erode the
structure. Pinyol (2008) reported that the range of drawdown rate is from 0.5 to 1 m/day in dam
engineering.
Table 5-1:Minimum Factor of Safety Values for Earth dams by USACE, 2003
End of construction Steady‐state Rapid drawdown
Upstream Downstream Upstream Downstream Upstream
Minimum Factor of Safety
1.3 1.3 1.5 1.5 1.1

49
Dam Model and Material Properties
Based on five earth dams the average number dimensions was used as summarized
in Table 5.2. The average slopes for upstream and downstream were 2.5H:1.0V and
2.25H:1.0V, respectively. According to these average slope of the earth dam, material types
of the zones were selected from Bureau of Reclamation and summarized in Table 5-3. Soil
types were SP, GP, SW or GW can be chosen for downstream, and SC or SM can be
selected for core. In this study, SP was selected for upstream slope. The most important
soil parameters for the stability analysis are friction angle and cohesion of the soils were
chosen according to soil types from the USACE MANUAL as shown in Table 5-4. The
dam configuration is shown in Figure 5-1 and material properties listed in Table 5-5.
Table 5-2:Selected Earth Dams for Model
Dam name Purpose
UpstreamSlope
DownstreamSlope
Height (m)
Crest length (m) Foundation References
Howard Praire Any 2.5 : 1 2.0 : 1 27 9
No information
Bureau of Reclamation
Dry falls dam Storage 2.0 : 1 2.0 : 1 14 6
No information
Tiber Storage 3.0 : 1 2.5 : 1 15 8 No information
Maneciu dam
supplying water electricity 2.5:1 2.5:1 78 12 30
Andreea (2015)
Al‐adhaim da
supplying water electricity 2.5:1 2.0 : 1 43.5 12 30
Fattah (2014)
Average 2.5 : 1 2.25 : 1 35 9 30
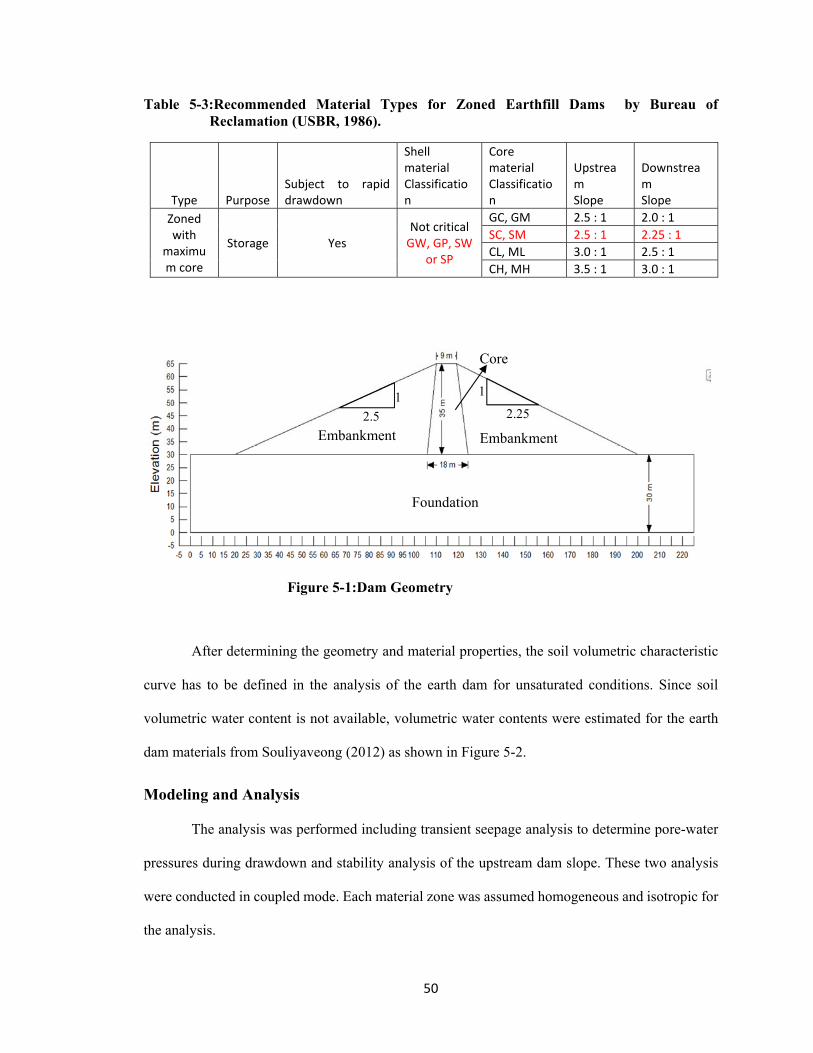
50
Table 5-3:Recommended Material Types for Zoned Earthfill Dams by Bureau of Reclamation (USBR, 1986).
Type Purpose Subject to rapid drawdown
Shell material Classification
Core material Classification
Upstream Slope
Downstream Slope
Zoned with
maximum core
Storage Yes Not critical GW, GP, SW
or SP
GC, GM 2.5 : 1 2.0 : 1
SC, SM 2.5 : 1 2.25 : 1
CL, ML 3.0 : 1 2.5 : 1
CH, MH 3.5 : 1 3.0 : 1
Figure 5-1:Dam Geometry
After determining the geometry and material properties, the soil volumetric characteristic
curve has to be defined in the analysis of the earth dam for unsaturated conditions. Since soil
volumetric water content is not available, volumetric water contents were estimated for the earth
dam materials from Souliyaveong (2012) as shown in Figure 5-2.
Modeling and Analysis
The analysis was performed including transient seepage analysis to determine pore-water
pressures during drawdown and stability analysis of the upstream dam slope. These two analysis
were conducted in coupled mode. Each material zone was assumed homogeneous and isotropic for
the analysis.
Embankment Embankment
Core
Foundation
1
2.5
1
2.25
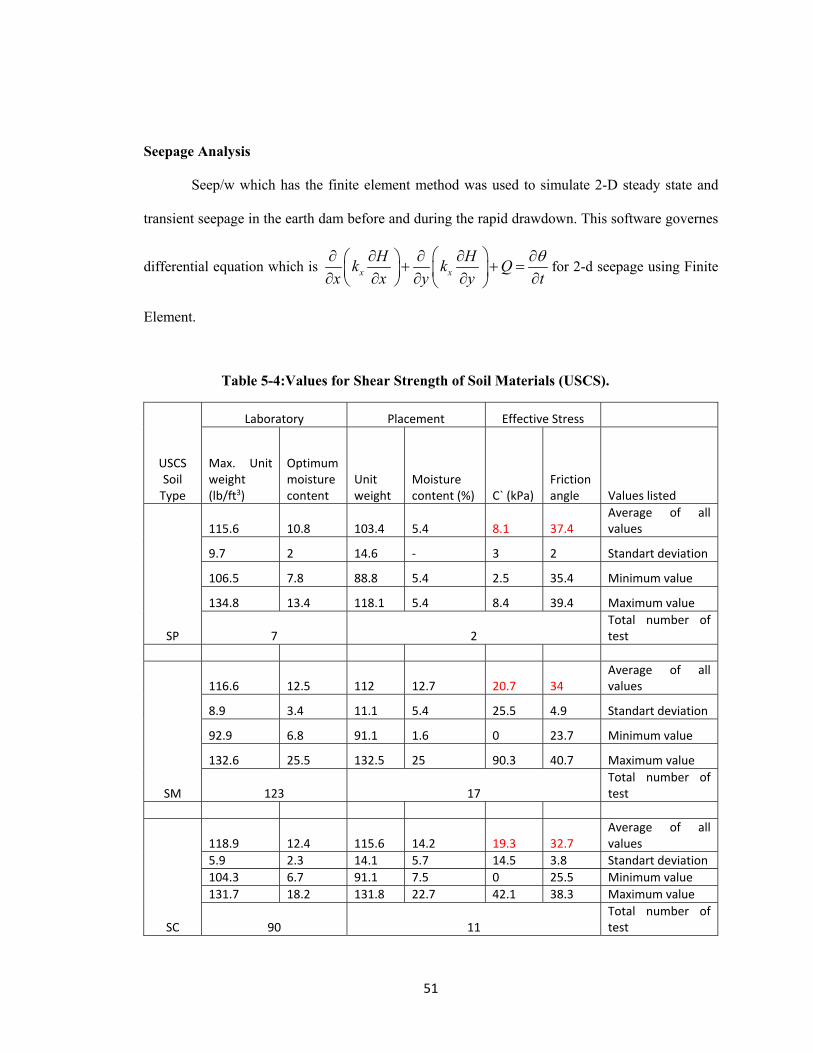
51
Seepage Analysis
Seep/w which has the finite element method was used to simulate 2-D steady state and
transient seepage in the earth dam before and during the rapid drawdown. This software governes
differential equation which is x x
H Hk k Q
x x y y t
for 2-d seepage using Finite
Element.
Table 5-4:Values for Shear Strength of Soil Materials (USCS).
USCS Soil Type
Laboratory Placement Effective Stress
Max. Unit weight (lb/ft3)
Optimummoisture content
Unit weight
Moisture content (%) C` (kPa)
Friction angle Values listed
SP
115.6 10.8 103.4 5.4 8.1 37.4 Average of all values
9.7 2 14.6 ‐ 3 2 Standart deviation
106.5 7.8 88.8 5.4 2.5 35.4 Minimum value
134.8 13.4 118.1 5.4 8.4 39.4 Maximum value
7 2 Total number of test
SM
116.6 12.5 112 12.7 20.7 34 Average of all values
8.9 3.4 11.1 5.4 25.5 4.9 Standart deviation
92.9 6.8 91.1 1.6 0 23.7 Minimum value
132.6 25.5 132.5 25 90.3 40.7 Maximum value
123 17 Total number of test
SC
118.9 12.4 115.6 14.2 19.3 32.7 Average of all values
5.9 2.3 14.1 5.7 14.5 3.8 Standart deviation
104.3 6.7 91.1 7.5 0 25.5 Minimum value
131.7 18.2 131.8 22.7 42.1 38.3 Maximum value
90 11 Total number of test

52
Table 5-5:Material Properties for Earth Dam
Material Properties Symbol Unit
Values
Remarks Clay core Embankment
Grouted Sand Foundation
Saturated hydraulic conductivity ksat m/sec
1x10‐6‐
1x10‐10 1x10‐4‐1x10‐6
1x10‐12 1x10‐7
embankment permeability varied 10‐4to 10‐6
Saturated Unit weight ɣsat kN/m3
14.6‐20.8 16.7‐21 20.2‐20.8 19‐21.5
Unit weight varied from 14 to 21.5 for material types
Effective Cohesion c` kPa
10‐42.1 2.5‐8.4 244‐325 0‐5
embankment cohesion was varied from 2.5 to 8.4
Effective friction angle ɸ degree
25.5‐38.3 35.4‐39.4 10‐15 30
Friction angle was varied from 25 to 39
Volumetric water content ϴw m3/m3 0.4 0.32 0.015 0.3
values for SWCC were taken from Souliyavong, 2012
Elastisite modulus E Mpa 30‐60 50‐80 34‐56 60‐80
based on Obrzud & Truty (2012)
Poisson ratio v 0.35‐0.40 0.25‐0.30 0.25‐0.35 0.1‐0.4
based on Obrzud & Truty (2012)
Remarks
Values were taken from
USBR (Compacted Soils)
Lab. Tests were carried
out
Fattah (2014)
Figure 5-2:Soil Water Characteristic Curve for Unsaturated Shear Strength Parameters for Earth Materials (Souliyavong, 2012).
0
0.1
0.2
0.3
0.4
0.5
0.01 0.1 1 10 100 1000
Volumetric water content(m
3/m
3)
Matric Suction (kPa)
Core
Embankment

53
Finite Element Analyses
The finite element mesh shown in Figure 5.3 was used to generate the dam structure. The
mesh was defined as an unstructured pattern of quadrilateral and triangular elements with 3 and 4
nodes respectively. Before drawdown condition, effect of mesh size on the seepage quantity and
phreatic line was investigated under steady-state condition. Maximum element size was 5mx5m
and minimum was 1mx1m. Moreover, the dam was analyzed for steady-state seepage conditions
and assuming reservoir level at the dam crest (elevation 65m) which is a critical condition.
BoundaryConditions
According to SEEP/W manual, boundary conditions can be only one of two fundamental options.
H (head) or Q (total flux) must be defined (SEEP/W).
There are four type boundry conditions for unconfined seepage problems ;
1. Impervious boundry
0H
n
, (5.1)
where, n = vertical direction of the boundry.
2. Entrance and exits: also called reservoir boundaries or submerged permeable boundaries
H=h1= 65m and (5.2)
H=h2= 30m, (5.3)
where, h1 and h2 are heads of water at entrance and exit, respectively.
3. Potential Seepage Face
H= y=30 m. (5.4)
4. Line of seepage
H= y and (5.5)
0H
n
.

54
In this study, H (total head) was defined. The boundaries ABC and DE as shown in Figure 3 were
defined as constant total head boundaries with values of 65m and 30m respectively.
Figure 5-3:Earth Dam with Mesh and Boundary Conditions for Steady-state Analysis
The initial pore-water pressure distribution calculated from steady-state analysis was
defined performing transient analysis. As shown in Figure 5.3, the upstream boundary (ABC) and
(DE) condition was defined to simulate the reservoir drawdown . This boundary will provide the
user to define the change in reservoir level as a function of time. The reservoir level was dropped
linearly from 65m to 30m. During the drawdown, the shear strength of the materials could change
from saturated to unsaturated and then the saturated hydraulic conductivity of each material should
be defined as a function of suction Souliyavong (2012). Fredlund and Xing`s (1994) method was
used to estimate the hydraulic conductivity function for each material. In this method, hydraulic
conductivity function can be found using its Volumetric water content function and saturated
hydraulic conductivity. The transient seepage analysis will give the changes of pore-water pressures
with drawdown time by means of the FE mesh.
A B
C
D E

55
Stability Analysis
Slope/w which has limit equilibrium method was used for stability analysis of upstream
slope during drawdown. Bishop method was used to evaluate minimum factor of safety. Trial
failure surfaces were defined using the entry (CD) and the exit (AB) method for each scenario as
shown in Figure 5-4. The Slope/w analyses most critical surface with a minimum factor of safety
for each drawdown scenario is obtained from all the trial surfaces.
Figure 5-4:Critical Trial Surfaces for Rapid Drawdown Condition
Because the drawdown condition generates unsaturated conditions in the dam materials,
the unsaturated shear strengths of the materials must be considered. In this analysis, Eq. (5.1)
suggested by Vanapalli (1996) was used to estimate unsaturated shear strength of the materials.
` ( ) tan ` ( ) tan `w rn a a w
s r
c u u u
, (5.6)
where =shear strength of saturated/unsaturated soil ; c`=effective cohesion of saturated soil;
n =total normal stress on the failure plane of the soil; ` =effective friction angle; a wu u =
matric suction in the failure plane of the soil; au =pore-air pressure in saturated soil; wu = pore-
water pressure w = volumetric water content, s =saturated volumetric water content, r =
residual volumetric water content can be estimated to be equal to 10% of s .
C D
A B
Fof S

56
Results and Discussions
Effect of Mesh Size on Leakage Flow Rate and Phreatic Line
Three mesh size was considered such as 5mx5m, 3mx3m and 1mx1m respectively. Node
and element numbers are shown in Table 5-6. According to results, the leakage rate was affected
by mesh size. When mesh size becomes finer, seepage value decreased. Seepage decreased 29%
when mesh size varied from 5mx5m to 1mx1m for dam body. The change for foundation seepage
was 25% which is almost similar to change in body. Phreatic line change is negligible under
different mesh size in Figure 5-4. According to the results, clay which had low permeability had
good resistance against water seeping into the dam and phreatic line dropped sharply as shown in
Figure 5.4.
Table 5-6:Effect of Mesh Size on Seepage Quantity
Seepage location
Mesh size
1mx1m 3mx3m 5mx5m
Body (10‐3 m3/day/m) 2.6 3.1 3.7
Foundation (10‐3 m3/day/m) 5.6 6.1 7
Node Number 46440 5368 1996
Element Number 15261 1715 621
Effect of Slope on Miminum Factor of Safety
After analyzing earth dam with 2.5H : 1V upstream slope, earth dam was stable for both
steady state and end of construction, however, minimum factor of safety for rapid drawdown
condition was 0.66 which is lower than required min fof safety according to USACE Manual.
Therefore, upstream slope with 3.0H:1V and 4.0H:1V was used for stability analysis to have stable
earth dam. Table 5-7 shows that earth dam designed with 4.0H:1V was stable. Factor of safety
values for 3.0H:1V and 4.0H:1V were 0.716 and 1.216, respectively. As shown in Figure 5-5 The
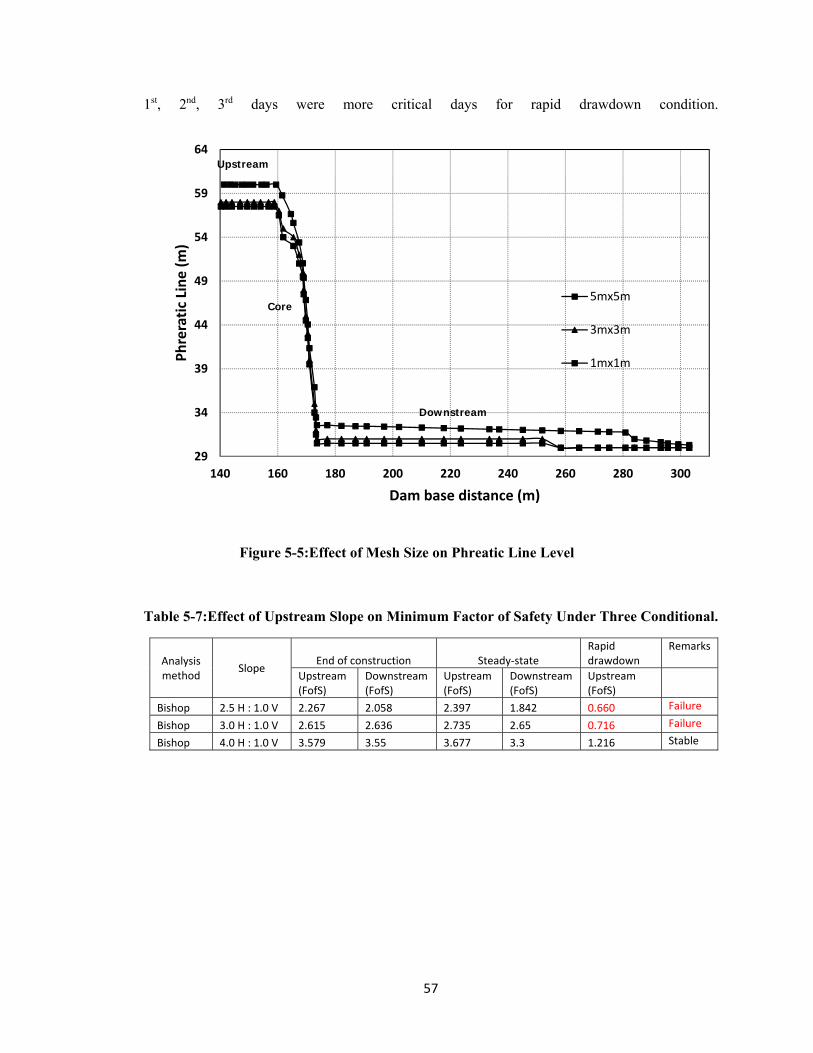
57
1st, 2nd, 3rd days were more critical days for rapid drawdown condition.
Figure 5-5:Effect of Mesh Size on Phreatic Line Level
Table 5-7:Effect of Upstream Slope on Minimum Factor of Safety Under Three Conditional.
Analysis method
Slope End of construction Steady‐state
Rapid drawdown
Remarks
Upstream (FofS)
Downstream (FofS)
Upstream (FofS)
Downstream (FofS)
Upstream (FofS)
Bishop 2.5 H : 1.0 V 2.267 2.058 2.397 1.842 0.660 Failure
Bishop 3.0 H : 1.0 V 2.615 2.636 2.735 2.65 0.716 Failure
Bishop 4.0 H : 1.0 V 3.579 3.55 3.677 3.3 1.216 Stable
29
34
39
44
49
54
59
64
140 160 180 200 220 240 260 280 300
Phreratic Line (m)
Dam base distance (m)
5mx5m
3mx3m
1mx1m
Upstream
Core
Downstream

58
Figure 5-6:Effect of Upstream Slope on Minimum Factor of Safety for Rapid Drawdown
Effect of Unsaturated Shear Strength of Soil on Factor of Safety
The effects of saturated and unsaturated shear strength of soils for upstream slope stability
were investigated during rapid drawdown of the reservoir. The drawdown rate of 1m/day which is
common condition was selected. Firstly, steady-state analysis was performed and it was seen that
saturated zone was larger for unsaturated materials compared to saturated materials. Secondly,
transient analysis was performed to obtain the pore water pressure distribution during rapid
drawdown. The results shown in Figure 5-6 shows that saturated and unsaturated behavior of
materials has similar minimum factor of safety during rapid drawdown. The minimum factor of
safety obtained using saturated shear strength materials is slightly higher than calculated from
unsaturated shear strength. This decrease in minimum factor of safety from unsaturated materials
may be due to having larger wetting zone. Smaller saturated region might dissipate pore water
pressure faster than larger saturated zone. As conclusion, the upstream slope of saturated dam
0
0.5
1
1.5
2
2.5
3
3.5
4
0 5 10 15 20 25 30
Minim
um Factor of Safety
Time (days)
2.5H:1V
3.0H:1V
4.0H:1.0V
USACE Min.

59
materials is more stable than unsaturated dam materials. Clay and embankment materials in earth
dams are not fully saturated in the real conditions, unsaturated condition must be take into account
for dam design. Moreover, effect of friction angle on min. factor of safety for dam slope stability
was investigated. As shown in Fig. Increasing friction angle has increased the stability of earth
dam. Friction angle with 10, 20, 30 resulted that earth dam is not stable under these values.
Figure 5-7:Effect of Unsaturated Shear Strength of Soil on Minimum Factor of Safety
Increasing drawdown rate has affected the upstream slope stability. As shown in Figure 5-
7 the minimum Factor of safety of the upstream slope of the earth dam increases when the
drawdown rate decreases. This is due to the low drawdown rate allows more time for the pore-
water pressure dissipation from the saturated zone within the dam. According to Equation 5.1, the
dissipation of pore-water pressure increases the shear strength of the dam materials. By means of
this, the slope stability increases. On the other hand, the higher drawdown rate will not allow water
0
0.5
1
1.5
2
2.5
3
3.5
4
0 5 10 15 20 25 30
Minim
um Factor of Safety
Time (days)
Unsaturated Shear Strength
Saturated Shear Strength

60
enough time for pore-water pressure dissipation. So, the shear strength increase in the dam
materials is less than that of the materials at a lower drawdown rate. Moreover, the earth dam was
not stable for 5m/day drawdown.
Figure 5-8:Effect of Rapid Drawdown Rate on Min. Factor of Safety
Figure 5-9:Effect of Friction Angle on Min. Factor of Safety
0
0.5
1
1.5
2
2.5
3
3.5
4
4.5
0 5 10 15 20 25 30 35
Minim
um Factor of Safety
Time (days)
Phi:10
Phi:20
Phi:30
Phi:40
0
0.5
1
1.5
2
2.5
3
3.5
4
0 5 10 15 20 25 30 35
Minim
um Factor of Safety
Time (days)
1m/day
3m/day
5m/day

61
Monitoring Shear Stress in Earth Dam
Monitoring shear stress during rapid drawdown can prevent possible failure of earth
dams. Grouted sand which has sensing property under compression was assigned to find a
best location in the earth dam. As shown in Figure 5-9 four locations were selected and
named Loc.1, Loc.2 for embankment, and Loc.3, Loc.4 for foundation. The dam was
analyzed under rapid drawdown condition with 1m/day. Pore-water distribution was
obtained from transient analysis. To find a shear stress on grouted sand, shear stress change
was obtained from load-deformation analysis. The shear stress change was calculated from
full reservoir (0 day) and empty reservoir (30 days later). As shown in Figure 5.11
embankment shear stress change was higher than foundation shear stress change. Loc.1
maximum shear stress change was 92 kPa and it was the highest change among the other
locations. With this shear stress change the piezoresistivity was observed around 15.6%.
As shown in Figure 5-12 the resistivity change for Loc.2, Loc.3, and Loc.4 were 13.9%,
12%, and 14.4%, respectively. These measurements show that the model is sensitive to
shear stress.
Figure 5-10:Locations for Monitoring Shear Stress in Earth Dam After Rapid Drawdown Condition.
Embankment
Foundation
Core
50º
Loc.1Loc.2
Loc.3 Loc.4

62
Figure 5-11:Shear Stress Change After Rapid Drawdown
Figure 5-12:Monitoring Shear Stress in Earth Dam During Rapid Drawdown
0
10
20
30
40
50
60
70
0 20 40 60 80 100
Elevation (m)
Shear Stress Change (kPa)
Loc.1
Loc.2
Loc.3
Loc.4
Embankment
Foundation
0
10
20
30
40
50
60
70
0 2 4 6 8 10 12 14 16 18
Elevation (m)
Change in Resistivity (ΔR*100/R)
Loc.1
Loc.3
Loc.4
Loc.2
Embankment
Foundation

63
Seepage Control in the Earth Dam
Since grouted sand has very low permeability value, it was applied in the four
locations in the dam for seepage control in Figure 5-13. The locations are upstream face,
upstream, core and full body and the values of leakage flow rate were compared to the
value obtained from clay core earth dam. As shown in Figure 5.14, location of grouted
sand has affected the seepage quantity in the earth dam body and foundation. When it is
used for whole body of the earth dam, seepage in the body is almost 0, however using for
entire body is not economical. Therefore, seepage decreased from 0.0026 m3/day/m to
0.00028 m3/day/m when it is used for upstream. Grouted sand thickness for upstream can
be calculated from t= 0.3 + 0.0035 x H = 0.45 m. In this study, 1 m thickness was selected
to stay in safe due to unknown effect of water wave. With the application of grouted sand
for upstream face, seepage decreased from 0.0025 m3/day/m to 0.0005 m3/day/m. When
thinking of economical cross-section, upstream face is the best place for earth dam design.
Using acrylamide grouted sand for upstream face (1m) in earth dam dropped significantly
phreatic line as shown in Figure 5.15. Dropping this line means having lower wetting zone
and lower pore-water pressure. This lower pore-water pressure will make the earth dam
more stable because it affects the effective stress of the materials in upstream slope. After
assigning grouted sand to upstream face, stability analysis was performed. Table 5.8 shows
that stability of earth dam also increased after using it for the earth dam. The stability of
earth dam increased almost twice under rapid drawdown condition.

64
a) Upstream face
b) Upstream
c) Core
d) Full body
Figure 5-13:Selected Locations in the Earth Dam for Acrylamide Grouted Sand (a) Upstream face, (b)Upstream, (c)Core, and (d)Full body
Grouted sand
Grouted sand
Grouted sand
Grouted sand

65
Figure 5-14:Seepage Quantity Changes for Different Locations of Grouted Sands
a) Earth dam with clay core
b) Earth dam with acrylamide grouted sand
Figure 5-15:Effect of Acrylamide Grouted Sand on Phreatic Line in the Earth Dam (a) (b)
0
0.5
1
1.5
2
2.5
3
Seepage (10‐3m3/day/m
)
Locations
(‐89%)
(‐100%) (‐100%)UpstreamBlanket
Upstream Center Full BodyClay Core
(‐80%)

66
Table 5-8:Stability of Earth Dam after Using Grouted Sand For Upstream face (1m)
Summary
Based on the literature review and analysis, following observations are advanced:
1. 2-D plane strain dam was modelled and analyzed under three main conditional. The most severe
condition was rapid drawdown condition. Especially, first days of rapid drawdown is more critical.
In this condition, max shear stress change in upstream was 94 kPa.
2. Monitoring maximum shear stress in upstream is possible using piezoresistivity method. Since
acrylamide grouted sand is sensitivity to compression, acrylamide grouted sand can be used to
monitor upstream stability during rapid drawdown.
3. A low rate of reservoir drawdown increases the stability of the upstream slope of the earth dam.
4. Seepage was affected by mesh size of the model. Seepage decreased 29% when mesh size varied
from 5mx5m to 1mx1m. Phreatic line was not influenced by mesh size.
5. Unsaturated soil shear strength affected the factor of safety. The slope stability calculated from
saturated shear strength is slightly higher than calculated from unsaturated shear strength. Since
there will be unsaturated soil in the earth dam during drawdown condition, unsaturated shear
strength must be considered for design.
6. Seepage decreased from 0.0026 m3/day/m to 0.0005 m3/day/m when acrylamide grouted sand
was used for upstream face, 80% reduction was observed. Upstream face is the best economical
cross-section for usage of acrylamide grouted sand for earth dams. Moreover, using grouted barrier
in the earth dam increased the stability twice compared to clay core earth dam.
Analysis method
Slope Zoned type
End of construction Steady‐state Rapid drawdown
Upstream Downstream Upstream Downstream Upstream
Bishop 4.0 H : 1.0 V Clay core 3.579 3.55 3.677 3.3 1.216
Bishop 4.0 H : 1.0 V
Grouted sand face 3.614 3.55 7.948 3.3 2.359

67
CHAPTER 6 CONCLUSIONS AND RECOMMENDATIONS
Seepage control in the earth dams is an important task to prevent possible failures.
Decreasing phreatic line by using low permeability materials or horizontal drains can be useful to
control seepage. When it comes to stability of earth dam, rapid drawdown condition is the most
severe condition. So, monitoring shear stress during rapid drawdown condition can provide
informations about phreatic line level or possible failures in the upstream. This study was focused
on investigation of the behavior of acrylamide grouted sand for earth dams. Since acrylamide grouts
has the lowest viscosity (1.2 cP) among all chemical grouts they have been widely used in stopping
water in geotechnical engineering. Around 140 acrylamide grouted sands were prepared to
investigate the mechanical, permeability and pizeoresistivity properties. Electrical resistivity
change was identified as the sensing and monitoring property for the acrylamide grouted sands.
0.1% conductive filler (CF) was added to make the grouted sands very sensing under submerged
and moist cured. Nonlinear Vipulanandan p-q piezoresistivity model was used to predict the
piezoresistive behavior of the grouted sands.
In this study, earth dam was modelled and grouted using smart acrylamide grouted sand
with enhanced piezoresistive properties. Shear stress changes during rapid drawdown was
observed.
Conclusions
Based on this study the following conclusions are advanced:
1. Unconfined compressive strength was affected by the density, particle size and gradation.
Strength of grouted sands increased when particles are finer. The compressive strength of the
grouted sands varied from 240 kPa to 775 kPa after 7days moist curing. Moreover, curing time
after 3 days did not affect the mechanical properties of grouted. Vipulanandan p-q model can
be used to predict the stress-strain and piezoresistivity behavior of acrylamide grouted sands.

68
Failure strain and modulus were not influenced by the curing time after 3 days. When grouted
sand samples were compacted, the failure strain decreased.
2. The permeability of grouted sand was 10-12 m/sec, and it was not affected by grain size
distribution and particle size.
3. The acrylamide grouted sand with and without conductive filler were pizoresistive. Adding
0.1% conductive filler into the sand increased the sensitivity of the grouted sands.The average
change in resistance change at peak compressive stress was 21% for submerged specimens and
24% for moist cured specimens.
4. 2-D dam was modelled and analyzed under three main conditional. The most severe condition
was rapid drawdown condition. Especially, first days of rapid drawdown is more critical. In
this condition, max shear stress change in upstream was 94 kPa.
5. Monitoring maximum shear stress change in upstream is possible using piezoresistivity
method. Since acrylamide grouted sand is sensitivity to compression, acrylamide grouted sand
can be used to monitor upstream stability during rapid drawdown.
6. Seepage was affected by mesh size of the model. Seepage decreased 29% when mesh size
varied from 5mx5m to 1mx1m. Phreatic line was not influenced by mesh size.
7. Unsaturated soil shear strength affected the factor of safety. The slope stability calculated from
saturated shear strength was slightly higher than calculated from unsaturated shear strength.
Since there will be unsaturated soil in the earth dam during drawdown condition, unsaturated
shear strength must be considered for design.
8. Seepage decreased from 0.0026 m3/day/m to 0.0005 m3/day/m when acrylamide grouted sand
was used for upstream face, 80% reduction was observed. Upstream face is the best economical
cross-section for usage of acrylamide grouted sand for earth dams.
9. Using acrylamide grouted sand for upstream face incredibly decreased the phreatic line and
provide lower wetting region in the earth dam. By means of this, the stability of upstream
increased twice compared to clay core earth dam.

69
Recommendations
1. In this study, a new method for monitoring earth dam during rapid drawdown is presented.
The electrical resistivity change was found to be the sensitive property.
2. From the present study, 2-D dam was analyzed under three main conditional. These are
end of construction, steady-state and rapid drawdown condition. However, USACE also offers
earthquake analysis. The earth dam should be analyzed under earthquake to see the behavior of
grouted sand. Moreover, 3-D analysis should be performed to see differences from 2-D analysis.
70
REFERENCES
AM-9 Chemical Grout Manual. (1965). Cyanamid Company, Number 33166000256370,
Washington State Department of Transportation Materials Laboratory Library Olympia, WA
98504-7365.
Billstein, M. Sevensson, U., and Johansson, N. (1999). “Development and Validation of a
Numerical Model of Flow through Embankment Dams – Comparisons with Experimental Data
and Analytical Solutions.” Transport in Porous Media, Vol. 35, No. 3, PP. 395-406.
Bishop, A. W. (1955). “The use of slip circles in stability analysis of slopes.” Geotechnique, Vol.
5, No. 1, pp. 7‐17
Center for Innovative Grouting Materials and Technology (CIGMAT). (2002a). “Standard Test
Method for Measuring Compressive Strength of Grouts and Grouted sands.” GR02-02, Univ.
of Houston, Houston.
Center for Innovative Grouting Materials and Technology (CIGMAT). (2002b). “Standard Test
Method for Permeability of Grouts and Grouted Sands.” GR07-02, Univ. of Houston, Houston.
Deniz Ersayin (2006). “Studying Seepage in a Body of Earth-fill Dam by Artificial Neural
Nerworks.” Master Thesis, Izmir Institute of Technology.
Das, B. M., (1987). “Advanced Soil Mechanics.” McGraw-Hill Book Company, New York, U. S.
A.
Drochytka, R., Kocianova, M., Cerny, V. (2015). “Development of Grout for Additional Seal
Embankment Dams.” Procedia Engineering 108 (2015) 632–638
Foster, M., Fell, R., and Spannagle, M. (2000). “A Method for Assessing the Relative Likelihood
of Failure of Embankment Dams by Piping.” Canadian Geotech. J., 37(5), 1025–1061.
Fellunius, W. (1936). “Calculations of the Stability of Earth Dams.” Proceedings of the Second
Congress of Large Dams. Vol. 4, pp. 445‐63, Washington D. C.

71
Fredlund DG and Xing A, (1994). “Equations for the soil-water characteristic curve.” Journal of
Canadian Geotechnical Journal, vol. 31, pp. 521-532
Garg, S. K. (2006). “Irrigation Engineering and HydraulicStructures,” 19th Edition, Khanna
Publishers, Delhi, 42006, pp. 960-1020.
Geo-studio (2012). Stability and Seepage Modeling.Users Guide July Edition, Geo Slope
International Ltd., Canada.
General Directorate of State Hydraulic Works, DSI (2012). “Technical Manual for
Instrumentations in Dams.” Turkey.
General Directorate of State Hydraulic Works, DSI (2012). “Earth Dam Design Guide.” Turkey.
Harr, M. E. (1962). “Groundwater and Seepage.” McGraw-Hill Book Company, New York, U. S.
A.
Gonzalez H.A. and C. Vipulanandan (2005). "Pulse Velocity and Strength Properties of
Acrylamide Grouted Sand." CIGMAT Conference Proceeding.
Karol, R. H. (1990). "Chemical Grouting." Marcel Dekker, Inc., New York
Kashef, A. I. (1987). “Groundwater Engineering.” McGraw-Hill Book Company, New York, U. S.
A.
Kasim F, Fei W. S. (2002). “Numerical Parametric Simulations for Seepage Flow Behaviour
Through an Earthfill Dam.” Journal of Civil Engineering 14(1), Malaysia.
Knight, M. A. (2016). “Construction Monitoring For Earth Dams [PowerPoint slides].” Retrieved
from http:// www.civil.uwaterloo.ca/
Lane, P. A., and Griffiths, D. V. (2000). “Assessment of Stability of Slopes Under Drawdown
Conditions.” Journal of Geotechnical and Geonvironmental Engineering, 126(5):443-450.
Linsley R.K. and Franzini, J.B., (1964). “Water-Resources Engineering.” McGraw – Hill,
Tokyo, pp. 173-211.
Morgenstern, N. R. and Price, V. E. (1965). “The Analysis of the Stability of General Slip
Surfaces.” Geotechnique, Vol. 15, No. 1 pp. 77‐93.

72
Narduzzo, L. (Feb. 2003). “The Toronto Transit Commision’s Subway Tunnel and Station Leak
Remediation Grouting Program,” Grouting and Ground Treatment, GSP No. 120, Vol.2,
pp.1617-1627.
Narita, Kunitomo, (2005). “Design and Construction of Embankment Dams.” Department of Civil
Eng., Aichi Institute of Technology.
Noori B. M. A., Ismaeel K. S. (2011). “Evaluation of seepage and stability of Duhok Dam.” Al-
Rafidain Engineering 19(1): 42-58, Iraq.
Novak, P., Moffat, A.I.B., Nalluri, C. and Narayanan R. (2001). “Hydraulic Structures Fourth
Edition.” Tylor & Francis Group, London.
Osuji, S. O. and Adegbemileke, S. A. (2015). “Phreatic Line and Pore Pressure Stresses in Zoned
Rockfill Dam.” Asian Journal of Science and Technology, Vol.6, Issue 0.5, pp. 1447-1454
Ozgurel, H. G. and Vipulanandan, C. (2005). "Effect of Grain Size Distribution on Permeability
and Mechanical Behavior of Acrylamide Grouted Sand." Journal of Geotechnical and
Geoenvironmental Engineering, Vol. 131, No. 12, pp.1457-1465
Pinyol, NM, Alonso EE and Olivella S. (2008). “Rapid drawdown in slopes and embankments.”
Water Resources Research, vol. 44, pp. 1-22.
Sakamoto, T., Yoshida, H., Yamaguedi, Y, (2002). “Numerical Simulation of Sliding of an Earth
Dam During 1995 Kobe Earthquake.” The 22nd USSD Annual Conference, JAPAN, 2002.
Sarma, S. K. (1973). “Stability Analysis of Embankment and Slopes.” Geotechnique, Vol. 23 (3),
pp.423‐33.
Seepage Modeling with SEEP/W (2012). “SEEP/W Manual 2012”.
Souliyavong T., (2012). “Factors Affecting the Stability Analysis of Earth Dam Slopes Subjected
to Reservoir Drawdown.” Second International Conference on Geotechnique, Construction
Materials and Environment, Kuala Lumpur, Malaysia, Nov. 14-16, 2012.
Spencer, E. (1967). “A method of Analysis of the Stability of Embankments, Assuming Parallel

73
Interslice Forces.” Geotechnique, Vol. 17, pp. 11‐26.
Suhail, A, Khattab A. (2008). “Stability Analysis of Mosul Dam under Saturated and Unsaturated
Soil Conditions.” Al-Rafidain Engineering Vol. 18, No.1.
Tallard, G. R., Caron, C. (1977). “Chemical Grouts for Soils Vol.1 Available Materials,” Federal
Highway Administration Report, Report # FHWA-RD-77-50.
USACE (1993). “Engineer and Design; Seepage Analysis and Control for Dams.” EM 1110-2-
1901, U. S. Army Corps of Engineers, Washington, U. S. A.
USACE (1994). “Deformation Monitoring and Control Surveying.” EM-110-2-1004, US Army
Corps of Engineering, Washington, DC.
USACE (1995). “Instrumentation of Embankment Dams and Levees.” EM-110-2-1908, U. S.
Army Corps of Engineering, Washington, DC
USACE (1997). “Chemical Grouting.” Technical Engineering and Design Guides No.24.
USACE (2004). “General Design and Construction Considerations for Earth and Rockfill Dams.”
Department of the Army, U.S. Army Corps of Engineers, Washington DC, United States of
America.
USBR (1960). “Design of Small Dams.” United States Department of the Interior of Bureau
Reclamation, Denver, Colorado, First Edition.
USBR (1987). “Design of Small Dams.” United States Department of the Interior of Bureau
Reclamation, Denver, Colorado, Third Edition.
USBR (1992). “Embankment Design.” United States Department of the Interior of Bureau
Reclamation, Denver, Colorado.
www.asctec.de/en/drone-uav/uav-uas-drone-bridge-dam-inspection.
Vanapalli SK, Fredlund DG, Pufahl DE and Clifton AW, (1996). “Model for the Prediction of
Shear Strength with Respect to Soil Suction.” Canadian Geotechnical Journal, vol.3, pp. 379-
392

74
Vipulanandan, C., and Paul, E. (1990). “Performance of epoxy and polyester polymer concrete.”
ACI Mater. J., 873(3), 241–251.%d