developing quality indicators & dashboards for dementia adam cook south east coast quality...
TRANSCRIPT
Developing Quality Indicators & Dashboards for Dementia
Adam CookSouth East Coast Quality Observatory
The Quality Observatory
• Team of 12• Provision of benchmarking
– Over 50 tools and products developed
• Skills development– Analytical– Measurement and interpretation
• Data quality improvement• World Class Commissioning support• Developing meaningful clinical metrics• Focus on measurement for improvement rather than
judgement
-
100
200
300
400
500
600
700
800
900
1,000
Ap
r-04
Ma
y-04
Jun
-04
Jul-0
4
Au
g-0
4
Se
p-0
4
Oct-0
4
No
v-04
De
c-04
Jan
-05
Fe
b-0
5
Ma
r-05
Ap
r-05
Ma
y-05
Jun
-05
Jul-0
5
Au
g-0
5
Se
p-0
5
Oct-0
5
No
v-05
De
c-05
Jan
-06
Fe
b-0
6
Ma
r-06
Ap
r-06
Ma
y-06
Jun
-06
Jul-0
6
Au
g-0
6
Se
p-0
6
Oct-0
6
No
v-06
De
c-06
Jan
-07
Fe
b-0
7
Ma
r-07
Ap
r-07
Ma
y-07
Jun
-07
Jul-0
7
Au
g-0
7
Se
p-0
7
Oct-0
7
No
v-07
De
c-07
Jan
-08
Fe
b-0
8
Ma
r-08
AAW
Bexhill
Brighton
Crawley
EAMES
East Surrey
Eastbourne
G & W
Hastings
Horsham
Mid Sussex
N Surrey
SD & Weald
SHaWoking
Western Sx
Inpatient All
1
Select currency from pivot table on "Data" sheet to change all Charts to that currency
% Delayed transfers of Care by Type - source SITREPS 7/1/02-31/08/03
-20.00
0.00
20.00
40.00
60.00
80.00
100.00
07
/01
/02
07
/02
/02
07
/03
/02
07
/04
/02
07
/05
/02
07
/06
/02
07
/07
/02
07
/08
/02
07
/09
/02
07
/10
/02
07
/11
/02
07
/12
/02
07
/01
/03
07
/02
/03
07
/03
/03
07
/04
/03
07
/05
/03
07
/06
/03
07
/07
/03
07
/08
/03
%Other Reasons
%Patient Family choice
%Await Domiciliary package
%Await Residential
%Await Further NHS care
%Await Public Funding
%AwaitAss >7days
%AwaitAss<7 days
% Delayed transfers of Care by Type - source SITREPS 7/1/02-31/08/03
-20.00
0.00
20.00
40.00
60.00
80.00
100.00
%Aw aitAss<7 days
%Aw aitAss >7days
%Aw ait Public Funding
%Aw ait Further NHS care
%Aw ait Residential
%Aw ait Domiciliary package
%Patient Family choice
%Other Reasons

Developing dementia metrics
• Undertaken jointly with the NHS Information Centre– Dementia and Stroke– Commenced October 2007– Regular meetings with a wide range of clinicians across South East Coast
• Aim to develop metrics from existing electronic data sources to evidence– The quality of care provided– Whether national standards and recommendations were met– Whether agreed pathways are adhered to– Cost effectiveness of treatment– Variation between different providers– The impact of care in one part of the system further down the pathway– Where ‘best’ is delivered
• Provide a balance of measures to prompt questions and discussion• Aimed to influence:-
– Influence national developments and recommendations– The priority given to new data collections or mandatory collection of new fields on
information systems– Linked to the National Dementia Strategy working group
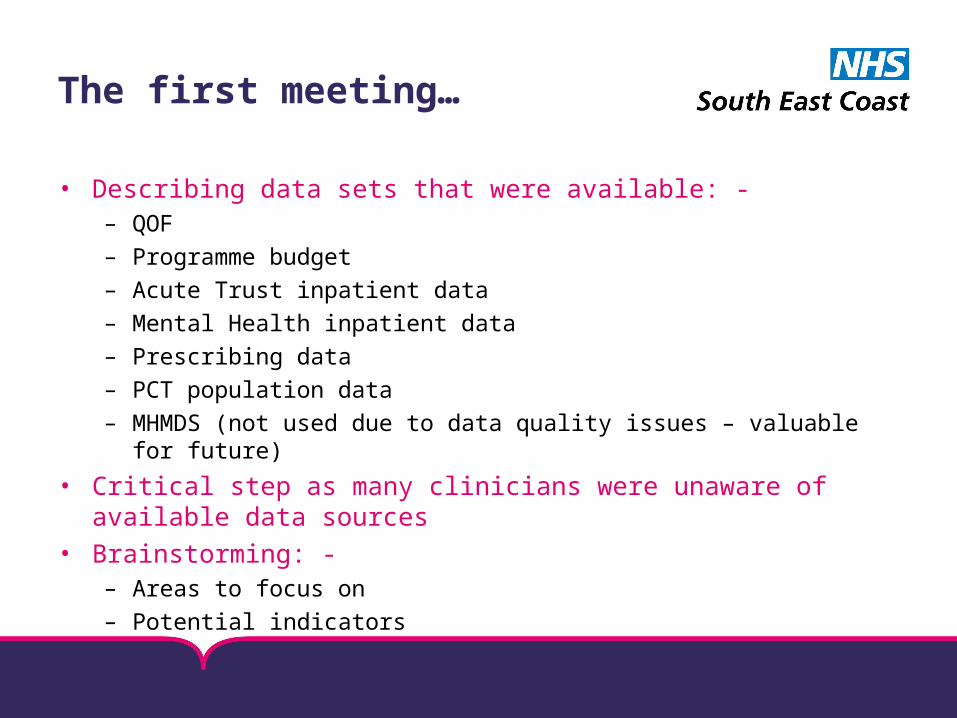
The first meeting…
• Describing data sets that were available: -– QOF
– Programme budget
– Acute Trust inpatient data
– Mental Health inpatient data
– Prescribing data
– PCT population data
– MHMDS (not used due to data quality issues – valuable for future)
• Critical step as many clinicians were unaware of available data sources
• Brainstorming: -– Areas to focus on
– Potential indicators
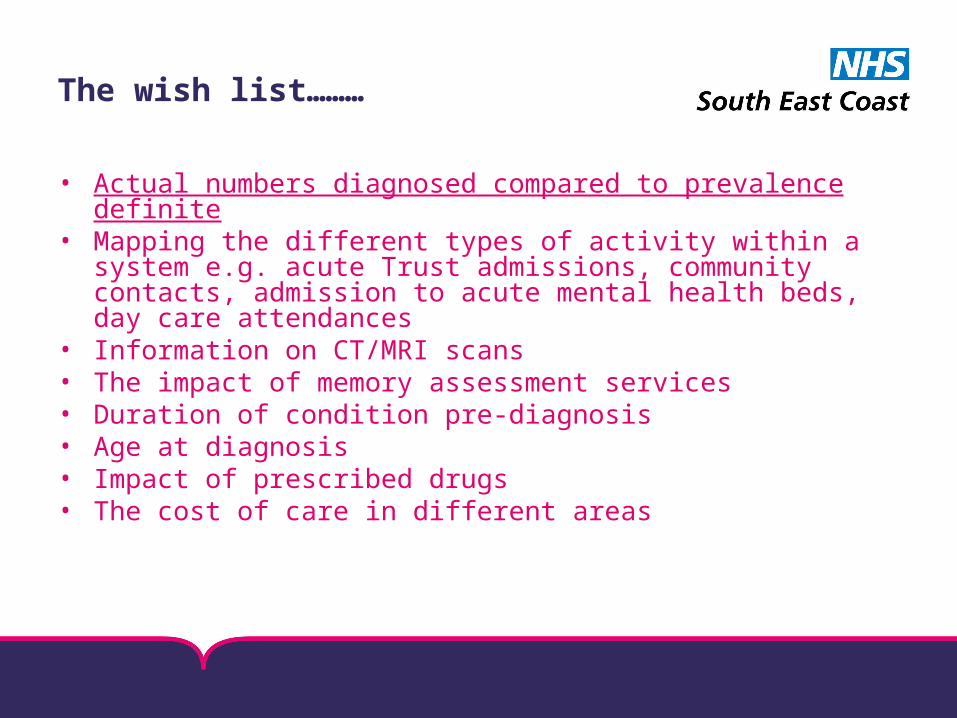
The wish list………
• Actual numbers diagnosed compared to prevalence definite• Mapping the different types of activity within a system e.g. acute
Trust admissions, community contacts, admission to acute mental health beds, day care attendances
• Information on CT/MRI scans• The impact of memory assessment services• Duration of condition pre-diagnosis• Age at diagnosis• Impact of prescribed drugs• The cost of care in different areas
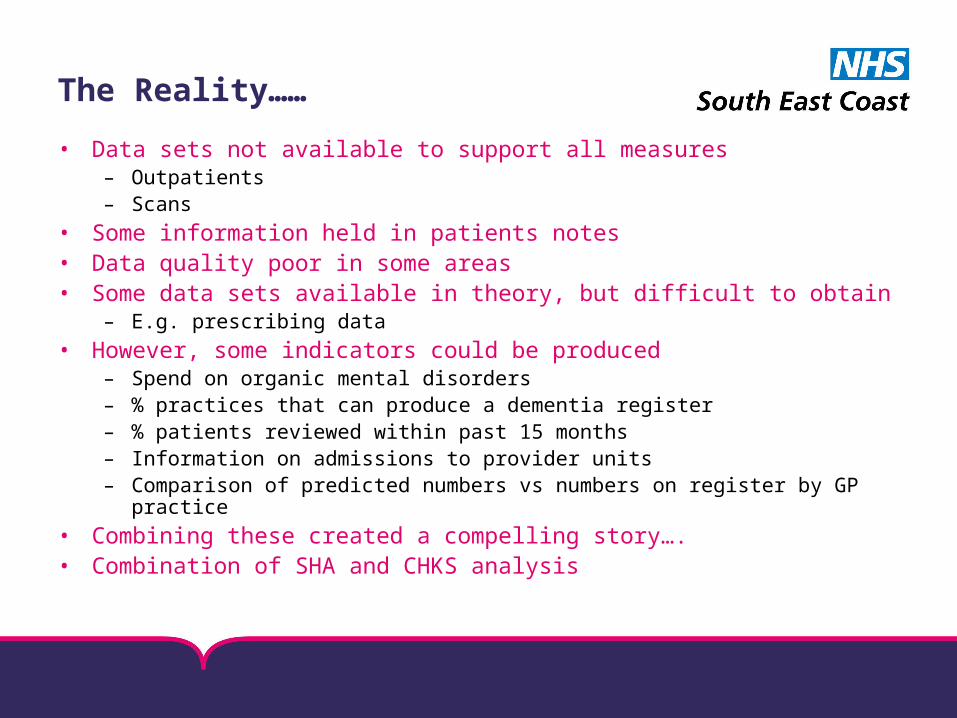
The Reality……
• Data sets not available to support all measures– Outpatients– Scans
• Some information held in patients notes• Data quality poor in some areas• Some data sets available in theory, but difficult to obtain
– E.g. prescribing data
• However, some indicators could be produced– Spend on organic mental disorders– % practices that can produce a dementia register– % patients reviewed within past 15 months– Information on admissions to provider units– Comparison of predicted numbers vs numbers on register by GP practice
• Combining these created a compelling story….• Combination of SHA and CHKS analysis
0
500
1,000
1,500
2,000
2,500
3,000
3,500
4,000
Brig
hton
and
Hov
e C
ityT
each
ing
PC
T
Eas
t S
usse
x D
owns
and
Wea
ldP
CT
Eas
tern
and
Coa
stal
Ken
tT
each
ing
PC
T
Has
tings
and
Rot
her
PC
T
Med
way
Tea
chin
g P
CT
Sur
rey
PC
T
Wes
t K
ent
PC
T
Wes
t S
usse
x T
each
ing
PC
T
'000
s
200607
200506
200405
by Area 5b - Organic Mental Disorders
Programme Budget Year on Year Net Expenditure / Unified Weighted 100,000 Pop.
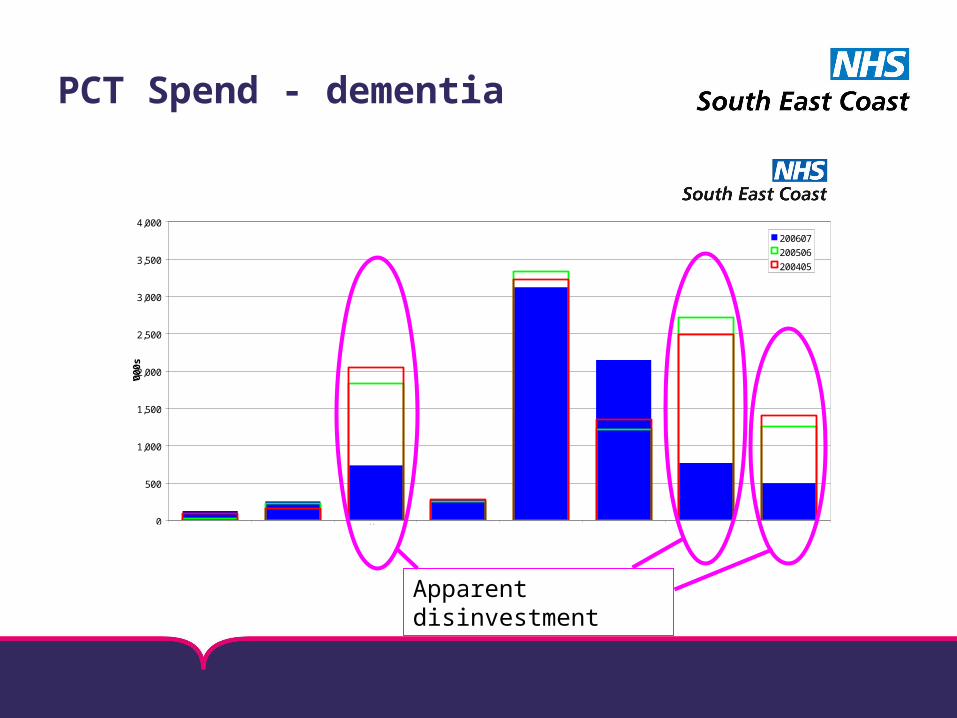
PCT Spend - dementia
Apparent disinvestment
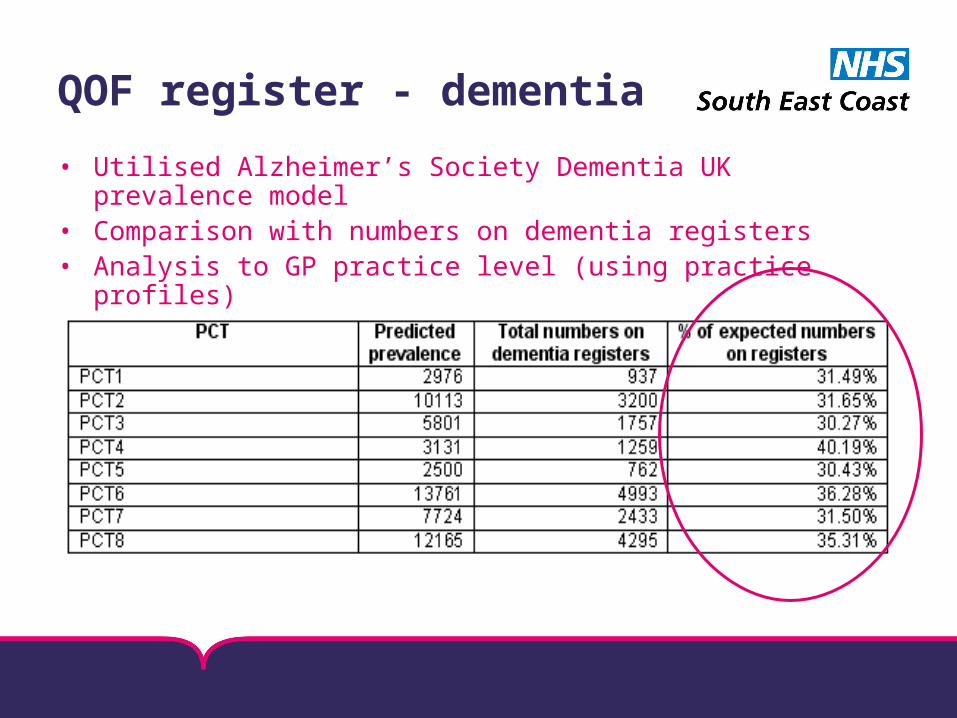
QOF register - dementia
• Utilised Alzheimer’s Society Dementia UK prevalence model• Comparison with numbers on dementia registers• Analysis to GP practice level (using practice profiles)
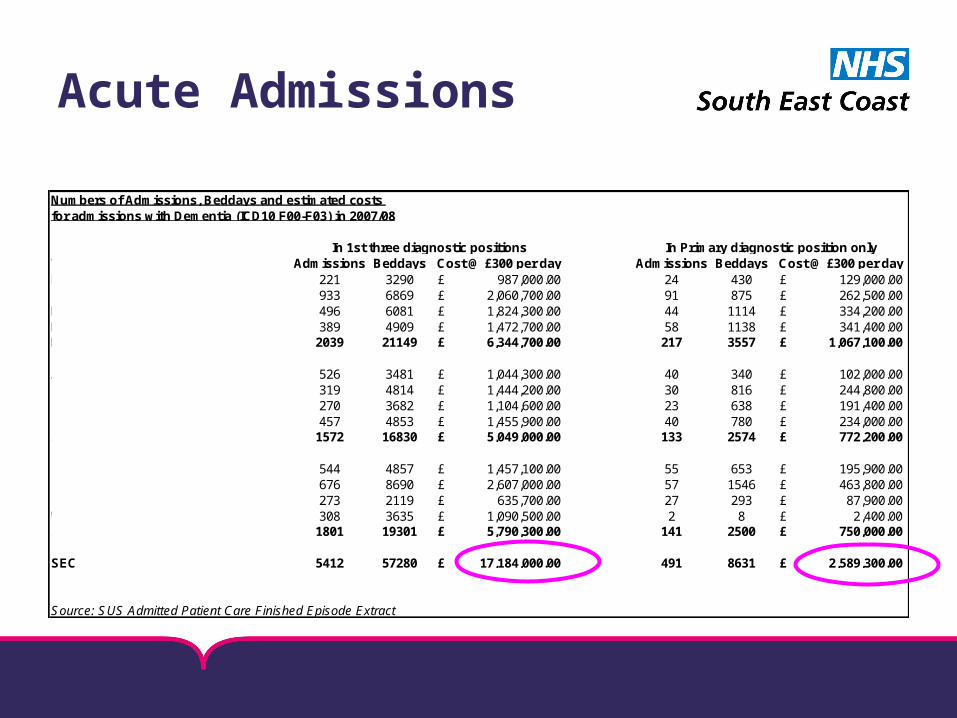
Acute Admissions
Numbers of Admissions, Beddays and estimated costs for admissions with Dementia (ICD10 F00-F03) in 2007/08
Trust Admissions Beddays Cost @ £300 per day Admissions Beddays Cost @ £300 per dayDartford & Gravesham 221 3290 987,000.00£ 24 430 129,000.00£ East Kent Hospitals 933 6869 2,060,700.00£ 91 875 262,500.00£ Maidstone & Tunbridge Wells 496 6081 1,824,300.00£ 44 1114 334,200.00£ Medway 389 4909 1,472,700.00£ 58 1138 341,400.00£ Kent 2039 21149 6,344,700.00£ 217 3557 1,067,100.00£
Ashford & St Peter's 526 3481 1,044,300.00£ 40 340 102,000.00£ Frimely Park 319 4814 1,444,200.00£ 30 816 244,800.00£ Royal Surrey County 270 3682 1,104,600.00£ 23 638 191,400.00£ Surrey & Sussex 457 4853 1,455,900.00£ 40 780 234,000.00£ Surrey 1572 16830 5,049,000.00£ 133 2574 772,200.00£
Brighton & Sussex University Hospitals 544 4857 1,457,100.00£ 55 653 195,900.00£ East Sussex 676 8690 2,607,000.00£ 57 1546 463,800.00£ Royal West Sussex 273 2119 635,700.00£ 27 293 87,900.00£ Worthing & Southlands 308 3635 1,090,500.00£ 2 8 2,400.00£ Sussex 1801 19301 5,790,300.00£ 141 2500 750,000.00£
SEC 5412 57280 17,184,000.00£ 491 8631 2,589,300.00£
Source: SUS Admitted Patient Care Finished Episode Extract
In 1st three diagnostic positions In Primary diagnostic position only
Challenging for local commissioners
• “You can’t use the Programme Budget data – it’s wrong”• Disinvestment + evidencing relatively low levels of
diagnosis• Significant sums being spent in secondary care• Could money be spent more effectively??• Analysis has influenced the service models developed by
local PCTs• Were commissioners aware of their ‘story’• Prompted lots of discussion and debate
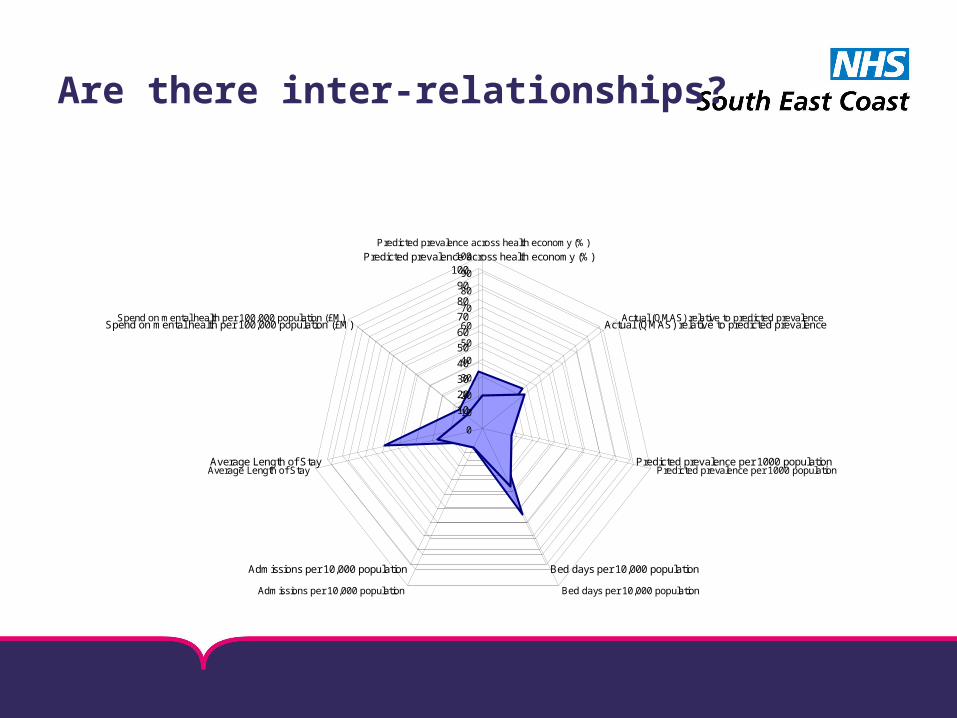
Are there inter-relationships?
Surrey PCT
0
10
20
30
40
50
60
70
80
90
100Predicted prevalence across health economy (%)
Actual (QMAS) relative to predicted prevalence
Predicted prevalence per 1000 population
Bed days per 10,000 populationAdmissions per 10,000 population
Average Length of Stay
Spend on mental health per 100,000 population (£M)
West Kent PCT
0
10
20
30
40
50
60
70
80
90
100Predicted prevalence across health economy (%)
Actual (QMAS) relative to predicted prevalence
Predicted prevalence per 1000 population
Bed days per 10,000 populationAdmissions per 10,000 population
Average Length of Stay
Spend on mental health per 100,000 population (£M)
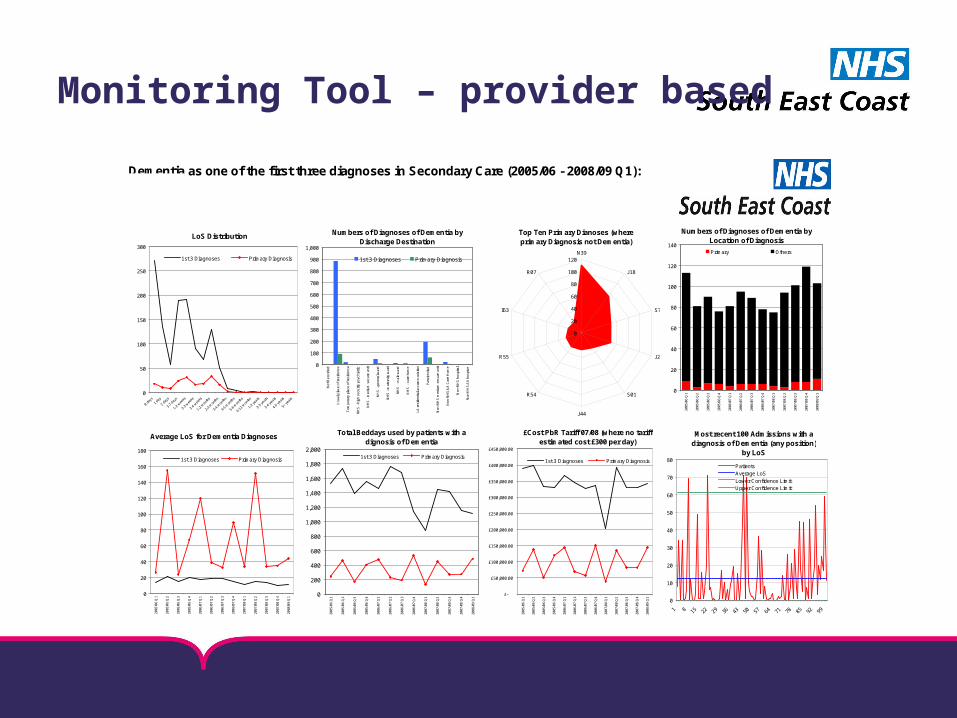
Monitoring Tool – provider based
Most recent 100 Admissions with a diagnosis of Dementia (any position)
by LoS
0
10
20
30
40
50
60
70
80
1 8 15 22 29 36 43 50 57 64 71 78 85 92 99
PatientsAverage LoSLower Confidence LimitUpper Confidence Limit
Top Ten Primary Dianoses (where primary Diagnosis not Dementia)
0
20
40
60
80
100
120N39
J18
S72
J22
S01
J44
R54
R55
I63
R07
LoS Distribution
0
50
100
150
200
250
300
0 da
ys1
day
2 da
ys
3-7
days
1-2
weeks
2-3
weeks
3-4
weeks
1-2
mon
ths
2-3
mon
ths
3-4
mon
ths
4-5
mon
ths
5-6
mon
ths
6-12
mon
ths
1-2
year
s
2-3
year
s
3-4
year
s
4-5
year
s
5+ ye
ars
1st 3 Diagnoses Primary Diagnosis
Numbers of Diagnoses of Dementia by Location of Diagnosis
0
20
40
60
80
100
120
140
2005
/06
Q1
2005
/06
Q2
2005
/06
Q3
2005
/06
Q4
2006
/07
Q1
2006
/07
Q2
2006
/07
Q3
2006
/07
Q4
2007
/08
Q1
2007
/08
Q2
2007
/08
Q3
2007
/08
Q4
2008
/09
Q1
Primary Others
Average LoS for Dementia Diagnoses
0
20
40
60
80
100
120
140
160
180
2005
/06
Q1
2005
/06
Q2
2005
/06
Q3
2005
/06
Q4
2006
/07
Q1
2006
/07
Q2
2006
/07
Q3
2006
/07
Q4
2007
/08
Q1
2007
/08
Q2
2007
/08
Q3
2007
/08
Q4
2008
/09
Q1
1st 3 Diagnoses Primary Diagnosis
Total Beddays used by patients with a dignosis of Dementia
0
200
400
600
800
1,000
1,200
1,400
1,600
1,800
2,000
2005
/06
Q1
2005
/06
Q2
2005
/06
Q3
2005
/06
Q4
2006
/07
Q1
2006
/07
Q2
2006
/07
Q3
2006
/07
Q4
2007
/08
Q1
2007
/08
Q2
2007
/08
Q3
2007
/08
Q4
2008
/09
Q1
1st 3 Diagnoses Primary Diagnosis
£Cost PbR Tariff 07/08 (where no tariff estimated cost £300 per day)
£-
£50,000.00
£100,000.00
£150,000.00
£200,000.00
£250,000.00
£300,000.00
£350,000.00
£400,000.00
£450,000.00
2005
/06
Q1
2005
/06
Q2
2005
/06
Q3
2005
/06
Q4
2006
/07
Q1
2006
/07
Q2
2006
/07
Q3
2006
/07
Q4
2007
/08
Q1
2007
/08
Q2
2007
/08
Q3
2007
/08
Q4
2008
/09
Q1
1st 3 Diagnoses Primary Diagnosis
Numbers of Diagnoses of Dementia by Discharge Destination
0
100
200
300
400
500
600
700
800
900
1,000
Not
Rec
orde
d
Usu
al p
lace
of r
esid
ence
Tem
pora
ry p
lace
of r
esi
den
ce
NH
S -
hig
h se
curit
y ps
ych
iatr
ic
NH
S -
med
ium
se
cure
uni
t
NH
S -
gen
eral
war
d
NH
S -
mat
ern
ity w
ard
NH
S -
mal
e w
ard
NH
S -
car
e h
ome
LA r
esid
ent
ial a
ccom
mod
atio
n
Pat
eint
die
d
Non
-NH
S m
ediu
m s
ecu
re u
nit
Non
-NH
S/L
A C
are
Hom
e
Non
-NH
S h
ospi
tal
Non
-NH
S/L
A h
osp
ice
1st 3 Diagnoses Primary Diagnosis
Dementia as one of the first three diagnoses in Secondary Care (2005/06 - 2008/09 Q1): Medway
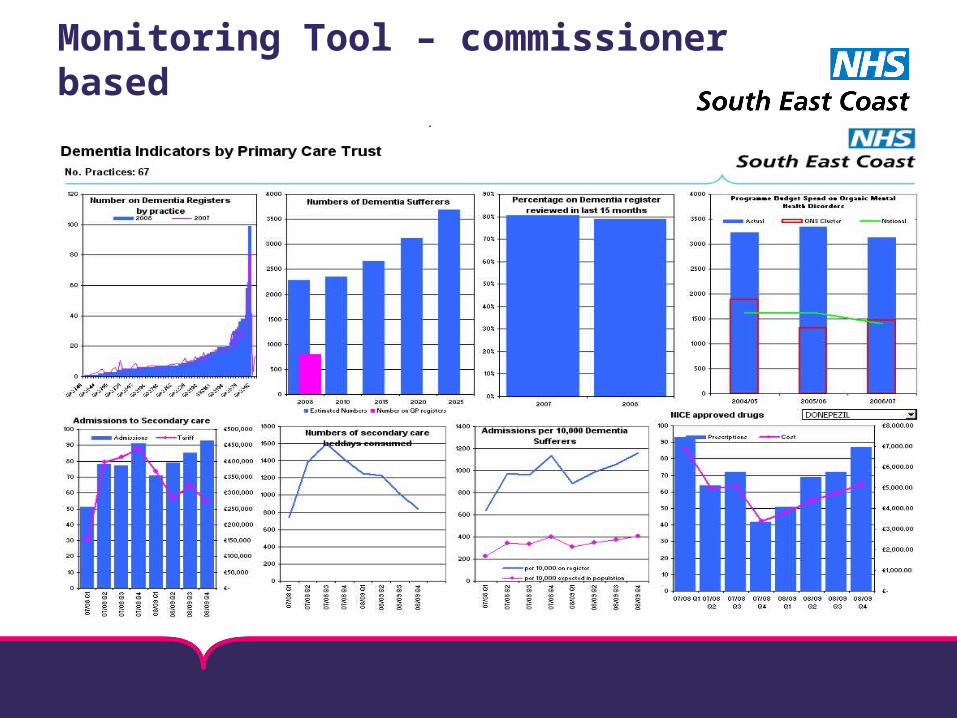
Monitoring Tool – commissioner based
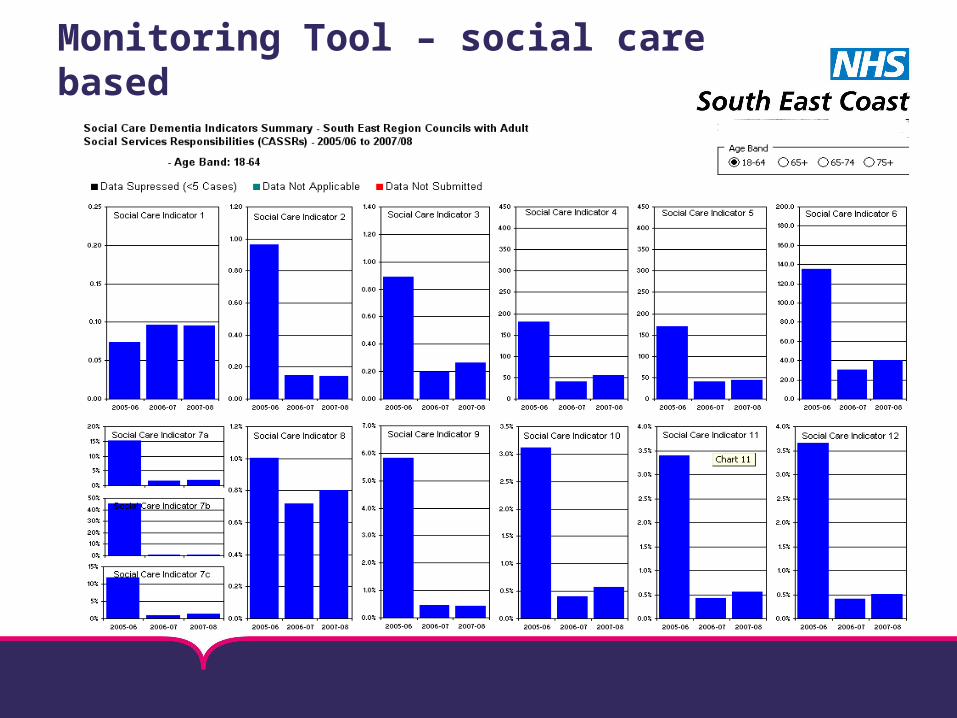
Monitoring Tool – social care based
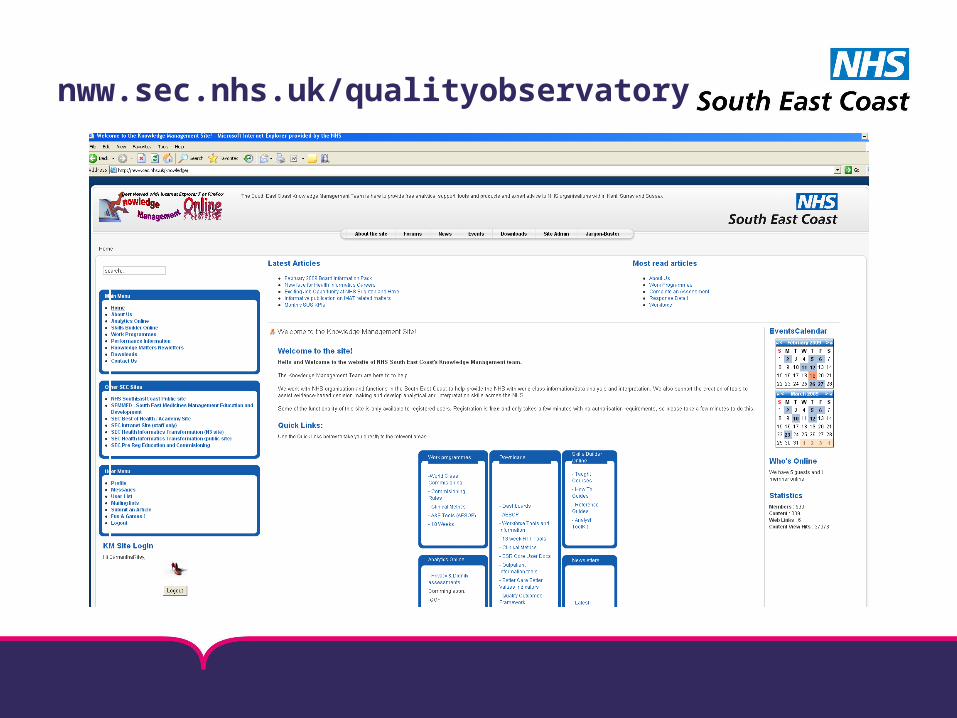
nww.sec.nhs.uk/qualityobservatory

Bi-monthly newsletter
Contact details
• nww.sec.nhs.uk/qualityobservatory– Register as a user
• Adam Cook– 01293 778846– [email protected]