developing an interface management (im) model for
TRANSCRIPT

University of Calgary
PRISM: University of Calgary's Digital Repository
Graduate Studies The Vault: Electronic Theses and Dissertations
2015-06-01
Developing an Interface Management (IM) Model for
Construction Projects
Weshah, Nesreen
Weshah, N. (2015). Developing an Interface Management (IM) Model for Construction Projects
(Unpublished doctoral thesis). University of Calgary, Calgary, AB. doi:10.11575/PRISM/25615
http://hdl.handle.net/11023/2284
doctoral thesis
University of Calgary graduate students retain copyright ownership and moral rights for their
thesis. You may use this material in any way that is permitted by the Copyright Act or through
licensing that has been assigned to the document. For uses that are not allowable under
copyright legislation or licensing, you are required to seek permission.
Downloaded from PRISM: https://prism.ucalgary.ca

UNIVERSITY OF CALGARY
Developing an Interface Management (IM) Model for Construction Projects
by
Nesreen Ayed Weshah
A THESIS
SUBMITTED TO THE FACULTY OF GRADUATE STUDIES
IN PARTIAL FULFILMENT OF THE REQUIREMENTS FOR THE
DEGREE OF DOCTOR OF PHILOSOPHY
GRADUATE PROGRAM IN CIVIL ENGINEERING
CALGARY, ALBERTA
May, 2015
© Nesreen Weshah 2015

ii
Abstract
Interface management (IM) is a main factor in the success of construction projects. Although
there is no agreement about the definition of interfaces and IM, many researchers discuss the
boundary conditions between tools, phases, systems, physical elements/components, people,
organizations, and other elements. For the last two to, three decades there has been less than
necessary awareness of the essentials of IM and the severity of interface problems, and this has
negatively affected project performance. Failure to properly manage interfaces impacts project
performance as defined by scope control, quality, schedule, cost, safety, and resources.
The objectives of this study are twofold: (a) enhancing the IM among different project
participants involved in the construction projects and (b) increasing the effectiveness of IM
throughout the project lifecycle, focusing specifically on the engineering/design phase. The study
uses both qualitative and quantitative approaches (mixed methods) to investigate, identify, and
classify interface problem factors in construction projects.
This study is divided into three phases. The first phase categorizes IM factors contributing to
interface conflicts among different project participants engaged in construction projects. The
second phase then makes use of these variables to develop a multiple-regression analysis to
develop models between underlying interface problem factors and project performance
indicators. Finally, based on the results of the first and the second phases, the third phase consists
of developing a conceptual framework (RIBA framework) and use case models to study the IM
relationships among owner, contractor, and designer to identify the main responsibilities for each
one, highlight the critical IM areas, and consequently provide suggestions for improving and
enhancing IM.

iii
The results of this research study could assist engineers, architects, and others within the
construction industry to study and examine the interfaces and the project performance during the
project’s early stages. This could in turn serve to minimize project delay and cost overruns and
reduce conflict among different project participants involved in the construction projects, which
will influence project performance positively.

iv
Acknowledgements
First, thanks to my Lord for providing me the health and wealth required to finalize this research
work. I would like to thank my supervisor, Dr. Lynne Cowe Falls, for her invaluable assistance,
feedback, and advice during my long research journey. Thank you for giving me the chance and
trusting me to finish my research work. I would like to extend my highest appreciation to
Dr. George Jergeas for helping me with his most valued academic and practical knowledge.
Additionally, I would like to acknowledge the invaluable assistance and contribution of
Dr. Wael Elghandour.
Also, I would like to acknowledge the valuable assistance and involvement of Dr. Jenny Krahn,
Haskayne School of Business, University of Calgary; Bill Holmes, PL (Eng), Electrical
Specialist at Calgary Operations, WorleyParsons Canada; David Clarke, VP Engineering at
Calgary Operations, WorleyParsons Canada; Esam Wshah, Vice President of SLC Petroleum
Inc., Alberta; Claudia Villeneuve, Project Manager, Enbridge Main System Projects, LP; Gisela
Engels and Tak Fung, statistics research group, University of Calgary, Alberta.
My sincerest appreciation goes to the following associations and groups who participated in the
research questionnaires: Association of Professional Engineers and Geoscientists of Alberta
(APEGA), Project Management Focus Group (PMFG), Consulting Engineering for Alberta
(CEA), Consulting Architects of Alberta (CAA), and the Alberta Construction Association
(ACA). Furthermore, I would like to express my appreciation to the study participants for
completing the surveys. Also, I would like to thank my best friends, Maha Abu-mazer and Dina
Said. Lastly, I would like to thank the Committee members for reading my thesis and for their
useful feedback.

v
Dedication
This thesis is dedicated to my father and mother for their unconditional love and incredible
support, to my helpful husband (Hussam), to my beautiful sisters (Lubna and Doa’a) and
brothers (Esam, Basheer, Alaa, and Hussien), to my sisters-in-law (Sheeren, Lubna, and Zainab)
and my brothers-in-law (Tamir and Mansour), and to the lovely children in my life (Sheera,
Celeina, Jumanah, Malak, Rama, Tala, Razan, Ahmad, Awse, Ayed, Yoseph, Esam, Own, and
Nasiraldin). I could not have accomplished this dissertation without their patience, support, and
immense love.
My thesis is also dedicated to the two lovely babies who will be born to me in July.

vi
Table of Contents
Abstract ............................................................................................................................... ii Table of Contents ............................................................................................................... vi
List of Tables ..................................................................................................................... ix List of Figures and Illustrations ....................................................................................... xiii List of Symbols, Abbreviations and Nomenclature ...........................................................xv
CHAPTER ONE: INTRODUCTION ..................................................................................1 1.1 Chapter Overview ......................................................................................................1
1.2 Background ................................................................................................................1 1.3 Research Questions and Problem Statement .............................................................7 1.4 Research Objectives ...................................................................................................8
1.5 Scope of the Work and Limitations ...........................................................................9 1.6 Research Methodology ............................................................................................10 1.7 Research Prepositions and Hypotheses ....................................................................13
1.8 Structure of the Thesis .............................................................................................14
CHAPTER TWO: LITERATURE REVIEW ....................................................................17
2.1 Chapter Overview ....................................................................................................17 2.2 Definition of Interfaces ............................................................................................18 2.3 Categorization of Interfaces .....................................................................................21
2.4 Definition and Analysis of Interface Management ..................................................27 2.5 Approaches to Exploring Interface Management Problems and Issues ..................32
2.6 Project Performance Measurement ..........................................................................35
2.7 Areas for Improving Interface Management ...........................................................40
2.8 Typical Lifecycle Project (Phases) ..........................................................................43 2.8.1 Commercial and building projects ...................................................................43
2.9 Project Delivery Methods (Systems) .......................................................................45 2.10 Summary (Identified Gaps/Room for Improvement) and Connection with the Next
Chapters .................................................................................................................46
CHAPTER THREE: RESEARCH METHODOLOGY ....................................................49 3.1 Chapter Overview ....................................................................................................49 3.2 Research Design and Approach ...............................................................................49
3.2.1 The first phase. ................................................................................................54
3.2.2 The second phase. ............................................................................................55
3.2.3 The third phase. ...............................................................................................56
3.2.3.1 Developing conceptual framework and use case models. .....................56 3.2.3.2 Defining areas for improving IM. ..........................................................56
3.3 Data Collection ........................................................................................................57 3.3.1 Pilot studies and face-to-face interviews. ........................................................58 3.3.2 Empirical surveys and data collection. ............................................................58
3.3.3 In-depth interviews. .........................................................................................61 3.4 Data Analysis ...........................................................................................................61
3.4.1 Qualitative data analysis. .................................................................................61
3.4.2 Quantitative data analysis. ...............................................................................62

vii
3.5 Research Reliability and Validity ............................................................................64 3.6 Summary and Connection with the Next Chapters ..................................................66
CHAPTER FOUR: FACTOR ANALYSIS AND MULTIPLE REGRESSION ANALYSIS
OF INTERFACE MANAGEMENT THROUGHOUT THE PROJECT LIFECYCLE
...................................................................................................................................67 4.1 Chapter Overview ....................................................................................................67 4.2 Analysis of Survey Results and Discussion of Findings .........................................67
4.2.1 Respondents’ profiles. .....................................................................................67 4.2.2 Pearson product-moment correlation. .............................................................69
4.2.3 Factors influencing interface management. .....................................................70 4.2.3.1 Correlation between emergent factors. ..................................................77
4.2.4 Analysis of the variance (MANOVA) between IM factor and different data. 78
4.2.4.1 Normality. ..............................................................................................78 4.2.4.2 Research hypothesis between IM factors and different construction data.79
4.2.5 Top 10 interface problems that affect IM. .......................................................89
4.2.6 Multiple regression models. ..........................................................................102 4.2.7 Reliability. .....................................................................................................106
4.3 Conclusions ............................................................................................................107 4.4 Summary and Connection with the Next Chapters ................................................109
CHAPTER FIVE: FACTOR ANALYSIS AND MULTIPLE REGRESSION ANALYSIS OF
INTERFACE MANAGEMENT DURING ENGINEERING/DESIGN PHASE...110 5.1 Chapter Overview ..................................................................................................110
5.2 Analysis of Survey Results and Discussion of Findings .......................................110
5.2.1 Respondent’s profile. .....................................................................................110
5.2.2 Pearson product-moment correlation. ...........................................................113 5.2.3 Factor influencing interface management. ....................................................113
5.2.3.1 Correlation between emergent factors. ................................................116 5.2.4 Analysis of the variance (MANOVA) between IM factor and different data.116
5.2.4.1 Normality. ............................................................................................116
5.2.4.2 Research hypothesis between IM factors and different construction data.116 5.2.5 Top 10 interface problems that affect IM. .....................................................127
5.2.6 Multiple regression models. ..........................................................................135 5.2.7 Reliability. .....................................................................................................138
5.3 Conclusions ............................................................................................................138 5.4 Summary and Connection with the Next Chapters ................................................140
CHAPTER SIX: PROPOSED INTERFACE MANAGEMENT FRAMEWORK APPLYING
RIBA STRUCTURE AND USE CASE MODELS THROUGHOUT PROJECT
PHASES ..................................................................................................................141 6.1 Chapter Overview ..................................................................................................141 6.2 Relationships among Owner, Contractor, and Designer ........................................143
6.2.1 Project lifecycle phases in commercial and building projects. ......................144 6.2.2 Use case model. .............................................................................................155
6.3 Summary and Connection with the Next Chapter .................................................168

viii
CHAPTER SEVEN: RESEARCH CONCLUSIONS AND RECOMMENDATIONS ..169 7.1 Chapter Overview ..................................................................................................169 7.2 Conclusion .............................................................................................................169 7.3 Research Contributions ..........................................................................................172
7.4 Benefits of the Research ........................................................................................173 7.5 Recommendations for Future Research .................................................................174
REFERENCES ................................................................................................................176
APPENDIX I: ETHICS APPROVAL .............................................................................184
APPENDIX II: LIST OF THE COLLECTED IM PROBLEMS BASED ON LITERATURE
REVIEW .................................................................................................................185
APPENDIX III: SURVEY INSTRUMENT ONE (THROUGHOUT PROJECT
LIFECYCLE) ..........................................................................................................189
APPENDIX IV: SURVEY INSTRUMENT TWO DURING THE ENGINEERING DESIGN
PHASE ....................................................................................................................197
APPENDIX V: DETERMINING SAMPLE SIZE ..........................................................202
APPENDIX VI: RESULTS OF THE PEARSON PRODUCT-MOMENT CORRELATION:
PROJECT LIFECYCLE .........................................................................................203
APPENDIX VII: MULTIPLE-REGRESSION RESULTS FOR SIX PROJECT
PERFORMANCE INDICATORS: PROJECT LIFECYCLE ................................205
APPENDIX VIII: RESULTS OF THE PEARSON PRODUCT-MOMENT
CORRELATION: ENGINEERING DESIGN PHASE ..........................................209
APPENDIX IX: MULTIPLE-REGRESSION RESULTS FOR SIX PROJECT
PERFORMANCE INDICATORS: ENGINEERING/DESIGN PHASE ...............210

ix
List of Tables
Table 2.1 List of the Interface Problems Categorization .............................................................. 22
Table 2.2 List of the Collected IM Problems Based on Literature Review .................................. 25
Table 2.3 The Common Used Project Performance Indicators by Previous Studies .................... 38
Table 2.4 List of the Areas for Improving the IM Based on Literature Review .......................... 41
Table 2.5 Typical Life Cycle from the Royal Institute of British Architects (RIBA, 2007) ........ 44
Table 3.1 List of the Collected IM Problems Based on Literature Review and Pilot Study
(Project lifecycle and engineering design phase) (Unranked) .............................................. 53
Table 3.2 Survey Sample Question throughout Project Lifecycle and during the
Engineering/Design Phase .................................................................................................... 54
Table 3.3 Examples of the Areas for Improving IM ...................................................................... 57
Table 3.4 Illustrates the Research Questions, Research Objectives, Potential Methodologies
and Methods throughout Project Lifecycle and the Engineering/Design Phase ................... 63
Table 4.1 Respondents’ Job Profiles ............................................................................................. 68
Table 4.2 Respondents’ “Company” Types .................................................................................. 68
Table 4.3 Respondents’ “Industry” Types .................................................................................... 68
Table 4.4 Respondents’ “Years of Experience” Types ................................................................. 69
Table 4.5 Respondents’ “Level of Education” Types ................................................................... 69
Table 4.6 Summary of Factor Analysis (Management Factor) ..................................................... 72
Table 4.7 Summary of Factor Analysis (Information Factor) ...................................................... 73
Table 4.8 Summary of Factor Analysis (Bidding and Contracting) ............................................. 74
Table 4.9 Summary of Factor Analysis (Technical and Site Issues) ............................................ 76
Table 4.10 Summary of Factor Analysis (Law and Regulations) ................................................. 77
Table 4.11 Summary of Factor Analysis (Other Interface Problems Factor) ............................... 77
Table 4.12 Correlation Coefficients between Six Extracted Factors ............................................ 78
Table 4.13 Calculated Means (Title Type Groups and Extracted IM Factors) ............................. 81

x
Table 4.14 MANOVA Results (Title Type Groups and Extracted IM Factors) ........................... 82
Table 4.15 Calculated Means (Company Type Groups and Extracted IM Factors) ..................... 84
Table 4.16 MANOVA Results (Company Type Groups and Extracted IM Factors) ................... 84
Table 4.17 Calculated Means (Industry Type Groups and Extracted IM Factors) ....................... 86
Table 4.18 MANOVA Results Table (Industry Type Groups and Extracted IM Factors) ........... 86
Table 4.19 Calculated Means (Years of Experience Groups and Extracted IM Factors) ............. 87
Table 4.20 MANOVA Results (Years of Experience Groups and Extracted IM Factors) ........... 88
Table 4.21 Example of Ranking Process of IM Problems Based on Five Company Types......... 91
Table 4.22 A Summary of the Rating Average of the Highest IM Problems for each
Company Type ...................................................................................................................... 93
Table 4.23 A Summary of the Rating Average of the Highest IM Problems/Industry Type ....... 96
Table 4.24 A Summary of the Rating Average of the Highest IM Problems for each Job Title .. 99
Table 4.25 A Summary of the Rating Average of the Highest IM Problems for each Year of
Experience ........................................................................................................................... 101
Table 4.26 Standard Deviation of Responses for Overall Project Performance ......................... 103
Table 4.27 Reliability Test of Interface Problem Factor ............................................................ 107
Table 4.28 Reliability Test of Project Performance Indicators ................................................... 107
Table 5.1 Respondents’ Job Profiles ........................................................................................... 111
Table 5.2 Respondents’ Company Types ................................................................................... 111
Table 5.3 Respondents’ Industry Types ...................................................................................... 112
Table 5.4 Respondents’ Years of Experience Types .................................................................. 112
Table 5.5 Respondents’ Level of Education Types .................................................................... 112
Table 5.6 Respondents’ Level of Complexity Types .................................................................. 112
Table 5.7 Summary of Factor Analysis (Management Factor) ................................................... 114
Table 5.8 Summary of Factor Analysis (Information Factor) .................................................... 115
Table 5.9 Summary of Factor Analysis (Law and Regulation Factor) ....................................... 115

xi
Table 5.10 Summary of Factor Analysis (Others Factor) ........................................................... 115
Table 5.11 Correlation Coefficients between Four Extracted Factors ........................................ 116
Table 5.12 Calculated Means (Title Type Groups and Extracted IM Factors) ........................... 119
Table 5.13 MANOVA Results (Title Type Groups and Extracted IM Factors) ......................... 119
Table 5.14 Calculated Means (Company Type Groups and Extracted IM Factors) ................... 121
Table 5.15 MANOVA Results Table (Company Type Groups and Extracted IM Factors) ....... 121
Table 5.16 Calculated Means (Industry Type Groups and Extracted IM Factors) ..................... 123
Table 5.17 MANOVA Results Table (Industry Type Groups and Extracted IM Factors) ......... 123
Table 5.18 Calculated Means (Years of Experience Groups and Extracted IM Factors) ........... 125
Table 5.19 MANOVA Results Table (Years of Experience Groups and IM Factors) ............... 125
Table 5.20 Calculated Means (Level of Complexity Groups and Extracted IM Factors) .......... 126
Table 5.21 MANOVA Results Table (Level of Complexity Groups and IM Factors) .............. 127
Table 5.22 A Summary of the Rating Average of the Highest IM Problems for each
Company Type .................................................................................................................... 128
Table 5.23 A Summary of the Rating Average of the Highest IM Problems for each Industry
Type .................................................................................................................................... 130
Table 5.24 A Summary of the Rating Average of the Highest IM Problems for each Job Title 132
Table 5.25 A Summary of the Rating Average of the Highest IM Problems for each Years of
Experience Group ............................................................................................................... 134
Table 5.26 A Summary of the Rating Average of the Highest IM Problems for each Project
Complexity Level ................................................................................................................ 135
Table 5.27 Multiple-Regression Results for Overall Project Performance ................................ 137
Table 5.28 Reliability Test of Interface Problem Factor ............................................................ 138
Table 5.29 Reliability test of project performance indicators..................................................... 138
Table 6.1 Royal Institute of British Architects Work Stages during the Design Phase .............. 157
Table 6.2 Hard Areas for Improving IM for each project player based on Literature Review
and Distributed Questionnaires ........................................................................................... 161

xii
Table 6.3 Soft Areas for Improving IM for each project player based on Literature Review
and Distributed Questionnaires ........................................................................................... 164
Table 7.1 Comparison between the First and the Second Survey Results .................................. 171

xiii
List of Figures and Illustrations
Figure 1.1 General Concept of Interface Management ................................................................... 1
Figure 1.2 Structure of the Thesis ................................................................................................. 16
Figure 2.1 Six Categories from Prior Research ............................................................................ 17
Figure 2.2: Vertical and Horizontal Ties in a General Contractor Concept, source Asbjorn
Rolstadas et al. (2011) , with permission from the publisher. .............................................. 20
Figure 2.3 Execution of Construction Interface, source R. Huang et al. (2008), with
permission from the authors .................................................................................................. 31
Figure 2.4 C&E Diagram Method, source Chen et al. (2008), with permission from ASCE. ..... 33
Figure 2.5 Research Method of C&E Diagram, source Chen et al. (2008), with permission
from ASCE. Notice: “This material may be downloaded for personal use only. Any
other use requires prior permission of the American Society of Civil Engineers”. .............. 34
Figure 3.1 Overall Research Methodology ................................................................................... 52
Figure 3.2 Conceptual Research Framework for Modeling the Impact of IM on Construction
Project Performance (Project Lifecycle Phase and the Engineering/Design Phase .............. 53
Figure 4.1 Scree Plot of 47 Interface Problems ............................................................................ 71
Figure 5.1 Scree Plot of 22 Interface Problems .......................................................................... 114
Figure 6.1 Overall Structure for this Chapter ............................................................................. 143
Figure 6.2 Six Factors or Areas Affecting IM throughout Project Lifecycle ............................. 144
Figure 6.3 Project Lifecycle General Phases (RIBA, 2007) ....................................................... 145
Figure 6.4 Project Lifecycle General Phases and Deliverables (Project Management Institute,
2004) ................................................................................................................................... 146
Figure 6.5 A Conceptual Framework of Phase One (Preparation) Including IM Interface
Areas ................................................................................................................................... 148
Figure 6.6 A Conceptual Framework of Phase Two (Design) Including IM Interface Areas .... 150
Figure 6.7 A Conceptual Framework of Phase Three (Pre-construction) Including IM
Interface Areas .................................................................................................................... 151
Figure 6.8 A Conceptual Framework of Phase Four (Construction) Including IM Interface
Areas ................................................................................................................................... 153

xiv
Figure 6.9 A Conceptual Framework of Phase Five (Use) Including IM Interface Areas ......... 154
Figure 6.10 UML Use Case Model of the Current Relationships among Owner, Designer, and
Contractor (adapted from The American Institute of Architects and The Associated
General Contractors of America (2011)) ............................................................................ 158
Figure 6.11 UML Use Case Model Packages of the Current Relationships among Owner,
Designer, and Contractor within different Project Phases .................................................. 159
Figure 6.12 Proposed Use Case Model Package for Owner’s Responsibilities and Actions ..... 165
Figure 6.13 Proposed Use Case Model Package for Design Team’s Responsibilities and
Actions ................................................................................................................................ 166
Figure 6.14 UML Proposed Use Case Model Package for Contractor’s Responsibilities and
Actions ................................................................................................................................ 167

xv
List of Symbols, Abbreviations and Nomenclature
ACA Alberta Construction Association
APEGA Association of Professional Engineers and Geoscientists of Alberta
CAA Consulting Architects of Alberta
CBS Cost Breakdown Structure
CDT Corporación de Desarrollo Tecnológico
CEA Consulting Engineering for Alberta
C&E Cause and Effect
CII Construction Industry Institute
CWBS Contracting Work Breakdown Structure
, EPC Engineering, Procurement and Construction
EPCM Engineering, Procurement, and Construction Management
ES Effect Size
FEL Front End Loading
GDP Gross Domestic Product
IM Interface Management
IPM International Project Management
IT Information Technology
KPI Key Performance Indicators
LWCIR Lost Workday Case Incident Rate
MANOVA Multivariate Analysis of the Variance
MRTS Mass Rapid Transit System
NN Neural Networks
OBS Organization Breakdown Structure
PDS Project Delivery Methods (Systems)
PPMC Pearson Product-Moment Correlation
PMI Project Management Institute
PM Project Management
PMFG Project Management Focus Group
PPC Percentage of Plan Completed
RIR Recordable Incident Rate
UML Unified Modeling Language
WBS Work Breakdown Structure

1
Chapter One: Introduction
1.1 Chapter Overview
This chapter provides an opening overview of this thesis. This includes a background on the
research questions, the problem statement, and a general idea about interface management (IM).
Moreover, this chapter lists the objectives, the scope of the work, the research methodology, and
the arrangement of dissertation chapters. Parts of the materials in this chapter and in this thesis
were included in Weshah, El-Ghandour, Cowe Falls, & Jergeas (2012a, 2012b, 2014a, 2014b,
2014c, 2014d) and Weshah, El-Ghandour, Jergeas, & Cowe Falls (2013a, 2013b).
1.2 Background
Interface management is a major factor in the success of construction projects (Chan, Chen,
Messner, & Chua, 2005; Chua & Godinot, 2006; Collins et al., 2008; Morris, 1983; Nooteboom,
2004; Pavitt & Gibb, 2003; Shokri et al., 2012). Although there is no agreement among previous
research about the definition of IM, many discuss the boundary conditions among physical
elements, tools, equipment, phases, systems, people, organizations, processes, and others
(Godinot, 2003; Wideman, 2002; Wren, 1967). Figure 1.1 illustrates the general concept of
interface management, where A, B, and C could be any one of three elements: phases, tools,
projects’ groups, organizations, etc.
Figure 1.1 General Concept of Interface Management
Conflict Area because
of the Interfaces
B C
A

2
The Project Management Institute (PMI) defined IM as “the management of communication,
coordination and responsibility across a common boundary between two organizations, phases,
or physical entities which are interdependent” (Project Management Institute, 2003). Basically,
“IM is the “glue” that holds a project together” (Crumrine, Nelson, Cordeiro, Loudermilk, &
Malbrel, 2005).
There are many reasons supporting the necessity for a comprehensive research study to enhance
IM among different participants involved in construction projects. For the last two to three
decades there has been less than necessary awareness of the essentials of IM and the severity of
interface problems, and this has negatively affected project performance. Failure to manage
interfaces impacts project scope control, quality, schedule, safety, and resources (Crumrine et al.,
2005; Mortaheb & Rahimi, 2010; Pavitt & Gibb, 2003). For example, C. Huang (2007)
concluded that the interface issues during the construction phase in the Tamsui Line MRT
construction project in Taiwan/the Republic of China were accountable for approximately 18%
of the total project delays. Shokri et al. (2012) mentioned that “poor management of interfaces
may result in deficiencies in the project cost, time, and quality during the project life cycle
execution, or may result in failures after the project has been delivered”.
Chen, Reichard, and Beliveau (2008) said that interface issues are “leading to low productivity,
poor quality, waste, delays, claims, and cost overruns”. Additionally, Sundgren (1999)
mentioned that failure to properly manage interfaces during the construction phase can waste
time and make revisions necessary, which increase the costs of projects. Nooteboom (2004), the
Vice President of Offshore Field Development with INTEC Engineering, said that in
megaprojects there are usually more than 75,000 task-connected interfaces. In addition, IM
accounts for approximately 20% of the total project cost (note: those numbers are purely

3
anecdotal). As well, the confusion related to interface problems among different project
participants involved in the construction process is considered one of the greatest risk factors that
contribute to cost and schedule uncertainty (Ku, Lin, Huang, & Shiu, 2010).
Interface management failures occurred frequently in the past, but captured the world’s attention
when the Three Mile Island nuclear accident happened in 1979. The investigation of this event
found that the lack of communication among key people involved in the project led to the
making of incorrect assumptions, which finally caused the disaster (Crumrine et al., 2005). It was
also found that IM failure was the main cause of the Piper Alpha, Exxon Valdez, and Phillips
Pasadena accidents (Crumrine et al., 2005).
In Canada the construction industry is very important and, in particular, makes an important
contribution to Western Canada’s economy (Statistics Canada, 2013). In 2013, according to
statistics for Alberta construction projects, $35.51 billion (10.7% of Alberta’s gross domestic
product (GDP)) was spent on construction projects (Alberta’s Economic Development, 2013).
Alberta construction projects involve many parties, such as engineering, architecture, design,
procurement, fabrication, construction, commissioning, and small contractors. This complexity
creates overlapping relationships that have plenty of interface problems among them; some
examples are ineffective communication, lack of trust, hidden agendas, and poor coordination.
These kinds of interface problems lead to time overruns, low productivity, quality impacts, cost
overruns, disputes, arbitration, litigation, termination, claims, and waste (Chen et al., 2008;
Morris, 1983; Mortaheb & Rahimi, 2010). Consequently, through the appropriate application of
effective management and communication and coordination techniques among different project
participants involved in the construction projects, these interface problems have to be cautiously,
immediately, and effectively resolved.

4
Some studies of different types of construction projects outline the interface problems between
two parties, such as between contractors and owners (Al-Hammad, 1990), designers and
contractors (Al-Hammad & Assaf, 1992), contractors and subcontractors (Al-Hammad, 1993;
Hinze & Tracey, 1994), maintenance contractors and owners (Al-Hammad, 1995), and owners
and designers (Al-Hammad & Al-Hammad, 1996). In addition, a few studies have identified the
interfaces among all project participants involved within the construction projects. One such
study was conducted by Al-Hammad (2000) on the common interface problems among various
construction participants. Moreover, new studies identified the same IM problems that Al-
Hammad had identified and added more new IM problems (Chen et al., 2008; R. Huang, Huang,
Lin, & Ku, 2008; Ku et al., 2010; Mortaheb & Rahimi, 2010).
In addition, some studies have identified the factors that lead to IM conflicts in construction
projects by applying statistical tools; an example is the construction projects of a mass rapid
transit system (MRTS) (R. Huang et al., 2008; Ku et al., 2010). Therefore, it is necessary to
measure the impact of IM on project performance indicators.
Many researchers emphasized that project performance, in terms of quality, scope, time,
schedule, and safety, will be improved by implementing IM at the early stages of the project
(Caglar & Connolly, 2007; Chen, Reichard, & Beliveau, 2007; Shokri et al., 2012).
Although many researchers have discussed and reported different methods for project
performance measurement, insufficient project performance measurement is one of the major
problems affecting the construction industry (Costa, Formoso, Kagioglou, & Alarcon, 2004a;
Costa, Lima, & Formoso, 2004b). Traditionally, in construction projects performance
measurement is based on quality, time, and cost, which are defined as the iron-triangle (Belassi
& Tukel, 1996; Walker, 1995). In the last two to three decades performance indicators have

5
changed and many new aspects of project performance have been included. These indicators are
used primarily for benchmarking purposes and have been used for controlling the performance
during the project lifecycle (Haponava & Al-Jibouri, 2009).
For instance, in 1992 performance measures were developed to measure project success among
owners, designers, and contractors, and all were in agreement that successful projects need to
meet the budget and the schedule, must have no legal claims, and need to meet the profit goals
(Sanvido, Grobler, Parfitt, & Coyle, 1992). Weston & Gibson (1993) measured many project
performance indicators in terms of value engineering savings, change-order cost, cost growth,
schedule growth, and claims costs. Performance measurements have been established for
benchmarking in different countries, namely the USA (Construction Industry Institute [CII],
2000), Chile (Corporación de Desarrollo Tecnológico [CDT], 2002), the UK (Key Performance
Indicators Working Group [KPI], 2003), and Brazil (Costa et al., 2004b).
In Alberta’s construction industry, there are insufficient studies for identification and
enhancement of interface problems in construction projects. Using Alberta data collected by
means of web questionnaires from a large group of experienced industry experts, this study
covers different company types in the construction sector, including owner; engineering,
procurement, and construction (EPC); engineering, procurement, and construction management
(EPCM); construction contractor/sub-contractor; engineering consultant; architecture firms;
architecture and engineering firms; and construction management companies, in order to have a
strong understanding of the main interface problems causing interface conflicts and affecting IM
in these companies. In addition, the study included different industry types, such as
infrastructure, oil and gas, transportation, commercial and buildings, and manufacturing, as well
as many job titles within these sectors.

6
Nowadays, with the increased complexity of projects, it is important to have a clear
understanding of interface problems and of IM and to enhance the interfaces between different
project participants to increase their performance in effectiveness and efficiency for large
projects.
The objectives of this study are twofold: (a) enhancing the IM among different project
participants involved in the construction projects and (b) increasing the effectiveness of IM
throughout the project lifecycle, focusing specifically on the engineering/design phase. This
research study has been approved by the Conjoint Faculties Ethics Board of the University of
Calgary (No. 7281) as shown in Appendix I. The focus of this study is to (a) enhance the IM in
construction by identifying the main interface problems and/or factors causing interface conflicts
and affecting IM using Alberta as a case study; (b) investigate the relationships among IM
factors and company types, industry types, and respondent’s title/position and years of
experience; (c) identify problems considered critical to IM; (d) enhance project performance by
developing and applying multiple-regression analysis models among the identified interface
problem factors and the project performance indicators (these models can be used to evaluate and
predict project performance based on IM); and (e) develop conceptual framework (RIBA
framework) and use case models to study the IM relationships among owner, designer, and
construction contractor in order to identify the main responsibilities for each one, highlight the
IM areas consider critical, and consequently provide suggestions for improving and enhancing
IM that are adequate to all project participants engaged in different construction projects. To
avoid conflicts and omissions, at the beginning of the project the responsibilities and interfaces
among owner, designer, and construction contractors must be carefully defined.

7
The results of this study may help owners, construction contractors, engineers, architects, and
others within the construction industry to study and inspect the interfaces and the project
performance during the early stages of the project. This could influence project performance
positively by minimizing project delay and cost overruns and reducing conflict among different
project members engaged in the construction project.
1.3 Research Questions and Problem Statement
Many people are involved in construction projects, including engineers, architects, designers,
procurement staff, construction workers, and those in charge of commissioning. This creates
complex relationships that can lead to many interface problems (Al-Hammad & Al-Hammad,
1996; Al-Hammad & Assaf, 1992; Al-Hammad, 1990, 1993, 1995, 2000; Chen et al., 2008; R.
Huang et al., 2008; Ku et al., 2010; Mortaheb & Rahimi, 2010). Interface problems can cause
cost and time overruns, impact quality, and lead to contract termination, claims, arbitration, and
legal actions (Chen et al., 2008; Morris, 1983; Mortaheb & Rahimi, 2010). Therefore, it is
important to identify the IM problems and measure the impact of IM on project performance.
However, few studies in the literature have specifically addressed the IM problems and their
impact on project performance.
Through the use of Alberta data collected from a large group of experienced industry experts
using two web questionnaires, this research study intends to address the following research
question: how does one enhance the IM among different participants involved in construction
projects and increase the effectiveness of IM throughout the project lifecycle, specifically during
the engineering/design phase? This research question can be broken down into six sub-questions
that examine IM throughout the project lifecycle, focusing specifically on the engineering/design
phase:

8
1. What are the main interface problems and/or factors causing interface conflicts that affect IM
of Alberta’s construction projects throughout project lifecycle phases and in particular during
the engineering/design phase?
2. What are the relationships between IM factors and company types, industry types, and
respondent’s title/position and years of experience, in particular during the engineering/design
phase?
3. What are the top 10 IM problems affecting IM throughout project lifecycle phases, in
particular during the engineering/design phase?
4. What are the relationships between IM factors (the underlying interface problem factors) and
project performance indicators of construction projects throughout project lifecycle phases, in
particular during the engineering/design phase?
5. Could we study the IM relationships among owner, designer, and construction contractor in
commercial and buildings projects throughout project lifecycle phases and recommend
solutions for management?
6. What are the procedures or areas for improving IM that are acceptable to all project
participants engaged in construction projects throughout project lifecycle phases?
1.4 Research Objectives
The objectives of this study are twofold: enhancing the IM among different project participants
involved in the construction projects and increasing the effectiveness of IM throughout the
project lifecycle, focusing specifically on the engineering/design phase. This objective was
accomplished through the following set of main tasks:

9
1. Investigate, identify, and classify the main IM factors that considerably impact IM and cause
interface conflicts among the participating parties in construction projects throughout the
project lifecycle phases and in particular during the engineering/design phase.
2. Investigate relationships among IM factors and company types, industry types, and
respondent’s title/position and years of experience throughout the project lifecycle phases and
in particular during the engineering/design phase.
3. Identify problems considered critical to IM throughout the project lifecycle phases and in
particular during the engineering/design phase.
4. Investigate the relationships between extracted IM factors and the project performance
indicators quality management, schedule management, cost management, scope management,
safety management, and teamwork throughout the project lifecycle phases and in particular
during the engineering/design phase.
5. Develop a conceptual framework (RIBA framework) and use case models to study the
interface management relationships among owner, designer, and construction contractor
throughout the project lifecycle phases.
6. Provide suggestions for improving and enhancing IM that are adequate to all project
participants engaged in different construction projects.
1.5 Scope of the Work and Limitations
The focus of this study is to enhance IM in construction by identifying the main interface
problems and/or factors causing interface conflicts and affecting IM using Alberta as a case
study. Research limitations are mostly related to methodological issues, which in turn are

10
associated with the constraints of applying qualitative and quantitative techniques. Consequently,
the following limitations should be taken into consideration:
1. The companies’ project profiles and availability of the data are considered some of the main
complexities in the research process. Mainly, in construction projects, companies keep project
data confidential because of the competitive nature of the work and other political matters.
2. As with any study using interview and questionnaire surveys, the data collection may be
influenced by different factors. Those could be insufficient resources, time limitations,
respondents’ biases, and transparency.
3. This research study used statistical methods to analyze the collected data. Therefore, research
findings are essentially vulnerable to the statistical limitations of the selected data analysis
methods. However, the application of qualitative techniques may moderate the vulnerability
of the results.
4. This study does not take into consideration the impact of different construction project sizes
on IM.
5. The data are from Alberta only. Also, there are limitations for different types of construction
sectors, such as transportation and manufacturing.
1.6 Research Methodology
This research study used both qualitative and quantitative statistical approaches (mixed methods)
to examine, identify, and categorize interface problems in the construction projects of Alberta. A
comprehensive literature review of journals papers, previous relevant studies, and conference
proceedings was conducted. This was followed by industry pilot studies. This research study
used structured methods (structured face-to-face interviews and web-page questionnaire), which
is considered to be a good method to ensure understanding of the participants’ points of view,

11
ideas, opinions, etc. In structured interviews “all respondents are asked the same questions with
the same wording and in the same sequence” (Kajornboon, 2005). On the other hand, the web-
page questionnaire method is used to answer the research questions and prove the hypothesis by
asking the participants to answer a set of specific questions.
This study uses two web-page questionnaires to collect data from a large group of experienced
industry experts in Alberta. Jick (1979) concluded that in research, survey technique is a chosen
method to quantify observations because it provides greater confidence in the generalizability of
the result findings. Different members of various associations and groups participated in this
questionnaire, including the Project Management Focus Group (PMFG), Consulting Engineering
for Alberta (CEA), Consulting Architects of Alberta (CAA), and the Alberta Construction
Association (ACA). These members include project controllers, procurement staff, project
engineers, engineers, architects, quality engineers, owners, general contractors, construction
managers, subcontractors, safety leaders, construction managers, and planners. In addition,
different industry sectors in the areas of commercial and buildings, infrastructure, oil and gas,
and transportation participated in this study with a large sample of responses received from the
oil and gas sector and the commercial and buildings sector.
Moreover, various companies types were involved in the data collection stage, such as owner,
architecture, architecture and engineering, engineering procurement and construction,
engineering procurement and construction management, engineering consultant, and construction
management.
Statistical techniques, such as factor analysis, cross-tabulated analysis, and multiple regressions
were used to analyze the data. This research project started with study of the interfaces

12
throughout project lifecycle phases and then narrowed them down to study interfaces during the
engineering/design phase.
This study consists of the following steps: (1) a comprehensive literature review, (2) pilot
studies, and (3) face-to-face interviews (structured interviews) (at this stage, data were gathered
from all parties engaged in various types of construction projects in Alberta), (4) distribution of
self-completion questionnaires (web-page questionnaires) to participants from industry and to
members of different associations in Alberta, (5) identifying, studying, and categorizing of
interface problem factors using factor analysis and Pearson’s correlation matrix, (6) testing the
correlation between IM factors and different construction data using the Multivariate Analysis of
the Variance (MANOVA) analysis technique, (7) identifying the top 10 interface problems
affecting IM performances through cross-tabulated analysis using SPSS software followed by the
ranking process method, (8) developing and applying multiple-regression analysis models
between the underlying interface problem factors and the project performance indicators,
(9) developing conceptual framework (RIBA framework) and use case models to study the IM
relationships among owner, contractor, and designer using the Unified Modeling Language
(UML) use case diagrams, (10) identifying areas for improving IM, and (11) conducting in-depth
interviews after questionnaires are completed to validate the final research findings.
In general, this methodology is applicable to other locations (other provinces in Canada) if the
major industries and types of projects in each province are taken into consideration. In addition,
this methodology can be applicable to other industrial sectors by conducting a dispersed study
for each type of project.

13
1.7 Research Prepositions and Hypotheses
The following research hypotheses have been established in this study to answer the research
questions using Alberta’s data:
1. Is there a correlation among all of the interface problems?
2. Is there a correlation between the identified IM factors (the underlying interface problem
factors) contributing to interface conflicts in Alberta’s construction projects and project
performance indicators (quality management, schedule management, cost management, scope
management, safety, and teamwork)?
Based on the research questions and the above research hypotheses, 10 null hypotheses were
tested throughout project lifecycle phases and in particular during the design phase. These
hypotheses were examined in this research study by using different statistical techniques,
including a factor analysis tool and multiple regression models. These hypotheses are the
following.
Hypotheses 1, 2, 3, and 4: there would be no significant difference in the means between the
impact of the IM extracted factors (dependent variables) and
Respondents’ title groups as independent variables
Company types as independent variables
Industry types as independent variables
Total years of experience groups as independent variables
Hypotheses 5, 6,7,8,9, and 10: there would be no significant relationships between the extracted
factors and the project performance indicators:
Quality
Schedule
Cost
Scope

14
Safety
Teamwork
1.8 Structure of the Thesis
This thesis is a manuscript-based thesis, as shown in Figure 1.2. This section describes the
outline of the thesis structure as follows:
Chapter 1: Introduction. This chapter gives an overview of the topic and areas of the research.
Chapter 2: Literature Review. This chapter highlights the related outcomes of the general
literature review. Moreover, this chapter reviews the gaps in the previous studies.
Chapter 3: Research Methodology. This chapter describes the research methodology and
reviews the different research approaches (qualitative and quantitative). The approach chosen by
the researcher was also discussed.
Chapter 4: Survey Number One. This chapter highlights the findings from the first survey that
was conducted throughout project life-cycle phases. This chapter provides analysis of the survey
results and discussion of the findings and conclusions. The material in this chapter was published
as peer-reviewed journal articles (Weshah et al., 2014c, 2013b).
Chapter 5: Survey Number Two. This chapter highlights the findings from the second survey
that was conducted during the engineering/design phase. This chapter provides analysis of the
survey results and discussion of the findings and conclusions. The material in this chapter was
submitted for publication.
Chapter 6: Relationships among Owner, Contractor, and Designer. This chapter provides a
development of the conceptual framework (RIBA framework) and use case models for studying
the IM relationships among owner, contractor, and designer (architect and engineer). The
material in this chapter will be submitted for publication.

15
Chapter 7: Research Conclusions and Recommendations. This chapter integrates the findings
of the individual chapters. It concludes the contributions of this research to the body of
knowledge. As well, areas for future research are recommended.

16
- Literature Review
- Pilot Study & Face-to-Face
Interviews
- Questionnaires
- In-depth Interviews
Research Steps
OBJ4, Q4: Multiple Regressions
(H5,H6,H7,H8,H9,H10)
Thesis Writing Conference & Journal
Papers
CH.1,2,& 3
Conf. Paper 1
(Weshah et al., 2012a)
CH.4 & 5
OBJ5, Q5: IM Relationships among
Owner, Construction Contractor &
Design team.
OBJ6,Q6: Areas for improving IM.
CH.6
OBJ1, Q1: Factor Analysis
OBJ2, Q2: Relationships between IM
Factor & Construction Data
(H1, H2, H3, H4)
OBJ3, Q3: Top Ten Interface Problem
Conf. Paper 2
(Weshah et al., 2013a)
Journal Paper 1
(Weshah et al., 2013b)
Journal Paper 2
(Weshah et al., 2014c)
Journal Paper 3
(Weshah et al., 2014d)
CH.7Conclusions and
Potential Future Conclusion
Conf. Paper 3
(Weshah et al., 2014a)
Data Collection
Q: Question, OBJ: Objective, H: Hypothesis
Figure 1.2 Structure of the Thesis

17
Chapter Two: Literature Review
2.1 Chapter Overview
This chapter affords a wide review of the published research findings related to the interface
management (IM) area. The previous studies in the areas of construction IM definitions,
categorization of IM, IM problems among various construction parties, and project performance
measurement are summarized. Useful information from previous studies and the methodologies
that are used in those studies are reported and discussed. Parts of the materials in this chapter and
in this thesis were included in Weshah et al. (2012a, 2012b, 2014a, 2014b, 2014c, 2014d, 2013a,
2013b).
The following section presents the main findings of the compilation of numerous academic
journal papers, conference proceedings, and research reports published by various institutes on
the subject area of the research. The areas covered in the literature review include construction
interface definition, interface categorization, definitions and analysis of IM approaches to
exploring IM problems and issues, project performance measurement, and areas for improving
IM. The findings have been categorized into six main areas based on a careful study of the
previous research studies, as shown in Figure 2.1.
Figure 2.1 Six Categories from Prior Research
Prior Research
• Definition of Interface
• Categorization of Interface
• Definitions and Analysis of IM
• Approaches to Exploring Interface Management Problems and Issues
• Areas for Improving Interface Management
• Typical Lifecycle of project (phases)

18
2.2 Definition of Interfaces
There is no agreement among different previous researchers about the definition of interfaces,
although Shokri et al. (2012) say “interfaces are generally considered as the links between
different construction elements, stakeholders, and project scope”. The identification and the
engagement of the project stakeholders is very important concept in understanding the interfaces.
Freeman (1984) defined the stakeholders as “A stakeholder is any group or individual who can
be affected or is affected by the achievement of the organization’s objectives”. According to the
Project Management Institute (PMI) Standards Committee, project stakeholders are “individuals
and organizations who are actively involved in the project or whose interests may be affected by
the execution of the project or by successful project completion” (Project Management Institute,
2004). The project management team should identify project stakeholders at the early stages of
the project to ensure successful projects. It is important to identify the stakeholders and to
understand the stakeholders’ engagement process to integrate them in the design and
construction activates and to identify the interfaces among them and the IM problems in order to
improve IM.
In construction projects, multiple interfaces appear among various contractors and project
participants such as owner, engineering team, sub-contractors, and manufacturers. In addition,
multiple interfaces appear among various disciplines such as civil, electrical, mechanical
engineers (Mortaheb & Rahimi, 2010). Generally, interfaces occur from the division of work into
parts that are executed by numerous organizations and people (Stuckenbruck, 1983).
The existence of interface concepts in project management (PM) followed the growth of the
system approach. Both Wren (1967) and Morris (1983) define the factors included in this
approach. Wren described the organization as “a system of mutually dependent variables” and

19
interface as “the meeting point between organizations”. Morris defined a system as a group
(people, things or information) that comes together with a particular objective in mind. Both
address the importance of project integration. Healy (1997) also provided a more-specific
definition for interface, saying that it is a boundary across which interdependency exists and
responsibility for interdependency can change. The interdependency is more technical, and the
boundaries commonly are determined by the arrangement of organizations and people. Buede
(1999) concluded that an interface can be extremely simple (a wire) or very complex (a
worldwide communication system).
Asbjorn Rolstadas, Hetland, Jergeas, and Westney (2011) discussed the contractual interfaces
and the Project ECO-System concept, which is defined as “the complete structure of the project
owner and contracted suppliers”. They listed four alternatives of the Project ECO-System based
on different contractual arrangements. These contractual arrangements may be among architects,
engineering contractors, and general contractors and sub-contractors. As can be seen in
Figure 2.2, vertical interfaces demonstrate agreements with a contract and horizontal interfaces
those without a contract. In addition, Fellows and Liu (2012) discuss the vertical and horizontal
“fragmentation among project participants”, the vertical among project participants such as
designers, owners, commission client and horizontal among project participants such as sub-
contractors.

20
Figure 2.2: Vertical and Horizontal Ties in a General Contractor Concept, source Asbjorn
Rolstadas et al. (2011) , with permission from the publisher.
The boundaries between project participants need to be carefully managed through
communication and organization. Recently, many have discussed the boundary conditions
among tools, phases, systems, physical elements/components, people, organization, occasions,
processes, equipments, and others (Godinot, 2003; Wideman, 2002). R. Huang et al. (2008)
defined the interfaces in mass rapid transit system (MRTS) construction projects as “the matters
required to be physically and functionally coordinated or cooperated with among two or more
subjects”. Collins, Durham, Fayek, and Zeid (2010) analyzed the interfaces in three levels:
(1) inter-project interface: interfaces that may occur between the parties that participate in project
execution and planning, (2) intra-project interface: interfaces that may occur inside the
organization of each independent party participating in the project, (3) extra-project interface:
interfaces that may occur between project parties that are involved in the project and external
organizations/parties that do not engaged directly in the project execution. In summary, the
Contractual governance
Project functional units/
Sub-suppliers
General contractor
Project owner
Engineering
contractor
Design team
(Architect &
Engineers)
Working Relationships
only, No Contract

21
above-mentioned interface definitions give the boundaries and connections among phases,
systems, tools, people, organization, physical elements, and others.
2.3 Categorization of Interfaces
In construction projects, interfaces occur from improper division of work, packaging design, and
sub-contracting performed by various people and organizations (Stuckenbruck, 1983). The
interfaces can be external if various organizations cooperate with each other or internal if one
organization conducts the work (Awakul & Ogunlana, 2002; Healy, 1997).
Stuckenbruck (1983) grouped the interfaces into systematic interfaces, organizational interfaces,
and personal interfaces. Healy (1997) classified the interfaces according to their level of
compatibility between the things they separate as perfect match, partial match, and total
mismatch. Korman, Fischer, and Tatum (2003) grouped the interfaces into actual, functional,
extended, temporal, and future interfaces.
Pavitt and Gibb (2003 proposed three main interface types: physical, contractual, and
organizational. Miles and Ballard (2002) discussed contractual interfaces. Al-Hammad (2000)
categorized the interface problems into financial problems, environmental problems, inadequate
contracts and specifications, and other problems. R. Huang et al. (2008) categorized the interface
problems in six perspectives using factor analysis techniques, namely, experience, coordination,
contract, regulation, management, and acts of God, whereas, Ku et al (2010) also used factor
analysis techniques to classify the interface problems as negotiation, management, experience,
contract, unavoidable, and law. In addition, experts from the construction industry in Alberta
define another type of interface as information interfaces (B. Holmes, personal communication,
June 5, 2012; D. Clarke, personal communication, June 13, 2012). They occur among project
participants that do not have any physical, contractual, or organizational interactions within the

22
project. This happens when one party involved in the construction project has information that
impacts the cost, schedule, safety, technical issues, or quality of the work of other parties. For
instance, permit requirements by the regulatory group could have an impact on the module
transportation of one of the construction contractors. Table 2.1 summarizes the categorization of
interfaces and IM.
Table 2.1 List of the Interface Problems Categorization
Many studies outlined the interface problems between two parties or more, such as between
contractors and owners (Al-Hammad, 1990), designers, and contractors (Al-Hammad & Assaf,
1992), contractors and subcontractors (Al-Hammad, 1993; Hinze & Tracey, 1994), maintenance
contractors and owners (Al-Hammad, 1995), and owners and designers (Al-Hammad & Al-
Hammad, 1996). These problems included such things as insufficient negotiation,
Interface Categorization References
Personal, organizational, systematic Stuckenbruck (1983)
Static and dynamic Morris (1983)
Attachment, spatial, transfer, control and
communication, environmental, ambient, and user
Sanchez (1999)
Functional, physical, and organizational Laan, Wildenburg, & Kleunen (2000)
Inadequate contract and specification, financial
problems, environmental problems, and other problems
Al-Hammad (2000)
Product and project Archibald (2003)
Physical, contractual, and organizational Pavitt & Gibb (2003)
Actual, functional, extended, temporal, and future Korman et al. (2003)
Management, experience, coordination, contract, acts of
God, and regulation
R. Huang et al. (2008)
Physical, functional, contractual/organizational, and
resource
Chen, Reichard, & Beliveau (2010)
Management, experience, negotiation, contract,
unavoidable, and law
Ku et al. (2010)
Information interfaces Expert from construction industry

23
communication, and coordination among relevant project participants. Many researchers have
noted that lack of communication and coordination among project participants involved in a
construction project accounts for approximately 13% of the total delay causes in construction
projects (Sweis, Sweis, Abu Hammad, & Shboul, 2008).
Also, Mortaheb & Rahimi (2010) identified the top 10 causes of interface problems in mega-oil
refineries in Iran. They identified the main causes of interface problems and their effects on
project completion of the Iranian ongoing oil refineries mega-projects through use of
questionnaires. This study concluded with the identification of 65 major causes of interface
problems within mega-projects in the Iranian sector. These were categorized into seven main
groups, as causes of the interface problems related to (1) the owner, (2) the project,
(3) engineering, (4) the contractor, (5) the consultant, (6) procurement, and (7) external issues
(Mortaheb & Rahimi, 2010). The top 10 causes of interface problems based on all industry
professionals’ opinions were classified (Mortaheb & Rahimi, 2010) as (1) “owner late decision
for dividing the program into the smaller projects”, (2) “lack of key deliverables such as internal
and external interface list, and IM plan within FEED package”, (3) “owner late decision for
hiring qualified project management consultant”, (4) “change order issued by owner”,
(5) “incomplete and unclear scope definition”, (6) “poor and slow owner’s decision making
process”, (7) “owner’s late in progress payment to contractor”, (8) “poor contractor’s
communication and coordination with other project participants”, (9) “contractors poor planning
and scheduling”, and (10) “consultants delay in reviewing and approving key engineering
deliverables”.
As well, Mortaheb and Rahimi (2010) identified the effects of the interface problems as (1) time
overrun in terms of delay, (2) cost overrun, (3) quality impacts, (4) disputes, (5) arbitration,

24
(6) litigation, and (7) termination. While the study conducted by Mortaheb and Rahimi (2010)
focused on the identification of the major causes of interface problems, the IM factors were not
identified using a statistical tool such as factor analysis. Also, the relationships between interface
problems and the seven main groups (owner, project, engineering, contractor, consultant,
procurement, and external issues) were not examined using statistical tools. The relationships
between interface problems and the project performance were not tested using statistical tools
such as the multiple-regression model. The sample size in Mortaheb and Rahimi’s (2010)
research study was not large enough to conduct a statistical analysis, such as factor analysis, but
the study concluded with the identification of 65 major causes of interface problems within
mega-projects in the Iranian sector. While 70 experts from the Iranian sector participated in this
research study, the sample was not sufficient to conduct factor analysis. A summary of the
interface problems is shown in Table 2.2. Readers can refer to Appendix II for a detailed list of
the collected IM problems and examples under each IM problem.
Many of the aforementioned studies of different types of construction projects outlined interface
problems between two parties or more. However, very few studies in the literature have
addressed the interfaces among all project participants involved within the construction project.
Moreover, many researchers have discussed, reported, and listed one type of interface problems.
In addition, few studies have identified the factors that lead to IM conflicts in construction
projects by applying statistical tools such as factor analysis. In conclusion, management of
interfaces is a necessary activity requiring intensive attention from all participants involved in
the project. Consequently, the next section discusses the following question: How to manage the
interfaces?

25
Table 2.2 List of the Collected IM Problems Based on Literature Review
No. Interface problems References
1 Insufficient negotiation, communication
and coordination among relevant project
participants involved in the project
Al-Hammad & Al-Hammad (1996); Al-
Hammad (1993, 2000); Ayudhya (2011); Chen
et al. (2008); Graumann & Schlei (1982);
R. Huang et al. (2008); Ku et al. (2010)
2 Financial difficulties Al-Hammad & Assaf (1992); Al-Hammad
(1995, 2000); Ayudhya (2011); Chen et al.
(2008); R. Huang et al. (2008); Ku et al. (2010)
3 Poor decision making Al-Hammad (2000); Ayudhya (2011); Chen et
al. (2008); R. Huang et al. (2008); Ku et al.
(2010)
4 Limited skills for labour and engineering Al-Hammad (1993, 1995, 2000); Ayudhya
(2011); Chen et al. (2008); R. Huang et al.
(2008); Ku et al. (2010).
5 Materials procurement problems Al-Hammad (2000); Chen et al. (2008)
6 Construction process problems Al-Hammad (1993, 2000); Ayudhya (2011);
Chen et al. (2008)
7 Engineering process problems related to
interfaces
Al-Hammad & Assaf (1992); Chen et al. (2008)
8 Project site issues Chen et al. (2008)
9 Information problems Chen et al. (2008)
10 Lack of project management Chen et al. (2008); Mortaheb & Rahimi (2010)
11 Lack of IM Chen et al. (2008)
12 Planning and scheduling problems Chen et al. (2008); R. Huang et al. (2008); Ku
et al. (2010)
13 Imprecise project cost estimate Al-Hammad & Al-Hammad (1996); Al-
Hammad (2000); Ayudhya (2011); R. Huang et
al. (2008); Ku et al. (2010)
14 Discrepancies among the owners’
expectations regarding project
construction schedule, cost. and quality
Ku et al. (2010)
15 Lack of personal experience of the
project teams
Al-Hammad & Al-Hammad (1996); R. Huang
et al. (2008); Ku et al. (2010)
16 Inability to predict and resolve project’s
problems related to new technological
techniques and materials
Ku et al. (2010)

26
Table 2.2 cont’d
No. Interface problems References
17 Contractor’s unfamiliarity with the
environmental circumstances and local weather
Al-Hammad (1995)
18 Lack of knowledge about site circumstances by
the project team members
Al-Hammad & Assaf (1992)
19 Increase project interfaces conflicts when
different contractors insist on their points of
view
Ku et al. (2010)
20 Insufficient and inaccurate work drawings and
specifications
Al-Hammad & Al-Hammad (1996); Al-
Hammad (1993, 2000); Ayudhya (2011);
Chen et al. (2008)
21 No proper work packaging design and
subcontracting because of many reasons
Chen et al. (2008)
22 Slow submission and approval of change
orders, permits, and shop drawings
Al-Hammad (1993, 2000); Ayudhya
(2011); Chen et al. (2008); Ku et al. (2010)
23 Unclear contract details and badly written
contract
Al-Hammad & Al-Hammad (1996); Al-
Hammad (2000); Ayudhya (2011); R.
Huang et al. (2008)
24 Delay in established schedule of engineering,
procurement, and construction, and delay in
owner approval of completed tasks
Al-Hammad (1995)
25 Application of fast-track engineering and
construction techniques
Al-Hammad & Assaf (1992)
26 Weather and climate conditions problems Al-Hammad (2000); Ayudhya (2011);
Chen et al. (2008); R. Huang et al. (2008)
27 Unexpected changes in materials and labour
availability and cost
Al-Hammad (1993, 2000); Ayudhya
(2011); Chen et al. (2008); R. Huang et al.
(2008); Ku et al. (2010).
28 Geotechnical circumstances problems Al-Hammad (2000); Chen et al. (2008);
R. Huang et al. (2008); Ku et al. (2010).
29 Inexperience with government auditing
protocols and procedures
R. Huang et al. (2008); Ku et al. (2010)
30 Inexperience with local laws and other
government regulations and modification in
laws and regulations
Al-Hammad (2000); R. Huang et al.
(2008); Ku et al. (2010)
31 Inexperience with building codes, and “trade
union practices”
Al-Hammad & Assaf (1992); Chen et al.
(2008)

27
2.4 Definition and Analysis of Interface Management
How to Manage Interfaces?
The rise of dynamism and complexity within construction projects has imposed many interfaces
among various project participants engaged within these projects. Shokri et al. (2012) state that
“industry leaders in mega construction projects believe that IM will improve alignment between
parties and reduce project issues and conflicts”. (Therefore, the concept of IM becomes
important. IM is a comparatively new topic in project management. It is not widely recognized
what subjects are enclosed under this project management area (Chen et al., 2007).
Many researchers have reported many definitions of IM. The Project Management Institute
describes IM as “the management of communication, coordination and responsibility across a
common boundary between two organizations, phases, or physical entities which are
interdependent” (Project Management Institute, 2003). A common boundary is the point where
an two or more parties come together; these are usually set out in contracts (Bible et al., 2014).
“In essence, interface management is the glue that holds a project together” (Crumrine et al.,
2005). “IM as an effective method in recognizing and communicating interfaces between project
parties and construction components, is an essential tool in successful execution” (Shokri et al.,
2012). Healy (1997) defined IM as “the management of the interdependencies and
responsibilities across the boundary of the interface”. Stuckenbruck (1983) mentioned that IM is
part of project integration and involves “identifying, documenting, scheduling, communicating
and monitoring interfaces related to both the product and the project”. IM is successful in dealing
with complex projects (Chen et al., 2007).
Wideman (2002) provided two meanings of IM within construction projects: the first meaning is
“the management of communication, coordination and responsibility across a common boundary

28
between two organizations, phases, or physical entities which are interdependent”. The second
meaning is “managing the problems that often occur among people, departments, and disciplines
rather than within the project team itself”. Mortaheb and Rahimi (2010) defined IM within oil
refineries’ mega projects as “the management of borders and boundaries between different
project players, including designers and contractors, contractors and sub-contractors, owners and
licensors, owners and designers, owners and contractors, as well as common interface problems
among various construction participants to enhance management of the resources, costs,
schedules, safety, risks, contracts, and systems in order to create a dynamic, organized, and
active environment during project execution of oil refineries mega projects”. Fellows and Liu
(2012) use the term “boundary management” to discuss the business organizational
boundaries/interfaces. This paper aims “to explore boundary management on engineering
construction projects to address issues of fragmentation and of performance”. Generally,
different perspectives have been used to define the organizational boundaries such as cross-
system interfaces (Yan & Louis, 1999). The “cross-system interfaces” perspective focuses on
“the interdependent relations and cross-boundary transaction between systems” (Yan & Louis,
1999) that matches the aforementioned definitions of interface management and projects’
interfaces.
On the other hand, IM must be continued through the life of a project; its objective is to keep all
aspects of the project (scope, time, cost, quality, and resources ) in balance (Crumrine et al.,
2005). Many researchers emphasized that project performance, in terms of quality, scope, time,
and schedule, safety, will be improved by implementing IM at the early stages of the project
(Caglar & Connolly, 2007; Chen et al., 2007; Shokri et al., 2012). Failure to properly manage
interfaces impacts project scope control, quality, schedule, cost, safety, and resources (Crumrine

29
et al., 2005; Mortaheb & Rahimi, 2010; Pavitt & Gibb, 2003). “The failure of IM may result in
low productivity, low quality construction, problems, and increased cost” (Chen et al., 2008).
Shokri et al. (2012) mentioned that “Poor management of interfaces may result in deficiencies in
the project cost, time, and quality during the project life cycle execution, or may result in failures
after the project has been delivered”.
Consequently, the critical relationship between project success and IM is expanded continuously
in the literature (Morris, 1983; Pavitt & Gibb, 2003; Stuckenbruck, 1983). Chen et al. (2007)
reported and listed the benefits of including IM in the construction process as follows: (1) deal
with project difficulty by classifying and reporting the best IM practices that can be used and
applied in future projects, (2) meet customer desires by improving design in terms of risk, cost,
quality, etc., (3) facilitate a well-organized construction project delivery system, 4) decrease the
uncertainties within the construction projects and regulate the work flow for different types of
interfaces, (5) build good relationships among different project participants involved in
construction projects to get effective communication, coordination, and cooperation among
them, (6) minimize project complexity by improving subcontracting and work packaging,
(7) identify the interfaces at an early stage of the project, which will minimize interface issues
within the project phases, and (8) assist project participants to have a deep understanding of
project difficulty.
Successful project management can be achieved through managing both internal and external
interface problems.
Chen et al. (2008) outlined the causes of interface issues through six perspectives, namely,
documentation, resources, processes/methods, people/participants, project management, and
environment. In addition, five different domains have been proposed in order to analyze IM,

30
namely, technology interfaces, contract interfaces, monitor interfaces, execution integration
interfaces, and the interacting behavior in the interface (R. Huang et al., 2008). “The execution
integration interface is considered to be the most comprehensive and practical to understanding
IM in construction projects” (R. Huang et al., 2008). Investigations and lessons learned
concluded that poor IM and organization are the main factors causing major delay during the
execution phase, which impact the relationships among a project’s scope, cost, quality, time, and
resources (Mortaheb & Rahimi, 2010). During the execution phase, construction projects
involved many participants that have contracts with each other, such as suppliers, executives,
designers, and sub-contractors. While many parties that have contracts with one another are
involved in construction projects, the main contractor possesses the power to control and
combine the execution phase, as shown in Figure 2.3. Because of that, effective IM must
integrate all the managerial and practical issues among engaged project members and manage
their communication. If not, interfaces can happen, causing loss to all project members engaged
in the construction projects (R. Huang et al., 2008).

31
Subcontractor
Contractor Owner Designer
SuperintendentPCM
Supplier
Site Construction Management Interface
Technical Coordination
Interface
Site Construction Management Interface
Technical Coordination InterfaceTechnical Coordination
Interface
ContractCommission
Contract
Supply Contract
Agent Contract
Contract
Monitor Integration Interface
Resistance
Interference
Resistance
Resistance
Resistance
Resistance
Interference
Interference
Interference
Interference
Technical Coordination Interface
Technical Coordination Interface
Figure 2.3 Execution of Construction Interface, source R. Huang et al. (2008), with
permission from the authors
Lin (2009) proposed an IM procedure in five phases: interface finding, interface identifying,
interface communicating, interface recording, and interface closing. Moreover, Caglar and
Connolly (2007) identified the interface management process in six steps as follows:
(1) identification and recording an interface, (2) creating an interface agreement,
(3) agreeing/resolving conflict, (4) monitoring the status, (5) reporting the status, and (6) closing
the interface agreement. Godinot (2003) identified five strategies to manage interfaces as
follows: interface definitions, visibility, communication, control, and response to interface

32
issues. Finally, for efficient IM the project control is very important. Caron, Marchet, and Perego
(1998) state that “the management of the interface between two successive phases is critical in
guaranteeing the integration of the overall project”. Morris (1983) emphasized that the
transitions from one phase to another one need to be managed carefully in terms of organization,
planning, direction, and control. In conclusion, to address the complexity of interface problems,
Mortaheb and Rahimi’s (2010) comprehensive definition for mega-oil refineries is adopted in
this study. Therefore, interface management is defined as the management of borders and
boundaries, relationships, and information transfer among different project actors including
architects, engineers, construction contractors, sub-contractors, owners, and others. It also covers
management of dual and multiple interface problems among the participants in various project
life-cycle phases to enhance management of the costs, schedules, safety, quality, scope, and
teamwork in order to create a dynamic, organized, and active environment during the project life
cycle and in particular during the engineering/design phase.
2.5 Approaches to Exploring Interface Management Problems and Issues
Many researchers have provided various approaches to investigate, identify, and classify
interface problems in different types of projects:
1. Many researchers have also identified, reviewed, and reported the interface problems in
different countries within varying types of projects through a comprehensive literature review,
pilot studies, and interviews with experts from industry and questionnaires in different
countries without applying statistical techniques (Al-Hammad & Al-Hammad, 1996; Al-
Hammad & Assaf, 1992; Al-Hammad, 1990, 1993, 1995, 2000). For instance, Mortaheb and
Rahimi (2010) set up a research study of the Iranian ongoing oil refineries mega-projects to
identify the main causes of the interface problems and their effects (impacts) on project

33
completion through questionnaires without applying statistical techniques such as factor
analysis, multiple-regression model, etc.
2. Multi-perspective approach: Chen et al. (2008) presented the multi-perspective approach to
investigate the causes of interface problems in different construction projects (residential
construction, offshore construction, and commercial construction) by using “the Cause and
Effect (C&E) diagram method”. The Cause and Effect (C&E) diagram method was proposed
by Ishikawa in 1968 (Ishikawa, 1968). This method uses a hierarchical prepared approach to
identify and categorize the level of implication of each cause of the problems as major causes,
minor causes, and sub-factors, as shown in Figure 2.4 and Figure 2.5. Although this approach
provided a holistic view of interface problems and a comprehensive cause of the interface
issues, it is only a graphical tool and does not provide any numerical values, such as the
impact or severity of each interface problem.
Main Cause Area 1
Major Cause
Major Cause
Major Cause
Subfactor
Minor cause
Effect or Problem
Main Cause Area 2
Figure 2.4 C&E Diagram Method, source Chen et al. (2008), with permission from ASCE.

34
People/Participants Methods/processes Resources
Interface Issues
Documentation Project Management Environment
Figure 2.5 Research Method of C&E Diagram, source Chen et al. (2008), with permission
from ASCE. Notice: “This material may be downloaded for personal use only. Any other use
requires prior permission of the American Society of Civil Engineers”.
3. Other researchers identified the interface problem factors in different construction projects
using both qualitative and quantitative statistical approaches using two statistical tools (factor
analysis and multiple regression models). For instance, R. Huang et al. (2008) and Ku et al.
(2010) have named the factors that cause IM conflicts in mass rapid transit system (MRTS)
construction projects by applying statistical tools in two stages. The first stage consisted of a
literature review, pilot studies, and face-to-face interviews with experts from industry to
identify the interface problems. The second stage developed a questionnaire survey. This
approach is considered to be appropriate for this research study because it combines both
qualitative and quantitative methods. Combining both qualitative and quantitative methods
increases the reliability of the results. Using both methods may result in the finding of unseen
variances that otherwise might have been ignored through the use of a single method
(Hewage, 2007). Pole (2007) stated that “mixed methods research can provide for stronger
inferences because the data are looked at from multiple perspectives. One method can provide
greater depth, the other greater breadth and together they confirm or complement each other”.

35
4. There are some other approaches, such as Work Breakdown Structure (WBS), to manage the
interfaces between systems and activities (Chua & Godinot, 2006).
2.6 Project Performance Measurement
A brief summary of project performance measurement techniques and the relevant indicator has
been outlined here to provide a better understanding of the impact of IM on project performance.
Traditionally, in construction projects performance measurement is based on quality, time, and
cost, which are defined as the iron-triangle (Walker, 1995). During the last two to three decades,
performance indicators have changed and many new aspects of project performance have been
included. These are primarily used for benchmarking purposes and have been used for
controlling the performance during the project lifecycle (Haponava & Al-Jibouri, 2009). For
instance, in 1992 performance measures were developed to measure project success among
owners, designers, and contractors (Sanvido et al., 1992), based upon an agreement that
successful projects have to meet the budget and the schedule, have no legal claims, and meet the
profit goals. Weston and Gibson (1993) and Schmader and Gibson (1995) measured many
project performance indicators in terms of value engineering savings, change-order cost, cost
growth, schedule growth, and claims cost. Pocock, Hyun, Liu, and Kim (1996) presented an
approach for measuring the relationship between the project participants’ communication and
project performance indicators in terms of cost growth, schedule growth, number of contract
modifications, claims cost, value-engineering savings, and safety information. Performance
measurements that have been established for benchmarking in different countries, namely the
USA (CII, 2000), Chile (Corporación de Desarrollo Tecnológico [CDT], 2002), the UK (Key
Performance Indicators Working Group [KPI], 2003), and Brazil (Costa et al., 2004b), are as
described below.

36
A. Construction Industry Institute (CII) Benchmarking System
Although the CII Benchmarking and Metrics Program commenced in 1993, the first data
collection was in 1996 (CII, 2000; Costa et al., 2004a) and included the following:
1. Cost: project cost growth, project budget factor (contractor data only), phase cost factor
(owner data only), and phase cost growth (owner data only);
2. Schedule: project schedule growth, project schedule factor (contractor data only), phase
duration factor (owner data only), total project duration, and construction phase duration;
3. Safety: recordable incident rate (RIR) and lost workday case incident rate (LWCIR);
4. Changes: change cost factor;
5. Rework: total field rework factor.
B. National Benchmarking System for the Chilean Construction Industry:
The National Benchmarking System for the Chilean Construction Industry was launched by the
Corporation for Technical Development (Corporación de Desarrollo Tecnológico) of the Chilean
Chamber of Construction (Camara Chilena de la Construccion) in 2001. This measurement
system includes a group of performance indicators: deviation of cost, deviation of construction
due date, change in amount contracted, accident rate, risk rate, efficiency of direct labour,
productivity, rate of subcontracting, client cost complaints, urgent orders, and planning
effectiveness” (CDT, 2002; Costa et al., 2004a). These performance indicators are differentiated
for five sub-sectors of the construction industry: high-rise or low-rise buildings, heavy or light
industrial construction, and civil works (CDT, 2002; Costa et al., 2004a).
C. Key Performance Indicators in the UK
The KPI Program was developed by the UK Best Practice Program in 1998. The aim of this
program was to facilitate the measurement of project and organizational performance. In

37
November 2000 the first group of KPIs was created (Costa et al., 2004a; KPI, 2003) and are
client satisfaction–product, client satisfaction–service, construction cost, construction time,
defects, predictability-cost, predictability-time, profitability, productivity, and safety (Costa et
al., 2004a; KPI, 2003).
D. Performance Measurements System for the Brazilian Construction Industry (SISIND)
The SISIND was launched in 1993 and consists of the following indicators: time deviation, non-
conformity index for critical processes, percentage of plan completed (PPC), supplier
performance, degree of user satisfaction (product), sale time, ratio between the number of
accidents and total man-hour input, construction site best practice index, and degree of internal
client (worker) satisfaction (Costa et al., 2004b).
The aforementioned studies measure project performance according to a few indicators.
Insufficient project performance measurement is one of the major problems that affect the
construction industry (Costa et al., 2004a; Costa et al., 2004b). In terms of quality of the built
facilities and project performance, interface problems and issues have been recognized to
considerably harm the construction industry (Chen et al., 2010). Despite project performance
measurements being a very significant topic in the construction industry, the data on project
performance measurements are very limited. The review revealed that there is no standard
method for measuring project performance (Costa et al., 2004a; 2004b). Table 2.3 summarizes
the most common indicators that have been used for the assessment of project performance in the
literature review.
Therefore, it is necessary to measure the impact of the IM on project performance indicators.
This study examine the relationships between the IM factors and the basic project performance

38
indicators (quality management, schedule management, cost management, scope management,
safety management, and teamwork) using the multiple regression technique.
Table 2.3 The Common Used Project Performance Indicators by Previous Studies
Indicator Definition Reference
Field rework factor The ratio of total direct cost of
field rework to actual
construction phase cost
CII (2000)
Schedule deviation
(total duration, phase
duration)
Percent difference between
original and actual schedule
Alarcón & Ashley (1996); CDT
(2002); CII (2000); Griffith, Gibson,
& Hamilton (1999); KPI (2003);
Pocock, Hyun, Liu, & Kim (1996);
Sanvido, Grobler, Parfitt, & Coyle
(1992); Weston & Gibson (1993)
Cost deviation (total
cost, phase cost)
Percent difference between
original and actual cost
Change cost factor Total cost impact of changes,
which is a ratio of total cost of
changes to actual total project
cost
CII (2000)
Urgent orders Number of urgent orders divided
by total number of orders in
procurement phase
CDT (2002)
Subcontracting Subcontracted costs divided by
total project cost
Quality (defects) The ratio of cost of repairing
defects to total project cost
KPI (2003)
Safety (incident rate) The number of incidents that a
company experiences per a
defined number of full-time
employees in any given time
CDT (2002); KPI (2003)
Safety (lost workday
incident rate)
The number of lost work days
per a defined number of full-
time employees in any given
time frame
CII (2000)
Number of contract
modifications
Number of contract
modifications
CDT (2002); Pocock et al. (1996)

39
Table 2.3 cont’d
Indicator Definition Reference
Percent amount of
contract modification
The percent ratio of total cost
of contract modification to the
contract value
CII (2000)
Number of claims Number of claims Weston & Gibson (1993)
Percent amount of
claims
The percent ratio of total cost
of claims to the contract value
Weston & Gibson (1993)
Value engineering
savings
The percent ratio of total
savings obtained by calculating
the ratio of value engineering
practices to the total project
cost
Weston & Gibson (1993)
Client satisfaction It is measured based on
questionnaire survey and state
of award
KPI (2003); Yu, Kim, Jung, & Chin
(2005)
Productivity The ratio of the output of a
system to the inputs that are
used to produce that output
KPI (2003); CDT (2002)

40
2.7 Areas for Improving Interface Management
Mortaheb and Rahimi (2010) provided a list of recommendations for each project party (owner,
contractor, consultant, and engineering) to improve IM of oil refinery mega-projects. These areas
can be summarized for each party (owner, contractor, consultant, and engineering), e.g., split the
program of the project at the end of the front-end loading (FEL) phase by the engineering
designer into sub-programs and prepare the internal and external interfaces list. A summary of
areas for improving the IM is shown in Table 2.4. The areas for improving IM were divided into
hard and soft by the researcher. The soft actions can be defined as the actions that need more
discussion, communication, engagement, and coordination among different project participants.
The hard actions can be defined as the actions that need a hard document to be circulated among
the parties involved in a project. Mortaheb and Rahimi’s (2010) research study provided a list of
the areas for improving IM, but did not quantify these areas. In addition, this list of areas is
specific to oil refinery mega-projects only and may not apply to all construction projects. The
Center for Chemical Process Safety (CCPS) (2004) identified the application of management and
communication techniques among different project participants involved in the projects to
improve IM. Pavitt and Gibb (2003) identified areas for improving IM within construction
projects, with specific reference to “building façade interface”, using questionnaires as shown in
Table 2.4. The areas for improvement are ranked from the highest to lowest as follows:
(1) “identify the interface responsibility as early as possible”, (2) “appoint the specialist
contractor earlier”, (3) “develop tools that identify and aid interface management”, (4)
“standardize interface designs”, and (5) “improve programming and sequencing at site level”.
Hence, the identification of interface responsibilities as early as possible was ranked as the best
area for improving the IM. This indicates that if the responsibilities of different project

41
participants are identified during the early stages of the project, the problems can be solved
before construction. In addition, appointing a specialist contractor earlier ranked second. The
response rate was 38%, which is considered to be a good response rate in statistics (Tabachnick
& Fidell, 2001). Pavitt and Gibb’s (2003) research study was with specific reference to building
façade interface. Therefore, the findings of this research study cannot be generalized. In addition,
Alarcón and Mardones (1998) identified three areas for improving IM, namely: (1) implementing
engineering, procurement, and construction standards, (2) coordinating among multi-disciplines
and specialties, (3) controlling the circulation of data within the project teams. In conclusion, it is
important to note that research on areas for improving IM is very limited. Most have identified
possible solutions, but no one attempted to quantify them and/or assess their impact on project
performance. In addition, some researchers have reported the procedures or areas for improving
IM in particular parts of the construction projects and/or in a specific sector. However, none of
them list areas for improving IM among all project participants involved in a construction
project. Table 2.4 provides a list of the areas for improving IM based on the literature review.
Table 2.4 List of the Areas for Improving the IM Based on Literature Review
No. Procedures or Areas Done by Hard Soft
1 Split the program of the project at the end of the front-end
loading phase into sub-programs (Mortaheb & Rahimi, 2010)
Engineering
designer
2 Prepare the internal and external interfaces list and IM plan
(Mortaheb & Rahimi, 2010)
Engineering
designer
3 Approve the design on time and pay the contractor on time
(Mortaheb & Rahimi, 2010)
Owner
4 Clearly define the scope of project (Mortaheb & Rahimi,
2010)
Owner
5 Use appropriate tools for choice of contractors (Mortaheb &
Rahimi, 2010)
Owner
6 Resolve any problem related to the interface issues (Mortaheb
& Rahimi, 2010)
Owner

42
Table 2.4 cont’d
No Procedures or Areas Done by Hard Soft
7 Strong understanding of the owner’s requirements and
the local law and regulations (Mortaheb & Rahimi,
2010)
Contractor
8 Schedule, plan, and monitor the interface problems with
other project participants (Mortaheb & Rahimi, 2010)
Contractor
9 Communicate and coordinate with other project
participants (Mortaheb & Rahimi, 2010)
Contractor
10 Accelerate the design events in terms of interface issues Engineering
designer
11 Arrange for weekly, bi-weekly, and monthly meetings
to discuss the interface issues (Mortaheb & Rahimi,
2010)
12 Reduce disagreements or errors in engineering
deliverables (Mortaheb & Rahimi, 2010)
Engineering
designer
13 Use 3D computerized modeling software (Mortaheb &
Rahimi, 2010)
14 Provide the project with an interface manager
(Mortaheb & Rahimi, 2010)
15 Identify the interface responsibility as early as possible
(Pavitt & Gibb, 2003)
16 Appoint the specialist contractor earlier (Pavitt & Gibb,
2003)
17 Develop tools that identify and aid interface
management (Pavitt & Gibb, 2003)
18 Improve programming and sequencing at site level
(Pavitt & Gibb, 2003)
19 Standardize interface designs (Pavitt & Gibb, 2003)
20 Implement engineering, procurement, and construction
standards (Alarcón & Mardones, 1998)
21 Coordinate among multi-disciplines and specialties
(Alarcón & Mardones, 1998)
22 Control the circulation of data within the project teams
(Alarcón & Mardones, 1998)

43
2.8 Typical Lifecycle Project (Phases)
This research study was applied to different sectors of construction, mainly: (1) oil and gas and
(2) commercial and buildings. The following section provides example of only the construction
projects research area, namely, commercial and building.
2.8.1 Commercial and building projects
Building projects were developed from inception to completion, as shown in Table 2.5, which
illustrates five main phases and deliverables of a typical life cycle adopted from The Royal
Institute of British Architects (RIBA, 2007) . These phases include (1) preparation, (2) design,
(3) pre-construction, (4) construction, and (5) use, as shown in Table 2.5.

44
Table 2.5 Typical Life Cycle from the Royal Institute of British Architects (RIBA, 2007) P
hase
s Phase 1
Preparation
Phase 2
Design
Phase 3
Pre-Construction
Phase 4
Construction
Phase 5
Use
Sta
ges
A. Inception
B. Feasibility.
C. Outline
proposals
D. Scheme
design
E. Detail
design
F. Production
information
G. Bills of
quantities
H. Tender action
J. Project
planning
K. Operations
on site
L. Completion
M. Feedback
Del
iver
ab
les
Identifications
of clients’
needs,
objectives, and
business case
Preparation of
concept design
Preparation of final
production
information, i.e.,
drawings,
schedules, and
specifications
Appointing the
contractor
Administration of
the building
contract after
practical
completion and
making final
inspections
Preparation of
feasibility
studies and
assessment of
options
Development
of concept
design
Preparation of bills
of quantities and
tender documents
Issuing of
information to
the contractor
Assisting building
user during initial
occupation period
Carry out
studies of use
requirements,
site conditions,
planning, de-
sign, and cost
Preparation of
technical
design(s) and
specifications
Procedure for
selective tendering
Arranging site
handover to
the contractor
Review of project
performance in
use
Identification
of procurement
method;
appoint
architect
Full design of
every part and
component of
the building;
complete cost
checking of
design
Administration
of the building
contract to
practical
completion;
Review of
information
provided by
contractors and
specialists

45
Finally, this review of the literature revealed that the focus of previous studies has been on
identification of the interface issues through different perspectives and domains and not on the
identification of the IM factors. None of the previous studies develop models between underlying
interface problem factors and project performance indicators. In addition, they do not develop a
conceptual framework to study the IM relationships among owner, contractor, and designer using
the UML use case diagrams.
The next section identifies the gaps and room for improvement in details and how this research
study plans to address these gaps.
2.9 Project Delivery Methods (Systems)
Many organizations have identified and classified several project delivery methods (PDS), such
as design-bid-build, design-negotiation-build, design-build (The Construction Specifications
Institute [CSI], 2004).
The design-bid-build is the traditional delivery method for public sector. Based on the contract
documents (drawings, specifications, and necessary information), the design-bid-build consists
of the competitive bid and lump sum construction contracts. The contract documents are
prepared by the architects and engineers. The design-bid-build consists of the following phases:
1) project conception, 2) design, 3) construction documents, 4) competitive bidding, and 5)
construction. The owner secures competitive bids from contractors based on the contract
documents that were developed by the design team (engineers, architects). Based on an accepted
bid, the owner signs a contract with the selected contractor for construction of the project.
On the other hand, Design-Negotiation-Build is an informal process as only on contractor is
involved in developing the cost and negotiating a contract in order to construct the project (CSI,
2004). In design-bid-build and design-negotiation build methods, the pricing stage has to be

46
started after the design has to be completed. The main reason behind the using of design-
negotiation build method is to finalize the project in less time comparing to the design-bid-build
method.
On other hand, Design-Built delivery method is process as the owner has single
agreement/contract with only single party (designer-builder) to complete the design and the
construction phases of the project (CSI, 2004). The main reason behind the using of the design-
built delivery method is the owner’s need only one single entity to be responsible to perform the
design and the construction of the project.
2.10 Summary (Identified Gaps/Room for Improvement) and Connection with the Next
Chapters
Although there is no consensus among researchers about the meaning and classifications of IM
and the interfaces, many discuss the border and boundary conditions between physical
elements/components, tools, equipments, phases, systems, people, organization, occasions,
processes, and others.
The construction industry still has many things that we do not know, and this justifies more
research, especially into the interface among project participants involved within construction
projects. After review of the literature, the following gaps in knowledge and practices in the area
of IM were identified.
1. Few studies have identified the IM problems among all project participants involved within
the construction project lifecycle.
2. While several studies related interface problems and issues in different projects, few previous
studies have identified the factors that contribute to IM conflicts in construction projects by
applying statistical tools. In addition, none of previous studies have investigated the

47
relationships between IM factors and company types, industry types, and respondent’s
title/position and years of experience.
3. Previous studies have considered a limited number of the factors that contribute to IM
conflicts in construction projects.
4. Some studies measure project performance according to a few indicators.
5. None of the previous studies list areas for improving IM among all project participants
involved in construction project.
Overall, most of the previous studies focused on the identification of IM problems and not on the
identification of the IM factors using statistical tools such as factor analysis. Previous studies
have considered a limited number of the factors that contribute to IM conflicts in construction
projects. This study adopts a comprehensive analytical approach to identify factors to be
considered in the quantification model. Moreover, this research study aims to address the
interface problems among all project participants involved within construction projects. In
addition, relationships between IM factors and company type, industry types, experience types,
and a participant’s level of education were not examined in the previous studies using statistical
tools. This research aims to investigate relationships between IM factors and company types,
industry types, and respondent’s title/position and years of experience and to identify the top 10
problems affecting each aspects of IM.
In sum up, this study attempts to bridge existing knowledge gaps in four areas: (1) focusing on
the impact of IM factors on project performance indicators: quality management, schedule
management, cost management, scope management, safety, and teamwork, (2) developing
conceptual framework using The Royal Institute of British Architects (RIBA) structure to
highlight the critical IM areas during different project phases, (3) developing use case models to

48
study the IM relationships among owner, contractor, and designer (architects, engineers) using
UML use case diagrams, and (4) providing suggestions for improving and enhancing IM that are
adequate to all project participants engaged in different construction projects.
The next chapter provides details of the research methodology.

49
Chapter Three: Research Methodology
3.1 Chapter Overview
The chapter defines the research methodology. It also explained the purpose for choosing the
approach adopted. Parts of the material in this chapter and in this thesis were included in Weshah
et al. (2012a, 2012b, 2014a, 2014b, 2014c, 2014d, 2013a, 2013b).
3.2 Research Design and Approach
This section provides and discusses the research design and approaches for this research study
that was conducted throughout the project lifecycle and particularly during the
engineering/design phase as shown in Figure 3.1. This research study used both qualitative and
quantitative approaches (mixed methods) and had direct contact with practitioners to collect and
analyze the research information. Using of mixed methods (combination of qualitative and
quantitative methods) is more common, which increases the reliability of the results. The use of
mixed methods may uncover the unseen variances that otherwise might have been ignored
through the use of a single method (Hewage, 2007). Pole (2007) mentioned that “mixed methods
research can provide for stronger inferences because the data are looked at from multiple
perspectives. One method can provide greater depth, the other greater breadth and together they
confirm or complement each other”.
This research study has been approved by the Conjoint Faculties Ethics Board of the University
of Calgary (No. 7281); please see Appendix I. This study explored the interface management
(IM) problems throughout project lifecycle and during the engineering/design phase and
introduced a new approach for evaluating and analyzing the impact of IM on project
performance indicators. For more details, a study was conducted to categorize the IM factors
contributing to interface conflicts among project participants engaged in construction projects. A

50
comprehensive literature review followed by industry pilot studies was conducted through
reviewing journals papers, previous relevant studies, and conference proceedings. In this study,
structured interviews were conducted around a major question; what are the interface problems
that may arise among different project participants involved in construction projects in Alberta?
A complete literature review and pilot studies in industry were performed, as shown in
Figure 3.1. While the pilot study concluded with the recognition of 16 major interface problems,
the literature review concluded with the recognition of 31 major interface problems, as shown in
Table 3.1. Therefore, the literature review (31 IM problems) and the pilot interviews (16 IM
problems) concluded with the recognition of 47 major interface problems. Based on the 47
interface problems, two web-based online surveys were performed with participants from
industry throughout the project lifecycle and during the engineering/design phase, as shown in
Appendixes III and IV. While the first survey was conducted to study the interfaces throughout
the project lifecycle phase with 47 interface problems, the second survey was conducted to
enhance the IM during the engineering/design phase within construction projects with 22
interface problems, as shown in Figure 3.1. Out of 47 IM problems collected throughout the
project lifecycle, 22 IM problems were found applicable to the engineering/design phase, as
shown in Table 3.1.
In general, the research surveys questions were designed based on the interface problems and
issues and on the following project performance indicators: quality management, schedule
management, cost management, scope management, safety, and teamwork, as shown in
Table 3.2. As can be seen in Table 3.2, the responses to the two questionnaires in this study were
obtained to build a six-point Likert scale with the end points being 1 = negligible and 6 =
disastrous and 1= unimportant and 7 = very important. The two likert scales (six-point Likert and
51
seven-point Likert scales) have the same effect in the analysis of the data. Therefore, this
research adopted the six and the seven likert scales.
Using Alberta’s data, this study was conducted in three phases (see Figure 3.2). Figure 3.2 shows
the conceptual research framework (theoretical framework) for modeling the impact of IM on
construction project performance throughout the project lifecycle phase and during the
engineering/design phase.

52
Literature Review
31 IM Problems
Pilot Interviews
n=35
16 IM Problems
Questionnaires
Project Lifecycle
n=135
Q= 47 IM Problems
Engineering/ Design Phase
n=161
Q= 22 IM Problems out of
47 IM Problems
Factor Analysis , Cross Tabulated,
& MANOVA
Factor Analysis , Cross Tabulated,
& MANOVA
Multiple-regression Models
Conceptual Framework (RIBA
Framework) & Use Case Models
47 IM problems
(31 + 16)
In-depth interviews
Figure 3.1 Overall Research Methodology

53
Table 3.1 List of the Collected IM Problems Based on Literature Review and Pilot Study
(Project lifecycle and engineering design phase) (Unranked)
No. Interface problems
Lit
Rev.
n = 31
Pilot
n = 16
Project
Lifecycle
n = 47
Eng./
Design
n = 22
1 Lack of enough negotiation and communication and
coordination
2 Financial difficulties
3 Poor decision making
4 Limited skills for labour and engineering
5 Materials procurement problems
6 Construction process problems
7 Engineering process problems related to interfaces
8 Project site issues
9 Information problems
10 Lack of project management
11 Lack of IM system
12 Planning and scheduling problems
13 Type of organization structure
14 Interfaces with other interdependent projects
15 Undefined reporting structure and responsibilities
16 Interfaces arise because of the application of the
project development gating (or phases) system
17 Insufficient or lack of alignment among WBS,
CWBS, CBS, and OBS
18 Imprecise project cost estimate
19 Discrepancies between the owners’ expectations
regarding project construction schedule, cost, and
quality
20 Lack of personal experience of the project teams
21 Inability to predict and resolve project’s problems
related to new technological techniques and materials
22 Contractor’s unfamiliarity with the environmental
circumstances and local weather
23 Project team members’ lack of knowledge about site
circumstances
24 Increased project interfaces conflicts when different
contractors insist on their points of view

54
Table 3.1 cont’d
No. Interface problems
Lit
Rev.
n = 31
Pilot
n = 16
Project
Lifecycle
n = 47
Eng./
Design
n = 22
25 Lack of trust among different project parties
26 Insufficient and inaccurate work drawings and
specifications
27 No proper work packaging design and subcontracting
28 Slow in change orders, permits and shop drawings
submission and approval
29 Unclear contract details and badly written contract
30 Delay in established schedule of engineering,
procurement, and construction, and delay in owner
approval of completed tasks
31 Type of the contract does not match the nature of the
project.
32 Appliction of fast-track engineering and construction
techniques
33 Lack of solid contracting strategy vision at early stage
of the project
34 Type of contracting strategy: EP, EPC, and EPCM
35 In the invitation to tender, identify the interface
problems
36 Complete appraisal of bids to comprise an assessment
of contractor’s understanding of IM
37 Weather climate conditions problems
38 Unexpected changes in materials and labour
availability and cost
39 Geological circumstances problems
40 Unclear company standard operating procedures
41 Inexperience with the government auditing protocols
and procedures
42 Inexperience with local laws and other government
regulations
43 Inexperience with building codes and trade union
practices
44 Project extension versus greenfield (new) project type
45 Free issue items
46 Insufficient definition of projects boundaries at early
stage of the project
47 Unclear system completion requirements

53
Figure 3.2 Conceptual Research Framework for Modeling the Impact of IM on Construction Project Performance (Project
Lifecycle Phase and the Engineering/Design Phase
Project
Performance
Regression
Analysis
IM Factors
impact on
project
performance
indicators
Quality Hard
Issue
s
Project Performance
Schedule
Cost
Scope
Safety
Teamw
ork
Conceptual
framework (RIBA
framework) & UML
use case models
Second Phase
Project Lifecycle & Eng. Design
Soft
IssueDefinition of IM Factors
Interface
Problems
Literature Review
Pilot Study &
Face-to-Face
Interviews
First Phase
Project Lifecycle & Eng. Design
Critical IM Problems
Relationship between IM Factors
& 1) Company Type, 2) Industry
Type, 3) Years of Experience, & 4)
Respondent’s title
Factor Analysis
Ranking process
ANOVA Technique
Surveys
Conclusions &
Recommendations
& Areas for
Improving IM
Developing conceptual framework (RIBA framework)
& use case models to study the IM relationships
among owner, contractor & design team
Third Phase
Project lifecycle

54
Table 3.2 Survey Sample Question throughout Project Lifecycle and during the
Engineering/Design Phase
1 2 3 4 5 6
1 2 3 4 5 6 7
Interface Problems /
Issues
Impact Project Performance
Qual
ity
Sch
edule
Cost
Sco
pe
Saf
ety
Tea
m-
work
Lack of interface details
within work drawings
and specifications
3.2.1 The first phase.
The first phase investigated, identified, and classified interface problems that impact IM and
cause interface conflicts among the participating parties in construction projects. The first phase
consists of (A) a complete literature review, followed by industry pilot studies and (B) two web-
based questionnaires with participants from industry. Both qualitative and quantitative data were
analyzed and interpreted using factor analysis. The findings of the first phase provided a
comprehensive view of the main reasons and factors that contribute to IM conflicts in
construction industry and provided the basis for the second phase.
A. Pilot Study and Face-to-face Interviews
Comprehensive literature reviews followed by industry pilot interviews were conducted.
B. A Web-based Online Questionnaire
Two web-based online questionnaires were conducted with participants from industry, as shown
in Table 3.2. The research survey questions were designed based on the interface problems and
Unimportant Very Important Negligible Disastrous
IM Factors Impact on Project
Performance (Phase Two)
IM Factors
(Phase One)

55
issues, as shown in Table 3.1, and project performance indicators: quality management, schedule
management, cost management, scope management, safety, and teamwork. The participants were
asked to assess the interface problems’ impact on IM. Besides that, the impact of IM problems
on project performance indicators was examined. Both qualitative and quantitative data were
analyzed and interpreted using statistical techniques such as factor analysis and cross tabulated.
The significant sample size was determined as shown in Appendix V. The relationships among
IM factors and company types, industry types, respondents’ titles/positions and years of
experience were tested using statistical techniques.
C. Identifying the top 10 interface problems
This phase identifies the top ten interface problems affecting IM performances using the cross-
tabulated analysis followed by the ranking factor process method. Cross-tabulation is a statistical
technique that helps us to analyse the relationships among two or more variables.
3.2.2 The second phase.
Based on the results of the first phase, the second phase consists of enhancing project
performance by developing a multiple-regression analysis model between the underlying
interface problem factors and the project performance indicators.
A. Developing a Multiple-Regression Analysis Model
A multiple regression analysis model between the underlying interface problem factors and the
project performance indicators (quality, cost, schedule, scope, teamwork, and safety) were
developed. These indicators are further divided into soft and hard issues. The hard issues are
quality management, schedule management, cost management, scope management, and safety
management; the soft issue is teamwork. The regression model can provide a good method to
examine how specific factors influence the outputs (Brace, Kemp, & Snelgar, 2006). As

56
regression analysis can assist in setting up a confidence interval of the results (Ng, 2006).
However, there are many deficiencies in using this technique; it needs sufficient data to set up
this model, which are not easy to obtain in the construction field. Also, if any new factor needs to
be added to this model, the regression equation must be started over (Abdelgawad, 2011). This
study adopted a comprehensive analytical approach to identify factors to be considered in the
quantification model. The sample size in this research study was large enough to conduct a
statistical analysis, such as multiple regressions and cross-tabulated analysis.
3.2.3 The third phase.
3.2.3.1 Developing conceptual framework and use case models.
Based on the previous phases, the last phase developed conceptual framework (RIBA
framework) and use case models to study the IM relationships among owners, contractors, and
designers (architect and engineer) using the UML use case diagrams. These models can be used
to evaluate the IM relationships among owner, contractor, and designer based on IM and to
provide suggestions for improving and enhancing IM, which are adequate to all participants
engaged in construction projects.
3.2.3.2 Defining areas for improving IM.
The last step collected data regarding existing and proposed IM procedures and/or areas for
improving and enhancing IM. Accordingly, suggestions for improving and enhancing the IM
were provided by experts from Alberta’s construction industry. These need to be adequate to all
participants engaged in Alberta construction projects. The data were collected using the web-
based online questionnaires. The last question in my survey was “from your experience, what do
you suggest and recommend improving the interface management?”

57
Examples of the areas for improving the IM are shown in Table 3.3. Finally, in-depth interviews
were conducted to validate the final research findings.
Table 3.3 Examples of the Areas for Improving IM
Areas
1 Applying of management and communication techniques among different project
participants involved in the projects
2 Engagement of the project teams (regulatory, engineering, procurement, construction,
project controls, and planning) from the beginning of the project to the completion
3 Prepare plans and schedules at an early stage of the project
4 Clear definition of proper contracting strategy
5 Identify the site-wide services
6 Provide the project with a general construction manager or project manager contractor at the
beginning of the project
7 Define a clear project organization structure
8 Define a clear work breakdown structure (WBS)
9 Define clear site access responsibilities
10 Define clear procedures for engineering review of construction design changes
11 Organize the regulatory and permit procedures
12 Minimize interfaces with other projects
13 Provide the owner’s team with an interface manager
14 Application of management and communication techniques among different project
participants
3.3 Data Collection
The following section provides full details for the data collection throughout project lifecycle
and during the design phase. Quantitative and qualitative data were collected from different types
of construction projects, including oil and gas, commercial and buildings, infrastructure,
transportation, and manufacturing with the largest sample size of responses coming from the
sectors oil and gas and commercial and buildings. In addition, different organizations were
included in the data collection, such as EPC, owner, EPCM, construction management
58
companies, construction contractor/sub-contractor, engineering consultant, architecture, and
architecture and engineering. Furthermore, surveys were sent to engineers, construction
managers, procurement staff, quality engineers, safety leaders, architects, planners, project
engineers, and project controllers. Two techniques were used to collect the data: (1) pilot studies
and face-to-face interviews (structured interviews) and (2) questionnaires and in-depth
interviews after the survey. The questionnaires were circulated through the members of the
following associations and groups: Project Management Focus Group (PMFG), Consulting
Engineering for Alberta (CEA), Consulting Architects of Alberta (CAA), and Alberta
Construction Association (ACA). The next two sections explain these techniques in details.
3.3.1 Pilot studies and face-to-face interviews.
Structured interviews were conducted around a major question: what are the interface problems
that may arise among different project participants involved in construction projects in Alberta?
The survey instrument was also developed through the pilot study to ensure that the survey was
comprehensible and comprehensive. Thirty-five experts from industry participated in the pilot
studies and face-to-face interviews and identified 16 major interface problems, shown in
Table 3.1.
3.3.2 Empirical surveys and data collection.
Data were collected to evaluate the impacts of the interface problems using two well-structured
questionnaire instruments. Two web-based online surveys were performed with members from
industry throughout the project lifecycle and during the engineering/design phase (see
Appendixes III and IV. The survey questionnaires were designed based on the identified
interface problems as shown in Table 3.1, and the format was recommended by experts in
Alberta’s industry. The two surveys include quantitative questions divided into two sections:

59
demographic information and interface problems. Both the rating scale and checklist techniques
were used to design the questionnaire. The participants were asked to evaluate the impact of the
interface problems on interface management performance. The study made use of the Likert
scale, which is suitable for perception-oriented questions (Jugdev, Mathur, & Fung, 2007). The
responses to the two questionnaires in this study were obtained to build a six-point Likert scale
with the end points being 1 = negligible and 6 = disastrous.
The numerical values assigned to the selected choices were used in the statistical analysis using
SPSS software by using two statistical tools (factor analysis and multiple-regression analysis).
The questionnaires were distributed through the members of the PMFG, CEA, CAA, and ACA.
Many parties engaged in the construction process participated in this survey questionnaire,
including engineers (structural, mechanical, electrical), architects, leaders (safety, procurement,
etc.), project controls, interface coordinators, contract administrators, project engineers,
commissioning engineers, quality engineers, planning engineers, project managers, construction
managers, construction planners, contractors/sub-contractors, project engineering managers.
Participating parties were from different industry sectors, infrastructure, oil and gas, commercial
and buildings, and transportation. In this research study, the large sample size of responses was
received from the sectors oil and gas and commercial and buildings. Furthermore, in the data
collection stage, various types of companies were included: owner, architecture, architecture and
engineering, EPC, EPCM, construction contractor/sub-contractor, engineering consultant, and
construction management company.
The collected data were analyzed using Pearson’s Product-Moment Correlation (PPMT) matrix,
factor analysis methods, cross-tabulated analysis, and multiple regressions. The Pearson’s
correlation is used to measure the strength of the relationships between variables (the identified

60
interface problems). Pearson’s correlation matrix was created to study its use for factor analysis.
Exploratory factor analysis was performed to extract the factors and the latent structure of
independent variables (the identified interface problems) using the IBM SPSS Statistics 20. The
one-way MANOVA was used to determine the relationships among the IM problems and
different construction data in Alberta. Cross-tabulation is a statistical technique that helps us to
analyse the relationships among two or more variables. For more details, the cross-tabulations
provide a way of analysing how changes in the frequency of occurrence of one variable are
related to changes in the frequency of occurrence of other variables (Tabachnick & Fidell, 2001).
“Multiple regression is a statistical technique that allows us to predict someone’s score on one
variable on the basis of their scores on several other variables”, where the researchers can predict
one variable on the basis of a number of other variables (Brace et al., 2006). For the first survey
that was conducted throughout the project lifecycle, the number of responses was 135 responses.
The overall response rate was approximately 32%. This means that out of the 421 participants
that completed the demographic questions, 135 completed the last survey question. In addition,
out of the 421 participants that completed the demographic questions, 269 participants completed
the first survey question (64%). To conduct factor analysis, the following scale guidelines were
proposed in (Tabachnick & Fidell, 2001) to examine the sample size: (a) sample size of 50 as
very poor, (b) 100 as poor, (c) 200 as fair to good, (d) 300 as good, and (e) 1000 as excellent.,
Therefore, the sample size of this study is considered “fair to good” because the number of
responses was 135. In addition, almost half of the participants (65 participants) provided the
researcher with their email addresses, which indicated their agreement to participate in the in-
depth interviews after the survey. This high percentage of the participants interested in

61
participating in the in-depth interviews after the survey shows the significance of IM in the
construction industry sector of Alberta.
For the second survey that was conducted during the engineering/design phase, the number of
responses was 162 responses. The overall response rate was approximately 46%. This means that
out of the 354 participants that completed the demographic questions, 162 completed the last
survey question. To conduct factor analysis, the following scale guidelines were proposed in
(Tabachnick & Fidell, 2001) to examine the sample size: (a) sample size of 50 as very poor, (b)
100 as poor, (c) 200 as fair to good, (d) 300 as good, and (e) 1000 as excellent., Therefore, the
sample size of this study is considered “fair to good” because the number of responses was 162.
3.3.3 In-depth interviews.
The primary advantage of in-depth interviews is that they provide much more detailed
information than what is available through other data collection methods. A second round of in-
depth interviews was conducted to validate the final research findings at the end of the study.
3.4 Data Analysis
Both quantitative and qualitative data were analyzed to address the research questions.
3.4.1 Qualitative data analysis.
The following steps were used to analyze the qualitative data collected of areas and procedures
to improve IM (Creswell, 1998): (1) organizing: all data were organized using Microsoft Excel®
or Word®, (2) scrutinizing: the entire data set was perused to get a sense of what it contains as a
whole, (3) categorizing: all data were classified into categories or themes, and (4) synthesizing:
conclusions will be drawn and theories offered..

62
3.4.2 Quantitative data analysis.
The main research hypotheses were tested to determine the correlation between IM problems in
construction projects. Statistical tools such as factor analysis, one-way MANOVA, and multiple-
regression analysis were used to analyze the data collected from the survey using SPSS software.
Factor analysis is “a statistical technique used to identify a relatively small number of factors that
can be used to represent the relationships among sets of many interrelated variables” (R. Huang
et al., 2008). Exploratory factor analysis was performed to extract the factors and the latent
structure of independent variables (interface problems/issues).
The one-way MANOVA test considered the relationships between identified IM factors and the
company type, industry type, title type, and survey respondent’s years of experience. In addition,
multiple-regression models were used to investigate the relationship between the extracted IM
factors and project performance indicators (quality management, schedule management, cost
management, scope management, safety management, and teamwork). This research study
enhanced IM within construction projects by developing a conceptual framework (RIBA
framework) and use case models to study the IM relationships among owner, contractor and
designer using the Microsoft Visio® flowcharts and the UML use case diagrams. Based on the
aforementioned discussion, regression techniques were used to examine the collected data at the
first stage of the data analysis. Table 3.4 gives the research questions, research objectives, and
potential methodologies and methods used throughout the project lifecycle and particularly
during the design phase.

63
Table 3.4 Illustrates the Research Questions, Research Objectives, Potential Methodologies
and Methods throughout Project Lifecycle and the Engineering/Design Phase
Research
questions
Research
objectives
Methodology Data
Collection
Data
Analysis
Phases
1. What are the
main interface
problems
and/or factors
causing
interface
conflicts and
affecting IM?
2. To
investigate,
identify, and
classify the
main IM factors
that
considerably
impact IM and
cause interface
conflicts
Quantitative
methodology
Web-page
questionnaire
#1 & #2
SPSS factor
analysis tool
Project
lifecycle and
engineering/
design phase
2. What are the
relationships
between IM
factors and
different
construction
data such as
company types
and industry
types
3. To
investigate the
relationships
between IM
factors and
different
construction
data such as:
company types
and industry
types
Quantitative
methodology
Web-page
questionnaire
#1 & #2
SPSS one-
way
MANOVA
Project
lifecycle and
engineering/
design phase
3. What are the
top 10 IM
problems
affecting each
aspect of IM?
3. To list the
top 10 IM
problems
affecting each
aspect of IM
Quantitative
methodology
Web-page
questionnaire
#1 & #2
SPSS cross-
tabulated
analysis
followed by
the ranking
factor process
Project
lifecycle and
engineering/
design phase

64
Table 3.4 cont’d
Research
questions
Research
objectives
Methodology Data
Collection
Data
Analysis
Phases
4. What are the
relationships
between the
identified IM
factor and the
project
performance
indicators of
construction
projects?
4. To
investigate the
relationship
between the
extracted IM
factors and the
project
performance
indicators
Quantitative
methodology
Web-page
questionnaire
#1 & #2
SPSS
multiple
regression
Project
lifecycle and
engineering/
design phase
5. Could we
study the
relationships
among owner,
contractor, and
designer and
recommend
solutions for
management?
5. To develop a
conceptual
framework and
use case
models to study
the IM
relationships
among owner,
contractor, and
design team
Quantitative
methodology
Web-page
questionnaire
#1 & #2
Microsoft
Visio®
flowcharts
and the UML
use case
diagrams
Project
lifecycle
6. What are the
procedures or
areas for
improving IM?
6. To provide
suggestions and
recommenda-
tions for
improving and
enhancing IM
Qualitative
methodology
In-depth
interviews
after the
web-page
questionnaire
Organizing,
scrutinizing,
categorizing,
synthesizing
Project
lifecycle
3.5 Research Reliability and Validity
In general, reliability measures and validity confirm and help data trustworthiness. In this study,
a reliability statistical method is used to assess the stability and consistency in survey questions,
to ensure that the questions are appropriately reliable, and to present a certain measurement. The

65
statistical method (Cronbach’s α) was used for examining the reliability of extracted IM factors
and six project performance indicators in order to ensure accuracy. A value of 0.7 reliability
coefficient or higher is acceptable in the social sciences (Jugdev et al., 2007). Besides that, all the
questions in this research study were established based on theoretical bases, expert consensuses
and experience, and the empirical questionnaire.
The best validity test is to test the model on a real-life project; however, achieving access to real-
life data may be a challenge owing to privacy and/or proprietary limits. In this study, the sample
size had to be determined to fulfill statistical requirements. The validity can be achieved by
requesting individuals external to the study to examine the credibility of the findings and
involving participants in evaluating the accuracy of the interpretations of the collected data
(Creswell & Miller, 2000).
In this study, participants in the pilot study prior to and after the web surveys provide an external
review of the results. The participants found that the results of these two surveys were expected
and make sense. The participants in the web-page questionnaires were also involved in assessing
the accuracy of the interpretations, as they review the results of the two surveys.
Through in-depth interviews that were conducted to validate the final research findings at the end
of the study. Experts from industry assisted in the review of the final research findings,
specifically the final conceptual framework (RIBA framework) and the use case models that
were developed. Many suggestions and actions from the industry experts were included in the
proposed use case model packages for each project players (owner, design team, and
construction contractor).
Moreover, “a good construct must explain why particular sets of variables are interconnected and
are strong predictors of the results” (Sutton & Staw, 1995). The web-page questionnaires

66
developed in this study were constructed of groups of variables that were identified by a large
group of experienced construction industry practitioners. Finally, the success of the multiple
regression models when applied to the real world in statistics can be estimated using R squared
(R2) (Brace et al., 2006). An investigation of the survey’s comprehensibility and
comprehensiveness through a pilot study was conducted with experts from industry.
3.6 Summary and Connection with the Next Chapters
This chapter provided and discussed the research design and approaches for this research study
in two sections: throughout the project lifecycle and during the engineering/design phase. This
research study used both qualitative and quantitative approaches and had direct contact with
practitioners to collect and analyze the research information. A complete literature review and
pilot studies in industry were performed. After that, two web-based online surveys were
performed with participants from industry, followed by in-depth interviews.
The next two chapters (4 and 5) provided full details of the two surveys that were conducted
throughout the project lifecycle phases and during the engineering/design phase.

67
Chapter Four: Factor Analysis and Multiple Regression Analysis of Interface Management
throughout the Project Lifecycle
4.1 Chapter Overview
Two web-based online surveys were performed with participants from industry throughout
project lifecycle and during the engineering/design phase, as shown in Appendixes III and IV.
This chapter provides full details of the first survey that was conducted throughout project
lifecycle phases. This chapter provides analysis of the results and discussion of the findings and
conclusions. Parts of the materials in this chapter and in this thesis were included in Weshah, El-
Ghandour, Cowe Falls, and Jergeas (2014c) and Weshah, El-Ghandour, Jergeas, and Cowe Falls
(2013b).
4.2 Analysis of Survey Results and Discussion of Findings
4.2.1 Respondents’ profiles.
Out of the 135 valid questionnaires collected, the highest number of responses received were
from the architect and project control group, followed by project manager and engineers
(structural, mechanical, electrical), as shown in Table 4.1. In addition, in terms of the company
types, the main responses were obtained from owners, engineering, procurement, and
construction management (EPCM), engineering consultants, and engineering, procurement, and
construction (EPC), as shown in Table 4.2. The participants are from different sectors in the
industry in Alberta: Seventy-eight participants are working in the oil and gas industry, while 32
are working in commercial and buildings, as shown in Table 4.3.
Moreover, in terms of years involved in construction, the proportions of the respondents were as
shown in Table 4.4; about half of the participants have at least 20 years of experience, which
demonstrates the importance of interface management (IM) in the industry sectors of Alberta.
Participants are well educated at the undergrad or higher levels, as shown in Table 4.5.

68
Table 4.1 Respondents’ Job Profiles
Respondents’ Job Profiles Number of
Responses
Percentage of Responses
(%)
Lead (safety, procurement, etc.) 4 3
Project controls 20 15
Interface coordinator 7 5
Project engineer 8 6
Commissioning engineer 2 2
Quality engineer 2 1
Planning engineer 7 5
Project manager 16 12
Construction manager 3 2
Construction planner 3 2
Contractor/sub-contractor 2 1
Engineer (structural, mechanical, etc.) 13 10
Architect 30 22
Project Engineering Manager 5 4
Other 13 10
Table 4.2 Respondents’ “Company” Types
Respondents’ Company Types Number of
Responses
Percentage of Responses
(%)
Owner 41 30
EPC 13 10
EPCM 18 13
Construction contractor/sub-contractor 6 5
Engineering consultant 15 11
Architecture firms 15 11
Architecture and engineering firms 10 7
Construction management company 4 3
Others 13 10
Table 4.3 Respondents’ “Industry” Types
Respondents’ Industry Types Number of Responses Percentage of Responses (%)
Infrastructure 13 10
Oil and Gas 78 58
Transportation 6 4
Commercial and buildings 32 24
Other Sectors 6 4

69
Table 4.4 Respondents’ “Years of Experience” Types
Respondents’ Years of
Experience Types
Number of Responses Percentage of Responses
(%)
≤5 years 7 5
6–9 years 8 6
10–14 years 23 17
15–19 years 26 19
≥20 years 61 45
Others 10 8
Table 4.5 Respondents’ “Level of Education” Types
Respondents’ Level of
Education Types
Number of Responses Percentage of Responses (%)
Diploma 7 5
Post-diploma 10 7
BSc 55 41
MSc 44 33
PhD 14 10
Others 5 4
4.2.2 Pearson product-moment correlation.
The Pearson product-moment correlation (PPMC) matrix is considered to be the most common
measure of dependence between two variables (Tabachnick & Fidell, 2001). “The Pearson
product moment correlation coefficient is a measure of linear dependency between two variables
in the range of –1 and 1. A PPMC of 1 indicates an exact positive correlation, –1 indicates an
exact negative correlation, while 0 indicates there is no linear relationship” (Phillips, Gauthier
Dickey, & Thurimella, 2010). To interpret the correlation coefficient, the following scale
guidelines have been proposed: correlations between 0 and 0.33 indicate a weak to low
relationship, correlations between 0.33 and 0.66 reflect medium to high relationships, and
correlations between 0.66 and 1 reflect very high and very strong relationships. The PPMC
values shown in Appendix VI show that although 65% of the 47 interface problems correlate

70
positively and reflect medium relationships, 33% show low to weak relationships and 2% reflect
high and very strong relationships. The correlation coefficients results show that our data are
reasonable enough to apply factor analysis.
4.2.3 Factors influencing interface management.
Factor analysis is “a statistical technique used to identify a relatively small number of factors that
can be used to represent the relationships among sets of many interrelated variables” (R. Huang
et al., 2008). Exploratory factor analysis was performed to extract the factors and the latent
structure of independent variables (in this case, the 47 interface problems) that reduce the 47
items into a small number of underlying factors. The extraction of the factors gives an apparent
picture of what each factor stands for.
Through the use of the Kaiser’s normalization criterium results, nine factors were determined
with eigenvalues greater than 1. Figure 4.1 is a scree plot showing the extracted factors plotted
against an eigenvalue that may be less than nine factors. Different models from five to nine
factors were reviewed and studied. The results show that the best factor solution is the six-factor
results. The six factors were reasonable enough. Each extracted factor consists of its own
interface problems that have common features that make them reasonable to be listed and
categorized.
Six factors were extracted in this research study. According to the factor loading and item
(interface problems) under each factor, the name for each of the factors was determined by
studying the variables that loaded highly (>0.40) on all six factors. Based on the common
features of their exact interface problems, each of the factors was given a specific name.
Tables 4.6 – 4.11 show the components of the six extracted factors, namely: management,
information, bidding and contracting, law and regulation, technical engineering and site issues,

71
and other interface problems. The reason behind the name of each of the interface problem
factors is explained in the following section.
Figure 4.1 Scree Plot of 47 Interface Problems
1. Management factor (Mgt. factor)
This factor consists of 14 various IM problems related to management problems such as lack of
enough negotiation, communication, and coordination among relevant parties involved in the
project and lack of project management, as shown in Table 4.6. Therefore, this factor was named
“management factor”. In addition, Table 4.6 shows the variables that loaded highly (>0.40) on all
IM problems related to management problems.
2. Information factor (Inf. factor)
This factor includes seven IM problems related to information problems, for example inaccurate
information and delays and undefined reporting structure and responsibilities, as shown in
Eigenvalue =1
IM problems

72
Table 4.7. All of the interface problems under this factor are due to information issues leading to
delay: missed, inaccurate, and insufficient information. Therefore, the name “information factor”
was considered appropriate.
3. Bidding and contracting factor (Bid & contr. factor)
This factor consisted of 10 interface problems concerning the bid and contract that appear in the
invitation to bid and contract execution, e.g., unclear contract details and poorly written contracts,
and in the invitation to tender, identify the interface problems, as shown in Table 4.8. These
problems may occur when different project parties are invited to bid or execute the contract.
Therefore, the name “bidding and contracting factor” was considered to be suitable.
Table 4.6 Summary of Factor Analysis (Management Factor)
IM Problems
Mgt.
factor
Inf.
factor
Bid &
contr.
factor
Law
& reg.
factor
Tech.
engg.
& site
issues
factor
Others
factor
1 Lack of enough negotiation and
communication and coordination
0.495 0.366 –0.066 0.235 0.118 0.368
2 Financial difficulties 0.552 0.188 0.035 0.196 0.213 –0.079
3 Poor decision making 0.565 0.165 0.12 0.02 0.369 0.23
10 Lack of project management 0.415 0.368 0.244 0.134 0.396 –0.067
12 Planning and scheduling
problems
0.607 0.38 0.409 –0.019 0.135 –0.028
14 Interfaces with other
interdependent projects
0.49 0.284 0.249 0.265 0.043 0.058
18 Imprecise project cost estimate 0.541 0.398 0.171 0.1 –0.044 0.005
19
Discrepancies among the
owners’ expectations regarding
project construction schedule,
cost, and quality
0.502 0.429 0.016 0.173 0.191 –0.008
20 Lack of personal experience of
the project teams
0.503 0.463 –0.061 0.181 0.136 0.289

73
Table 4.6 cont’d
IM Problems
Mgt.
factor
Inf.
factor
Bid &
contr.
factor
Law
&
reg.
factor
Tech.
engg.
& site
issues
factor
Others
factor
21
Incapability to predict and resolve
project’s problems related to new
technological techniques and
materials
0.485 0.24 0.137 0.405 0.093 –0.249
25 Lack of trust among different project
parties
0.512 0.334 0.294 0.238 0.326 –0.054
28
Slow in change orders, permits, and
shop drawings submission and
approval
0.385 0.239 0.345 0.174 0.347 0.265
30
Delay in established schedule of
engineering, procurement, and
construction
0.664 0.12 0.432 0.137 0.169 0.194
32 Application of fast-track engineering
and construction techniques
0.556 0.196 0.281 0.061 0.294 0.116
Table 4.7 Summary of Factor Analysis (Information Factor)
IM Problems
Mgt.
factor
Inf.
factor
Bid &
contr.
factor
Law
&
reg.
factor
Tech.
engg.
& site
issues
factor
Other
s
factor
9 Information problems 0.413 0.515 0.118 0.139 0.362 0.183
11 Lack of IM system 0.345 0.586 0.218 0.227 0.145 0.156
13 Type of organization structure 0.169 0.68 0.264 0.064 0.166 0.124
15 Undefined reporting structure and
responsibilities
0.299 0.617 0.14 0.224 0.178 –0.078
16
Interfaces arise because of the
application of the project
development gating (or phases)
system
0.11 0.491 0.251 –0.021 0.278 0.001

74
Table 4.7 cont’d
IM Problems
Mgt.
factor
Inf.
factor
Bid &
contr.
factor
Law
&
reg.
factor
Tech.
engg. &
site
issues
factor
Others
factor
17
Insufficient and lack of
alignment among WBS,
CWBS, CBS, and OBS
0.246 0.758 0.208 0.023 0.168 0.219
27 No proper work packaging
design and subcontracting
0.291 0.416 0.37 0.304 0.366 0.116
Table 4.8 Summary of Factor Analysis (Bidding and Contracting)
IM Problems
Mgt.
factor
Inf.
factor
Bid &
contr.
factor
Law &
reg.
factor
Tech.
engg.
& site
issues
factor
Others
factor
24
Increase project interface
conflicts when different
contractors insist on their
points of view
0.329 0.292 0.513 0.341 0.079 0.155
29 Unclear contract details and
poorly written contract
0.353 0.224 0.459 0.343 0.272 0.059
31 Type of the contract does not
match the nature of the project
0.447 0.106 0.622 0.145 0.134 –0.219
33
Lack of solid contracting
strategy vision at early stage of
the project
0.113 0.165 0.8 0.127 0.209 –0.095
34 Type of contracting strategy;
EP, EPC, and EPCM
0.157 0.026 0.702 0.066 0.207 0.355
35 In the invitation to tender,
identify the interface problems
0.122 0.269 0.44 0.318 0.271 0.284
36
Complete appraisal of bids to
comprise an assessment of con-
tractor’s understanding of IM
0.109 0.217 0.521 0.409 0.124 0.227
45 Free issue items 0.082 0.378 0.444 0.186 0.082 0.333

75
Table 4.8 cont’d
IM Problems
Mgt.
factor
Inf.
factor
Bid &
contr.
factor
Law &
reg.
factor
Tech. engg.
& site
issues
factor
Others
factor
46
Insufficient definition of
projects boundaries at early
stage of the project
–
0.074
0.269 0.612 0.315 –0.03 0.17
47 Unclear system completion
requirements
0.157 0.354 0.623 0.352 –0.024 0.108
4. Technical engineering and site issues factor (Tech. engg. & site issues factor)
This factor consisted of 10 IM problems concerning the technical engineering and site issues that
occur because of a lack of skills or the complexity of the process and (or) site problems. Some
examples of this factor are limited skills for labour and engineering, contractor's unfamiliarity
with the environmental circumstances and local weather, and project site issues such as excessive
usage of heavy equipment and unclear site wide service responsibilities, as shown in Table 4.9.
Therefore, the name “technical engineering and site issues factor” was considered to be
appropriate. Also, the name “construction engineering and site issues factor” can be used as
another name to this factor.
5. Law and regulation factor (Law & reg. factor)
This factor consisted of four IM problems regarding laws and regulations that occur when
different project parties are unfamiliar with the government auditing protocols, local laws, and
building codes. Examples of this factor are inexperience with the government auditing protocols
and procedures and inexperience with building codes, by-laws, statutes, and other government
regulations, as shown Table 4.10. Therefore, the name “law and regulation factor” was considered
to be appropriate.

76
6. Other interface problems factor
This factor consisted of two IM problems that do not match up with the aforementioned factors,
as shown in Table 4.11. The two IM problems are unexpected changes in materials and labour
availability and cost and project extension of existing projects versus greenfield (new) project
type. Therefore, the name “other interface problems factor” or “others factor” was found
appropriate
Table 4.9 Summary of Factor Analysis (Technical and Site Issues)
Mgt.
factor
Inf.
factor
Bid
and
contr.
factor
Law
&
reg.
factor
Tech.
Eng. &
site issues
factor
Others
factor
4 Limited skills for labour and
engineering
0.391 0.393 –0.116 0.136 0.437 0.072
5 Materials procurement problems 0.474 0.225 0.183 0.039 0.559 –0.064
6 Construction processes and
methods problems
0.149 0.211 0.139 0.133 0.715 0.193
7 Engineering process problems
related to interfaces
0.404 0.307 0.209 0.142 0.631 0.141
8 Project site issues 0.056 0.471 0.086 0.314 0.513 0.019
22
Contractor's unfamiliarity with
the environmental circumstances
and local weather
0.204 0.153 0.231 0.402 0.61 0.012
23
Lack of knowledge about site
circumstances by the project
team members
0.268 0.215 0.233 0.415 0.607 0.037
26 Insufficient and inaccurate work
drawings and specifications
0.308 0.257 0.199 0.232 0.648 0.084
37 Weather and climate conditions
problems
0.344 –0.038 –0.042 0.298 0.403 –0.037
39 Geotechnical circumstances
problems
0.381 –0.123 0.377 0.213 0.42 –0.10

77
Table 4.10 Summary of Factor Analysis (Law and Regulations)
Mgt.
factor
Inf.
factor
Bid &
contr.
factor
Law &
reg.
factor
Tech.
Eng. &
site
issues
factor
Others
factor
40 Unclear company standard
operating procedures
0.111 0.334 0.457 0.532 0.11 0.023
41
Inexperience with the
government auditing protocols
and procedures
0.094 0.187 0.387 0.736 0.112 0.103
42
Inexperience with local laws
and other government
regulations and modification in
laws and regulations
0.156 0.051 0.21 0.849 0.175 0.127
43 Inexperience with building
codes and trade union practices
0.248 0.059 0.149 0.789 0.037 0.046
Table 4.11 Summary of Factor Analysis (Other Interface Problems Factor)
Mgt.
factor
Inf.
factor
Bid &
contr.
factor
Law &
reg.
factor
Tech.
Eng. &
site
issues
factor
Others
factor
38
Unexpected changes in
materials and labour
availability and cost
0.216 0.198 0.154 0.214 0.121 0.666
44 Project extension versus
greenfield (new) project type
0.148 0.092 0.267 0.069 0.104 0.739
4.2.3.1 Correlation between emergent factors.
The Pearson product-moment correlation technique was used to examine the correlation between
the six IM factors. The correlation coefficients among the six factors that emerged from the
factor analysis test are shown in Table 4.12. Based on the previously proposed scale, the analysis

78
results confirm that the six interface management factors are highly and positively correlated.
This means that the six extracted factors impact each other as well as presenting the IM
performance.
Table 4.12 Correlation Coefficients between Six Extracted Factors
4.2.4 Analysis of the variance (MANOVA) between IM factor and different data.
The following two sections present the test of the normality and the performed hypotheses
between IM factors and different data: company type, industry type, title type, and years of
experience.
4.2.4.1 Normality.
Extracted IM factors were examined for normality and homogeneity of variance. If the data do
not come from a random sample, normality and homogeneity of variance of the dependent
variables within each group of the groups’ variables, the researchers cannot apply the
multivariate analysis of the variance (MANOVA) test. Normality tests are used to decide
whether the research data collection is well-modeled by a normal distribution that consists of two
elements: skewness and kurtosis (Tabachnick & Fidell, 2001). The skewness and kurtosis values
need to be between –1 and +1 to be considered normal (Tabachnick & Fidell, 2001). The results
Mgt.
factor
Inf.
factor
Bid & contr.
factor
Law & reg.
factor
Tech. engg.
& site issues
factor
Others
factor
Mgt. factor 1
Inf. Factor .757 1
Bid & contr. factor .693 .689 1
Law & reg. factor .531 .492 .678 1
Tech. engg. & site
issues factor .678 .700 .669 .642 1
Others factor .621 .583 .603 .405 .618 1

79
show that the variables are within the basic assumptions of the normality and homogeneity of
variance and thus found to be satisfactory.
4.2.4.2 Research hypothesis between IM factors and different construction data.
To determine whether the six IM factors have a significant impact on IM among different groups
type, MANOVA was applied. The multivariate variance analysis and the one-way MANOVA test
considered the relationships between these variables and each of the following independent
variables: company type, industry type, title type, and years of experience. The study tested four
hypotheses. These hypotheses were examined in this research study by using the one-way
MANOVA test. Because the one-way MANOVA test measures more than one dependent
variable, this test can be chosen (Tabachnick & Fidell, 2001).
Tables 4.13, 4.15, 4.17, and 4.19 present the means, standard deviations, and the numbers of cases
for the six dependent variables (IM extracted factors) that have been calculated per the
independent variables (groups) of the title and company type. Tables 4.14, 4.16, 4.18, and 4.20
summarized the MANOVA results. Generally, the study used a significance level of 0.05. The
following section provides full details regarding the tested hypotheses. The study concluded that
the management factor is the factor most impacting IM performance.
1. Job title group related to factor group
The six extracted IM factors were analyzed by five job title groups: (1) project controls, planning
engineer, construction planner, interface coordinator, and contract administrator; (2) project
engineer, commissioning engineer, quality engineer, and lead (safety, procurement, etc.); (3)
engineer (structural, mechanical, electrical) and project engineering manager; (4) project
manager, construction manager, contractor and sub-contractor; (5) architect. The following
hypothesis (Hypothesis 1) was examined; there would be no significant difference in the means

80
between the impact of the six IM extracted factors (dependent variables) and respondent’s title
groups as independent variables.
Based on the means (Table 4.13), the management factor is the factor most impacting the IM
performance. The technical and site issues factor and the information factor ranked second and
third, respectively. More conclusions could be summarized for each group, as shown in
Table 4.13. For example, the project controls people do not consider the management factor
among other groups as the highest factor impacting IM performance. This result was expected
because the project controls people just support the project and other project participants provide
them with information.
The overall MANOVA is statistically significant (F24,402.39 = 2.01; p = 0.003) as shown in
Table 4.14. In addition, there is almost a significant difference between the five groups.
Consequently, hypothesis 1 can be rejected. In more detail, the bidding and contracting factor
(F4,120 = 2.71; p = 0.033) is statistically significant while the management factor (F4,120 = 2.346;
p = 0.058) is almost statistically significant, as can be seen in Table 4.14. This indicates that
these two factors are affected by different respondent’s title groups. Under the management
factor, there are statistically significant differences between group 3 (engineer (structural,
mechanical, electrical) and project engineering manager) and group 5 (architect) with p-values
0.043. This means that the impact of this factor on IM performance is significantly different
between these two groups.
In addition, under the bidding and contracting factor there is an statistically significant difference
between group 3 (engineer group (structural, mechanical, electrical) and project engineering
manager) and group 5 (architect), with p = 0.037. This result show that the impact of the
management and bidding and contracting factors on IM performance are extremely different

81
between the engineer group ((structural, mechanical, electrical) and project engineering
manager) and architect group. As can also be seen in Table 4.13, among the five groups the
architect group views the management and bidding and contracting factors as having the highest
impact on IM, while the engineer group (structural, mechanical, electrical) and project
engineering manager views it as the lowest impact on IM performance. Other results could be
concluded from Tables 4.13 and 4.14.
Table 4.13 Calculated Means (Title Type Groups and Extracted IM Factors)
Extracted
IM Factors
Title Type
Group
Mgt.
factor
(X,SD,N)
Inf. factor
(X,SD,N)
Bid &
cont.
factor
(X,SD,N)
Law &
reg. factor
(X,SD,N)
Tech. &
site issues
factor
(X,SD,N)
Others
factor
(X,SD,N)
1. Project controls,
planning engineer,
construction planner,
interface coordinator,
and contract
administrator
(4.27,
0.77, 36)
(4.04,
0.10, 36)
(3.97,
0.85, 36)
(3.73,
1.12, 36)
(4.04,
0.89, 36)
(3.93,
1.05, 36)
2. Project engineer,
commissioning
engineer, quality
engineer, and lead
(4.12,
0.66, 16)
(4.12,
0.60, 16)
(4.14,
0.64, 16)
(4.28,
0.84, 16)
(4,23,
0.74, 16)
(4.10,
0.84, 16)
3. Engineer and
project engineering
manager
(3.89,
0.60, 19)
(3.42,
0.90, 19)
(3.60,
0.76, 19)
(3.61,
0.10, 19)
(3.74,
0.74, 19)
(3.53,
0.96, 19)
4. Project manager,
construction manager,
contractor, and sub-
contractor
(4.39,
0.51, 23)
(4.10,
0.75, 23)
(3.76,
0.76, 23)
(3.86,
1.06, 23)
(4.21,
0.53, 23)
(4.15,
0.81, 23)
5. Architect (4.46,
0.71, 31)
(4.07,
0.87, 31)
(4.24,
0.68, 31)
(3.96,
0.10, 31)
(4.24,
0.65, 31)
(3.75,
0.77, 31)
Total 4.27 3.97 3.96 3.86 4.09 3.88

82
Table 4.14 MANOVA Results (Title Type Groups and Extracted IM Factors)
Source F Df1, df2 P
Overall 2.014 24, 402.397 0.003
Management factor 2.346 4, 120 0.058
Information factor 2.334 4, 120 0.059
Bidding and contracting factor 2.712 4, 120 0.033
Law factor 1.171 4, 120 0.327
Technical engineering and site issues factor 1.668 4, 120 0.162
Others factor 1.680 4, 120 0.159
*Management factor group comparison
Group 3 (engineer and project engineering manager) and
Group 5 (architect)
0.043
*Bidding and contracting factor group comparison
Group 3 (engineer and project engineering manager) and
Group 5 (architect)
0.037
*Included only the significant pairwise comparison
2. Company type
The six extracted IM factors were analyzed by five groups, which consist of owner,
EPC/construction contractor, EPCM/construction management, engineering consultant, and
architecture firms and architecture and engineering company. The following hypothesis
(Hypothesis 2) was tested; there would be no significant difference in means between the impact
of the six IM extracted factors (dependent variables) and different company types as independent
variables. Based on the means in Table 4.15, the greatest difference among groups was observed
in the management factor, indicating that the management factor is more important than other
factors. The technical and site issues factor and the information factor ranked second and third,
respectively. More conclusions could be summarized for each group as shown in Table 4.15.
The overall MANOVA is almost statistically significant (F24,398.90 = 1.42; p = 0.09), as shown in
Table 4.16. Consequently, hypothesis 2 can be rejected. In more detail, the bidding and

83
contracting factor has a statistically significant effect on different company types with (F4,119 =
2.86; p = 0.026), as can be seen in Table 4.16. This indicates that this factor is affected by
different respondents’ company groups. Under the bidding and contracting factor there were
statistically significant differences between company type group 4 (engineering consultant) and
company type group 5 (architecture firms and architecture and engineering company) with p-
values of 0.048. This means that the impact of this factor on IM performance is significantly
different between these two groups. There were almost statistically significant differences
between company type group 2 (EPC/construction contractor) and company type group 5
(architecture firms and architecture and engineering firms) with p-values of 0.089.
As can also be seen in Table 4.15, the architecture firms and architecture and engineering firms
companies view the bidding and contracting factor as having the highest impact on IM, while the
engineer consultant company views it as having the lowest impact on IM performance as the
architect works with the engineers (electrical, mechanical, etc.) to finalize the work.
These results show that the impacts of the bidding and contracting factors on IM performance are
extremely different between group 5 (architecture firms and architecture and engineering firms
companies) and group 4 (engineer consultant company). This result shows that the IM factors are
affected by the company type. Other results could be concluded from Tables 4.15 and 4.16.

84
Table 4.15 Calculated Means (Company Type Groups and Extracted IM Factors)
Extracted IM
Factors
Company
typeGroups
Mgt.
factor
(X,SD,N)
Inf. factor
(X,SD,N)
Bid &
cont.
factor
(X,SD,N)
Law &
reg. factor
(X,SD,N)
Tech. and
site. issues
factor
(X,SD,N)
Others
factor
(X,SD,N)
1. Owner (4.40,
0.66, 41)
4.19,
0.79, 41)
4.06,
0.79, 41)
(4.10,
1.15, 41)
(4,25, 0.7,
41)
4.20,
0.10, 41
2. EPC/construction
contractor
(4.09,
0.64, 18)
(3.74,
0.86, 18)
(3.67,
0.71, 81)
3.71,
0.94, 18
3.10, 0.54,
18
3.75,
1.03, 18
3. EPCM/
construction
management
4.17,
0.61, 22)
(4.03,
0.92, 22)
(4.03,
0.64, 22)
(3.57,
1.10, 22)
(4.09,
0.84, 22)
3.66,
0.76, 22
4. Engineering
consultant
(4.12,
0.70, 17)
(3.67,
0.94, 17)
(3.61,
0.82, 17)
(3.76,
0.93, 17)
(3.97,
0.63, 17)
(3.79,
1.03, 17)
5. Architecture firms
and architecture and
engineering
company
(4.52,
0.70, 26)
(4.16,
0.80, 26)
(4.25,
0.69, 26)
(3.97,
0.94, 26)
(4.27,
0.72, 26)
(3.93,
0.68, 26)
Total 4.30 4.01 3.97 3.88 4.15 3.93
Table 4.16 MANOVA Results (Company Type Groups and Extracted IM Factors)
Source F df1, df2 P
Overall 1.425 24, 398,000 0.09
Management factor 1.871 4, 119 0.21
Information factor 1.776 4, 119 0.138
Bidding and contracting factor 2.861 4, 119 0.026
Law factor 1.100 4, 119 0.360
Technical engineering and site issues factor 0.947 4, 119 0.439
Others factor 1.633 4, 119 0.171
*Bid factor group comparison
Group 2 (EPC/construction contractor) and Group 5
(architecture firms and architecture and engineering company)
0.089
Group 4 (engineering consultant) and Group 5 (architecture
firms and architecture and engineering company)
0.048
*Included only the significant pairwise comparison

85
3. Industry type
The six extracted IM factors were analyzed by three industry type groups, which include
(1) infrastructure, (2) oil and gas, and (3) commercial and building. The following hypothesis
(Hypothesis 3) was tested; there would be no significant difference in means between the impact
of the six IM extracted factors (dependent variables) and different industry types as independent
variables. Based on the means in Table 4.17, the greatest difference among groups was observed
in the management factor, indicating that the management factor is more important than other
factors. While the commercial and buildings industry type considered the management factor as
the factor with the highest impact on IM followed by technical and site issues factor and bidding
and contracting factor, the oil and gas industry type also considered the management factor as the
factor with the highest impact on IM followed by technical and site issues factor and information
factor. The overall MANOVA is not statistically significant (F12,250 = 1.41; p = 0.157), as shown
in Table 4.18.
Consequently, hypothesis 3 can be accepted. There was not a statistically significant difference
between the IM factors and the industry type. Consistent with these findings, a follow up
univariate test showed no significant results among groups. This result shows that the interface
management factors are not affected by the industry type.

86
Table 4.17 Calculated Means (Industry Type Groups and Extracted IM Factors)
Extracted
IM Factors
Industry
Type
Group
Mgt.
factor
(X,SD,N)
Inf. factor
(X,SD,N)
Bid &
cont.
factor
(X,SD,N)
Law &
reg.
factor
(X,SD,N)
Tech. and
site
issues
factor
(X,SD,N)
Others
factor
(X,SD,N)
1. Infrastructure (4.30,
0.67,13)
(3.84,
0.85, 13)
(3.80,
0.56,13)
(3.96,
0.80, 13)
(4.27,
0.66, 13)
(3.69,
0.95, 13)
2. Oil and gas (4.21,
0.69,79)
(4.03,
0.85, 79)
(3.95,
0.79,79)
(3.78,
1.20, 79)
(4.06,
0.77, 79)
(3.99,
0.97, 79)
3. Commercial
building
(4.33,
0.71,41)
(3.87,
0.91, 41)
(3.95,
0.83, 41)
(3.88,
0.83, 41)
(4.11,
0.69, 41)
(3.79,
0.77, 41)
Total 4.26 3.96 3.94 3.83 4.10 3.90
Table 4.18 MANOVA Results Table (Industry Type Groups and Extracted IM Factors)
Source F df1, df2 P
Overall 1.419 12, 250 0.157
Management factor 0.446 2, 130 0.641
Information factor 0.602 2, 130 0.549
Bidding and contracting factor 0.240 2, 130 0.787
Law factor 0.233 2, 130 0.792
Technical engineering and site issues factor 0.446 2, 130 0.641
Others factor 0.991 2, 130 0.374
4. Years of experience
The six extracted IM factors were analyzed by four groups, based on years of experience, which
includes: (1) ≤9 years, (2) 10–14 years, (3) 15–19 years, and (4) ≥20 years. The following
hypothesis (Hypothesis 4) was tested: there would be no significant difference in means between
the impact of the six IM extracted factors (dependent variables) and total years of experience
groups as independent variables. Based on the means in Table 4.19, the greatest difference
among groups was observed in the management factor, indicating that the management factor is
more important than other factors. The technical and site issues factor ranked second. The overall

87
MANOVA is almost statistically significant (F18,334.24 = 1.55; p = 0.070). Consequently,
hypothesis 4 can be rejected. In more detail, the management factor has a statistically significant
effect on different years of experience types (F3,123 = 3.37; p = 0.021). This indicates that this
factor is affected by different respondents’ years of experience groups. As can be seen in Table
4.20, under the management factor there were almost statistical significant differences between
group 2 (10 to 14 years) and group 3 (15 to 19 years). This means that the impact of this factor
on IM performance is significantly different between these two groups. As can be seen also in
Table 4.19, group 3 (15 to 19 years) views the management factor as having the highest impact
on IM, group 2 (10 to 14 years) views it as having the lowest impact on IM performance. Finally,
regardless of the years of experience, the highest years of experience group (≥20 years) and the
lowest years of experience group (≤9 years) ranked the factors affecting IM performance in the
same order. Both groups considered the management factor as the factor most affecting IM
performance followed by technical and site issues, information, bidding and contracting, and law
and regulation factors, respectively. This ranking of factors was not expected and was surprising.
Table 4.19 Calculated Means (Years of Experience Groups and Extracted IM Factors)
Extracted
IM Factors
Years of
Experience
Group
Mgt.
factor
(X,SD,N)
Inf. factor
(X,SD,N)
Bid &
cont.
factor
(X,SD,N)
Law &
reg. factor
(X,SD,N)
Tech.
and site.
issue
factor
(X,SD,N)
Others
factor
(X,SD,N)
1. ≤9 years (4.10,
0.53, 16)
(3.80,
0.52, 16)
(3.69,
0.60, 16)
(3.67,
0.78, 16)
(3.96,
0.49, 16)
(3.72,
0.63,16)
2. 10–14 years (3.94,
0.99, 24)
(3.70,
1.01, 24)
(3.71,
0.94, 24)
(3.87,
1.06, 24)
(3.87,
1.06, 24)
(3.69,
1.14,24)
3. 15–19 years (4.48,
0.77,26)
(4.27,
0.89, 26)
(4.11,
0.82, 26)
(4.08,
1.11, 26)
(4.17,
0.70, 26)
(3.92,
0.98,26)
4. ≥20 years (4.30,
0.60, 61)
(3.94,
0.89, 61)
(3.93,
0.84, 61)
(3.68,
1.19, 61)
(4.17,
0.60, 61)
(4.00,
0.87, 61)
Total 4.23 3.93 3.93 3.80 4.08 3.89

88
Table 4.20 MANOVA Results (Years of Experience Groups and Extracted IM Factors)
Source F df1, df2 P
Overall 1.553 18, 334.240 0.070
Management factor 3.376 3, 123 .021
Information factor 2.223 3, 123 0.089
Bidding and contracting factor 0.976 3, 123 0.407
Law factor 0.97 3, 123 0.440
Technical engineering and site issues factor 1.508 3, 123 0.216
Others factor 0.869 3, 123 0.459
*Management factor group comparison
Group 2 and Group 3 0.05
*Included only the significant pairwise comparison

89
4.2.5 Top 10 interface problems that affect IM.
What are the most critical problems affecting each aspect of IM? The frequency of the 47 IM
problems was examined using the cross-tabulated analysis followed by the ranking factor process
method. The ranking process is defined in a way that puts more focus and value on aspects of the
data according to the contribution that leads to the final outputs, so that the aspects that have
more contribution get more focus in the analysis. That is, rather than each variable in the data
contributing equally to the final result, some data are adjusted to contribute more than others.
The 47 IM problems were studied within four areas: company types, industry types, years of
experience, and respondent’s title. The five company types reported and discussed are (1) owner,
(2) EPC and construction contractor, (3) EPCM and construction management companies,
(4) engineering consultant, and (5) architecture firms and architecture and engineering firms.
The 47 IM problems were studied and summarized in 47 tables that show the rating average for
each company type. As an example, Table 4.21 shows an example of the rating average for the
problem of “lack of a solid contracting strategy vision at the early stage of the project”. This
table describes the steps used to calculate the rating average for five company types of the
interface problem “lack of a solid contracting strategy vision at the early stage of the project”.
The columns through company type 1 to company type five listed the number of participants in
the questionnaire for each scale from 1 (negligible) to 6 (disastrous) linked scale. As can be seen,
the weighting scale is from x1 through x6; where x1 is the weighting scale corresponding to the
lowest linked scale of the ranking process. Consequently, x6 is the weighting scale of the highest
linked scale given to the IM problem through the ranking process. The weighting columns

90
represent the multiplication of each company’s number of responses column by the weighting
scale. For instance, the column “Weighting 1” represents the multiplication of company 1’s
number of responses by the weighting scale. The following equation is used to calculate the
rating average Yj:
𝑌𝑗(%) =∑ 𝑎𝑖𝑗𝑖
∑ 𝑏𝑖𝑗×𝑛𝑖100 (1)
where aij is the weighting scale of the linked scale i for company j, bij is the number of responses
of linked scale i for company j, and n is the number of responses in the survey. For example,
using equation 2, the rating average company type 1 is equal to (197/ (44 × 128)) × 100 = 3.50.
Based on equation 1, the rating averages of the five company types are 3.50, 2.95, 3.62, 3.08, and
3.91, respectively. This means that the participants from company type five (architecture firms
and architecture and engineering firms) acknowledged the importance of this IM problem (lack
of a solid contracting strategy vision at the early stage of the project) more than other companies.
Consequently, the remaining 47 tables were constructed to find the company type that considers
each of the 47 IM problems the most critical. Based on the data from the 47 tables, the top 10 IM
problems for each company type were ranked and summarized as shown in Table 4.22.
Table 4.22 summarized the rating average of the highest IM problems for each company type.
It should be noted that the five company types are almost in agreement over the 10 general IM
problems with the exception of company type 4 (engineering consultants), as they reported
different IM problems, such as lack of personal experience of the project teams. In addition,
EPCM and construction management companies reported different IM problems, such as

91
(1) complete appraisal of bids to comprise an assessment of contractor’s understanding of
interface management and (2) no proper work packaging design and subcontracting.
Table 4.21 Example of Ranking Process of IM Problems Based on Five Company Types
IM P
rob
lem
s
6 l
iker
t sc
ale
Wei
gh
tin
g s
cale
Com
pan
y 1
nu
mb
er
of
resp
on
ses
Wei
gh
tin
g 1
Com
pan
y 2
nu
mb
er
of
resp
on
ses
Wei
gh
tin
g 2
Com
pan
y 3
nu
mb
er
of
resp
on
ses
Wei
gh
tin
g 3
Com
pan
y 4
nu
mb
er
of
resp
on
ses
Wei
gh
tin
g 4
Com
pan
y 5
nu
mb
er
of
resp
on
ses
Wei
gh
tin
g 5
Tota
l n
um
ber
of
resp
on
ses
Lac
k o
f a
soli
d c
ontr
acti
ng
stra
tegy v
isio
n a
t th
e ea
rly
stag
e of
the
pro
ject
1 Negligible x1 0 0 1 1 0 0 0 0 0 0 1
2 Marginal x2 1 2 2 4 0 0 2 4 1 2 6
3 Moderate x3 6 18 2 6 2 6 4 12 1 3 15
4 Substantial x4 16 64 8 32 7 28 6 24 5 20 42
5 Severe x5 13 65 5 25 10 50 5 25 9 45 42
6 Disastrous x6 8 48 0 0 3 18 1 6 10 60 22
Total (n) 44 197 18 68 22 102 18 71 26 130 128
Rating
Average
3.50 2.95 3.62 3.08 3.91
The top 10 frequent sources of IM problems were also studied according to the area of industry
types in the same way as for the area of company types. Three industry groups resulted from the
classification: (1) infrastructure, (2) oil and gas, and (3) commercial and building. Using
equation 1, the 47 IM problems were studied and summarized in 47 tables that show the rating
average for each industry type. After that, the 47 tables were examined to determine the most
critical problems for each industry type.

92
Based on that, the top 10 IM problems for each industry type were ranked and summarized.
Table 4.23 summarized the rating average of the highest IM problems for each industry type. As
a general conclusion, the different industry types are almost in agreement as to the top 10
problems. For more detail, the oil and gas industry reported different IM problems, such as
(1) unexpected changes in materials and labour availability and cost, (2) project extension versus
greenfield (new) project type, and (3) type of the contract does not match the nature of the
project. In addition, the commercial and buildings reported different IM problems, such as
insufficient and inaccurate work drawings and specifications.

93
Table 4.22 A Summary of the Rating Average of the Highest IM Problems for each Company Type
IM Problem
Owner EPC and
Construction
Contractor
EPCM and
Construction
Management
Companies
Engineering
Consultant
Architecture
and
Architecture
and
Engineering
firms
1 Unclear system completion requirements 3.63 3.15 3.52 - 3.73
2 Inexperience with local laws and other government
regulations and modification in laws and
regulations
3.52 3.28 - 3.33 -
3 Lack of solid contracting strategy vision at an early
stage of the project
3.50 - 3.62 - 3.91
4 Geotechnical circumstances problems 3.47 3.46 - 3.51 3.69
5 Type of the contract does not match the nature of
the project
3.40 3.26 3.17 - 3.37
6 Project extension versus greenfield (new) project
type
3.36 - - 3.13 -
7 Unclear company standard operating procedures 3.36 - - - -
8 Increase project interfaces conflicts when different
contractors insist on their points of view
3.35 - - - -
9 Insufficient definition of projects boundaries at an
early stage of the project
3.35 - 3.75 3.17 3.57

94
Table 4.22 cont’d
IM Problem
Owner EPC and
Construction
Contractor
EPCM and
Construction
Management
Companies
Engineering
Consultant
Architecture
and
Architecture
and
Engineering
firms
10 Delay in established schedule of engineering,
procurement, and construction, and delay in owner
approval of completed tasks
3.34 3.07 3.18 3.16 3.48
11 Inexperience with building codes and trade union
practices
- 3.47 - 3.39 3.67
12 Discrepancies between the owners’ expectations
regarding project construction schedule, cost, and
quality
- 3.26 3.15 3.13 3.50
13 Weather and climate conditions problems - 3.25 - 3.16 -
14 Unclear contract details and poorly written contract - 3.19 3.19 - 3.54
15 Insufficient and inaccurate work drawings and
specifications
- 3.11 - - -
17 Lack of solid contracting strategy vision at an early
stage of the project
- - - - -
18 Application of fast-track engineering and
construction techniques
- - 3.42 3.28 -

95
Table 4.22 cont’d
IM Problem
Owner EPC and
Construction
Contractor
EPCM and
Construction
Management
Companies
Engineering
Consultant
Architecture
and
Architecture
and
Engineering
firms
19 Complete appraisal of bids to comprise an
assessment of contractor’s understanding of IM
- - 3.21 - -
20 No proper work packaging design and
subcontracting
- - 3.16 - -
21 Lack of personal experience of the project teams - - - 3.12 -
22 Lack of trust among different project parties - - - - 3.49
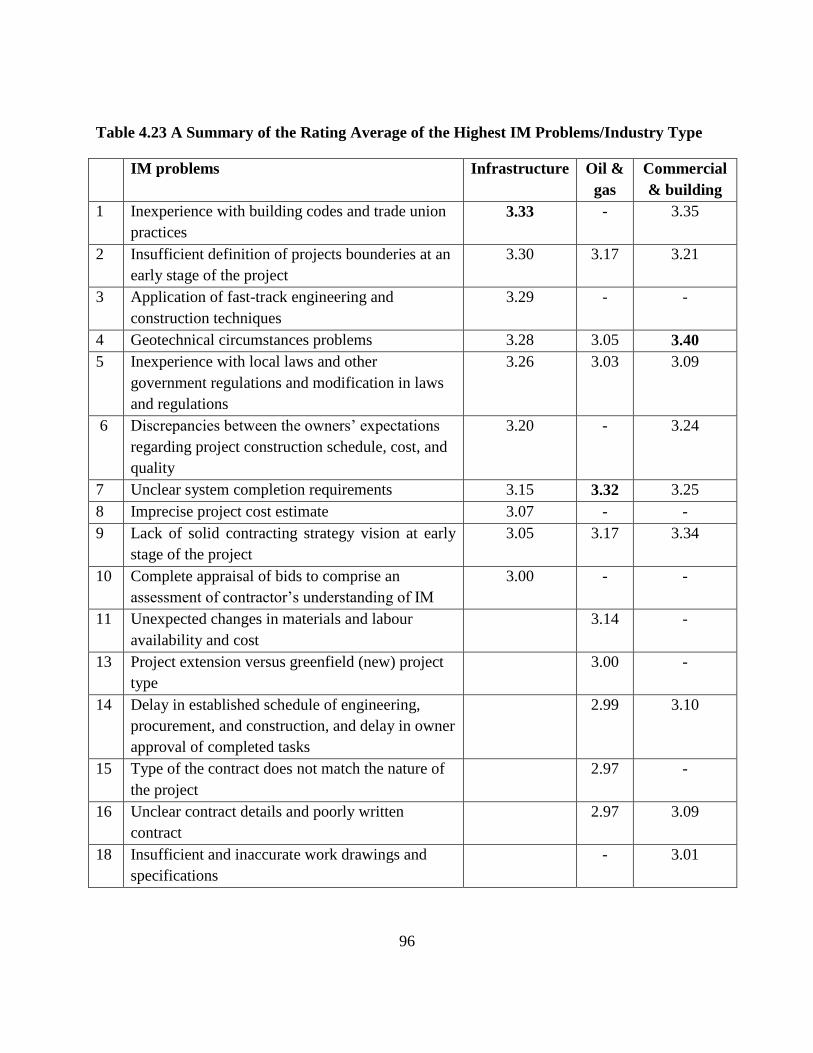
96
Table 4.23 A Summary of the Rating Average of the Highest IM Problems/Industry Type
IM problems Infrastructure Oil &
gas
Commercial
& building
1 Inexperience with building codes and trade union
practices
3.33 - 3.35
2 Insufficient definition of projects bounderies at an
early stage of the project
3.30 3.17 3.21
3 Application of fast-track engineering and
construction techniques
3.29 - -
4 Geotechnical circumstances problems 3.28 3.05 3.40
5 Inexperience with local laws and other
government regulations and modification in laws
and regulations
3.26 3.03 3.09
6 Discrepancies between the owners’ expectations
regarding project construction schedule, cost, and
quality
3.20 - 3.24
7 Unclear system completion requirements 3.15 3.32 3.25
8 Imprecise project cost estimate 3.07 - -
9 Lack of solid contracting strategy vision at early
stage of the project
3.05 3.17 3.34
10 Complete appraisal of bids to comprise an
assessment of contractor’s understanding of IM
3.00 - -
11 Unexpected changes in materials and labour
availability and cost
3.14 -
13 Project extension versus greenfield (new) project
type
3.00 -
14 Delay in established schedule of engineering,
procurement, and construction, and delay in owner
approval of completed tasks
2.99 3.10
15 Type of the contract does not match the nature of
the project
2.97 -
16 Unclear contract details and poorly written
contract
2.97 3.09
18 Insufficient and inaccurate work drawings and
specifications
- 3.01

97
Additionally, the top 10 frequent sources of IM problems were also studied according to the five
independent job title groups: (1) project controls, planning engineer, construction planner,
interface coordinator, and contract administrator, (2) project engineer, commissioning engineer ,
quality engineer, and lead (safety, procurement, etc.), (3) engineer (structural, mechanical,
electrical), and project engineering manager, (4) project manager, construction manager,
contractor and sub-contractor, (5) and architect. Based on equation 1, the 47 IM problems were
studied and summarized in 47 tables that show the rating average for each respondent’s title.
After that, the 47 tables were examined to determine the most critical problems for each
respondent’s title. Based on that, the top 10 IM problems for each respondent’s title type were
ranked and summarized. As an example, Table 4.24 summarized the rating average of the
highest IM problems for each respondent’s title type.
Generally, the different respondent’s title types are in agreement as to the top 10 problems. As
well, engineer and project engineering manager reported different IM problems, such as (1) lack
of knowledge about site circumstances by the project team members, (2) insufficient and
inaccurate work drawings and specifications, and (3) interfaces with other interdependent
projects.
In addition, the top 10 frequent sources of IM problems were further divided into four groups,
according to years of experience, as follows: (1) ≤9 years, (2) 10–14 years, (3) 15–19 years, and
(4) ≥20 years. Using equation 1, the 47 IM problems were studied and summarized in 47 tables
that show the rating average for each type of years of experience. After that, the 47 tables were
examined to determine the most critical problems for each years of experience type. Based on

98
that, the top 10 IM problems for each years of experience type were ranked and summarized.
Table 4.25 summarized the rating average of the highest IM problems for each years of
experience type. Generally, the different years of experience types are in agreement concerning
the top 10 problems.

99
Table 4.24 A Summary of the Rating Average of the Highest IM Problems for each Job Title
IM Problems
1. P
roje
ct c
on
trols
,
pla
nn
ing e
ngin
eer,
con
stru
ctio
n
pla
nn
er, in
terf
ace
coord
inato
r
2. P
roje
ct
engin
eer,
com
mis
sion
ing
engin
eer,
qu
ali
ty
engin
eer,
an
d l
ead
3. E
ngin
eer
an
d
pro
ject
engin
eeri
ng
man
ager
4. P
roje
ct
man
ager
,
con
stru
ctio
n
man
ager
,
con
tract
or
5. A
rch
itec
t
1 Inexperience with building codes and trade union practices 3.60 3.50 3.15 3.25 3.65
2
Slow in change orders, permits, and shop drawings
submission and approval
3.57 3.59 - - 3.88
3
Lack of solid contracting strategy vision at early stage of
the project
3.33 - 3.02 3.30 -
4 Type of contracting strategy; EP, EPC, and EPCM 3.28 3.28 3.28 3.55 3.62
5
Inexperience with the government auditing protocols and
procedures
3.26 3.61 3.19 - 3.58
6
Lack of knowledge about site circumstances by the project
team members
3.20 - - - -
7 Lack of trust among different project parties 3.19 - - 3.36
8 In the invitation to tender, identify the interface problems 3.18 - - - -
9
Type of organization structure, e.g., matrix organization
increases interface points
3.17 - - - -
10
Incapability to predict and resolve project’s problems
related to new technological techniques and materials
3.17 - - - 3.40
11 Weather and climate conditions problems - 3.75 3.18 - -

100
Table 4.24 cont’d
IM Problems
1.P
roje
ct c
on
trols
,
pla
nn
ing e
ngin
eer,
con
stru
ctio
n
pla
nn
er, in
terf
ace
coord
inato
r
2.P
roje
ct e
ngin
eer,
com
mis
sion
ing
engin
eer,
qu
ali
ty
engin
eer,
an
d l
ead
3)
En
gin
eer
&
pro
ject
engin
eeri
ng
man
ager
4.P
roje
ct
man
ager
,
con
stru
ctio
n
man
ager
,
con
tract
or
5.A
rch
itec
t
12 Application of fast-track engineering and construction
techniques
- 3.66 - 3.42 3.48
13 Unexpected changes in materials and labour availability
and cost
- 3.52 3.12 3.51 3.66
14 Geotechnical circumstances problems, e.g., lack of
information on the geotechnical examination
- 3.52 - 3.36 -
15 Complete appraisal of bids to comprise an assessment of
contractor’s understanding of interface management
- 3.43 - - -
16 Unclear contract details and poorly written contract - 3.33 - -
17 No proper work packaging design and subcontracting - - 3.07 3.23
18 Lack of knowledge about site circumstances by the project
team members
- - 3.07 - -
19 Insufficient and inaccurate work drawings and
specifications
- - 3.02 - 3.40
20 Interfaces with other interdependent projects - - 3.00
21 Increase project interfaces conflicts when different
contractors insist on their points of view
- - - 3.30 3.47
22 Lack of personal experience of the project teams - - - - 3.41

101
Table 4.25 A Summary of the Rating Average of the Highest IM Problems for each Year of
Experience
IM Problems ≤9
years
10–14
years
15–19
years
≥20
years
1 Lack of solid contracting strategy vision at early stage of
the project
3.62 3.19 3.60 3.26
2 Unclear system completion requirements 3.58 3.18 3.50 3.28
3 Insufficient definition of projects boundaries at an early
stage of the project
3.40 3.06 3.31 3.40
4 Type of the contract does not match the nature of the
project.
3.26 - - -
5 Inexperience with building codes and trade union
practices
3.23 3.29 3.26 3.23
6 Weather climate conditions problems 3.20 3.12 - 3.15
7 Geotechnical circumstances problems 3.10 3.08 3.25 3.46
8 Project extension versus greenfield (new) project type 3.04 3.06 - -
9 Type of contracting strategy; EP, EPC, and EPCM 3.01 - - -
10 Inexperience with local laws and other government
regulations and modification in laws and regulations
3.01 3.39 3.31 -
11 Unclear contract details and poorly written contract - 3.09 - -
12 Inexperience with the government auditing protocols
and procedures
- 3.08 - -
13 Unclear company standard operating procedures - - 3.36 -
14 Delay in established schedule of engineering,
procurement, and construction
- - 3.25 3.17
15 Lack of trust among different project parties - - 3.24 -
16 Unexpected changes in materials and labour availability
and cost
- - 3.22 3.22
17 Application of fast-track engineering and construction
techniques
- - - 3.21
18 Insufficient and inaccurate work drawings and
specifications
- - - 3.20

102
4.2.6 Multiple regression models.
In this study, the number of participants is 135 and there are six interface management factors
(six predictors), which indicates that this study has 22 times as many participants as predictor
variables (approximately 22 participants for each predictor variable); this exceeds the required
ratio of 5:1 (Brace et al., 2006). The following null hypotheses were proposed and examined
under this section. To examine the hypotheses, six multiple regression models were conducted
between the six different construction performance indicators (quality management, schedule
management, cost management, scope management, and safety management, and team work) as
dependent variables and six underlying interface problem factors as independent variables, using
IBM SPSS® Statistics version 20. The six multiple regression models can be used to predict the
factors that affecting each project performance indicator. Consequently, these models can be
used to predict overall project performance at the early stages of the projects. Hypothesis 5, 6, 7,
8, 9, and 10: There would be no significant relationships between the extracted factors and the
project performance indicators:
Quality
Schedule
Cost
Scope
Safety
Teamwork
The multiple regression analyses results indicated that the interface problem factor had a major
impact on the project performances. Appendix VII shows the results of the multiple-regression
analysis. The results of the multiple-regression models indicate that the interface problems
caused by the technical engineering and site issues factor, the information factor, the bidding and

103
contracting factor, and law and regulation factor were the strongest in influencing the schedule
project performance indicator as shown in Table 4.26, whereas the interface problems caused by
the technical engineering and site issues factor, the bidding and contracting factor, and the
information factor were the strongest to influence the cost project performance indicator. On the
other hand the problems caused by the management factor and the law and regulation factor had
the most influence on the rest of the project performance indicators, which are quality, scope,
safety, and teamwork. Readers can refer to Weshah et al., (2013b) for more details about the IM
problems listed under each IM factor. In summary, based on all the multiple regression results,
Table 4.26 shows that the management factor, law and regulation factor, and technical and site
issues factor are the most important factors affecting overall project performance. Many results
can be concluded out of Table 4.26, for example under the quality project performance indicator
the β for the management factor and the law and regulation factor were 0.487 and 0.285,
respectively, which indicated that the law and regulation factor influences the quality
management less than the management factor.
Table 4.26 Standard Deviation of Responses for Overall Project Performance
Factors Quality Schedule Cost Scope Safety Teamwork Overall
Performance
Mgt. 0.487 0.521 0.477 0.455 1.94
Inf. 0.225 0.218 0.443
Bid & cont. 0.181 0.259 0.44
Law & reg. 0.285 0.152 0.207 0.388 1.032
Tech. & site
issues
0.354 0.399 0.753

104
“One way of developing multiple correlation is to obtain the prediction equation for Y' in order to
compare the prediction value of the dependent variables with obtained Y” (Tabachnick & Fidell,
2001).
𝑌′ = 𝐴 + 𝐵1𝑋1 + 𝐵2𝑋2 + ⋯ + 𝐵𝐾𝑋𝐾 (2)
where
𝑌′ is the predicted value of Y, A is the value of 𝑌′ when all X are zero, B1 to BK represent
regression coefficients, and X1 to XK represent the independent variables” (Tabachnick & Fidell,
2001).
Based on equation (2) and Appendix VII, the predication equations for the:
Project quality performance is
𝑌′ = 0.529 + 0.621 𝑋1 + 0.248 𝑋2 (3)
where 𝑌′ is the project quality performance predicted value
𝑋1 is the management factor
𝑋2 is the law and regulation factor
An example of calculations of the project quality performance predicted value is as follows:
𝑌′ = 0.529 + 0.621(4.18) + 0.248(3.78) = 4.06
𝑋1 is equal to 4.18, which is the mean of the data under the management factor collected using
the questionnaire.
𝑋2 is equal to 3.78, which is the mean of the data under the law and regulation factor collected
using the questionnaire.
Project schedule performance is

105
𝑌′ = 0.824 + 0.434𝑋1 + 0.231𝑋1 + 0.199𝑋3 + 0.132𝑋4 (4)
where
𝑌′ is the project schedule performance predicted value
𝑋1 is the technical engineering and site issues factor
𝑋2 is the information factor
𝑋3 is the bidding and contracting factor
𝑋4 is the law and regulation factor
Project cost performance is
𝑌′ = 0.547 + 0.514𝑋1 + 0.301𝑋2 + 0.236𝑋3 (5)
where
𝑌′ is the project cost performance predicted value
𝑋1 is the technical engineering and site issues factor
𝑋2 is the bidding and contracting factor
𝑋3 is the information factor
Project scope performance is
𝑌′ = 0.532 + 0.684𝑋1 + 0.183𝑋2 (6)
where
𝑌′ is the project scope performance predicted value
𝑋1 is the management factor
𝑋2 is the law and regulation factor
Project safety performance is

106
𝑌′ = 0.407 + 0.724𝑋1 (7)
where
𝑌′ is the project safety performance predicted value
𝑋1 is the management factor
Project teamwork performance is
𝑌′ = 0.294 + 0.633𝑋1 + 0.321𝑋2 (8)
where
𝑌′ is the project teamwork performance predicted value
𝑋1 is the management factor
𝑋2 is the law and regulation factor
Based on the results of the aforementioned regression analysis, all the null hypotheses were
rejected.
4.2.7 Reliability.
The reliability statistical tool is usually used to assess the stability and consistency in survey
questions, to ensure that the questions are appropriately reliable and to present a certain
measurement by using Cronbach’s alpha. “Cronbach’s alpha measures how well a set of items
measures a single unidimensional latent construct” (Nunnally, 1978). In this research study, the
reliability analysis was conducted for examining the reliability of the six extracted IM factors to
ensure the correctness (accuracy) of the extracted factors. A value of 0.7 reliability coefficient or
higher is acceptable in the social sciences (Nunnally, 1978). Most of the Cronbach’s α values in
this study are greater than 0.85 except for the other interface problems factor, which is lower

107
than 0.70 with a value of 0.415, as shown in Table 4.27. Therefore, the variables in this research
study are considered reliable.
As discussed in the previous sections, the other interface problems factor consists of only two IM
problems, which will not impact the reliability of overall data including the 47 IM problems. In
addition, all the Cronbach’s α values of the reliability test of the six project performance
indicators are greater than 0.95, as shown in Table 4.28.
Table 4.27 Reliability Test of Interface Problem Factor
Table 4.28 Reliability Test of Project Performance Indicators
Indicator Name Quality
Mgt.
Schedule
Mgt.
Cost
Mgt.
Scope
Mgt.
Safety
Mgt.
Teamwork
Mgt.
Cronbach’s α 0.97 .97 .974 .968 .978 .97
4.3 Conclusions
This research began a comprehensive investigation to identify and classify interface problem
factors in Alberta’s construction projects through structured face-to-face interviews and
empirical questionnaires. The collected data were analyzed using factor analysis, Pearson’s
correlation matrix, and the one-way MANOVA test. Exploratory factor analysis was performed
to extract the factors and the latent structure of independent variables (interface problems).
Correlation between IM factors and different construction data was tested. The data analysis
Factor
Categories
Mgt.
factor
Inf.
factor
Bid & contr.
factor
Law & reg.
factor
Tech. Eng.
& site issues
factor
Others
factor
Cronbach’s α 0.902 0.865 0.899 0.875 0.881 0.416

108
results provided a comprehensive view of the main causes behind IM conflicts in Alberta’s
construction industry. The results identified six IM factors affecting construction project
performance in Alberta. The study concluded that the management factor is the factor most
impacting IM performance. Although there are strong relationships between the six extracted
factors and the company type, job title type, and years of experience, there are no relationships
between the six extracted IM factors and the industry type.
Based on the aforementioned conclusions that identified major interface management factors
impacting construction project performance, a new integrated IM model was introduced to
enhance project performance by developing multiple regression models. These models were used
to evaluate and predict project performance based on IM at a project’s early stages.
The results of the multiple regression models indicate that the interface problems caused by the
technical engineering and site issues factor, the information factor, the bidding and contracting
factor, and the law and regulation factor had the strongest influence on the schedule project
performance indicator. The interface problems caused by the technical engineering and site
issues factor, the bidding and contracting factor, and the information factor had the strongest
influence on the cost project performance indicator. On the other hand, the problems caused by
the management factor and the law and regulation factor had the most influence on the rest of the
project performance indicators, i.e., quality, scope, safety, and teamwork. Readers can refer to
Weshah et al. (2013) for more details about the IM problems listed under each IM factor.

109
4.4 Summary and Connection with the Next Chapters
The findings of this chapter present a basis for enhancing overall project performance and the
interfaces by (a) reviewing the interfaces in depth during the engineering/design phase of
construction projects (Chapter 5), (b) developing a conceptual framework (RIBA framework) in
order to highlight the IM areas consider critical and use case models to study the IM
relationships among owner, contractor and designer throughout project lifecycle using the
Microsoft Visio® flowcharts and UML use case diagrams (Chapter 6), and (c) developing
suggestions for improving and enhancing IM that are adequate to all participants engaged in
construction projects (Chapter 6).
110
Chapter Five: Factor Analysis and Multiple Regression Analysis of Interface Management
during Engineering/Design Phase
5.1 Chapter Overview
Two web-based online surveys were performed with participants from industry throughout the
project lifecycle and during the engineering/design phase, as shown in Appendix III and IV. This
chapter provides full details of the second survey that was conducted during the
engineering/design phase. This part of the research study consists of deeply studying the
interfaces during the engineering/design phase of projects using a web-based questionnaire with
participants from industry. This chapter provides analysis of the second survey results and
discussion of the findings and conclusions. The contents of this chapter will be submitted to the
Journal of Construction Engineering.
5.2 Analysis of Survey Results and Discussion of Findings
5.2.1 Respondent’s profile.
The number of valid responses is 161. The highest number of responses was received from
project manager and engineers (structural, mechanical, electrical), followed by project control,
project engineer, and architect, as shown in Table 5.1. In addition, in terms of the company
types, the highest number of responses was obtained from owners, EPC, EPCM, and engineering
consultants, as shown in Table 5.2. The questionnaire participants are in different fields and
include 99 participants working in the oil and gas industry and 29 working in commercial and
buildings, as shown in Table 5.3. Finally, more than half of the questionnaires’ contributors have
≥20 years of experience, as shown in Table 5.4. The participants in this study are well-educated,

111
as shown in Table 5.5. Finally, most of the participants’ current projects are high-complexity
projects, as shown in Table 5.6.
Table 5.1 Respondents’ Job Profiles
Respondents’ Job Profiles Number of
Responses
Percentage of
Responses (%)
Lead (safety, procurement, etc.) 7 4
Project controls 18 11
Interface coordinator 12 8
Project engineer 18 11
Quality engineer 2 1
Planning engineer 2 1
Project Manager 36 22
Contractor/sub-contractor 3 2
Engineer (structural, mechanical, electrical) 22 14
Architect 16 10
Project engineering manager 11 7
Other 14 9
Table 5.2 Respondents’ Company Types
Respondents’ Company Types Number of
Responses
Percentage of
Responses (%)
Owner 47 29
EPC 34 21
EPCM 19 12
Engineering consultant 18 11
Architecture firms 3 2
Architecture and engineering firms 11 7
Construction management company 7 4
Others 22 14

112
Table 5.3 Respondents’ Industry Types
Respondents’ Industry Types Number of
Responses
Percentage of
Responses (%)
Infrastructure 18 11
Oil and gas 99 61
Transportation 6 4
Commercial and buildings 29 18
Other sectors 9 6
Table 5.4 Respondents’ Years of Experience Types
Respondents’ Years of Experience Types Number of
Responses
Percentage of
Responses (%)
≤5 years 11 7
6–9 years 18 11
10–14 years 31 19
15–19 years 15 9
≥20 years 86 54
Table 5.5 Respondents’ Level of Education Types
Respondents’ Level of Education Types Number of
Responses
Percentage of
Responses (%)
Diploma 10 6
Post diploma 9 6
BSc 74 46
MSc 49 30
PhD 13 8
Others 6 4
Table 5.6 Respondents’ Level of Complexity Types
Respondents’ Level of Complexity Types Number of
Responses
Percentage of
Responses (%)
High complexity 88 55
Medium complexity 59 36
Low complexity 14 9

113
5.2.2 Pearson product-moment correlation.
One of the requirements to get a reasonable factor analysis technique is to have a significant
correlation between the 22 identified interface management (IM) problems. Pearson product-
moment correlation (PPMC) values, given in Appendix VIII, show that although 67% of the 22
interface problems show medium to high relations and are correlated positively, 30% show low
to weak relations, and 2% show high and very strong relations. Therefore, the collected data are
reasonable to use in the factor analysis technique. The reader can refer to Chapter four to get
more information about the PPMC.
5.2.3 Factor influencing interface management.
Factor analysis is “a statistical technique used to identify a relatively small number of factors that
can be used to represent the relationships among sets of many interrelated variables” (R. Huang
et al., 2008). Chapter four has information about the factor analysis technique. With eigenvalues
greater than 1, results show that four factors can be extracted and identified during the
engineering/design phase, as shown in the Kaiser’s normalization criterium results in Figure 5.1.
Tables 5.7–5.10 provide the list of the four extracted factors, namely management, information,
law and regulation, and other interface problems.

114
Figure 5.1 Scree Plot of 22 Interface Problems
Table 5.7 Summary of Factor Analysis (Management Factor)
No
IM Problem
Mgt.
factor
Inf.
factor
Law &
reg.
factor
Others
factor
1 Lack of enough negotiation and communication
and coordination
.601 .155 .202 .189
2 Financial difficulties .615 .020 .090 .330
3 Poor decision making .700 .330 .111 –.002
4 Limited skills for labour & engineering .480 .164 .414 .107
5 Engineering process problems related to
interfaces
.629 .345 .168 .032
7 Lack of project management .573 .477 .022 .103
9 Planning and scheduling problems .511 .113 –.040 .424
18 Delay in established schedule of engineering,
procurement, and construction, and delay in
owner approval of completed tasks
.552 .196 .342 .198
Eigenvalue =1

115
Table 5.8 Summary of Factor Analysis (Information Factor)
No IM Problem
Mgt.
factor
Inf.
factor
Law &
reg.
factor
Others
factor
6 Information problems .478 .627 .159 .007
8 Lack of interface management system .267 .685 .001 .251
10 Type of organization structure –.104 .395 –.021 .255
12 Undefined reporting structure and
responsibilities
.247 .669 .123 .147
13 Insufficient and lack of alignment among WBS,
CWBS, CBS, and OBS
.248 .472 .092 .513
16 Insufficient and inaccurate work drawings and
specifications
.177 .719 .307 .121
17 No proper work packaging design and
subcontracting
.200 .699 .341 .100
Table 5.9 Summary of Factor Analysis (Law and Regulation Factor)
No. IM Problem Mgt.
factor
Inf.
factor
Law & reg.
factor
Others
factor
20 Inexperience with local laws and other
government regulations and modifications in
laws and regulations
.141 .254 .841 .140
21 Inexperience with building codes; trade
union practices
.265 .285 .795 .111
Table 5.10 Summary of Factor Analysis (Others Factor)
No. IM Problem
Mgt.
factor
Inf.
factor
Law & reg.
factor
Others
factor
11 Interfaces with other interdependent projects .157 .165 .372 .585
14 Lack of personal experience of the project
teams
0.080 .180 .113 0.653
15 Lack of trust among different project parties 0.126 .045 .220 .625
19 Type of the contract does not match the
nature of the project
.304 –.031 .150 .669
22 Unclear system completion requirements .325 .088 .206 .599

116
5.2.3.1 Correlation between emergent factors.
The correlation coefficients among the four extracted factors, calculated using the factor analysis
technique, are shown in Table 5.11. The results show that these factors are significantly and
positively correlated.
Table 5.11 Correlation Coefficients between Four Extracted Factors
Mgt. factor Inf. factor Law & reg.
factor
Others
factor
Mgt. factor 1
Inf. factor .737 1
Law & reg. factor .554
.540 1
Others factor .731 .779 .562 1
5.2.4 Analysis of the variance (MANOVA) between IM factor and different data.
This section provides results of the test of normality and research hypothesis between IM factors
and different construction data. For more details, these hypotheses examine the relationships
between the IM factors and different construction data: company type, industry type, title type,
and years of experience.
5.2.4.1 Normality.
The test of normality shows that all the variables are consistent with the normality assumptions
and homogeneity of variance.
5.2.4.2 Research hypothesis between IM factors and different construction data.
The MANOVA technique was applied to decide whether the four factors (variables) have an
important impact on IM among different groups type (independent variables: company type,
industry type, title type, and years of experience). Four hypotheses were presented and examined

117
in this research study using the one-way MANOVA test. Tables 5.12, 5.14, 5.16, 5.18, and 5.20
show the means, standard deviations, and the numbers of cases for the four dependent variables
(IM extracted factors) and the independent variables (groups) of the company type, industry
type, title type, and years of experience, complexity of the projects. Tables 5.13, 5.15, 5.17, 5.19,
and 5.21 summarize the MANOVA results. Results show that the information factor and law and
regulation factor impact IM most during the engineering/design phase. These results are
expected and make sense during this phase. The following section provides full details regarding
the tested hypotheses.
1. Job title group related to factor group
Based on five groups, the four IM factors were examined. Five independent job title groups were
included in the respondent’s title type: (1) project controls, planning engineer, interface
coordinator; (2) project engineer, quality engineer, and lead (safety, procurement, etc.);
(3) engineer (structural, mechanical, electrical) and project engineering manager; (4) project
manager, contractor, and sub-contractor; (5) architect. The following hypothesis (Hypothesis 1)
was presented and examined; there would be no significant difference in the means between the
impact of the four IM extracted factors (dependent variables) and respondent’s title groups as
independent variables.
Table 5.12 shows that for the calculated means, the information and the law and regulation
factors are the factors that most impact IM, followed by the management factor. More results
could be listed for each group, as shown in Table 5.12. For example, the project controls people,
planning engineer, and interface coordinator consider the information factor among other groups

118
as the highest factor impacting IM performance. This result was expected because they merely
support the project and other project participants provide them with the information. On the other
hand, the project engineer, quality engineer, and lead consider the law and regulation factor as
the factor impacting IM the most. Moreover, Table 5.13 shows that the overall MANOVA is
statistically significant (F16,400.849 = 2.720; p = 0.000). In addition, there is almost a significant
difference between the five groups. Therefore, hypothesis 1 can be rejected. For more details,
three out of four factors are statistically significant: the management factor (F4,134 = 2.449; p =
0.049), the information factor (F4,134 = 3.126; p = 0.017), and the law and regulation factor (F4,134
= 2.578; p = 0.040), as shown in Table 5.13. Therefore, this result specifies that these three
factors are affected by different respondent’s title groups. There are major differences between
group 4 and group 5 under the management factor with p-values equal to 0.076. This indicates
that between group 4 and group 5 the impact of this factor on IM performance is significantly
different. Other findings could be summarized from Tables 5.12 and 5.13.

119
Table 5.12 Calculated Means (Title Type Groups and Extracted IM Factors)
Extracted IM Factors
Title Type Group
Mgt.
factor
(X,SD,N)
Inf.
factor
(X,SD,N)
Law & reg.
factor
(X,SD,N)
Others
factor
(X,SD,N)
1. Project controls, planning engineer,
interface coordinator
4.54,
0.68, 31
5.56,
0.94, 31
4.66,
1.13, 31
4.01,
0.88, 31
2. Project engineer, quality engineer, and lead 4.57,
0.68, 27
5.02,
0.75, 27
5.11, 0.91,
27
4.41,
0.73, 27
3. Engineer (structural, mechanical, etc.) and
project eng. manager
4.32,
0.54, 28
4.44,
0.82, 28
4.63, 0.95,
28
4.16,
0.75, 28
4.Project manager, contractor, and sub-
contractor
4.58,
0.54, 39
4.82,
0.68, 39
4.64, 1.18,
39
4.46,
0.66, 39
5. Architect 4.08,
0.62, 14
4.35,
0.46, 14
4.00, 1.04,
14
4.27,
0.63, 14
Total 4.47 4.67 4.67 4.26
Table 5.13 MANOVA Results (Title Type Groups and Extracted IM Factors)
Source F df1,df2 P
Overall 2.720 16,400.849 0.000
Management factor 2.449 4,134 0.049
Information factor 3.126 4,134 0.017
Law factor 2.578 4,134 0.040
Other factors 1.981 4,134 0.101
*Management factor group comparison
Group 4 and Group 5 0.076
*Information factor group comparison
Group 2 and Group 3 0.049
*Law and fegulation factor group comparison
Group 5 and Group 2 0.016
*Included only the significant pairwise comparison
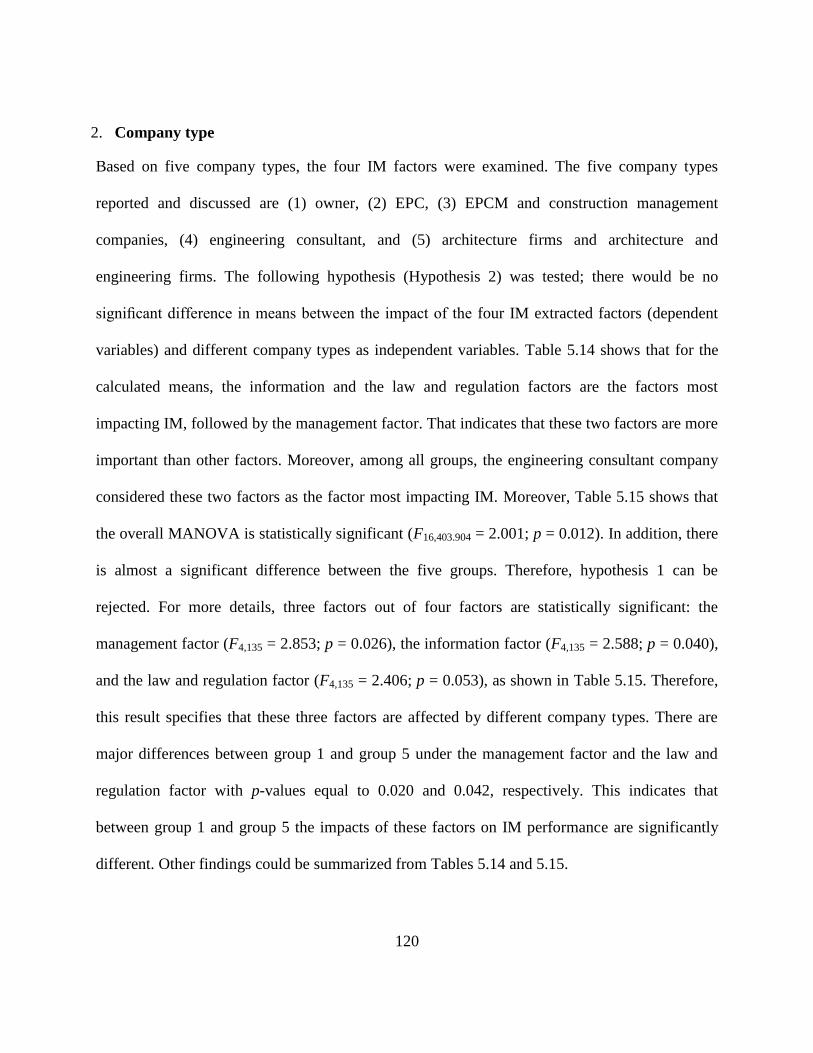
120
2. Company type
Based on five company types, the four IM factors were examined. The five company types
reported and discussed are (1) owner, (2) EPC, (3) EPCM and construction management
companies, (4) engineering consultant, and (5) architecture firms and architecture and
engineering firms. The following hypothesis (Hypothesis 2) was tested; there would be no
significant difference in means between the impact of the four IM extracted factors (dependent
variables) and different company types as independent variables. Table 5.14 shows that for the
calculated means, the information and the law and regulation factors are the factors most
impacting IM, followed by the management factor. That indicates that these two factors are more
important than other factors. Moreover, among all groups, the engineering consultant company
considered these two factors as the factor most impacting IM. Moreover, Table 5.15 shows that
the overall MANOVA is statistically significant (F16,403.904 = 2.001; p = 0.012). In addition, there
is almost a significant difference between the five groups. Therefore, hypothesis 1 can be
rejected. For more details, three factors out of four factors are statistically significant: the
management factor (F4,135 = 2.853; p = 0.026), the information factor (F4,135 = 2.588; p = 0.040),
and the law and regulation factor (F4,135 = 2.406; p = 0.053), as shown in Table 5.15. Therefore,
this result specifies that these three factors are affected by different company types. There are
major differences between group 1 and group 5 under the management factor and the law and
regulation factor with p-values equal to 0.020 and 0.042, respectively. This indicates that
between group 1 and group 5 the impacts of these factors on IM performance are significantly
different. Other findings could be summarized from Tables 5.14 and 5.15.

121
Table 5.14 Calculated Means (Company Type Groups and Extracted IM Factors)
Extracted
IM Factors
Company type
Groups
Mgt. factor
(X,SD,N)
Inf. factor
(X,SD,N)
Law & reg.
factor
(X,SD, N)
Others factor
(X,SD,N)
1. Owner 4.64, 0.62, 47 4.78, 0.85, 47 4.90, 1.01, 47 4.28, 0.83, 47
2. EPC 4.38, 0.54, 34 4.47, 0.73, 34 4.59, 1.14, 34 4.04, 0.68, 34
3. EPCM and
construction
management companies
4.52, 0.57, 27 4.78, 0.75, 27 4.59, 1.00, 27 4.31, 0.71, 27
4. Engineering
consultant
4.58, 0.55, 18 5.03, 0.73, 18 4.94, 1.06, 18 4,54, 0.61, 18
5. Architecture firms and
architecture and
engineering firms
4.09, 0.62, 14 4.35, 0.46, 14 4.00, 1.04, 14 4.27, 0.63, 14
Total 4.49 4.69 4.69 4.26
Table 5.15 MANOVA Results Table (Company Type Groups and Extracted IM Factors)
Source F df1,df2 p
Overall 2.001 16, 403.904 0.012
Management factor 2.853 4, 135 0.026
Information factor 2.588 4, 135 0.040
Law factor 2.406 4, 135 0.053
Others factor 1.482 4, 135 0.211
*Management factor group comparison
Group 1 and Group 5 0.020
*Regulation factor group comparison
Group 1 and Group 5 0.042
*Included only the significant pairwise comparison

122
3. Industry type
Based on three industry types, the four IM factors were examined. The three industry types
reported and discussed are (1) infrastructure, (2) oil and gas, and (3) commercial and building.
The following hypothesis (Hypothesis 3) was tested; there would be no significant difference in
means between the impact of the four IM extracted factors (dependent variables) and different
industry types as independent variables.
Table 5.16 shows the calculated means; the information factor impacts IM the most, followed by
the information and the law and regulation factors. That indicates that this factor is more
important than other factors. Moreover, Table 5.17 shows that the overall MANOVA is
statistically significant (F8,284.00 = 2.182; p = 0.029). In addition, there is almost a significant
difference between the three groups. Therefore, hypothesis 1 can be rejected. For more details,
two factors out of four factors are statistically significant: the management factor (F2,145 = 4.572;
p = 0.012) and the information factor (F2,145 = 4.020; p = 0.020), as shown in Table 5.17.
Therefore, this result specifies that these two factors are affected by different industry types. The
oil and gas industry and commercial and building industry considered the law and regulation
factor as the most important factor affecting IM followed by the information factor. There are
major differences between group 1 and group 3 under the management factor with p-values equal
to 0.008. This indicates that between group 1 and group 3 the impacts of these factors on IM
performance are significantly different. There are major differences between group 1 and group 2
under the information factor with p-values equal to 0.024. This indicates that between group 1
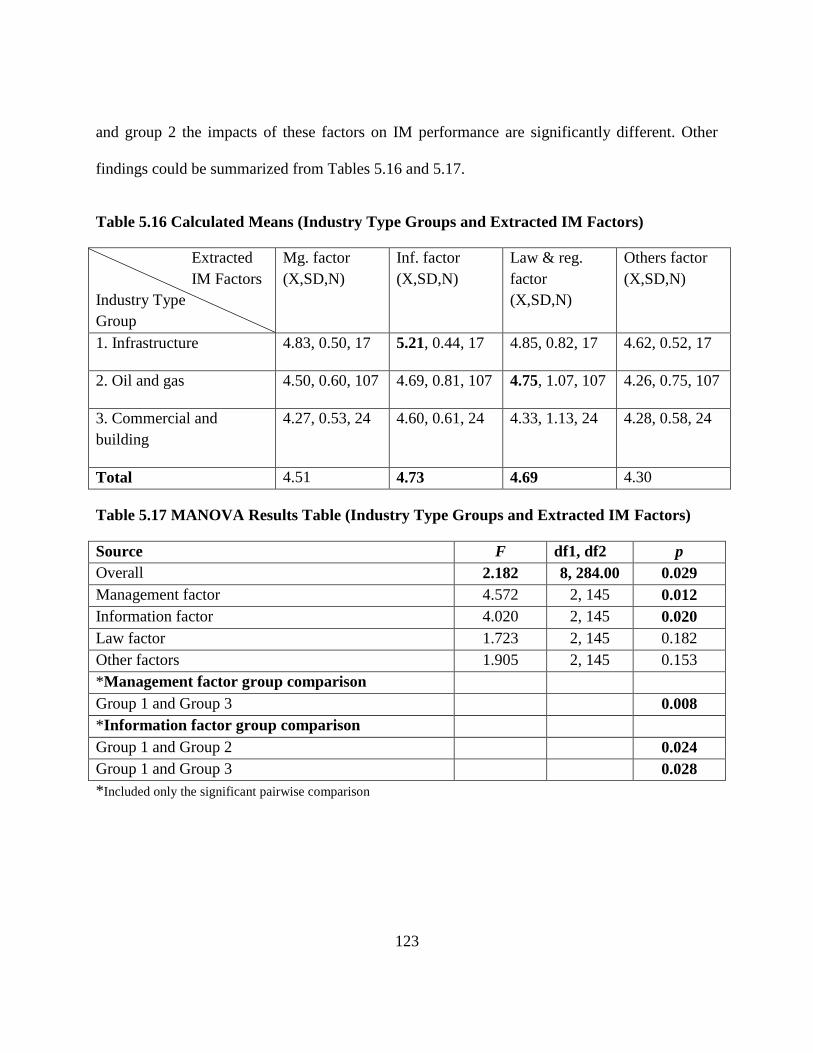
123
and group 2 the impacts of these factors on IM performance are significantly different. Other
findings could be summarized from Tables 5.16 and 5.17.
Table 5.16 Calculated Means (Industry Type Groups and Extracted IM Factors)
Extracted
IM Factors
Industry Type
Group
Mg. factor
(X,SD,N)
Inf. factor
(X,SD,N)
Law & reg.
factor
(X,SD,N)
Others factor
(X,SD,N)
1. Infrastructure 4.83, 0.50, 17 5.21, 0.44, 17 4.85, 0.82, 17 4.62, 0.52, 17
2. Oil and gas 4.50, 0.60, 107 4.69, 0.81, 107 4.75, 1.07, 107 4.26, 0.75, 107
3. Commercial and
building
4.27, 0.53, 24 4.60, 0.61, 24 4.33, 1.13, 24 4.28, 0.58, 24
Total 4.51 4.73 4.69 4.30
Table 5.17 MANOVA Results Table (Industry Type Groups and Extracted IM Factors)
Source F df1, df2 p
Overall 2.182 8, 284.00 0.029
Management factor 4.572 2, 145 0.012
Information factor 4.020 2, 145 0.020
Law factor 1.723 2, 145 0.182
Other factors 1.905 2, 145 0.153
*Management factor group comparison
Group 1 and Group 3 0.008
*Information factor group comparison
Group 1 and Group 2 0.024
Group 1 and Group 3 0.028
*Included only the significant pairwise comparison

124
4. Years of experience
The four extracted IM factors were analyzed by four groups. Years of experience includes the
four groups (1) ≤9 years, (2) 10–14 years, (3) 15–19 years, and (4) ≥20 years.
The following hypothesis (Hypothesis 4) was proposed and examined; there would be no
significant difference in means between the impact of the four IM extracted factors (dependent
variables) and total years of experience groups as independent variables. Table 5.18 shows that
for the calculated means, the information and the law and regulation factors are the factors most
impacting IM, followed by the management factor. That indicates that these two factors more
important than other factors. Moreover, regardless of the years of experience, the highest years of
experience group (≥20 years) and the lowest years of experience group (≤9 years) ranked the
factors affecting IM performance in the same order. Both groups considered the law and
regulation and information factors as the factors most affecting IM performance, followed by the
management factor. Moreover, Table 5.19 shows that the overall MANOVA is statistically
significant (F12,402.440 = 1.730; p = 0.058). In addition, there is almost a significant difference
between the five groups. Therefore, hypothesis 1 can be rejected. For more details, four factors
are statistically significant: the management factor (F3,155 = 3.914; p = 0.010), the information
factor (F3,155 = 4.674; p = 0.040), the law and regulation factor (F3,155 = 2.226; p = 0.087), and
others factor (F3,155 = 2.299; p = 0.080), as shown in Table 5.19. Therefore, this result specifies
that these four factors are affected by different years of experience groups. There are major
differences between group 1 and group 4 under the management factor, the information factor,
and the law and regulation factor with p-values equal to 0.044, 0.011, and 0.052, respectively.

125
This indicates that between group 1 and group 4, the impacts of these factors on IM performance
are significantly different. Other findings could be summarized from Tables 5.18 and 5.19.
Table 5.18 Calculated Means (Years of Experience Groups and Extracted IM Factors)
Extracted IM
Factors
Years of
Experience
Group
Mgt. factor
(X,SD,N)
Inf. factor
(X,SD,N)
Law & reg.
factor
(X,SD,N)
Others factor
(X,SD,N)
1. ≤9 years 4.24, 0.53, 27 4.36, 0.69, 27 4.24, 1.14, 27 4.01, 0.68, 27
2. 10–14 years 4.37, 0.69, 31 4.49, 1.00, 31 4.69, 0.92, 31 4.19, 0.94, 31
3. 15–19 years 4.76, 0.58, 15 4.87, 0.59, 15 4.73, 1.34, 15 4.30, 0.61, 15
4. ≥20 years 4.57, 0.55, 86 4.90, 0.66, 86 4.84, 1.01, 86 4.40, 0.65, 86
Total 4.49 4.72 4.72 4.28
Table 5.19 MANOVA Results Table (Years of Experience Groups and IM Factors)
Source F df1,df2 p
Overall 1.730 12,402.440 0.058
Management factor 3.914 3,155 0.010
Information factor 4.674 3,155 0.040
Law factor 2.226 3,155 0.087
Others factor 2.299 3,155 0.080
*Management factor group comparison
Group 1 and Group 3 0.027
Group 1 and Group 4 0.044
*Information factor group comparison
Group 1 and Group 4 0.011
*Regualtion factor group comparison
Group 1 and Group 4 0.052
*Included only the significant pairwise comparison

126
5. Project complexity
The four extracted IM factors were analyzed by three levels of project complexity: (1) high,
(2) medium, and (3) low. The following hypothesis (Hypothesis 5) was proposed and examined;
there would be no significant difference in means between the impact of the four IM extracted
factors (dependent variables) and level of project complexity groups as independent variables.
Table 5.20 shows that for the calculated means, the information and the law and regulation
factors are the factors most impacting IM, followed by the management factor. That indicates
that these two factors are more important than other factors. Table 5.21 shows that, the overall
MANOVA is not statistically significant (F8,300.000 = 0.630; p = 0.753). Consequently,
hypothesis 3 can be accepted. There was no statistically significant difference between the IM
factors and the level of project complexity. Consistent with these results, a follow up univariate
test presented no significant results among level of project complexity types. Therefore, the
conclusion is that the IM factors are not affected by the level of project complexity types. This
result was not expected and needs to be studied more in future research.
Table 5.20 Calculated Means (Level of Complexity Groups and Extracted IM Factors)
Extracted IM
Factors
Years of
Experience Group
Mgt. factor
(X,SD,N)
Inf. factor
(X,SD,N)
Law & reg.
factor
(X,SD,N)
Others factor
(X,SD,N)
1. High complexity 4.56, 0.63, 88 4.77, 0.80, 88 4.76, 1.03, 88 4.33, 0.76, 88
2. Medium complexity 4.42, 0.54, 60 4.67, 0.73, 60 4.70, 1.05, 60 4.26, 0.59, 60
3. Low complexity 4.49, 0.57, 8 4.48, 0.78, 8 4.31, 0.96, 8 3.98, 1.10, 8
Total 4.51 4.72 4.72 4.28

127
Table 5.21 MANOVA Results Table (Level of Complexity Groups and IM Factors)
Source F df1, df2 p
Overall 0.630 8, 300.000 0.753
Management factor 0.958 2, 153 0.386
Information factor 0.731 2, 153 0.483
Law factor 0.701 2, 153 0.498
Others-factor 0.911 2, 153 0.404
5.2.5 Top 10 interface problems that affect IM.
What are the most critical problems affecting each aspect of IM during the engineering/design
phase of EPC projects? The cross-tabulated analysis and the ranking factor process method were
used to examine the frequency of the 22 IM problems. Four areas were studied with the 22 IM
problems, including company types, industry types, years of experience, and respondent’s title.
The five company types listed and discussed are (1) owner, (2) EPC, (3) EPCM and construction
management companies, (4) engineering consultant, and (5) architecture firms and architecture
and engineering firms. The 22 IM problems were studied and summarized in 22 tables that show
the rating average for each company type. The following equation is used to calculate the rating
average Yj:
𝑌𝑗(%) =∑ 𝑎𝑖𝑗𝑖
∑ 𝑏𝑖𝑗×𝑛𝑖100 (1)
where aij is the weighting scale of the linked scale i for company j, bij is the number of responses
of linked scale i for company j, and n is the number of responses in the survey. The reader can
refer to Chapter 4 to get more information about the application of this equation.

128
Accordingly, the 22 tables were created to find the company type that considers each of the 22
IM problems the most critical. Based on the data from the 22 tables, the top 10 IM problems for
each company type were ranked and summarized, as shown in Table 5.22. It should be realized
that the five company types are in agreement over the 10 general IM problems (not necessary, in
the same rank) with the exception of company type 5 (architecture firms and architecture and
engineering firms), as they reported different IM problems, such as type of the contract does not
match the nature of the project. In addition, the following three companies, EPCM and
construction management companies, engineering consultant, and architecture firms and
architecture and engineering firms considered the lack of personal experience of the project
teams as one of the top 10 IM problems.
Table 5.22 A Summary of the Rating Average of the Highest IM Problems for each
Company Type
No.
IM Problem
1. O
wn
er
2. E
PC
an
d
Con
stru
ctio
n
Con
tract
or
3. E
PC
M a
nd
Con
stru
ctio
n
Man
agem
ent
Com
pan
ies
4. E
ngin
eeri
ng
Con
sult
an
t
5. A
rch
itec
ture
firm
s an
d
Arc
hit
ectu
re
an
d
En
gin
eeri
ng
1 Insufficient and inaccurate
work drawings and
specifications
3.61 3.22 3.60 3.79 3.05
2 Lack of project management 3.54 3.40 3.27 3.47 -
3 Inexperience with building
codes; trade union practices
3.53 3.32 3.31 3.61 2.96
4 Inexperience with local laws
and other government
regulations and modification
in laws and regulations
3.48 3.24 3.25 3.45 -

129
Table 5.22 cont’d
No.
IM Problem
1. O
wn
er
2. E
PC
an
d
Con
stru
ctio
n
Con
tract
or
3. E
PC
M a
nd
Con
stru
ctio
n
Man
agem
ent
Com
pan
ies
4. E
ngin
eeri
ng
Con
sult
an
t
5. A
rch
itec
ture
firm
s an
d
Arc
hit
ectu
re
an
d
En
gin
eeri
ng
5 Unclear system completion
requirements
3.38 3.32 3.29 3.36 2.93
6 No proper work packaging
design and subcontracting
3.32 3.11 3.44 3.66 3.19
7 Undefined reporting structure
and responsibilities
3.32 3.12 3.29 3.34 2.99
8 Lack of trust among different
project parties
3.32 3.14 3.33 3.85 -
9 Delay in established schedule
of engineering, procurement,
and construction, and delay in
owner approval of completed
tasks
3.29 3.32 3.31 3.31 2.99
10 Insufficient and lack of
alignment among WBS,
CWBS, CBS, and OBS
3.18 2.98 - - -
11 Lack of personal experience of
the project teams
- - 3.29 3.35 3.20
12 Type of the contract does not
match the nature of the project
- - - - 3.24
13 Planning and scheduling
problems
- - - - 3.00
In the same steps aforementioned for the area of company types, the top 10 frequent sources of
IM problems were also evaluated and summarized based on the area of industry types. Three
industry groups were included: (1) infrastructure, (2) oil and gas, and (3) commercial and
building and transportation. Based on equation 1, the 22 IM problems were studied and

130
summarized in 22 tables that show the rating average for each industry type. After that, the 22
tables were studied to determine the most critical problems for each industry type. Based on that,
the top 10 IM problems for each industry type were ranked and summarized as shown in
Table 5.23. Table 5.23 summarized the rating average of the highest IM problems for each
industry type. Generally, the top 10 problems based on the three industry types are similar but
not necessarily in the same rank and order.
Table 5.23 A Summary of the Rating Average of the Highest IM Problems for each
Industry Type
IM problems
Infr
ast
ruct
ure
Oil
an
d g
as
Com
merc
ial
an
d b
uil
din
g
1 Insufficient and inaccurate work drawings and specifications 3.62 3.28 3.31
2 No proper work packaging design and subcontracting 3.58 3.12 3.24
3 Lack of project management 3.48 3.20 2.86
4 Undefined reporting structure and responsibilities 3.47 2.99 3.09
5 Unclear system completion requirements 3.44 3.20 2.83
6 Lack of trust among different project parties 3.43 3.14 3.07
7 Delay in established schedule of engineering, procurement, and
construction, and delay in owner approval of completed tasks
3.36 3.15 2.96
8 Inexperience with building codes, by-laws, statutes and other
government regulations
3.30 3.24 3.04
9 Insufficient and lack of alignment among WBS, CWBS, CBS, and
OBS
3.29 - 2.92
10 Inexperience with local laws and other government regulations and
modification in laws and regulations
3.26 3.18 -
11 Lack of personal experience of the project teams - 2.92 3.11

131
Furthermore, the top 10 frequent sources of IM problems were also examined based on the area
of respondent’s title. Five independent job title groups were included in the respondent’s title
type: (1) project controls, planning engineer, interface coordinator; (2) project engineer, quality
engineer, and lead (safety, procurement, etc.); (3) engineer (structural, mechanical, electrical)
and project engineering manager; (4) project manager, contractor and sub-contractor;
(5) architect. Using equation number 1, the 22 IM problems were studied and listed in 22 tables
that display the rating average for each respondent’s title. After that, the 22 tables were evaluated
to determine the most critical problems for each respondent’s title. Table 5.24 shows the top 10
IM problems for the five respondent’s title types. It should be realized that the five respondent’s
title types are in agreement over the 10 general IM problems (not necessarily in the same rank)
with the exception of respondent’s title type 5 (architect), as they reported different IM problems,
such as (1) type of the contract does not match the nature of the project and (2) planning and
scheduling problems.

132
Table 5.24 A Summary of the Rating Average of the Highest IM Problems for each Job
Title
IM Problems
Pro
ject
con
trols
,
pla
nn
ing e
ngin
eer,
inte
rface
coord
inato
r
Pro
ject
en
gin
eer,
qu
ali
ty e
ngin
eer,
an
d
lead
En
gin
eer
an
d p
roje
ct
engin
eeri
ng m
an
ager
Pro
ject
man
ager,
con
tract
or
Arc
hit
ect
1 Lack of project management 3.54 3.39 3.21 3.48 -
2 Inexperience with building codes; trade union
practices
3.43 3.65 3.31 3.39 2.98
3 Insufficient and inaccurate work drawings and
specifications
3.43 3.78 3.29 3.61 3.07
4 Delay in established schedule of engineering,
procurement, and construction
3.37 3.36 3.21 3.47 3.03
5 Unclear system completion requirements 3.36 3.62 3.21 3.34 2.95
6 Lack of trust among different project parties 3.29 3.49 3.43 3.46 -
7 Inexperience with local laws and other
government regulations and modification in
laws and regulations
3.27 3.70 3.34 3.28 -
8 No proper work packaging design and
subcontracting.
3.23 3.76 3.26 3.38 3.24
9 Undefined reporting structure and
responsibilities
3.14 3.43 3.07 3.47 3.01
10 Insufficient and lack of alignment among
WBS, CWBS, CBS, and OBS
3.04 - 3.10 - 2.97
11 Lack of personal experience of the project
teams
- 3.21 - 3.30 3.22
12 Type of the contract does not match the nature
of the project
- - - - 3.29
13 Planning and scheduling problems - - - - 3.01

133
In addition, the top 10 frequent sources of IM problems were further divided into four groups
according to years of experience as follows: (1) ≤9 years, (2) 10–14 years, (3) 15–19 years, and
(4) ≥20 years. Based on equation 1, the 22 IM problems were studied and summarized in 22
tables that show the rating average for each type of years of experience. After that, the 22 tables
were examined to determine the most critical problems for each years of experience type. Based
on that, the top 10 IM problems for each years of experience type were ranked and summarized.
Table 5.25 summarized the rating average of the highest IM problems for each years of
experience type. Generally, the top 10 problems based on the years of experience types are
similar but not necessarily in the same rank and order. Group 3 (15–19 years) and group 1 (≤9
years experience) considered the planning and scheduling problems as one of the top 10 IM
problems.
In addition, the top 10 frequent sources of IM problems were further divided into three groups,
according to level of project complexity, as follows: (1) high complexity, (2) medium
complexity, and (3) low complexity. Based on equation 1, the 22 IM problems were studied and
summarized in 22 tables that show the rating average for each type of level of project
complexity. After that, the 22 tables were studied to determine the most critical problems for
each level of complexity type. Based on that, the top 10 IM problems for each level of project
complexity type were ranked and summarized, as shown in Table 5.26. Table 5.26 summarized
the rating average of the highest IM problems for each level of complexity type. Generally, the
top 10 problems based on the level of project complexity types are similar but not necessarily in
the same rank and order.

134
Table 5.25 A Summary of the Rating Average of the Highest IM Problems for each Years
of Experience Group
IM Problem Experience group 1 ≤9
years
10–14
years
15–19
years
≥20
years
1 Lack of project management 2.84 2.95 3.11 2.96
2 Insufficient and inaccurate work drawings and
specifications
2.79 2.85 3.28 3.18
3 No proper work packaging design and subcontracting 2.78 2.70 3.09 3.09
4 Unclear system completion requirements 2.73 2.70 2.95 3.01
5 Inexperience with building codes; trade union practices 2.70 2.94 2.98 3.11
6 Undefined reporting structure and responsibilities 2.68 2.89 2.91 2.92
7 Inexperience with local laws and other government
regulations and modification in laws and regulations
2.63 2.96 2.98 2.98
8 Lack of trust among different project parties 2.61 2.81 3.05 3.05
9 Delay in established schedule of engineering,
procurement, and construction, and delay in owner
approval of completed tasks
2.59 2.80 3.09 3.00
10 Lack of personal experience of the project teams 2.59 2.75 - 2.86
10 Planning and scheduling problems 2.84 - 2.84 -

135
Table 5.26 A Summary of the Rating Average of the Highest IM Problems for each Project
Complexity Level
IM Problems 1. H
igh
com
ple
xit
y
2. M
ediu
m
com
ple
xit
y
3. L
ow
com
ple
xit
y
1 Inexperience with building codes; trade union practices 3.13 3.00 2.80
2 Insufficient and inaccurate work drawings and specifications, e.g.,
lack of interface details within work drawings and specifications
3.11 3.15 2.81
3 Lack of project management 3.06 2.97 2.89
4 Unclear system completion requirements 3.06 2.92 2.98
5 No proper work packaging design and subcontracting 3.04 3.01 2.95
6 Delay in established schedule of engineering, procurement, and
construction, and delay in owner approval of completed tasks
3.03 2.87 2.79
7 Lack of trust among different project parties 2.98 3.02 2.83
8 Inexperience with local laws and other government regulations and
modification in laws and regulations
2.98 3.02 2.72
9 Undefined reporting structure and responsibilities 2.90 2.92 3.03
10 Insufficient and lack of alignment among WBS, CWBS, CBS, and
OBS
2.85 - -
11 Lack of personal experience of the project teams - 2.91 2.66
5.2.6 Multiple regression models.
The findings show that the collected data are reasonable for building multiple-regression models.
The number of valid responses in this research study is 162 responses. On the other hand, there
are four interface management factors (four predictors). Brace et al. (2006) proposed the 5:1 ratio
for the number of response to number of predictor variables. In this research study, there are
approximately 40 participants for each predictor variables, which exceeds the required ratio. A
multiple-regression technique was used, with the six different construction performance

136
indicators (quality management, schedule management, cost management, scope management,
and safety management, and team work) as dependent variables and the four extracted interface
problem factors as independent variables, to examine the following hypotheses:
Hypothesis 5, 6, 7, 8, 9, and 10: There would be no significant relationships between the
extracted factors and the project performance indicators:
Quality
Schedule
Cost
Scope
Safety
Teamwork
Appendix IX summarizes the results of the multiple-regression analysis. The overall results show
that the IM factors have a significant impact at the project performance. Therefore, the six
hypotheses were rejected. Moreover, the information factor had the strongest influence on the six
project performance indicators.
The results of the multiple regression models show that the interface problems caused by the
information factor and management factor and the law and regulation factor had the strongest
influence on the quality project performance indicator. The interface problems caused by the
information factor and others factor were the strongest and positively influence the cost and
safety project performance indicators. The problems caused by the management factor and the
information factor were the most positive influences on the rest of the project performance
indicators. In summary, based on the multiple regression results, Table 5.27 shows that the
information factor is the most important factor affecting overall project performance.

137
Table 5.27 Multiple-Regression Results for Overall Project Performance
Factors Quality Schedule Cost Scope Safety Teamwork Overall
Performance
Mgt. factor 0.200 0.170 0.211 0.235 0.816
Inf. factor 0.548 0.428 0.493 0.562 0.284 0.470 2.785
Law & reg.
factor
0.129 0.129
Others factor 0.332 0.379 0.302 1.013
“One way of developing multiple correlation is to obtain the prediction equation for 𝑌′ in order
to compare the prediction value of the dependent variables with obtained Y” (Tabachnick &
Fidell, 2001) is as follows:
𝑌′ = 𝐴 + 𝐵1𝑋1 + 𝐵2𝑋2 + ⋯ + 𝐵𝐾𝑋𝐾 (1)
“where 𝑌′ is the predicted value of Y, A is the value of 𝑌′ when all XS are zero, B1 to BK represent
regression coefficients, and X1 to XK represent the independent variables” (Tabachnick & Fidell,
2001). For instance, based on equation number one and Appendix IX, the predication equation
for the project quality performance is
𝑌′ = −0.400 + 0.662𝑋1 + 0.303𝑋2 + 0.117𝑋3 (2)
where 𝑌′ is the project quality performance predicted value
𝑋1 is the information factor
𝑋2 is the management factor
𝑋3 is the law and regulation factor
Based on equation number one and Appendix IX, the predication equations for the project
performance indicators can be performed.

138
5.2.7 Reliability.
All the Cronbach’s α value for the IM factors are greater than 0.75 except for the other interface
problems factor, which is a little lower than 0.70 with a value of 0.649, as shown in Table 5.28.
All the Cronbach’s α values of the reliability test of the six project performance indicators are
greater than 0.90, as shown in Table 5.29.
Table 5.28 Reliability Test of Interface Problem Factor
Table 5.29 Reliability test of project performance indicators
Indicator
Name
Quality
Mgt.
Schedule
Mgt.
Cost Mgt. Scope Mgt. Safety
Mgt.
Teamwork
Mgt.
Cronbach’s α 0.920 .923 .927 .931 .951 .944
5.3 Conclusions
This part consists of intensely studying the interfaces during the engineering/design phase of
projects using a web-based questionnaire with participants from industry. This web-based
questionnaire was distributed inside Alberta. Out of 47 IM problems that were collected
throughout the project lifecycle, 22 IM problems were found applicable to the
engineering/design phase. The questionnaire questions were designed based on the 22 interface
management problems. The collected data were analyzed using factor analysis, Pearson’s
correlation matrix, and the one-way MANOVA test followed by Tukey’s HSD post hoc tests.
Exploratory factor analysis was performed to extract the factors and the latent structure of
Factor
Categories
Mgt.
factor
Inf.
factor
Law & reg.
factor
Others
factor
Cronbach’s α .794 .858 .844 .649

139
independent variables (interface problems). Correlation between IM factors during the
engineering/design phase and different construction data was tested. The results identified four
IM factors affecting construction project performance in Alberta during the engineering/design
phase.
The study concluded that while the management factor is the factor most impacting IM
performance throughout project lifecycle, the information factor and the law and regulation
factor impact IM performance the most during the engineering/design phase. These results are
different from some previous studies, for example (Ku et al. (2010) concluded that negotiation
and experience factors are the most important factors affecting IM. In addition, R. Huang et al.
(2008) indicated that, the interface management problems caused by the experience and
coordination factors are the most significant factors affecting IM. Therefore, some future
investigation is required to clarify this issue.
Although there are strong relationships between the four extracted factors and the company type,
industry type, job title type, and years of experiences, there are no relationships between the four
extracted IM factors and the level of project complexity. Therefore, it was concluded that the
four IM factors are not affected by the level of project complexity types. The results of the
multiple regression models indicate that the interface problems caused by the information factor,
management factor, and the law and regulation factor had the strongest influence on the quality
project performance indicator. The interface problems caused by the information factor and the
others factor were the strongest and positively influenced the schedule and cost and safety
project performance indicators. The problems caused by the management factor and the
information factor most positively influenced the rest of the project performance indicators.
140
5.4 Summary and Connection with the Next Chapters
The findings of this chapter present a basis for enhancing overall project performance and the
interfaces by (a) developing conceptual framework to study the IM relationships among owner,
contractor, and designer throughout project lifecycle using the Microsoft Visio® flowcharts and
UML use case Diagrams (Chapter 6) and (b) developing practical guidelines and suggestions for
improving and enhancing IM that are adequate to all participants engaged in construction
projects as well as beneficial to management practices at early stages of the project (Chapter 7).

141
Chapter Six: Proposed Interface Management Framework Applying RIBA Structure and
Use Case Models throughout Project Phases
6.1 Chapter Overview
As discussed in detail in Chapters 4 and 5, a comprehensive investigation was conducted through
structured face-to-face interviews and questionnaires with participants from industry throughout
the project lifecycle and during the engineering/design phase. The data analysis results provided
a comprehensive view of the main causes behind IM conflicts in Alberta’s construction industry.
Throughout the project lifecycle, factors affecting interface management (IM) were identified
and classified, namely, management, information, bidding and contracting, law and regulation,
technical engineering and site issues, and other interface problems. In addition, during the
engineering/design phases, factors affecting IM were identified and classified, namely,
management, information, law and regulation, and other interface problems.
Moreover, the correlations between IM factors and different respondents’ profiles (company
type, industry type, title type, and years of experience) were examined and tested. The most
critical problems affecting each aspect of IM were examined and discussed in detail. Finally,
based on the identified major IM factors impacting construction project performance, a new
integrated IM model was introduced to enhance project performance by developing 12 multiple
regression models. The reader can refer to Chapters 4 and 5 for more details.
Based on insights and results gained from the analysis and discussions described in previous
chapters and interviews with specialists from industry, this chapter consists of the following.
(1) Develop conceptual framework using The Royal Institute of British Architects (RIBA)
structure to highlight the critical IM areas during different project phases(2) Develop use case
models to study the IM relationships among owner, contractor, and designer (architects,

142
engineers) using UML use case diagrams. Also, identify the main responsibilities for each one
throughout project lifecycle phases in commercial and building projects. (3) Accordingly,
provide suggestions for improving and enhancing IM that are adequate to all project participants
engaged in different construction projects, as shown in Figure 6.1.
As mentioned before in chapter two (literature review chapter), many organizations have
identified and classified several project delivery methods. This research study is using RIBA
structure that considers the design-bid-built project delivery method. Consequently, this research
study focuses on the design-bid-built project delivery method (traditional project delivery
approach).

143
A conceptual framework (RIBA
framework) for each phase
Map the six IM perspective areas to each phase
Management interface area
Information interface area
Bidding and contracting interface area
Law and regulation interface area
Technical engineering and site issues interface area
Other interface area
Develop Use Case Models
Owner, Designer, and Construction
Contractor
Proposed Areas for Improving IM
for each Project Player
Phase1
Preparation
Phase 2
Design
Phase 3
Pre-construction
Phase 4
Construction
Phase 5
Use
Owner Designer Construction Contractor
Figure 6.1 Overall Structure for this Chapter
6.2 Relationships among Owner, Contractor, and Designer
Construction projects involve a variety of parties having contracts with each other, such as
owners, designers, constructors, and suppliers. This research study identified six different IM
areas/factors to analyze interface management improvement opportunities. Those areas/factors
are “management interface problems area”, “information interface problems area”, “bidding and
contracting interface problems area”, “law and regulation interface problems area”, “technical
engineering and site issues interface problems area”, and “other interface problems area”, as

144
shown in Figure 6.2. Under each area or factor there are a number of IM problems that were
discussed and presented in the previous chapters.
Management interface
problems area
Law and regulation
interface problems
area
Technical engineering
and site issues interface
problems area
Other interface
problems area
Information
interface problems
area
Bidding and
contracting interface
problems area
Interface
Management
Figure 6.2 Six Factors or Areas Affecting IM throughout Project Lifecycle
6.2.1 Project lifecycle phases in commercial and building projects.
Building project developed from inception to completion, as shown in Figure 6.3, which
illustrates five main phases and deliverables of a typical lifecycle adopted from (RIBA 2007).
These phases are: (1) preparation, (2) design, (3) pre-construction, (4) construction, and (5) use.
It should be noted that the operation phase and the close-out phase, known in the industry, are
included in the construction and use phases of RIBA respectively. Under each phase different
stages must be done. Figure 6.3 describes the phases and activities from appraising the client’s
requirements through to post-construction. For example, the design phase consists of the
following steps: (a) prepare the concept design, (b) develop the concept design, (c) prepare the
technical design(s) and specifications, (d) prepare the full design for each part of the project, and
finally, (e) check the cost of the design (RIBA 2007).
Because the RIBA process consists of the tasks and the responsibilities is considered an
architecture-based work-plan, using RIBA in this research study may create a bias towards

145
architects more than engineers. This can lead to some limitation in the application of this IM
framework.
Alternatively, A Guide to the Project Management Body of Knowledge (Project Management
Institute, 2004) illustrates four main phases and deliverables of a typical lifecycle, as shown in
Figure 6.4. The phases include (1) starting the project, (2) organizing and preparing, (3) carrying
out the project work, and (4) closing the project.
Client’s needs
Feasibility
studies
Planning,
design
Cost Appoint
architect
Concept
design
Technical design(s) &
specifications
Full designComplete
cost
Final production
information
Bills of
quantities Tender
documents
Procedure for selective
tenderingAppointing the
contractor
Issuing of
information
Arranging site hand
over
Administration of
the building
Review of information
provided
Final inspections
Assisting building user
Project performance in use
Phase 1:
Preparation
Phase 2:
Design
Phase 3:
Pre-Construction
Phase 4:
Construction
Phase 5:
Use
Figure 6.3 Project Lifecycle General Phases (RIBA, 2007)

146
Figure 6.4 Project Lifecycle General Phases and Deliverables (Project Management
Institute, 2004)
Results of the analysis and discussion described in the previous chapters and information
provided by industry experts during their interview sessions were used to map the IM areas
considered critical to different phases, as shown in Figures 6.5 through 6.9.
Based on the opinion of experts from industry, the following three areas were mapped to all
phases: (1) management interface problems area, (2) information interface problems area, and
(3) law and regulation problems areas. In addition, the technical interface problems area and
other interface problems area were mapped to the design phase, pre-construction phase, and
construction phase. As well, the bidding and contracting interface problems area was mapped to
the phases pre-construction, construction, and use.
For example, Figure 6.5 shows a conceptual framework (RIBA framework) of the preparation
phase that consists of two stages, (A) inception and (B) feasibility. During the inception stage, it

147
is important that the project teams understand, establish, and determine the project vision and the
project management body. Therefore, the management interface problems area was mapped
during this stage. There are some examples of the problems under this area. In addition, the
information interface problems area was mapped during this stage. It must be taken into
consideration to circulate the general outline of requirements and plan for future action
(responsibilities of the client to the design and construction process) among people involved in
the project and to ensure information transfer, i.e., what documents are shared, with whom, and
when. Moreover, some interfaces arise between stages and phases. Also, the law and regulation
area is one of the critical IM areas that have to be taken into consideration to carry out studies
about user requirements, site conditions, and planning design and cost.

148
Stage A Inception
Stage B Feasibility
Start
Set up client
organization
Appoint
architect
Consider
requirements
General outline of requirements & plan
future action (responsibilities of the client
to the design & construction process)
Carry out studies
- user requirements & site conditions
- planning, design and cost (Architect
& Engineer)
Appraisal and
recommendation
Appoint
Project
Manager
Give it to
the client
Is the client
happy ? YES
Identify
procurement
method
Establish a project
management body
and determine the
vision of the project
Identify the
KPIs for the
project
Do people
involved agree?
Go to phase
two (design)
Review the progress of the project with
respect to the vision and the KPIs
established in stage A
YES
Management interface problems area
Information interface
Problems area
Information interface problems area
Law and regulation problems area
Examples of management interface problems area:
Lack of enough negotiation and communication
and coordination
Poor decision making
Lack of project management
Discrepancies among the owners’ expectations
regarding project construction schedule, cost, and
quality
Examples of information interface problems area:
Information problems
Lack of IM system
Undefined reporting structure and responsibilities
Examples of law and regulation problems area
Inexperience with local laws and other government
regulations and modification in laws and regulations
Inexperience with building codes and trade union practices
NO
Figure 6.5 A Conceptual Framework of Phase One (Preparation) Including IM Interface Areas

149
Another example during the design phase that consists of three stages is shown in Figure 6.6:
(1) outline proposal, (2) scheme design, and (3) detail design. The most critical areas during this
phase are the law and regulation area, technical and engineering and site issues problems area,
management interface problems area, and information interface problems area. During the
outline proposal stage, it is important that the project team carries out studies on user
requirements, technical problems, etc. Therefore, the project team has to be familiar with local
laws and other government regulations, with modification in laws and regulations, and with
building codes and trade union practices. At the same time, during the detailed design stage, full
information must be circulated among the design team’s members to finalize the working
drawings related to design, specifications, construction, and cost. Besides that, the technical
engineering and site issues problems have to be taken into consideration to properly complete the
detail design.
Also, the IM areas considered critical were mapped to the pre-construction phase, as shown in
Figure 6.7.

150
Stage C Outline Proposals
Stage D Scheme Design
Stage E Detail Design
Start Preliminary
design proposals
& cost estimates
Prepare full design of the
project (architect)
Prepare preliminary
design (engineers)
Prepare cost plan and full
explanatory report
Proposals, including planning
arrangement appearance,
constructional method,
outline specification, and cost
Do people involved agree ?
Obtain approval on the
outline proposals (owner)
Is the client
satisfied ?
Full design (Architect and Engineers, QS and Specialists) Full document (Working drawings related
to design, specification, construction & cost
Do people
involved agree ?
Complete cost checking of designs Go to phase 3 Pre Construction
YES
Carry out studies
on user requirements and technical problems,
planning, design and costs
(Architect and Engineers, QS & Specialists)
Law & regulation problems area
Review the progress of the project/ KPIs
established in stage A
Information interface problems
area
NO
Management interface problems area
Technical engineering and site issues problems area,
and and Other interface problems area
NO
Information interface problems area Technical engineering and site issues problems area
Examples of law and reg.
interface problems area:
Inexperience with local laws
and other government
regulations and modification
in laws and regulations
Inexperience with building
codes and trade union
practices
Examples of information interface
problems area:
Undefined reporting structure and
responsibilities
No proper work packaging design
and subcontracting
Interfaces arise because of the
application of the project
development gating (or phases)
system
Examples of tech. engg. and site issues interface problems
area:
Engineering process problems related to interfaces
Lack of knowledge about site circumstances by the project
team
Insufficient and inaccurate work drawings and specification
YES
NO
Examples of other interface problems area
Project extension versus greenfield (new) project type
YES
Figure 6.6 A Conceptual Framework of Phase Two (Design) Including IM Interface Areas

151
Stage F Production Information
Stage G Bills of Quantities
Stage H Tender Action
Start
Prepare the final
production information
ie drawings, schedules
and specifications
(Architect,Engineers,
Specialists)
Preparation of Bills of
Quantities and tender
documents
(Architect, QS)
Complete
document of
all information
Obtaining
tender
Do people
involved agree ?
YES
Procedure for
Selective Tendering
process
YES
Select
contractor Are people
involved happy?
Go to
Constructio
n phase
Production information
Law and regulation interface problems area
Technical engineering and site issues problems area
Information interface problem area
Bidding and contracting interface problems
area and Other interface problems area
NO
Law and regulation interface problems area Examples of law and reg. interface problems area:
Inexperience with local laws and other government regulations and
modification in laws and regulations
Inexperience with building codes and trade union practices
Unclear company standard operating procedures
Inexperience with the government auditing protocols and procedures
Examples of tech. engg. and site issues interface problems area:
Construction processes and methods problems
Engineering process problems related to interfaces
Insufficient and inaccurate work drawings and specification
Materials procurement problems
Examples of information interface problems area:
Information problems
Undefined reporting structure and responsibilities
No proper work packaging design and subcontracting
Insufficient and lack of alignment among WBS, CWBS, CBS,
and OBS
Examples of bid and contr. interface problems area:
Unclear contract details and poorly written contract
Type of the contract does not match the nature of the project
Lack of solid contracting strategy vision at early stage of the project
In the invitation to tender, identify the interface problems
YES
NO
Examples of other interface problems area
Unexpected changes in materials and labour availability and cost
Figure 6.7 A Conceptual Framework of Phase Three (Pre-construction) Including IM Interface Areas

152
During the construction phase almost all the IM areas have to be taken into consideration. This
phase consists of two stages: (1) project planning and (2) operation on site as shown in
Figure 6.8. The project teams must have a deep knowledge about site circumstances. In addition,
when issuing the information to the contractor, the contractor's familiarity with the
environmental circumstances and local weather must be discussed and checked. In addition, the
geotechnical circumstances have to be studied carefully. After that, when arranging the site
handover to the contractor, the contractor must be familiar with local laws and other government
regulations and modification in laws and regulations and with building codes and trade union
practices. Finally, deep attention has to be paid to the management interface problems and
information interface problems. Also, the IM areas considered critical were mapped to the use
phase, as shown in Figure 6.9.

153
Stage J Project Planning
Stage K Operation on Site
Start
Prepare the Administration of
the building contract to
practical completion
Plans to practical
completion of
the building
Go to phase 5 (Use )
Make arrangements to commence work on site
Appointing the
contractor
Issuing of information to
the contractor
Arranging site hand over to the
contractor
Program the work in
accordance with contract
conditions by the contractor
Do site inspection
Review of information
provided by contractors
and specialists
Do people involved agree ?
YES
Technical engineering and site issues problems area
Information interface problems area, and Bidding
and contracting interface problems area
Law and regulation interface
problems area and Other
interface problems area
Management interface problems area
Information interface problems area
Examples of tech. engg. and site issues interface problems area:
Construction processes and methods problems
Contractor's unfamiliarity with the environmental circumstances
and local weather
Geotechnical circumstances problems
Project site issues
Materials procurement problems
Limited skills for labour and engineering
Examples of law and reg. interface
problems area:
Inexperience with local laws and other
government regulations
Inexperience with building codes and
trade union practices
Examples of management interface problems area:
Discrepancies among the owners’ expectations
regarding project construction schedule, cost, etc
Planning and scheduling problems
Interfaces with other interdependent projects
Slow in change orders, permits, and shop drawings
submission and approval
Delay in established schedule of engineering,
procurement, and construction
Application of fast-track engineering and construction
techniques
Examples of information interface problems area:
No proper work packaging design and subcontracting
Interfaces arise because of the application of the
project development gating (or phases) system
NO
Examples of bid and contr. interface problems area:
Different contractors insist on their points of view
Insufficient definition of projects boundaries and tie-in
information
Unclear system completion requirements
Examples of other interface problems area
Unexpected changes in materials and labour availability
and cost
Figure 6.8 A Conceptual Framework of Phase Four (Construction) Including IM Interface Areas

154
Stage L Completion
Stage M Feedback
Start
Assist building user
during initial
occupation period
Make the final inspections
and practical completion
Administration of
the building contract
Review of project
performance in use.
Hand over the building to the client
for occupation, remedy any defects
Settle the final account, and
complete all work in accordance
with the contract.
Analyze the job records
Inspect the completed building
Do people involved
agree ? YES End
Information interface
problems area
Bidding and contracting
interface problems area
NO
Law and regulation interface problems area
Information interface problem area
Examples of information
interface problems area:
Information problems
Undefined reporting
structure and
responsibilities
Interfaces arise because of
the application of the
project development gating
(or phases) system
Examples of bid and contr. interface
problems area:
Unclear contract details and poorly
written contract
Type of the contract does not match the
nature of the project
Lack of solid contracting strategy vision
at early stage of the project
In the invitation to tender, identify the
interface problems
Increase project interface conflicts when
different contractors insist on their
points of view
Examples of law and reg. interface problems area:
Inexperience with local laws and other government
regulations and modification in laws and regulations
Inexperience with building codes and trade union practices
Figure 6.9 A Conceptual Framework of Phase Five (Use) Including IM Interface Areas

155
6.2.2 Use case model.
This is the first research study using the use case model to analyze interface management; none
of the previous studies use this model to study IM. The use case model is a graphical tool that is
simple and easy to understand by different project parties. Companies can use the use case
models to develop their own systems to manage the interfaces (Pender, 2003). “Each use case
describes the functionality to be built in the proposed system, which can include another use
case’s functionality or extend another use case with its own behavior” (Pender, 2003). The use
case model consists of many elements, such as actors, use cases, and «include» and «extend»
relationships. A use case is a list of interactions between what is called an “actor” and a system.
An actor can be a human or machine or enterprise that interacts with the system (see Figure
6.10). An include relationship “identifies a reusable use case that is unconditionally incorporated
into the execution of another use case” (Pender, 2003).
This section presents the development of the use case models to study the IM relationships
among owner, contractor, and designer (architects and engineers) and identify the main
responsibilities for each one throughout the project lifecycle phases in commercial and building
projects. Consequently, areas and actions that are adequate to all project participants engaged in
different construction projects can be suggested for improving and enhancing IM.
There are three primary players (actors): owner, designer, and contractor, as shown in
Figure 6.10 (CSC, 2006). The owner secures competitive bids from contractors based on the
contract documents that were developed by the designer. Based on an accepted bid, the owner
signs a contract with the selected contractor for construction of the project. For more details,

156
Figure 6.10 shows the traditional project delivery approach, which consists of three steps as
follows:
Step one: An owner assigns a designer to prepare the design documents and to prepare contract
documents based on the owner needs.
Step two: Competitive bids are obtained from the contractor using the contract document.
Step three: A contract is signed with the selected contractor for construction of the project.
There are two separate main contracts between the owner and the designer and the owner and the
construction contractor. The first contract is directly with the designer to prepare the detailed
design drawings, specifications, and procurement and contracting services. The second contract
is signed with the construction contractor for construction of the project (The American Institute
of Architects and The Associated General Contractors of America, 2011).
Figure 6.11 shows the current UML use case model packages of the owner, designer, and
contractor. Figure 6.10 and Figure 6.11 show the responsibilities for each player; one such
example is the design team (architects and engineers). According to the owner requirements the
design team prepares the detailed design documents and prepares the contract documents. The
design team is to first “finalize project design and specifications” in three stages, stages as shown
in Table 6.1: outline proposals, scheme design, and detail design (The Royal Institute of British
Architects (RIBA), 2007). The “finalize project design and specifications” step is included as
step number 4 in Figure 6.10 and Figure 6.11. Table 6.1 provides details about the design phase
and helps to explain step number 4 in Figure 6.10 and Figure 6.11. As well, it helps to build the
use case model of the current relationships among owner, designer, and contractor.

157
Furthermore, the key deliverables of the detailed design phase can be broken down into seven
components: (1) “Scope definition and engineering execution strategy”, (2) “Commencement of
detailed design”, (3) “Initial design development and hazard identification”, (4) “Initial design
review & audit”, (5) “Approval for design”, (6) “Approval for construction”, and (7) “Design
close-out” (AMEC, 2013). Many people are involved during the design phase (as shown in
Table 6.1), including client, architects, engineers, specialists, and all statutory and approving
authorities. Then the design team (architects and engineers) finalize the contract documents. The
contract documents consist of drawings, specifications, and supporting information. Based on the
contract documents, competitive bids are obtained from the contractors to sign a contractor to
construct the project. Then, the design team administers the building contract to practical
completion.
Table 6.1 Royal Institute of British Architects Work Stages during the Design Phase
Adapted from RIBA (2007)
Stage Purpose of work People directly involved Commonly
used
terminology
Outline
proposals
To determine general approach to
layout, design and construction in order
to obtain authoritative approval of the
client on the outline proposals
Client, architects,
engineers, and specialists,
as essential
Sketch plans
Scheme
design
To complete the brief and decide on
particular proposals, including planning
arrangement appearance, constructional
method, outline specification, and cost,
and to obtain all approvals
Client, architects,
engineers, specialists, all
statutory, and approving
authorities
Sketch plans
Detail
design
To obtain final decision on every matter
related to design, specification,
construction and cost
Architects, engineers,
specialists, and contractor
Working
drawings

158
Owner
2. Initiate Design
Procurement Services
3. Identify & Retail
Design Services
4. Finalize Project
Design &
Specifications
6. Finalize Contract
Documents
7. Initiate Tender &
Bidding Process8. Retain Contractor
Services9. Make Construction
Administration
11. Construct &
complete the ProjectDesign
Team
Construction
Contractor
12. Complete Project
Acceptance and Start-up
5. Start
Procurement
Services
10. Finish
Manufacturing &
Fabrication
13. Close out the
Project
1. Define Project
Deliverables
Figure 6.10 UML Use Case Model of the Current Relationships among Owner, Designer,
and Contractor (adapted from The American Institute of Architects and The Associated
General Contractors of America (2011))

159
1. Define Project
Deliverables
2. Initiate Design
Procurement
Services
3. Identify & Retail
Design Services
Owner(s)
responsibilities
Phase 1: Preparation
7. Initiate Tender
& Bidding Process
8. Retain
Contractor Services
12. Complete Project
Acceptance and Start-
up
Phase 5: Use
Phase 3: Pre-construction
4. Finalize Project
Design &
Specifications
6. Finalize Contract
Documents
Phase 2: Design
9. Make Construction
Administration
11. Construct &
complete the Project
Phase 4: Construction Design team’s
responsibilities
Contractor(s)
responsibilities
5. Start Procurement
Services
10. Finish
Manufacturing &
Fabrication
13. Close out the
Project
“A use case package contains use cases and relationships” (Pender, 2003).
Figure 6.11 UML Use Case Model Packages of the Current Relationships among Owner,
Designer, and Contractor within different Project Phases
Use Case

160
According to the literature review and distributed questionnaires, different actions,
recommendations, and areas were proposed in order to improve IM for each project player, as
shown in Table 6.2 and Table 6.3. The IM problems in bold text, 65% of the areas for improving
IM, were new and never mentioned in previous studies. The underlined IM problems, 20% of the
areas for improving IM, were identified in previous studies and the distributed questionnaires.
The rest were identified only in previous studies (15% of the areas for improving IM).
While the owner is responsible for 30% of the actions for improving IM, the design team is
responsible for 45% and the contractor is responsible for 25%. These results demonstrate the
importance of the design team’s role and the design phase.
In addition, Table 6.2 and Table 6.3 show the hard and soft actions. The soft actions can be
defined as the actions that need more discussion, communication, engagement, and coordination
among different project participants such as “engagement of all stakeholders from the very start
to completion of projects”. The hard actions can be defined as the actions that need a hard
document to be circulated among the parties involved in a project. While 70% of the areas were
considered as hard actions, 30% were considered as soft actions. After that, proposed use case
models were developed to illustrate the responsibilities and actions of each project player, as
shown in Figures 6.12, 6.13, and 6.14. The dashed lines are the relationships between the use
cases. The solid lines indicate the connection between the actor(s) and the use cases.

161
Table 6.2 Hard Areas for Improving IM for each project player based on Literature
Review and Distributed Questionnaires
Hard Owner Designer Contracter
1 Clearly define the scope of
project (Mortaheb & Rahimi
(2010) and distributed
questionnaires)
Clear understanding of the
design team
interdisciplinary
coordination problems
Have a clear
understanding of the
site/fabrication facility
quality requirements
2 Approve the design on time,
pay the contractor, and
approve the change orders
(Mortaheb & Rahimi (2010)
and distributed
questionnaires)
Split the program of the
project into sub-programs
(Mortaheb & Rahimi, 2010)
Ensure modularization
and corresponding
fabrication and shipment
are well managed, as are
regulatory,
transportation, weight
requirements, etc.
3 Use appropriate tools for
choice of the contractors
(Mortaheb & Rahimi, 2010)
Accelerate the design events
in terms of interface issues
(Mortaheb & Rahimi, 2010)
Clear expectations from
contractors at the time of
awarding of the contract
4 Implement engineering,
procurement and
construction standards
(Alarcón & Mardones
(1998) and distributed
questionnaires)
Take into consideration the
interface issues during the
design activities
Expedite the mobilization
process
5 Appoint the specialist
contractor earlier (Pavitt &
Gibb, 2003)
Standardize interface designs
(Pavitt & Gibb, 2003)
Schedule, plan, and
monitor the interface
problems with other project
participants (Mortaheb &
Rahimi (2010) and
distributed questionnaires)
6 Clearly define proper
contracting strategy
Review value engineering,
constructability
Define clear site access
responsibilities
7 Define a clear project
organization structure
Quickly respond to any
request for information
(RFIs) from the contractors
Reduce the overlapping
between multiple
construction contractors

162
Table 6.2 cont’d
Hard Owner Designer Contracter
8 Appoint Interface Manager
(Mortaheb & Rahimi (2010)
and distributed
questionnaires)
Consider the application of
engineering standards and
specifications
Understand the
site/fabrication facility
quality requirements
9 Get information on time,
get someone to take
responsibility for
problems
Use 3D computerized
modeling software (Mortaheb
& Rahimi, 2010)
Identify the site-wide
services
10 Organize the regulatory
and permit procedures
Reduce disagreements or
errors in engineering
deliverables (Mortaheb &
Rahimi, 2010)
Improve programming and
sequencing at site level
(Pavitt & Gibb, 2003)
11 Control the circulation of
data within the project
teams (Alarcón &
Mardones (1998) and
distributed questionnaires)
Clear and concise alignment
on the design parameters of
the project. What are we
building — fit for purpose,
life cycle, etc?
Prepare boundary
information at an early
stage of the project
12 Appoint general
construction manager or
project manager
contractor
Understand the owner’s
requirements and the local law
and regulations (Mortaheb &
Rahimi (2010) and distributed
questionnaires)
13 Coordination between
drawings for various
disciplines
14 Prepare the internal and
external interfaces list and IM
plan (Mortaheb & Rahimi
(2010) and distributed
questionnaires)

163
Table 6.2 cont’d
Hard Owner Designer Contracter
15 Identify the interface
responsibility as early as
possible (Pavitt & Gibb
(2003) and distributed
questionnaires)
16 Consider the time difference
between offices at different
remote locations
17 Alignment on the design
parameters
18 Early order of long-lead
items and special materials
Key: The IM problems in bold text were new and never mentioned in previous studies.
The underlined IM problems were identified in previous studies and the distributed questionnaires.

164
Table 6.3 Soft Areas for Improving IM for each project player based on Literature Review
and Distributed Questionnaires
Soft Owner Designer Contracter
1 Resolve any problems related
to the interface issues
(Mortaheb & Rahimi, 2010)
Coordinate among multi-
disciplines and specialties
(Alarcón & Mardones, 1998)
Good
communication with
the owners
2 Engagement of the project
teams (regulatory,
engineering, procurement,
etc.)
Consider the time difference
between offices at different
remote locations
Lessons learned from
past projects. Utilize
experienced project
workers
3 Need for an integrated
project team of client and
EPC
Arrange for internal meetings
among each discipline
Set the obligations
on or before the
kickoff
4 Engagement of all
stakeholders from the very
start to completion of
projects
Need to get engineers to site
and construction people into
the office
Communicate and
coordinate with other
project participants
(Mortaheb & Rahimi,
2010)
5 Application of
communication techniques
among different project
participants
Personal contact between
various disciplines rather than
emails and other non-personal
contact
Reduce the conflict
between various
project parties by
creating a suitable
mechanism to solve
problems
6 Arrange for weekly, bi-weekly,
and monthly meetings to
discuss the interface issues
(Mortaheb & Rahimi, 2010)
Alignment between client and
contractor standardization of
processes and engineering and
construction requirements
7 Expedite the reviewing for the
key engineering deliverables
8 Define clear procedures for
engineering review of
construction design changes
Key: The IM problems in bold text were new and never mentioned in previous studies.
The underlined IM problems were identified in previous studies and the distributed questionnaires

165
Owner (s) Responsibilities
Appoint Interface Manager
Clearly define the scope of project
and the design parameters
<<Include>>
<<Include>>
<<Include>>
1. Define Project
2. Initiate Design
Procurement
Services
3. Identify &
Retail Design
Services
Owner
Phase 1: Preparation
7. Initiate Tender &
Bidding Process
8. Retain
Contractor
Services
Phase 5: Use
Phase 3: Pre-construction
Organize the regulatory and permit
procedures
Resolve any problem related to the
interface issues at early stages
<<Include>>
Define the procurement method
<<Include>>
Implement engineering, procurement
and construction standards
Use appropriate tools for choice of
the contractors
<<Include>>
Appoint the specialist contractor earlier
Clearly define proper contracting
strategy
<<Include>>
Need for an integrated project team of
client and EPC at early stages
<<Include>>
<<Include>>
<<Include>>
Approve the design, pay the contractor,
and approve the change orders
12. Complete
Project Acceptance
and Start-up
13. Close out the
Project
Define a clear project organization structure
<<Include>> Appoint general construction manager
or project manager contractor<<Include>>
Get information on time, get someone to
take responsibility for problems
Control the circulation of data
Engagement of the project teams
Engagement of all stakeholders from
the very start to completion of projects
Application of communication
techniques among different project
participants
Arrange for weekly, bi-weekly, and monthly
meetings to discuss the interface issues
<<Include>>
<<Include>>
<<Include>>
<<Include>>
<<Include>>
<<Include>>
<<Include>>
Actor
Hard Actions
Soft Actions
Connection between the actor (s) & the Use Cases
Relationships between the Use Cases
“The «include» relationship allows us to include the steps from one Use case into another”
(Pender, 2003)
Figure 6.12 Proposed Use Case Model Package for Owner’s Responsibilities and Actions

166
Design’s team responsibilities
Contractor (s)
responsibilities
Split the program of the project into
sub-programs<<Include>>
4. Finalize Project
Design &
Specifications
6. Finalize
Contract
Documents
Phase 2: Design
9. Prepare
Construction
Administration
Phase 4: Construction
Designer
Clear understanding interdisciplinary
coordination problems
Accelerate the design events in
terms of interface issues
Standardize interface designs
<<Include>>
<<Include>>
<<Include>>
Quickly respond to any RFIs from the
contractors
Consider the application
of engineering standards
and specifications.
<<Include>>
Alignment on the design parameters
Reduce disagreements in engineering
deliverables
Use 3D computerized modeling software
Prepare the internal and external
interfaces list and IM plan
Arrange for internal meetings among
each discipline
<<Include>>
<<Include>>
<<Include>>
<<Include>>
<<Include>>
<<Include>>
Coordinat among multi-
disciplines and specialties
Consider the time difference between
offices at different remote locations<<Include>>
5. Start
Procurement
Services
<<Include>>
<<Include>>
Early order of long-lead items and
special materials
Take into consideration the interface
issues during the design activities<<Include>>
Identify the interface responsibility
Understand the owner’s requirements
and the local law and regulations
Need to get engineers to
site and construction people
into the office
Personal contact between various disciplines
rather than emails and other non-personal contact
Define clear procedures for engineering
review of construction design changes
Expedite the reviewing for the key
engineering deliverables
Alignment between client and contractor
standardization of processes, and engineering
and construction requirements
<<Include>>
<<Include>>
<<Include>> <<Include>>
<<Include>>
<<Include>>
<<Include>>
Actor
Hard Actions
Soft Actions
Connection between the actor (s) & the Use Cases
Relationships between the Use Cases
Figure 6.13 Proposed Use Case Model Package for Design Team’s Responsibilities and
Actions

167
Contractor (s)
responsibilities
11. Construct &
complete the
Project
Phase 4: Construction
Construction
Contractor
Understand the site/fabrication facility
quality requirements
<<Include>> Schedule, plan, and monitor the interface
problems with other project participants
Clear expectations from contractors at the time
of awarding of the contract
<<Include>>
<<Include>>
Expedite the mobilization process
Ensure modularization, and corresponding fabrication
and shipment is well managed regulatory,
transportation, weight requirements, etc.
Reduce the overlapping between
multiple construction contractors
Prepare boundary information at an
early stage of the project
Identify the site wide services
Improve programming and
sequencing at site level
Communicate and coordinate with
other project participants
Lessons learned from past projects.
Utilize experienced project workers. Set the obligations on or before
the kickoff
<<Include>>
<<Include>>
<<Include>>
<<Include>>
<<Include>>
<<Include>>
<<Include>>
<<Include>>
<<Include>>
12. Completed
Project Acceptance
and Start-up
10. Prepare
Manufacturing &
Fabrication
Reduce the conflict between various
project parties by creating a suitable
mechanism to solve problems
<<Include>>
Define clear site access
responsibilities
<<Include>>
Good communication with the owners
<<Include>>
Hard Actions
Soft Actions
Connection between the actor (s) & the Use Cases
Relationships between the Use Cases
Actor (s)
“The «include» relationship allows us to include the steps from one Use case into another”
(Pender, 2003)
Figure 6.14 UML Proposed Use Case Model Package for Contractor’s Responsibilities and
Actions

168
6.3 Summary and Connection with the Next Chapter
The findings of this chapter present a basis for studying the relationships among owner,
contractor, and designer by developing a conceptual framework to study the IM relationships
among them throughout a project lifecycle using the UML use case diagrams. In addition, the
results of this chapter develop proposals for improving and enhancing IM functionality. Those
are adequate for all participants engaged in commercial and building construction projects.
Chapter 7 highlights the contributions of this research study and gives suggestions for future
research.

169
Chapter Seven: Research Conclusions and Recommendations
7.1 Chapter Overview
This chapter presents the lessons learned and the theoretical contribution to academia and
practical contributions to the industry. The researcher also suggests and recommends areas for
future research.
7.2 Conclusion
For this research study, analytical approaches and quantitative statistical approaches were
adopted to examine, identify, and categorize interface problems in the construction projects of
Alberta. This research study used structured methods (structured face-to-face interviews and
web-page questionnaires). Data were collected using two web-based questionnaires that were
distributed through the members of different associations in Alberta. The first survey was
conducted throughout project lifecycle phases, and the second survey was conducted during the
engineering/design phase. The research study during the engineering/design phase consists of
examining the interfaces (22 interface management (IM) problems) during the
engineering/design phase of projects using a web-based questionnaire with participants from
industry. Statistical techniques, such as factor analysis, cross-tabulated analysis, and multiple
regressions were used to analyze the collected data. Based on the data analysis, several findings
were revealed. Table 7.1 shows a summary of general conclusions. As can be seen in Table 7.1,
the big differences between the results during the project lifecycle phases and the engineering
design phase were in the MANOVA results and the multiple regression results.
The results of the six multiple regression models studied throughout project lifecycle indicated
that the interface problems caused by the technical engineering and site issues factor, the bidding

170
and contracting factor, the information factor, and the law and regulation factor had the strongest
influence on the schedule project performance indicator whereas the interface problems caused
by the technical engineering and site issues factor, the bidding and contracting factor, and the
information factor had the strongest influence on the cost project performance indicator. On the
other hand, the problems caused by the management factor and the law and regulation factor had
the most influence on the rest of the project performance indicators, which are quality, scope,
safety, and teamwork. As well, the results of the multiple regression models show that the
interface problems caused by the information factor, the management factor, and the law and
regulation factor had the strongest influence on the quality project performance indicator. The
interface problems caused by the information factor and the others factor were strongest and
positively influenced the cost and safety project performance indicators. The problems caused by
the management factor and the information factor were the most positive influences on the rest
of the project performance indicators.
Based on the results of the two surveys and opinions and thoughts of experts from industry, this
study developed a conceptual framework using The Royal Institute of British Architects (RIBA)
structure in order to highlight the IM areas considered critical and important for each phase in the
project lifecycle. Moreover, use case models were developed to study the IM relationships
among owner, contractor, and designer (architects, engineers) and to identify the main
responsibilities for each one throughout project lifecycle phases in commercial and building
projects. Finally, suggestions for improving and enhancing IM that are adequate to all project
participants engaged in different construction projects are provided.

171
Table 7.1 Comparison between the First and the Second Survey Results
Statistical
Technique
Project Lifecycle Engg. Design Phase
Factor
analysis
Six IM Factors Four IM Factors
MANOVA Management factor is the factor
most impacting IM
Strong relationships between the
IM factors and the company type,
job title type, and years of
experience
No relationships between the IM
factors and the industry type
Information factor and law and
regulation factor have the most impact
on IM
Strong relationships between the IM
factors and the company type, industry
type, job title type, and years of
experience
No relationships between the IM factors
and the level of project complexity
Top 10 IM
problems
Different company types, industry
types, respondent’s title types, and
experience types are almost in
agreement over the general IM
problems
Different company types, industry types,
respondent’s title types, experience
types, and the level of project
complexity types are almost in
agreement over the general IM problems
Multiple
regression
Schedule project performance:
technical engineering and site
issues factor, the bidding and
contracting factor, the information
factor, and the law and regulation
factor
Cost project performance: technical
engineering and site issues factor,
the bidding and contracting factor,
and the information factor
The rest of the project performance
indicators: management factor and
the law and regulation factor
Quality project performance:
information factor, management factor,
and law and regulation factor
Cost and safety project performance:
information factor and others factor
The rest of the project performance
indicators: management factor and the
information factor

172
7.3 Research Contributions
Several theoretical and practical contributions to the body of the knowledge in the area of
construction industries were provided as follows:
The most important contribution of this research study is the development of a conceptual
framework using RIBA structure to highlight the IM areas considered critical for each
phase of a project lifecycle. In addition, use case models were developed to study the IM
relationships among owner, contractor, and designer (architects, engineers) and identify
the main responsibilities for each one throughout project lifecycle phases in commercial
and building projects. These use case models help to reduce the conflict between
construction project participants by identifying the interface problems/issues.
Accordingly, suggestions were provided for improving and enhancing IM that are
adequate to all project participants engaged in different construction projects.
Identification of 16 new IM problems through the questionnaires and the pilot study.
Development of 12 multiple-regression models to study the impact of IM on project
performance throughout the project lifecycle and especially during the engineering design
phase. The following steps were conducted to achieve this point as follows:
Confirmation of IM problems, factors, and most critical problems, and their impact on
project performance in construction projects.
Understanding the relationships between the IM factors and company type, industry
type, etc.
Conceptual research methodology (theoretical framework) for modeling the impact of IM
on construction project performance.

173
Focused on the understanding of interfaces during the engineering design phase.
7.4 Benefits of the Research
1. Reduce conflict among owner, design team, and construction contractor. A number of
conflicts and omissions can be avoided if the responsibilities and interfaces among owner,
architects, engineers, and construction contractors are carefully defined in the beginning
of the project. In addition, the research provides the project participants with practical
actions on effective and efficient ways to implement IM practices that could result in
improved project performance. In addition, they can receive early indication during the
lifecycle of an active project of potential IM issues and use this opportunity to take
necessary actions to prevent or mitigate the negative impacts of these problems.
2. Companies could use the use case models to develop their own systems to manage the
interfaces.
3. The results of this study can assist project managers, architects, engineers, and others to
focus on certain tools, areas, and procedures and improve them at the early stages of the
project life cycle, so as to optimize the overall project performance. The results of this
research study could assist engineers, architects, and others within the construction
industry to analyze the project performance during the project’s early stages. Furthermore,
the results of this research could allow these professionals to have more immediate
information about the potential and the most critical IM problems. This information may
then minimize project delays and cost and reduce conflict among different project
participants involved in construction projects, which may positively influence project
performance.

174
4. Through appropriate communication and coordination techniques among different project
participants the potential exists to reduce conflict between phases, disciplines, etc. These
interface problems have to be directly, carefully, and effectively resolved.
7.5 Recommendations for Future Research
1. Focus on the understanding of interfaces during different phases of project lifecycle, for
instance, the construction phase.
2. Development of a prediction model of the impact of IM on project performance. This
step develops a model for prediction of project performance based on IM by using the
common methods to predicate the outcomes of the construction projects. Generally, there
are many tools being used for project management performance prediction modeling,
such as simulation, and neural networks (NN).
3. Study the relationship between the project complexity and the IM by choosing two or
more real projects (case studies).
4. Rank and quantify the areas for improving IM that were included in this research study to
pick the most important ones to enhance IM.
5. Apply and implement the 12 multiple-regression models that were developed in this
research study to real projects in order to study the impact of IM on project performance.
6. Study the IM in different countries and compare IM practices in different countries.
7. Expand this research study to other sectors.
8. Work toward a better understanding of why management and information have the
largest impact on the other factors.
9. Study the impact of project delivery methods on IM.

175
10. Involve other stakeholders in the future research study.
11. Study the relationships between project complexity and IM.

176
REFERENCES
Abdelgawad, M. (2011). Hybrid decision support system for risk criticality assessment and risk
analysis. PhD dissertation, University of Alberta, Alberta, Canada.
Alarcón, L., & Ashley, D. (1996). Modeling project performance for decision making. Journal of
Construction Engineering and Managemen, 122(3), 265–273.
Alarcón, L., & Mardones, D. (1998). Improving the design-construction interface. Proceedings
IGLC’98, http://www.
Alberta’s Economic Development. (2013). Alberta’s Economic Development. Economic results.
Retrieved from http://albertacanada.com/about-alberta/economic-results.html
Al-Hammad, A. (1990). A study of the interface problems between owners and contractors over
the construction of residential housed in Saudi Arabia. International Journal for Housing
Science and Its Application, 14(4), 245–257.
Al-Hammad, A. (1993). Factors affecting the relationship between contractors and their sub-
contractors in Saudi Arabia. Building Research and Information Journal, 21(5), 269–273.
Al-Hammad, A. (1995). Interface problems between owners and maintenance contractors in
Saudi Arabia. Journal of Performance of Constructed Facilities, 9(3), 194–205.
Al-Hammad, A. (2000). Common interface problems among various construction parties.
Journal of Performance of Constructed Facilities, 14(2), 71–74.
Al-Hammad, A., & Al-Hammad, I. (1996). Interface problems between building owners and
designers. Journal of Performance of Constructed Facilities, 10(3), 123–126.
Al-Hammad, A., & Assaf, S. (1992). Design-Construction interface problems in Saudi Arabia.
Building Research and Information, 20(1), 61–63.
AMEC. (2013). Detailed Engineering Design Phase Engineering Design Integrity Workflow
Introduction. http://www.amec.com/documents/downloads/about-us-
documents/brochures/oil-gas-brochures/detailed-engineering-and-design-brochure.pdf.
Archibald, R. D. (2003). Managing high-technology programs and projects. (Wiley, Ed.). New
York.
Asbjorn Rolstadas, Hetland, P. W., Jergeas, G. F., & Westney, R. E. (2011). Reshaping the
Governance System. In Risk Navigation Strategies for Major Capital Projects (pp. 75–95).
London: Springer London.

177
Awakul, P., & Ogunlana, S. O. (2002). The effect of attitudinal differences on interface conflicts
in large scale construction projects: a case study. Construction Management and
Economics, 20(4), 365–377.
Ayudhya, I. B. N. (2011). Appraisal of Common Dispute Problems over Residential Building
Projects in Hong Kong. In FIG Working Week 2011 (pp. 1–10). Marrakech, Morocco.
Belassi, W., & Tukel, O. I. (1996). A new framework for determining critical success/failure
factors in projects. International Journal of Project Management, 14(3), 141–151.
Bible, M., Abualfeilat, Y., Calder, S., Andersen, M., Weshah, N., Haskins, C., … Tompkins, P.
(2014). Project Interface Management Handbook: (First Draft): An Interface Management
Practitioner’sGuide2014.
Brace, N., Kemp, R., & Snelgar, R. (2006). Multiple regression: An introduction to multiple
regression on SPSS. In SPSS for psychologists a guide to data analysis using SPSS for
Windows (3d Eition.). MacmillanL. Erlbaum Assoc. 450 p.
Buede, D. M. (1999). The engineering design of systems. Models and Methods. New York:
Wiley.
Caglar, J., & Connolly, M. (2007). Interface Management: Effective information exchange
through improved communication (No. ABB Value Paper Series).
Caron, F., Marchet, G., & Perego, A. (1998). Project logistics: integrating the procurement and
construction processes. International Journal of Project Management, 16(5), 311–319.
Center for Chemical Process Safety (CCPS). (2004). Interface Management; Effective
Communication to Improve Process Safety. New York: American Institute of Chemical
Engineers (AICHE).
Chan, W., Chen, C., Messner, J., & Chua, D. (2005). Interface Management for China’s Build–
Operate–Transfer Projects. Journal of Construction Engineering and Management, 131(6),
645–655.
Chen, Q., Reichard, G., & Beliveau, Y. (2007). Interface Management — A Facilitator Of Lean
Construction And Agile. In Proceedings IGLC-15, July 2007, Michigan, USA (pp. 57–66).
Chen, Q., Reichard, G., & Beliveau, Y. (2008). Multiperspective Approach to Exploring
Comprehensive Cause Factors for Interface Issues. Journal of Construction Engineering
and Management, 134(6), 432–441.

178
Chen, Q., Reichard, G., & Beliveau, Y. (2010). Object model framework for interface modeling
and IT-oriented interface management. Journal of Construction Engineering and
Management, ASCE, 136(2), 187–198.
Chua, D., & Godinot, M. (2006). Use of a WBS matrix to improve interface management in
projects. Journal of Construction Engineering and Management, 132(1), 67–79.
Collins, R., Durham, R., Fayek, R., & Zeid, W. (2010). Interface management in complex
projects. Petroleum Technology Quarterly, 15(2), 27–35.
Collins, R., Durham, R., Wheeler, F., Limited, E., Fayek, R., & Zeid, W. (2008). Interface
Management. In the 2008 Abu Dhabi International Petroleum Exhibition and Conference
(pp. 1–10).
Construction Industry Institute [CII]. (2000). CII Benchmarking & Metrics Data Report. Texas,
EU.
Corporación de Desarrollo Tecnológico [CDT]. (2002). National Benchmarking System for the
Construction Industry, Report 1 ed. Chile.
Costa, D., Formoso, C., Kagioglou, M., & Alarcon, F. (2004). Performance measurement
systems for benchmarking in the construction industry. International Group for Lean
Construction Conference, 1–13.
Costa, D., Lima, H., & Formoso, C. (2004). Performance measurement systems for
benchmarking in the Brazilian construction industry. Performance Measuring System for
Benchmarking Conference, 1029–1040.
Creswell, J., & Miller, D. (2000). Determining validity in qualitative inquiry. Theory into
Practice, 39(3), 124–130.
Creswell, J. w. (1998). Qualitative Inquiry and Research Design: Choosing among Five
Traditions. Thousand Oaks: CA: Sage.
Crumrine, T., Nelson, R., Cordeiro, C., Loudermilk, M., & Malbrel, C. A. (2005). Interface
Management for Subsea Sand-Control-Completion Systems. In SPE Latin American and
Caribbean Petroleum Engineering Conference, Rio de Janeiro, September 2005 (pp. 1–11).
CSC. (2006). CSC Manual of Practice (MOP) - Part 02. Toronto, Canada: Construction
Specifications Canada (CSC).

179
Fellows, R., & Liu, A. (2012). Managing organizational interfaces in engineering construction
projects: addressing fragmentation and boundary issues across multiple interfaces.
Construction Management and Economics, 30, 653–671.
Flury, B., & Riedwyl, H. (1988). Multivariate Statistics, A Practical Approach (1st editon.).
Springer.
Freeman, R. E. (1984). Strategic Management: A Stakeholder Approach (1st editio.). Boston,
MA, USA: Pitman Publishing.
Godinot, M. (2003). The work breakdown structure matrix: A tool to improve interface
management. Master of Engineering Thesis, National University of Singapore.
Graumann, R. W., & Schlei, D. (1982). Engineering management in Germany: The personal
interface. Engineering Management International, 1(2), 131–140.
Griffith, A., Gibson, G., & Hamilton, M. . (1999). Project success index for capital facility
construction projects. Journal of Performance of Constructed Facilities, 13(1), 39–45.
Haponava, T., & Al-Jibouri, S. (2009). Identifying key performance indicators for use in control
of pre-project stage process in construction. International Journal of Productivity and
Performance Management, 58(2), 160–173.
Healy, P. (1997). Project Management: Getting the Job done on Time and in Budget. Australia:
Butterworth-Heinemann.
Hewage, K. (2007). Construction productivity improvement by worker motivation and IT based
communication. PhD Thesis, Department Of Civil Engineering, University of Calgary,
Calgary, Alberta, Canada.
Hinkle, D., Wiersma, W., & Jurs, S. (2003). Determining Power and Sample Size. In Applied
Statistics for the Behavioral Science (fifth edit., pp. 297–330). Bosten, Newyork: Houghton
Mifflin Company.
Hinze, J., & Tracey, A. (1994). The contractor-subcontractor relationship: the subcontractor’s
view. Journal of Construction Engineering and Management, 120(2), 274–287.
Huang, C. (2007). The study of MRT track project interface problems in knowledge management.
National Central University, Taiwan.
Huang, R., Huang, C., Lin, H., & Ku, W. (2008). Factor Analysis of Interface Problems-a Case
Study Of MRT. Journal of Marine Science and Technology, 16(1), 52–63.

180
Ishikawa, K. (1968). Guide to Quality Control (2nd Edit.). Tokyo: Asian Productivity
Organization.
Jick, T. (1979). Mixing qualitative and quantitative methods: Triangulation in action.
Administrative Science Quarterly, 24(4), 602–611. Retrieved from
http://www.jstor.org/stable/10.2307/2392366
Jugdev, K., Mathur, G., & Fung, T. S. (2007). Project management assets and their relationship
with the project management capability of the firm. International Journal of Project
Management, 25(6), 560–568.
Kajornboon, A. B. (2005). No Title. E-Journal for Researching Teachers (EJRT).
Key Performance Indicators Working Group [KPI]. (2003). Key Performance Indicators for
M&E Contractors; Handbook and Guideline. London.
Korman, T., Fischer, M., & Tatum, C. (2003). Knowledge and reasoning for mechanical,
electrical, and plumbing (MEP) coordination. Journal of Construction Engineering and
Management, 129(6), 627–635.
Ku, H., Lin, J., Huang, C., & Shiu, R. (2010). Development interface knowledge management
system for the Mass Rapid Transit system construction. In proceedings of the 8th
International Conference on Supply Chain Management and Information Systems, Hong
Kong, Oct. 6-8 2010 (pp. 1– 6).
Laan, J., Wildenburg, L., & Kleunen, P. (2000). Dynamic interface management in transport
infrastructure project. In 2nd European Systems Engineering Conference. Munich, Germany
September 13-15 2000.
Miles, R. S., & Ballard, G. (2002). Problems in the interface between mechanical design and
construction: a research proposal. Journal of Construction Research, 3(1), 83–95.
Morris, P. W. G. (1983). Managing Project Interfaces- Key Points for Project Success. In D. E.
Cleland & W. King (Eds.), Project Management Handbook (pp. 407–446). New York: Van
Nostrand.
Mortaheb, M. M., & Rahimi, M. (2010). Interface Management in Mega Oil Refinery Projects.
In 6th International Project Management Conference, Tehran, Iran,Oct 26 -27 2010 (pp. 1–
19).
Ng, H. (2006). Dynamic decision support for contingency management and allocation for
construction projects. University of Illinois at Urbana-Champaign. Retrieved from
http://gradworks.umi.com/32/23/3223680.html

181
Nooteboom, U. (2004). Management: Interface Management Improves On-Time, On-Budget
Delivery of Megaprojects.
Nunnally JC. (1978). Psychometric theory (2nd ed.). New York: McGraw-Hill.
Pavitt, T. C., & Gibb, a. G. F. (2003). Interface Management within Construction: In Particular,
Building Facade. Journal of Construction Engineering and Management, 129(1), 8–15.
Pender, T. (2003). Chapter 12: Modeling the use of a system with the use case diagram. In UML
bible. John Wiley & Sons. Retrieved from http://dl.acm.org/citation.cfm?id=861444
Phillips, T., Gauthier Dickey, C., & Thurimella, R. (2010). Using transitivity to increase the
accuracy of sample-based Pearson correlation coefficients. In 12th International Conference
on Data Ware- housing and Knowledge Discovery (DaWaK) (Vol. 6263, pp. 157–171).
Bilbao, Spain Aug 30- Sep 3, 2010.
Pocock, J., Hyun, C., Liu, L., & Kim, M. (1996). Relationship between project interaction and
performance indicators. Journal of Construction Engineering and Managemen, 122(2),
165–176.
Pole, K. (2007). Mixed Method Designs: A Review of Strategies for Blending Quantitative and
Qualitative Methodologies. Mid-Western Educational Researcher, 20(4), 35–38.
Project Management Institute. (2003). Project Management Body of Knowledge PM Glossary
#D00867 (Third Edit.). Pennsylvania, USA: Project Management Institute, New Town
Square.
Project Management Institute. (2004). A Guide to the Project Management Body of Knowledge
(PMBOK® Guide) (Fifth Edit.). Pennsylvania, USA: Project Management Institute, Four
Campus Boulevard, Newtown Square.
Sanchez, R. (1999). Modular Architectures Marketing Process. Journal of Marketing, Special
Issues, 63, 92–111.
Sanvido, V., Grobler, F., Parfitt, K., & Coyle, M. (1992). Critical success factors for construction
projects. Journal of Construction Engineering and Managemen, 118(1), 94–111.
Schmader, K. J., & Gibson, G. E. (1995). Partnerd project Performance in the U.S. NAVAL
acilities Engineering Command. Project Management Journal, 1–85.
Shokri, S., Safa, M., Haas, C., Haas, R. C. G., Maloney, K., & MacGillivray, S. (2012). Interface
Management Model for Mega Capital Projects. In Construction Research Congress 2012 ©
ASCE 2012 (pp. 447–456).

182
Statistics Canada. (2013). Construction. Retrieved from Statistics Canada (www.statcan.gc.ca)
Stuckenbruck, L. C. (1983). Integration : The Essential Function of Project Management. In D.i.
Cleland and W.R. King (Ed.), ProjectManagement Handbook (2nd ed., pp. 208–232). New
York: Van Nostrand Reinhold.
Sundgren, N. (1999). Introducing interface management in new product family development.
Journal of Product Innovation Management, 16(1), 40–51.
Sutton, R., & Staw, B. (1995). What theory is not. Administrative Science Quarterly, 40(3), 371–
384. Retrieved from http://www.jstor.org/stable/10.2307/2393788
Sweis, G., Sweis, R., Abu Hammad, A., & Shboul, A. (2008). Delays in construction projects:
The case of Jordan. International Journal of Project Management, 26(6), 665–674.
Tabachnick, B., & Fidell, L. (2001). Using multivariate statistics (4th ed.). Northridge,
California: Allyn and Bacon.
The American Institute of Architects (AIA), T. A. G. C. of A. (AGC). (2011). Primer on Project
Delivery (2nd ed., pp. 1–13). U.S.A: The American Institute of Architects and The
Associated General Contractors of America.
The Construction Specifications Institute [CSI]. (2004). The project resource manual: CSI
manual of practice (5th Editio.). McGraw-Hill Professional Publishing.
The Royal Institute of British Architects (RIBA). (2007). Royal Institute of British Architects
Work Stages. Retrieved from http://www.liv.ac.uk/media/livacuk/facilities-
management/policies-and-procedures/RIBA_workstages.pdf
Walker, D. (1995). An investigation into construction time performance. Construction
Management and Economics, 13, 263–274.
Weshah, N., El-Ghandour, W., Cowe Falls, L., & Jergeas, G. (2012a). Analytical approaches to
investigate, identify, and classify interface problems in Alberta’s construction projects. In
proceedings of the Twenty Sixth International Project Management (IPM) Association,
World Congress, Hersonissos, Crete, Greece, Oct.29-31 (pp. 810–819).
Weshah, N., El-Ghandour, W., Cowe Falls, L., & Jergeas, G. (2012b). Interfacing Architects,
Engineers and Construction Contractors. In Proceedings of Second annual Alberta
Graduate Conference 2012, abstract, Edmonton, Alberta, Canada, May 3-5.
Weshah, N., El-Ghandour, W., Cowe Falls, L., & Jergeas, G. (2014a). A New Approach for
Evaluating and Analysing the Impact of Interface Management (IM) on Project

183
Performance during Engineering / Design Phase using Monte Carlo Simulation. In
Proceedings of the Canadian Society for Civil Engineering Conference Halifax,Nova
Scotia, Canada, May 28th -31st, 2014. (pp. GEN–128–1–10).
Weshah, N., El-Ghandour, W., Cowe Falls, L., & Jergeas, G. (2014b). Developing an Interface
Management (IM) Model for Construction Projects. In The Third Abu Dhabi University
Annual Research Conference (3rd ADU-ARC), 23-24 April 2014, Abstract, Abu Dhabi,
United Arab Emirates.
Weshah, N., El-Ghandour, W., Cowe Falls, L., & Jergeas, G. (2014c). Enhancing Project
Performance by Developing Multiple Regression Analysis and Risk Analysis Models for
Interface Management. Canadian Journal of Civil Engineering, 41, 929–944.
Weshah, N., El-Ghandour, W., Cowe Falls, L., & Jergeas, G. (2014d). The Impact of IM on
Construction Project Performance during Design Phase. Submitted to Journal of
Construction Management.
Weshah, N., El-Ghandour, W., Jergeas, G., & Cowe Falls, L. (2013a). A Framework for
Developing Prediction Model of Interface Management (IM) for Construction Projects in
Alberta. In proceedings of the Canadian Society for Civil Engineering Conference (CSCE),
4th Construction Specialty Conference, Montreal, Canada, May 29 - June 1, 2013 (pp.
CON–57–1–11).
Weshah, N., El-Ghandour, W., Jergeas, G., & Cowe Falls, L. (2013b). Factor Analysis of the
Interface Management (IM) Problems for Construction Projects in Alberta. Canadian
Journal of Civil Engineering, 40(7), 848–860.
Weston, D., & Gibson, G. . (1993). Partnering project performance in US Army Corps of
Engineers. Journal of Management in Engineering, 9(4), 410–425.
Wideman, R. M. (2002). Wideman comparative glossary of project management terms v3.1.
Retrieved from http://www.maxwideman.com/pmglossary/PMG_I03.htm
Wren, D. (1967). Interface and Inter organizational Coordination. Academy of Management
Journal, 10(1), 69–81.
Yan, A., & Louis, M. R. (1999). The Migration of Organizational Functions to the Work Unit
Level: Buffering, Spanning, and Bringing Up Boundaries. Human Relations, 52(1), 25–47.
Yu, I., Kim, K., Jung, Y., & Chin, S. (2005). Comparable Performance Measurement System for
Construction Companies. Journal of Management in Engineering, 23(131-139).

184
Appendix I: ETHICS APPROVAL

185
Appendix II: List of the Collected IM Problems Based on Literature Review
Table II.1 Detailed List of the Collected IM Problems Based on Literature Review
No. Interface problems References
1 Insufficient negotiation, communication, and coordination
among relevant project participants, e.g., (a) insufficient
information standards, (b) poor relationships between
organization and human, (c) unknown data required,
(d) language and culture differences, (e) ignorance of
interface ownership, responsibilities, problems, and (f) poor
coordination between design and construction teams..
Al-Hammad & Al-Hammad
(1996); Al-Hammad (1993,
2000); Ayudhya (2011);
Chen et al. (2008);
Graumann & Schlei (1982);
R. Huang et al. (2008); Ku et
al. (2010)
2 Financial difficulties, e.g., (a) delay in owner payment,
(b) disputes among different project participants because of
cost, and (c) insufficient budget for project design and
construction
Al-Hammad & Assaf (1992);
Al-Hammad (1995, 2000);
Ayudhya (2011); Chen et al.
(2008); R. Huang et al.
(2008); Ku et al. (2010)
3 Poor decision making, e.g., (a) delay in decision-making by
the clients, (b) the difficulty of the project design and
construction, (c) poor policy for managing the relationships
inside the company, (d) insufficient experience in design and
construction, and (e) outdated and insufficient project data
Al-Hammad (2000);
Ayudhya (2011); Chen et al.
(2008); R. Huang et al.
(2008); Ku et al. (2010)
4 Limited skills for labour and engineering, e.g., insufficient
training programs
Al-Hammad (1993, 1995,
2000); Ayudhya (2011);
Chen et al. (2008); R. Huang
et al. (2008); Ku et al.
(2010).
5 Materials procurement problems, e.g., (a) late ordering of
long-lead items and special materials, (b) imprecise
quantities of project materials, and (c) delay in arrival of
project’s materials because of bad supply chain management
and logistics, poor quality of project materials, and the local
market’s inability to supply necessary materials
Al-Hammad (2000); Chen et
al. (2008)
6 Construction process problems, e.g., (a) bad quality of
finished construction work, (b) delays in construction
process, (c) the complexity of the construction process
because of too many project elements and using a new
technology, (d) bad design tasks sequence and management
techniques, (e) poor supervision of interfaces, (f) delays in
approval for the completed work, and (g) modularization via
site fabrication methods
Al-Hammad (1993, 2000);
Ayudhya (2011); Chen et al.
(2008)

186
Table II.1 cont’d
No. Interface problems References
7 Engineering process problems related to interfaces, e.g., (a) poor
quality of the design, (b) level of design complexity of the
project because of increased number of physical interfaces, the
complexity of system integration, and the diversity of the project
components and elements, (c) lack of awareness of design for
manufacturing and gathering of the project elements and parties,
(d) bad design interfaces because of insufficient understanding of
interfaces and lack of experiences and skills by the design team,
(e) insufficient well-matched design standards, (f) poor
architecture product in terms of modularity and project elements
combination, and (g) during the design planning, lack of
awareness of the multi-disciplinary type of the project
Al-Hammad & Assaf;
(1992); Chen et al.
(2008)
8 Project site issues, e.g., (a) insufficient space in the project field
for the materials, labour, and equipment because of many
reasons, e.g., unorganized project field and simultaneous work
tasks, and (b) excessive usage of heavy equipment at site (tower
crane, heavy trucks)
Chen et al. (2008)
9 Information problems, e.g., inaccurate and delays in information
and repetition in information loop
Chen et al. (2008)
10 Lack of project management, e.g., (a) bad safety management,
(b) bad quality management and control, (c) bad risk
management, and (d) bad management of the relations among
different project sub-contractors
Chen et al. (2008);
Mortaheb & Rahimi
(2010)
11 Lack of IM, e.g., (a) late starting of IM, (b) lack of awareness of
IM and interface problems, and (c) unsuccessful managing of the
interface conflicts happening within the project because of
inadequate interface documents, insufficient sources, knowledge,
and special staffs for IM, and insufficient interface documents
and databases
Chen et al. (2008)
12 Planning and scheduling problems, e.g., (a) disagreeing in the
project plan, (b) bad scheduling and planning because of:
multidiscipline nature of the project, lack of awareness of project
tasks relations and orders and sources restrictions, (c) the
condensed schedule when the project applies the fast-tracking
techniques, and (d) scheduling conflicts among relevant project
participants because of bad control on project schedule and
update
Chen et al. (2008);
R. Huang et al. (2008);
Ku et al. (2010)

187
Table II.1 cont’d
No. Interface problems References
13 Imprecise project cost estimate Al-Hammad & Al-
Hammad (1996); Al-
Hammad (2000);
Ayudhya (2011);
R. Huang et al. (2008);
Ku et al. (2010)
14 Discrepancies among the owners’ expectations regarding project
construction schedule, cost. and quality
Ku et al. (2010)
15 Lack of personal experience of the project teams Al-Hammad & Al-
Hammad (1996);
R. Huang et al. (2008);
Ku et al. (2010)
16 Inability to predict and resolve project’s problems related to new
technological techniques and materials
Ku et al. (2010)
17 Contractor’s unfamiliarity with the environmental circumstances
and local weather
Al-Hammad (1995)
18 Project team members’ lack of knowledge about site
circumstances
Al-Hammad & Assaf
(1992)
19 Increased project interfaces conflicts when different contractors
insist on their points of view
Ku et al. (2010)
20 Insufficient and inaccurate work drawings and specifications,
e.g., (a) lack of interface details within work drawings and
specifications, insufficient interface categorization and
descriptions in the literature, (b) insufficient standards for the
interface, (c) within the scope of the work, unclear interface
responsibilities and ownerships, and (d) unclear and insufficient
descriptions of work tasks engaged in interface
Al-Hammad & Al-
Hammad (1996); Al-
Hammad (1993, 2000);
Ayudhya (2011); Chen
et al. (2008)
21 No proper work packaging design and subcontracting because of
many reasons, e.g., (a) lack of awareness of relations among
project elements, parties, and sub-systems, (b) lack of awareness
of relations between IM and sub-contracting, and (c) unsuitable
project breakdown structure
Al-Hammad & Assaf
(1992); Chen et al.
(2008)

188
Table II.1 cont’d
No. Interface problems References
22 Slow submission and approval of change orders, permits,
and shop drawings, e.g., (a) slow change order approval, (b)
no attention to interfaces while changing involved project
parties, (c) inappropriate schedule of sample materials and
shop drawings approval, (d) confused submission
procedures, (e) no schedule time for submission and review
processes, and (f) bad quality of submitted documents
Al-Hammad (1993, 2000);
Ayudhya (2011); Chen et al.
(2008); Ku et al. (2010)
23 Unclear contract details and badly written contract, e.g.,
(a) undetermined labour skills in contract, (b) insufficient
penalty clause in contract, and (c) interface responsibilities
not included within the contract documents
Al-Hammad & Al-Hammad
(1996); Al-Hammad (2000);
Ayudhya (2011); R. Huang
et al. (2008)
24 Delay in established schedule of engineering, procurement,
and construction, and delay in owner approval of completed
tasks
Al-Hammad (1995)
25 Application of fast-track engineering and construction
techniques
Al-Hammad & Assaf (1992)
26 Weather and climate conditions problems, e.g., (a) not
enough consideration of weather issues in planning because
of inaccurate weather information and ignoring of the effect
of weather conditions on interfaces, (b) unsuccessful
management of the risks related to weather conditions, and
(c) unanticipated harsh weather circumstances
Al-Hammad (2000);
Ayudhya (2011); Chen et al.
(2008); R. Huang et al.
(2008).
27 Unexpected changes in materials and labour availability and
cost
Al-Hammad (1993, 2000);
Ayudhya (2011); Chen et al.
(2008); R. Huang et al.
(2008); Ku et al. (2010).
28 Geotechnical circumstances problems, e.g., (a) lack of
information on the geological examination, (b) unsuitable
selection of design/construction techniques, and
(c) unanticipated site circumstances
Al-Hammad (2000); Chen et
al. (2008); R. Huang et al.
(2008); Ku et al. (2010).
29 Inexperience with government auditing protocols and
procedures
R. Huang et al. (2008); Ku
et al. (2010)
30 Inexperience with local laws and other government
regulations and modification in laws and regulations
Al-Hammad (2000);
R. Huang et al. (2008); Ku
et al. (2010)
31 Inexperience with building codes, by-laws, statutes, and
other government regulations
Al-Hammad & Assaf
(1992); Chen et al. (2008)

189
Appendix III: Survey Instrument One (Throughout project lifecycle)
SECTION 1. Demographic Information:
1.1 The type of company you are working for (please check the most appropriate one):
Owner
EPC
EPCM
Construction Contractor/Sub-contractor
Engineering Consultant
Architecture Firms
Architecture and Engineering Firms
Construction Management Company
Other (Pls. specify)………………………
1.2 Respondent’s title/position (please check the most appropriate one):
Lead (Safety, Procurement, etc.)
Project Controls
Interface Coordinator
Contract Administrator
Project Engineer
Commissioning Engineer
Quality Engineer
Planning Engineer
Project Manager
Construction Manager

190
Construction Planner
Contractor/sub-contractor
Engineer (Structural, Mechanical, Electrical)
Architect
Project Eng. Manager
Student (Pls. specify in which Faculty)……
Other (Pls. specify)…………………….
1.3 The main industry your company is working in (you can pick more than one answer ):
Infrastructure
Oil and Gas
Transportation
Commercial and Buildings
Manufacturing
Other (Pls. specify)………………………
1.4 Highest Educational Qualifications:
Diploma
Post Diploma
BSc
MSc
PhD
Other (Pls. specify)………………
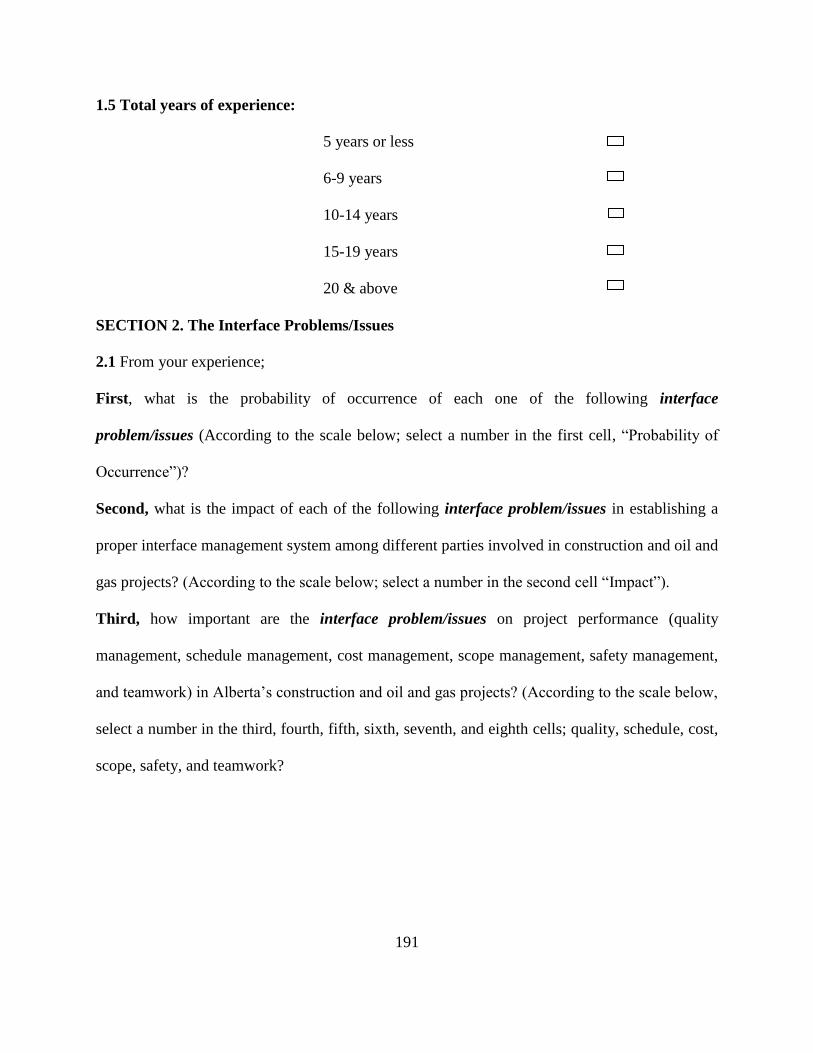
191
1.5 Total years of experience:
5 years or less
6-9 years
10-14 years
15-19 years
20 & above
SECTION 2. The Interface Problems/Issues
2.1 From your experience;
First, what is the probability of occurrence of each one of the following interface
problem/issues (According to the scale below; select a number in the first cell, “Probability of
Occurrence”)?
Second, what is the impact of each of the following interface problem/issues in establishing a
proper interface management system among different parties involved in construction and oil and
gas projects? (According to the scale below; select a number in the second cell “Impact”).
Third, how important are the interface problem/issues on project performance (quality
management, schedule management, cost management, scope management, safety management,
and teamwork) in Alberta’s construction and oil and gas projects? (According to the scale below,
select a number in the third, fourth, fifth, sixth, seventh, and eighth cells; quality, schedule, cost,
scope, safety, and teamwork?

192
Table III.1 Survey questions
Negligible Disastrous Unimportant Very
Important
Interface Problems/Issues
Impact
Project Performance
Qual
ity
Sch
edule
Cost
Sco
pe
Saf
ety
Tea
mw
ork
2.1.1 Lack of enough negotiation and communication & coordination.
2.1.2 Financial difficulties.
2.1.3 Poor decision making.
2.1.4 Limited skills for labour and engineering, for example,
insufficient training programs.
2.1.5 Materials procurement problems.
2.1.6 Construction processes and methods problems.
2.1.7 Engineering process problems related to interfaces.
2.1.8 Project site issues.
2.1.9 Information problems.
2.1.10 Lack of project management.
2.1.11 Lack of interface management system.
2.1.12 Planning and scheduling problems.
2.1.13 Type of organization structure.
2.1.14 Interfaces with other interdependent projects
2.1.15 Undefined reporting structure and responsibilities
2.1.16 Interfaces arise because of the application of the project
development gating (or phases) system.

193
Table III.1 cont’d
Negligible Disastrous Unimportant Very
Important
Interface Problems/Issues
Impact
Project Performance
Qual
ity
Sch
edule
Cost
Sco
pe
Saf
ety
Tea
mw
ork
2.1.17 Insufficient and lack of alignment among WBS, CWBS, CBS, &
OBS.
2.1.18 Imprecise project cost estimate.
2.1.19 Discrepancies among the owners’ expectations regarding project
construction schedule, cost. and quality
2.1.20 Lack of personal experience of the project teams.
2.1.21 Inability to predict and resolve project’s problems related to new
technological techniques and materials
2.1.22 Contractor’s unfamiliarity with the environmental circumstances
and local weather.
2.1.23 Project team members’ lack of knowledge about site
circumstances
2.1.24 Increase project interfaces conflicts when different contractors
insist on their points of view.
2.1.25 Lack of trust among different project parties.
2.1.26 Insufficient and inaccurate work drawings and specifications.
2.1.27 No proper work packaging design and subcontracting.
2.1.28 Slow submission and approval of change orders, permits, and
shop drawings.

194
Table III.1 cont’d
Negligible Disastrous Unimportant Very
Important
Interface Problems/Issues
Impact
Project Performance
Qual
ity
Sch
edule
Cost
Sco
pe
Saf
ety
Tea
mw
ork
2.1.29 Unclear contract details and poorly written contract.
2.1.30 Delay in established schedule of engineering, procurement, and
construction, and delay in owner approval of completed tasks.
2.1.31 Type of the contract doesn’t match the nature of the project.
2.1.32 Application of fast-track engineering and construction
techniques.
2.1.33 Lack of solid contracting strategy vision at early stage of the
project.
2.1.34 Type of contracting strategy; EP, EPC, and EPCM.
2.1.35 In the invitation to tender, identify the interface problems.
2.1.36 Complete appraisal of bids to comprise an assessment of
contractor’s understanding of interface management.
2.1.37 Weather climate conditions problems.
2.1.38 Unexpected changes in materials and labour availability and
cost.
2.1.39 Geological circumstances problems. For example, lack of
information on the geological examination.

195
Table III.1 cont’d
Negligible Disastrous Unimportant Very
Important
Interface Problems/Issues
Impact
Project Performance
Qual
ity
Sch
edule
Cost
Sco
pe
Saf
ety
Tea
mw
ork
2.1.40 Unclear company standard operating procedures.
2.1.41 Inexperience with the government auditing protocols and
procedures.
2.1.42 Inexperience with local laws and other government regulations
and modification in laws and regulations.
2.1.43 Inexperience with building codes, by-laws, statutes and other
government regulations.
2.1.44 Project extension versus greenfield (new) project type.
2.1.45 Free issue items. For example, owner supply concrete and
gravel, fly-in-out and camp services to the construction
contractors for free.
2.1.46 Insufficient definition of projects boundaries at early stage of
the project.
2.1.47 Unclear system completion requirements.

196
From your experience, what do you suggest and recommend improving the interface
management? (Please write below.)
…………………………………………………………………………………………………..…..
………………………………………………………………………………………………………
Do you agree to go for an interview as part of follow up? 1. Yes 2. No
If yes, please write down your email address (Print please)
……………………………………………..................................................................................
If you would like to get the final findings of this study, please write down your email address
please)………………………………………………………………………………………………

197
Appendix IV: Survey Instrument Two during the Engineering Design Phase
Title: Interface Management during Engineering/Design phase projects/ Inside Alberta.
Purpose: The purpose of the first survey is to collect data during the design phases.
SECTION 1. Demographic Information:
1.6 The type of company you are working for (please check the most appropriate one):
Owner
EPC
EPCM
Engineering Consultant
Architecture Firms
Architecture and Engineering Firms
Construction Management Company
Other (Pls. specify)………………………
1.7 Respondent’s title/position (please check the most appropriate one):
Lead (Structural, Mechanical, etc.)
Project Controls
Interface Coordinator
Project Engineer
Quality Engineer
Planning Engineer
Project Manager
Contractor/sub-contractor

198
Engineer (Structural, Mechanical, Electrical)
Architect
Project Eng. Manager
Other (Pls. specify)…………………….
1.8 The main industry your company is working in (you can pick more than one answer):
Infrastructure
Oil and Gas
Transportation
Commercial and Buildings
Manufacturing
Other (Pls. specify)………………………
1.9 Highest Educational Qualifications:
Diploma and Post Diploma
BSc
MSc
PhD
Other (Pls. specify)…………………
1.10 Total years of experience:
5 years or less
6-9 years
10-14 years
15-19 years
20 & above

199
1.11 In your current projects, what is the average complexity of the construction projects?
High complexity
Medium complexity
Low complexity
SECTION 2. The Interface Problems/Issues
2.1 From your experience;
First, from your experience what is the impact of the IM problems during Engineering Design
phase projects?
Second, how important are the interface problem/issues on project performance (quality
management, schedule management, cost management, scope management, safety management,
and teamwork) during Engineering Design phase of EPC (Engineering, procurement, and
construction) projects? (According to the scale below, select a number in the third, fourth, fifth,
sixth, seventh, and eighth cells; quality, schedule, cost, scope, safety, and teamwork?

200
Table IV.1 Survey questions
Negligible Disastrous Unimportant Very
Important
Interface Problems/Issues
Impact
Project Performance
Qual
ity
Sch
edule
Cost
Sco
pe
Saf
ety
Tea
mw
ork
2.1.1 Lack of enough negotiation and communication and
coordination.
2.1.2 Financial difficulties.
2.1.3 Poor decision making.
2.1.4 Limited skills for labour and engineering.
2.1.5 Engineering process problems related to interfaces
2.1.6 Information problems.
2.1.7 Lack of project management.
2.1.8 Lack of interface management system.
2.1.9 Planning and scheduling problems.
2.1.10 Type of organization structure.
2.1.11 Interfaces with other interdependent projects
2.1.12 Undefined reporting structure and responsibilities.
2.1.13 Insufficient and lack of alignment among WBS, CWBS, CBS,
& OBS.
2.1.14 Lack of personal experience of the project teams.

201
Table IV.1 cont’d
Negligible Disastrous Unimportant Very
Important
Interface Problems/Issues
Impact
Project Performance
Qual
ity
Sch
edule
Cost
Sco
pe
Saf
ety
Tea
mw
ork
2.1.15 Lack of trust among different project parties.
2.1.16 Insufficient and inaccurate work drawings and specifications.
2.1.17 No proper work packaging design and subcontracting.
2.1.18 Delay in established schedule of engineering, and delay in
owner approval of completed tasks.
2.1.19 Type of contracting strategy; EP, EPC, and EPCM.
2.1.20 Inexperience with local laws and other government
regulations and modification in laws and regulations.
2.1.21 Inexperience with building codes, by-laws, statutes and other
government regulations.
2.1.22 Unclear system completion requirements.
If you would like to get the final findings of this study, please write down your email address (Print please):
……………………
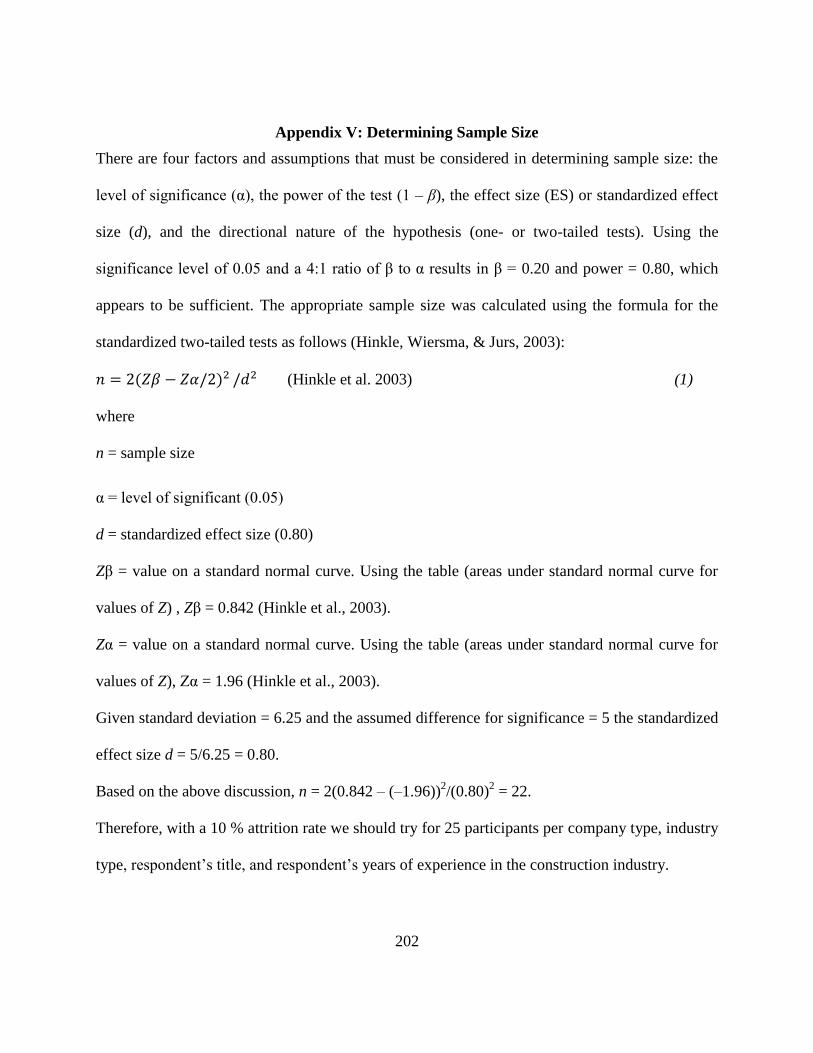
202
Appendix V: Determining Sample Size
There are four factors and assumptions that must be considered in determining sample size: the
level of significance (α), the power of the test (1 – β), the effect size (ES) or standardized effect
size (d), and the directional nature of the hypothesis (one- or two-tailed tests). Using the
significance level of 0.05 and a 4:1 ratio of β to α results in β = 0.20 and power = 0.80, which
appears to be sufficient. The appropriate sample size was calculated using the formula for the
standardized two-tailed tests as follows (Hinkle, Wiersma, & Jurs, 2003):
𝑛 = 2(𝑍𝛽 − 𝑍𝛼/2)2 /𝑑2 (Hinkle et al. 2003) (1)
where
n = sample size
α = level of significant (0.05)
d = standardized effect size (0.80)
Zβ = value on a standard normal curve. Using the table (areas under standard normal curve for
values of Z) , Zβ = 0.842 (Hinkle et al., 2003).
Zα = value on a standard normal curve. Using the table (areas under standard normal curve for
values of Z), Zα = 1.96 (Hinkle et al., 2003).
Given standard deviation = 6.25 and the assumed difference for significance = 5 the standardized
effect size d = 5/6.25 = 0.80.
Based on the above discussion, n = 2(0.842 – (–1.96))2/(0.80)
2 = 22.
Therefore, with a 10 % attrition rate we should try for 25 participants per company type, industry
type, respondent’s title, and respondent’s years of experience in the construction industry.

203
Appendix VI: Results of the Pearson Product-Moment Correlation: Project Lifecycle
Table VI.1 Results of the Pearson Product-Moment Correlation: Project Lifecycle
1 2 3 4 5 6 7 8 9 10 11 12 13 14 15 16 17 18 19 20 21 22 23
1 1
2 0.4 1
3 0.3 0.3 1
4 0.3 0.4 0.3 1
5 0.3 0.3 0.4 0.4 1
6 0.3 0.3 0.4 0.3 0.4 1
7 0.4 0.3 0.4 0.5 0.5 0.5 1
8 0.3 0.2 0.3 0.3 0.4 0.4 0.5 1
9 0.4 0.4 0.4 0.4 0.5 0.4 0.6 0.5 1
10 0.4 0.4 0.4 0.3 0.4 0.4 0.5 0.4 0.5 1
11 0.5 0.3 0.4 0.4 0.5 0.4 0.5 0.5 0.6 0.5 1
12 0.3 0.3 0.4 0.4 0.4 0.4 0.5 0.4 0.5 0.4 0.5 1
13 0.4 0.4 0.3 0.5 0.3 0.3 0.4 0.3 0.5 0.5 0.5 0.4 1
14 0.3 0.3 0.3 0.3 0.4 0.3 0.4 0.2 0.4 0.4 0.4 0.4 0.4 1
15 0.4 0.3 0.3 0.3 0.4 0.4 0.4 0.5 0.5 0.4 0.4 0.4 0.5 0.4 1
16 0.3 0.2 0.3 0.4 0.3 0.3 0.3 0.3 0.4 0.3 0.3 0.3 0.5 0.3 0.4 1
17 0.4 0.3 0.2 0.4 0.4 0.3 0.5 0.4 0.5 0.4 0.6 0.5 0.6 0.4 0.6 0.4 1
18 0.3 0.3 0.3 0.4 0.4 0.2 0.4 0.3 0.5 0.3 0.4 0.5 0.3 0.4 0.5 0.4 0.5 1
19 0.4 0.3 0.4 0.4 0.4 0.3 0.5 0.3 0.5 0.4 0.4 0.5 0.4 0.4 0.3 0.3 0.4 0.5 1
20 0.4 0.3 0.3 0.3 0.4 0.3 0.5 0.4 0.5 0.4 0.5 0.4 0.4 0.4 0.4 0.2 0.5 0.3 0.4 1
21 0.3 0.3 0.3 0.3 0.3 0.3 0.4 0.3 0.3 0.4 0.4 0.3 0.3 0.4 0.4 0.2 0.2 0.4 0.4 0.4 1
22 0.2 0.3 0.3 0.4 0.3 0.5 0.5 0.4 0.4 0.4 0.3 0.3 0.3 0.3 0.4 0.3 0.2 0.3 0.4 0.4 0.4 1
23 0.4 0.3 0.3 0.4 0.4 0.4 0.5 0.5 0.4 0.5 0.4 0.3 0.4 0.4 0.4 0.4 0.3 0.3 0.4 0.4 0.5 0.7 1
24 0.4 0.3 0.3 0.3 0.3 0.3 0.4 0.3 0.3 0.3 0.4 0.5 0.4 0.4 0.4 0.4 0.4 0.4 0.3 0.4 0.4 0.5 0.5
25 0.4 0.4 0.3 0.4 0.5 0.4 0.5 0.4 0.6 0.5 0.5 0.5 0.5 0.4 0.4 0.5 0.5 0.4 0.5 0.5 0.4 0.5 0.5
26 0.4 0.4 0.4 0.4 0.6 0.4 0.6 0.4 0.5 0.5 0.6 0.5 0.4 0.4 0.4 0.3 0.5 0.4 0.5 0.5 0.4 0.4 0.5
27 0.4 0.2 0.3 0.3 0.5 0.4 0.5 0.5 0.5 0.5 0.6 0.4 0.4 0.4 0.5 0.4 0.4 0.2 0.4 0.4 0.5 0.5 0.6
28 0.3 0.3 0.4 0.3 0.4 0.4 0.5 0.3 0.4 0.4 0.5 0.5 0.5 0.4 0.3 0.3 0.4 0.3 0.3 0.4 0.4 0.4 0.5
29 0.4 0.3 0.3 0.3 0.4 0.4 0.5 0.3 0.5 0.5 0.5 0.4 0.4 0.4 0.4 0.3 0.4 0.4 0.4 0.4 0.4 0.5 0.6
30 0.4 0.4 0.4 0.3 0.4 0.3 0.5 0.2 0.5 0.4 0.5 0.5 0.4 0.4 0.4 0.4 0.4 0.5 0.5 0.4 0.4 0.4 0.4
31 0.2 0.3 0.3 0.2 0.4 0.2 0.5 0.3 0.3 0.4 0.4 0.4 0.3 0.3 0.4 0.3 0.3 0.4 0.2 0.3 0.5 0.4 0.5
32 0.3 0.3 0.4 0.3 0.4 0.3 0.4 0.2 0.5 0.3 0.4 0.5 0.4 0.4 0.4 0.3 0.4 0.4 0.5 0.4 0.3 0.4 0.4
33 0.2 0.2 0.2 0.2 0.4 0.3 0.3 0.3 0.3 0.4 0.4 0.5 0.4 0.4 0.3 0.3 0.3 0.3 0.3 0.2 0.2 0.4 0.4
34 0.3 0.3 0.2 0.2 0.4 0.4 0.5 0.3 0.3 0.3 0.4 0.4 0.4 0.3 0.2 0.3 0.4 0.3 0.2 0.3 0.2 0.3 0.4
35 0.3 0.2 0.3 0.3 0.4 0.3 0.4 0.4 0.4 0.3 0.4 0.4 0.4 0.4 0.3 0.3 0.4 0.3 0.4 0.4 0.3 0.4 0.5
36 0.3 0.2 0.2 0.3 0.3 0.3 0.4 0.3 0.3 0.3 0.3 0.4 0.4 0.3 0.2 0.3 0.3 0.3 0.3 0.3 0.2 0.4 0.4
37 0.4 0.3 0.2 0.4 0.4 0.2 0.3 0.2 0.3 0.3 0.3 0.2 0.3 0.4 0.3 0.2 0.2 0.4 0.3 0.1 0.3 0.3 0.4
38 0.4 0.4 0.3 0.4 0.5 0.3 0.5 0.3 0.4 0.5 0.5 0.5 0.3 0.4 0.4 0.3 0.5 0.5 0.4 0.5 0.4 0.4 0.5
39 0.3 0.3 0.2 0.2 0.3 0.3 0.4 0.2 0.3 0.4 0.3 0.3 0.2 0.4 0.3 0.1 0.2 0.2 0.3 0.2 0.4 0.4 0.5
40 0.4 0.3 0.2 0.4 0.3 0.3 0.4 0.4 0.4 0.4 0.4 0.4 0.4 0.3 0.4 0.3 0.4 0.3 0.2 0.3 0.3 0.4 0.6
41 0.3 0.3 0.1 0.2 0.3 0.2 0.4 0.4 0.4 0.3 0.3 0.3 0.3 0.3 0.3 0.2 0.3 0.3 0.2 0.2 0.3 0.5 0.6
42 0.3 0.2 0.2 0.3 0.3 0.4 0.4 0.4 0.3 0.3 0.3 0.2 0.3 0.4 0.3 0.2 0.2 0.2 0.3 0.3 0.4 0.5 0.7
43 0.3 0.3 0.2 0.3 0.3 0.2 0.3 0.3 0.3 0.3 0.3 0.3 0.2 0.4 0.2 0.1 0.1 0.3 0.3 0.3 0.4 0.4 0.6
44 0.4 0.1 0.2 0.2 0.2 0.3 0.4 0.2 0.4 0.2 0.3 0.2 0.2 0.3 0.3 0.2 0.4 0.2 0.1 0.2 0.0 0.2 0.2
45 0.3 0.3 0.3 0.2 0.2 0.3 0.3 0.2 0.4 0.4 0.4 0.4 0.4 0.3 0.3 0.2 0.5 0.2 0.3 0.3 0.2 0.2 0.2
46 0.1 0.1 0.2 0.1 0.2 0.3 0.3 0.2 0.3 0.3 0.3 0.4 0.4 0.3 0.3 0.2 0.3 0.2 0.2 0.2 0.2 0.2 0.3
47 0.3 0.2 0.3 0.3 0.3 0.3 0.4 0.4 0.4 0.4 0.5 0.5 0.4 0.4 0.4 0.2 0.4 0.4 0.3 0.3 0.3 0.3 0.4

204
Table VI.1 cont’d
24 25 26 27 28 29 30 31 32 33 34 35 36 37 38 39 40 41 42 43 44 45 46 47
1
0.5 1
0.5 0.5 1
0.5 0.5 0.6 1
0.5 0.4 0.5 0.6 1
0.5 0.6 0.6 0.5 0.5 1
0.5 0.5 0.6 0.5 0.6 0.6 1
0.5 0.4 0.5 0.5 0.3 0.5 0.5 1
0.4 0.5 0.5 0.4 0.5 0.4 0.5 0.3 1
0.5 0.4 0.4 0.5 0.3 0.5 0.4 0.5 0.3 1
0.5 0.3 0.3 0.5 0.4 0.4 0.5 0.5 0.4 0.6 1
0.5 0.4 0.4 0.4 0.4 0.5 0.4 0.4 0.4 0.5 0.5 1
0.4 0.3 0.4 0.4 0.4 0.4 0.4 0.3 0.4 0.4 0.5 0.6 1
0.2 0.3 0.4 0.3 0.2 0.3 0.3 0.3 0.2 0.2 0.2 0.3 0.2 1
0.5 0.4 0.6 0.4 0.5 0.4 0.6 0.5 0.5 0.3 0.4 0.4 0.3 0.4 1
0.4 0.3 0.4 0.4 0.4 0.5 0.5 0.4 0.4 0.4 0.4 0.3 0.4 0.3 0.4 1
0.5 0.4 0.3 0.5 0.4 0.4 0.3 0.4 0.2 0.5 0.5 0.4 0.5 0.2 0.3 0.4 1
0.5 0.4 0.4 0.5 0.4 0.5 0.4 0.4 0.3 0.4 0.4 0.5 0.5 0.3 0.4 0.4 0.6 1
0.5 0.4 0.4 0.5 0.4 0.5 0.4 0.4 0.3 0.3 0.4 0.4 0.5 0.3 0.4 0.5 0.6 0.8 1
0.4 0.4 0.4 0.5 0.3 0.5 0.4 0.4 0.2 0.3 0.2 0.3 0.4 0.3 0.4 0.4 0.4 0.6 0.8 1
0.3 0.2 0.4 0.3 0.3 0.3 0.4 0.1 0.2 0.3 0.5 0.3 0.3 0.2 0.3 0.2 0.2 0.2 0.2 0.1 1
0.3 0.4 0.3 0.3 0.3 0.4 0.3 0.3 0.3 0.4 0.5 0.4 0.3 0.2 0.3 0.2 0.4 0.4 0.3 0.2 0.4 1
0.3 0.4 0.2 0.3 0.3 0.4 0.3 0.3 0.3 0.5 0.4 0.4 0.5 0.2 0.2 0.3 0.4 0.4 0.4 0.4 0.4 0.5 1
0.5 0.4 0.4 0.5 0.4 0.5 0.4 0.4 0.3 0.6 0.5 0.5 0.5 0.2 0.3 0.3 0.6 0.5 0.4 0.4 0.3 0.5 0.6 1

205
Appendix VII: Multiple-Regression Results for Six Project Performance Indicators:
Project Lifecycle
This materials in this appendix were included in Weshah et al. (2014).
“Multiple regression is a statistical technique that allows us to predict someone’s score on one
variable on the basis of their scores on several other variables”, where the researchers can predict
one variable on the basis of a number of other variables (Brace et al., 2006). The contribution of
each predictor variable can be measured by using various techniques such as the stepwise
method. The stepwise method is an approach that assists the researcher to end up with the
smallest number of significant predictor variables to be included in the final model.
Researchers must abide by two assumptions before applying the multiple-regression analysis:
(1) the square distances of the points to the regression line need to be normally distributed. The
SPSS® prints out a scatter plot to see if the researchers conform to this assumption, and (2) the
correlation between criterion variables and predictor variables must not be higher than 0.80. To
check this, the bivariate correlation between the criterion variables and predictor variables should
be examined; this is titled “collinearity” in SPSS®. The collinearity diagnostics table “gives
some useful additional output that allows you to assess whether you have a problem with
Collinearity in your data” (Brace et al., 2006). The term collinearity “is used to describe the
situation when a high correlation is detected between two or more predictor variables. Such high
correlations cause problems when trying to draw inferences about the relative contribution of
each predictor variable to the success of the model” (Brace et al., 2006). The results show that
our data conforms to these two assumptions and are reasonable enough to build multiple-
regression models. For more details, Table VII.1 illustrates the model where “quality” is used as

206
the dependent variable. The overall p-value for this model was 0.00, lower than 0.05, which
indicated that different interface problems would have a major influence on the quality project
performance. In addition, R2 was 0.464 and the adjusted R
2 was 0.456: These values were much
better than the lowest accepted standard of 0.18 (Flury & Riedwyl, 1988). In more detail, the p-
values for the management factor and the law and regulation factor were 0.00 and 0.00,
respectively, which is lower than 0.05. Consequently, it can be seen that quality management
would be positively influenced by these two interface problem factors only. Moreover, the β for
the management factor and the law and regulation factor were 0.487 and 0.285, respectively,
which indicated that the law and regulation factor influences the quality management less than
the management factor.
Moreover, Table VII.1 illustrates the full details of the model where schedule management is
used as the dependent variable. Consequently, it can be seen that schedule management would be
positively influenced by these four interface problem factors only. Also, the β for the technical
engineering and site issues factor, information factor, bidding and contracting factor, and law and
regulation factor were 0.354, 0.225, 0.181, and 0.152, respectively, which indicates that the
technical engineering and site issues factor positively influences the schedule management more
than the information factor, bidding and contracting factor, and the law and regulation factor.
In addition, Table VII.1 also shows full details on the model where cost management is used as
the dependent variable. The β for the technical engineering and site issues factor, bidding and
contracting factor, and information factor were 0.399, 0.259, and 0.218, respectively, which
indicates that the technical engineering and site issues factor positively influences cost
management more than the bidding and contracting factor and the information factor.

207
Moreover, Table VII.1 gives full details on the model where scope management is used as the
dependent variable. Consequently, it can be seen that scope management would be positively
influenced by these two interface problem factors only. Moreover, the β value for the
management factor and law and regulation factor were 0.521 and 0.204, respectively, which
indicated that the management factor positively influences cost management more than the law
and regulation factor. In addition, Table VII.1 shows details on the model where safety
management is used as the dependent variable. Consequently, it can be seen that safety
management would be positively influenced by this problem factor only.
Moreover, Table VII.1 shows full details on the model where teamwork management is used as
the dependent variable. β for the management factor and law and regulation factor were 0.455
and 0.338, respectively, which indicated that the management factor influences teamwork
management more than the law and regulation factor.
Table VII.1: Multiple-Regression Results for Six Project Performance Indicators
1. Dependent value: quality management
Independent variable B Standardized coefficient (β) P value
Constant 0.529 0.129
Management factor 0.621 0.487 0.00
Law and regulation factor 0.248 0.285 0.00
Model P value 0.000; R2 =0.464; Adjusted R
2 = 0.456. Note: means p value <0.05
2. Dependent value: schedule management
Independent variable B Standardized coefficient (β) P value
Constant 0.828 0.003
Technical engineering and site issues factor 0.434 0.354 0.000
Information factor 0.231 0.225 0.008
Bidding and contracting factor 0.199 0.181 0.041
Law and regulation factor 0.132 0.152 0.049
Model P value= 0.049; R2 = 0.631; Adjusted R
2 = 0.620. Note: means p value <0.05

208
Table VII.1 cont’d
3. Dependent value: cost management
Independent variable B Standardized coefficient(β) P value
Constant 0.547 0.064
Technical engineering and site issues factor 0.514 0.399 0.000
Bidding and contracting factor 0.301 0.259 0.001
Information factor 0.236 0.218 0.011
Model P value= 0.011; R2 = 0.619; Adjusted R
2 = 0.611. Note: means p value <0.05
4. Dependent value: scope management
Independent variable B Standardized coefficient (β) P value
Constant 0.532 0.153
Management factor 0.684 0.521 0.000
Law and regulation factor 0.183 0.204 0.009
Model P value= 0.000; R2 = 0.424; Adjusted R
2= 0.416. Note: means p value <0.05
5. Dependent value: safety management
Independent variable B Standardized coefficient (β) P value
Constant 0.407 0.409
Management factor 0.725 0.477 0.000
Model P value= 0.000; R2 = 0.228; Adjusted R
2 = 0.222. Note: means p value <0.05
6. Dependent value: teamwork management
Independent variable B Standardized coefficient (β) P value
Constant 0.294 0.430
Management factor 0.633 0.455 0.000
Law factor 0.321 0.338 0.000
Model P value= 0.000; R2 = 0.483; Adjusted R
2= 0.475. Note: means p value <0.05

209
Appendix VIII: Results of the Pearson Product-Moment Correlation: Engineering Design Phase
Table VIII.1 Results of the Pearson Product-Moment Correlation: Engineering Design Phase
1 2 3 4 5 6 7 8 9 10 11 12 13 14 15 16 17 18 19 20 21 22
1 1
2 0.35 1
3 0.43 0.41 1
4 0.36 0.31 0.37 1
5 0.38 0.31 0.46 0.40 1
6 0.35 0.31 0.52 0.33 0.49 1
7 0.42 0.28 0.48 0.26 0.48 0.56 1
8 0.27 0.22 0.41 0.28 0.47 0.51 0.47 1
9 0.22 0.21 0.34 0.14 0.20 0.42 0.31 0.42 1
10 0.22 0.21 0.11 0.13 0.11 0.14 0.22 0.40 0.32 1
11 0.31 0.23 0.25 0.21 0.34 0.29 0.24 0.31 0.32 0.32 1
12 0.41 0.16 0.33 0.30 0.37 0.52 0.51 0.45 0.40 0.30 0.31 1
13 0.35 0.28 0.27 0.33 0.35 0.44 0.43 0.47 0.32 0.41 0.40 0.42 1
14 0.18 0.23 0.26 0.29 0.39 0.45 0.31 0.44 0.36 0.32 0.23 0.43 0.42 1
15 0.32 0.17 0.33 0.20 0.32 0.43 0.38 0.43 0.25 0.29 0.29 0.46 0.36 0.38 1
16 0.31 0.25 0.43 0.38 0.36 0.55 0.42 0.52 0.46 0.31 0.30 0.57 0.43 0.51 0.49 1
17 0.31 0.30 0.41 0.41 0.41 0.55 0.39 0.57 0.43 0.34 0.31 0.50 0.42 0.49 0.47 0.63 1
18 0.21 0.24 0.41 0.38 0.36 0.52 0.38 0.46 0.39 0.26 0.29 0.40 0.48 0.44 0.34 0.54 0.50 1
19 0.17 0.28 0.18 0.28 0.23 0.22 0.27 0.24 0.29 0.20 0.34 0.22 0.36 0.16 0.11 0.21 0.14 0.26 1
20 0.37 0.24 0.31 0.38 0.28 0.40 0.30 0.27 0.26 0.20 0.39 0.31 0.29 0.29 0.33 0.47 0.49 0.41 0.22 1
21 0.34 0.27 0.36 0.38 0.43 0.42 0.40 0.34 0.19 0.16 0.40 0.39 0.33 0.30 0.39 0.44 0.48 0.48 0.29 0.74 1
22 0.27 0.29 0.37 0.37 0.41 0.52 0.47 0.51 0.26 0.27 0.26 0.53 0.48 0.35 0.41 0.51 0.57 0.43 0.21 0.35 0.43 1

210
Appendix IX: Multiple-Regression Results for Six Project Performance Indicators:
Engineering/Design Phase
There are two assumptions that one must abide by to apply the multiple-regression analysis:
(1) the square distances of the points to the regression line need to be normally distributed and
(2) the correlation between criterion variables and predictor variables must not be higher than
0.80. Table IX.1 illustrates the six multiple regression models.
Table IX.1 Multiple-Regression Results for Six Project Performance Indicators
1. Dependent value: quality management
Independent variable B Standardized coefficient (β) P value
Constant –0.400
Information factor 0.662 0.548 0.00
Management factor 0.303 0.200 0.009
Law and regulation factor 0.117 0.129 0.028
Model P value 0.000; R2 =0.620; Adjusted R
2 = 0.613. Note: means p value <0.05
2. Dependent value: schedule management
Independent variable B Standardized coefficient (β) P value
Constant 0.19
Information factor 0.497 0.428 0.000
Management factor 0.248 0.170 0.011
Others factor 0.409 0.332 0.000
Model P value= 0.000; R2 = 0.720; Adjusted R
2 = 0.715; Note: means p value <0.05
3. Dependent value: cost management
Independent variable B Standardized coefficient(β) P value
Constant 0.302
Information factor 0.581 0.493 0.00
Others factor 0.475 0.379 0.00
Model P value= 0.000; R2 = 0.665; Adjusted R
2 = 0.661; Note: means p value <0.05

211
Table IX.1 cont’d
4. Dependent value: scope management
Independent variable B Standardized coefficient (β) P value
Constant –0.505
Information factor 0.744 0.562 0.00
Management factor 0.350 0.211 0.012
Model P value = 0.000; R2 = 0.539; Adjusted R
2 = 0.533. Note: means p value <0.05
5. Dependent value: safety management
Independent variable B Standardized coefficient (β) P value
Constant –0.436
Information factor 0.447 0.284 0.005
Others factor 0.507 0.302 0.003
Model P value = 0.000; R2 = 0.45; Adjusted R
2 = 0.55. Note: means p value <0.05
6. Dependent value: teamwork management
Independent variable B Standardized coefficient (β) P value
Constant –0.227
Information factor 0.647 0.470 0.00
Management factor 0.406 0.235 0.010
Model P value= 0.000; R2 = 0.51; Adjusted R
2= 0.55. Note: means p value <0.05