develop field management practices to reduce soil · pdf filefinal report to california...
TRANSCRIPT
Final Report to California Department of Food and Agriculture
Develop Field Management Practices to Reduce Soil Fumigant
Emissions
By
Suduan Gao
Tom Trout
Ruijun Qin
USDA-ARS, Water Management Research
San Joaquin Valley Agricultural Sciences Center
9611 S. Riverbend Ave.
Parlier, CA 93648
for
David Luscher and Charlie Goodman
Office of Pesticide Consultation and Analysis, California Department of Food and
Agriculture, Sacramento, CA 95814
June 30, 2010

ii
Disclaimer
This project reports research funded by the California Department of Food and Agriculture
under Contract no. 58−5302−6−102 (October 1, 2005 through September 30, 2008). The
final report was not completed prior to the end date as a result of suspension of the project in
July 2008 due to state financial budget decisions. Under a new contract no. 58−5302−9−450,
the major task was to complete this final report of the work conducted under the previous
contract. It should also be noted that by the time this report is written, most of the work has
been published in peer-reviewed journals, proceedings, and abstracts for presentations at
meetings. The aim of this report is to synthesize all experimental data to achieve the project
goal. Mention of trade names or commercial products does not imply endorsement by the
USDA, Agricultural Research Service.
iii
Acknowledgements
Drs. Sally Schneider, Bradley Hanson, James Gerik and Dong Wang participated in some of
the field trials reported under this project by either conducting parallel pest control
investigations or providing help in field trials. Dr. Jason McDonald conducted one year
postdoctoral research from 2006 to 2007 under this project.
Technical assistance in field preparation/sampling and lab analytical work was received from
Robert Shenk, Allison Kenyon, Tom Pflaum, Jim Gartung, Nancy Goodell, Stella
Zambrzuski, Aileen Hendratna, Ashley Torres, Curtis Koga, Matthew Gonzales, Patty
Mungur, and Amanda Crump as well as Carl Hawk with his field support personnel in the
San Joaquin Valley Agricultural Sciences Center, USDA-ARS, Parlier, California.
TriCal Inc., Hollister, CA provided fumigants, plastic materials and fumigant application
services for all field trials.
iv
Abstract
The phase out of methyl bromide (MeBr) has raised many challenges to major commodities
in California. These challenges include the use of alternative fumigants that are often more
difficult to apply and less efficacious compared to MeBr and the increasingly stringent
environmental regulations on fumigant use because of emissions. The goal of this project was
to develop effective and feasible field management practices to reduce fumigant emissions
while achieving good soil pest control. Three sets of laboratory experiments and three field
trials were conducted from October 2005 through 2007 to determine the effect of application
methods and various surface sealing techniques or soil treatments on emission reduction from
soil fumigation. Telone (1,3-dichloropropene or 1,3-D) and chloropicrin (CP) were tested at
the maximum rate used by growers in all field tests. Application methods included shank
injection vs. subsurface drip as well as broadcast fumigation vs. target sub-area treatment.
Surface sealing/treatments included water treatments (post-fumigation water seals and pre-
fumigation irrigation), tarping with plastic films including standard high density polyethylene
(HDPE) and low or virtually impermeable film (VIF), and surface soil amendment with
organic matter or chemicals such as thiosulfate. Integrated results showed that emission
reduction by HDPE tarp, post-fumigation water seals or pre-irrigation, and organic
amendment can vary from zero to 50% due to variations in specific soil and environmental
conditions as well as how the treatment was applied. These treatments sometimes
compromise efficacy as well. Thiosulfate treatment in surface soil following fumigation
reduced emissions significantly; but resulted in some undesirable byproducts. The VIF tarp
consistently showed the most promise in reducing emissions (>90% emission reduction)
while improving efficacy, but it is also the most costly. Uncertainties on the use of VIF tarp
remain because they are susceptible to damage during field installation. Commercial low
permeable films that maintain integrity from field installation is a viable option for crops
with very high potential profit margins. Feasible techniques for lower profit margin
commodities should consider the practicality for the production system, effectiveness on
emission reduction, potential impact on pest control, and affordability.

v
Contents
Acknowledgements……………………………………………………………………………iii
Abstract ……………………………………………………………………………………….iv
Figures ……………………………………………………………………………………….viii
Tables …………………………………………………………………………………………xi
Abbreviations…………………………………………………………………………………xii
1.0 Introduction ………………………………………………………………….................. 1
1.1 Status of Soil Fumigant Use in California………………………………………….. 1
1.2 Fumigant Characteristics…………………………………………………………... 3
1.3 Methods to Reduce Fumigant Emissions………………………………………….... 6
1.4 Objectives…………………………………………………………………………..11
2.0 Materials and Methods…………………………………………………………………. 11
2.1 Soils and Chemicals……………………………………………………………… 12
2.2 Fumigant Analysis in the Laboratory……………………………………….......... 15
2.3 Soil Column Experiment 1……………………………………………………….. 17
2.4 Soil Column Experiment 2……………………………………………………….. 20
2.5 Soil Column Experiment 3……………………………………………………….. 21
2.6 Field Trial 1 (Year 2005)………………………………………………………… 23
2.6.1 Fumigation and Treatment……………………………………………......... 23
2.6.2 Field Sampling……………………………………………………………... 25
2.7 Field Trial 2 (Year 2006) ………………………………………………………... 27
2.7.1 Fumigation and Treatment……………………………………………......... 28
2.7.2 Field Sampling……………………………………………………………... 30
2.8 Field Trial 3 (Year 2007) ………………………………………………………... 31
2.8.1 Fumigation and Treatment……………………………………………......... 31
2.8.2 Field Sampling……………………………………………………………... 33
2.9 Statistical analysis ……………………………………………………………….. 34
3.0 Results and Discussions…………………………………………………....................... 35
3.1 Soil Column Experiment 1……………………………………………………… 35
3.1.1 Emission Flux………………………………………………………………. 35

vi
3.1.2 Cumulative Emission Loss…………………………………………………. 36
3.1.3 1,3-D Concentrations in Soil-Gas Phase…………………………………… 38
3.1.4 Residual and the Fate of 1,3-Dichloropropene…………………………….. 39
3.1.5 Conclusion……………………………………………………………......... 41
3.2 Soil Column Experiment 2……………………………………………………… 42
3.2.1 Soil Water Content ………………………………………………………… 42
3.2.2 Emission Flux……………………………………………………………… 42
3.2.3 Cumulative Emission Loss………………………………………………… 46
3.2.4 1,3-D in Soil-Gas Phase and Soil Residual 1,3-D……………………......... 46
3.2.5 Fate of 1,3-D……………………………………………………………….. 49
3.2.6 Conclusion……………………………………………………………......... 49
3.3 Soil Column Experiment 3……………………………………………………... 50
3.3.1 Emission Flux………………………………………………………………. 50
3.3.2 Cumulative Emission Loss…………………………………………………. 51
3.3.3 Fumigants in Soil-Gas Phase…………………………………………......... 53
3.3.4 Residual Fumigants in Soil and the Fate of Fumigants………………......... 56
3.3.5 Conclusion…………………………………………………………….......... 56
3.4 Field Trial 1 (Year 2005) ……………………………………………………….. 60
3.4.1 Emission Flux………………………………………………………………. 60
3.4.2 Cumulative Emission Loss…………………………………………………. 62
3.4.3 Fumigants in Soil-Gas Phase…………………………………………......... 64
3.4.4 Residual Fumigant in Soil………………………………………………….. 67
3.4.5 Soil Water Content, Temperature, and Nematode Response ……………… 68
3.4.6 Conclusion …………………………………………………………………. 71
3.5 Field Trial 2 (Year 2006) ……………………………………………….............. 72
3.5.1 Emission Flux………………………………………………………………. 72
3.5.2 Cumulative Emission Loss…………………………………………………. 76
3.5.3 Fumigant in Soil-Gas Phase………………………………………………... 79
3.5.4 Residual Fumigant……………………………………………………......... 79
3.5.5 Soil Water Content……………………………………………………......... 81
3.5.6 Conclusion……………………………………………………………......... 83
vii
3.6 Field Trial 3 (Year 2007) ……………………………………………………….. 83
3.6.1 Emission Flux……………………………………………………………… 83
3.6.2 Cumulative Emission Loss………………………………………………… 85
3.6.3 Fumigant in Soil-Gas Phase………………………………………………... 90
3.6.4 Soil Residual Fumigant…………………………………………………….. 92
3.6.5 Soil Moisture and Temperature………………………………………......... 92
3.6.6 Conclusion……………………………………………………………......... 95
4.0 Summary………………………………………………………………………………. 96
5.0 References…………………………………………………………………………….. 102
viii
Figures
Figure 1-1. Chemical structure of soil fumigants …………………………………………. 4
Figure 1-2. The fate of soil fumigants …………………………………………………....... 6
Figure 2-1. Soil water content at the end of the soil column experiment 3…………………22
Figure 3-1. Emission rate of cis-1,3-dichloropropene in soil column studies-
(A) water seal and manure treatments; (B) ammonium thiosulfate
treatments in soil column experiment 1.…………… ……………………….. 37
Figure 3-2. Cumulative emissions of cis-1,3-dichloropropene from soil
column treatments over two weeks in soil column experiment 1.……………...38
Figure 3-3. Concentration of cis-1,3-dichloropropene (1,3-D) in the soil-gas
phase from soil column treatments in soil column experiment 1.…………….. 40
Figure 3-4. Distribution of soil water content (%, v/v) with depth in soil
column experiment 2: A) Loamy sand, B) Sandy loam, C)
Loam……………………………………………………………………………44
Figure 3-5. Comparison of 1,3-dichloropropene (1,3-D) emissions from different
soil surface treatments: A) Loamy sand, B) Sandy loam, C) Loam
in soil column experiment 2.……………………………………………………45
Figure 3-6. Distribution of 1,3-dichloropropene (1,3-D) in soil-gas phase
under different surface treatments in soil column experiment 2.
LS = Loamy Sand, SL = Sandy Loam, L = Loam …………………………… 48
Figure 3-7. Effect of soil water content on emission flux of cis- and
trans-1,3-dichloropropene (1,3-D), and chloropicrin (CP)
in soil column experiment 3………………………………………………….. 52
Figure 3-8. Cumulative emissions of cis- and trans-1,3-dichloropropene
(1,3-D), and chloropicrin (CP) affected by soil water content
(soil column experiment 3) …………………………………………………….54
Figure 3-9. Distribution of cis-1,3-dichloropropene (1,3-D) in soil-gas
phase at different water treatments (soil column experiment 3)..…………….. 55

ix
Figure 3-10. Average residual cis-and trans-1,3-dichloropropene (1,3-D),
and chloropicrin (CP) concentration in soil columns under
different soil water contents (soil column experiment 3).……………………. 58
Figure 3-11. Effects of application methods and surface seal treatments on emission
flux of (a) 1,3-dichloropropene (1,3-D) and (b) chloropicrin (CP) from
Telone C35 (shank-injection) and InLine (drip-irrigation) applications
in 2005 field trial……………………………………………………………… 61
Figure 3-12. Cumulative emission of (a) 1,3-dichloropropene (1,3-D) and
(b) chloropicrin (CP) from surface seal treatments in 2005 field
trial.………………………………………………………………………….... 63
Figure 3-13. Distribution of 1,3-dichloropropene (1,3-D) in the soil-gas phase
after fumigation under various surface treatments in 2005 field
trial.……………………………………………………………………………..66
Figure 3-14. Residual fumigants (a) 1,3-dichloropropene (1,3-D) and
(b) chloropicrin (CP) extracted from soil samples collected
14 d after fumigation in 2005 field trial……………………………………… 67
Figure 3-15. Soil water content measured two weeks after fumigation under
various surface treatments in 2005 field trial.………………………............... 69
Figure 3-16. One-day soil temperature measurements at a 10 cm depth during
the fumigant emission monitoring period in 2005 field trial.…………………..70
Figure 3-17. Effects of surface seal and soil treatments on emission flux
of 1,3-dichloropropene (1,3-D) and chloropicrin (CP) from
shank-injection of Telone C35 in 2006 field trial.…………………….............. 75
Figure 3-18. One-day soil temperature measurements at 10 cm soil depth
during fumigant emission monitoring period in 2006 field
trial.……………………………………………………………………………. 76
Figure 3-19. Cumulative emission losses of 1,3-dichloropropene (1,3-D) and
chloropicrin (CP) from surface seal and soil treatments in 2006
field trial………………………………………………………………………. 77
Figure 3-20. 1,3-dichloropropene (1,3-D) distribution in the soil-gas phase under
various surface treatments at location a - adjacent to fumigant injection
x
lines (top six graphs), and location b - between injection lines
(bottom six graphs) under various surface treatments in 2006 field
trial…………………………………………………………………………….. 80
Figure 3-21. Residual 1,3-dichloropropene (1,3-D) and chloropicrin (CP)
extracted from soil samples 14 days after fumigation in 2006 field
trial.…………………………………………………………………………… 81
Figure 3-22. Soil water content measured the day before fumigation and 4
and 14 days after fumigation under various surface treatments
in 2006 field trial.……………………………………………………………… 82
Figure 3-23. Effects of manure and water applications on emission flux of
(a) 1,3-dichloropropene (1,3-D) and (b) chloropicrin (CP) in
2007 field trial.…………………………………………………………………84
Figure 3-24. Cumulative emission loss of (a) 1,3-dichloropropene (1,3-D)
and (b) chloropicrin (CP) from manure amendment and water
application treatments in 2007 field trial.……………….………….................. 87
Figure 3-25. 1,3-dichloropropene (1,3-D) concentration in the soil-gas phase
at location a (adjacent to fumigant injection line; graphs on the
left side) and at location b (between fumigant injection lines;
graphs on the right side) in 2007 field trial.……….………………….............. 91
Figure 3-26. Residual 1,3-dichloropropene (1,3-D) and chloropicrin (CP)
extracted from soil samples 10 days after fumigant injection
in 2007 field trial.…………………………………………………………….. 93
Figure 3-27. Soil water content measured at the end of 2007 field trial .………………….. 93
Figure 3-28. Soil temperature measured at a 10 cm depth on October 5, 2007
during the field trial in 2007………………………………………………….. 94
xi
Tables
Table 1-1. Physicochemical properties of soil fumigants……………………………………. 5
Table 2-1. Summary of laboratory soil column experiments and treatments on
fumigant emission reductions…………………………………………………….13
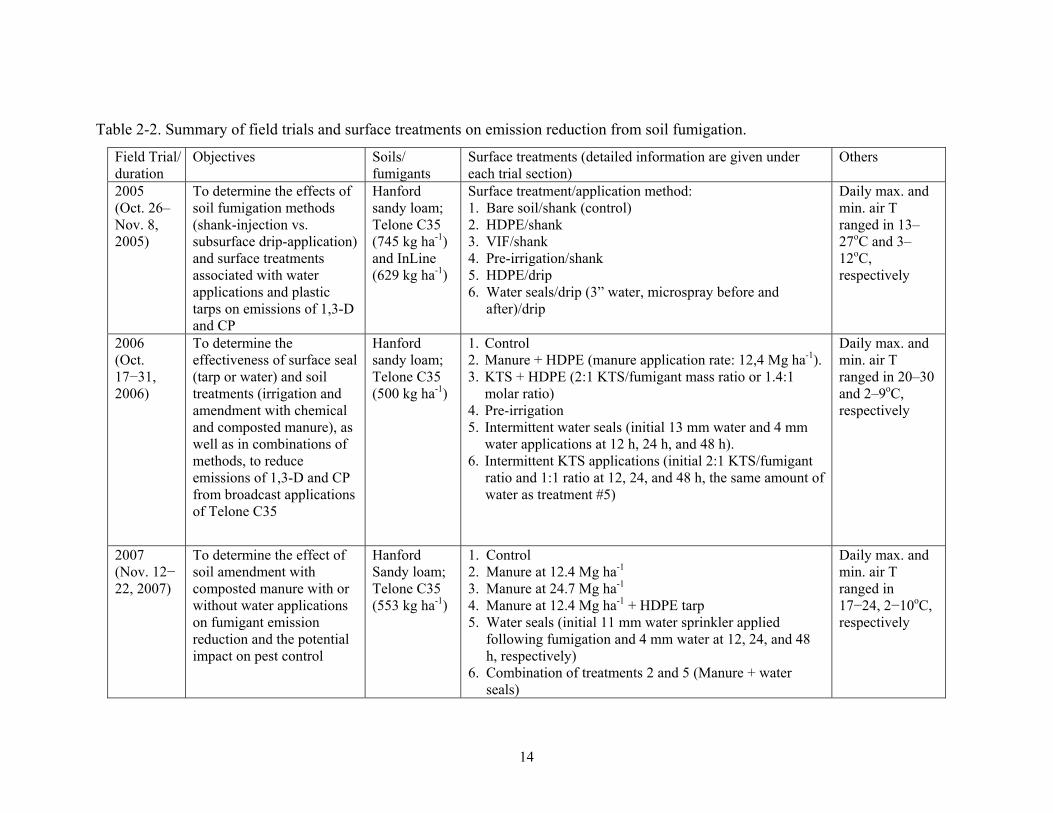
Table 2-2. Summary of field trials and surface treatments on emission reductions
from soil fumigation………………..………………………………………….....14
Table 2-3. Selected properties of soils used in this project…………………………………. 15
Table 2-4. Fumigation and surface treatments for emission study in 2005 field trial……… 24
Table 3-1. Fate of 1,3-dichloropropene in soil column experiment 1……………………… 41
Table 3-2. Fate of 1,3-dichloropropene in soil column experiment 2……………………… 47
Table 3-3. Effect of soil water content on the fate of cis- and trans-1,
3-dichloropropene (1,3-D) and chloropicrin (CP) in soil
column experiment 3…………………………………………………………… 59
Table 3-4. Peak flux and total emission loss of 1,3-dichloropropene (1,3-D)
and chloropicrin (CP) measured over 2 weeks after fumigation in
the 2005 field trial..…………………………………………………………… 68
Table 3-5. Total emission loss of 1,3-dichloropropene (1,3-D) and chloropicrin
(CP) measured over 2 weeks after fumigation in the 2006 field
trial……………………………………………………………………………… 78
Table 3-6. Emission peak and cumulative emission loss of 1,3-dichloropropene
(1,3-D) and chloropicrin (CP) monitored over 10 days following
fumigation in the 2007 field trial………………………………........................... 88

xii
Abbreviations
1,3-D 1,3-dichloropropene or Telone
ATS or KTS ammonium or potassium thiosulfate
CP chloropicrin
FC field capacity
GC gas chromatography
HDPE high density polyethylene
MeBr methyl bromide
PE polyethylene
SOM soil organic matter
VIF virtually impermeable film
XAD tubes ORBO 613, XAD 4 80/40mg (Supelco, Bellefonte, PA)
µECD micro electron capture detector

1
1.0 INTRODUCTION
1.1 Status of Soil Fumigant Use in California
Pre-plant soil fumigation with methyl bromide (MeBr) has been an important management
practice to control a variety of soil-borne pests including nematodes, diseases, and weeds in
many agricultural systems. Many important commodities in California have relied on soil
fumigation for decades. These crops include high-value cash crops such as annual
fruits/vegetables (e.g., strawberry, carrots), ornamentals and perennial trees (stone fruit/nut)
and grapevine including nursery and orchard re-planting. In California, open-field tree and
grapevine nurseries must meet the requirements of the California Department of Food and
Agriculture (CDFA) Nursery Nematode Control Program to produce parasitic nematode-free
crops (CDFA, 2008). Soil fumigation is a critical tool for meeting the certification. Without
fumigants, productivity of these cropping systems would suffer from significant yield losses
due to diseases or replant disorders or lack of phytosanitary certification.
Methyl bromide was used as a broad-spectrum soil fumigant for decades. Due to its
contribution to the depletion of stratospheric ozone (the good ozone protecting life and
materials on the earth), MeBr was phased-out in the US and other developed countries as of
January 2005 under the provisions of the Montreal Protocol (an international agreement) and
the U.S. Clean Air Act in the USA (USEPA, 1994; 2009). Some limited uses of MeBr are
permitted for crops that satisfy Critical Use Exemptions (CUEs) and Quarantine/Preshipment
(QPS) criteria. The amounts of MeBr allowed for different commodity use, however, are
subject to annual application and approval and have been decreasing each year (the
information on yearly nomination and approval can be found at USEPA website:
http://www.epa.gov/ozone/mbr/). The price of MeBr has been increasing steadily as the
amount of CUE allowance decreases (Noling and Botts, 2009). Subsequently, alternatives
have been increasingly used (CDPR, 2006; Trout, 2006). Challenges in transition from MeBr
to alternatives continue as none of the alternatives are as effective as MeBr in pest control
and these alternatives are heavily regulated because of exposure risks and contribution to air
quality degradation through emissions of volatile organic compounds (VOCs), which can

2
react with nitrogen oxides under the sunlight to form harmful ground level ozone (CDPR,
2009; USEPA, 2009). Five ozone non-attainment areas were identified in California with the
most restrictive in Ventura County and the San Joaquin Valley. Stringent environmental
regulations continue to be developed or implemented in these areas in the effort of reducing
emissions from soil fumigation (CDPR, 2006).
Soil fumigants in California must be registered through the California Department of
Pesticide Regulation (CDPR). Only a few alternative fumigants to MeBr are currently
registered including 1,3-dichloropropene (Telone® or 1,3-D), chloropicrin (CP), and methyl
isothiocyanate (MITC) generators (e.g., metam sodium or dazomet) (Trout, 2006; CDPR,
2007). Methyl iodide (iodomethane) is not currently registered in California except under
Research Authorization. 1,3-D is a good nematocide; CP is a good fungicide and nematocide;
and MITC serves as a good fungicide and herbicide with some capabilities as a nematocide
(Ajwa et al., 2003). Use of these alternatives has been increasing dramatically in various
commodities (Trout, 2006). MITC generators are mostly used on annual fruit/vegetable crops
such as tomato, carrots, potato, leaf vegetables, pepper and melons etc. 1,3-D and CP, mostly
in a combination, have been increasingly used on strawberry crops and perennial trees
(including nurseries and orchard replant). In addition to their toxic properties, most of these
alternative fumigants and some inert formulation ingredients are volatile organic compounds
(VOCs), important air pollutants that can react with nitrogen oxides under sunlight to form
harmful ground level ozone (the bad ozone). Ground-level ozone is the primary constituent
of smog. Regulations have been used to protect public and environmental health by
controlling the use amount, buffer zone and emission loss. Regulations currently in place
include Township Caps (Telone), buffer zones and restricted application techniques, timing,
and rates designed to reduce emissions. Township Caps limit Telone usage to 90,250 lbs per
township (23,040 ac) (Trout, 2003). Recently, California has further implemented mitigation
measures to reduce total VOC emissions that are required in ozone non-attainment areas
targeting low emissions from May through October (CDPR, 2007a,b; 2009; Segawa, 2008).
To some extent, minimizing fumigant emissions will allow continued availability of
fumigants to growers by meeting environmental safety standards.
3
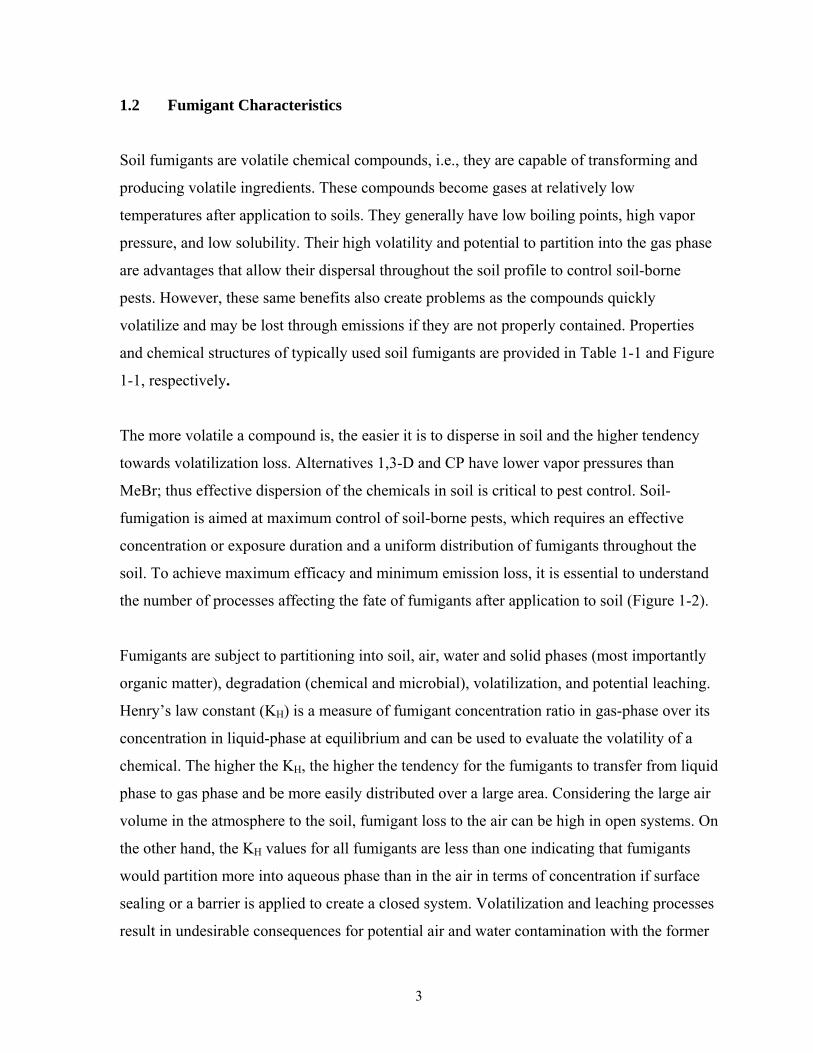
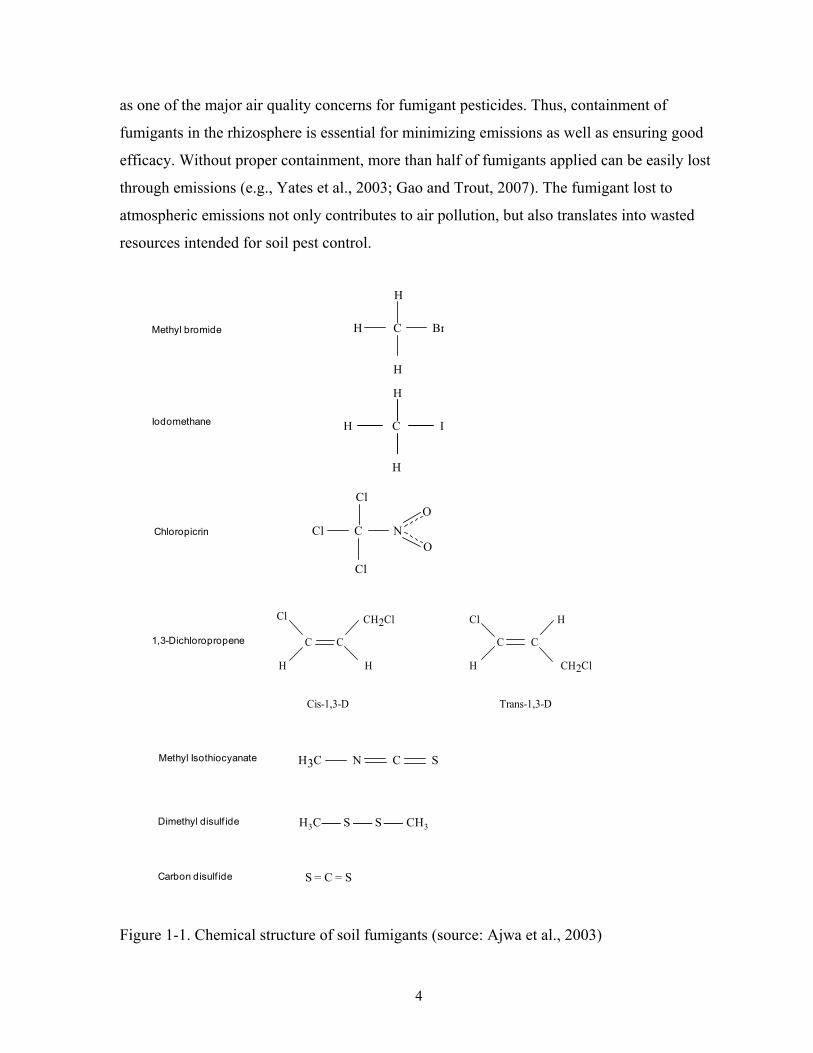
1.2 Fumigant Characteristics
Soil fumigants are volatile chemical compounds, i.e., they are capable of transforming and
producing volatile ingredients. These compounds become gases at relatively low
temperatures after application to soils. They generally have low boiling points, high vapor
pressure, and low solubility. Their high volatility and potential to partition into the gas phase
are advantages that allow their dispersal throughout the soil profile to control soil-borne
pests. However, these same benefits also create problems as the compounds quickly
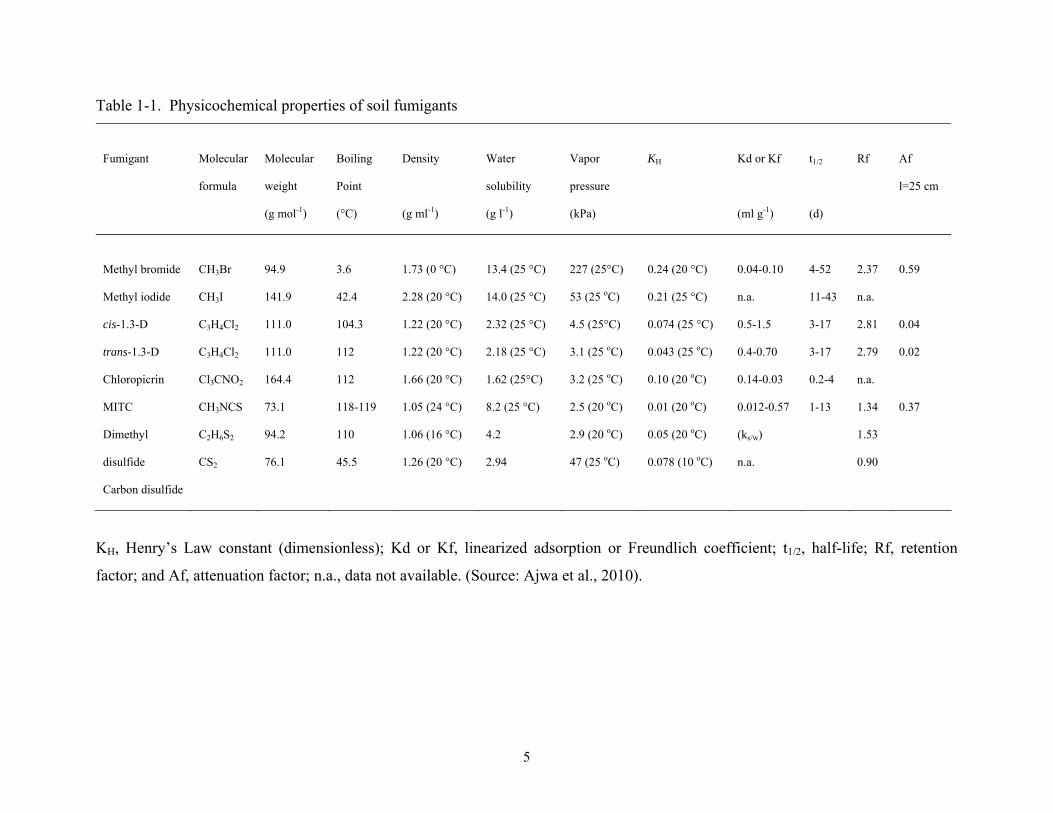
volatilize and may be lost through emissions if they are not properly contained. Properties
and chemical structures of typically used soil fumigants are provided in Table 1-1 and Figure
1-1, respectively.
The more volatile a compound is, the easier it is to disperse in soil and the higher tendency
towards volatilization loss. Alternatives 1,3-D and CP have lower vapor pressures than
MeBr; thus effective dispersion of the chemicals in soil is critical to pest control. Soil-
fumigation is aimed at maximum control of soil-borne pests, which requires an effective
concentration or exposure duration and a uniform distribution of fumigants throughout the
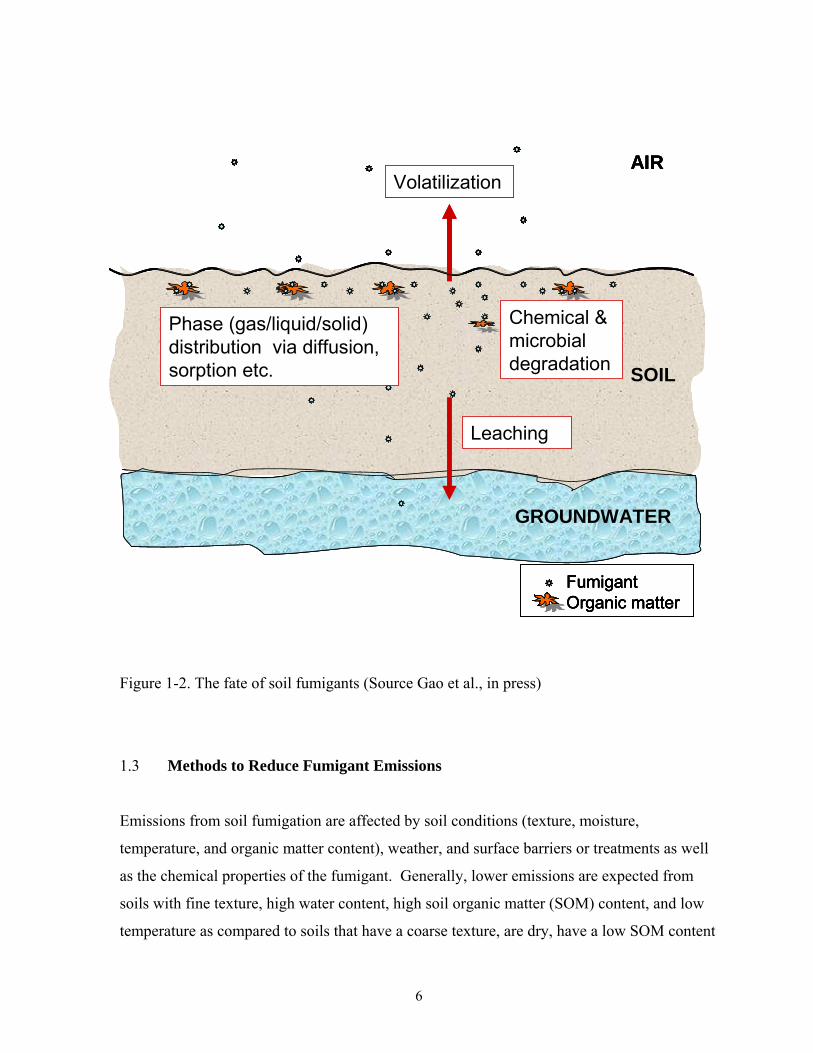
soil. To achieve maximum efficacy and minimum emission loss, it is essential to understand
the number of processes affecting the fate of fumigants after application to soil (Figure 1-2).
Fumigants are subject to partitioning into soil, air, water and solid phases (most importantly
organic matter), degradation (chemical and microbial), volatilization, and potential leaching.
Henry’s law constant (KH) is a measure of fumigant concentration ratio in gas-phase over its
concentration in liquid-phase at equilibrium and can be used to evaluate the volatility of a
chemical. The higher the KH, the higher the tendency for the fumigants to transfer from liquid
phase to gas phase and be more easily distributed over a large area. Considering the large air
volume in the atmosphere to the soil, fumigant loss to the air can be high in open systems. On
the other hand, the KH values for all fumigants are less than one indicating that fumigants
would partition more into aqueous phase than in the air in terms of concentration if surface
sealing or a barrier is applied to create a closed system. Volatilization and leaching processes
result in undesirable consequences for potential air and water contamination with the former
4
as one of the major air quality concerns for fumigant pesticides. Thus, containment of
fumigants in the rhizosphere is essential for minimizing emissions as well as ensuring good
efficacy. Without proper containment, more than half of fumigants applied can be easily lost
through emissions (e.g., Yates et al., 2003; Gao and Trout, 2007). The fumigant lost to
atmospheric emissions not only contributes to air pollution, but also translates into wasted
resources intended for soil pest control.
Cl CH2Cl Cl H
H H H CH2Cl
Cis-1,3-D Trans-1,3-D
C C C C1,3-Dichloropropene
H3C N C SMethyl Isothiocyanate
Cl C N
ClO
Cl
OChloropicrin
H C Br
H
H
Methyl bromide
H C I
H
H
Iodomethane
Dimethyl disulf ide
Carbon disulf ide S = C = S
H3C S S CH3
Figure 1-1. Chemical structure of soil fumigants (source: Ajwa et al., 2003)
5
Table 1-1. Physicochemical properties of soil fumigants
Fumigant
Molecular
formula
Molecular
weight
(g mol-1)
Boiling
Point
(°C)
Density
(g ml-1)
Water
solubility
(g l-1)
Vapor
pressure
(kPa)
KH
Kd or Kf
(ml g-1)
t1/2
(d)
Rf
Af
l=25 cm
Methyl bromide
Methyl iodide
cis-1.3-D
trans-1.3-D
Chloropicrin
MITC
Dimethyl
disulfide
Carbon disulfide
CH3Br
CH3I
C3H4Cl2
C3H4Cl2
Cl3CNO2
CH3NCS
C2H6S2
CS2
94.9
141.9
111.0
111.0
164.4
73.1
94.2
76.1
3.6
42.4
104.3
112
112
118-119
110
45.5
1.73 (0 °C)
2.28 (20 °C)
1.22 (20 °C)
1.22 (20 °C)
1.66 (20 °C)
1.05 (24 °C)
1.06 (16 °C)
1.26 (20 °C)
13.4 (25 °C)
14.0 (25 °C)
2.32 (25 °C)
2.18 (25 °C)
1.62 (25°C)
8.2 (25 °C)
4.2
2.94
227 (25°C)
53 (25 oC)
4.5 (25°C)
3.1 (25 oC)
3.2 (25 oC)
2.5 (20 oC)
2.9 (20 oC)
47 (25 oC)
0.24 (20 °C)
0.21 (25 °C)
0.074 (25 °C)
0.043 (25 oC)
0.10 (20 oC)
0.01 (20 oC)
0.05 (20 oC)
0.078 (10 oC)
0.04-0.10
n.a.
0.5-1.5
0.4-0.70
0.14-0.03
0.012-0.57
(ks/w)
n.a.
4-52
11-43
3-17
3-17
0.2-4
1-13
2.37
n.a.
2.81
2.79
n.a.
1.34
1.53
0.90
0.59
0.04
0.02
0.37
KH, Henry’s Law constant (dimensionless); Kd or Kf, linearized adsorption or Freundlich coefficient; t1/2, half-life; Rf, retention
factor; and Af, attenuation factor; n.a., data not available. (Source: Ajwa et al., 2010).
6
Figure 1-2. The fate of soil fumigants (Source Gao et al., in press)
1.3 Methods to Reduce Fumigant Emissions
Emissions from soil fumigation are affected by soil conditions (texture, moisture,
temperature, and organic matter content), weather, and surface barriers or treatments as well
as the chemical properties of the fumigant. Generally, lower emissions are expected from
soils with fine texture, high water content, high soil organic matter (SOM) content, and low
temperature as compared to soils that have a coarse texture, are dry, have a low SOM content
FumigantOrganic matter
SOIL
AIR
GROUNDWATER
Leaching
Volatilization
Phase (gas/liquid/solid) distribution via diffusion, sorption etc.
Chemical & microbial degradation
FumigantOrganic matterFumigantOrganic matterFumigantOrganic matter
SOIL
AIR
GROUNDWATER
Leaching
Volatilization
Phase (gas/liquid/solid) distribution via diffusion, sorption etc.
Chemical & microbial degradation
SOIL
AIR
GROUNDWATER
Leaching
Volatilization
Phase (gas/liquid/solid) distribution via diffusion, sorption etc.
Chemical & microbial degradation

7
and are under high temperature conditions. Approaches to reduce fumigant emissions include
management of application methods such as equipment design/injection depth, physical
barriers, irrigation, soil amendment with chemicals or organic materials to react with
fumigants, and targeted reduced area treatments. The following briefly reviews the
knowledge on these emission reduction methods prior to the project.
Plastic tarp. The most commonly adopted practice is to place standard polyethylene (PE)
film, either high density (HDPE) or low density (LDPE) tarp, over the soil after fumigation.
This technology was developed primarily for MeBr but was found not to be effective in
controlling emissions of some alternatives - especially 1,3-D (Wang et al., 1999; Papiernik
and Yates, 2002). Low-permeable films, such as the virtually impermeable film (VIF), have
shown effectiveness on emission reduction. The VIF is typically a multilayer film that
contain high barrier polymers such as ethylene vinyl alcohol or polyamide (nylon)
sandwiched between other polymer layers (typically low-density polyethylene) (Noling,
2002). The VIF is generally much less permeable to fumigants than PE films.
Irrigation or water treatments can drastically alter soil moisture conditions that affect
fumigation emissions. Water seals (applying water with sprinklers to the soil surface) can
effectively prevent rapid fumigant emissions by forming a temporarily saturated or high
water content layer at the soil surface and reducing secondary (macro) porosity. Increasing
soil water content also reduces fumigant diffusion in soil because fumigant diffusion is much
slower in the liquid phase than in the gas phase. Water seals were found to be effective in
reducing emissions of MeBr (Jin and Jury, 1995; Wang et al., 1997), MITC (Sullivan et al.,
2004), 1,3-D and CP (Thomas et al., 2003; Gao and Trout, 2006). The proper timing of water
applications as well as the use of intermittent water applications were important factors for
maximizing emission reduction (Gao and Trout, 2006; Sullivan et al., 2004). There were not
enough field data to quantify the potential of water treatments to reduce Telone fumigant
emissions under practical field operation conditions. The amount of water retained by a soil
is affected by soil texture and bulk density which can vary throughout a field as well as
throughout the soil profile. Finer- textured soils generally hold water longer than coarser-
textured soils.
8
High soil water content was found to decrease the peak flux and reduce cumulative emission
losses of 1,3-D (Thomas et al., 2003). Thomas et al. (2004) in another field test also found
that soil water content near FC decreased the emissions of 1,3-D and CP as compared to the
air-dry soil. In a column study, Gan et al. (1996) found that high soil water content decreased
the peak flux of MeBr and also delayed the occurrence of the peak. Lower MeBr emission
from wet soils was also reported by Shinde et al. (2000). However, excessive soil moisture
can reduce fumigant distribution throughout the soil profile and is undesirable because of its
potential to reduce pest control (McKenry and Thomason, 1974; Thomas et al., 2003). For
fine-textured soils, the effect of soil water content on fumigant diffusion was most striking
when soils had soil water tension less than 50 kPa at 30 cm depth (McKenry and Thomason,
1974). Generally speaking, the proper amount of water applied and the timing of water
application are not well understood in terms of achieving emission reduction while ensuring
good efficacy as they can vary for different fumigation rates and varying soil/weather
conditions.
Soil amendment with chemicals (e.g., ammonium thiosulfate, thiourea, or polysulfides) had
been shown to degrade fumigants effectively in soils (Wang et al., 2000; Zheng et al., 2003)
and soil columns (Qin et al., 2007) and to reduce emissions from soil columns and small plot
tests (Gan et al., 1998a; Zheng et al., 2006). Thiosulfate was suggested as a reactive surface
barrier to reduce fumigant emissions, because they can react with halogenated fumigants
rapidly to form a dehalogenated product and a halide ion (Cl-) (Yates et al., 2002; Zheng et
al., 2006; Gan et al., 2000; Gan et al., 1998a). Generally, a greater ATS:fumigant ratio
applied to the soil surface results in faster transformation and effective emission reduction
(Wang et al., 2000).
Amendment of soils with organic materials such as composted manure can increase
fumigant adsorption and enhance degradation of fumigants in soils to reduce emissions (e.g.,
Gan et al., 1998b; Kim et al., 2003; Dungan et al., 2001; Dungan et al., 2005; and Ashworth
and Yates, 2007). Dungan et al. (2005) evaluated composted steer manure and composted
chicken manure that were incorporated into the surface 5 cm of soil at 3.3 and 6.5 kg m-2 (or

9
33 and 65 Mg ha-1, respectively) to reduce emissions from a drip-applied emulsified
formulation of 1,3-D in raised beds. Their results showed that cumulative emission loss of
1,3-D over 170 h were 48% and 28% lower from the steer manure and chicken manure
amended beds, respectively, than from the unamended beds. However, all the studies that
indicated the effectiveness of OM amendment in reducing emissions were tested at a much
lower fumigant application rate, about one third of the maximum Telone application rate in
California (e.g., Dungan et al., 2005; Ashworth and Yates, 2007). There had been no testing
done at the maximum Telone application rate allowed in CA for effective pest control (e.g.,
perennial nurseries and orchards).
Application methods can drastically affect fumigant emissions. Various fumigant
application techniques are being used depending on the cropping system, formulation type,
pests to be controlled, and timing of the application. Liquid fumigants are applied from
pressurized cylinders by directly injecting them into the soil via tractor-driven shanks or
chisels (shank injection). Deeper injection depths allow further movement of fumigants
through soil pores. CDPR considers the 18” depth a deep injection for broadcast shank
application as a low emission application method. Fumigants can also be applied to soil via
irrigation systems such as sprinklers or drip tapes (drip application), which is referred to as
chemigation. The irrigation water acts as a vehicle to distribute and deliver the fumigant to
deeper depths (Ajwa and Trout, 2004). Although most fumigants have low solubility in
water, they can achieve sufficient concentrations for good pest control; some such as 1,3-D
and CP have sufficient solubility and can be applied with irrigation water. Emulsified
formulations (e.g., InLine containing 61% 1,3-D, 33% CP and 6% inert ingredient) are
popularly used for drip-application.
Drip application of fumigants has been shown to be an effective fumigation practice for
raised strawberry beds (Ajwa and Trout, 2004). By 2009, about 50% of strawberry fields in
the coastal areas were fumigated with drip-application. Trout et al. (2003) found that
subsurface drip application of fumigants before orchard replant provided good efficacy.
Many orchards are irrigated with micro-irrigation systems, so drip application of fumigants
may also be a viable option. Subsurface drip irrigation with fumigants was shown to give
10
lower emissions than shank injections from soil columns and small plot tests (Gan et al.,
1998c; Wang et al., 2001). Emission assessments from subsurface drip applications were
limited under field operation conditions.
For stone fruits/grapevine orchard replanting or any other commodities with low-profit
margins, fumigation methods must be cost-effective to be feasible. Browne et al. (2003)
proposed reducing fumigation areas to tree rows or tree sites for controlling replant
diseases/disorders. Because trees are planted in widely spaced rows, strip application of
fumigants is an option to effectively treat target areas. Reducing fumigation areas may offer
low and effective use of fumigants. Low chemical input automatically reduces emissions.
The target area treatment, however, is not recommended for pest-infected fields, which
require broadcast fumigation. Overall, no adequate assessment had been given regarding the
benefits of target-area fumigation on reducing emissions.
Generally speaking, prior to the project, a fair amount of knowledge and research were
available especially on MeBr and some alternatives that were mostly conducted on a
laboratory scale or in limited field operations. Field data for feasible and effective emission
reduction methods especially representing field operation conditions are needed to help
address the environmental issues by minimizing emissions. There was also a significant lack
of research on what field management practices can be taken to minimize emissions while
ensuring satisfactory pest control with alternative fumigants to MeBr. Numerous studies have
shown that satisfactory pest control for deep-rooted perennial fields require relatively high
rates of Telone products compared to rates used for annual vegetable crops. Do emission
reduction methods offer the same effectiveness for both low and high fumigation rates? With
the increasing awareness and environmental regulations on soil fumigant use, addressing
these issues would help maintain the availability of fumigants to growers especially in
California where many high value crops rely on pre-plant fumigation for sustaining
agricultural productivity. This project was designed to collect data to evaluate a number of
field management options to control emissions.
11
1.4 Objectives
The goal of this project was to develop field management practices that reduce emissions
from soil fumigation while maintaining good soil pest control. This project focused on
alternatives 1,3-D and CP at relatively high application rates for perennials. The maximum
rate of 1,3-D for broadcast application in CA is 332 lbs per acre (or 372 kg ha-1). This rate
(1,3-D alone or 1,3-D plus additional CP) is used for certified nursery stock production with
standard HDPE tarp (CDFA, 2008). The maximum rate of 1,3-D translates to 33.7 gallons
per acre (or 341 lbs ac-1 = 380 kg ha-1) of Telone II (97.5% 1,3-D and 2.5% inert ingredient)
or 48.6 gallons per acre (or 544 lbs ac-1 = 610 kg ha-1) of Telone® C35 (61.1% 1,3-D, 34.7%
CP and 4.2% inert ingredient). Orchard replanting may use lower rates than the nurseries, but
much higher rates than vegetable and field crops to ensure satisfactory soil pest control
according to their labels. We believe that effective emission reduction methods for high
application rates will apply to situations with low fumigation rates. Specific objectives were
chosen for each experiment or field trial (Tables 2-1 and 2-2) to evaluate various surface
sealing or soil treatments on fumigant emissions and fumigant distribution in soil. Although
the agronomic systems were targeted in the San Joaquin Valley, the results should apply to
other agronomic systems or in other geographical areas.
2.0 MATERIALS AND METHODS
A comprehensive approach was used in this project for collecting data and information
needed to conclude the effectiveness of various field methods to control fumigant emissions.
Three lab experiments and three field trials were conducted from October 2005 through July
2008. A summary of the three laboratory experiments and three field trials are given in
Tables 2-1 and 2-2, respectively. Each experiment or trial targeted specific questions with
specific objectives. Conducting field trials is often labor-intensive and costly in addition to
the involvement of more variables that sometimes result in difficulties in interpreting data.
Laboratory experiments can be conducted within a relatively short period of time at low costs
and also allow better control of the study conditions for testing single or multiple variables at
12
one time. Laboratory studies, however, may not be directly used to represent what actually
would occur under field conditions. Caution should be taken when extrapolating laboratory
data to the field environment.
2.1 Soils, Chemicals and Plastics
Three different soils were used in this research: 1) Atwater loamy sand (coarse-loamy,
mixed, active, thermic Typic Haploxeralfs); 2) Hanford sandy loam (coarse-loamy, mixed,
superactive, nonacid, thermic Typic Xerorthents); and 3) Madera loam (fine, smectite,
thermic Abruptic Durixeralfs). Properties of these three soils are given in Table 2-3. The
Hanford sandy loam was tested the most among the experiments and was the major soil type
in all field trials. For laboratory studies, soil samples were collected from field surface
(~0−30 cm), air-dried, sieved through a 4-mm sieve, and mixed thoroughly before being
used. The Atwater loamy sand was obtained from a cultivated field in Atwater, Merced
County, CA. The Atwater series soils are distributed along the east side of the San Joaquin
Valley, comprising 36,000 ha in Fresno, Merced and Madera Counties, and mainly used for
production of truck crops, tree fruits, nuts, grain and alfalfa (NRCS, 2004). The Hanford
sandy loam was collected from the USDA-ARS San Joaquin Valley Agricultural Sciences
Center, Parlier, Fresno County, CA. Hanford series soils are widely distributed in the San
Joaquin Valley and in the valleys of central and southern California and typically are used for
growing a wide range of fruits, vegetables and general farm crops (NRCS, 2004). The
Madera loam was obtained from Bright’s Nursery in Le Grand, Merced County, CA. The
Madera soil series is used mainly for irrigated cropland and is distributed in the eastern side
of the Sacramento and the San Joaquin Valley (NRCS, 2004).
1,3-dichloropropene either in mixture of isomers or pure cis- or trans-1,3-D (purity of 98.9%
and 99%, respectively) was provided by Dow AgroScience (Indianapolis, IN). Chloropicrin
(purity of 99.9%) was provided by Niklor Chemical Co., Inc. (Mojave, CA). Ethyl acetate
(pesticide grade), hexane (pesticide grade), and sodium sulfate anhydrous 10-60 mesh (ACS
grade) were obtained from Fisher Scientific (Tustin, CA). All laboratory work with

13
Table 2-1. Summary of laboratory soil column experiments and surface treatments on fumigant emission reductions
Exp # Specific Objectives Soils/Fumigants Surface treatments Others 1 To determine the
effectiveness of surface amendments with ammonium thiosulfate (ATS) and composted manure and in combination with water application or standard (HDPE) tarp on emission reduction of 1,3-D from soil columns compared to a water seal
Hanford sandy loam; cis-1,3-D (122 mg per column, equivalent to application rate of 65 kg ha-1)
1. Control 2. Water seal (9 mm of water) 3. Chemical seal 1 (ATS 1:1) 4. Chemical seal 1 (ATS 1:1+HDPE) 5. Chemical seal 2 (ATS 2:1) 6. Manure (5%, w/w top 5 cm soil) plus water seal
(Manure) 7. Manure amendment plus water seal and tarping
(Manure+ HDPE)
Lab room temperature: 22±3 oC
2 To determine the effectiveness of water seals on reducing 1,3-D emissions from different textured soils (loamy sand, sandy loam, and loam) in soil column tests
Atwater loamy sand, Hanford sandy loam, and Madera loam; cis-1,3-D (122 mg per column, equivalent to application rate of 65 kg ha-1)
1. Control 2. Initial water seal - sprayed 9 mm of tap water onto soil
surface just before fumigant injection 3. Intermittent water seals - initial water seal with 9 mm
water followed by two sprayed water applications of 3 mm at 12 h and 24 h after 1,3-D application
Treatment 2 was not tested in the loamy sand soil and instead, a reduced-amount intermittent water seal treatment (i.e., initial water 3 mm + 1 mm at 12 and 24 h) was tested.
Lab room temperature: 22±3 oC
3 To determine the effects of soil water content on emission and distribution of 1,3-D and CP in soil columns
Hanford Sandy loam; 1,3-D (mixture of cis- and trans-1,3-D isomers) and CP (111 mg each of compound per column, equivalent to application rate of 37 kg ha-1)
Soil water content: 1. 30% of field capacity (FC) (W30) 2. 45% of FC (W45) 3. 60% of FC (W60) 4. 75% of FC (W75) 5. 90% of FC (W90) 6. 100% of FC (W100)
Lab room temperature: 22±3 oC
14
Table 2-2. Summary of field trials and surface treatments on emission reduction from soil fumigation.
Field Trial/ duration
Objectives Soils/ fumigants
Surface treatments (detailed information are given under each trial section)
Others
2005 (Oct. 26–Nov. 8, 2005)
To determine the effects of soil fumigation methods (shank-injection vs. subsurface drip-application) and surface treatments associated with water applications and plastic tarps on emissions of 1,3-D and CP
Hanford sandy loam; Telone C35 (745 kg ha-1) and InLine (629 kg ha-1)
Surface treatment/application method: 1. Bare soil/shank (control) 2. HDPE/shank 3. VIF/shank 4. Pre-irrigation/shank 5. HDPE/drip 6. Water seals/drip (3” water, microspray before and
after)/drip
Daily max. and min. air T ranged in 13–27oC and 3–12oC, respectively
2006 (Oct. 17−31, 2006)
To determine the effectiveness of surface seal (tarp or water) and soil treatments (irrigation and amendment with chemical and composted manure), as well as in combinations of methods, to reduce emissions of 1,3-D and CP from broadcast applications of Telone C35
Hanford sandy loam; Telone C35 (500 kg ha-1)
1. Control 2. Manure + HDPE (manure application rate: 12,4 Mg ha-1). 3. KTS + HDPE (2:1 KTS/fumigant mass ratio or 1.4:1
molar ratio) 4. Pre-irrigation 5. Intermittent water seals (initial 13 mm water and 4 mm
water applications at 12 h, 24 h, and 48 h). 6. Intermittent KTS applications (initial 2:1 KTS/fumigant
ratio and 1:1 ratio at 12, 24, and 48 h, the same amount of water as treatment #5)
Daily max. and min. air T ranged in 20–30 and 2–9oC, respectively
2007 (Nov. 12− 22, 2007)
To determine the effect of soil amendment with composted manure with or without water applications on fumigant emission reduction and the potential impact on pest control
Hanford Sandy loam; Telone C35 (553 kg ha-1)
1. Control 2. Manure at 12.4 Mg ha-1 3. Manure at 24.7 Mg ha-1 4. Manure at 12.4 Mg ha-1 + HDPE tarp 5. Water seals (initial 11 mm water sprinkler applied
following fumigation and 4 mm water at 12, 24, and 48 h, respectively)
6. Combination of treatments 2 and 5 (Manure + water seals)
Daily max. and min. air T ranged in 17−24, 2−10oC, respectively

15
Table 2-3. Selected properties of soils used in this project
Soil properties Atwater loamy sand
Hanford sandy loam
Madera loam
Bulk density, g cm-3 1.6 1.4 1.4
Sand, g kg-1 880 548 404
Silt, g kg-1 50 396 344
Clay, g kg-1 70 56 252
Water content at 33 kPa suction, g kg-1 54 170 230
Organic matter content, g kg-1 7.2 7.4 11.2
Cation exchange capacity, cmolc kg-1 3.3 6.8 20
fumigants and solvents was conducted under well-vented hoods. Only glassware and Teflon
materials were used for all samples containing fumigants.
Fumigant products used in field fumigation included Telone II, Telone C35, and InLine (61%
1,3-D, 33% CP and 6% inert ingredient). The label information for these products can be
found on the Dow AgroScience Inc. website
(http://www.cdms.net/manuf/mprod.asp?mp=11&lc=0&ms=3691&manuf=11). Plastic films
tested in this project included standard (1 ml or 0.025 mm thickness) HDPE film (Tyco
Plastics, Princeton, NJ) and Bromostop VIF (0.025 mm thickness, Bruno Rimini Corp,
London, UK). The fumigant products and plastics as well as fumigation service for all field
trials were provided by TriCal Inc. (Hollister, CA).
2.2 Fumigant Analysis in the Laboratory
Laboratory analysis for fumigants is mainly for 1,3-D and CP. 1,3-D is comprised of cis- and
trans- isomers (Figure 1-1) that are quantified individually and simultaneously. Total 1,3-D,
is reported as the sum of the two isomers unless otherwise specified. Air or soil-gas samples
were collected in various experiments that were quantified either directly with gas
chromatography (GC) equipped with a micro electron capture detector (μECD) or trapped in
resin sampling tubes for later extraction and quantification. ORBO 613, XAD 4 80/40mg
16
(Supelco, Bellefonte, PA) sampling tubes were used for trapping gas samples. The XAD
resin traps both 1,3-D and CP efficiently at sampling flow rates below 200 ml min-1 (Gao et
al., 2006). After collection, the XAD sampling tubes were stored under frozen conditions (-
18 to -80oC) until ready for extraction. The extraction included breaking the tubes and
transferring all materials into 10 ml headspace glass vials. After 5 ml of hexane solvent was
added, the vials were sealed immediately and then shaken for 1 h. After settling for a
minimum of 2 h, a portion of the clear hexane extract was transferred to a 2 ml GC vial. The
vials were stored in the -18oC freezer until analysis. Based on analysis of 130 samples before
and after storage of one month, relative standard deviations were 2.2 (±4.6), 1.8 (±4.9), and
1.5 (±10.6) for cis 1,3-D, trans 1,3-D, and CP, respectively.
Analysis of cis-1,3-D, trans 1,3-D and CP in hexane extracts was carried out using an
Agilent Technology 6890N Network GC system μECD (Agilent Technology, Palo Alto,
CA). A DB-VRX capillary column (30 m length x 0.25 mm i.d. x 1.4-µm film thickness,
Agilent Technologies, Palo Alto, CA) was used for separation of fumigants. The GC carrier
gas (He) flow rate, inlet temperature, and detector temperature were set at 2.0 ml min-1, 140 oC, and 300 oC, respectively. The oven temperature program began initially at 65 oC,
increasing by 2.5 oC min-1 to 85 oC. Using this method, retention time was 5.2, 5.9, and 6.6
min for cis-1,3-D, trans-1,3-D, and CP, respectively. Slight modifications of the program
were used from time to time. The detection limit (three times the standard deviation of the
background noise level) was 0.01, 0.01, and 0.001 mg L-1 for cis-1,3-D, trans-1,3-D and CP,
respectively, when an injection volume of 1 μl solution was used. Depending on the sample
concentration range, a high standard range (1 to 100 mg L-1) and a low range (0.1 to 10 mg L-
1) were used at various times. If the sample concentration was above 100 mg L-1, sample
dilution was made to below 100 mg L-1 and reanalyzed. Numerous duplicate analyses of
samples were run that often resulted in standard deviation of less than 5%.
When fumigant in the soil-gas phase was sampled and analyzed directly with the GC such as
in laboratory soil column experiments, the gas sample was injected into 20 ml clear
headspace glass vials. To prevent moisture effects on fumigant stability, 0.2 g sodium sulfate
was added to the vial before sample injections. The sample analysis was performed using a
17
GC-µECD and an automated headspace sampler (Agilent Technologies G1888 Network
Headspace Sampler) system. A DB-VRX capillary column was used with the same
dimensions as the fumigant analysis mentioned above. Conditions for the headspace
autosampler were: equilibration temperature, 100°C; equilibration time, 2 min; and sample
loop, 1 ml. The GC carrier gas (He) flow rate, inlet temperature, and detector temperature
were set at 2.0 ml min-1, 150°C, and 300°C, respectively. The oven temperature program was
the same as the liquid sample analysis with GC-µECD as described above.
For residual fumigant analysis, soil samples were collected at the end of experiments or field
trials. Soil samples were stored under frozen conditions upon collection. The extraction of
soil samples followed methods by Guo et al. (2003). While the vials were still frozen, an
equivalent dry weight of 8 g of soil was weighed into a 20 ml clear glass vial. Eight ml of
ethyl acetate and a proper amount of Na2SO4 were added to the vial to adsorb soil moisture.
The amount of Na2SO4 was estimated at a 7:1 w/w Na2SO4:water depending on soil sample
water content. The vial was crimped with aluminum seals containing Teflon-faced butyl-
rubber septa, mixed and incubated at 80oC in a water bath overnight. After centrifuging, a
portion of the supernatant was transferred into a 2 ml GC vial for fumigant analysis using the
GC-μECD as described above, except that ethyl acetate was used as the standard and sample
solvent
2.3 Soil Column Experiment 1
The specific objective of this laboratory experiment was to determine the effectiveness of
surface amendments with ammonium thiosulfate (ATS) and composted manure or in
combination with water application or standard (HDPE) tarp on emission reduction of 1,3-D
from soil columns and compared to a water seal. This experiment was designed to test
whether applying chemicals or manure to soil surface with small amounts of water or in
combination with the HDPE tarp could reduce emissions effectively as large amounts of
water may affect fumigation efficacy. The Hanford sandy loam soil was used.
18
The Hanford soil with a soil water content of 5% (w/w) was packed into close-bottomed
stainless steel columns (63.5 cm high x 15.5 cm i.d.) to a height of 61.5 cm and the top 2 cm
was left empty in the column allowing surface water application. The columns were packed
in 5 cm increments to a uniform bulk density of 1.4 g cm-3. Sampling ports for soil gases
were installed at depths of 0 (under plastic tarp when applied), 10, 20, 30, 40, 50, and 60 cm
below the soil surface. A Teflon-faced silicone rubber septum (3-mm thick, Supelco Inc.,
Bellefonte, PA) was installed in each sampling port. The septum was replaced with a new
one after each use. A Teflon tube attached to the inside of each sampling port was extended
to the center of the column.
For emission measurements, a flow-through gas sampling chamber (4.5 cm deep with the
same diameter as the soil column) was placed on the top of the soil column and sealed to the
column with a sealant-coated aluminum tape to prevent any gas leakage. After the whole
column was assembled and treatment was applied, a continuous flow rate of 110 ±10 ml min-
1 through the chamber was maintained by a vacuum source. The chamber inlet port was sized
such that pressure inside the chamber should be no more than 0.6% below atmospheric
pressure. A flow meter was used to monitor and adjust the air-flow rate after sampling tubes
were replaced and between sampling times whenever needed. The flow rate usually
stabilized within 5 min to the set range. The column experiments were conducted at
laboratory room temperature (22 ± 3oC). Monitoring and sampling were normally done for
two weeks.
One hundred μl of liquid cis-1,3-D (122 mg) was injected into the column center at the 30-
cm depth (simulating shallow shank injection depth of 12”) through a custom-made long
needle syringe to the center of the column similar to column studies conducted previously
(Gao and Trout, 2006). We chose to use only cis-1,3-D because of the similar chemical
behavior between the two isomers (cis- and trans-1,3-D), although research has shown that
cis-1,3-D diffuses slightly faster than trans-1,3-D through HDPE film or soil (Yates et al.,
2002; Thomas et al., 2003). Two sets of soil columns (a total of 12) were packed in the
experiment. Treatments included:
19
1) Control: Dry soil (5%, w/w) soil water content, without tarp or water application
2) Water seal (9 mm of water were sprayed onto soil surface just before fumigant
injection)
3) Chemical seal (ATS 1:1), which was achieved by spraying 6 mm of water onto soil
surface followed by 3.1 ml 10% ATS solution in 3 mm H2O at 1:1 (ATS:fumigant)
molar ratio
4) Chemical seal plus plastic tarping (ATS 1:1 + HDPE), i.e., Treatment 3 plus HDPE
tarp
5) Chemical seal (ATS 2:1), which was similar to Treatment C with twice the amount of
ATS (ATS:fumigant at a 2:1 molar ratio)
6) Manure amendment plus water seal (Manure): 66 g (dry weight) composed steer
manure amendment incorporated into the top 5 cm of the soil layer (equivalent to 3.5
kg m-2, or 5% on a weight basis in the top 5 cm soil), plus one time spraying of 9 mm
of water just before fumigant injection
7) Manure amendment plus water seal and plastic tarping (Manure + HDPE): Treatment
6 plus HDPE tarping
Water or the ATS solution was sprayed onto the soil surface right before fumigant injection.
The HDPE tarp was sealed to the top edge of the columns with silicone sealant after columns
were packed. For the treatments with the manure amendment, manure was mixed in the top 5
cm soil in the columns. Except for the treatment of ATS 1:1 and the treatment of Manure +
HDPE, the rest of the treatments were duplicated.
The emission of fumigant from the soil surface was sampled by continuously flushing the air
above the soil column surface through ORBO 613, XAD 4 80/40mg sampling tubes at the
outlet of the chambers. The tubes were replaced every 1 h for the first three days during the
day and every 2 to 4 h for the remainder of the study. A chain of 2 to 6 ORBO tubes was
connected to ensure trapping of all emissions overnight. The fumigant in the soil-gas phase
was sampled by withdrawing a 0.5 ml of soil gas from the sampling ports with a gas-tight
syringe at 3, 6, 12, 24, and 48 h, and 3, 5, 8, 11, and 14 d after fumigant injection. At the end
of the experiment, soil samples from each column were taken at 10 cm depth intervals, and
20
soil water content and residual 1,3-D in the soil were determined. Further sample processing
and analysis followed the procedures described under Fumigant Analysis in the Laboratory.
2.4 Soil Column Experiment 2
The specific objective of this experiment was to determine the effectiveness of water seals on
reducing 1,3-D emissions from different textured soils (Atwater loamy sand, Hanford sandy
loam, and Madera loam, Table 2-3) using soil columns. The column design and study
methods were the same as in the soil column experiment 1. The soil columns were packed to
a bulk density of 1.6 g cm-3 throughout for the loamy sand and 1.4 g cm-3 for the sandy loam
and the loam soils, representing surface soil conditions in the field.
One hundred μl of liquid cis-1,3-D (122 mg) was injected into the column center at the 30 cm
depth through a custom-made long needle syringe. Soil surface treatments were: 1) Control:
no surface water application; 2) Initial water seal: sprayed 9 mm of tap water onto soil
surface just before fumigant injection; 3) Intermittent water seals: same as treatment 2
followed by two sprayed water applications of 3 mm at 12 h and 24 h after 1,3-D application.
The 9 mm of water would bring a 5 cm surface sandy loam soil or a 4 cm surface loam soil to
field capacity, while only 3 mm water would bring a 5 cm surface loamy sand soil to field
capacity (FC). Therefore, treatment 2 was not tested in the loamy sand soil because of its low
FC requirement and instead, a proportionally reduced-amount intermittent water seal
treatment (i.e., initial water 3 mm + 1 mm at 12 and 24 h) was tested. For the treatments with
water additions after the fumigant injection, the top chamber was removed from the column.
This would result in fumigant loss. To avoid biasing emission measurements, all the top
chambers for all the treatments were opened at the same time. The emission rate during the
period when the top chamber was removed was estimated based on the volume of the
chamber, the time for the chamber to remain open, and fumigant concentration before and
after the top chamber was removed. More than one set of column tests (a maximum of 6
columns each time in a fume hood) were conducted. The data on the sandy loam soil was
obtained from the previous publication of Gao and Trout (2006) and was used for
comparison with the other two soils in this study. All treatments were run in duplicate except

21
the reduced-amount intermittent water seal treatment used in the loamy sand. The laboratory
room temperature was at 22±3 °C. Sampling and monitoring continued for two weeks after
fumigant injection. The sampling, extraction and analysis of the emission samples and
analysis of fumigant in air and soil samples were similar to that described in soil column
experiment 1. The soil water content was also measured at the end of the experiment.
2.5 Soil Column Experiment 3
The specific objective of this experiment was to determine the effects of soil water content
on emission and distribution of 1,3-D and CP in soil columns. This experiment was designed
to identify an optimum range of soil water content that could provide emission reduction
benefits while also not reducing or impacting fumigant concentration and movement in soil,
thereby impacting efficacy. Thus the soil water content range tested was between air-dried to
maximum field capacity (FC). At the FC level (17%, w/w), soil air volume was about 25% at
a bulk density of 1.4. The Hanford sandy loam soil was used for the experiment. Both 1,3-D
(including cis-1,3-D, trans-1,3-D isomers) and chloropicrin (CP) were tested in the study
with a similar Telone C35 composition. In order to produce a uniform soil water content soil
column, relatively short columns (25 cm) were used simply because it would have taken a
substantially greater time to achieve the targeted soil water condition if longer columns were
employed. The relative differences in fumigant emission and changes in soil due to the
different soil moisture conditions were to be observed.
Air-dried soil (water content of 5.1%, w/w) was packed 23 cm deep at a uniform bulk density
of 1.4 g cm–3 into closed-bottom stainless steel columns (25 cm height x 15.5 cm i.d.). Gas
sampling ports were installed at 0, 10, and 20 cm below the soil surface. After packing the
soil columns, different amounts of water were added to the soil surface to achieve water
contents of 30, 45, 60, 75, 90 and 100% of field capacity, represented by W30, W45, W60,
W75, W90 and W100, respectively. All treatments were tested in duplicate columns. A soil
water content of 5.1% (w/w) was equivalent to 30% FC (W30). After water application, the
columns were covered immediately with aluminum foil and set aside to equilibrate for 6
weeks to achieve a uniform soil water distribution. The final soil water content for each

22
treatment is shown in Figure 2-1. The average soil water content in the columns within
treatments ranged from 4.5% (w/w) for W30 to 16.3% (w/w) for W100, which were close to
the target soil water contents based on FC of this soil (17%, w/w).
0
5
10
15
20
0 5 10 15 20
Soil water content (%, w/w)
So
il d
ep
th (
cm)
W30
W45
W60
W75
W90
W100
Figure 2-1. Soil water content in soil column experiment 3. Error bars are the standard
deviation of duplicate samples.
Similar to the soil column experiments 1 and 2, a flow-through gas sampling chamber was
installed directly above the soil columns and the connection was sealed with sealant-coated
aluminum tape to prevent gas leakage. A 250 μl fumigant solution containing 111 mg each of
cis-1,3-D, trans-1,3-D, and CP was injected into the column center at the 10 cm depth using
a long needle syringe. After the injection (time zero), a constant air flow rate of 110±10 ml
min-1 was established through the chamber by applying a vacuum to the discharge port, and
was monitored with a flow meter. Fumigant emissions and the fumigant in the soil-gas phase
were sampled for 14 days at laboratory room temperature (22 ± 3°C). Residual fumigants and
soil water content were determined at the end of the experiment. The sampling procedure for
the fumigant emission and soil gas as well as residual fumigants (at 5 cm increment) in the
end of experiment were similar to that described under the laboratory experiments 1 and 2.
23
2.6 Field Trial 1 (Year 2005)
The specific objective of this field trial was to determine the effects of soil fumigation
methods (shank-injection vs. subsurface drip-application) and surface treatments with water
applications and plastic tarps on emissions of 1,3-D and CP. This field trial was conducted in
fall (Oct. 26–Nov. 8) 2005 in a 1.8-ha peach replant orchard near Parlier (Latitude: 36o 35’
36.74” N; Longitude: 119o 30’ 48.71” W), CA. The soil is the Hanford sandy loam with a
bulk density ranging from 1.45-1.65 g cm-3. Mature peach trees were removed from this field
three months prior to fumigation. The field was cultivated (deep ripped) to a 75 cm depth,
disked, and land planed, and all visible root pieces were removed. The field was dry with
water content varying from about 2% (v/v) near the soil surface to 10% (v/v) at a 1.2 m depth
following preparation, as is common for orchard replant conditions in the arid-to-semiarid
climate of the San Joaquin Valley.
2.6.1 Fumigation and Treatment
The fumigation trial was originally designed in replicated complete block to investigate the
performance of replant peach trees for several years after fumigation with alternative
fumigants (e.g., 1,3-D, CP, and methyl iodide). For all the treatments, fumigation was
applied to the center 3.2 m strip of each tree row and the fumigation area was 53% coverage
of the field. Selected row subsections from the field trial were modified by adding treatments
for the emission studies. Two rows from one replication were chosen that included shank-
injection of Telone® C35 and subsurface drip-application of InLine. Soil surface treatments
were made in subsections of each row as described in Table 2-4. The target rate was the
maximum rate recommended for fruit and nut crops according to the label (e.g., 50 gallons
per acre of Telone C35 for broadcast applications, equivalent to 628 kg ha-1).
Telone C35 was shank-applied at an actual rate of 745 kg ha-1, which exceeded the target rate
by about 20%, and InLine was drip-applied close to the target rate at 629 kg ha-1. Telone C35
was applied 46 cm deep with 7 shanks spaced 46 cm apart. InLine was applied through
Netafim Streamline 60 thin-walled drip tubing (drip tape) (0.15 mm wall thickness, 0.87 L h-
24
1 emitter flow rate, and 30 cm emitter spacing) installed 20 cm below the soil surface on 46
cm spacing. The seven tapes in each 3.2 m treatment strip were connected through a
temporary manifold to the delivery pipeline. The chemical was applied with 150 mm of
irrigation water (InLine concentration = 400 mg l-1) over 25 h, which was sufficient to
penetrate to about a 1.3 m depth. The long application time is required to get sufficient water
penetration without water ponding during the treatment.
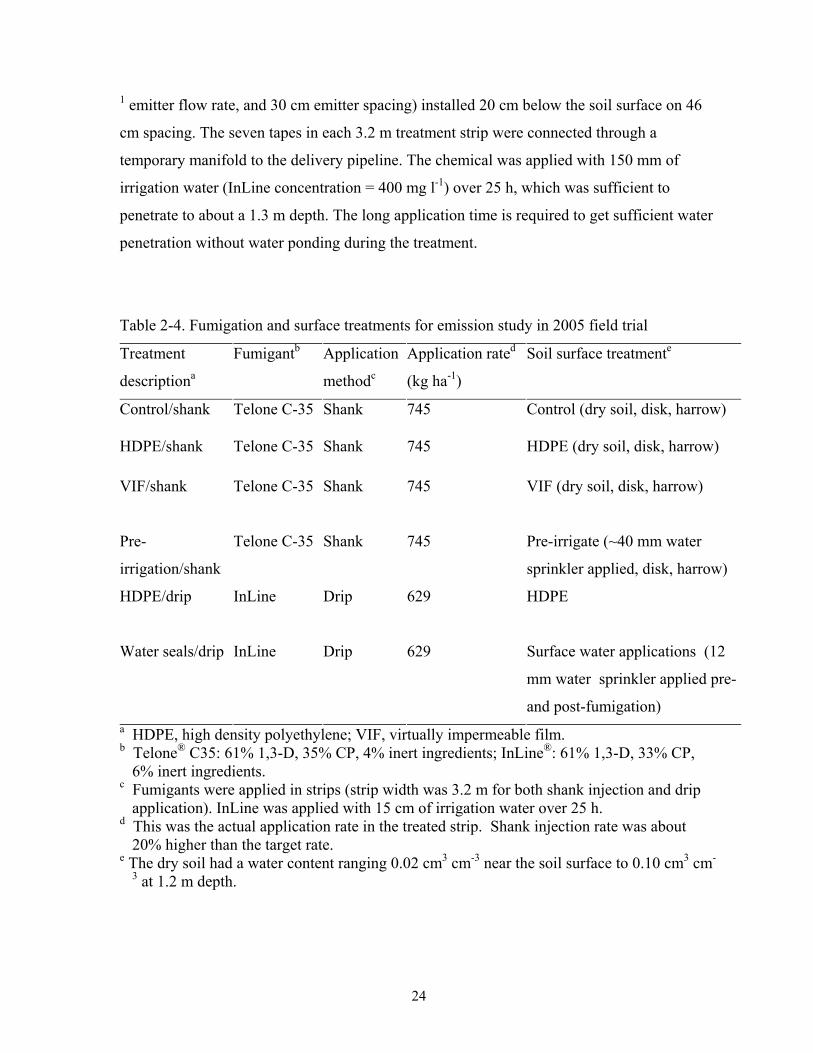
Table 2-4. Fumigation and surface treatments for emission study in 2005 field trial
Treatment
descriptiona
Fumigantb
Application
methodc
Application rated
(kg ha-1)
Soil surface treatmente
Control/shank Telone C-35 Shank 745 Control (dry soil, disk, harrow)
HDPE/shank Telone C-35 Shank 745 HDPE (dry soil, disk, harrow)
VIF/shank Telone C-35 Shank
745 VIF (dry soil, disk, harrow)
Pre-
irrigation/shank
Telone C-35 Shank
745 Pre-irrigate (~40 mm water
sprinkler applied, disk, harrow)
HDPE/drip InLine Drip
629 HDPE
Water seals/drip InLine Drip 629 Surface water applications (12
mm water sprinkler applied pre-
and post-fumigation) a HDPE, high density polyethylene; VIF, virtually impermeable film. b Telone® C35: 61% 1,3-D, 35% CP, 4% inert ingredients; InLine®: 61% 1,3-D, 33% CP,
6% inert ingredients. c Fumigants were applied in strips (strip width was 3.2 m for both shank injection and drip
application). InLine was applied with 15 cm of irrigation water over 25 h. d This was the actual application rate in the treated strip. Shank injection rate was about
20% higher than the target rate. e The dry soil had a water content ranging 0.02 cm3 cm-3 near the soil surface to 0.10 cm3 cm-
3 at 1.2 m depth.
25
Four soil surface treatments were tested with shank injection: control (dry soil with no water
application or surface treatment), HDPE tarp over dry soil, VIF tarp over dry soil, and pre-
irrigation; and two treatments were tested with drip-application: HDPE tarp and water seals.
Each treatment area was about 9 m x 3.2 m. Plastic tarps were applied to the strip
immediately following shank-injection or prior to the drip-application. For the pre-irrigation
treatment, the strip was irrigated with micro-spray sprinklers 4 days before fumigation to
achieve soil water content near field capacity to a 25 cm depth, which required about 40 mm
of water. All shank treatments were disked and harrowed immediately following fumigation
and before tarping following the label requirements. For the water seals over drip-application
treatment, 12 mm of irrigation water was applied with micro-sprinklers just before and after
fumigant application.
2.6.2 Field Sampling
Fumigant emissions and distribution in the soil-gas phase were monitored for two weeks
after fumigation. Soil samples were taken at the end of the trial for determining residual
fumigants in the soil. Efficacy monitoring was included in this trial on selected nematodes.
Because the field did not have significant native parasitic nematode populations, bagged
samples of citrus nematode (Tylenchulus semipenetrans) infested soil were prepared and
buried at depths of 30, 60, and 90 cm the day before fumigation in all the treatments and
were retrieved four weeks later and analyzed for their survival.
Emission samples were collected using static or passive (open bottom) chambers assembled
from inverted Leaktite galvanized steel buckets (Leaktite Co., Leominster, MA). At the top
center of the chamber, a sampling port with a Teflon-faced silicone rubber septum (3-mm
thick, Supelco Inc., Bellefonte, PA) was installed for withdrawing gas samples. For
treatments with plastic tarps, the chamber bottom was sealed to the plastic film with silicone
rubber sealant. For treatments with no plastic tarp, the chamber bottom was pushed into the
soil about 3 cm and soil was packed around the chamber. Within 30 min after the chamber
placement, a 120-ml gas sample from inside the chamber was withdrawn through the
sampling port using a gas-tight syringe and through an ORBO™ 613, XAD 4 80/40mg tube
26
for trapping both 1,3-D and CP. The sampling tubes were immediately capped at both ends,
stored on dry-ice in the field and stored in a freezer (-18oC) in the laboratory, and extracted
within six weeks for fumigant analysis using the procedures described under Fumigant
Analysis. Duplicate measurements were made for each treatment. Samples were collected
every 2–3 h for the first 36 h and every 4 h thereafter during the day.
Based on the fumigant concentration within the chamber, capture time, chamber volume and
covering surface area, the average emission rate (flux) during the capture time was calculated
and compared among treatments. By assuming a linear model for concentration increase
inside the chamber over time, the flux was calculated:
Adt
VdCf or
)(
)(
12
12
ttA
CCVf
(2.1)
where V and A are the chamber volume and covering surface area, and C1 and C2 are the
concentrations measured at time t1 and t2 during chamber deployment, respectively.
However, a linear model is often ideal because of the decrease of diffusion rates into the
chamber as concentrations increased inside the chamber (Yates et al., 2003). Thus, the
average emission rates likely underestimated actual instantaneous emission rates, especially
when emissions were high. After the first 36 h following fumigation, no measurements were
made at nighttime, when emissions were expected to be low. An emission flux measurement
early in the morning was used to estimate emission loss during the night. Data from all the
treatments were treated the same and comparisons or relative differences between treatments
in reducing emissions should be valid. Cumulative emissions of 1,3-D and CP were
estimated by summing up the products of the average of two consecutive emission flux
values and the time interval between the two measurements over the time span of the study.
Because the actual application rates for shank-injection (745 kg ha-1) were 20% higher than
the drip applications (629 kg ha-1), direct comparisons of absolute emission values between
shank-injection and drip-application was not appropriate. Total emissions were normalized
by the application rate as a percent of total applied to reduce this bias.
27
Soil-gas sampling probes were installed following fumigation and surface treatments. The
probes were stainless steel tubing (i.d. 0.1-mm), with the lower ends inserted to depths of 10,
30, 50, 70, and 90 cm below the soil surface. A set of five probes were installed in each
treatment plot at Location “a” adjacent to shank-injection lines or drip tapes and Location “b”
between shank-injection lines or drip tapes. A 50 ml soil gas sample at each depth was
withdrawn through an ORBO™ 613, XAD 4 80/40mg tube using a custom-made sampling
apparatus. This apparatus was able to collect 10 samples at a time. During sample analysis
we concluded that the apparatus did not collect adequate samples at the 50 cm depth at
Location “a” indicating a failure of the sampling line. Thus, fumigant concentration in the
soil-gas phase at this depth was estimated based on the distribution pattern of fumigant
concentrations at Location “b”. The gas samples were collected at 6, 12, 24, 30, 36, 48, 72,
120, 168, 216, and 336 h following fumigation. Processing of the sampling tubes for analysis
was the same as the emission samples.
Soil samples were taken at the end of the field trial at 20 cm depth intervals to 100 cm to
determine residual fumigants and soil water content. Samples were collected with an auger (5
cm i.d.) and immediately mixed, from which a portion was taken and placed into a screw-top
glass jar and placed on dry ice in the field. This process was done as quickly as possible to
minimize fumigant losses. Despite taking all precautions, some losses were unavoidable and
thus the estimated values might be lower than actual. The jars were stored in a freezer (-
18oC) in the laboratory until analyzed.
The soil temperature at a 10 cm depth from each treatment plot was measured using a
Traceable® thermometer one day during the field trial.
2.7 Field Trial 2 (Year 2006)
The specific objective of this field trial was to determine the effectiveness of surface seal
(tarp or water) and soil treatments (irrigation and amendment with chemical and composted
manure), as well as combinations of methods, to reduce emissions of 1,3-D and CP from
broadcast applications of Telone C35. This field trial was conducted from Oct. 17-31, 2006
28
at the USDA-ARS San Joaquin Valley Agricultural Sciences Center. Other information
regarding this trial is given in Table 2-2.
2.7.1 Fumigation and Treatment
A field strip (150 m long and 9 m wide) was prepared and soil was cultivated to a 76 cm
depth for fumigation. The soil was dry. The field was irrigated with sprinklers two weeks
prior to fumigation and the irrigation stopped when the wetting front reached about an 8 cm
depth. The soil moisture at the top 50 cm depth was measured as an average 8% (v/v or 5.1
%, w/w), which was 30% of field capacity, on the day before fumigation.
Half of the field strip (150 m long and 4.5 m wide) was fumigated by shank injection of
Telone C35 to a depth of 46 cm below soil surface. The other half was not fumigated, serving
as a comparison to the fumigated area for efficacy studies (Hanson et al., 2007). The
fumigation was applied on Oct.17 by TriCal Inc. using a rig with 8 shanks spaced 50 cm
apart. Fumigation started at 0900 h and was completed within 5 min in one pass across the
field. The actual application rate of Telone C35 was 500 kg ha-1 (445 lb ac-1), which was
about 20% lower than the target rate. Immediately following fumigation, the field surface
was tilled with a spring tooth harrow and ring roller in a one pass operation to compact the
surface soil and eliminate large pores and shank traces.
Six surface seals or soil treatments were applied with three replicates in a randomized
complete block design. The treatment was applied perpendicular to shank injection lines. A 3
m wide buffer was given between blocks and treatments with water applications. The final
treatment plot size was 9 m x 3 m for tarped treatments and 9 m x 9 m for irrigation
treatments. The treatments included irrigation prior to fumigation, water seals after
fumigation, and amendment of surface soils with potassium thiosulfate (KTS) with or
without HDPE tarp or composted manure with HDPE tarp. These treatments had shown their
potential in reducing fumigant emissions in previous research either in soil columns or small
field plot tests (e.g., Gan et al., 1998a, b; Zheng et al., 2006; Gao and Trout, 2007). One of
the main purposes of this trial was to test these treatments simultaneously under field

29
conditions for controlling emissions as well as for controlling soil pests. Treatments are
summarized below:
1) Control (bare soil without irrigation or tarping)
2) Manure + HDPE (manure application rate was 12.4 Mg ha-1)
3) KTS + HDPE (KTS was applied in 4 mm water at 1000 kg ha-1 (a.i.) or 2:1
KTS/fumigant mass ratio, which was equivalent to 1.4:1 molar ratio)
4) Pre-irrigation (34 mm water was applied 4 days prior to fumigation)
5) Intermittent water seals (13 mm water was applied immediately following
fumigation, with an additional 4 mm water application at 12 h, 24 h, and 48 h,
respectively)
6) Intermittent KTS applications [KTS at 1000 kg ha-1 (a.i.) or 2:1 KTS/fumigant ratio
immediately following fumigation, and at 500 kg ha-1 (a.i.) or 1:1 ratio at 12, 24, and
48 h using the same amount of water as treatment #5]
For treatment 2 (Manure + HDPE), composted steer manure purchased from a local garden
center was spread over the soil surface immediately after fumigation and surface preparation,
i.e., the organic material was not incorporated into the soil. The manure application rate is
commonly used by many growers as a source of fertilizer or material for maintaining soil-
properties in the region. The HDPE tarp was installed immediately after the manure was
applied.
For treatment 3 (KTS + HDPE), KTS® was obtained in the 50% liquid formula (KTS, 0-0-
25-17S) from Tessenderlo Kerley (Phoenix, AZ), and was applied in 4 mm water using a 3 m
wide spray bar. The HDPE tarp was hand-applied to avoid the compaction of wet surface
soils by equipment after application of the KTS solution.
For treatment 4 (pre-irrigation), 34 mm water was applied four days prior to fumigation using
a sprinkler-irrigation system with one sprinkler at each corner of each 9 m x 9 m plot. This
amount of water was expected to result in a soil water content of 60% of FC for the top 30
cm of soil.
30
For treatment 5 (intermittent water seals), the water seal was applied to each plot using the
sprinkler-irrigation system described in treatment 4. Thirteen mm of water was initially
applied following fumigation to moisten the top 8 cm of soil. Application of this amount of
water took about 1.5 h following fumigation. For subsequent water applications at 12, 24,
and 48 h, 4 mm of water were applied in about 25 min. The small water applications were to
compensate for evaporation losses near the soil surface, so as to maintain a moist surface.
For treatment 6 (intermittent KTS applications), the application schedule and the amount of
water used in delivering KTS to soil surface were the same as treatment 5. At the initial
application following fumigation, the KTS solution at a 2:1 KTS/fumigant (w/w) ratio was
applied in the last 30 min of sprinkler irrigation. For the subsequent application, i.e., at 12, 24
and 48 h, a 2:1 KTS solution was applied in 4 mm water.
2.7.2 Field Sampling
Similar to the 2005 field trial, sampling for air emissions and soil gas distribution of applied
fumigants (1,3-D and CP) was conducted for two weeks following fumigation. At the end of
the sampling period, soil samples were collected for residual fumigants in the soil. Soil water
content was determined for the control and pre-irrigated plots on the day before fumigation, 4
days later, and at the end of the field trial for all plots.
Air emission sampling, sample processing and analysis followed the procedures similar in
the 2005 field trial with minor modifications indicated below. Briefly, emissions were
measured using static (passive) flux chambers. In 15 min after the chamber placement, a 100
ml gas sample was withdrawn through the sampling port and the XAD tube at a flow rate
between 100-200 ml min-1. The short chamber capture time was used to reduce the potential
of underestimation of flux. Sampling was done following a similar schedule to the 2005 field
trial. The XAD sampling tubes were immediately capped after collection, stored on dry ice in
the field, and transferred into an ultra-freezer (-80oC) in the laboratory. The fumigants were
extracted from the tubes and analyzed within 4 weeks. Storage of the sample extracts did not
result in significant loss of fumigants.
31
Fumigant in the soil-gas phase was sampled using the same methods as described in the 2005
field trial. The same applies to soil samples at the end of the trial to determine residual
fumigants in the soil. Soil temperature was also monitored for one day during the trial.
The effect of surface sealing treatments on efficacy was included in this trial. Selected
nematodes and weeds were investigated by collaborators. The pest control results are not
reported here; but can be found in Hanson et al., (2007).
2.8 Field Trial 3 - 2007
The objective of the 2007 field trial was specifically to determine the effects of soil
amendments with composted manure with or without water applications on fumigant
emission reduction and the potential impact on pest control efficacy. The trial was conducted
at the USDA-ARS San Joaquin Valley Agricultural Sciences Center in November, 2007.
Other information regarding this trial is given in Table 2-2.
2.8.1 Fumigation and Treatment
A field site (160 m long and 10 m wide) was cultivated to a 75 cm depth and irrigated two
weeks before fumigation to achieve adequate soil moisture conditions for the application.
Soil water content determined two days before fumigation averaged 12.0% v/v (45% of field
capacity) in the top 50 cm of soil. To determine the effect of organic amendment on fumigant
(1,3-D and CP) emissions, the following surface treatments were applied:
1) Control
2) Manure at 12.4 Mg ha-1
3) Manure at 24.7 Mg ha-1
4) Manure at 12.4 Mg ha-1 + HDPE tarp
5) Water seals (11 mm water sprinkler-applied immediately following fumigation and
three subsequent applications of 4 mm water at 12, 24, and 48 h, respectively)
6) Combination of treatments 2 and 5 (Manure at 12.4 Mg ha-1 + water seals).
32
Composted manure was obtained from Earthwise Organics (Bakersfield, CA) and used for all
manure treatments except Treatment 4. The composted material was prepared from 100%
dairy manure feedstock using a windrow composting process. The windrows had water
added and were mechanically turned on a frequent basis. Active compost was maintained
under aerobic conditions at a minimum temperature of 55oC, and a maximum of 65oC for a
pathogen reduction period extending 15 days or longer to successfully undergo “Processes to
Further Reduce Pathogens (PFRPs)”, as described in Title 14, California Code of Regulations
Section 17868.3. During this period, there was a minimum of five turnings of the windrow.
Duration in the windrows is typically 90 to 120 days, after which it was stockpiled for
several months. The composted materials had a normal average water content of 65%,
organic matter of 37%, ash of 64%, total N of 1.6%, total P (P2O5) of 1.8%, and total K
(K2O) of 2.8% (all on dry weight basis) (Joe Voth, Paramount Farming Company,
Bakersfield, CA, personnel communication, 2008).
All manure application rate treatments refer to fresh weight and material obtained for this
trial had an average water content of 55% (w/w). The manure material was spread evenly
over the soil surface within a 3 m x 9 m plot prior to fumigation and was incorporated into
surface (about 15 cm) soils with a disc and roller operation following fumigant application.
The incorporation was restricted to surface soils to ensure that the organic material would
react with fumigants only in surface soils and would not reduce fumigant concentrations or
pest control efficacy in the deeper soil profile. Treatment 4 was included to compare to a
similar treatment tested in the 2006 field trial when the manure was not incorporated into the
soil. Thus, the same materials were used for the two treatments (steer manure obtained from
a local garden supply store). The manure application rates of 12.4 Mg ha-1 and 24.7 Mg ha-1
(~5 and 10 tons per acre) represent commonly used soil amendment rates in conventional
farming for maintaining/improving soil physiochemical properties.
On 12 Nov. 2007, Telone C35 was shank-applied using a rig with 9 shanks spaced 50 cm
apart and a 45 cm injection depth. The application rate was 553 kg ha-1, ~15% lower than the
target rate. Following fumigant injection, the surface soil was compacted with a disc and a
ring roller operation followed by tarp placement and irrigation treatments. Similar to the

33
2006 field trial, water seals were applied with quarter-circle sprinklers that were installed at
each corner of the 9 m x 9 m plots. All operations including manure incorporation and
installation of tarps were completed within 30 minutes after fumigant injection. The initial
water seal application started about 3 h following fumigation and took about 1.5 hours to
complete. The 11 mm of water was sufficient to moisten the top 10 cm of soil to field
capacity. All treatments were replicated three times in a randomized complete block design.
The blocks and treatments were distributed along a 160 m long strip of the field.
2.8.2 Field Sampling
Emissions, fumigant in the soil-gas phase, and soil residual fumigants at the end of the
fumigation were sampled similarly to the previous field trials. The major difference from the
previous trials was that in the 2007 field trial, emission sampling was accomplished using
dynamic flux chambers (DFCs). Twenty four DFCs were constructed in 2007 following
similar designs reported in Gao et al. (1997) and Wang et al. (1999a). The DFCs consist of
two components, a flow-through chamber and an automated sampling and data module (Gao
et al., 2008a). Unlike passive chambers that are labor-intensive and non-continuous, the
DFCs allow continuous sampling during the course of the monitoring period, i.e., including
day and night. The flow-through chambers were made to cover a soil surface area of 51 cm x
25 cm. The chambers were installed near the center of each treatment plot (for a total of 18
plots), perpendicular to shank lines after fumigant injection. A constant air flow (5 L min-1)
was maintained through the chamber using a vacuum source. The inflow air was collected 10
m away from the plots and 3 m above the ground through a PVC pipe (i.d. 10 cm). The
inflow air was sampled to obtain background levels of each fumigant, which turned out to be
negligible most of the time. A small portion (100 ml min-1) of the outflow air was sampled by
a split sampling line connected to XAD sampling tubes for trapping 1,3-D and CP. For the
first three days, two XAD sampling tubes were used in series to avoid breakthrough when the
emission flux was high. Sampling tubes were changed every 3 h for the first 4 days and every
6 h thereafter for the remaining days in this trial. At the end of each sampling period, the
XAD tubes were replaced with new ones. When a steady state air flow is established through
34
the chamber, the flux (f) during a sampling period of time can be calculated from flow and
gas concentration measurements using:
)( inout CCA
Qf (2.2)
where Q is the total air flow through the chamber, A is the soil surface area covered by the
chamber, Cin and Cout are the gas concentrations at the inlet and the outlet, respectively. The
inlet concentration, Cin, is usually negligible for contaminants from a clean air source. When
a split sampling line is used, as is the case of sampling scheme we used, a multiplier (dilution
factor, i.e., ratio of total chamber flow to sample flow), needs to be inserted into Eq. 2.2.
Deployment of the DFCs presented some problems during the first year due to unexpected
condensation problems when temperatures dropped, often occurring during the nighttime.
The condensation caused malfunctioning or stopping of air flow meters in the system. This
problem was suspected to result in some over-estimation of flux. The problems were later
addressed by adding a heating unit in the flow path of the DFC system (Gao et al., 2009).
Thus, caution is needed in interpretation of the 2007 field trial emission data.
Fumigant in the soil-gas phase and residual fumigants in soil at the end of the trial were
sampled as in the previous trials. For the 2007 field trial, the soil sampling depth was only
down to 70 cm because the previous trials showed negligible fumigant concentration below
this depth. Soil temperatures at 10 cm below soil surface were measured for one day.
Efficacy studies on selected nematode, weed and pathogen species were conducted by other
research scientists in the Water Management Research Unit and will be reported elsewhere.
2.9 Statistical Analysis
Statistical analysis on treatment effects was performed when appropriate. In order to describe
the time-series cumulative emission data for soil column experiment 3, a regression analysis
was performed using a three-parameter sigmoidal model (Hill equation; Sigma Plot version
35
10.0); Y = a*Xb/ (cb +Xb), where Y is the fumigant cumulative emission (% of applied), X is
the time (h), a is the predicted maximum emission loss, b is Hill or sigmoidicity coefficient,
and, c is the time when the emission equals half of the predicted maximum emission loss (h).
For the 2006 and 2007 field trials, SAS 9.1.2 or 9.2 (SAS Institute Inc.) was used to
determine treatment effects on the fumigant peak emission flux shortly after fumigation,
cumulative emission loss, soil residual fumigant concentrations, surface soil water contents
and temperature, etc. A general linear model (Proc GLM) was used to conduct the analysis of
variance (ANOVA) and treatment means were separated using either Tukey’s HSD (honestly
significant difference) (2006 trial) or Fisher’s Protected Least Significant Difference (LSD)
procedure (2007 trial) with α = 0.05.
3.0 RESULTS AND DISCUSSIONS
The major results for each experiment or field trial have been reported in published journal
articles. These papers include McDonald et al., 2008 (Environ. Sci. Technol.); McDonald et
al., 2009 (J. Environ. Qual.); Qin et al., 2009 (Atmos. Environ.); Gao et al., 2008b (Sci. Total
Environ); Gao et al., 2008c (J. Environ. Qual.); and Gao et al., 2009 (J. Agric Food Chem.).
Discussions about the results and conclusions are revisited after integrating all research data
obtained under this project.
3.1 Soil Column Experiment 1
3.1.1 Emission Flux
The emission flux of 1,3-D from the column treatments is shown in Figure 3-1. The control
(dry soil without surface treatment) resulted in the highest emission peak (16 μg m-2 s-1) at
about 15 h after injection, and then rapidly declined with time. Water seals, as well as
chemical and manure-amended surface soil treatments gave a lower peak 1,3-D emission
within 15 h but the rate was sustained for up to 36 h. Initial water application (water seal) had
a peak emission flux of 10 μg m-2 s-1. Manure amendment with water resulted in further
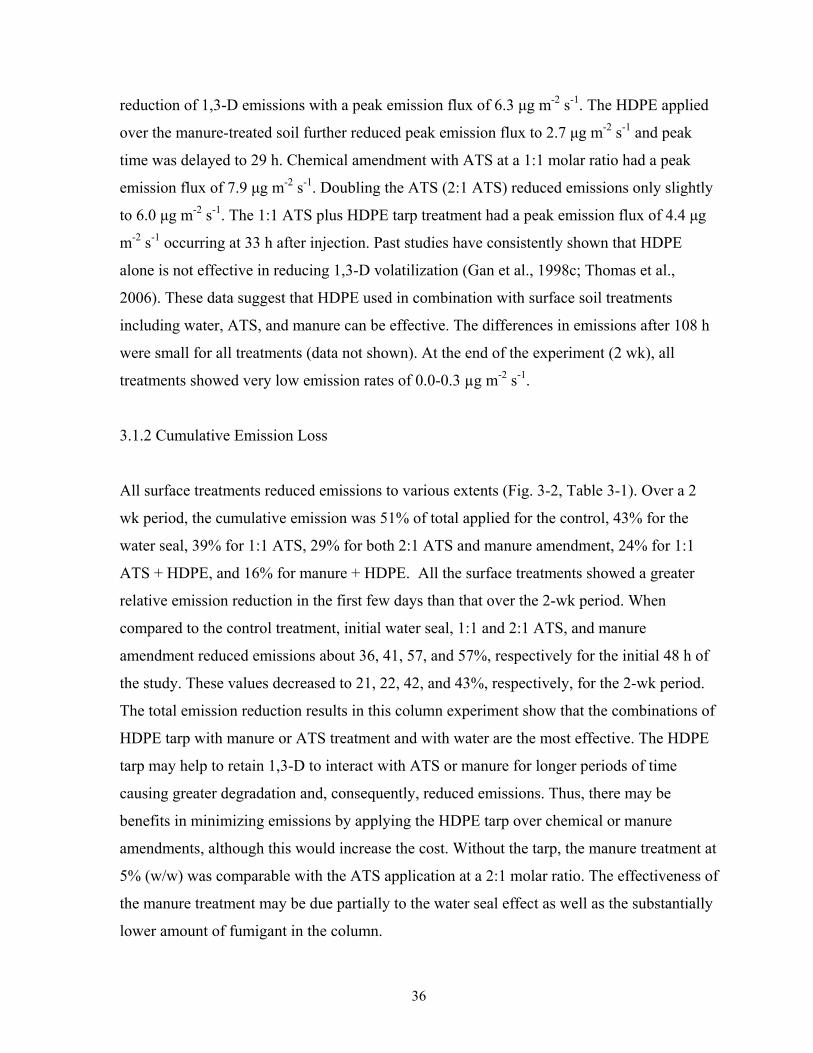
36
reduction of 1,3-D emissions with a peak emission flux of 6.3 μg m-2 s-1. The HDPE applied
over the manure-treated soil further reduced peak emission flux to 2.7 μg m-2 s-1 and peak
time was delayed to 29 h. Chemical amendment with ATS at a 1:1 molar ratio had a peak
emission flux of 7.9 μg m-2 s-1. Doubling the ATS (2:1 ATS) reduced emissions only slightly
to 6.0 μg m-2 s-1. The 1:1 ATS plus HDPE tarp treatment had a peak emission flux of 4.4 μg
m-2 s-1 occurring at 33 h after injection. Past studies have consistently shown that HDPE
alone is not effective in reducing 1,3-D volatilization (Gan et al., 1998c; Thomas et al.,
2006). These data suggest that HDPE used in combination with surface soil treatments
including water, ATS, and manure can be effective. The differences in emissions after 108 h
were small for all treatments (data not shown). At the end of the experiment (2 wk), all
treatments showed very low emission rates of 0.0-0.3 µg m-2 s-1.
3.1.2 Cumulative Emission Loss
All surface treatments reduced emissions to various extents (Fig. 3-2, Table 3-1). Over a 2
wk period, the cumulative emission was 51% of total applied for the control, 43% for the
water seal, 39% for 1:1 ATS, 29% for both 2:1 ATS and manure amendment, 24% for 1:1
ATS + HDPE, and 16% for manure + HDPE. All the surface treatments showed a greater
relative emission reduction in the first few days than that over the 2-wk period. When
compared to the control treatment, initial water seal, 1:1 and 2:1 ATS, and manure
amendment reduced emissions about 36, 41, 57, and 57%, respectively for the initial 48 h of
the study. These values decreased to 21, 22, 42, and 43%, respectively, for the 2-wk period.
The total emission reduction results in this column experiment show that the combinations of
HDPE tarp with manure or ATS treatment and with water are the most effective. The HDPE
tarp may help to retain 1,3-D to interact with ATS or manure for longer periods of time
causing greater degradation and, consequently, reduced emissions. Thus, there may be
benefits in minimizing emissions by applying the HDPE tarp over chemical or manure
amendments, although this would increase the cost. Without the tarp, the manure treatment at
5% (w/w) was comparable with the ATS application at a 2:1 molar ratio. The effectiveness of
the manure treatment may be due partially to the water seal effect as well as the substantially
lower amount of fumigant in the column.
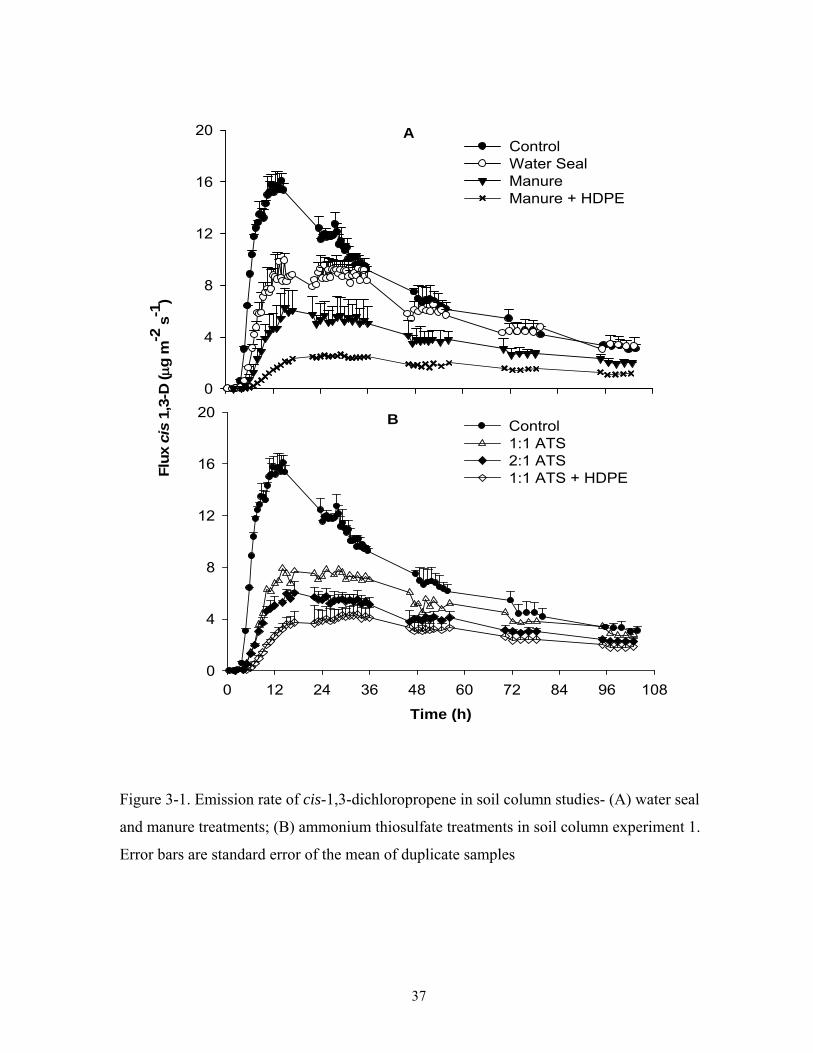
37
0
4
8
12
16
20Control Water Seal Manure Manure + HDPE
A
Time (h)
0 12 24 36 48 60 72 84 96 108
Flu
x ci
s 1,
3-D
(g
m-2
s-1
)
0
4
8
12
16
20Control1:1 ATS2:1 ATS1:1 ATS + HDPE
B
Figure 3-1. Emission rate of cis-1,3-dichloropropene in soil column studies- (A) water seal
and manure treatments; (B) ammonium thiosulfate treatments in soil column experiment 1.
Error bars are standard error of the mean of duplicate samples

38
Time (h)
0 60 120 180 240 300 360
% C
um
ula
tive
Em
issi
on
s o
f ci
s 1,
3-D
0
20
40
60
80 ControlWater Seal1:1 ATS2:1 ATSManure1:1 ATS + HDPEManure + HDPE
Figure 3-2. Cumulative emissions of cis-1,3-dichloropropene from soil column treatments
over two weeks in soil column experiment 1.
3.1.3 1,3-D Concentrations in Soil-Gas Phase
The distribution of 1,3-D in the soil-gas phase over time is shown in Fig. 3-3. The greatest
concentration of 1,3-D was at the first sampling time (3h) near the injection depth. A fairly
uniform 1,3-D distribution at about 1 mg L-1 in the column gradually established within 48h
for all treatments. By the end of the experiment (2 wk), the soil gas phase had concentrations
at or near 0.1 mg L-1 for all treatments.
The distributions of 1,3-D over time in the soil-gas phase were similar for all ATS and
manure surface treatments indicating the surface treatment would not have a great impact on
39
fumigant concentrations in the soil profile if managed properly. The initial concentration of
1,3-D in the soil-gas phase in the ATS or manure were slightly lower (5-6 mg L-1) compared
to the control (8 mg L-1). 1,3-D could be degraded rapidly by subsurface applications of ATS
in the root-zone (Wang et al., 2000; Papiernik et al., 2004). This indicates that 1,3-D diffuses
fairly quickly in soil and applying ATS to the soil surface can effectively reduce 1,3-D
concentrations throughout the soil profile and achieve emission reductions. The slightly
reduced 1,3-D concentration with the ATS application may not mean a reduced fumigation
efficacy as some studies indicated, and ATS showed no negative impact on fumigation
efficacy (Gan et al., 1998a; 2000). Similarly, the addition of organic amendments to the soil
may reduce fumigant exposure to soil pests due to the strong interaction between fumigant
and OM (Kim et al., 2003). Water seals appeared to slightly decrease the concentration of
1,3-D in the soil-gas phase during the initial periods of this study.
3.1.4 Residual and the Fate of 1,3-Dichloropropene
Residual 1,3-D at the end of the experiment for most samples was low (0.3 ± 0.1 µg g-1 soil)
for all soil depths. However, soil samples from the top 5 cm manure-treated columns
contained up to 10.4 ± 1.9 µg g-1 where organic matter was added. These results indicate
greater residual bound 1,3-D via possible sorption with organic matter. Work by Kim et al.
(2003) found that soil organic matter content could potentially be used as an indicator to
predict adsorption capacity for 1,3-D.
The amount of 1,3-D degraded in soil columns during the experiment was estimated by
subtracting total emission loss, fumigant in the soil-gas phase, and residual fumigant
remaining in soil (Table 3-1). The emissions of 1,3-D ranged from 16 % (manure + HDPE)
to 51 % (control) of the total amount applied. The amount of 1,3-D in the soil-gas phase at
the end of the experiment was very low, from 0.1 to 0.2 % of applied. Residual 1,3-D in the
solid-liquid phase ranged from 3 to 5 % of applied for most treatments. The greatest residual
1,3-D was found in the manure (13% of applied) and manure + HDPE (17% of applied)
treatments.
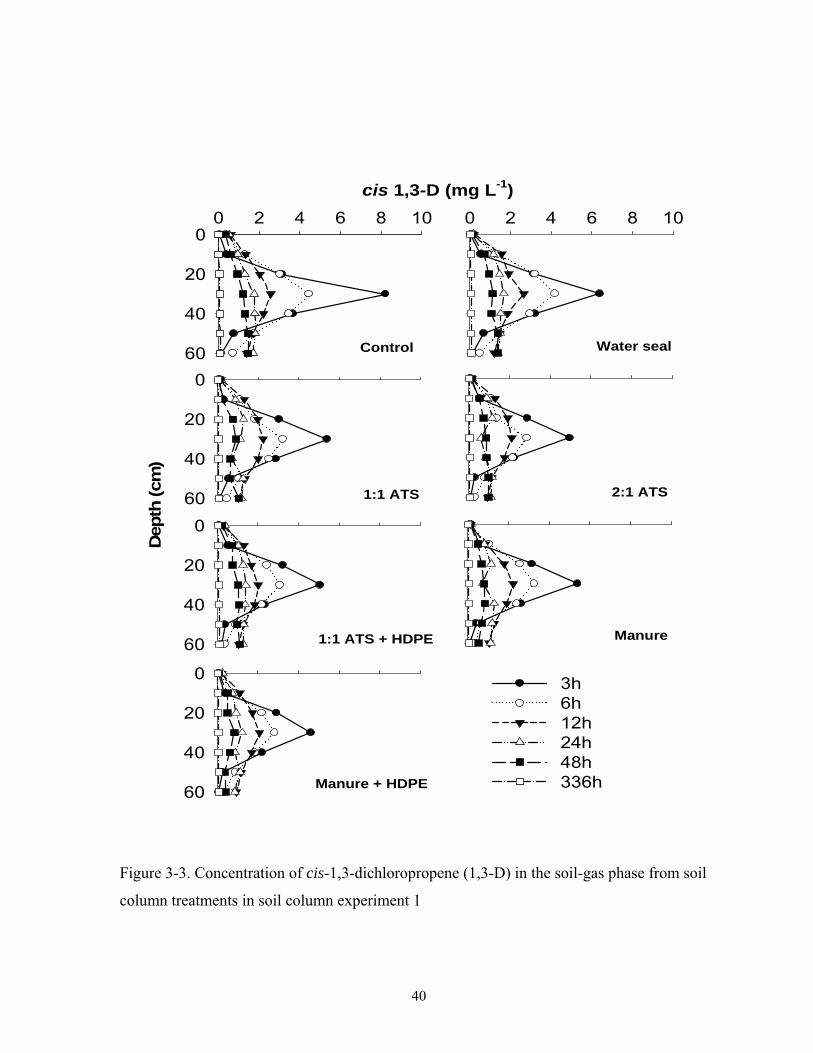
40
cis 1,3-D (mg L-1)
0 2 4 6 8 100
20
40
60
3h6h12h 24h 48h 336h
Control
Dep
th (cm
)
0
20
40
60 1:1 ATS
0 2 4 6 8 10
Water seal
2:1 ATS
0
20
40
60 1:1 ATS + HDPE Manure
0
20
40
60Manure + HDPE
Figure 3-3. Concentration of cis-1,3-dichloropropene (1,3-D) in the soil-gas phase from soil
column treatments in soil column experiment 1
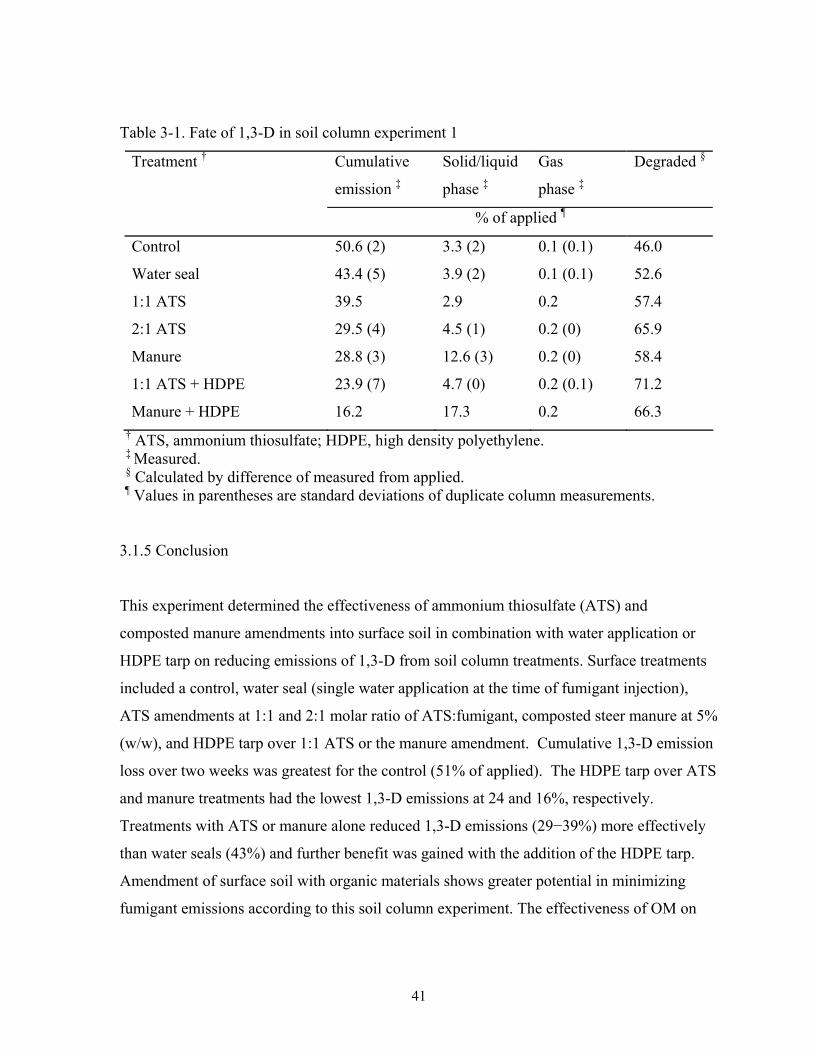
41
Table 3-1. Fate of 1,3-D in soil column experiment 1
Cumulative
emission ‡
Solid/liquid
phase ‡
Gas
phase ‡
Degraded §Treatment †
% of applied ¶
Control 50.6 (2) 3.3 (2) 0.1 (0.1) 46.0
Water seal 43.4 (5) 3.9 (2) 0.1 (0.1) 52.6
1:1 ATS 39.5 2.9 0.2 57.4
2:1 ATS 29.5 (4) 4.5 (1) 0.2 (0) 65.9
Manure 28.8 (3) 12.6 (3) 0.2 (0) 58.4
1:1 ATS + HDPE 23.9 (7) 4.7 (0) 0.2 (0.1) 71.2
Manure + HDPE 16.2 17.3 0.2 66.3 † ATS, ammonium thiosulfate; HDPE, high density polyethylene. ‡ Measured. § Calculated by difference of measured from applied. ¶ Values in parentheses are standard deviations of duplicate column measurements.
3.1.5 Conclusion
This experiment determined the effectiveness of ammonium thiosulfate (ATS) and
composted manure amendments into surface soil in combination with water application or
HDPE tarp on reducing emissions of 1,3-D from soil column treatments. Surface treatments
included a control, water seal (single water application at the time of fumigant injection),
ATS amendments at 1:1 and 2:1 molar ratio of ATS:fumigant, composted steer manure at 5%
(w/w), and HDPE tarp over 1:1 ATS or the manure amendment. Cumulative 1,3-D emission
loss over two weeks was greatest for the control (51% of applied). The HDPE tarp over ATS
and manure treatments had the lowest 1,3-D emissions at 24 and 16%, respectively.
Treatments with ATS or manure alone reduced 1,3-D emissions (29−39%) more effectively
than water seals (43%) and further benefit was gained with the addition of the HDPE tarp.
Amendment of surface soil with organic materials shows greater potential in minimizing
fumigant emissions according to this soil column experiment. The effectiveness of OM on
42
emission reduction agreed with other researchers. It should be noted that much lower
fumigant application rates are often used for soil column tests compared to field conditions.
3.2 Soil Column Experiment 2
3.2.1 Soil Water Content
Water applications alter surface soil moisture conditions, which has a direct impact on
fumigant emissions. The soil water content in soil columns determined at the end of the
experiment is shown in Figure 3-4. Water distribution was relatively uniform throughout the
columns for the control with minor evaporation loss at the surface with the averages of 1.8%
(v/v, 32% FC) for the loamy sand, 7.3% (v/v, 31% FC) for the sandy loam, and 7.2% (v/v,
22% FC) for the loam. Water application treatments increased soil water content mostly in
the surface layers (0-30 cm). The high intermittent water seal treatment (9 mm + 3 mm at 12
h + 3 mm at 24 h) resulted in the highest soil water content in each soil type. The sandy loam
soil had more downward movement of water applied, which might be associated with its
lower bulk density than the loamy sand soil.
The surface (0-10 cm) soil retained the highest water content from the water applications. For
loamy sand soil, it was 12.7% (v/v, 145% FC) with the high intermittent water treatment and
was reduced to 6.4% (v/v, 74% FC) in the lower-amount intermittent water treatment. For the
sandy loam and loam soils, the water content in the surface soil was 55% and 58% of their
FC values, respectively, for the intermittent water seal treatment. The bulk density of the
loamy sand was higher than that for the other two soils (1.6 vs. 1.4 g cm-3). As a result, the
air volume in the loamy sand surface soil was 27% compared to 34% for the sandy loam and
29% for the loam soil for the intermittent water treatment.
3.2.2 Emission Flux
The emission flux of 1,3-D from the column treatments is shown in Figure 3-5. Peak
emission flux decreases as the soil texture becomes finer. For the control treatment, the peak
43
1,3-D emission from the loamy sand was 20 μg m-2 s-1 occurring 11 h after injection, 16 μg
m-2 s-1 at 15 h from the sandy loam, and 11 μg m-2 s-1 at about 15 h from the loam. The
difference in emission flux for the three soils are likely due to differences in soil texture
reflected in different clay content, organic matter and capacity to retain soil water (Figure 3-
4, Table 3-2). All these are important factors affecting fumigant degradation and transport.
Increasing soil water content retards soil gas diffusion and can result in reduced emissions
from the soil surface. Although the loamy sand had a higher bulk density compared to the
other two soils, the dominance of larger primary open pore space between soil particles and
lower soil water content led to higher emissions in the control. The loam soil had higher clay
and organic matter content than the coarser soils and was able to effectively adsorb or retain
1,3-D, thus suppressing the diffusion process leading to lower emission rates.
The peak flux was reduced about 35% from the control by the initial water seal treatment for
both the sandy loam and loam soils (Figure 3-5) as compared to the control, in addition to the
delayed peak flux occurrence time. Additional 3 mm water applications at 12 and 24 h
further suppressed peak 1,3-D emissions by about 55% from the control for the sandy loam
and loam, and about 75% for the loamy sand soils. After the final water application at 24 h,
1,3-D emission rates were stabilized and then gradually decreased with time for all three
soils. The reduced-amount intermittent water seal (3 mm at 0 h, and 1 mm at 12h and 24 h) in
the loamy sand had little influence on emission reduction compared to the control (Fig. 3-5).
Water applied to the loamy sand was expected to infiltrate quickly due to large particle size
(sands) with larger pores compared to the finer-textures soils with smaller particles (clays,
silts). Thus, it is commonly thought that forming an effective barrier to fumigants with water
seals might be difficult in sandy soils. This appeared to be the case for the low amount of
intermittent water treatment (3 +1 + 1 mm water). For the high amount of intermittent water
treatment (9 + 3 + 3 mm water), however, water applied to the loamy sand soil did not
demonstrate significant downward movement in soil columns and most of the water retained
in the 0-20 cm soil layer could have effectively formed a saturation layer (Fig. 3-4). As a
result, significantly lower emission rates were observed in the high-amount intermittent water
seal treatment. All surface treatments had similar emission rates beyond 108 h in this study

44
and decreased to 0.0-0.3 µg m-2 s-1 by the end of the experiment, i.e., two weeks after
fumigant injection (data not shown).
B: Sandy loam
Soi
l dep
th (
cm)
0
10
20
30
40
50
60
ControlInitial Water (9 mm)Intermittent Water(9 + 3 + 3 mm)
C: Loam
0
10
20
30
40
50
60
ControlInitial Water (9 mm)Intermittent Water(9 + 3 + 3 mm)
A: Loamy sand
Soil water content (%, v/v)
0 5 10 15 200
10
20
30
40
50
60
ControlLow Intermittent Water (3 + 1+ 1 mm)Intermittent Water(9 + 3 + 3 mm)
Figure 3-4. Distribution of soil water content (%, v/v) with depth in soil column experiment
2: A) Loamy sand, B) Sandy loam, C) Loam. Error bars are the standard deviation of
duplicate samples.

45
Time (h)
0 12 24 36 48 60 72 84 96 1080
4
8
12
16
20
24ControlInitial water (9 mm)Intermittent Water
(9 + 3 + 3 mm)
0
4
8
12
16
20
24Control Low intermittent Water(3 + 1 + 1 mm)Intermittent Water(9 + 3 + 3 mm)
A: Loamy sand
Em
issi
on f
lux
1,3-
D ( g
m-2
s-1
)
0
4
8
12
16
20
24ControlInitial Water (9 mm)Intermittent Water (9 + 3 + 3 mm)
B: Sandy loam
C: Loam
Figure 3-5. Comparison of 1,3-dichloropropene (1,3-D) emissions from different soil surface
treatments: A) Loamy sand, B) Sandy loam, C) Loam in soil column experiment 2. Error bars
are the standard deviation of duplicate samples.
46
3.2.3 Cumulative Emissions
Cumulative emissions for all the treatments are given in Table 3-2. For each soil, the
intermittent water treatment (9+3+3 mm) had the lowest cumulative emissions, which was
reduced by 53%, 19%, and 50% for loamy sand, sandy loam, and loam, respectively,
compared to the control, over two weeks. The higher porosity in the sandy loam soil (34%)
compared to the other soils (27-29%) might contribute to the relatively smaller effect of
intermittent water treatments on 1,3-D emission reduction in the sandy loam. The results
suggest that a sufficient amount of water is the critical factor to reducing emissions in any
type of soils. With the same treatment, emission losses were usually higher in coarse-textured
soil compared to fine-textured soil. An exception was for the loamy sand with the higher
amount of water seals which had similar emission reductions (53% reductions over a 2-wk
measurement) as the loam soil due to the high surface soil water content and low porosity as
discussed above. These results indicate that with sufficient amounts of water, intermittent
water seals can also reduce emissions significantly in coarser-textured soil. Similar to soil
experiment 1, emission reductions for the first two days following water applications were
greater than the whole 2-wk monitoring period (data not shown). Water seals can be
important in protecting workers and bystanders from acute exposure following fumigant
injection.
3.2.4 1,3-D in Soil-Gas Phase and Soil Residual 1,3-D
The distribution of 1,3-D in the soil-gas phase over time is shown in Figure 3-6. The greatest
concentration of 1,3-D was at the first sampling time (3 h) near the injection depth (30 cm).
The fumigant dispersed quickly in the columns and a relatively uniform 1,3-D concentration
(≤ 2 µg cm-3) was established within 24 h. The difference in fumigant concentration in the
soil-gas phase was greater between the soils than between the water treatments within a soil.
The loam soil had about 10-20% lower fumigant concentrations compared to the other two
soils. The relatively higher clay and organic matter content in the loam soil would have
contributed to faster fumigant degradation or adsorption. Upon completion of the experiment
(2 wk), the soil gas-phase concentrations were less than 0.2 µg cm-3 for all columns.

47
Table 3-2. Fate of 1,3-D two weeks after injection into soil columns in Soil Column
Experiment 2.
Cumulative emission †
Solid/liquid phase †
Gas Phase †
Degraded‡Soil type Treatment
% of applied § Control 56.4 (0) 1.6 (0) 0.12 (0) 41.9 Low intermittent water seals (3 mm + 1 mm at 12 and 24 h)
51.5 1.8 0.1 46.6
Atwater loamy sand
Intermittent water seals (9 mm + 3 mm at 12 and 24 h)
26.3 (5.9) 2.3 (0.1) 0.39 (0) 71.0
Control 50.6 (1.6) 3.3 (1.6) 0.08 (0.11) 46.0 Water seal (9 mm) 46.1 (1.1) 2.6 (0.5) 0.02 (0.03) 51.2
Hanford sandy loam
Intermittent water seals (9 mm + 3 mm at 12 and 24 h)
41.1 (3.8) 3.4 (1.4) 0.16 (0.14) 55.3
Control 42.7 (0) 4.8 (0) 0.25 (0) 52.3 Water seal (9 mm) 31.0 (0.2) 4.3 (0.4) 0.25 (0.03) 64.5
Madera loam
Intermittent water seals (9 mm + 3 mm at 12 and 24 h)
21.3 (3.6) 3.7 (0.1) 0.26 (0) 74.8
† Measured. ‡ Calculated by difference of measured values and applied amounts. § Values in parentheses are the standard deviation of duplicate column measurements.
In the soil column test, water seal treatments did not reduce fumigant concentrations in the
soil-gas phase in these three soils. Similar results were observed in other cases (e.g., Gao and
Trout, 2007; Thomas et al., 2003; 2004) when emissions were reduced from increasing soil
water content, fumigant concentration in the soil air was not affected. As water applications
increased soil water content, mostly in the surface layer, this helped retain fumigant in the
soil profile and reduce fumigant diffusion and emission. Caution must be taken because the
application of too much water would result in poor fumigant dispersion and reduce fumigant

48
efficacy (McKenry and Thomason, 1974). Thus, the amount of water used in surface seals
must be appropriate so that it does not sacrifice efficacy.
Residual 1,3-D in the soil (solid and liquid phases) was measured at the end of the
experiment (Table 3-2). Although residual 1,3-D was low in all soils, concentrations tended
to be highest in the fine-textured soil, likely because of the strong binding to clay and organic
matter particles (Gan et al., 1994; Kim et al., 2003; Xu et al., 2003).
1,3-D (g cm-3)
0 2 4 6 8 10
Dep
th (
cm)
3 h6 h12 h24 h48 h336 h
Control-L
Initial Water (9 mm)-L
Intermittent Water (9 + 3 + 3 mm)-L
0 2 4 6 8 100
20
40
60
0
20
40
60
Control-LS
Intermittent Water (9 + 3 + 3 mm)-LS
0
20
40
60Low intermittent Water (3 + 1 + 1 mm)-LS
0 2 4 6 8 10
Control-SL
Initial Water (9 mm)-SL
Intermittent Water (9 + 3 + 3 mm)-SL
Figure 3-6. Distribution of 1,3-dichloropropene (1,3-D) in soil-gas phase under different
surface treatments in soil column experiment 2. LS = Loamy Sand, SL = Sandy Loam, L =
Loam.
49
3.2.5 Fate of 1,3-D
The amount of 1,3-D degraded in soil columns was calculated based on the differences
between what captured (cumulative emissions, fumigant in soil gas after 14 days, and
residual fumigant in solid/liquid phase) and the total amount (122 mg per column) of 1,3-D
initially applied (Table 3-2). Because residual amounts were small, degradation was
inversely related to the cumulative emissions from each treatment. Over two weeks, 1,3-D
degraded ranging from 42-75% of the 1,3-D applied in the three soils. Higher volume water
applications led to a longer retention time in the soil and resulted in greater fumigant
degradation. A similar phenomenon was observed in previous column studies (Gao and
Trout, 2006; soil column experiment 1). Increasing soil water content alone did not appear to
affect the degradation rate of 1,3-D in a batch incubation experiment (Dungan et al., 2001).
The higher degradation rate in the column experiments were likely due to the high surface
soil water content that retained fumigants in soil profile for a longer reaction time. Fumigant
degradation was generally greater in fine-textured soils compared to coarse-textured soils
except the higher water seal in the sandy loam soil which also had relatively high degradation
rates. The fate of 1,3-D in soils appears to be affected by a combination of factors including
soil texture and bulk density, soil water content, and organic matter content.
3.2.6 Conclusion
This column experiment compared the effectiveness of water seals on emission reduction of
cis-1,3-D from three different textured soils (loamy sand, sandy loam, and loam). The
difference in soil texture and water seal applications to the soil surface greatly affected 1,3-D
emissions. The highest cumulative emissions as well as earlier and higher 1,3-D peak
emission fluxes were from coarse-textured loamy sand when no water was applied. Low
emissions from the non-treated fine-textured soils were due to higher clay and organic matter
content. When a water seal was applied, emission reduction was observed from all types of
soil depending on how much water was applied. The data showed that a high-amount
intermittent water treatment could result in a significantly lower emission rate for a sandy
soil. Fine-textured soil (e.g., loam) generally had slower diffusion and more residual 1,3-D

50
compared to coarse-textured soil (e.g., loamy sand) at similar soil water conditions. Applying
a sufficient amount of water to the soil surface can effectively reduce emissions for a
relatively wide range of soil textures. While reducing emissions, regulating the amount of
water applied to surface soils is also essential for ensuring adequate fumigant efficacy. The
amount of water used in the column studies may not necessarily represent the effective
amount of water needed in field conditions to reduce emissions. The column test results
indicate that water seal practices can reduce fumigant emissions across different soil types.
3.3 Soil Column Experiment 3
3.3.1 Emission Flux
The emission flux of 1,3-D and CP from different soil moisture conditions is shown in Figure
3-7. The flux increased initially following fumigant injection and then decreased across all
the treatments. The peak emission flux was 80.8 μg m-2 s-1 for cis-1,3-D, 73.5 μg m-2 s-1 for
trans-1,3-D, and 69.1 μg m-2 s-1 for CP and occurred within 5 h following fumigant injection
in the driest soil (W30). The increase of soil water content resulted in decreased peak
emission fluxes and delayed their occurrence time. For example, the peak emission flux in
W100 (FC) was reduced by 78-84% and delayed by 11-20 h compared to W30. In general,
the emission flux of cis-1,3-D was higher than that of trans-1,3-D and CP. The peak flux of
each compound and soil water content can be described in a linear equation with a negative
slope: Y = -0.49X + 94.5 for cis-1,3-D (R2 = 0.94); Y = -0.46X + 80.6 for trans-1,3-D (R2 =
0.84); and Y = -0.43X + 76.4 for CP (R2 = 0.86), where Y is the peak flux in µg m-2 s-1 and X
is soil water content (g kg-1). Thomas et al. (2004) also reported that higher water content
delayed volatilization of 1,3-D isomers and CP from a sandy soil in a microplot experiment.
Two field tests by Gao et al. (2008b, c) showed that pre-irrigation, which produced a moist
soil profile with relatively higher water content near the surface than subsurface before shank
fumigation, reduced the peak emission rate of 1,3-D and CP compared to the non-irrigated
treatments. Gan et al. (1996) reported a column study in which increasing soil water content
decreased and delayed the peak flux of MeBr due to increased retardation and tortuosity
factors in fumigant gas-phase transport. Our findings show that increasing soil water content
51
to FC has a significant impact on peak emissions, and thus can be used to reduce the potential
exposure risks to workers and by-standers. Therefore, soil water content should be
considered when determining adequate buffer zones and worker safety regulations.
After the emission peak, fumigant emissions decreased the most rapidly in W30 and the rate
of decrease was slowed as soil water content increased (Figure 3-7). The fumigants
dissipated faster in drier soil conditions than soils with higher soil water content. At the end
of the experiment, emission rates were < 0.01 μg m-2 s-1 for all three compounds in W30,
compared to 0.40, 0.63, 0.01 μg m-2 s-1 for cis-1,3-D, trans-1,3-D, and CP, respectively in
W100.
3.3.2 Cumulative Emission Loss
The cumulative emission for 1,3-D isomers and CP increased rapidly and reached a plateau
in the driest soil in about 2 days (Figure 3-8). As soil water content increased, the cumulative
emission increased more slowly but steadily for a longer time. As a result, much larger
differences in cumulative emission loss between water treatments were observed at earlier
times.
The high soil water content (near FC) reduces 1,3-D and CP emissions due to the slower
diffusion rate of fumigant through the moist soil and increased degradation. Jury et al. (1983)
reported that fumigant diffusion through the soil liquid phase is generally 10-100 times
slower than through the gas phase. Some suggest that high water content accelerates the
degradation (or increased hydrolysis) of MeBr (Shinde et al., 2000) and 1,3-D (Guo et al.,
2004a). Guo et al. (2004a) explained that the increased hydrolysis was because of higher
partitioning of 1,3-D in the water phase. However, another study reported that 1,3-D
degradation was not affected by soil moisture (Dungan et al., 2001)
The cumulative emission data from the column study can only show the comparative or
relative fumigant emission information from soil water treatments. The total emission losses
from this column study (Table 3-4) were much higher than usually reported in field studies.
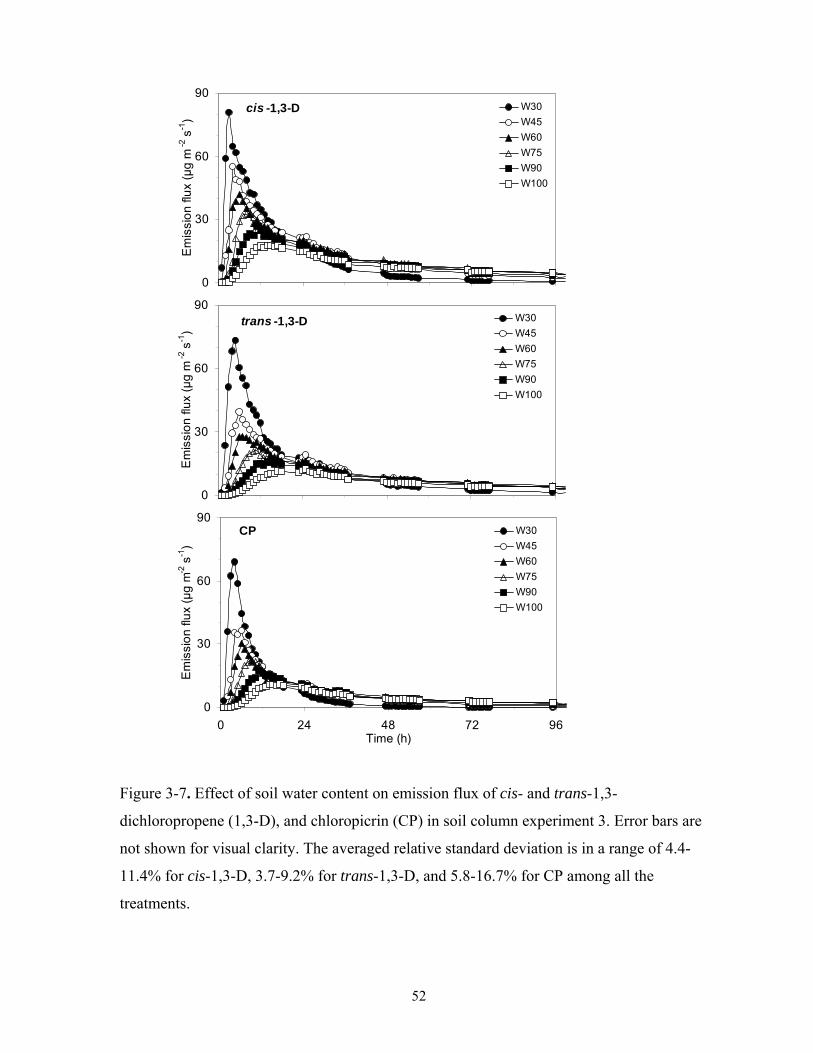
52
Figure 3-7. Effect of soil water content on emission flux of cis- and trans-1,3-
dichloropropene (1,3-D), and chloropicrin (CP) in soil column experiment 3. Error bars are
not shown for visual clarity. The averaged relative standard deviation is in a range of 4.4-
11.4% for cis-1,3-D, 3.7-9.2% for trans-1,3-D, and 5.8-16.7% for CP among all the
treatments.
cis -1,3-D
0
30
60
90
0 24 48 72 96Time (h)
Em
issi
on
flu
x (μ
g m
-2 s
-1)
W30
W45
W60
W75
W90
W100
trans -1,3-D
0
30
60
90
0 24 48 72 96Time (h)
Em
issi
on
flu
x (μ
g m
-2 s
-1)
W30
W45
W60
W75
W90
W100
CP
0
30
60
90
0 24 48 72 96Time (h)
Em
issi
on
flu
x (μ
g m
-2 s
-1)
W30
W45
W60
W75
W90
W100
53
This was due to the relatively shallow closed-bottom columns as compared to field
applications which have no restrictive lower boundary. The fumigants injected into the
columns can only escape upward (emission); whereas in a field, gases can move in three
dimensions in the soil profile. As a consequence, the closed-bottom columns likely led to
higher total emission losses compared to field conditions. It is expected that the combination
of environmental and biological factors in the field could accelerate fumigant degradation
and would result in larger differences in fumigant emissions between soils with different
moisture conditions than what was observed from these soil columns.
3.3.3 Fumigants in Soil-Gas Phase
Similar distribution patterns over time were observed for cis-1,3-D, trans-1,3-D, and CP in
soil-gas phase; therefore, only cis-1,3-D data are shown in Figure 3-9. The highest cis-1,3-D
concentration was measured at the first sampling time (3 h) near the injection depth (10 cm)
in all the treatments, and the fumigant concentration in soil gas at the depths of 0 and 20 cm
were very low at that time. The lowest peak fumigant concentration was in the driest soil due
to the rapid emission loss (Fig. 3-7). The fumigant concentrations were relatively uniform
throughout the whole soil column by 6 h in W30, W45 and W60, 12 h in W75 and W90, and
24 h in W100 again indicating that high water content reduced the diffusion rate. After
uniform distribution was reached, the fumigant concentration in soil gas-phase decreased
over time in all treatments.
The disadvantage of increasing soil water content is that excess amounts of water may result
in significantly reduced diffusion rates of fumigant and uniform distribution especially when
fumigant injection points are widely spaced and/or deep soil treatment is required. The soil
column study showed the measured fumigant concentrations in the moist soils up to FC level
were consistently higher than those in the dry soil due to more retention and the slower
emission rate in moist soils. Thomas et al. (2004) also reported higher 1,3-D and CP
concentrations in soil gas-phase at FC as compared to dry soil during the fumigation period
(except the initial few hours following fumigant injection) in a microplot.

54
Figure 3-8. Cumulative emissions of cis- and trans-1,3-dichloropropene (1,3-D), and
chloropicrin (CP) affected by soil water content (soil column experiment 3). Error bars are
not shown for visual clarity. The averaged relative standard deviation is in a range of 0.8-
8.1% for cis-1,3-D, 0.3-7.9% for trans-1,3-D, and 1.8-13.7% for CP among all the
treatments.
cis -1,3-D
0
30
60
90
0 48 96 144 192 240 288 336
Time (h)
% o
f ap
plie
d
W30
W45
W60
W75
W90
W100
trans -1,3-D
0
30
60
90
0 48 96 144 192 240 288 336
Time (h)
% o
f ap
plie
d
W30
W45
W60
W75
W90
W100
CP
0
15
30
45
0 48 96 144 192 240 288 336
Time (h)
% o
f ap
plie
d
W30
W45
W60
W75
W90
W100

55
Figure 3-9. Distribution of cis-1,3-dichloropropene (1,3-D) in soil-gas phase at different
water treatments (soil column experiment 3). Error bars are not shown for visual clarity. The
averaged relative standard deviation is in a range of 7.9-28.4% for cis-1,3-D, 14.7-34.9% for
trans-1,3-D, and 15.4-36.2% for CP among all the treatments.
W100-5
0
5
10
15
20
25
0 5 10 15 20 25 30
cis-1,3-D (mg L-1)
So
il d
epth
(c
m)
W60-5
0
5
10
15
20
25
0 5 10 15 20 25 30
cis-1,3-D (mg L-1)
So
il d
ep
th (
cm)
W90-5
0
5
10
15
20
25
0 5 10 15 20 25 30
cis-1,3-D (mg L-1)
So
il d
ep
th (
cm
)
W45-5
0
5
10
15
20
25
0 5 10 15 20 25 30
cis-1,3-D (mg L-1)
So
il d
ep
th (
cm
)
W75-5
0
5
10
15
20
25
0 5 10 15 20 25 30
cis -1,3-D concentration (mg L-1)
So
il d
ep
th (
cm
)
W30-5
0
5
10
15
20
25
0 5 10 15 20 25 30
cis -1,3-D concentration (mg L-1)
So
il d
ep
th (
cm
)
3-h
6-h
12-h
24-h
72-h
120-h
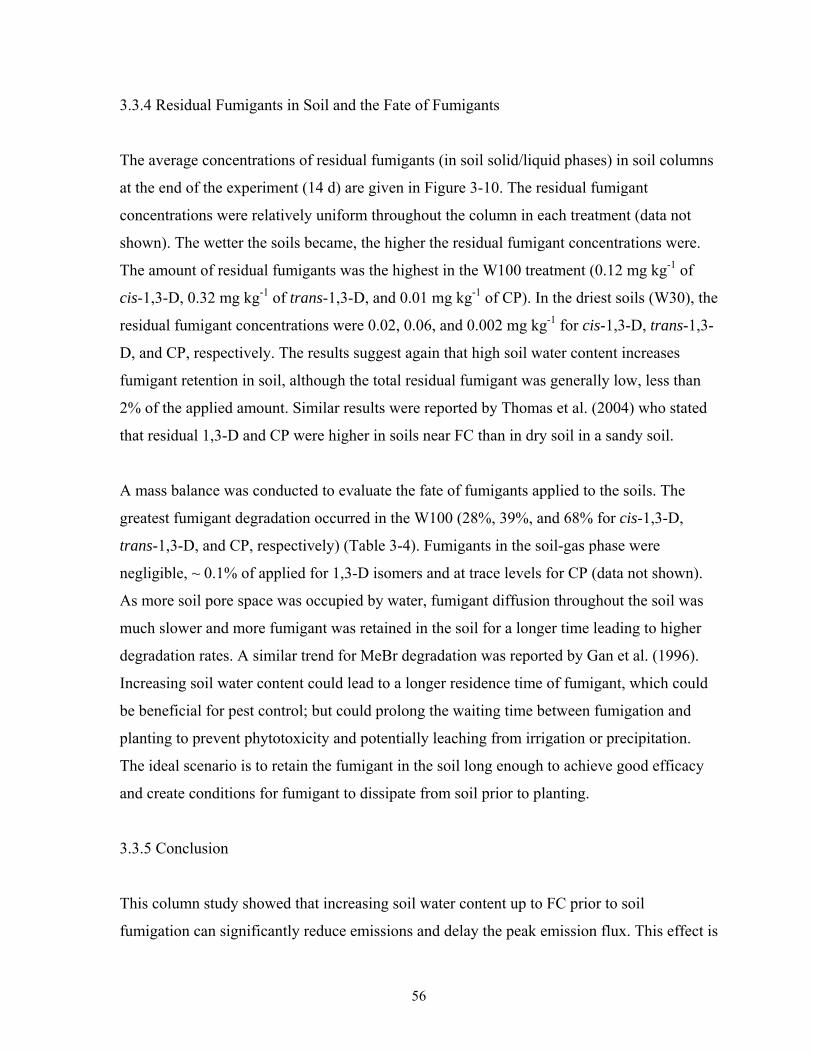
56
3.3.4 Residual Fumigants in Soil and the Fate of Fumigants
The average concentrations of residual fumigants (in soil solid/liquid phases) in soil columns
at the end of the experiment (14 d) are given in Figure 3-10. The residual fumigant
concentrations were relatively uniform throughout the column in each treatment (data not
shown). The wetter the soils became, the higher the residual fumigant concentrations were.
The amount of residual fumigants was the highest in the W100 treatment (0.12 mg kg-1 of
cis-1,3-D, 0.32 mg kg-1 of trans-1,3-D, and 0.01 mg kg-1 of CP). In the driest soils (W30), the
residual fumigant concentrations were 0.02, 0.06, and 0.002 mg kg-1 for cis-1,3-D, trans-1,3-
D, and CP, respectively. The results suggest again that high soil water content increases
fumigant retention in soil, although the total residual fumigant was generally low, less than
2% of the applied amount. Similar results were reported by Thomas et al. (2004) who stated
that residual 1,3-D and CP were higher in soils near FC than in dry soil in a sandy soil.
A mass balance was conducted to evaluate the fate of fumigants applied to the soils. The
greatest fumigant degradation occurred in the W100 (28%, 39%, and 68% for cis-1,3-D,
trans-1,3-D, and CP, respectively) (Table 3-4). Fumigants in the soil-gas phase were
negligible, ~ 0.1% of applied for 1,3-D isomers and at trace levels for CP (data not shown).
As more soil pore space was occupied by water, fumigant diffusion throughout the soil was
much slower and more fumigant was retained in the soil for a longer time leading to higher
degradation rates. A similar trend for MeBr degradation was reported by Gan et al. (1996).
Increasing soil water content could lead to a longer residence time of fumigant, which could
be beneficial for pest control; but could prolong the waiting time between fumigation and
planting to prevent phytotoxicity and potentially leaching from irrigation or precipitation.
The ideal scenario is to retain the fumigant in the soil long enough to achieve good efficacy
and create conditions for fumigant to dissipate from soil prior to planting.
3.3.5 Conclusion
This column study showed that increasing soil water content up to FC prior to soil
fumigation can significantly reduce emissions and delay the peak emission flux. This effect is
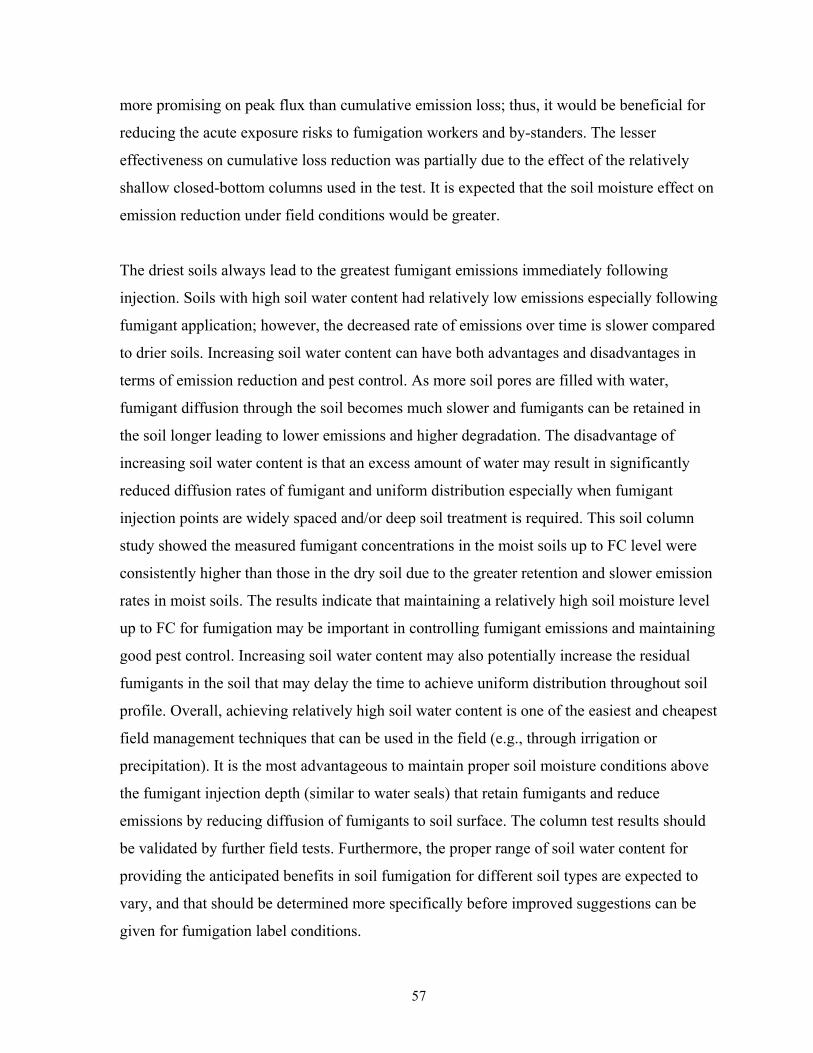
57
more promising on peak flux than cumulative emission loss; thus, it would be beneficial for
reducing the acute exposure risks to fumigation workers and by-standers. The lesser
effectiveness on cumulative loss reduction was partially due to the effect of the relatively
shallow closed-bottom columns used in the test. It is expected that the soil moisture effect on
emission reduction under field conditions would be greater.
The driest soils always lead to the greatest fumigant emissions immediately following
injection. Soils with high soil water content had relatively low emissions especially following
fumigant application; however, the decreased rate of emissions over time is slower compared
to drier soils. Increasing soil water content can have both advantages and disadvantages in
terms of emission reduction and pest control. As more soil pores are filled with water,
fumigant diffusion through the soil becomes much slower and fumigants can be retained in
the soil longer leading to lower emissions and higher degradation. The disadvantage of
increasing soil water content is that an excess amount of water may result in significantly
reduced diffusion rates of fumigant and uniform distribution especially when fumigant
injection points are widely spaced and/or deep soil treatment is required. This soil column
study showed the measured fumigant concentrations in the moist soils up to FC level were
consistently higher than those in the dry soil due to the greater retention and slower emission
rates in moist soils. The results indicate that maintaining a relatively high soil moisture level
up to FC for fumigation may be important in controlling fumigant emissions and maintaining
good pest control. Increasing soil water content may also potentially increase the residual
fumigants in the soil that may delay the time to achieve uniform distribution throughout soil
profile. Overall, achieving relatively high soil water content is one of the easiest and cheapest
field management techniques that can be used in the field (e.g., through irrigation or
precipitation). It is the most advantageous to maintain proper soil moisture conditions above
the fumigant injection depth (similar to water seals) that retain fumigants and reduce
emissions by reducing diffusion of fumigants to soil surface. The column test results should
be validated by further field tests. Furthermore, the proper range of soil water content for
providing the anticipated benefits in soil fumigation for different soil types are expected to
vary, and that should be determined more specifically before improved suggestions can be
given for fumigation label conditions.
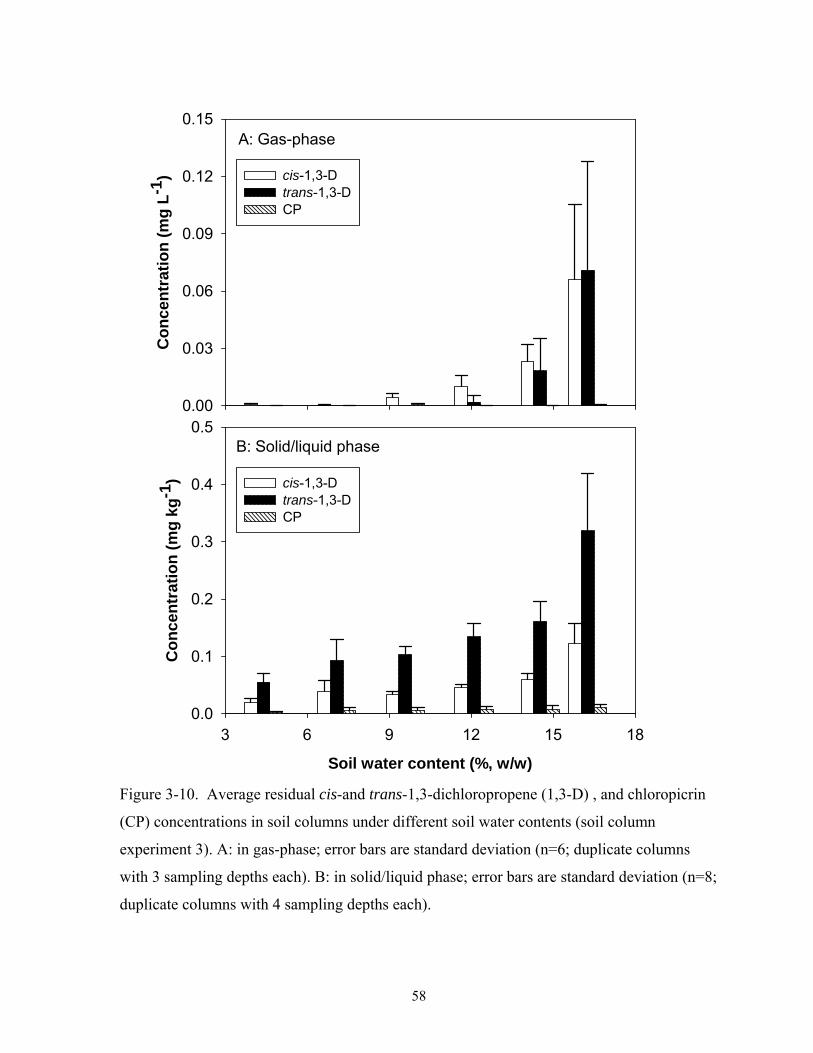
58
B: Solid/liquid phase
Soil water content (%, w/w)
3 6 9 12 15 18
Co
nce
ntr
atio
n (
mg
kg
-1)
0.0
0.1
0.2
0.3
0.4
0.5
cis-1,3-D trans-1,3-DCP
A: Gas-phase
Co
nce
ntr
atio
n (
mg
L-1
)
0.00
0.03
0.06
0.09
0.12
0.15
cis-1,3-D trans-1,3-DCP
Figure 3-10. Average residual cis-and trans-1,3-dichloropropene (1,3-D) , and chloropicrin
(CP) concentrations in soil columns under different soil water contents (soil column
experiment 3). A: in gas-phase; error bars are standard deviation (n=6; duplicate columns
with 3 sampling depths each). B: in solid/liquid phase; error bars are standard deviation (n=8;
duplicate columns with 4 sampling depths each).
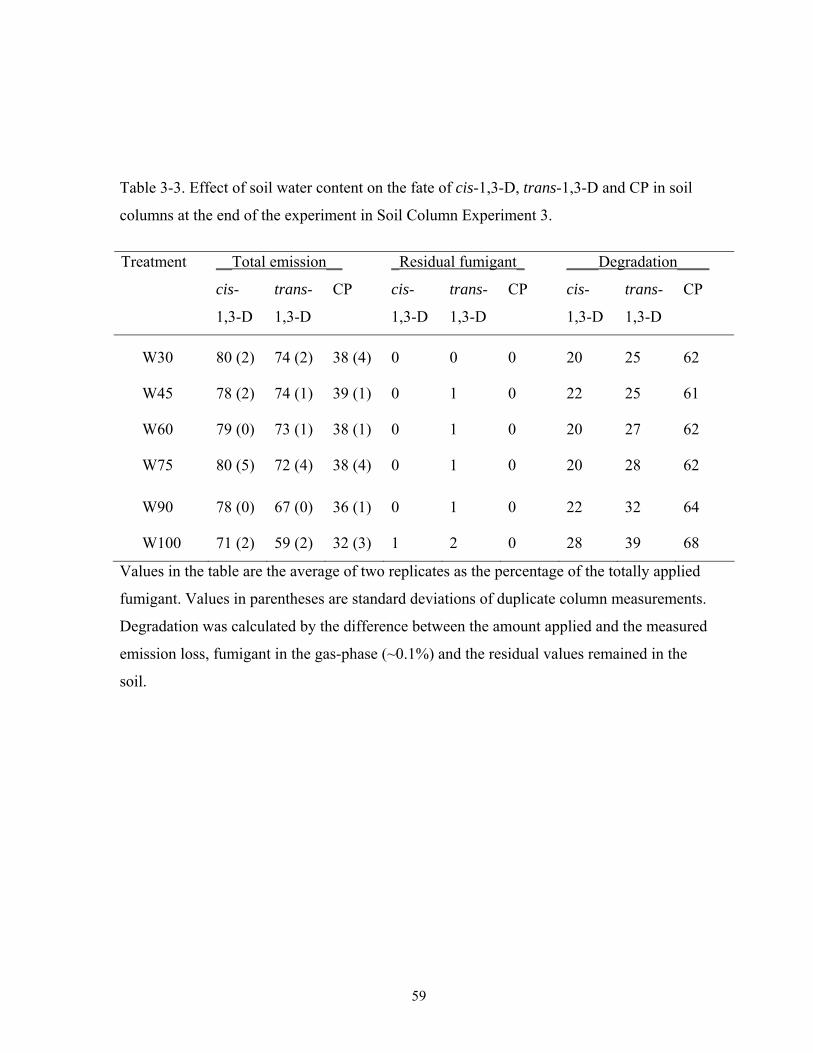
59
Table 3-3. Effect of soil water content on the fate of cis-1,3-D, trans-1,3-D and CP in soil
columns at the end of the experiment in Soil Column Experiment 3.
__Total emission__ _Residual fumigant_ ____Degradation____ Treatment
cis-
1,3-D
trans-
1,3-D
CP
cis-
1,3-D
trans-
1,3-D
CP
cis-
1,3-D
trans-
1,3-D
CP
W30 80 (2) 74 (2) 38 (4) 0 0 0 20 25 62
W45 78 (2) 74 (1) 39 (1) 0 1 0 22 25 61
W60 79 (0) 73 (1) 38 (1) 0 1 0 20 27 62
W75 80 (5) 72 (4) 38 (4) 0 1 0 20 28 62
W90 78 (0) 67 (0) 36 (1) 0 1 0 22 32 64
W100 71 (2) 59 (2) 32 (3) 1 2 0 28 39 68
Values in the table are the average of two replicates as the percentage of the totally applied
fumigant. Values in parentheses are standard deviations of duplicate column measurements.
Degradation was calculated by the difference between the amount applied and the measured
emission loss, fumigant in the gas-phase (~0.1%) and the residual values remained in the
soil.

60
3.4 Field Trial 1 (Year 2005)
3.4.1 Emission Flux
The emission rates of 1,3-D and CP are shown in Figure 3-11. The control (shank, dry soil)
resulted in the earliest peak emission flux (76 µg m-2 s-1 for 1,3-D and 53 µg m-2 s-1 for CP),
followed by the HDPE tarp over dry soil with shank injection for 1,3-D (up to 71 µg m-2 s-1).
The HDPE tarp resulted in a much lower CP emission peak (19 µg m-2 s-1) than 1,3-D
relative to the control. The emission peaks occurred at 15 h for the control and 48 h for the
HDPE tarp after fumigation. This emission delay with HDPE was not found in an earlier
study carried out during high summer temperatures (Gao and Trout, 2007). Higher
temperatures under the HDPE tarp in the summer may have caused earlier emissions. The
overall results indicate that the HDPE tarp is not effective in reducing 1,3-D emissions even
under relatively cool temperature conditions, although the peak flux may be delayed. Pre-
irrigation before shank-injection resulted in a much lower 1,3-D peak emission rate (26 µg m-
2 s-1) than the dry soil control or HDPE tarp over dry soil. This illustrates that irrigation prior
to fumigation to produce a moist soil profile can reduce fumigant emissions more effectively
than the HDPE tarp. The VIF tarp over the dry soil profile resulted in relatively low but
variable emission rates (1-26 µg m-2 s-1).
Fumigation through the subsurface drip-applications resulted in much lower peak emission
rates (8-14 µg m-2 s-1 for 1,3-D, and 2-4 µg m-2 s-1 for CP, respectively) than shank-
injections. Even considering that the actual application rate of the fumigant for subsurface
drip-injection was 16% lower than that for shank application, fumigant volatilization rates
still appeared much lower from drip application than from shank-injections.
The emission flux of CP showed a similar trend as 1,3-D except with lower values–
below 20 μg m-2 s-1 for all treatments except the Control. The amount of CP applied was
about 57% of 1,3-D on a weight basis while emission rates were generally less than 50% 1,3-
D emissions. The HDPE tarp over dry soil with shank injection resulted in much lower CP
emission rates than 1,3-D, indicating that HDPE is more effective in reducing CP emissions
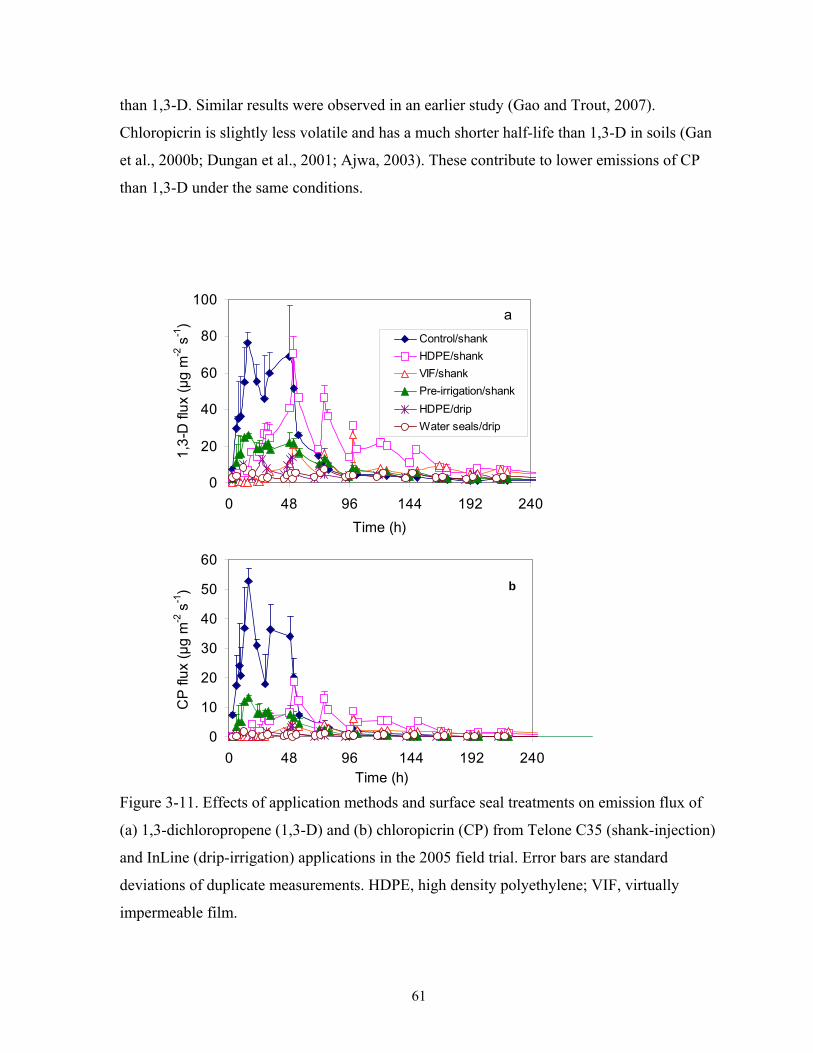
61
than 1,3-D. Similar results were observed in an earlier study (Gao and Trout, 2007).
Chloropicrin is slightly less volatile and has a much shorter half-life than 1,3-D in soils (Gan
et al., 2000b; Dungan et al., 2001; Ajwa, 2003). These contribute to lower emissions of CP
than 1,3-D under the same conditions.
Figure 3-11. Effects of application methods and surface seal treatments on emission flux of
(a) 1,3-dichloropropene (1,3-D) and (b) chloropicrin (CP) from Telone C35 (shank-injection)
and InLine (drip-irrigation) applications in the 2005 field trial. Error bars are standard
deviations of duplicate measurements. HDPE, high density polyethylene; VIF, virtually
impermeable film.
0
20
40
60
80
100
0 48 96 144 192 240
Time (h)
1,3
-D fl
ux
(µg
m-2
s-1
)
Control/shank
HDPE/shank
VIF/shank
Pre-irrigation/shank
HDPE/drip
Water seals/drip
a
0
10
20
30
40
50
60
0 48 96 144 192 240Time (h)
CP
flu
x (µ
g m
-2 s
-1) b
62
3.4.2 Cumulative Emission Loss
Cumulative emission losses of 1,3-D and CP, and the total losses as a percentage of applied
over a 2-wk monitoring period are shown in Figure 3-12 and Table 3-4, respectively. As with
emission rates, the control resulted in the earliest and highest 1,3-D emission losses in the
first week after which emission loss from HDPE tarped treatments exceeded the control.
Warmer soil temperatures under the tarp as compared to the bare soil may contribute to this
pattern. Total measured losses of 1,3-D were 36% of applied for the control with a large
cumulative standard deviation (7.1%) and 43% (with a standard deviation of 3%) for the
HDPE tarp. Total emission losses from the pre-irrigated and VIF tarp over shank-injection
applications (19%) were about half of those from the control and the HDPE tarp. Emission
losses for the VIF tarp over shank application were lower than the pre-irrigation treatment
initially but increased steadily until the end of the monitoring period. The VIF tarp appeared
to retain fumigants under the tarp but the warm temperatures under the tarp (see below)
might have caused emission increases at a later time. Subsurface drip applications under the
HDPE tarp and micro-sprinkler water applications before and after drip application resulted
in the lowest and similar emission losses (12–13% for 1,3-D and 2–3% for CP, respectively).
These similar results indicate that small amounts of surface water applications before and
after fumigation through subsurface drip irrigation can reduce emissions as effectively as the
HDPE tarp. If micro-sprinkler systems are available in orchards, using the systems to apply
water prior to or after drip-fumigation will provide equivalent emission reduction to plastic
tarps and will reduce total fumigation cost.
The total emission loss of CP follows a similar pattern as 1,3-D except that the HDPE tarp
reduced CP emissions more effectively than 1,3-D. Total emission loss of CP under HDPE
was about half that of the control. In addition, although the differences between 1,3-D and
CP emission losses for the control were not appreciable, total percent losses of CP in all other
surface treatments are generally lower than 1,3-D. This has been previously observed (e.g.,
Gao and Trout, 2007), i.e., surface treatments, either with tarps or water seals, reduce CP
emissions more effectively than 1,3-D. The lower CP emissions are again due to CP’s lower
volatility and faster degradation than 1,3-D in soils.

63
Figure 3-12. Cumulative emission of (a) 1,3-dichloropropene (1,3-D) and (b) chloropicrin
(CP) from surface seal treatments in the 2005 field trial. Plotted data are averages of
duplicate measurements with cumulative standard deviations listed in Table 3-4. HDPE, high
density polyethylene; VIF, virtually impermeable film.
Emission results from this orchard field trial confirmed the ineffectiveness of the HDPE tarp
on 1,3-D emission reduction. This supports the current Telone label that does not require a
tarp but does require soil moisture above the injection point. Irrigation with enough water to
produce a moist surface soil profile to a 25 cm depth prior to soil fumigation can effectively
reduce 1,3-D and CP peak emission flux and total emission losses by 50% for 1,3-D and 70%
for CP relative to the control. The field data validated some of the findings in soil column
experiments reported above.
Drip-applications resulted in high soil water content (see below) and greatly reduced
emissions by 70% for 1,3-D and 90% for CP, respectively, in comparison with the dry-soil
control. Pre- and post-fumigation surface water applications resulted in the same low
0
10
20
30
40
50
60
0 48 96 144 192 240 288
Time (h)
Cu
mu
lativ
e lo
ss o
f 1,3
-D (%
of a
pp
lied
).
Control/shankHPDE/shankVIF/shankPre-irrigation/shankHDPE/dripWater seals/drip
a
0
10
20
30
40
50
60
0 48 96 144 192 240 288
Time (h)
Cu
mul
ativ
e lo
ss o
f CP
(%
of a
pp
lied
)
b
64
emissions from subsurface drip-applied fumigants as HDPE. The HDPE tarp over moist soils
traps moisture under the tarp and prevents the surface from drying. High soil water content
created by pre-fumigation surface water application greatly reduces soil water suction and
thus capillary rise of water with fumigants from the subsurface drip tape to soil surface. Post-
fumigation replenishment of surface water application further delays any capillary rise to the
soil surface of water with fumigant. The current InLine label requires use of HDPE tarps for
drip application. The field data indicate that the tarp is not necessary if the fumigant is
applied 20 cm below the surface and light pre- and post-fumigation sprinkler irrigation is
used. Orchard growers with micro-irrigation systems can use their irrigation delivery systems
(pump, filters, and pipelines) to deliver water to micro-sprinklers to apply water to the soil
surface, or to subsurface drip tape that is installed to apply fumigants.
Fumigation in this orchard replant field trial was applied in strips covering about half of the
field areas. This automatically reduces total fumigant input by 50%. Fumigating target areas
where trees would be planted can be an effective strategy to reduce emissions. The total
emission losses of fumigants would be reduced in proportion to the decrease of fumigated
areas. For example, in this field trial, a further 50% emission reduction was expected in the
strip treatment compared to the fumigation of an entire field.
3.4.3 Fumigants in Soil-Gas Phase
The distribution of 1,3-D in the soil-gas phase is shown in Figure 3-13. Similar distribution
patterns were followed by CP with lower concentrations and faster dissipation (data not
shown). The application ratio of CP:1,3-D was 1:1.7. The initial ratio of CP:1,3-D in the soil
gas near the surface was 1:1.4 and this ratio decreased with time and depth.
At the shank-injection line or drip tapes (Location a), the highest concentration of gaseous
fumigants was found at 6 h for shank-injection and at 33 h for drip-application. At the
locations between shank-injection lines or drip tapes (Location b), the highest concentration
was found at 24 h for shank-injections and 33 h for drip applications. Fumigant
concentrations at Location a were generally higher than Location b but this difference
65
became very small at 48 h and thereafter. This reflects the time required for uniform
distribution of fumigants throughout the soil.
The HDPE tarp over shank injection had similar fumigant concentrations as the control. The
VIF tarp resulted in relatively higher fumigant concentrations in the soil-gas phase than the
other treatments especially between 48-120 h. A single 3.7 m wide plastic sheet was used to
cover the treatment area and some fumigant might have dissipated under the tarp edges.
Fumigant distribution in the soil gas for the pre-irrigation over shank-injection treatment was
not measured in this field trial. Measurements in a previous field trial indicated no
differences in fumigant concentrations in this soil between the control and pre-irrigated soil
plus the HDPE tarp (Gao and Trout, 2007) as well as between the control and pre-irrigated
soil profile (unpublished data) when 56 mm of water was sprinkler-applied 48 h prior to
fumigation in this soil.
Throughout the soil profile, fumigant concentrations in the soil air in drip-applications were
generally lower than shank-injection treatments, but decreased more slowly. Towards the end
of monitoring, considerably higher 1,3-D concentrations in the soil profile were measured in
drip-application treatments (ave. 1.3 – 1.5 mg L-1) in comparison to shank-application
treatments (ave. 0.2 – 0.7 mg L-1). This was supported by the data obtained from soil column
experiment 3 where high soil moisture levels were shown to retain fumigants longer by
reducing diffusion rates and increasing partitioning to the liquid phase. Thomas et al. (2003)
also showed that both 1,3-D diffusion and emissions in a sandy soil were very high in air-
dried soil but greatly reduced by high soil-water content. For fine-textured soils, the effect of
water content on fumigant diffusion was greatest when soils had water contents that resulted
in soil water tension below 50 kPa at a 30 cm depth (McKenry and Thomason, 1974). With
drip-application and surface water application, soil gas fumigant concentrations near the soil
surface were very low, which contributed to the low emissions. Drip-application is designed
to deliver the fumigant with irrigation water movement or infiltration. Poor distribution may
affect pest control and lower fumigant concentration in surface and may affect weed control,
which, however, is not a primary concern for orchard replanting.
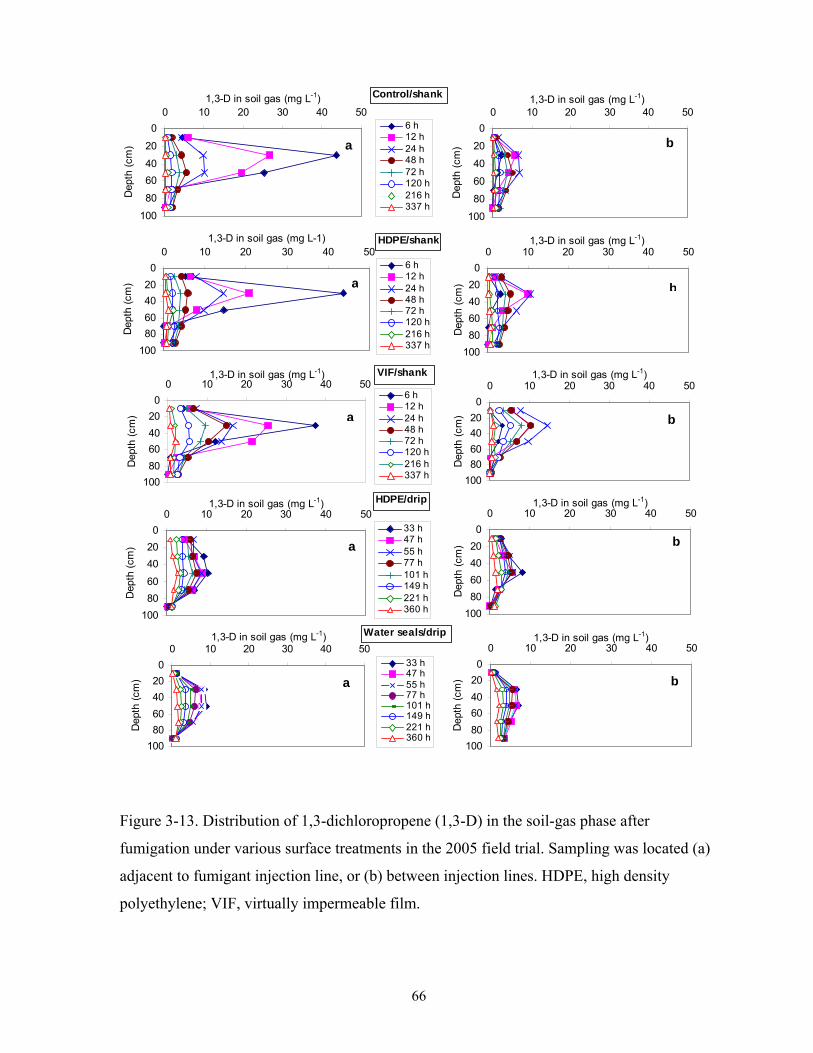
66
Figure 3-13. Distribution of 1,3-dichloropropene (1,3-D) in the soil-gas phase after
fumigation under various surface treatments in the 2005 field trial. Sampling was located (a)
adjacent to fumigant injection line, or (b) between injection lines. HDPE, high density
polyethylene; VIF, virtually impermeable film.
0
20
40
60
80
100
0 10 20 30 40 501,3-D in soil gas (mg L-1)
Dep
th (
cm)
6 h12 h24 h48 h72 h120 h216 h337 h
0
20
40
60
80
100
0 10 20 30 40 501,3-D in soil gas (mg L-1)
Dep
th (
cm)
HDPE/shank
a b
0
20
40
60
80
100
0 10 20 30 40 501,3-D in soil gas (mg L-1)
Dep
th (
cm)
6 h12 h24 h48 h72 h120 h216 h337 h
0
20
40
60
80
100
0 10 20 30 40 501,3-D in soil gas (mg L-1)
Dep
th (
cm)
VIF/shank
a b
0
20
40
60
80
100
0 10 20 30 40 501,3-D in soil gas (mg L-1)
Dep
th (
cm)
6 h12 h24 h48 h72 h120 h216 h337 h
0
20
40
60
80
100
0 10 20 30 40 501,3-D in soil gas (mg L-1)
Dep
th (
cm)a b
Control/shank
0
20
40
60
80
100
0 10 20 30 40 501,3-D in soil gas (mg L-1)
Dep
th (
cm)
33 h47 h55 h77 h101 h149 h221 h360 h
0
20
40
60
80
100
0 10 20 30 40 501,3-D in soil gas (mg L-1)
Dep
th (
cm)
HDPE/drip
ba
0
20
40
60
80
100
0 10 20 30 40 501,3-D in soil gas (mg L-1)
Dep
th (
cm)
33 h47 h55 h77 h101 h149 h221 h360 h
0
20
40
60
80
100
0 10 20 30 40 501,3-D in soil gas (mg L-1)
Dep
th (
cm)
Water seals/drip
a b
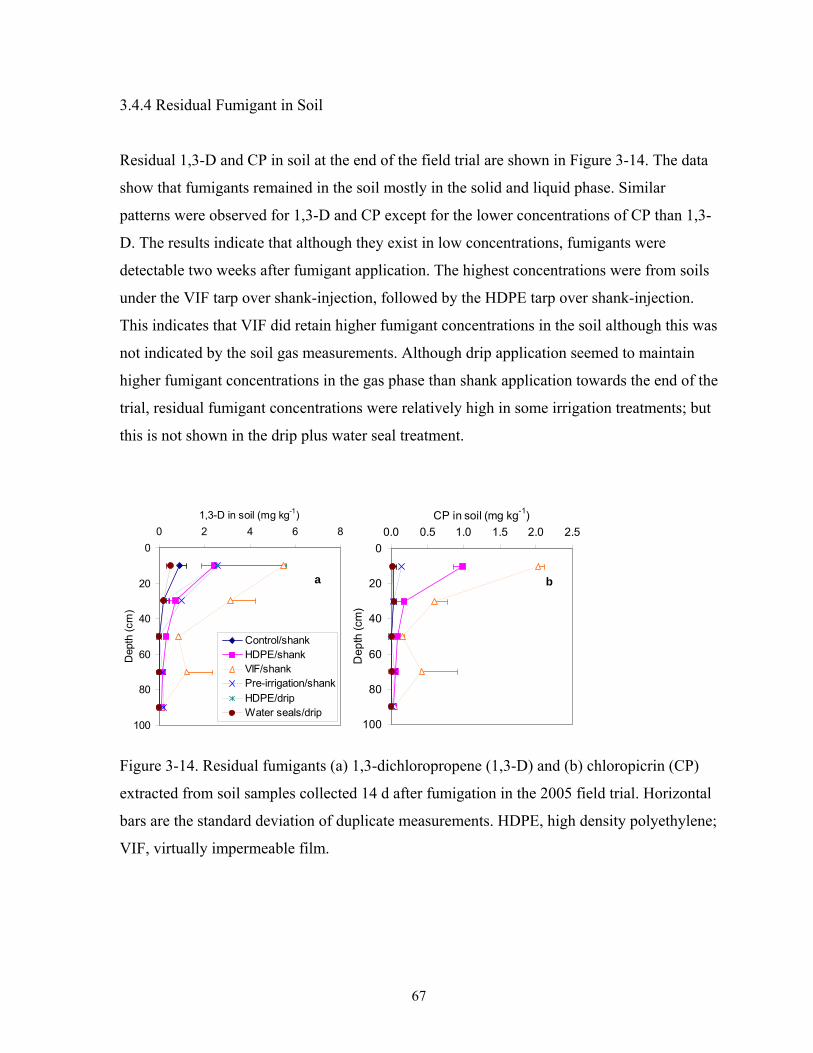
67
3.4.4 Residual Fumigant in Soil
Residual 1,3-D and CP in soil at the end of the field trial are shown in Figure 3-14. The data
show that fumigants remained in the soil mostly in the solid and liquid phase. Similar
patterns were observed for 1,3-D and CP except for the lower concentrations of CP than 1,3-
D. The results indicate that although they exist in low concentrations, fumigants were
detectable two weeks after fumigant application. The highest concentrations were from soils
under the VIF tarp over shank-injection, followed by the HDPE tarp over shank-injection.
This indicates that VIF did retain higher fumigant concentrations in the soil although this was
not indicated by the soil gas measurements. Although drip application seemed to maintain
higher fumigant concentrations in the gas phase than shank application towards the end of the
trial, residual fumigant concentrations were relatively high in some irrigation treatments; but
this is not shown in the drip plus water seal treatment.
Figure 3-14. Residual fumigants (a) 1,3-dichloropropene (1,3-D) and (b) chloropicrin (CP)
extracted from soil samples collected 14 d after fumigation in the 2005 field trial. Horizontal
bars are the standard deviation of duplicate measurements. HDPE, high density polyethylene;
VIF, virtually impermeable film.
0
20
40
60
80
100
0 2 4 6 8
1,3-D in soil (mg kg-1)
Dep
th (
cm)
Control/shankHDPE/shankVIF/shankPre-irrigation/shank
HDPE/dripWater seals/drip
a
0
20
40
60
80
100
0.0 0.5 1.0 1.5 2.0 2.5
CP in soil (mg kg-1)
Dep
th (c
m)
b

68
Table 3-4. Peak flux and total emission loss of 1,3-dichloropropene (1,3-D) and chloropicrin
(CP) measured over 2 weeks after fumigation in the 2005 field trial. Values in parenthesis are
standard deviations of duplicate measurements.
Maximum Emission flux (μg m2 s-1)
Total Emissions (% of applied) Treatment
1,3-D CP 1,3-D CP
Control/shank 76.3 (5.9) 52.7 (4.5) 36 (7)
30 (3)
HDPE/shank 70.6 (9.6) 18.8 (2.8) 43 (<1)
17 (0)
VIF/shank 26.0 (18.2) 6.2 (4.4) 19 (1)
8 (<1)
Pre-irrigation/shank 14.2 (1.0) 13.2 (0.8) 19 (1)
9 (0)
HDPE/drip 14.2 (1.0) 3.8 (0.2) 12 (2)
2 (<1)
Water seals/drip 8.3 (4.0) 1.7 (1.3) 13 (5) 3 (2)
HDPE, high density polyethylene; VIF, virtually impermeable film.
3.4.5 Soil Water Content, Temperature, and Nematode Response
Irrigation alters soil water content which directly affects fumigant emissions and distribution
in soil. The pre-irrigated soil treatment applied about 40 mm of water that was intended to
wet the surface 25 cm of soil to field capacity 4 days prior to fumigation. One hundred fifty
millimeters of water was added to the soil profile during drip-application in order to move
fumigants with the water to at least the 1 m depth. The amount and timing of water
application may greatly affect emissions. After two weeks of redistribution and surface
evaporation, the soil water content from all the treatments were significantly below the field
capacity of 0.26 cm3 cm-3 (Figure 3-15). With a total porosity of 0.45 cm3 cm-3, air volume in
the soil would be about 0.20 cm3 cm-3 at field capacity. Initial soil water content distribution
throughout the profile would be more concentrated near the soil surface, i.e., lower air
volume near the soil surface immediately after water applications. The air volume in the
surface soil should have played an important role in fumigant emissions.

69
0
20
40
60
80
100
0.0 0.1 0.2 0.3Soil water Content (cm3 cm-3)
De
pth
(cm
)
Control/shank)
HDPE/shank
VIF/shank
Pre-irrigation/shank
HDPE/drip
Water seals/drip
Figure 3-15. Soil water content measured two weeks after fumigation under various surface
treatments in the 2005 field trial. Horizontal bars are the standard deviation of duplicate
measurements. HDPE, high density polyethylene; VIF, virtually impermeable film.
Water added to the pre-irrigated soil to increase the soil water content to the 25 cm depth to
field capacity, had redistributed throughout the 50 cm soil depth after 2 wks. This treatment
reduced emissions of 1,3-D by about 50% compared to the control with a dry-soil profile.
The Telone label recommends a moist soil condition in at least a 25 cm soil layer above the
fumigant injection depth as determined by the “feel method”, so this treatment would have
met the label requirements at the time of fumigation. The large amount of water used for
drip-application treatments resulted in significant increases of soil water content to the 1.5 m
depth. About 120 mm of water was stored in the 1 m profile, and additional soil sampling
measured similar soil water content to the 1.5 m depth. The high soil water content also
resulted in lower fumigant concentrations measured in the soil-gas phase and the reduced
gas-phase fumigant concentration may be a result from more partitioning into the liquid
phase as the water content increased. Fumigant concentrations in the gas phase and liquid
phase are often assumed at equilibrium, obeying the Henry’s Law Constant, although there
was not enough information to verify how well this equilibrium is maintained under dynamic
field conditions.
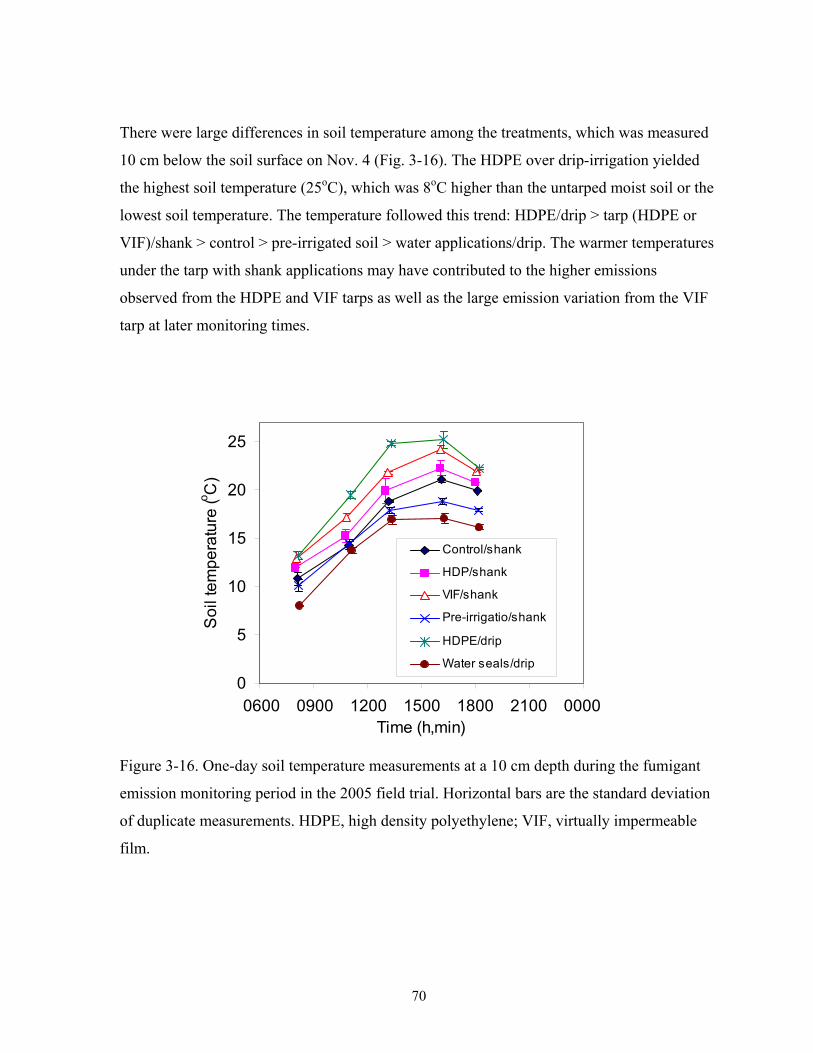
70
There were large differences in soil temperature among the treatments, which was measured
10 cm below the soil surface on Nov. 4 (Fig. 3-16). The HDPE over drip-irrigation yielded
the highest soil temperature (25oC), which was 8oC higher than the untarped moist soil or the
lowest soil temperature. The temperature followed this trend: HDPE/drip > tarp (HDPE or
VIF)/shank > control > pre-irrigated soil > water applications/drip. The warmer temperatures
under the tarp with shank applications may have contributed to the higher emissions
observed from the HDPE and VIF tarps as well as the large emission variation from the VIF
tarp at later monitoring times.
Figure 3-16. One-day soil temperature measurements at a 10 cm depth during the fumigant
emission monitoring period in the 2005 field trial. Horizontal bars are the standard deviation
of duplicate measurements. HDPE, high density polyethylene; VIF, virtually impermeable
film.
0
5
10
15
20
25
6:00 9:00 12:00 15:00 18:00 21:00 0:00Time (h,min)
So
il te
mp
era
ture
(o C)
Control/shank
HDP/shank
VIF/shank
Pre-irrigatio/shank
HDPE/drip
Water seals/drip
0600 0900 1200 1500 1800 2100 0000
71
Recovery of bagged samples of citrus nematode infested soil buried at depths of 30, 60, and
90 cm showed that in the untreated plots, an average of 4,000 live citrus nematodes per bag
were recovered. However, no live nematodes were found in bags recovered from any of the
fumigation treatments. This indicates that all the fumigation treatments provided good
control of the citrus nematodes throughout the soil profile regardless of fumigation and
surface seal treatments and the observed variations in gas-phase fumigant concentrations.
However, no efficacy evaluation was made in surface soils (0-30 cm depth) where variations
in gas-phase concentrations were the highest. Wang et al. (2006) studied distribution of
MITC and CP in soil gas phase following fumigation with dazomet, metam-sodium, and CP
under tarp and water seal covers. They observed significantly higher MITC and CP
concentrations under the tarp than with water seals and implied that the much lower fumigant
concentrations in the water-sealed plots, especially near the soil surface, were unlikely to
provide sufficient exposure time to achieve desired pesticidal efficacy. The effect of high
water content on soil pest control from irrigation treatments to reduce fumigant emissions
remains less well understood.
3.4.6 Conclusion
This field trial investigated the effects of fumigation methods (shank-injection vs. subsurface
drip-application) and selected surface treatments (irrigation and plastic tarps) on the emission
reduction of 1,3-D and CP from shank-injection of Telone® C35 and drip-application of
InLine®. Treatments included control (no water or soil surface treatment), standard HDPE
tarp, VIF tarp, and pre-irrigation all over the shank-injection; and HDPE tarp and irrigation
with micro-sprinklers (water seals) before and after fumigation over the subsurface drip-
application. The highest 1,3-D and CP emission losses over a 2-wk monitoring period were
from the control (36% 1,3-D and 30% CP) and HDPE tarp (43% 1,3-D and 17% CP) over
shank-injection. The pre-irrigation four days prior to fumigation and VIF tarp over shank-
injection had similar total emission losses (19% 1,3-D, and 8-9% CP). The HDPE tarp and
irrigations over the subsurface drip-application treatments resulted in similar and the lowest
emission losses (12-13% 1,3-D, and 2-3% CP). Lower gaseous fumigant concentrations were
observed with drip-application initially but the concentrations were higher at later times than
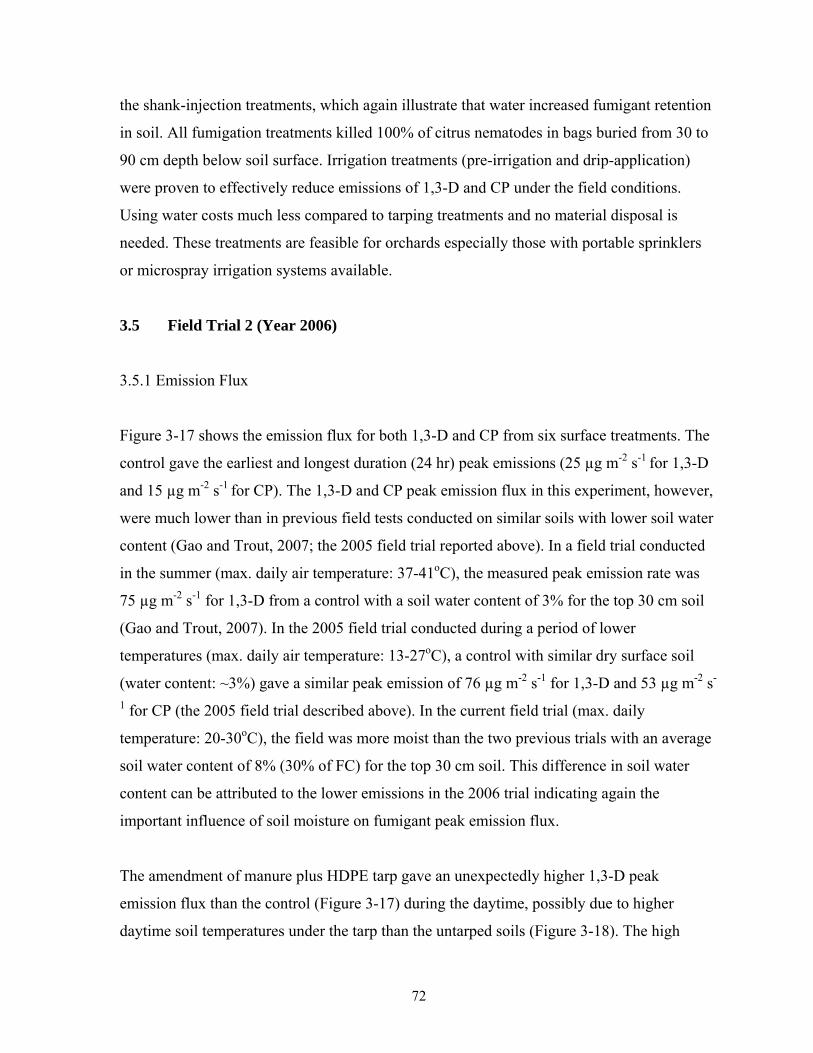
72
the shank-injection treatments, which again illustrate that water increased fumigant retention
in soil. All fumigation treatments killed 100% of citrus nematodes in bags buried from 30 to
90 cm depth below soil surface. Irrigation treatments (pre-irrigation and drip-application)
were proven to effectively reduce emissions of 1,3-D and CP under the field conditions.
Using water costs much less compared to tarping treatments and no material disposal is
needed. These treatments are feasible for orchards especially those with portable sprinklers
or microspray irrigation systems available.
3.5 Field Trial 2 (Year 2006)
3.5.1 Emission Flux
Figure 3-17 shows the emission flux for both 1,3-D and CP from six surface treatments. The
control gave the earliest and longest duration (24 hr) peak emissions (25 µg m-2 s-1 for 1,3-D
and 15 µg m-2 s-1 for CP). The 1,3-D and CP peak emission flux in this experiment, however,
were much lower than in previous field tests conducted on similar soils with lower soil water
content (Gao and Trout, 2007; the 2005 field trial reported above). In a field trial conducted
in the summer (max. daily air temperature: 37-41oC), the measured peak emission rate was
75 µg m-2 s-1 for 1,3-D from a control with a soil water content of 3% for the top 30 cm soil
(Gao and Trout, 2007). In the 2005 field trial conducted during a period of lower
temperatures (max. daily air temperature: 13-27oC), a control with similar dry surface soil
(water content: ~3%) gave a similar peak emission of 76 µg m-2 s-1 for 1,3-D and 53 µg m-2 s-
1 for CP (the 2005 field trial described above). In the current field trial (max. daily
temperature: 20-30oC), the field was more moist than the two previous trials with an average
soil water content of 8% (30% of FC) for the top 30 cm soil. This difference in soil water
content can be attributed to the lower emissions in the 2006 trial indicating again the
important influence of soil moisture on fumigant peak emission flux.
The amendment of manure plus HDPE tarp gave an unexpectedly higher 1,3-D peak
emission flux than the control (Figure 3-17) during the daytime, possibly due to higher
daytime soil temperatures under the tarp than the untarped soils (Figure 3-18). The high

73
temperatures reduce the affinity of the fumigant for organic materials. It is also possible that
since the composted manure was not incorporated into the soil it was unable to react
effectively with fumigants. Similar results were observed from a soil column test in which
composted manure spread over the soil surface gave much higher 1,3-D emissions than when
incorporated into surface soil (unpublished data from soil column experiment 1). These
results indicate that incorporation of organics into surface soils may be necessary to reduce
emissions.
The KTS plus HDPE tarp greatly reduced emission rates especially for CP. For 1,3-D, both
the KTS + HDPE tarp and the pre-irrigation treatments resulted in similar low emission rates.
The post-fumigation intermittent water seals resulted in low emissions for the first 48 hours
only and emission rates at later times (48-192 h) were as high as the control or the manure
amendment treatment. When KTS was applied with water seals (intermittent KTS application
treatment), emission rates were low for the first four days for 1,3-D and throughout the whole
experimental period for CP. This trial shows that KTS is very effective in reducing emission
rates, especially for CP.
The KTS appears much more efficient than manure in reducing fumigant emissions. KTS
reacts rapidly with halogenated fumigants to form non-volatile compounds (Gan et al.,
1998a). Manure degrades fumigants both biologically, by enhancing microbial activity, and
chemically (Dungan et al., 2001, 2003; Gan et al., 1998b) in a much less rapid process and
may also involve some reversible sorption processes as indicated by Kim et al. (2003).
Fumigant emission rates showed a greater diurnal pattern in the manure plus HDPE tarp
treatment compared to others as the tarp increased soil temperature more compared to bare
soils (Figure 3-18). Partitioning of fumigants into the soil gas phase and fumigant desorption
from the soil solid/liquid phases increases with temperature. More importantly, the tarp
permeability increases with temperature, which results in increased emissions (Papiernik and
Yates, 2002). The unincorporated composted manure materials may be unable to react with
fumigants effectively. All these factors may have resulted in the higher emission rates in the
manure + HDPE tarped treatment, especially during the daytime. Most studies have shown
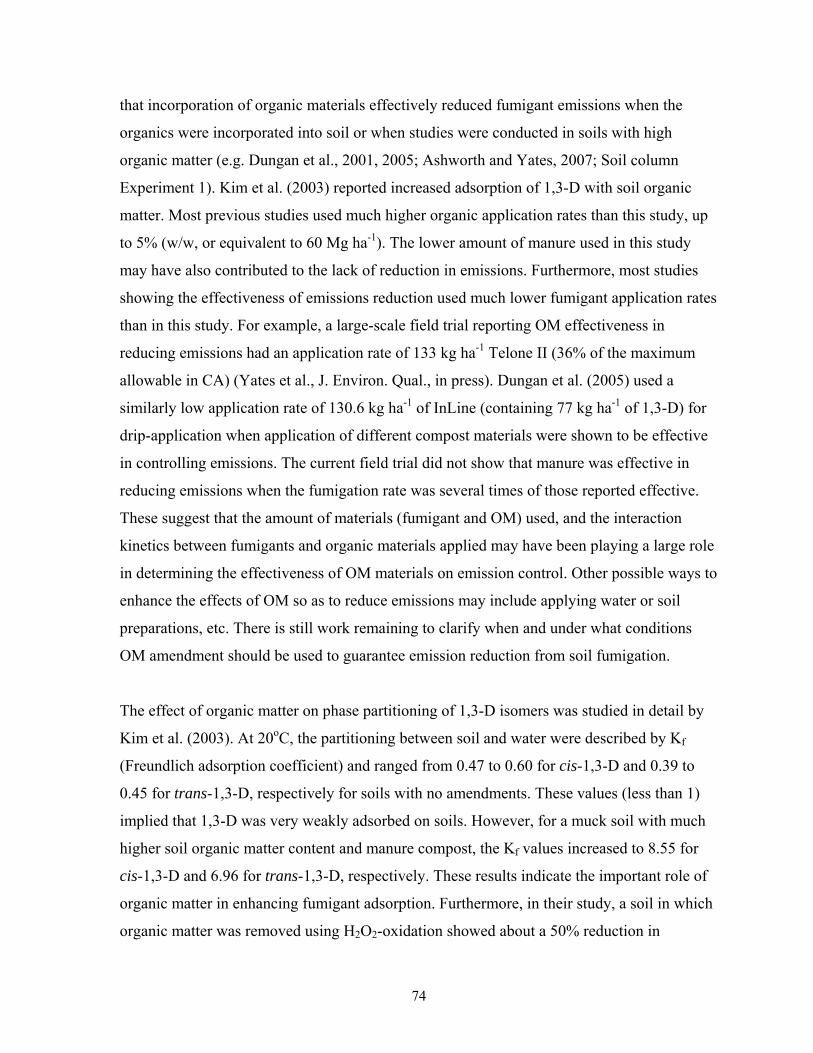
74
that incorporation of organic materials effectively reduced fumigant emissions when the
organics were incorporated into soil or when studies were conducted in soils with high
organic matter (e.g. Dungan et al., 2001, 2005; Ashworth and Yates, 2007; Soil column
Experiment 1). Kim et al. (2003) reported increased adsorption of 1,3-D with soil organic
matter. Most previous studies used much higher organic application rates than this study, up
to 5% (w/w, or equivalent to 60 Mg ha-1). The lower amount of manure used in this study
may have also contributed to the lack of reduction in emissions. Furthermore, most studies
showing the effectiveness of emissions reduction used much lower fumigant application rates
than in this study. For example, a large-scale field trial reporting OM effectiveness in
reducing emissions had an application rate of 133 kg ha-1 Telone II (36% of the maximum
allowable in CA) (Yates et al., J. Environ. Qual., in press). Dungan et al. (2005) used a
similarly low application rate of 130.6 kg ha-1 of InLine (containing 77 kg ha-1 of 1,3-D) for
drip-application when application of different compost materials were shown to be effective
in controlling emissions. The current field trial did not show that manure was effective in
reducing emissions when the fumigation rate was several times of those reported effective.
These suggest that the amount of materials (fumigant and OM) used, and the interaction
kinetics between fumigants and organic materials applied may have been playing a large role
in determining the effectiveness of OM materials on emission control. Other possible ways to
enhance the effects of OM so as to reduce emissions may include applying water or soil
preparations, etc. There is still work remaining to clarify when and under what conditions
OM amendment should be used to guarantee emission reduction from soil fumigation.
The effect of organic matter on phase partitioning of 1,3-D isomers was studied in detail by
Kim et al. (2003). At 20oC, the partitioning between soil and water were described by Kf
(Freundlich adsorption coefficient) and ranged from 0.47 to 0.60 for cis-1,3-D and 0.39 to
0.45 for trans-1,3-D, respectively for soils with no amendments. These values (less than 1)
implied that 1,3-D was very weakly adsorbed on soils. However, for a muck soil with much
higher soil organic matter content and manure compost, the Kf values increased to 8.55 for
cis-1,3-D and 6.96 for trans-1,3-D, respectively. These results indicate the important role of
organic matter in enhancing fumigant adsorption. Furthermore, in their study, a soil in which
organic matter was removed using H2O2-oxidation showed about a 50% reduction in
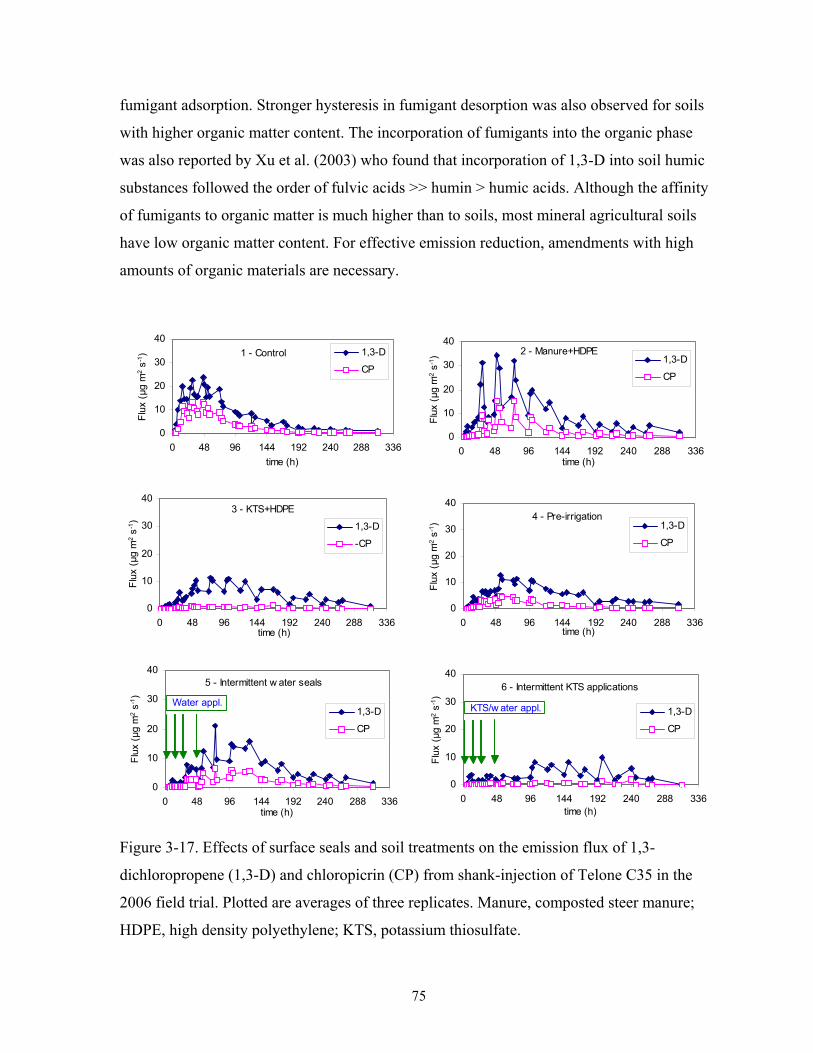
75
fumigant adsorption. Stronger hysteresis in fumigant desorption was also observed for soils
with higher organic matter content. The incorporation of fumigants into the organic phase
was also reported by Xu et al. (2003) who found that incorporation of 1,3-D into soil humic
substances followed the order of fulvic acids >> humin > humic acids. Although the affinity
of fumigants to organic matter is much higher than to soils, most mineral agricultural soils
have low organic matter content. For effective emission reduction, amendments with high
amounts of organic materials are necessary.
1 - Control
0
10
20
30
40
0 48 96 144 192 240 288 336
time (h)
Flu
x (µ
g m
-2 s
-1) 1,3-D
CP
2 - Manure+HDPE
0
10
20
30
40
0 48 96 144 192 240 288 336time (h)
Flu
x (µ
g m
-2 s
-1) 1,3-D
CP
3 - KTS+HDPE
0
10
20
30
40
0 48 96 144 192 240 288 336time (h)
Flu
x (µ
g m
-2 s
-1)
1,3-D
-CP
4 - Pre-irrigation
0
10
20
30
40
0 48 96 144 192 240 288 336time (h)
Flu
x (µ
g m
-2 s
-1) 1,3-D
CP
6 - Intermittent KTS applications
0
10
20
30
40
0 48 96 144 192 240 288 336time (h)
Flu
x (µ
g m
-2 s
-1)
1,3-D
CP
KTS/w ater appl.
5 - Intermittent w ater seals
0
10
20
30
40
0 48 96 144 192 240 288 336time (h)
Flu
x (µ
g m
-2 s
-1)
1,3-D
CP
Water appl.
Figure 3-17. Effects of surface seals and soil treatments on the emission flux of 1,3-
dichloropropene (1,3-D) and chloropicrin (CP) from shank-injection of Telone C35 in the
2006 field trial. Plotted are averages of three replicates. Manure, composted steer manure;
HDPE, high density polyethylene; KTS, potassium thiosulfate.
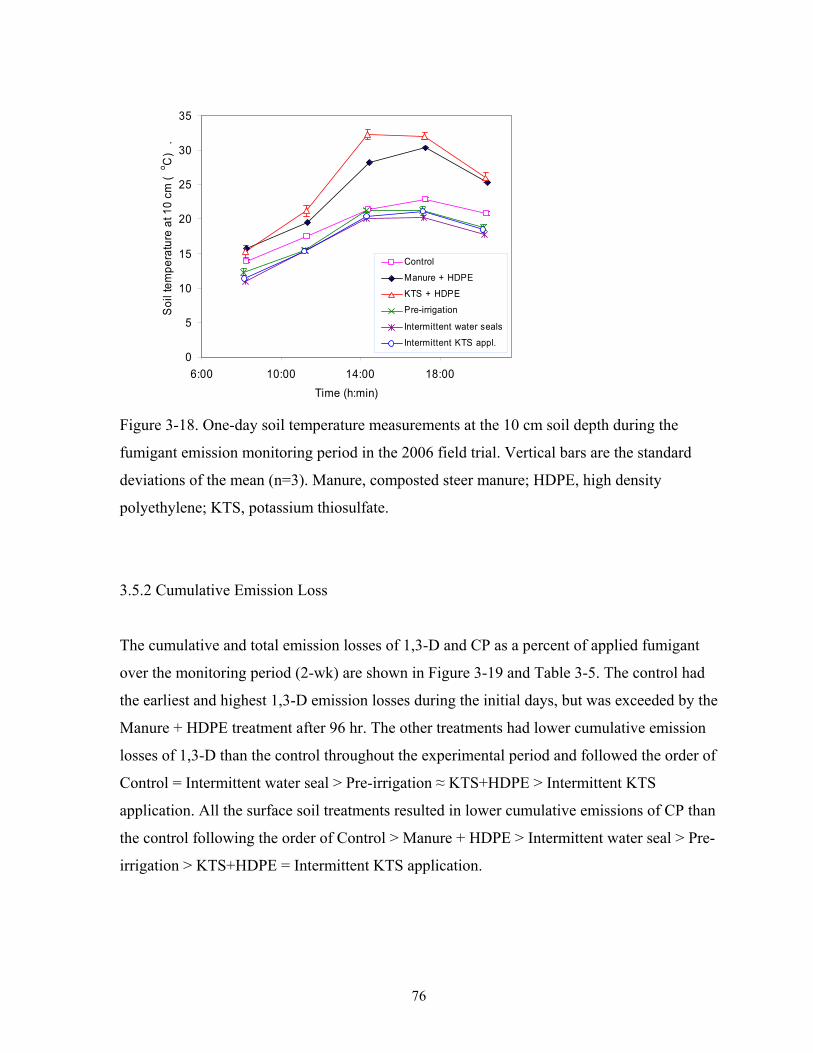
76
0
5
10
15
20
25
30
35
6:00 10:00 14:00 18:00
Time (h:min)
So
il te
mp
era
ture
at 1
0 c
m (
o C)
.
Control
Manure + HDPE
KTS + HDPE
Pre-irrigation
Intermittent water seals
Intermittent KTS appl.
Figure 3-18. One-day soil temperature measurements at the 10 cm soil depth during the
fumigant emission monitoring period in the 2006 field trial. Vertical bars are the standard
deviations of the mean (n=3). Manure, composted steer manure; HDPE, high density
polyethylene; KTS, potassium thiosulfate.
3.5.2 Cumulative Emission Loss
The cumulative and total emission losses of 1,3-D and CP as a percent of applied fumigant
over the monitoring period (2-wk) are shown in Figure 3-19 and Table 3-5. The control had
the earliest and highest 1,3-D emission losses during the initial days, but was exceeded by the
Manure + HDPE treatment after 96 hr. The other treatments had lower cumulative emission
losses of 1,3-D than the control throughout the experimental period and followed the order of
Control = Intermittent water seal > Pre-irrigation ≈ KTS+HDPE > Intermittent KTS
application. All the surface soil treatments resulted in lower cumulative emissions of CP than
the control following the order of Control > Manure + HDPE > Intermittent water seal > Pre-
irrigation > KTS+HDPE = Intermittent KTS application.
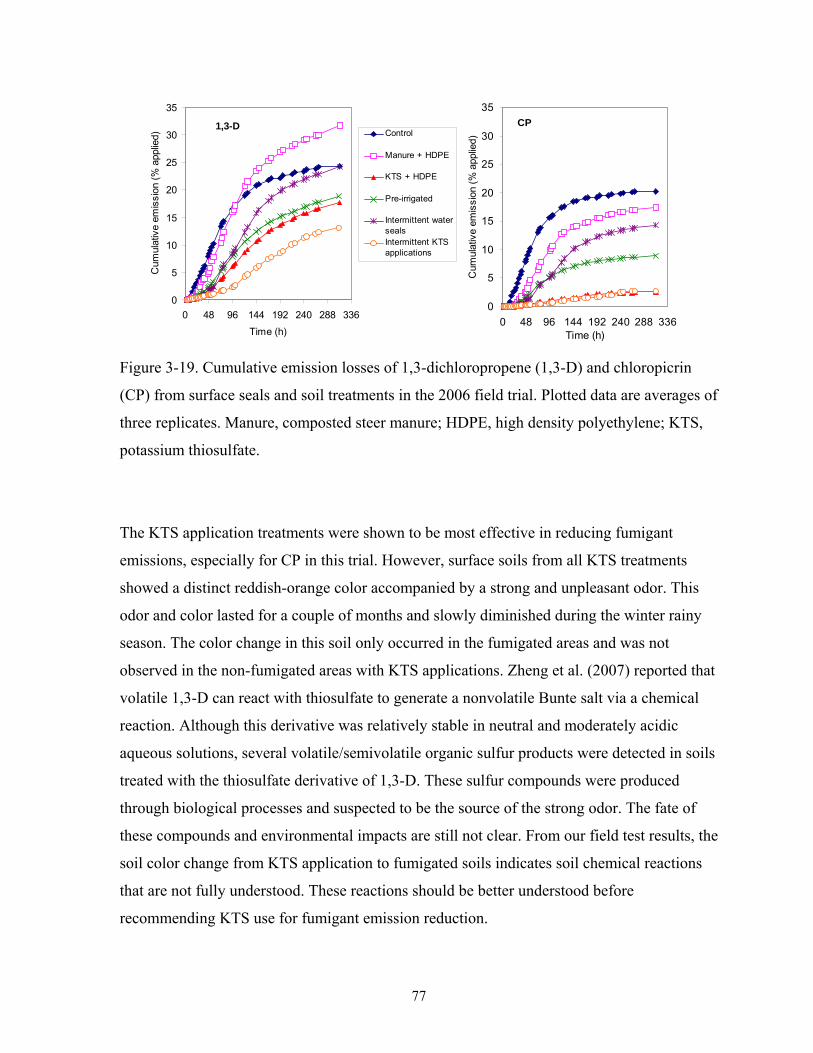
77
1,3-D
0
5
10
15
20
25
30
35
0 48 96 144 192 240 288 336
Time (h)
Cum
ulat
ive
emis
sion
(%
app
lied)
Control
Manure + HDPE
KTS + HDPE
Pre-irrigated
Intermittent watersealsIntermittent KTSapplications
CP
0
5
10
15
20
25
30
35
0 48 96 144 192 240 288 336Time (h)
Cum
ulat
ive
emis
sion
(%
app
lied)
Figure 3-19. Cumulative emission losses of 1,3-dichloropropene (1,3-D) and chloropicrin
(CP) from surface seals and soil treatments in the 2006 field trial. Plotted data are averages of
three replicates. Manure, composted steer manure; HDPE, high density polyethylene; KTS,
potassium thiosulfate.
The KTS application treatments were shown to be most effective in reducing fumigant
emissions, especially for CP in this trial. However, surface soils from all KTS treatments
showed a distinct reddish-orange color accompanied by a strong and unpleasant odor. This
odor and color lasted for a couple of months and slowly diminished during the winter rainy
season. The color change in this soil only occurred in the fumigated areas and was not
observed in the non-fumigated areas with KTS applications. Zheng et al. (2007) reported that
volatile 1,3-D can react with thiosulfate to generate a nonvolatile Bunte salt via a chemical
reaction. Although this derivative was relatively stable in neutral and moderately acidic
aqueous solutions, several volatile/semivolatile organic sulfur products were detected in soils
treated with the thiosulfate derivative of 1,3-D. These sulfur compounds were produced
through biological processes and suspected to be the source of the strong odor. The fate of
these compounds and environmental impacts are still not clear. From our field test results, the
soil color change from KTS application to fumigated soils indicates soil chemical reactions
that are not fully understood. These reactions should be better understood before
recommending KTS use for fumigant emission reduction.

78
The pre-irrigation treatment resulted in the second lowest cumulative emissions of 1,3-D and
CP among the treatments. The effectiveness of pre-irrigation was reported earlier. These
results suggest that water application 2-4 days prior to fumigation to achieve field capacity at
the surface 25-30 cm soil is a feasible solution to reduce fumigant emissions. Pre-irrigation
also has an economic advantage compared to other surface treatments because of its easy
application. In the current study, pre-irrigation reduced cumulative emissions more
effectively than the intermittent water seals, which gave higher emissions after four days for
both 1,3-D and CP. The intermittent water seals had a limited effect on reducing fumigant
emissions (Figure 3-17; Table 3-5), possibly less effective water seals were formed or
remained after irrigation stopped.
Table 3-5. Total emission loss of 1,3-dichloropropene (1,3-D) and chloropicrin (CP)
measured over 2 weeks after fumigation in the 2006 field trial.
Total Emissions (% of applied)‡ Treatment†
1,3-D CP
Control 24 (a, b)
20 (a)
Manure + HDPE 32 (a)
17 (a, b)
KTS + HDPE 18 (b)
3 (b)
Pre-irrigation 19 (b)
9 (a, b)
Intermittent water seal 24 (a, b)
14 (a, b)
Intermittent KTS appl. 13 (b) 3 (b) † Manure, composted steer manure; HDPE, high density polyethylene; KTS, potassium
thiosulfate.
‡ Within a column, means (n=3) with the same letter in parentheses are not significantly
different according to Tukey’s HSD test (α=0.05).
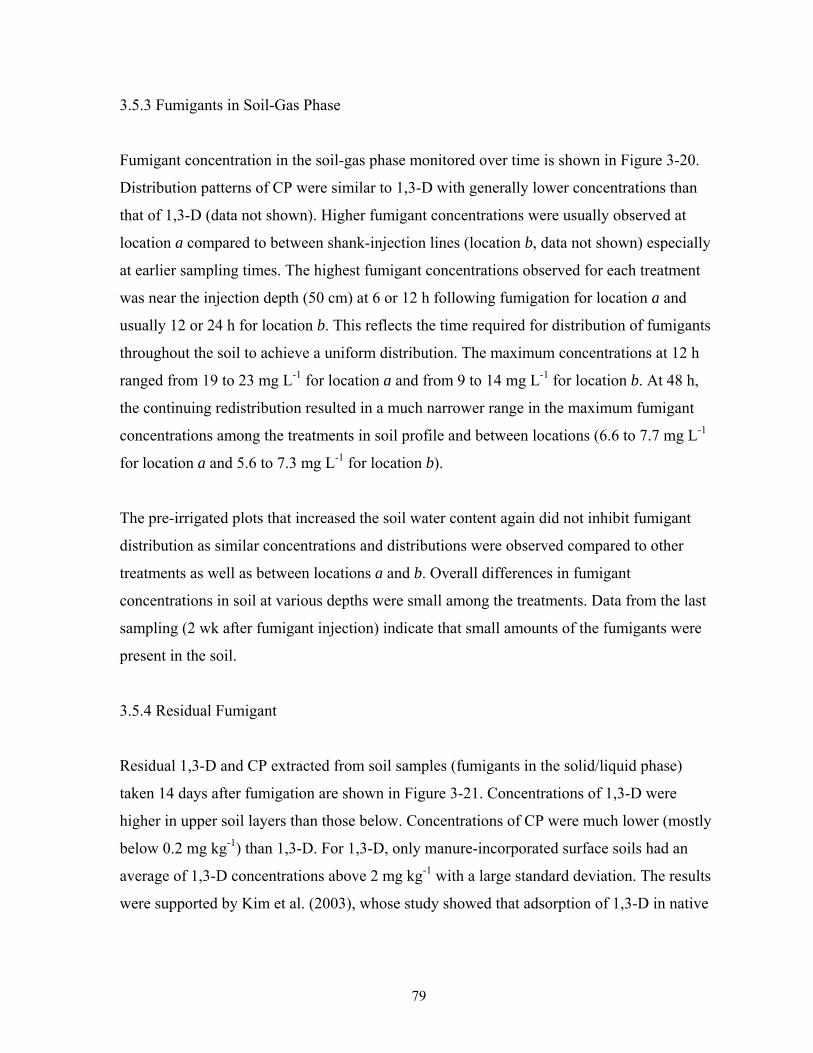
79
3.5.3 Fumigants in Soil-Gas Phase
Fumigant concentration in the soil-gas phase monitored over time is shown in Figure 3-20.
Distribution patterns of CP were similar to 1,3-D with generally lower concentrations than
that of 1,3-D (data not shown). Higher fumigant concentrations were usually observed at
location a compared to between shank-injection lines (location b, data not shown) especially
at earlier sampling times. The highest fumigant concentrations observed for each treatment
was near the injection depth (50 cm) at 6 or 12 h following fumigation for location a and
usually 12 or 24 h for location b. This reflects the time required for distribution of fumigants
throughout the soil to achieve a uniform distribution. The maximum concentrations at 12 h
ranged from 19 to 23 mg L-1 for location a and from 9 to 14 mg L-1 for location b. At 48 h,
the continuing redistribution resulted in a much narrower range in the maximum fumigant
concentrations among the treatments in soil profile and between locations (6.6 to 7.7 mg L-1
for location a and 5.6 to 7.3 mg L-1 for location b).
The pre-irrigated plots that increased the soil water content again did not inhibit fumigant
distribution as similar concentrations and distributions were observed compared to other
treatments as well as between locations a and b. Overall differences in fumigant
concentrations in soil at various depths were small among the treatments. Data from the last
sampling (2 wk after fumigant injection) indicate that small amounts of the fumigants were
present in the soil.
3.5.4 Residual Fumigant
Residual 1,3-D and CP extracted from soil samples (fumigants in the solid/liquid phase)
taken 14 days after fumigation are shown in Figure 3-21. Concentrations of 1,3-D were
higher in upper soil layers than those below. Concentrations of CP were much lower (mostly
below 0.2 mg kg-1) than 1,3-D. For 1,3-D, only manure-incorporated surface soils had an
average of 1,3-D concentrations above 2 mg kg-1 with a large standard deviation. The results
were supported by Kim et al. (2003), whose study showed that adsorption of 1,3-D in native

80
Figure 3-20. 1,3-dichloropropene (1,3-D) distribution in soil-gas phase under various surface
treatments at location a - adjacent to fumigant injection lines (top six graphs), and location b
- between injection lines (bottom six graphs) under various surface treatments in the 2006
field trial. Manure, composted steer manure; HDPE, high density polyethylene; KTS,
potassium thiosulfate.
KTS+HDPE
0
20
40
60
80
100
0 10 20 30 401,3-D (mg/L)
de
pth
(cm
)
a
Manure+HDPE
0
20
40
60
80
100
0 10 20 30 401,3-D (mg/L)
dept
h (c
m)
a
Intermitent KTS appl.
0
20
40
60
80
100
0 10 20 30 40
1,3-D (mg/L)
dept
h (c
m)
b
Intermittent w ater seals
0
20
40
60
80
100
0 10 20 30 40
1,3-D (mg/L)
dept
h (c
m)
b
Pre-irrigation
0
20
40
60
80
100
0 10 20 30 40
1,3-D (mg/L)
dept
h (c
m)
b
Control
0
20
40
60
80
100
0 10 20 30 401,3-D (mg/L)
dept
h (c
m)
a
Intermittent w ater seal
0
20
40
60
80
100
0 10 20 30 40
1,3-D (mg/L)
dept
h (c
m)
6 h 12 h24 h 36 h48 h 72 h168 h 312 h
a
Pre-irrigation
0
20
40
60
80
100
0 10 20 30 40
1,3-D (mg/L)
dept
h (c
m)
a
Intermittent KTS appl.
0
20
40
60
80
100
0 10 20 30 40
1,3-D ( mg/L)
dept
h (c
m)
a
Control
0
20
40
60
80
100
0 10 20 30 40
1,3-D (mg/L)
dept
h (c
m)
b
KTS+HDPE
0 10 20 30 401,3-D (mg/L)
dept
h (c
m)
b
Manure+HDPE
0
20
40
60
80
100
0 10 20 30 401,3-D (mg/L)
dept
h (c
m)
b
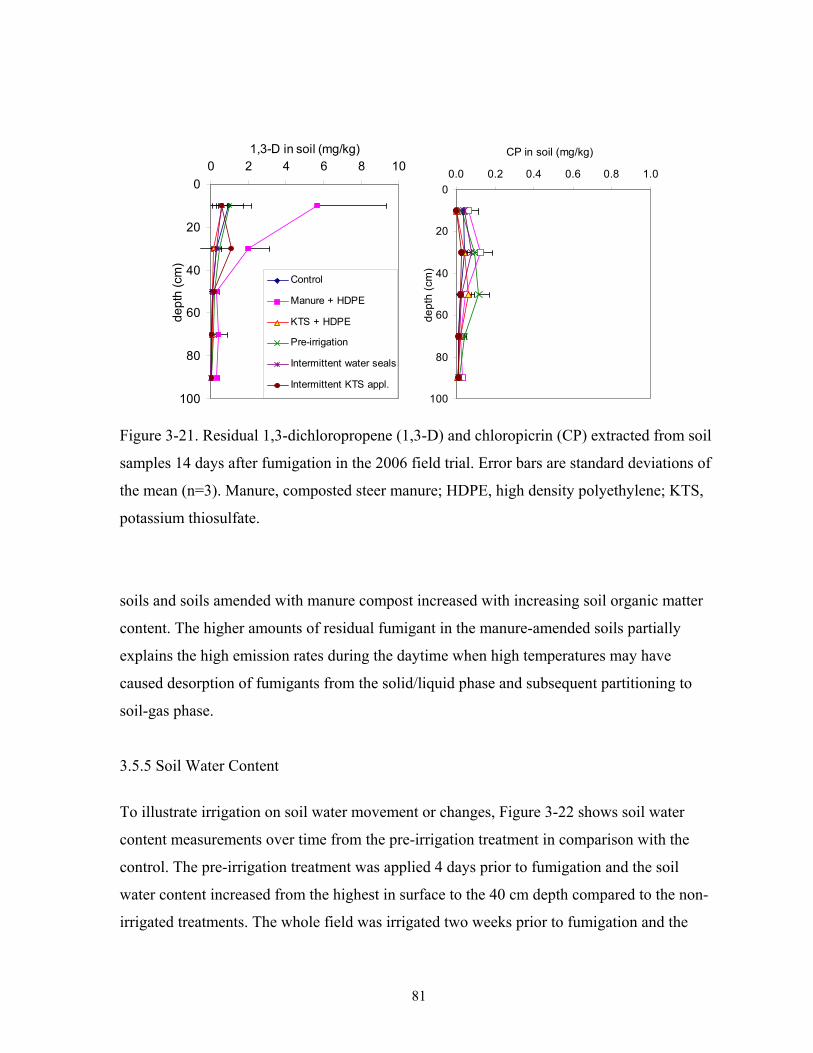
81
Figure 3-21. Residual 1,3-dichloropropene (1,3-D) and chloropicrin (CP) extracted from soil
samples 14 days after fumigation in the 2006 field trial. Error bars are standard deviations of
the mean (n=3). Manure, composted steer manure; HDPE, high density polyethylene; KTS,
potassium thiosulfate.
soils and soils amended with manure compost increased with increasing soil organic matter
content. The higher amounts of residual fumigant in the manure-amended soils partially
explains the high emission rates during the daytime when high temperatures may have
caused desorption of fumigants from the solid/liquid phase and subsequent partitioning to
soil-gas phase.
3.5.5 Soil Water Content
To illustrate irrigation on soil water movement or changes, Figure 3-22 shows soil water
content measurements over time from the pre-irrigation treatment in comparison with the
control. The pre-irrigation treatment was applied 4 days prior to fumigation and the soil
water content increased from the highest in surface to the 40 cm depth compared to the non-
irrigated treatments. The whole field was irrigated two weeks prior to fumigation and the
0
20
40
60
80
100
0 2 4 6 8 101,3-D in soil (mg/kg)
de
pth
(cm
)
Control
Manure + HDPE
KTS + HDPE
Pre-irrigation
Intermittent water seals
Intermittent KTS appl.
0
20
40
60
80
100
0.0 0.2 0.4 0.6 0.8 1.0
CP in soil (mg/kg)
de
pth
(cm
)
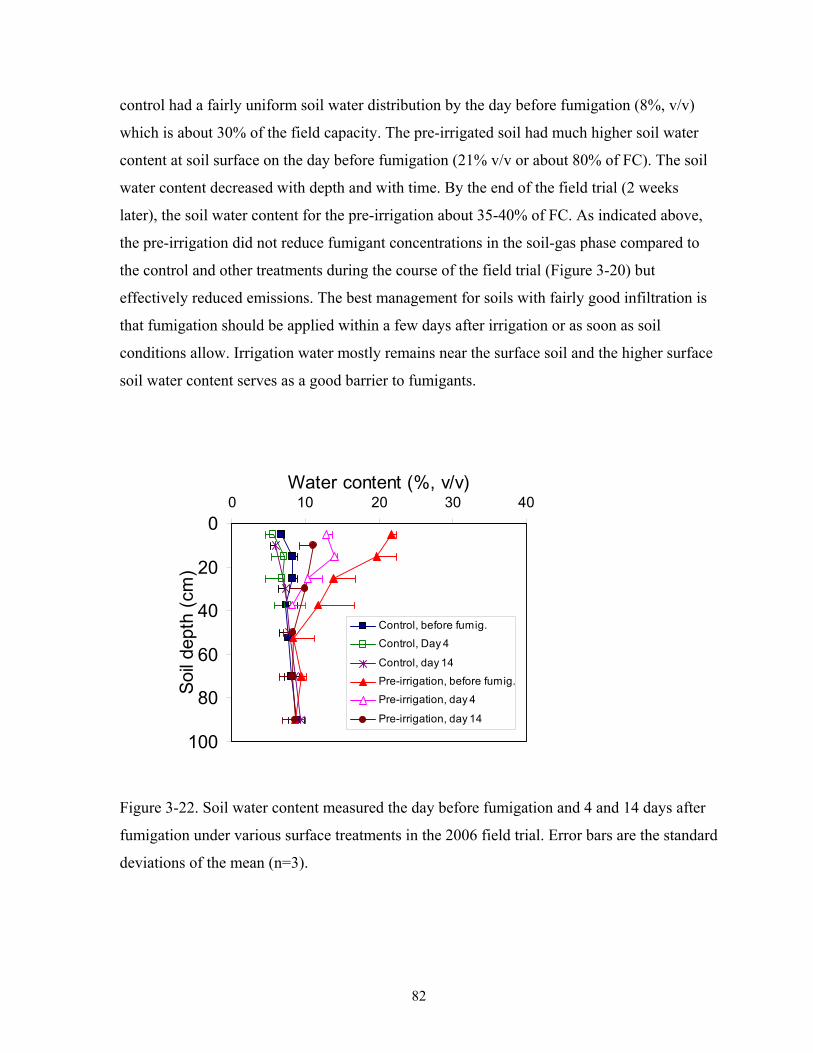
82
control had a fairly uniform soil water distribution by the day before fumigation (8%, v/v)
which is about 30% of the field capacity. The pre-irrigated soil had much higher soil water
content at soil surface on the day before fumigation (21% v/v or about 80% of FC). The soil
water content decreased with depth and with time. By the end of the field trial (2 weeks
later), the soil water content for the pre-irrigation about 35-40% of FC. As indicated above,
the pre-irrigation did not reduce fumigant concentrations in the soil-gas phase compared to
the control and other treatments during the course of the field trial (Figure 3-20) but
effectively reduced emissions. The best management for soils with fairly good infiltration is
that fumigation should be applied within a few days after irrigation or as soon as soil
conditions allow. Irrigation water mostly remains near the surface soil and the higher surface
soil water content serves as a good barrier to fumigants.
0
20
40
60
80
100
0 10 20 30 40Water content (%, v/v)
Soi
l dep
th (
cm)
Control, before fumig.
Control, Day 4
Control, day 14
Pre-irrigation, before fumig.
Pre-irrigation, day 4
Pre-irrigation, day 14
Figure 3-22. Soil water content measured the day before fumigation and 4 and 14 days after
fumigation under various surface treatments in the 2006 field trial. Error bars are the standard
deviations of the mean (n=3).

83
3.5.6 Conclusion
This field study evaluated the effectiveness of several surface seals or soil treatment methods
on emissions of 1,3-D and CP from shank-injection of Telone C35. Treatments included
control (bare surface), pre-irrigation (with sufficient amounts of irrigation water 4 days prior
to fumigation), post-fumigation water seals with or without potassium thiosulfate (KTS)
amendment, and the standard HDPE tarp over soils amended with either KTS or composted
manure. The two KTS treatments resulted in the lowest fumigant emissions; however, the
soil surface in the treatments developed a reddish-orange color and an unpleasant odor that
lasted for a few months. These reactions may not be desirable for subsequent planting, which
have never been investigated. The pre-irrigation that did not affect fumigant concentrations
in the soil-gas phase reduced emissions more than the post-application intermittent water
seals. Pre-irrigation is much more easily managed than water seals. An application of
composted manure at 12.4 Mg ha-1 (~ 5 tons per acre) spread over the soil surface followed
by the HDPE tarp did not reduce 1,3-D emissions compared to the bare soils in this trial,
indicating that a better understanding of processes is needed to effectively use organic
amendments for emission reduction purposes under field conditions.
3.6 Field Trial 3 (Year 2007)
3.6.1 Emission Flux
Measured emission flux for 1,3-D and CP is shown in Figure 3-23. Statistical analysis on the
difference in the peak flux between treatments is given in Table 3-6. The control and manure
treatment at 12.4 Mg ha-1 gave the highest and similar emission rates for both 1,3-D and CP
for the first 4 days following fumigation. The manure treatment at 24.7 Mg ha-1 was slightly
lower than the control and the 12.4 Mg ha-1 manure treatment; however no significant
differences were identified. The peak emissions for these three treatments occurred about 30
h after fumigant injection and were significantly higher than the other three treatments. With
the continuous monitoring of the emission flux using the DFCs, the flux showed clear diurnal
temperature patterns, highest in early afternoon (1200-1500 h) daily and lowest at dawn

84
(around 0300 h). The water application treatments with or without manure application
resulted in the lowest emission rates for 1,3-D within the first 4 days. The manure + HDPE
tarp treatment had low peak flux values that were similar to the water treatments.
Figure 3-23. Effects of manure and water applications on the emission flux of (a) 1,3-
dichloropropene (1,3-D) and (b) chloropicrin (CP) in the 2007 field trial. Plotted data are
averages of three replicates. Error bars are not given for the legibility of the figure
(significance of the differences between treatments is indicated in Table 3-6).
0
10
20
30
40
50
60
11/12 11/14 11/16 11/18 11/20 11/22Date
CP
em
issi
on fl
ux (
µg
m -2
s-1) b
0
20
40
60
80
100
120
11/12 11/14 11/16 11/18 11/20 11/22
1,3
-D e
mis
sio
n fl
ux
(µg
m -2
s-1
)
ControlManure 12.4 Mg/haManure 24.7 Mg/haManure 12.4 Mg/ha + HDPEWater sealsManure 12.4 Mg/ha + water seals
a

85
For the control and manure amendment treatments, the flux decreased dramatically with time
after the peak flux, had similar values as the water treatments at day 5 or 6, and continued to
decrease thereafter. For the two water treatments (with and without manure amendment), the
flux remained low but maintained a steady rate during the 10-d monitoring period. At the end
of the monitoring period, the water seals alone had the highest flux, which was significantly
higher than all other treatments for 1,3-D and for CP except the manure + water seal
treatment. The manure + HDPE tarp treatment had the lowest emission flux for CP among all
treatments throughout the experiment (Figure 3-23) indicating the effectiveness of HDPE in
controlling CP emissions compared to 1,3-D. Similar results had been observed in previous
studies (Gao and Trout, 2007; The 2005 and 2006 field trials above).
3.6.2 Cumulative emission loss
The cumulative emission losses of 1,3-D and CP from all the treatments are shown in Figure
3-24. Statistical differences in total emission loss between treatments are given in Table 3-6.
The fumigant application rate was 33.7 g m-2 for 1,3-D and 19.4 g m-2 for CP. Calculation for
cumulative emission loss over the 10-d monitoring period for the control was about 80% of
total applied. This value appears unreasonably high considering the relatively moist soil and
low temperatures during the field trial in comparison with values reported in the literature
(Gao and Trout, 2007; The 2005 and 2006 field trials reported above). It is likely that a
systematic error occurred in the DCFs because of unexpected water condensation problems
in the field (see discussions below).
3.6.2.1 Overestimation of flux by DFCs
The dynamic chambers had a tendency to overestimate emissions compared to passive
chambers that tend to underestimate emissions if sampling and processing are handled
improperly (Yates et al., 2003; Gao and Wang, in press). A negative pressure (vacuum) was
created inside the chamber due to the constant flow drawn by a vacuum and this pressure
deficit was considered so that it would not be significant enough to affect the emission flux
estimate. Using the conditions set up in the field, measurements in both the laboratory and
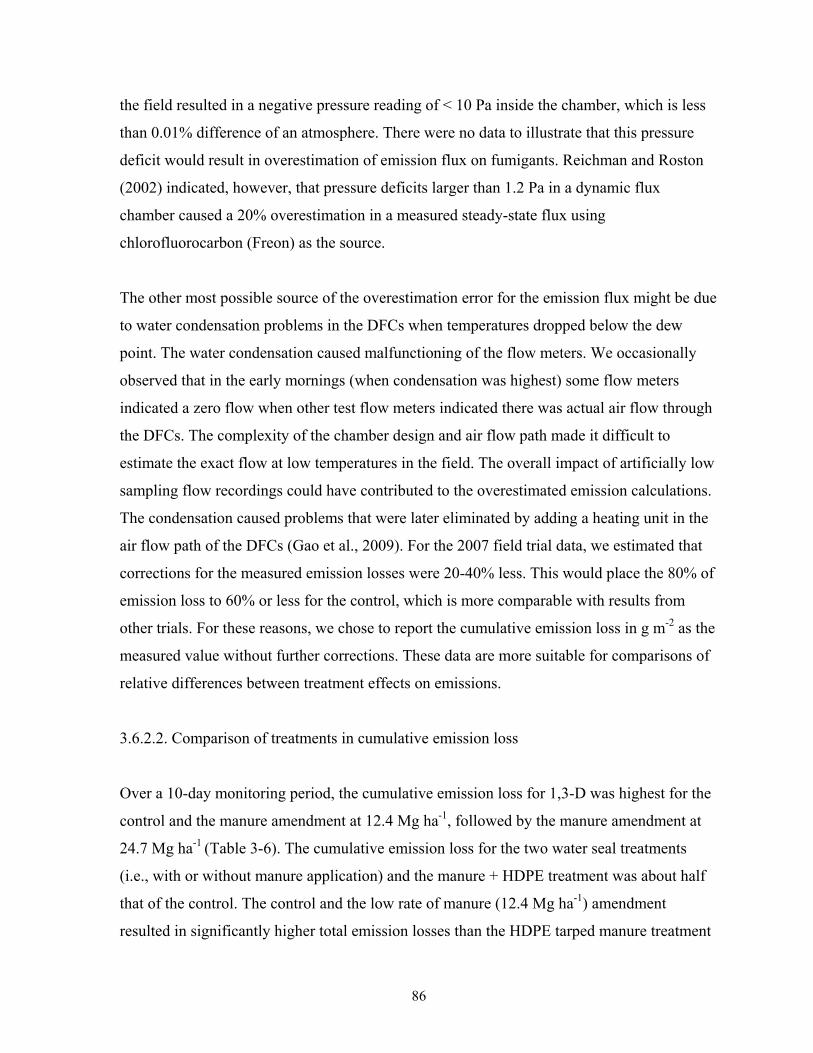
86
the field resulted in a negative pressure reading of < 10 Pa inside the chamber, which is less
than 0.01% difference of an atmosphere. There were no data to illustrate that this pressure
deficit would result in overestimation of emission flux on fumigants. Reichman and Roston
(2002) indicated, however, that pressure deficits larger than 1.2 Pa in a dynamic flux
chamber caused a 20% overestimation in a measured steady-state flux using
chlorofluorocarbon (Freon) as the source.
The other most possible source of the overestimation error for the emission flux might be due
to water condensation problems in the DFCs when temperatures dropped below the dew
point. The water condensation caused malfunctioning of the flow meters. We occasionally
observed that in the early mornings (when condensation was highest) some flow meters
indicated a zero flow when other test flow meters indicated there was actual air flow through
the DFCs. The complexity of the chamber design and air flow path made it difficult to
estimate the exact flow at low temperatures in the field. The overall impact of artificially low
sampling flow recordings could have contributed to the overestimated emission calculations.
The condensation caused problems that were later eliminated by adding a heating unit in the
air flow path of the DFCs (Gao et al., 2009). For the 2007 field trial data, we estimated that
corrections for the measured emission losses were 20-40% less. This would place the 80% of
emission loss to 60% or less for the control, which is more comparable with results from
other trials. For these reasons, we chose to report the cumulative emission loss in g m-2 as the
measured value without further corrections. These data are more suitable for comparisons of
relative differences between treatment effects on emissions.
3.6.2.2. Comparison of treatments in cumulative emission loss
Over a 10-day monitoring period, the cumulative emission loss for 1,3-D was highest for the
control and the manure amendment at 12.4 Mg ha-1, followed by the manure amendment at
24.7 Mg ha-1 (Table 3-6). The cumulative emission loss for the two water seal treatments
(i.e., with or without manure application) and the manure + HDPE treatment was about half
that of the control. The control and the low rate of manure (12.4 Mg ha-1) amendment
resulted in significantly higher total emission losses than the HDPE tarped manure treatment
87
and the two water (seals) treatments. The total emission loss of 1,3-D from the high rate of
manure (24.7 Mg ha-1) fell in between; but it was not significantly different from any other
treatments due to large variations within the treatment. The results indicate that higher rates
of manure application may be required in order to effectively reduce emissions. For CP, the
cumulative emission loss from the manure + HDPE treatment was the lowest, significantly
lower than all other treatments except the manure + water treatment.
Figure 3-24. Cumulative emission loss of (a) 1,3-dichloropropene (1,3-D) and (b)
chloropicrin (CP) from manure amendment and water application treatments in the 2007 field
trial. Plotted data are averages of three replicates (significance of the differences between
treatments is indicated in Table 3-6). Manure, composted manure; HDPE, high density
polyethylene.
0
5
10
15
11/12 11/14 11/16 11/18 11/20 11/22
Date
CP
cu
mu
lativ
e e
mis
sio
n lo
ss (
g m
-2)
0
10
20
30
40
11/12 11/14 11/16 11/18 11/20 11/22
1,3
-D c
um
ula
tive
em
issi
on
loss
(g
m -2
) ControlManure 12.4 Mg/haManure 24.7 Mg/haManure 12.4 Mg/ha+HDPEWater sealsManure 12.4 Mg/ha+water seals
a
b

88
Table 3-6. Emission peak and cumulative emission loss of 1,3-dichloropropene (1,3-D) and
chloropicrin (CP) monitored over 10 d following fumigation in the 2007 field trial
Maximum Emission flux‡ (μg m-2 s-1)
Cumulative Emissions§ (g m-2)
Treatment†
1,3-D CP 1,3-D CP
Control 98.0 (a) 38.8 (a) 26.0 (a)
7.4 (a)
Manure 12.4 Mg ha-1 104.9 (a) 36.3 (a) 26.3 (a)
6.2 (ab)
Manure 24.7 Mg ha-1 72.8 (ab) 30.7 (a) 21.5 (ab)
6.9 (a)
Manure 12.4 Mg ha-1+ HDPE
33.3 (bc) 3.3 (b) 13.0 (b)
1.2 (d)
Water seals 16.7 (c) 3.4 (b) 16.5 (b)
4.3 (bc)
Manure 12.4 Mg ha-1 + water seal
20.0 (c) 3.4 (b) 14.4 (b)
2.7 (cd)
† Manure, composted manure; HDPE, high density polyethylene.
‡ Within a column, means (n=3) with the same letter in parentheses are not significantly
different according to Fisher’s Protected Least Significant Difference (LSD) procedure
(α=0.05).
§ Fumigant applied was about 33.7 g m-2 1,3-D and 19.4 g m-2 CP. The cumulative
emission loss of 1,3-D for the control was substantially higher than expected, about 80%
of applied based on measured emission flux using dynamic flux chambers. Contributed
errors might be caused by the malfunctioning of flow meters due to water condensation in
the field. The estimated correction factor for the measured emission losses were 20-40%
less. Reported values here were used for a comparison of relative differences between
surface treatments.
The steady increase in cumulative emission loss for the two water seal treatments (with and
without manure amendment) (Figure 3-24) was the result of the relatively constant emission
flux throughout the monitoring period (Figure 3-23). The high surface soil water content in
the water seal treatments could reduce emissions by inhibiting fumigant transport to soil
surface as discussed above. On the other hand, high surface soil water content may have also
retained fumigants in soils including those dissolved in the liquid phase, which may have
provided the continuous source for emissions.

89
The overall emission data indicate that manure application at rates of 12.4 and 24.7 Mg ha-1
(~ 5 and 10 tone per acre) did not significantly reduce emissions in this trial. The HDPE
tarped manure treatment reduced emissions. Recall that the manure (12.4 Mg ha-1) + HDPE
treatment tested in the 2006 field trial that did not reduce emission as discussed above. The
differences between the two field trials were that in the 2006 trial the manure was not
incorporated into the soil, the surface soil water content was lower (5.4% in 2006 vs. 7.6%,
v/v in this trial), and temperatures were higher (avg. max. air temperature 25.4 vs. 18.7 oC).
None of these changed conditions resulted in the effectiveness of composted manure in
reducing emissions under field conditions, which appear contradictory to those reported
effective.
Further examination of the effectiveness of OM amendment on emission reduction from soil
fumigants revealed that most studies showing OM amendments to be effective in reducing
emissions applied either much lower fumigant application rates or much higher OM rates
than the two field trials we conducted that showed OM amendment to be ineffective. In our
2006 and 2007 field trials, the fumigation rate was near the maximum allowable Telone Rate
in California that is used for perennials with actual tested rates of 500-550 kg ha-1 Telone
C35. The 12.4 and 24.9 Mg ha-1 manure application rate are equivalent to 5 and 10 tons per
acre. Dungan et al. (2005) reported that amendment rates with composted steer manure and
composted chicken manure at 33 and 65 Mg ha-1, respectively, to surface (5 cm) soils
effectively reduced emissions from drip-applied emulsified formulation of 1,3-D in raised
beds. The fumigation rate was 130.6 kg ha-1 of InLine (containing 77 kg ha-1 of 1,3-D), about
a quarter of the tested rates we used in the 2006 and 2007 field trials. Yates et al. (in press)
reported that OM was very effective in reducing emissions based on a large-scale field trial
also had a very low application rate (133 kg ha-1 Telone II) in addition to the 300 tons per
acre of green-waste incorporated into the field a year prior to fumigation. Most laboratory
studies often used higher OM application rates that are well-mixed with the soil (difficult to
achieve in the field) (e.g., Gan et al., 1998b, McDonald et al., 2008) and lower fumigant
injection rates to avoid a prolonged experiment time (e.g., Table 2-1). Apparent conclusions
can be made that OM amendments can be effective when substantially high ratios of OM
90
materials to fumigants is tested. When a high fumigation rate is required for satisfactory pest
control as is the case for perennials, it may be a great challenge to control emissions with the
growers normally-applied OM rate for improving soil physicochemical properties. This
means that a substantially higher OM amendment rate may be necessary for emission
reduction purposes. The data also suggest that the amount of materials (fumigant and OM)
used, and the interaction kinetics between fumigants and organic materials applied, may have
played a large role in determining the effectiveness of OM materials on emission control.
Other possible ways to enhance the effects of OM in reducing emissions may include water
application or soil preparation, etc. There is still work remaining to clarify when and under
what conditions OM amendment should be used to guarantee emission reduction from soil
fumigation especially at high application rates.
Dungan et al. (2005) also reported that different amendment rates with different OM
materials resulted in different emission reduction. This indicates that source materials may
also determine their effectiveness on fumigant emission reduction. As a soil amendment
material, composted manure is used mostly below 25 Mg ha-1 in conventional farmlands.
Better characterization of organic materials may also be needed in future studies. Higher
composted manure application rates may be associated with higher costs unless growers have
access to free materials. An application of 25 Mg ha-1 (10 tons per acre) would cost roughly
$250-$800 ha-1 ($100-&300 per acre) considering delivery and material costs, and potentially
more depending on delivery distance from the source.
3.6.3 Fumigant in Soil-Gas Phase
Distribution of 1,3-D in the soil-gas phase is given in Figure 3-25. Chloropicrin (data not
shown) followed similar patterns as that of 1,3-D except at lower concentration levels
because CP dissipates more rapidly than 1,3-D from soils as discussed earlier.
A difference in fumigant distribution was observed between sampling locations in the first
day or two for all treatments, i.e., higher fumigant concentrations at Location a - adjacent to
fumigant injection lines than Location b - between injection lines (data not shown). The least

91
difference was observed from the bare-soil control treatment. The differences between
locations decreased over time. The highest concentrations of 1,3-D (20-25 µg cm-3) at
Location a were observed within 12 h and 24-48 h at Location b. At Location a, fumigant
concentrations were similar by 24 h among all surface treatments except the manure + water
seal treatment which had much lower concentrations. Because there was no replicate
measurement at the soil gas sampling locations for each treatment, it was uncertain if the
much lower soil gaseous fumigant concentration in the manure + water seal treatment was
due to the addition of manure and water or potential problems with sampling probes. The
manure + HDPE treatment was not monitored for soil gaseous fumigants as the 2006 field
trial indicated no difference from the control.
Figure 3-25. 1,3-dichloropropene (1,3-D) concentration in the soil-gas phase at location a
(adjacent to fumigant injection line; graphs on the left side) and at location b (between
fumigant injection lines; graphs on the right side) in the 2007 field trial.
Control - a
020406080
100
0 5 10 15 20 25
1-3,D concentration (mg/L)
De
pth
(cm
) 24 h48 h72 h168 h336 h
Control -b
020406080
100
0 5 10 15 20 25
1.3-D concentration (mg/L)
Water Seals - a
020406080
100
0 5 10 15 20 25
De
pth
(cm
)
Water seals - b
020406080
100
0 5 10 15 20 25
Manure 12.4 Mg/ha - a
0
20
40
60
80
100
0 5 10 15 20 25
Dep
th (
cm)
Manure 12.4 Mg/ha - b
020406080
100
0 5 10 15 20 25
Manure 12.4 Mg/ha + w ater seals - a
020406080
100
0 5 10 15 20 25
Dep
th (
cm)
Manure 12.4 Mg/ha + water seals - b
020406080
100
0 5 10 15 20 25
Manure 24.7 Mg/ha - a
0
20
40
60
80
100
0 5 10 15 20 25
Dep
th (
cm)
Manure 24.7 Mg/ha - b
020406080
100
0 5 10 15 20 25
92
3.6.4 Soil Residual Fumigant
Residual fumigants extracted from soil samples at the end of the trial are given in Figure 3-
26. The amount of residual fumigants in the soil (liquid + solid phase) followed similar
trends as the soil water content (Fig. 3-27), i.e., water seal treatments and the HDPE tarped
treatments had relatively higher fumigant concentrations especially in the surface soils
compared to the control and the two manure amendment treatments. Increasing soil water
content increases the total portion of fumigants in the aqueous phase compared to the vapor
phase. The highest residual fumigant concentrations and the greatest differences among the
treatments were observed in the top 30 cm surface soils. The higher residual fumigant
concentrations in the water treatments compared to other treatments partially support the
continuous emissions observed from these treatments throughout the monitoring period
(Figure 3-23). The average concentrations in the soil profiles were analyzed statistically. The
manure + HDPE and the two water seal treatments had significantly higher concentrations
(ranging from 1.1 to 1.2 mg kg-1) than the control and the two rates of manure treatment
(ranging from 0.2 to 0.3 mg kg-1). The data indicate again that water seals and the manure
amendment under HDPE tarp could result in longer residence time of fumigants in the soil.
Residual CP concentrations in the soil were extremely low (<0.02 mg kg-1) for all treatments
due to much faster dissipation or degradation rates compared to 1,3-D.
3.6.5 Soil Moisture and Temperature
Soil water content measured at the end of the trial is shown in Figure 3-27. Irrigation
increased soil water content mostly in the surface 20 cm of soil. Water seal treatments (with
or without manure amendment) resulted in significantly higher (α=0.05) surface (0-20 cm)
soil water content (12.2-12.7%, v/v) than the control and manure amendment treatments (7.8-
9.2, v/v). The manure + HDPE treatment resulted in an average soil water content of 9.2%
(v/v), which is not significantly different from any other treatments. Prior to fumigation, soil
water content of the surface soils averaged 12% (v/v) and it decreased about 3-4% from
evaporation loss and seepage when no additional irrigation or tarping was applied. The
additional irrigation maintained higher soil water content in surface soils which reduced
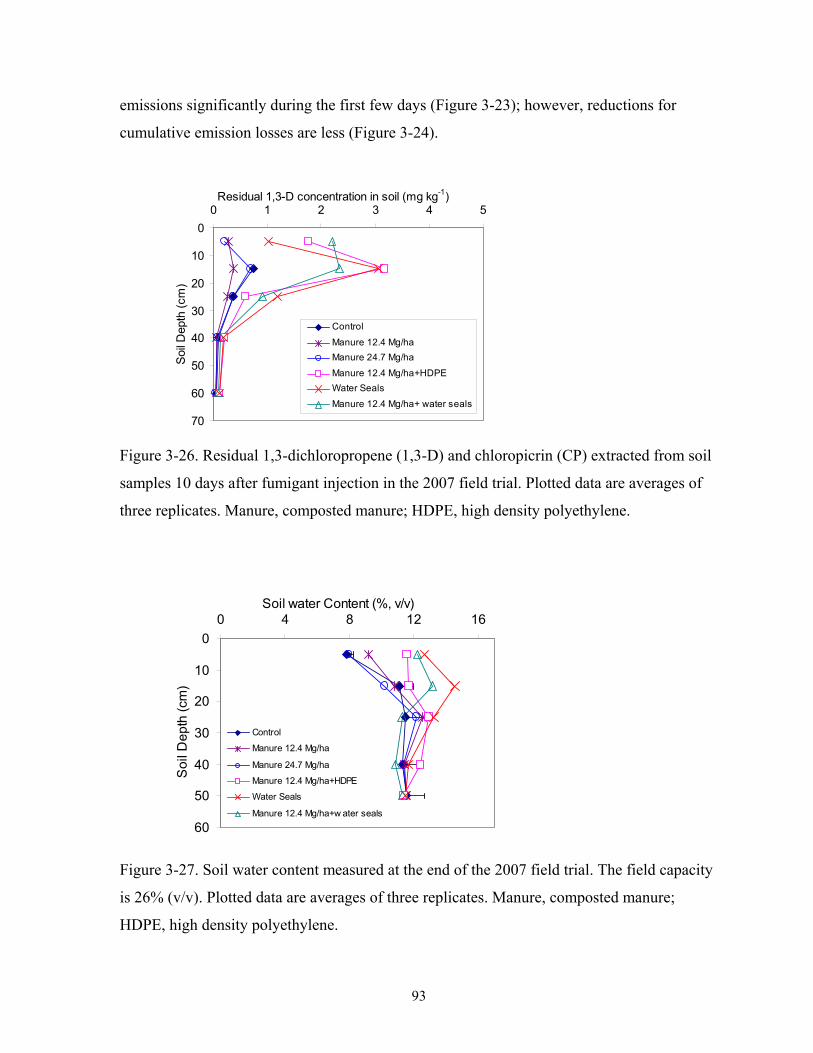
93
emissions significantly during the first few days (Figure 3-23); however, reductions for
cumulative emission losses are less (Figure 3-24).
Residual 1,3-D concentration in soil (mg kg-1)
0
10
20
30
40
50
60
70
0 1 2 3 4 5
Soi
l Dep
th (
cm)
Control
Manure 12.4 Mg/ha
Manure 24.7 Mg/ha
Manure 12.4 Mg/ha+HDPE
Water Seals
Manure 12.4 Mg/ha+ water seals
Figure 3-26. Residual 1,3-dichloropropene (1,3-D) and chloropicrin (CP) extracted from soil
samples 10 days after fumigant injection in the 2007 field trial. Plotted data are averages of
three replicates. Manure, composted manure; HDPE, high density polyethylene.
Soil water Content (%, v/v)
0
10
20
30
40
50
60
0 4 8 12 16
So
il D
ep
th (
cm)
Control
Manure 12.4 Mg/ha
Manure 24.7 Mg/ha
Manure 12.4 Mg/ha+HDPE
Water Seals
Manure 12.4 Mg/ha+w ater seals
Figure 3-27. Soil water content measured at the end of the 2007 field trial. The field capacity
is 26% (v/v). Plotted data are averages of three replicates. Manure, composted manure;
HDPE, high density polyethylene.
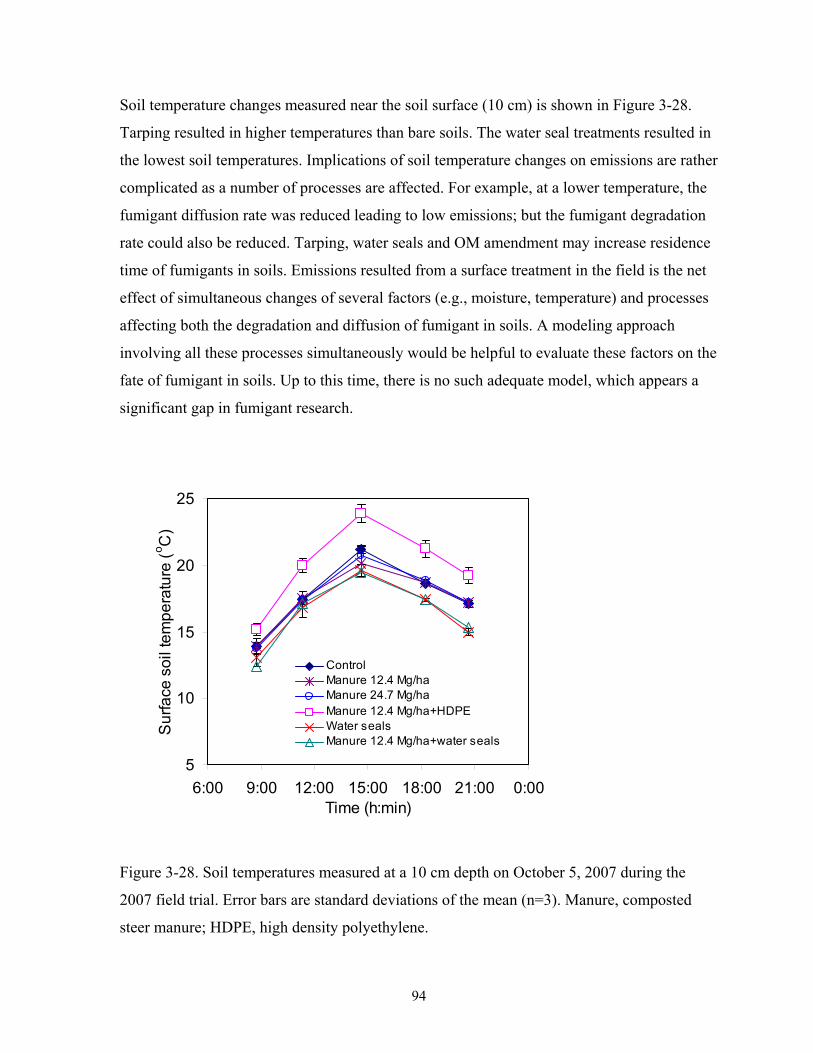
94
Soil temperature changes measured near the soil surface (10 cm) is shown in Figure 3-28.
Tarping resulted in higher temperatures than bare soils. The water seal treatments resulted in
the lowest soil temperatures. Implications of soil temperature changes on emissions are rather
complicated as a number of processes are affected. For example, at a lower temperature, the
fumigant diffusion rate was reduced leading to low emissions; but the fumigant degradation
rate could also be reduced. Tarping, water seals and OM amendment may increase residence
time of fumigants in soils. Emissions resulted from a surface treatment in the field is the net
effect of simultaneous changes of several factors (e.g., moisture, temperature) and processes
affecting both the degradation and diffusion of fumigant in soils. A modeling approach
involving all these processes simultaneously would be helpful to evaluate these factors on the
fate of fumigant in soils. Up to this time, there is no such adequate model, which appears a
significant gap in fumigant research.
5
10
15
20
25
6:00 9:00 12:00 15:00 18:00 21:00 0:00Time (h:min)
Su
rfa
ce s
oil
tem
pe
ratu
re (
o C)
ControlManure 12.4 Mg/haManure 24.7 Mg/haManure 12.4 Mg/ha+HDPEWater sealsManure 12.4 Mg/ha+water seals
Figure 3-28. Soil temperatures measured at a 10 cm depth on October 5, 2007 during the
2007 field trial. Error bars are standard deviations of the mean (n=3). Manure, composted
steer manure; HDPE, high density polyethylene.
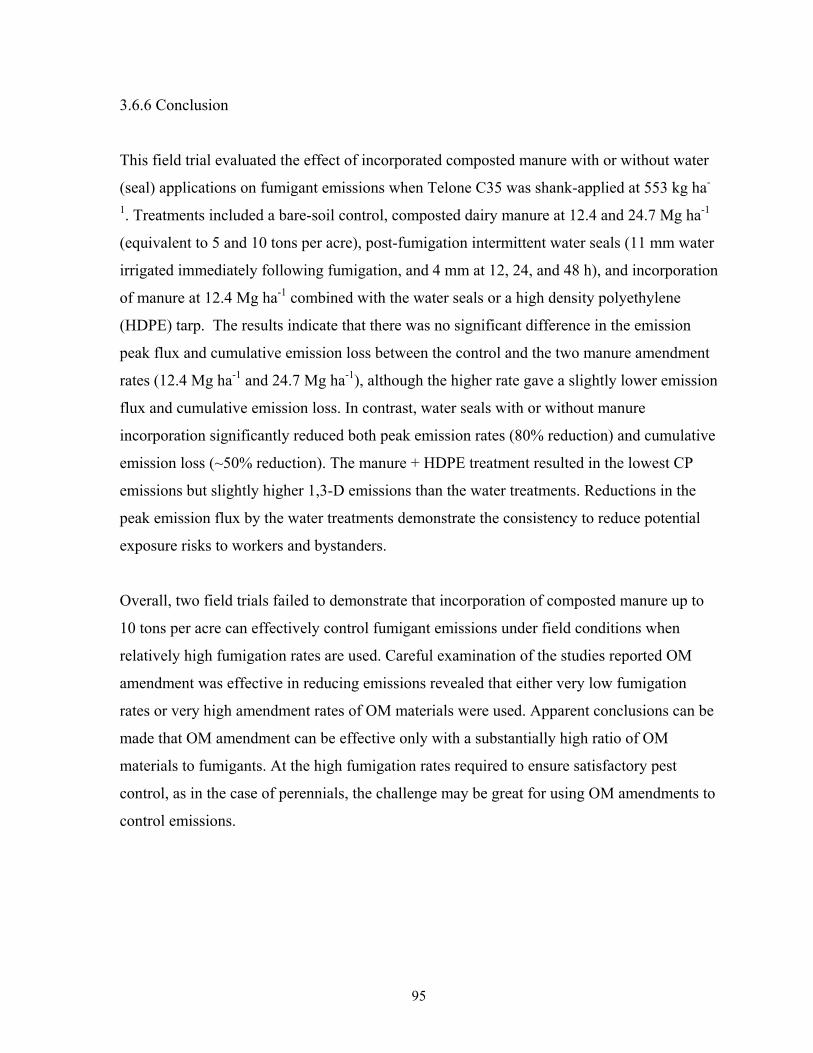
95
3.6.6 Conclusion
This field trial evaluated the effect of incorporated composted manure with or without water
(seal) applications on fumigant emissions when Telone C35 was shank-applied at 553 kg ha-
1. Treatments included a bare-soil control, composted dairy manure at 12.4 and 24.7 Mg ha-1
(equivalent to 5 and 10 tons per acre), post-fumigation intermittent water seals (11 mm water
irrigated immediately following fumigation, and 4 mm at 12, 24, and 48 h), and incorporation
of manure at 12.4 Mg ha-1 combined with the water seals or a high density polyethylene
(HDPE) tarp. The results indicate that there was no significant difference in the emission
peak flux and cumulative emission loss between the control and the two manure amendment
rates (12.4 Mg ha-1 and 24.7 Mg ha-1), although the higher rate gave a slightly lower emission
flux and cumulative emission loss. In contrast, water seals with or without manure
incorporation significantly reduced both peak emission rates (80% reduction) and cumulative
emission loss (~50% reduction). The manure + HDPE treatment resulted in the lowest CP
emissions but slightly higher 1,3-D emissions than the water treatments. Reductions in the
peak emission flux by the water treatments demonstrate the consistency to reduce potential
exposure risks to workers and bystanders.
Overall, two field trials failed to demonstrate that incorporation of composted manure up to
10 tons per acre can effectively control fumigant emissions under field conditions when
relatively high fumigation rates are used. Careful examination of the studies reported OM
amendment was effective in reducing emissions revealed that either very low fumigation
rates or very high amendment rates of OM materials were used. Apparent conclusions can be
made that OM amendment can be effective only with a substantially high ratio of OM
materials to fumigants. At the high fumigation rates required to ensure satisfactory pest
control, as in the case of perennials, the challenge may be great for using OM amendments to
control emissions.

96
4.0 SUMMARY
Since the phase-out of MeBr, 1,3-D and CP have been increasingly used as alternative
chemicals in pre-plant soil fumigation for several important commodities in California.
Stringent environmental regulations are being developed to reduce emissions of soil
fumigants to reduce the potential exposure risks and VOC emissions particularly in ozone-
non-attainment areas. The goal of this project was to develop effective and feasible field
management practices to reduce fumigant emissions from field fumigation while ensuring
good soil pest control. The intent was to assist commodities that have been relying on MeBr
soil fumigation to transition to alternatives. Scenarios for perennials are targeted for testing
because high fumigation rates are required for satisfactory control of the soil pests. Open-
field perennial nurseries must deliver parasitic nematode-free crops under the CDFA’s
Nursery Stock Nematode Control Program. Effective emission control methods for high
fumigation rates should be applicable to most other scenarios.
The project utilized an approach of both field and laboratory tests. Three field trials and three
lab experiments were carried out to evaluate the effect of fumigation methods and various
surface treatments on emission reductions from soil fumigation. Each trial or experiment had
specific objectives (Tables 2-1 and 2-2). A treatment was sometimes repeated between trials
to increase the confidence in the conclusions. Treatments included application method (shank
vs. subsurface drip), water treatments (pre-fumigation irrigation and post-fumigation water
seals), tarping with the standard HDPE or low permeable VIF, and surface soil amendment
with chemicals (thiosulfate: ATS or KTS) and organic materials (composted manure).
Emissions and fumigant concentration changes in the soil-gas phase (to assess the potential
effect on pest control) were monitored. Residual fumigant was determined at the end of each
experiment using a mass balance approach to evaluate the fate of fumigants in soil and
implications on fumigation management.
The three laboratory soil column experiments were designed to test variables under closely-
controlled study conditions, which is often difficult to achieve in the field. The results,
however, may not represent what actually would occur for the same treatment under field

97
conditions (e.g., total emission loss and soil-gas distribution patterns) because of the
limitations of the columns in addition to the use of disturbed soils. Caution should be taken
when extrapolating laboratory data to the field environment. The laboratory tests were
utilized for supporting or directing further field tests.
The first soil column experiment determined the effectiveness of ATS and surface soil
amendments with composted steer manure amendments or in combination with a small
amount of water application (9 mm) or HDPE tarp on reducing the emissions of 1,3-D. ATS
amendments at 1:1 and 2:1 molar ratio (ATS:fumigant), manure at 5% (w/w), and HDPE tarp
over 1:1 ATS and the manure amendment were tested. Cumulative 1,3-D emission losses
over two weeks were greatest for the control (51% of total applied) and lowest in the HDPE
tarp over ATS (1:1 ATS:fumigant molar ratio) and manure treatments (16-24%). The 2:1
ATS and manure treatment alone gave relatively high emissions (29−39%). The 1:1 ATS and
one-time water seal alone gave emissions (40-43%), not much less than the control. The
manure treatment was shown to be effective in reducing emissions in this experiment, which
is in agreement with some results reported in the literature.
The second soil column experiment evaluated the effectiveness of intermittent water seals on
the emission reduction of cis-1,3-D from three different soil textures (Atwater loamy sand,
Hanford sandy loam, and Madera loam). When no water seals were applied, fine-textured
soils gave lower emissions than coarse-textured soils due to different soil OM and clay
content. With sufficient amounts of water applied, water seals were shown to be effective in
reducing emissions from all three soils, while with lower amounts of water, water seals did
not reduce emissions in the sandy soil. The results indicate that intermittent water seals can
be used to reduce emissions for a relatively wide range of soil textures.
The third soil column experiment evaluated specifically how different soil moisture
conditions affect fumigant emissions in an effort to determine an optimum range of soil water
content to reduce emissions while not reducing fumigant concentrations or distribution in the
soil that may impact pest control. Soil water content levels from 30% up to 100% of field
capacity were tested. As soil water content increased, fumigant peak emission flux was

98
significantly reduced and its occurrence time was delayed. Similar to water seals, by
increasing soil water content, the emission reduction effect on the peak flux is more profound
than on the cumulative loss. This might be partially due to the column effect in this test. It is
expected that the soil moisture effect on the emission reduction would be greater under field
conditions if the same conditions as in the columns can be achieved. Increasing the soil water
content within the studied range did not reduce fumigant concentrations in the soil-gas phase;
on the contrary, increased fumigant concentrations were observed because of the reduced
emissions and increased fumigant retention in the soil. The column test results for specific
moisture conditions should be validated by further field tests as field/environmental
conditions vary, the proper range of soil water content for providing the anticipated benefits
for different soil types are expected to vary. Maintaining a relatively high soil moisture
condition at the surface or above the fumigant injection depth provides the benefit of
reducing emissions and retaining fumigants in soil by reducing diffusion of fumigants to soil
surface.
The 2005 field trial investigated the effects of the fumigation method (shank-injection vs.
subsurface drip-application) and selected surface treatments (irrigation and plastic tarps) on
the emission reduction of 1,3-D and CP from shank-injection of Telone® C-35 and drip-
application of InLine®. With the same surface treatment, the subsurface drip-application gave
generally lower emissions compared to the shank-injection. Over a 2-wk monitoring period,
the highest emission loss was from the bare soil (36% 1,3-D and 30% CP) and HDPE tarp
(43% 1,3-D and 17% CP) from shank-injection. Pre-irrigation (with 40-mm of water
application 4 days prior to fumigation) and VIF tarp over shank-injection had similarly low
emission losses (19% 1,3-D, and 8-9% CP). The HDPE tarp and water applications (seals)
before and after the subsurface drip-application resulted in the lowest emission losses (12-
13% 1,3-D, and 2-3% CP). All fumigation treatments provided 100% efficacy to control
citrus nematodes in bags buried from 30 to 90 cm below the soil surface. This field trial
confirmed the findings from the column experiment that irrigation treatments (pre-irrigation
and drip-application) used to increase soil water content can effectively control emissions of
1,3-D and CP under field conditions. Using water costs much less compared to plastic tarps,

99
and these treatments provide options for orchards with low-profit margins, especially those
with portable irrigation systems.
The 2006 field trial evaluated several surface treatments (pre-irrigation, post-fumigation
water seals, KTS in water seals or under HDPE tarp, manure plus HDPE tarp) to reduce
emissions of 1,3-D and CP from shank-injection of Telone C35. The KTS treatments were
found extremely effective in reducing emissions; however, the KTS application resulted in a
reddish-orange soil color and an unpleasant odor that lasted for a few months. These
reactions may not be desirable for subsequent planting, which has not been investigated
carefully. The pre-irrigation (34 mm of water application 4 days prior to fumigation) in this
trial reduced emissions more than the post-application intermittent water seals (13 mm water
immediately following fumigation and 4 mm water at 12, 24, and 48 h). Again the pre-
irrigation did not reduce fumigant concentrations in the soil-gas phase compared to other
treatments. This further confirmed the previous laboratory and field findings on the
effectiveness of adequate soil moisture for emission reductions. An application of composted
manure at 12.4 Mg ha-1 (~ 5 tons per acre) spread over the soil surface followed by the
HDPE tarp did not reduce 1,3-D emissions in this trial.
The 2007 field trial focused on the evaluation of manure incorporation into surface soils with
or without water seals on fumigant emissions from shank injection of Telone C35.
Composted dairy manure was tested at 12.4 and 24.7 Mg ha-1 (equivalent to 5 and 10 tons per
acre, respectively). The results indicate that the manure applications did not reduce emissions
(neither peak flux nor cumulative loss). Water seals (11 mm water immediately following
fumigation and 4 mm water at 12, 24, and 48 h), however, with or without manure
incorporation reduced both peak emission flux (80% reduction) and cumulative emission loss
(~50% reduction). The treatment with the incorporated manure under the HDPE in this trial
gave the lowest CP emissions but slightly lower 1,3-D emissions than the water seal
treatments. The difference is that the soil in the 2007 field trial contained a higher water
content than the 2006 field trial at the time of fumigation.
100
Summarizing the results from the laboratory experiments and field trials can lead to a few
conclusions regarding field practices that can be utilized to control emissions in soil
fumigation. Subsurface drip-application tends to have lower emissions than shank-injection
because of the reduced mobility of fumigants to the soil surface due to increased soil water
content. Once the fumigation method is set, surface sealing/treatments have a profound effect
on emissions. The following are primarily based on tests from broadcast shank applications.
Pre-irrigation to achieve proper soil water content (at the minimum of the label requirements
by using the hand-feeling method) at the time of soil fumigation is critical to ensure
emissions are as low as possible. The higher the soil water content, the lower the emissions
will be. However, excessive amounts of water are not recommended as reduced fumigant
diffusion through the soil may negatively impact pest control. Laboratory data showed that
increasing soil water content to field capacity in a sandy loam soil did not reduce fumigant
concentrations in soil columns. Field data indicate that irrigation with the amount of water
that could achieve field capacity in the top one foot four days prior to fumigation can provide
substantial emission reduction in a sandy loam soil. Pre-irrigation can be achieved either
from irrigation or by taking advantage of precipitation when applicable. Post-fumigation
intermittent water seals to maintain the surface 4-6 inch soil with a high water content have
been consistently observed to reduce 1,3-D and CP peak emission flux, especially during the
period of water applications, although cumulative emission loss was less effectively reduced.
Reducing the peak emission flux can reduce the potential exposure risks to workers and by-
standers. Generally speaking, irrigation is less costly and no material disposal is required
compared to using plastic tarps. Plastic tarps with the standard HDPE alone can not reduce
emissions of 1,3-D in relatively dry soils but can reduce emissions to some extent with moist
soils and/or at low temperatures. Total emissions can be reduced up to 50% of total applied
1,3-D using the irrigation treatments or the standard tarp.
Although surface soil amendment with composted manure was shown to be effective in
reducing emissions in laboratory studies, amendment rates up to 10 tons per acre did not
show emission reduction for the high fumigation rates tested (or the maximum allowable rate
in CA) in the field unless water seals were applied at the same time. ATS or KTS treatment,
either with water seals or applied under the HDPE tarp, have consistently shown significant
101
emission reduction (up to 50% emission reduction) in both peak flux and cumulative loss.
The observed soil color changes and odor may prevent its adoption on a large field scale until
these potential problems are addressed. The low permeable film, VIF, is the most effective
emission reduction technique (up to 90% emission reduction) as long as the tarp can be
installed successfully in the field. However, the VIF tarp technology is the most costly; thus,
it may be feasible only for commodities with high-profit margins (e.g., almonds/nut trees,
nurseries).
Some questions remain regarding feasible and economical field management practices to
effectively minimize fumigant emissions. 1) Two field trials failed to prove that the normal
manure incorporation rate used by growers can effectively reduce soil fumigant emissions
when high fumigation rates that ensure satisfactory pest control are used. The effectiveness
of OM in reducing emissions reported in the literature was tested at either a much lower
fumigation rate or at an exceptionally high OM application rate. These options may apply to
annual field or vegetable crops; but for perennials, the drawbacks are either with
unsatisfactory pest control or associated with high costs, unless OM materials can be
obtained for free. The effective OM rate or the ratio of OM to fumigant and the source
materials for reducing fumigant emissions need to be further clarified in order to conclude
whether OM amendment can be managed as an effective practice to control fumigant
emissions. 2) Thiosulfate (ATS or KTS) has been tested at high ratios (up to 4:1 molar ratio)
in all studies including those reported in the literature. At the 1:1 ATS:fumigant molar ratio,
the amount of the N nutrient input is several times that of most crops’ need (Gao et al., in
press). In the case when KTS is used (N is excluded), the observed soil color change and
odor in the field may also be due to excessive amounts of thiosulfate applied. Strategies with
low application amounts of ATS or KTS to reduce emissions have not been investigated in
the field at the high fumigation rates. It is possible that the combination of low amounts of
KTS application in a soil with adequate soil water content and the standard HDPE tarp may
achieve significant emission reduction based on what we have learnt from the field trials and
lab experiments. 3) Although pre-irrigation has been confirmed to reduce emissions with the
increase in soil water content, the amount of water in pre-irrigation to maximize this effect
has not been fully determined for different seasons and especially for different soil types. 4)

102
Concerns of tarp damage during installation of VIF continue to remain although the low
permeable tarps can substantially reduce emission as well as improve efficacy because of
their capability to retain fumigants under the tarp. Other treatments (irrigation, soil
amendment) that reduce emissions are based on either reducing fumigant diffusion/transport
or increasing degradation, which may lead to a negative impact on efficacy. The low
permeable film has the potential to allow reduced application rates that may compensate for
some of the high costs associated with the use of the material. This type of film, however,
was reported to have potential problems with being damaged during installation. Practical
materials and application methods need to be worked out in this regard. A new film (so-
called totally impermeable film or TIF) has emerged recently for testing and easy field
installation has been claimed. Choices of emission reduction techniques to be made by
various commodities should consider the practicality for their production system,
effectiveness on emission reduction, potential impact on pest control, and affordability.
5.0 REFERENCES
Ajwa, H, W.J. Ntow, R. Qin, and S. Gao. 2010. Chapter 9. Properties of soil fumigants and
their fate in the environment. In Robert Krieger (ed.) Hayes’ Handbook of Pesticide
Toxicology. Elsevier Inc. (in press)
Ajwa, H.A., and T. Trout. 2004. Drip application of alternative fumigants to methyl bromide
for strawberry production. HortScience 39:1707–1715.
Ajwa, H.A., S. Klose, D. Neilson, A. Minuto, M.L. Gullino, F. Lamberti, and J.M. Lopez-
Aranda. 2003. Alternatives to methyl bromide in strawberry production in the United
States of America and the Mediterranean Region. Phytopathol. Mediterr. 42:220–244.
Ashworth, D.J., and S.R. Yates. 2007. Surface irrigation reduces the emission of volatile 1,3-
dichloropropene from agricultural soils. Environ. Sci. Technol. 41:2231-2236.
Browne, G., J. Connell, H. Becherer, S. McLaughlin, S. Schneider, R. Lee, and E. Hosoda.
2003. Evaluation of rootstocks and fumigants for control of almond replant disease. p.11
(1-2) In Proc. Annual Int. Res. Conf. on MeBr Alternatives and Emissions Reductions,
Nov. 3-6, 2003, San Diego, CA. Available at:

103
http://www.mbao.org/2003/011%20brownegrootstocks%20fumigants%20and%20almon
d%20rd%20fin%20browne.pdf (verified 31 March 2010).
California Department of Pesticide Regulation (CDPR). 2006. Pesticide air initiative:
Strategy to reduce toxic and volatile organic compound emissions from agricultural and
commercial structural pesticides (concept paper). CDPR, Sacramento, CA. Available at
http://www.cdpr.ca.gov/docs/empm/airinit/airinit.htm (verified 31 March 2010)..
California Department of Food and Agriculture (CDFA). 2008. Nursery Inspection
Procedures Manual (NIPM) Online. CDFA, Sacramento, CA. Availabel at:
http://www.cdfa.ca.gov/phpps/pe/Nursery/NIPM.html (verified 31 March 2010).
CDPR. 2007. Pesticide Use Reporting - 2006 Summary Data. CDPR, Sacramento, CA.
Available at: http://www.cdpr.ca.gov/docs/pur/pur06rep/06_pur.htm (verified 31 March
2010).
CDPR. 2007a. Plan for reducing emissions of volatile organic compounds from agricultural
and commercial structural pesticides. CDPR, Sacramento, CA. Available at:
http://www.cdpr.ca.gov/docs/emon/vocs/vocproj/vocplan070523.pdf (verified 31 March
2010).
CDPR. 2007b. Rule making package: text of proposed regulations. CDPR, Sacramento, CA.
Available at: http://www.cdpr.ca.gov/docs/legbills/rulepkgs/07-002/text.pdf (verified 31
March 2010).
CDPR. 2009. Volatile Organic Compound (VOC) Emissions from Pesticides. Available
online at http://www.cdpr.ca.gov/docs/emon/vocs/vocproj/vocmenu.htm (verified 31
March 2010).
Dungan, R.S., J. Gan, and S.R. Yates. 2001. Effect of temperature, organic amendment rate
and moisture content on the degradation of 1,3-dichloropropene in soil. Pest Manag. Sci.
57:1107–1113.
Dungan, R.S., J. Gan, and S.R. Yates. 2003. Accelerated degradation of methyl
isothiocyanate in soil. Water Air Soil Pollut. 142:299–310.
Dungan, R.S., S. Papiernik, and S.R. Yates. 2005. Use of composted animal manures to
reduce 1,3-dichloropropene emissions. J. Environ. Sci. Health. B. 40:355-362.

104
Gan, J., J.O. Becker, F.F. Ernst, C. Hutchinson, J.A. Knuteson, and S.R. Yates. 2000. Surface
application of ammonium thiosulfate fertilizer to reduce volatilization of 1,3-
dichloropropene from soil. Pest. Manag. Sci. 56:264-270.
Gan, J., S.R Yates, M.A. Anderson, W.F. Spencer, F.F. Ernst, and M.V. Yates. 1994. Effect
of soil properties on degradation and sorption of methyl bromide in soil. Chemosphere
29:2685-2700.
Gan, J., S.R. Yates, D. Wang, and F.F. Ernst. 1998c. Effect of application methods on 1,3-D
volatilization from soil under controlled conditions. J. Environ. Qual. 27:432–438.
Gan, J., S.R. Yates, D. Wang, W.F. Spencer. 1996. Effect of soil factors on methyl bromide
volatilization after soil application. Environ. Sci. Technol. 30:1629-1636.
Gan, J., S.R. Yates, F.F. Ernst, and W.A. Jury. 2000b. Degradation and volatilization of the
fumigant chloropicrin after soil treatment. J. Environ. Qual. 29:1391–1397.
Gan, J., S.R. Yates, J.O. Becker, and D. Wang. 1998a. Surface amendment of fertilizer
ammonium thiosulfate to reduce methyl bromide emission from soil. Environ. Sci.
Technol. 32:2438–2441.
Gan, J., S.R. Yates, S. Papiernik, and D. Crowley. 1998b. Application of organic
amendments to reduce volatile pesticide emissions from soil. Environ. Sci. Technol.
32:3094–3098.
Gao, F., S.R. Yates, M.V. Yates, J. Gan, and F.F. Ernst. 1997. Design, fabrication, and
application of a dynamic chamber for measuring gas emissions from soil. Environ. Sci.
Technol. 31:148–153.
Gao, S., A. Hendratna, R. Shenk, and T. Pflaum. 2006. Trapping efficiency of cis-1,3-
dichloropropene by XAD-4 sorbent tubes for emission studies. p. 121(1–4) In Proc. Ann.
Int. Res. Conf. on MeBr Alternatives and Emission Reductions. Orlando, FL, Nov. 6–9,
2006. Available at: http://www.mbao.org/2006/06Proceedings/mbrpro06.html (verified
31 March 2010).
Gao, S. B.H. Hanson, D. Wang, G. Brown, R. Qin, H. Ajwa, S.R. Yates. 2010. Methods for
minimizing emissions from pre-plant soil fumigation. Calif. Agric. (in press).
Gao, S., and T.J. Trout. 2006. Using surface water application to reduce 1,3-dichloropropene
emission from soil fumigation. J. Environ. Qual. 35:1040-1048.

105
Gao, S., and T.J. Trout. 2007. Surface seals reduce 1,3-dichloropropene and chloropicrin
emissions in field tests. J. Environ. Qual. 36:110-119.
Gao, S., D. Wang, T. Pflaum, R. Qin, B. Hanson, G. Browne, H. Ajwa, and S. Yates. 2008a.
Dynamic flux chamber systems for fumigant emission measurements. p. 22(1-4) In Proc.
Ann. Int. Res. Conf. on MeBr Alternatives and Emissions Reductions, 11-14 November,
2008, Orlando, FL. Available at: http://www.mbao.org/2008/Proceedings/mbrpro08.html
(verified 31 March 2010).
Gao, S., R. Qin, B.D. Hanson, N. Tharayil, T.J. Trout, D. Wang, and J. Gerik. 2009. Effects
of manure and water applications on 1,3-dichloropropene and chloropicrin emission in a
field trial. J. Agric. Food Chem. 57:5428−5434.
Gao, S., R. Qin, J.A. McDonald, B.D. Hanson, and T.J. Trout. 2008b. Field tests of surface
seals and soil treatments to reduce fumigant emissions from shank-injection of Telone
C35. Sci. Total Environ. 405:206-214.
Gao, S., T.J. Trout, and S. Schneider. 2008c. Evaluation of fumigation and surface seal
methods on fumigant emissions in an orchard replant field. J. Environ. Qual. 37:369-377.
Gao, S. and D. Wang. Vapor flux measurements – chamber methods. Chapter 9 In S.
Saponaro, E. Sezenna, L. Bonomo (ed.) Vapor emission to outdoor air and enclosed
spaces for human health risk assessment: site characterization, monitoring and
modeling”. Nova Science Publishers, Inc., Hauppauge, NY. (in press)
Guo, M., S.K. Papiernik, W. Zheng, S.R. Yates. 2004a. Effect of environmental factors on
1,3-dichloropropene hydrolysis in water and soil. J. Environ. Qual. 33:612-618.
Guo, M., S.K. Papiernik, W. Zheng, S.R. Yates. 2003. Formation and extraction of persistent
fumigant residues in soils. Environ. Sci. Technol. 37:1844-1849.
Hanson, B.D., S. Gao, A. Shrestha, J. Gerik, and S. Schneider. 2007. Effects of surface seals
on pest control efficacy with 1,3-dichloropropene / chloropicrin. p. 43(1-4) In Proc. Ann.
Int. Res. Conf. on MeBr Alternatives and Emissions Reductions, 29 October-1
November, 2007, San Diego, CA. Available at:
http://www.mbao.org/2007/Proceedings/mbrpro07.html (verified 31 March 2010).
Jin, Y., and W.A. Jury. 1995. Methyl bromide diffusion and emission through soil columns
under various management techniques. J. Environ. Qual. 24:1002-1009.
106
Jury, W.A., W.F., Spencer, and W.J., Farmer. 1983. Behavior assessment model for trace
organics in soil: I. Model description. J. Environ. Qual. 12:558-564.
Kim, J.H., J.Y. Gan, W.J. Farmer, S.R. Yates, S.K. Papiernik, R.S. Dungan. 2003. Organic
matter effects on phase partition of 1,3-dichloropropene in soil. J. Agric. Food Chem.
51:165-169.
McDonald, J.A., S. Gao, R. Qin, T. J. Trout, and B.D. Hanson. 2008. The effect of chemical
and manure amendment with water application and tarp on 1,3-dichloropropene
emissions from soil. Environ. Sci. Technol. 42:398–402.
McDonald, J.A., S. Gao, R. Qin, B.D. Hanson, T.J. Trout, and D. Wang. 2009. Effect of
water seal on reducing 1,3-dichloropropene emissions from different soil textures. J.
Environ. Qual. 38:712-718.
McKenry, M.V., and I.J. Thomason. 1974. 1,3-dichloropropene and 1,2-dibromoethane
compounds: I. Movement and fate as affected by various conditions in several soils.
Hilgardia 42:383-421.
Natural Resources Conservation Service (NRCS). 2004. Soil series classification database.
USDA-NRCS, Lincoln, NE. Available at:
http://soils.usda.gov/technical/classification/scfile/index.html (verified 31 March 2010).
Noling, J.W. 2002. Reducing methyl bromide field application rates with plastic mulch
technology. Publication ENY-046, Institute of Food and Agricultural Sciences,
University of Florida. Available at: http://edis.ifas.ufl.edu/IN403 (verified 31 March
2010).
Noling, J.W., and D. Botts. 2009. Transitioning to methyl bromide alternatives: A current
U.S. assessment. P. 2(1-5) In Proc. Ann. Int. Res. Conf. on MeBr Alternatives and
Emissions Reductions, 10-13 November, 2009, San Diego, California, USA. Available
at:
http://mbao.org/2009/Proceedings/002NolingJBottsDMBAO2009TransitioningtoMethyl
BromideAlternatives.pdf (verified 31 March 2010).
Papiernik, S.K., F.F. Ernst, R.S. Dungan, W. Zheng, M. Guo, and S.R. Yates. 2004. Chapter
13. Remediation of halogenated fumigant compounds in the root zone by subsurface
application of ammonium thiosulfate. p. 169-179 In J. Gan et al. (ed.). Pesticide
decontamination and detoxification. American Chemical Society, Washington D.C.
107
Papiernik, S.K., and S.R. Yates. 2002. Effect of environmental conditions on the
permeability of high density polyethylene film to fumigant vapors. Environ. Sci. Technol.
36:1833–1838.
Qin R., S. Gao, B.D. Hanson, J.A. McDonald, T.J. Trout, and H. Ajwa. 2007. Effect of drip
application of ammonium thiosulfate on fumigant degradation in soil columns. J. Agric.
Food Chem. 55: 8193–8199.
Qin, R., S. Gao, D. Wang, B.D. Hanson, T.J. Trout, and H. Ajwa. 2009. Relative effect of
soil moisture on emissions and distribution of 1,3-dichloropropene and chloropicrin in
soil columns. Atmos. Environ. 43:2449–2455.
Reichman, R., and D.E. Rolston. 2002. Design and Performance of a Dynamic Gas Flux
Chamber. J. Environ. Qual. 31:1774–1781.
Segawa, R. 2008. California regulatory issues for fumigants. Presentation at Ann. Int. Res.
Conf. on MeBr Alternatives and Emissions Reductions, 11-14 November, 2008, Orlando,
FL. Available at: http://www.mbao.org/2008/004segawa.pdf.
Shinde, D., A.G. Hornsby, R.S. Mansell, and M.R. Savabi. 2000. A simulation model for fate
and transport of methyl bromide during fumigation in plastic-mulched vegetable soil
beds. Pest Manag. Sci. 56:899-908.
Sullivan, D.A., M.T. Holdsworth, and D.J. Hlinka. 2004. Control of off-gassing rates of
methyl isothiocyanate from the application of metam-sodium by chemigation and shank
injection. Atmos. Environ. 38:2457-2470.
Thomas, J.E., L.H. Allen Jr., L.A. McCormack, J.C. Vu, D.W. Dickson, and L.T. Ou. 2003.
Diffusion and emission of 1,3-dichloropropene in Florida sandy soil in microplots
affected by soil moisture, organic matter, and plastic film. Pest. Manag. Sci. 60:390–398.
Thomas, J.E., L.T. Ou, L.H. Allen, Jr., L.A. McCormack, J.C. Vu, and D.W. Dickson. 2006.
Henry’s law constants and mass transfer coefficients for methyl bromide and 1,3-
dichloropropene applied to Florida sandy field soil. Chemosphere 62:980-988.
Thomas, J.E., L.T. Ou, L.H. Allen, L.A. McCormack, J.C. Vu, and D.W. Dickson. 2004.
Persistence, distribution, and emission of Telone C35 injected into a Florida sandy soil as
affected by moisture, organic matter, and plastic film cover. J. Environ. Sci. Heal. B.
39:505-516.

108
Trout, T. 2003. Impact of Township caps on the use of Telone in California. p. 109(1–8) In
Proc. Ann. Intl. Res. Conf. on Methyl Bromide Alternatives and Emissions Reductions,
3-6 November, 2003, San Diego, CA. Available at:
http://www.mbao.org/2003/mbrpro03.html (verified 31 March 2010).
Trout T. 2006. Fumigant use in California – Response to the phase-out. p. 18(1–6). In
Proceedings of Annual International Research Conference on Methyl Bromide
Alternatives and Emissions Reductions, Orlando, FL, Nov. 6–9, 2006. Available at:
http://www.mbao.org/2006/06Proceedings/018TroutTmb-fumuse-06.pdf. (verified 31
March 2010)
Trout, T., S. Schneider, H. Aiwa, and J. Gartung. 2003. Fumigation and fallowing effects on
replant problems in California peach. p. 55(1–5). In Proc. Ann. Int. Res. Conf. on MeBr
Alternatives and Emissions Reductions, 3 – 6 Nov., 2003, San Diego, CA. Available at:
http://www.mbao.org/2003/mbrpro03.html (verified 31 March 2010).
U.S. Environmental Protection Agency (USEPA). 1994. Protection of stratosphere ozone.
USEPA., Washington D.C. Available at: http://www.epa.gov/fedrgstr/EPA-
AIR/1994/October/Day-14/pr-47.html (verified 31 March 2010).
USEPA. 2009. Implementation of Risk Mitigation Measures for Soil Fumigant Pesticides.
Available at: http://www.epa.gov/oppsrrd1/reregistration/soil_fumigants/#ammendedreds
(verified 31 March 2010).
Wang, D., F.F. Ernst, S.R. Yates. 1999a. Automated sequential sampler for collection of
highly volatile atmospheric contaminants. J. Environ. Qual. 28:345–349.
Wang, D., S.R. Yates, F.F. Ernst, J. Gan, F. Gao, and J.O. Becker. 1997. Methyl bromide
emission reduction with field management practices. Environ. Sci. Technol. 31:3017-
3022.
Wang, D., S.R. Yates, F.F. Ernst, J.A. Knuteson, and G.E. Brown, Jr. 2001. Volatilization of
1,3-dichloropropene under different application methods. Water Air Soil Pollu. 127:109–
123.
Wang, D., S.R. Yates, J. Gan, and J.A. Knuteson. 1999. Atmospheric volatilization of methyl
bromide, 1,3-dichloropropene, and propargyl bromide through two plastic films: transfer
coefficient and temperature effect. Atmos. Environ. 33:401–407.
109
Wang, D., S.W. Fraedrich, J. Juzwik, K. Spokas, Y. Zhang, and W.C. Koskinen. 2006.
Fumigant distribution in forest nursery soils under water seal and plastic film after
application of dazomet, metam-sodium and chloropicrin. Pest Manag. Sci. 62:263–273
Wang, Q., J. Gan, S.K. Papiernik, and S.R. Yates. 2000. Transformation and detoxification
of halogenated fumigants by ammonium thiosulfate. Environ. Sci. Technol. 34: 3717–
3721.
Xu, J.M., J. Gan, S.K. Papiernik, J.O. Becker, and S.R. Yates. 2003. Incorporation of
fumigants into soil organic matter. Environ. Sci. Technol. 37:1288-1291.
Yates, S.R., J. Gan, and S.K. Papiernik. 2003. Environmental fate of methyl bromide as a soil
fumigant. Rev. Environ. Contam. Toxicol. 177:45–122.
Yates, S.R., J. Gan, S.K. Papiernik, R. Dungan, and D. Wang. 2002. Reducing fumigant
emissions after soil application. Phytopathology 92:1344-1348.
Yates, S.R., J. Knuteson, W. Zheng, and Q. Wang. Effect of Organic Material on Field-scale
Emissions of 1,3-Dichloropropene (1,3-D). J. Environ. Qual. (in press).
Zheng W., J. Gan, S.K. Papiernik, and S.R. Yates. 2007. Identification of
volatile/semivolatile products derived from chemical remediation of cis-1,3-
dichloropropene by thiosulfate. Environ. Sci. Technol. 41:6454-6549.
Zheng, W., S.K. Papiernik, M. Guo, and S.R. Yates. 2003. Accelerated degradation of
methyl iodide by agrochemicals. J. Agric. Food Chem. 51:673–679.
Zheng, W., S.R. Yates, S.K. Papiernik, and Q. Wang. 2006. Reducing 1,3-dichloropropene
emissions from soil columns amended with thiourea. Environ. Sci. Technol. 40:2402–
2407.