effectiveness of cover crops to reduce loss of soil
TRANSCRIPT

land
Article
Effectiveness of Cover Crops to Reduce Loss of SoilOrganic Matter in a Rainfed Vineyard
Manuel López-Vicente 1,* , Elena Calvo-Seas 2, Sara Álvarez 3 and Artemi Cerdà 4
1 Team Soil, Water and Land Use, Wageningen Environmental Research, Droevendaalsesteeg 3,6708RC Wageningen, The Netherlands
2 Geographer, Independent Scholar, Casa Calvo, 22144 Bierge (Huesca), Spain; [email protected] Unit of Woody and Horticultural Crops, Technological Agriculture Institute of Castilla y León, ITACyL,
47071 Valladolid, Spain; [email protected] Soil Erosion and Degradation Research Group, Department of Geography, Valencia University,
Blasco Ibàñez 28, 46010 Valencia, Spain; [email protected]* Correspondence: [email protected]
Received: 27 June 2020; Accepted: 14 July 2020; Published: 16 July 2020�����������������
Abstract: Cover crops (CCs) minimize the loss of soil in permanent cropping systems where thesoil is usually bare due to intense tillage or overuse of herbicides. The topsoil, the richer layer insoil organic carbon and organic matter (OM), is affected by water erosion. Nature-based solutionsappear as a suitable option for sustainable farming. In this study, the effectiveness of two years ofCC management to reduce the OM loss is evaluated in a rainfed vineyard in a rolling landscape(Huesca, NE Spain). Two sediment traps collected runoff over 15 months. Topsoil OM contents(1.64% and 1.60%) and sediment/soil OM enrichment ratio (2.61 and 3.07) were similar. However,the average annual rate of OM loss was 3.6 times higher in the plot with lower vegetation cover thanin the plot with CCs (1.29 vs. 0.35 kgOM ha−1 yr−1). The concentration of OMSed showed a negativerelationship with the net soil loss; and significant differences appeared between the OMSed in themonths with low and moderate-to-high ground cover. CCs are an excellent nature-based solution tocontrol the unsustainable soil and OM losses measured in vineyards, which will contribute to achievethe Sustainable Development Goals of the United Nations.
Keywords: cover crop; vineyard; soil erosion; soil organic matter; enrichment ratio; sediment trap;Mediterranean climate
1. Introduction
In 2015, all United Nations Member States adopted the resolution entitled “Transforming OurWorld: The 2030 Agenda for Sustainable Development: [1]. This Agenda encompasses the 17 SustainableDevelopment Goals (SDGs) and 169 targets with global ambitious scale. Land degradation neutrality(LDN) is the concept behind the target 15.3, which is part of the SDG 15 called “Life on Land.”The concept of LDN aims to respond to “the need for urgent action to reserve land degradation andachieve a land-degradation neutral world” [2]. In croplands, sustainable solutions need to embedshort-term management of the soil–water–plant system in long-term landscape planning [3]. Achievingthe target of land degradation neutrality would decrease the environmental footprint of agriculture,while supporting food security and sustaining human wellbeing [4]. The soil system acts as a keycomponent of the Earth system by regulating the hydrological, erosional, and biogeochemical cycles [5].Therefore, the soil is where we first need to act to control the non-sustainable management and createenabling conditions to transition toward sustainable land management [6]. This is especially true foragricultural soils, where soil loss rates are commonly unsustainable and above those considered astolerable [7–9].
Land 2020, 9, 230; doi:10.3390/land9070230 www.mdpi.com/journal/land
Land 2020, 9, 230 2 of 16
Soil erosion, by water and wind, is among the most serious threats to preserve soil and waterresources at any spatial and temporal scale [10,11]. The expansion of agriculture and livestock farminghas resulted in a significant increment of soil erosion rates that explain the development of erosionallandscapes and sedimentary structures (recent alluvial plains, alluvial fans, deltas, and flat valleysinfilled of sediment) in many countries, such as in Spain [12]. Within the European agricultural areas(mean estimated rate of soil loss of 4.21 Mg ha−1 yr−1), soils of the permanent crops (e.g., vineyards,olive groves, fruit tree orchards) have much higher soil losses (9.47 Mg ha−1 yr−1) than arable land(2.67 Mg ha−1 yr−1) and pastures (2.02 Mg ha−1 yr−1) [13]. This fact is explained because most of thevineyards and olive trees are located in hilly Mediterranean areas with high rainfall erosivity anddue to the unsustainable tillage (bare soil) and exploitation (new large fields) management practices.It is well accepted by the scientific community that the traditional rainfed and tilled agricultureland in the Mediterranean contributes to high erosion rates. This was assessed by means of directmeasurements (plots and watersheds) and rainfall simulator experiments along the last three decades.Gómez et al. [14] measured in Córdoba (Andalucía, South Iberian Peninsula) 4 Mg ha−1 yr−1 of soilloss on plots of 6 × 12 m and a runoff coefficient—the ratio between the amount of water that leaves (viarunoff) from a hydrological unit (measured in mm or L m−2) and the amount of water that enters (viarainfall) into the same unit (in mm or L·m−2)—of 7.4% under tillage. The use of herbicides increased thesoil losses to 8.5 Mg ha−1 yr−1 and 21.5%, respectively. Other vineyards also showed high erosion rates;Novara et al. [15] found 9.5 Mg ha−1 yr−1 under tillage management in Sicily. This is confirmed with thedata generated with rainfall simulators by Rodrigo-Comino et al. [16] that show non-sustainable soillosses in the vineyards in eastern Spain. Similar soil erosion rates were found in other Mediterraneancrops such as almonds [17], apricots [18], and flood irrigated persimmon orchards [9].
Among the distinct measures to minimize soil erosion in permanent crops, the use of ground coverplants (e.g., spontaneous vegetation, cover crops, pruning remains, straw mulch) has been provedas an effective and environmentally friendly alternative [19]. Homogeneous and mixed temporarycover crops (CCs) favor surface water infiltration [20,21] and reduce runoff generation compared withfields managed under conventional tillage (CT)—bare soil in the inter-row areas due to ploughingand/or use of herbicides [22]. The use of weeds as cover crops was found to be a good policy in citrusorchards due to the fact that they reduce the soil losses from 3.8 to 0.7 Mg ha−1 h−1 [23]. Cover crops invineyards also contribute to reduce soil losses; Ruiz-Colmenero et al. [24] found that tillage contributewith 5.88 Mg ha−1 yr−1 and a cover of Brachypodium sp. reached 0.78 and Secale 1.27 Mg ha−1 yr−1.
Next to reducing soil erosion, which prevents also the export of carbon from the fields, certainsoil management strategies can increase the amount of carbon in the soil and sequester carbon forimproved soil health and climate mitigation. For example, Novara et al. [8] found increments ofsoil organic carbon (SOC) up to 6% and 9% in Italian vineyards with CC in flat and sloping areas,respectively, and compared with vineyards under CT. In central Spain, under semi-arid conditionsand only three years after ground cover establishment, García-Díaz et al. [25] found that soil organiccarbon stocks increased up to 1.62 and 3.18 Mg ha−1 in the vineyards with seeded CC and spontaneousvegetation, respectively, compared to the CT vineyard. In a recent meta-analysis in Mediterraneanpermanent crops, Vicente-Vicente et al. [26] observed that soil carbon sequestration potential in olivefarming was much higher than in vineyards, mainly due to the relative large space of the field that isthe beneficiary of the good management practices, such as ground cover plants or organic amendments.In a review study in commercial vineyards in southern Spain, Guzmán et al. [27] identified a significantimprovement in the SOC content and soil aggregate stability in the vineyards with ground coversin comparison with the bare soil vineyards. However, these authors observed a large variabilityamong vineyards that precludes the identification of other impacts and differences among the differentkind of temporary plants (plant species of the cover crops and spontaneous vegetation) followed bythe winegrowers. Processes of carbon transfer and sequestration in Grenache vineyards, which is alarge and economically important variety in Mediterranean vineyards [28], have been rarely studied.Capó-Bauçà et al. [29] investigated the long-term effects of natural green cover, established over seven
Land 2020, 9, 230 3 of 16
years, on the soil physicochemical characteristics in an experimental Grenache variety vineyard locatedin Mallorca (Spain). These authors found that natural weed cover resulted in an increment of 1%of the organic carbon content, larger dry aggregate sizes, a reduction of 0.36 g·cm−3 of bulk density,and higher functional microbial community diversity. After 21 years, Novara et al. [30] measured anincrease of 61 Mg CO2 ha−1 of soil C pools due to the organic farming applied to an orange plantationin the orchards of Valencia region in Eastern Spain. This was due to the chipped pruned branches,the weed cover and the use of 5000 Kg ha−1 of manure annually.
Although data is already available on soil organic matter recovery with alternative management totillage and herbicides, there is a need to diversify the research on different types of crops, managementstrategies, climatic regions, and physiographic conditions. This will enable farmers to obtain healthysoil health and contribute to achieving the SDGs. The topography and roughness of the land determinesurface runoff and consequent sediment delivery. However, this factor is not studied at plot scaleand in detail. The effectiveness of cover crops to reduce soil organic matter loss in vineyards underdifferent topographical conditions is a relevant issue as vineyards are mostly located in rugged terrainand steep slopes where soils have poor fertility and are highly erodible. The review carried out byRodrigo-Comino [31] demonstrates that soil erosion is high in vineyards around the world, where theorganic-rich topsoil is especially vulnerable to be lost from the fields. This organic-rich material istranslocated from the fields where it is eroded to depositional sites. This process can be explainedby the sediment/soil organic matter (OM) enrichment ratios (EROM) [32]. In semi-arid croplands ofSpain, Boix-Fayos et al. [33] estimated an average organic carbon ER at sub-catchment scale (8–125 ha)of 0.59 ± 0.43. Although the study of carbon and organic matter ER is not rare in olive groves [34]and other croplands [35], the assessment of EROM in vineyards has received little attention (e.g.,Ruiz-Colmenero et al. [36]; EROC ranging from 1.4 to 2).
In this study, we hypothesized that the OM loss is influenced by the local changes of the soil surfacecharacteristics—regarding surface coverage, slope gradient, and total drainage area—within the samevineyard managed with a seeded cover crop. Most previous studies have dealt with this issue at plotor field scale. The novel aspect of this study is the assessment on how the internal changes within thesame field influence the magnitude of the benefits of CC on soil and carbon loss reduction. To achievethis goal, a rainfed vineyard was selected in a rolling landscape under Mediterranean conditions andmanaged with a mixed cover crop of common sainfoin (forage legume) and spontaneous vegetation.Topographic and ground characteristics were assessed at high spatial resolution; using drone-derivedimagery, two sediment traps were installed, and soil and sediment organic matter contents weremeasured during a 15-month test period. This study aims to better understand the actual effectivenessof cover crops to reduce organic matter loss in vineyards under natural (non-controlled) conditionswhere ground cover plant development presents high spatial heterogeneity.
2. Materials and Methods
2.1. Study Area and Sediment Traps
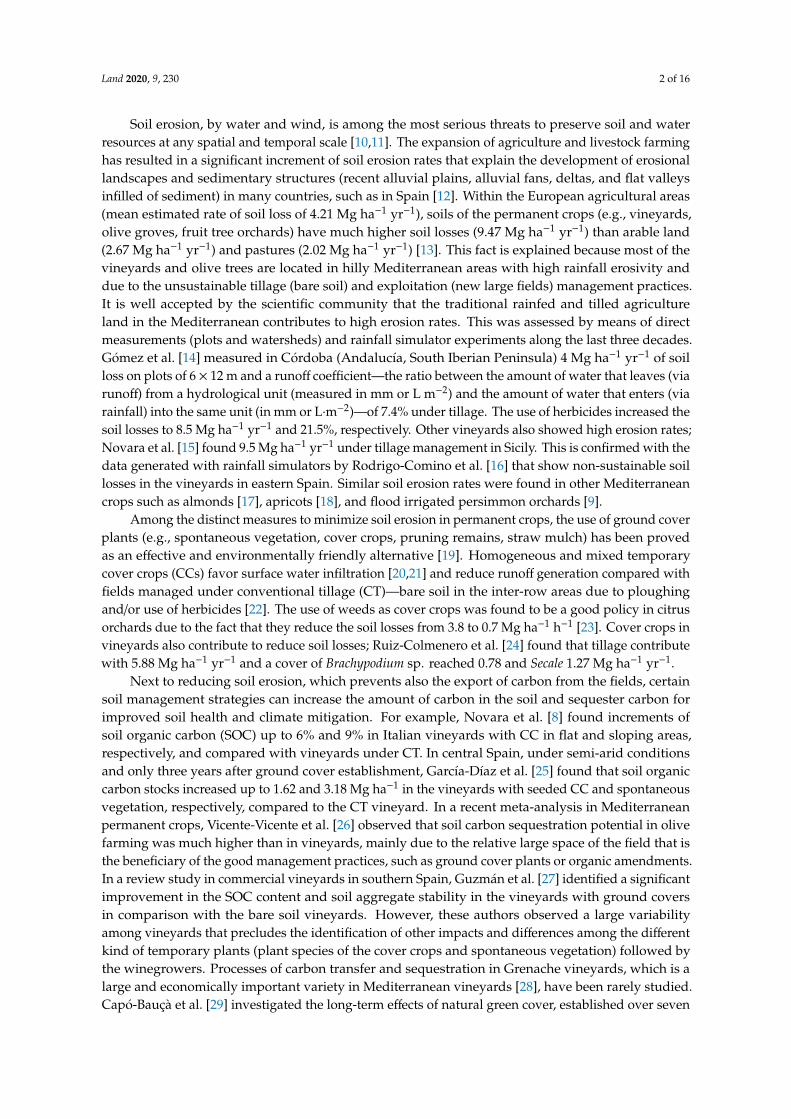
The study area is a rainfed vineyard located in the Ebro River Basin (NE Spain; 42◦02′04′′ N;0◦04′13′′ E) (Figure 1A). This plantation includes four commercial fields (Fábregas Cellar, a winery withCertificate of Origin: Somontano) that are cultivated with the Spanish variety Grenache (‘GarnachaTinta’; Vitis vinifera L. cv. Grenache). This site is located on a rolling landscape (mean slope gradientof 9.8%) in the lower part of “Los Oncenos” sub-catchment (see Supplementary Material), withinthe Vero River catchment, near Barbastro town (Huesca province). Elevation ranges from 447 to 468m a.s.l. (Figure 1B). Three fields include red grapes (planted in 2008; named VY1, VY2, and VY3),and one is devoted to white grapes (planted in 2007; VY4) under rainfed management. The wholevineyard plantation is arranged in 147 straight lines (espalier system). Soil in the grapevine lines (rowhereafter) remains between 8 cm and 23 cm, 13 cm on average, raised related to the soil in the inter-rowarea, due to the tillage practices carried out by the farmer. Therefore, ground elevation is higher in
Land 2020, 9, 230 4 of 16
the rows than in the inter-row areas. More information about this plantation and the surroundingland uses can be found in López-Vicente and Álvarez [37]. The climate is continental Mediterranean,with an average annual precipitation of 627 mm, mainly concentrated in two rainy seasons, in spring(April–June; 31% of the total annual rainfall) and autumn (September–November; 28%), and theaverage annual potential evapotranspiration is 1043 mm (data source: “Oficina del Regante” of theRegional Government of Aragon). The summer is dry with occasional thunderstorms and snowfallevents are scarce in winter. The mean annual temperature was 14.1 ◦C between 2004 and 2016.
Land 2020, 9, x FOR PEER REVIEW 4 of 16
found in López-Vicente and Á lvarez [37]. The climate is continental Mediterranean, with an average
annual precipitation of 627 mm, mainly concentrated in two rainy seasons, in spring (April–June;
31% of the total annual rainfall) and autumn (September–November; 28%), and the average annual
potential evapotranspiration is 1043 mm (data source: “Oficina del Regante” of the Regional
Government of Aragon). The summer is dry with occasional thunderstorms and snowfall events are
scarce in winter. The mean annual temperature was 14.1 °C between 2004 and 2016.
Figure 1. (A) Map of the overland flow pathways in the part of Los Oncenos sub-catchment where
the drainage area of the two sediment traps are located, showing the location of the vines and soil
sampling points (B). Pictures in January, April, July, and October (C).
Four sediment traps were included in the original design of the experiment in Los Oncenos sub-
catchment—two in the cereal fields (ST1 and ST4) and two in the vineyards (ST2 and ST3). This
research focuses on the vineyards. The two sediment traps (ST2 and ST3) were established in the first
inter-row of VY4 down the corridor that separates VY3 and VY4 (Figure 2a). Each ST was located in
the course of an ephemeral gully and installed below the soil surface to avoid any disturbance with
the tractor traffic (Figure 2b). The drainage areas (DAs) of the ST2 and ST3 were 3286 m2 and 6214 m2,
with a mean slope gradient of 17.0% and 9.2%, respectively (Table 1). In a recent study in the “Los
Oncenos” sub-catchment, López-Vicente and Á lvarez [38] found that soil roughness and the index of
sediment connectivity (IC; water-mediated transfer of soil and sediments within a hydrological unit)
are higher in DA-ST2 than in DA-ST3, indicating active processes of sediment delivery. However,
DA-ST2 is closer to a convex topography (estimated with the convergence index –CI) that is
characteristic of disperse flow at short distance, whereas DA-ST3 has a general concave surface,
which indicates concentrated overland flow when neighbor pixels are analyzed. Intense soil erosion
processes have launched the development of continuous flow path lines, breaking the topographic
sills of the rows in some sections. Soils are Haplic Regosols (calcaric; RGca) in the upper part of DA-
ST2 and Luvic Calcisols (CLl) in the lower part of DA-ST2 and in DA-ST3.
Figure 1. (A) Map of the overland flow pathways in the part of Los Oncenos sub-catchment where thedrainage area of the two sediment traps are located, showing the location of the vines and soil samplingpoints (B). Pictures in January, April, July, and October (C).
Four sediment traps were included in the original design of the experiment in Los Oncenossub-catchment—two in the cereal fields (ST1 and ST4) and two in the vineyards (ST2 and ST3).This research focuses on the vineyards. The two sediment traps (ST2 and ST3) were established in thefirst inter-row of VY4 down the corridor that separates VY3 and VY4 (Figure 2A). Each ST was locatedin the course of an ephemeral gully and installed below the soil surface to avoid any disturbance withthe tractor traffic (Figure 2B). The drainage areas (DAs) of the ST2 and ST3 were 3286 m2 and 6214 m2,with a mean slope gradient of 17.0% and 9.2%, respectively (Table 1). In a recent study in the “LosOncenos” sub-catchment, López-Vicente and Álvarez [38] found that soil roughness and the index ofsediment connectivity (IC; water-mediated transfer of soil and sediments within a hydrological unit) arehigher in DA-ST2 than in DA-ST3, indicating active processes of sediment delivery. However, DA-ST2is closer to a convex topography (estimated with the convergence index–CI) that is characteristicof disperse flow at short distance, whereas DA-ST3 has a general concave surface, which indicatesconcentrated overland flow when neighbor pixels are analyzed. Intense soil erosion processes havelaunched the development of continuous flow path lines, breaking the topographic sills of the rowsin some sections. Soils are Haplic Regosols (calcaric; RGca) in the upper part of DA-ST2 and LuvicCalcisols (CLl) in the lower part of DA-ST2 and in DA-ST3.

Land 2020, 9, 230 5 of 16
Land 2020, 9, x FOR PEER REVIEW 5 of 16
Figure 2. Picture of the sediment trap #2 (A) and ephemeral gully located in the drainage area of ST3
within VY3 (B).
Table 1. Physiographic characteristics of the upslope drainage area (DA) of the two sediment traps
(STs).
Sub-Basin A S (Mean ± S.D.) Average Bare Soil SR CI IC (Mean; Max.)
ID m2 % % mm % [−∞; +∞]
DA-ST2 3286 17.0 ± 9.5 18.4 21.5 −0.143 −6.394; −4.695
DA-ST3 6214 9.2 ± 5.0 10.6 11.6 −0.668 −6.821; −4.818
A: total area; S: slope gradient; SR: soil roughness; CI: convergence index; IC: index of runoff and
sediment connectivity.
The two STs played the role of collectors of runoff and sediment generated during the different
rainfall-runoff events. Each trap had two boxes; one box was buried and permanently remained in
the field, and the other one was located inside the first box. This allowed an easy measurement of the
runoff and sediments collected during most of the rainfall events but not during the high magnitude-
low frequency ones as then the buried box should also be emptied. A metal grid with holes (4 × 4
mm) was located on the top of the smaller box to avoid the entrance of animals and rocks. Finally, a
metal cap with big holes (7 × 7 cm) was used to close the trap. Each trap was designed to hold a
maximum volume of 32.2 L (460 mm length × 200 mm width × 350 mm depth). Both STs were installed
in December 2016 and tested in January 2017. The test period lasted 15 months, from February 2017
to April 2018. During this period and after each heavy rainfall event or after several low- or medium-
intensity rainfall events, the runoff and sediment samples were collected and associated to the
corresponding time-integrated period (TIP). Every TIP covered the period (in days) between the
latest and the new field survey. We performed 26 field surveys. After sampling collection, the internal
boxes with runoff and sediments were transported to the laboratory and replaced by new boxes.
Then, the total runoff with sediments of each trap was weighted, and sediment was separated by
decantation. The wet sediment was dried in an oven at 60 °C for 96 h to ensure a complete dry out of
the samples, and the dry sediment was weighed. We selected 60 °C temperature to avoid destroying
the organic matter during the drying process. The total runoff (Q; L TIP–1) and sediment yield (SY; g
TIP–1) were calculated for each ST and TIP and presented in a previous study [7] (Table 2). During
the test period, values of rainfall depth were obtained from two weather stations, called “Barbastro-
Oficina del Regante” (managed by the Regional Government of Aragon; records every 30 min) and
“Barbastro-CHEbro” (managed by the Ebro River Basin water authorities; records every 15 min), that
are located 4.2 and 5.2 Km eastern from the study area, respectively. Ben-Salem et al. [7] observed
minor differences between the records of the two stations and then generated a synthetic weather
station. First, the temporal resolution of both records was equalized by calculating the values of
precipitation every 30 min. Then, the mean value of precipitation was calculated and assigned this
value to the synthetic weather station. Using aggregated values every 30 min, the number of erosive
rainfall events and their corresponding rainfall depth (Re; mm), intensity (I30e; mm h–1), and erosivity
(EI30e; MJ mm ha–1 h–1) were calculated.
Figure 2. Picture of the sediment trap #2 (A) and ephemeral gully located in the drainage area of ST3within VY3 (B).
Table 1. Physiographic characteristics of the upslope drainage area (DA) of the two sediment traps (STs).
Sub-Basin A S (Mean ± S.D.) Average Bare Soil SR CI IC (Mean; Max.)
ID m2 % % mm % [−∞; +∞]
DA-ST2 3286 17.0 ± 9.5 18.4 21.5 −0.143 −6.394; −4.695DA-ST3 6214 9.2 ± 5.0 10.6 11.6 −0.668 −6.821; −4.818
A: total area; S: slope gradient; SR: soil roughness; CI: convergence index; IC: index of runoff andsediment connectivity.
The two STs played the role of collectors of runoff and sediment generated during the differentrainfall-runoff events. Each trap had two boxes; one box was buried and permanently remained in thefield, and the other one was located inside the first box. This allowed an easy measurement of the runoff
and sediments collected during most of the rainfall events but not during the high magnitude-lowfrequency ones as then the buried box should also be emptied. A metal grid with holes (4 × 4 mm) waslocated on the top of the smaller box to avoid the entrance of animals and rocks. Finally, a metal capwith big holes (7 × 7 cm) was used to close the trap. Each trap was designed to hold a maximum volumeof 32.2 L (460 mm length × 200 mm width × 350 mm depth). Both STs were installed in December 2016and tested in January 2017. The test period lasted 15 months, from February 2017 to April 2018. Duringthis period and after each heavy rainfall event or after several low- or medium-intensity rainfall events,the runoff and sediment samples were collected and associated to the corresponding time-integratedperiod (TIP). Every TIP covered the period (in days) between the latest and the new field survey.We performed 26 field surveys. After sampling collection, the internal boxes with runoff and sedimentswere transported to the laboratory and replaced by new boxes. Then, the total runoff with sedimentsof each trap was weighted, and sediment was separated by decantation. The wet sediment was driedin an oven at 60 ◦C for 96 h to ensure a complete dry out of the samples, and the dry sediment wasweighed. We selected 60 ◦C temperature to avoid destroying the organic matter during the dryingprocess. The total runoff (Q; L TIP−1) and sediment yield (SY; g TIP−1) were calculated for each ST andTIP and presented in a previous study [7] (Table 2). During the test period, values of rainfall depthwere obtained from two weather stations, called “Barbastro-Oficina del Regante” (managed by theRegional Government of Aragon; records every 30 min) and “Barbastro-CHEbro” (managed by theEbro River Basin water authorities; records every 15 min), that are located 4.2 and 5.2 Km eastern fromthe study area, respectively. Ben-Salem et al. [7] observed minor differences between the records of thetwo stations and then generated a synthetic weather station. First, the temporal resolution of bothrecords was equalized by calculating the values of precipitation every 30 min. Then, the mean value ofprecipitation was calculated and assigned this value to the synthetic weather station. Using aggregatedvalues every 30 min, the number of erosive rainfall events and their corresponding rainfall depth (Re;mm), intensity (I30e; mm h−1), and erosivity (EI30e; MJ mm ha−1 h−1) were calculated.
Land 2020, 9, 230 6 of 16
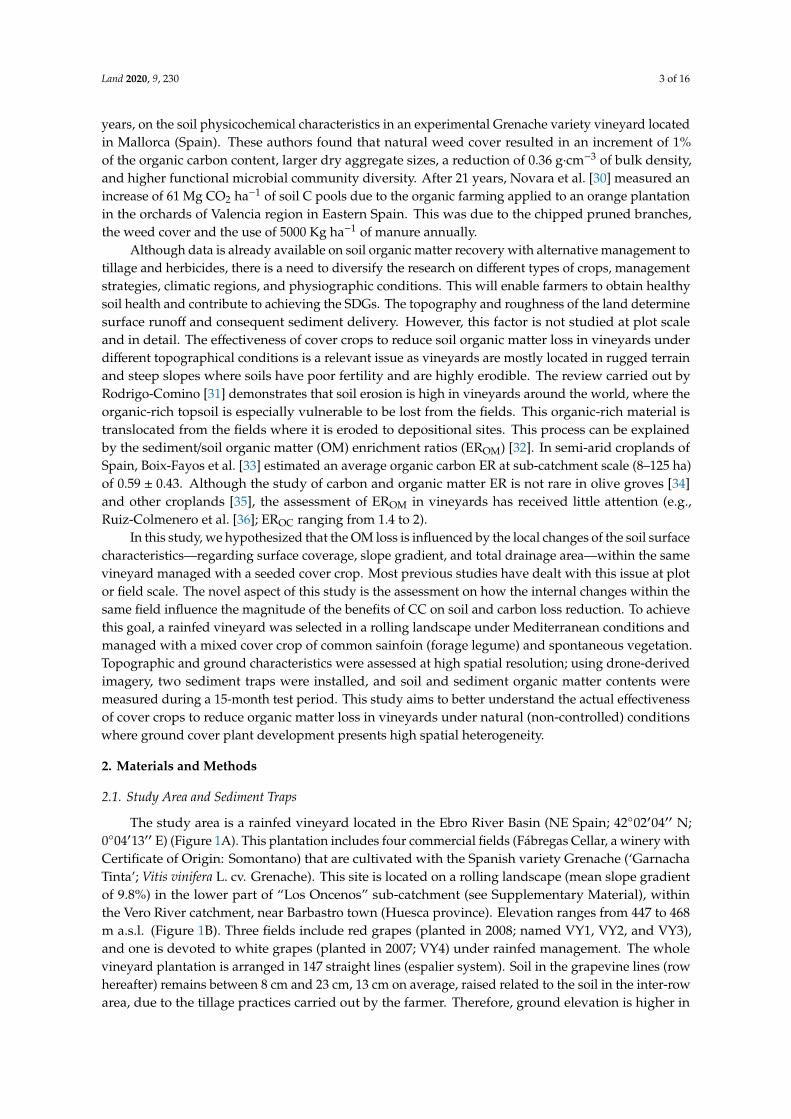
Table 2. Accumulated rainfall depth (∑
R) and erosivity (∑
EI30) calculated with the synthetic weatherstation, runoff (Q) and sediment (SY) yields, and organic matter content measured in the sediment(OMSed) collected in the two sediment traps (ST) at each time-integrated period (TIP) during the15-month test period.
TIP∑
R∑
EI30 GC ST Q SY OMSed
Date # mm MJ mm ha−1 h−1 TIP−1 Level # L TIP−1 g TIP−1 % g ha−1 TIP−1
07/02/2017 1 24.3 10.3 High ST2 MF ND ND NDST3 26.488 16.1 6.27 1.6
16/02/2017 2 30.1 30.4 High ST2 MF ND ND NDST3 23.824 39.8 3.22 2.1
08/03/2017 3 34.1 43.1 High ST2 MF ND ND NDST3 3.678 22.6 5.07 1.8
28/03/2017 4 70.3 68.1 Very high ST2 * 30.195 30.9 3.46 3.2ST3 * 30.010 124.6 3.35 6.7
17/04/2017 5 11.7 5.1 Very high ST2 0 0 ND NDST3 0 0 ND ND
04/05/2017 6 23.3 29.4 Very high ST2 0.720 3.4 ND† ND †
ST3 0 0 ND ND
17/05/2017 7 31,9 68.8 Very high ST2 0 0 ND ND
ST3 0.930 2.9 ND† ND †
06/06/2017 8 39.9 27.9 LowST2 1.500 2.3 ND
† ND †
ST3 4.787 7.1 ND† ND †
16/06/2017 9 2.8 0.8 LowST2 0 0 ND NDST3 0 0 ND ND
27/06/2017 10 19,4 47.6 LowST2 MF ND ND ND
ST3 21.128 38.9 ND† ND †
10/07/2017 11 10.8 8.0 LowST2 0.383 1.7 ND
† ND †
ST3 0.462 1.4 ND† ND †
29/08/2017 12 7.6 2.4 Very low ST2 0 0 ND NDST3 0 0 ND ND
19/09/2017 13 16.7 9.0 Very low ST2 0.645 27.8 5.48 4.6ST3 0.206 15.2 5.30 1.3
26/09/2017 14 18.1 50.7 Very low ST2 ** 9.942 32,825.8 0.60 599.4ST3 7.071 1821.6 3.48 102.0
17/10/2017 15 1.3 0.1 LowST2 0 0 ND NDST3 0 0 ND ND
25/10/2017 16 42.9 107.9 LowST2 ** 8.546 41,260.2 0.72 904.1ST3 ** 26.513 2778.4 4.11 183.8
17/11/2017 17 8.0 15.3 MediumST2 23.156 281.4 5.34 45.7ST3 8.252 911.6 4.40 64.7
20/12/2017 18 13.8 2.9 MediumST2 1.012 2.2 ND
† ND †
ST3 0.276 0.4 ND† ND †
18/01/2018 19 28.6 12.1 High ST2 28.396 60.5 6.21 11.4ST3 24.612 38.1 4.63 2.8
12/02/2018 20 42.4 11.5 High ST2 2.287 0.8 ND† ND †
ST3 * 28.766 44.6 ND† ND †
19/02/2018 21 9.5 5.0 High ST2 0 0 ND NDST3 0 0 ND ND

Land 2020, 9, 230 7 of 16
Table 2. Cont.
TIP∑
R∑
EI30 GC ST Q SY OMSed
Date # mm MJ mm ha−1 h−1 TIP−1 Level # L TIP−1 g TIP−1 % g ha−1 TIP−1
07/03/2018 22 45.4 18.1 High ST2 * 30.711 13.3 4.25 1.7ST3 * 30.237 18.8 5.45 1.6
19/03/2018 23 23.3 16.8 Very high ST2 28.466 84.5 5.45 14.0ST3 28.380 40.7 6.72 4.4
05/04/2018 24 17.7 5.6 Very high ST2 0.861 4.1 ND† ND †
ST3 * 28.900 42.0 4.50 3.0
18/04/2018 25 93.8 101.1 Very high ST2 * 28.834 59.2 5.60 10.1ST3 * 29.034 30.2 5.51 2.7
30/04/2018 26 22.4 37.6 Very high ST2 * 29.023 94.3 5.64 16.2ST3 * 27.702 572.7 7.01 64.6
GC: ground cover; MF: malfunctioning; *: ST completely full of runoff; **: ST completely full of sediments;†: Insufficient amount of sediment to perform the chemical analysis.
Regarding the vegetation cover, the soil surface of the DA-ST2 had less vegetation with an averagepercentage of bare soil of 18.4%, whereas the DA-ST3 only had 10.6% of the soil surface withoutvegetation [7]. However, significant changes in the soil surface cover were observed over the twelvemonths of the year due to the phenology of the grapevines, the cover crop (CC), the spontaneousvegetation and the tillage practices (e.g., grape harvest and mowing pass) (Figure 1C). The inter-rowareas of the vineyards are managed with a mixture of plant species—(i) spontaneous vegetation in VY4and (ii) plantation of common sainfoin (Onobrychis viciifolia Scop., 1772) with spontaneous vegetationin VY1, VY2, and VY3. Spontaneous vegetation also covers the soil in the corridors between the fourvineyards. This ground cover was seeded for the first time in early 2016. The maintenance of the CCsincludes one mowing pass in spring to avoid water and nutrient competition between the CCs and thevines. In this study, the mowing was done in the third week of May 2017 (later than usual) and in thefirst week of May 2018. Most pruning remains on the same place after the mowing, so the soil coverfactor (percentage of the soil surface covered with vegetation) keeps high all over the year. Herbicidewas applied under the vines along the row to avoid the growth of weeds. Grapes were harvestedin September.
2.2. Organic Matter Content in the Soil and Sediment Samples
In a previous study, López-Vicente and Álvarez [37] collected 144 soil samples in 48 samplingpoints in the four vineyards and estimated the bulk density (BD), rock content (RF; fragments with aminimum diameter higher than 2 mm), and texture of the soil (content of clay-, silt- and sand-sizedparticles) at field scape. In this study, the organic matter (OM) content of the soil samples included inthe DAs of the two STs was measured. Besides, we generated the corresponding maps of all thesephysical and chemical properties by means of spatial interpolation. We chose the spline interpolationtool (type: Tension; weight: 100; # points: 1) available in ArcGIS© 10.5 (ESRI, USA). All maps weregenerated at 0.2 × 0.2 m of cell size. In the previous cited studies, we observed clear differences in thesoil properties between the rows and inter-row areas. Therefore, we decided to use a two-step process:(I) three interpolation maps were generated using the solely points of the different compartments (1)samples from the inter-row areas and corridors; 2) samples from the rows; and 3) samples from thenatural vegetation); and (II) overlap the three interpolated maps. Then, the values of the differentparameters in the DA-ST2 and DA-ST3 were obtained from the resulting maps.
After removing the coarse fragments (mean diameter higher than 2 mm) of the soil and sedimentsamples, the fine fractions were analyzed in the certified laboratory “Centro Tecnológico AgropecuarioCinco Villas S.L.” Values were presented as weight percentage. During the 26 TIPs, we collectedsediment samples in 16 and 20 TIPs in ST2 and ST3, respectively. However, the amount of fine sediment(after removing water, small rocks, and the small vegetation remnants) was very low (SY < 5 g) in some

Land 2020, 9, 230 8 of 16
of them, and the OM content was measured in 10 and 14 samples from the ST2 and ST3, respectively(Table 2). Few differences among the dates of the measured samples appeared due to the differenthydrological response of the soils in the DA of the two STs.
2.3. Organic Matter Enrichment Ratio and Statistical Analysis
The sediment/soil OM enrichment ratios (EROM) were calculated in the two sediment traps foreach TIP,
EROM =OMSed
OMSoil(1)
where OMSed (%) is the concentration of OM in the sediment and OMSoil (%) is the average concentrationof OM in the soil of the drainage area of each sediment trap.
Then, the mean and total values of OM loss were estimated at annual and test-period scales.The statistical differences of the SY and EROM between the two STs were analyzed over the test periodby means of the analysis of variance (ANOVA; one-way) with the Shapiro¬–Wilk normality test atp-value < 0.05.
3. Results and Discussion
3.1. Organic Matter Content in the Sediment Samples
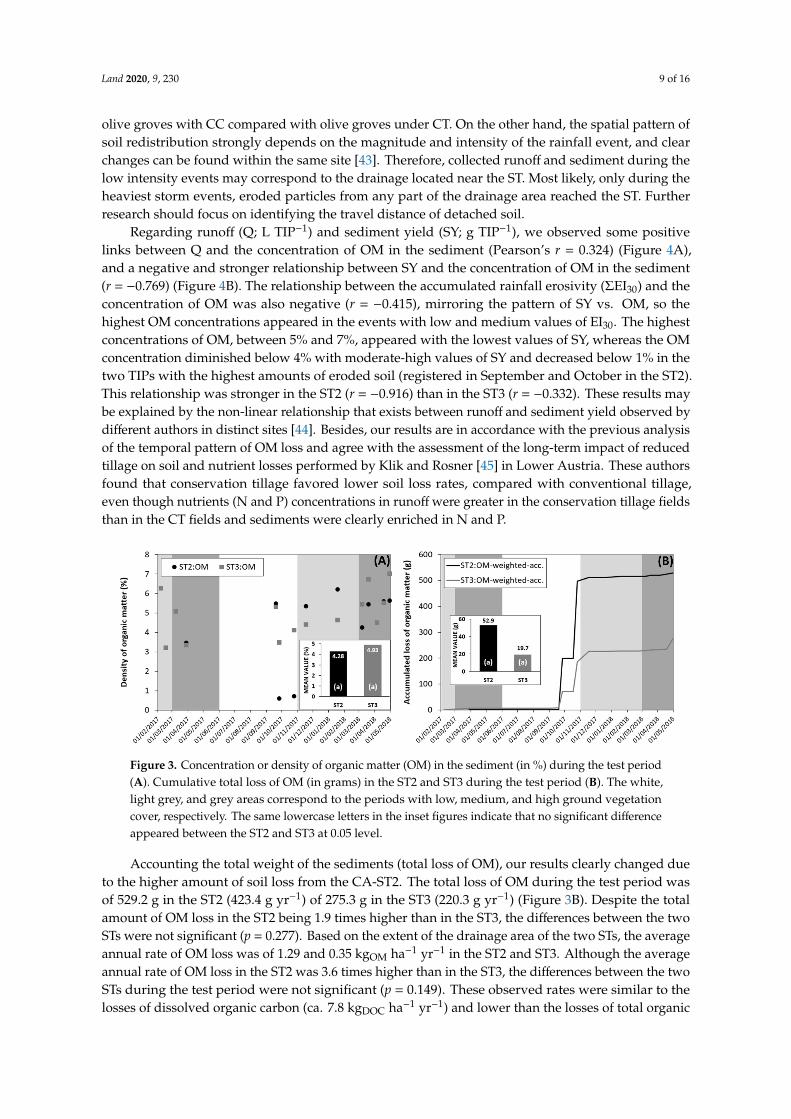
During the 15-month test period, the accumulated rainfall depth and erosivity was 690.1 mm and735.3 MJ mm ha−1 h−1 T−1, respectively, which means 552.1 mm yr−1 and 588.2 MJ mm ha−1 h−1 yr−1.These values of precipitation were ca. 12% lower than the average rainfall in the region, and higherlosses of soil and carbon may be expected in other years. At TIP scale, the concentration of OM in thesediment (grams of OM per grams of sediment) collected in the ST3 (OMSed = 4.93%± 1.20) was slightlyhigher than the concentration of OM in the sediment obtained in the ST2 (OMSed = 4.28% ± 2.06),but the differences were not significant (p-value = 0.336) (Table 2). In the ST2, the OM content rangedbetween 0.60% and 6.21%, whereas in the ST3, the OM content ranged between 3.22% and 7.01%(Figure 3A). In the collected sediment, the concentration of OM was higher in the ST2 than in theST3 in five TIPs, and in five TIPs, the concentration of OM was higher in the ST3 than in the ST2.During the five months (from June to October) with the lowest ground vegetation cover (GC) inthe inter-row areas, because the CC was mowed in May, the concentration of OM was the lowestin the ST2 (OMSed = 2.27%) and ST3 (OMSed = 4.30%). However, during the four months withmoderate GC (November–February) and the three months with maximum GC (March–May), theconcentration of OM was clearly higher in the ST2 (OMSed = 5.78% and 4.88% and ST3 (OMSed = 4.63%and 5.37%. The differences between the OM densities in the periods with low and moderate-high GCwere statistically significant (p-value = 0.012), showing the different type of soil erosion that happenedover the year. As expected, low values of SY were observed during the months with moderate andhigh GC in the ST2 (SY = 69 and 32 g TIP−1) and ST3 (SY = 150 and 85 g TIP−1), whereas veryhigh values of SY appeared during the months with the lowest GC in the ST2 (SY = 8235 g TIP−1)and ST3 (SY = 518 g TIP−1). Moreover, the differences of SY between the periods with low andmoderate–high GC were statistically significant (p-value = 0.005). These results totally agree withthose observed in vineyards [39] and olive groves [40] managed with temporary CC, where the positiveeffect of CC on soil erosion control declined after mowing or application of herbicides. On the otherhand, low-intensity erosive events detach fine soil particles, which gather most SOM [41], whereashigh-intensity erosive events detach and transport sediment particles of all sizes [42], including sandand rocks that are poor in SOM. The combined effect of preferential soil particle size remobilizedduring the distinct rainfall events and the temporal changes in ground cover explains the temporalpattern of OM concentration in the sediment. These temporal patterns were even more notably in theST2 than in the ST3, suggesting that higher values of GC reduce the temporal variability of soil andOM loss, and agree with the results of higher runoff stability observed by López-Vicente et al. [22] in
Land 2020, 9, 230 9 of 16
olive groves with CC compared with olive groves under CT. On the other hand, the spatial pattern ofsoil redistribution strongly depends on the magnitude and intensity of the rainfall event, and clearchanges can be found within the same site [43]. Therefore, collected runoff and sediment during thelow intensity events may correspond to the drainage located near the ST. Most likely, only during theheaviest storm events, eroded particles from any part of the drainage area reached the ST. Furtherresearch should focus on identifying the travel distance of detached soil.
Regarding runoff (Q; L TIP−1) and sediment yield (SY; g TIP−1), we observed some positivelinks between Q and the concentration of OM in the sediment (Pearson’s r = 0.324) (Figure 4A),and a negative and stronger relationship between SY and the concentration of OM in the sediment(r = −0.769) (Figure 4B). The relationship between the accumulated rainfall erosivity (ΣEI30) and theconcentration of OM was also negative (r = −0.415), mirroring the pattern of SY vs. OM, so thehighest OM concentrations appeared in the events with low and medium values of EI30. The highestconcentrations of OM, between 5% and 7%, appeared with the lowest values of SY, whereas the OMconcentration diminished below 4% with moderate-high values of SY and decreased below 1% in thetwo TIPs with the highest amounts of eroded soil (registered in September and October in the ST2).This relationship was stronger in the ST2 (r = −0.916) than in the ST3 (r = −0.332). These results maybe explained by the non-linear relationship that exists between runoff and sediment yield observed bydifferent authors in distinct sites [44]. Besides, our results are in accordance with the previous analysisof the temporal pattern of OM loss and agree with the assessment of the long-term impact of reducedtillage on soil and nutrient losses performed by Klik and Rosner [45] in Lower Austria. These authorsfound that conservation tillage favored lower soil loss rates, compared with conventional tillage,even though nutrients (N and P) concentrations in runoff were greater in the conservation tillage fieldsthan in the CT fields and sediments were clearly enriched in N and P.
Land 2020, 9, x FOR PEER REVIEW 8 of 16
3. Results and Discussion
3.1. Organic Matter Content in the Sediment Samples
During the 15-month test period, the accumulated rainfall depth and erosivity was 690.1 mm
and 735.3 MJ mm ha–1 h–1 T–1, respectively, which means 552.1 mm yr–1 and 588.2 MJ mm ha–1 h–1 yr–
1. These values of precipitation were ca. 12% lower than the average rainfall in the region, and higher
losses of soil and carbon may be expected in other years. At TIP scale, the concentration of OM in the
sediment (grams of OM per grams of sediment) collected in the ST3 (𝑂𝑀𝑆𝑒𝑑 = 4.93% ± 1.20) was
slightly higher than the concentration of OM in the sediment obtained in the ST2 (𝑂𝑀𝑆𝑒𝑑 = 4.28% ±
2.06), but the differences were not significant (p-value = 0.336) (Table 2). In the ST2, the OM content
ranged between 0.60% and 6.21%, whereas in the ST3, the OM content ranged between 3.22% and
7.01% (Figure 3a). In the collected sediment, the concentration of OM was higher in the ST2 than in
the ST3 in five TIPs, and in five TIPs, the concentration of OM was higher in the ST3 than in the ST2.
During the five months (from June to October) with the lowest ground vegetation cover (GC) in the
inter-row areas, because the CC was mowed in May, the concentration of OM was the lowest in the
ST2 (𝑂𝑀𝑆𝑒𝑑 = 2.27%) and ST3 (𝑂𝑀𝑆𝑒𝑑
= 4.30%). However, during the four months with moderate
GC (November–February) and the three months with maximum GC (March–May), the concentration
of OM was clearly higher in the ST2 (𝑂𝑀𝑆𝑒𝑑 = 5.78% and 4.88% and ST3 (𝑂𝑀𝑆𝑒𝑑
= 4.63% and 5.37%.
The differences between the OM densities in the periods with low and moderate-high GC were
statistically significant (p-value = 0.012), showing the different type of soil erosion that happened over
the year. As expected, low values of SY were observed during the months with moderate and high
GC in the ST2 (𝑆𝑌 = 69 and 32 g TIP–1) and ST3 (𝑆𝑌 = 150 and 85 g TIP–1), whereas very high values
of SY appeared during the months with the lowest GC in the ST2 (𝑆𝑌 = 8235 g TIP–1) and ST3 (𝑆𝑌 =
518 g TIP–1). Moreover, the differences of SY between the periods with low and moderate–high GC
were statistically significant (p-value = 0.005). These results totally agree with those observed in
vineyards [39] and olive groves [40] managed with temporary CC, where the positive effect of CC on
soil erosion control declined after mowing or application of herbicides. On the other hand, low-
intensity erosive events detach fine soil particles, which gather most SOM [41], whereas high-
intensity erosive events detach and transport sediment particles of all sizes [42], including sand and
rocks that are poor in SOM. The combined effect of preferential soil particle size remobilized during
the distinct rainfall events and the temporal changes in ground cover explains the temporal pattern
of OM concentration in the sediment. These temporal patterns were even more notably in the ST2
than in the ST3, suggesting that higher values of GC reduce the temporal variability of soil and OM
loss, and agree with the results of higher runoff stability observed by López-Vicente et al. [22] in olive
groves with CC compared with olive groves under CT. On the other hand, the spatial pattern of soil
redistribution strongly depends on the magnitude and intensity of the rainfall event, and clear
changes can be found within the same site [43]. Therefore, collected runoff and sediment during the
low intensity events may correspond to the drainage located near the ST. Most likely, only during
the heaviest storm events, eroded particles from any part of the drainage area reached the ST. Further
research should focus on identifying the travel distance of detached soil.
Figure 3. Concentration or density of organic matter (OM) in the sediment (in %) during the test period(A). Cumulative total loss of OM (in grams) in the ST2 and ST3 during the test period (B). The white,light grey, and grey areas correspond to the periods with low, medium, and high ground vegetationcover, respectively. The same lowercase letters in the inset figures indicate that no significant differenceappeared between the ST2 and ST3 at 0.05 level.
Accounting the total weight of the sediments (total loss of OM), our results clearly changed dueto the higher amount of soil loss from the CA-ST2. The total loss of OM during the test period wasof 529.2 g in the ST2 (423.4 g yr−1) of 275.3 g in the ST3 (220.3 g yr−1) (Figure 3B). Despite the totalamount of OM loss in the ST2 being 1.9 times higher than in the ST3, the differences between the twoSTs were not significant (p = 0.277). Based on the extent of the drainage area of the two STs, the averageannual rate of OM loss was of 1.29 and 0.35 kgOM ha−1 yr−1 in the ST2 and ST3. Although the averageannual rate of OM loss in the ST2 was 3.6 times higher than in the ST3, the differences between the twoSTs during the test period were not significant (p = 0.149). These observed rates were similar to thelosses of dissolved organic carbon (ca. 7.8 kgDOC ha−1 yr−1) and lower than the losses of total organic

Land 2020, 9, 230 10 of 16
carbon (ca. 101 kgTOC ha−1 yr−1) measured by Gómez et al. [46] in Spanish olive orchard plots with CC.Besides, these authors also reported clear benefits on reducing the loss of carbon in those plots with CCcompared with the plots under CT. In vineyards located in Central Spain, Ruiz-Colmenero et al. [24]also found that the concentration of SOC in sediments was greater in the cover crops plots than in theCT plots, whilst the mass-corrected loss of SOC was greater under CT (ca. 60 kgOM ha−1 yr−1) thanunder CC (ca. 20 kgOM ha−1 yr−1).
Land 2020, 9, x FOR PEER REVIEW 9 of 16
Figure 3. Concentration or density of organic matter (OM) in the sediment (in %) during the test
period (A). Cumulative total loss of OM (in grams) in the ST2 and ST3 during the test period (B). The
white, light grey, and grey areas correspond to the periods with low, medium, and high ground
vegetation cover, respectively. The same lowercase letters in the inset figures indicate that no
significant difference appeared between the ST2 and ST3 at 0.05 level.
Regarding runoff (Q; L TIP–1) and sediment yield (SY; g TIP–1), we observed some positive links
between Q and the concentration of OM in the sediment (Pearson’s r = 0.324) (Figure 4a), and a
negative and stronger relationship between SY and the concentration of OM in the sediment (r =
−0.769) (Figure 4b). The relationship between the accumulated rainfall erosivity (ƩEI30) and the
concentration of OM was also negative (r = −0.415), mirroring the pattern of SY vs. OM, so the highest
OM concentrations appeared in the events with low and medium values of EI30. The highest
concentrations of OM, between 5% and 7%, appeared with the lowest values of SY, whereas the OM
concentration diminished below 4% with moderate-high values of SY and decreased below 1% in the
two TIPs with the highest amounts of eroded soil (registered in September and October in the ST2).
This relationship was stronger in the ST2 (r = −0.916) than in the ST3 (r = −0.332). These results may
be explained by the non-linear relationship that exists between runoff and sediment yield observed
by different authors in distinct sites [44]. Besides, our results are in accordance with the previous
analysis of the temporal pattern of OM loss and agree with the assessment of the long-term impact
of reduced tillage on soil and nutrient losses performed by Klik and Rosner [45] in Lower Austria.
These authors found that conservation tillage favored lower soil loss rates, compared with
conventional tillage, even though nutrients (N and P) concentrations in runoff were greater in the
conservation tillage fields than in the CT fields and sediments were clearly enriched in N and P.
Figure 4. Relationship between the concentration or density of OM in the sediment and the amount
of runoff (Q) (A) and sediment yield (SY) (B) per time-integrated period (TIP).
Accounting the total weight of the sediments (total loss of OM), our results clearly changed due
to the higher amount of soil loss from the CA-ST2. The total loss of OM during the test period was of
529.2 g in the ST2 (423.4 g yr–1) of 275.3 g in the ST3 (220.3 g yr–1) (Figure 3b). Despite the total amount
of OM loss in the ST2 being 1.9 times higher than in the ST3, the differences between the two STs
were not significant (p = 0.277). Based on the extent of the drainage area of the two STs, the average
annual rate of OM loss was of 1.29 and 0.35 kgOM ha−1 yr−1 in the ST2 and ST3. Although the average
annual rate of OM loss in the ST2 was 3.6 times higher than in the ST3, the differences between the
two STs during the test period were not significant (p = 0.149). These observed rates were similar to
the losses of dissolved organic carbon (ca. 7.8 kgDOC ha−1 yr−1) and lower than the losses of total organic
carbon (ca. 101 kgTOC ha−1 yr−1) measured by Gómez et al. [46] in Spanish olive orchard plots with CC.
Besides, these authors also reported clear benefits on reducing the loss of carbon in those plots with
CC compared with the plots under CT. In vineyards located in Central Spain, Ruiz-Colmenero et al.
[24] also found that the concentration of SOC in sediments was greater in the cover crops plots than
Figure 4. Relationship between the concentration or density of OM in the sediment and the amount ofrunoff (Q) (A) and sediment yield (SY) (B) per time-integrated period (TIP).
3.2. Soil Physical and Chemical Properties
The interpolated maps allowed estimating the spatially distributed values of the soil physical andchemical properties (Figure 5). Regarding the physical parameters, the mean values of bulk density,effective volume of the soil (volume occupied by the fine fraction, mean diameter lower than 2 mm),silt and clay contents were 1.22, 1.08, 1.46 and 1.41 times higher in the CA-ST3 than in the CA-ST2(Table 3). Rock fragments and sand content were 2.71 and 1.37 times higher in the CA-ST2 than in theCA-ST3. The dominant soil texture is sandy loam in the CA-ST2 and loam in the CA-ST3. The lowercontent of silt and clay found in the DA-ST2 can be associated with the higher soil loss rates observedin this area because continuous water soil erosion tends to reduce the amount of fine soil particles inthe topsoil layer [42].
Land 2020, 9, x FOR PEER REVIEW 10 of 16
in the CT plots, whilst the mass-corrected loss of SOC was greater under CT (ca. 60 kgOM ha–1 yr–1)
than under CC (ca. 20 kgOM ha–1 yr–1).
3.2. Soil Physical and Chemical Properties
The interpolated maps allowed estimating the spatially distributed values of the soil physical
and chemical properties (Figure 5). Regarding the physical parameters, the mean values of bulk
density, effective volume of the soil (volume occupied by the fine fraction, mean diameter lower than
2 mm), silt and clay contents were 1.22, 1.08, 1.46 and 1.41 times higher in the CA-ST3 than in the CA-
ST2 (Table 3). Rock fragments and sand content were 2.71 and 1.37 times higher in the CA-ST2 than
in the CA-ST3. The dominant soil texture is sandy loam in the CA-ST2 and loam in the CA-ST3. The
lower content of silt and clay found in the DA-ST2 can be associated with the higher soil loss rates
observed in this area because continuous water soil erosion tends to reduce the amount of fine soil
particles in the topsoil layer [42].
Figure 5. Map of the soil organic matter content (A) and corresponding histograms of the DA-ST2 (B)
and DA-ST3 (C) in the total drainage area (B.1 and C.1) and within the vineyard (B.2 and C.2).
Table 3. Physical and chemical soil parameters in the drainage area of the two sediment traps.
Sub-basin BD RF Voleff Clay Silt Sand Texture SOM
ID gr·cm–3 % Weight % Vol. % % % Type %
DA-ST2: all area 1.190 34.2 86.19 6.34 31.22 62.44 Sandy loam 4.02 ± 5.10
DA-ST2: vineyard 1.286 29.0 86.76 6.95 32.99 60.06 Sandy loam 1.64 ± 0.19
DA-ST3: all area 1.450 12.6 92.68 8.96 45.54 45.50 Loam 1.66 ± 0.60
DA-ST3: vineyard 1.448 12.5 92.74 9.01 45.64 45.35 Loam 1.60 ± 0.19
BD: bulk density; RF: rock fragments; Voleff: effective volume; SOM: Soil organic matter content.
The SOM content in the DA-ST2 (𝑂𝑀𝑆𝑜𝑖𝑙 = 4.02) was higher than in the DA-ST3 (𝑂𝑀𝑆𝑜𝑖𝑙
= 1.66)
due to the presence of a small forest area in the upper part of the drainage area (Table 3). The soil in
this patch of Valencian oaks (Quercus faginea; a species of oak native to the western Mediterranean
region in the Iberian Peninsula) have high values of SOM (between 11.2% and 15.8%). When the
spatial analysis was limited to the area occupied by the vineyard, the SOM content was almost the
same in the DA-ST2-vineyard (𝑂𝑀𝑆𝑜𝑖𝑙 = 1.64) and DA-ST3-vineyard (𝑂𝑀𝑆𝑜𝑖𝑙
= 1.60). These results
did not reflect higher values of SOM in the DA with higher ground cover and partially disagree with
those obtained by Novara et al. [8], who found that, after five years of cover crop soil management
in Italian vineyards, there were higher SOC contents in the CC fields compared to the CT fields. That
fact could be explained by the recent short duration of the CC in the study area, lower than one year
at the beginning of the field surveys and around two years at the end of the study. Therefore, more
marked differences are expected to be found in the next years when the CC implementation reach a
longer duration.
Figure 5. Map of the soil organic matter content (A) and corresponding histograms of the DA-ST2 (B)and DA-ST3 (C) in the total drainage area (B.1 and C.1) and within the vineyard (B.2 and C.2).

Land 2020, 9, 230 11 of 16
Table 3. Physical and chemical soil parameters in the drainage area of the two sediment traps.
Sub-basin BD RF Voleff Clay Silt Sand Texture SOM
ID gr·cm−3 % Weight % Vol. % % % Type %
DA-ST2: all area 1.190 34.2 86.19 6.34 31.22 62.44 Sandy loam 4.02 ± 5.10DA-ST2: vineyard 1.286 29.0 86.76 6.95 32.99 60.06 Sandy loam 1.64 ± 0.19
DA-ST3: all area 1.450 12.6 92.68 8.96 45.54 45.50 Loam 1.66 ± 0.60DA-ST3: vineyard 1.448 12.5 92.74 9.01 45.64 45.35 Loam 1.60 ± 0.19
BD: bulk density; RF: rock fragments; Voleff: effective volume; SOM: Soil organic matter content.
The SOM content in the DA-ST2 (OMSoil = 4.02) was higher than in the DA-ST3 (OMSoil = 1.66)due to the presence of a small forest area in the upper part of the drainage area (Table 3). The soil inthis patch of Valencian oaks (Quercus faginea; a species of oak native to the western Mediterraneanregion in the Iberian Peninsula) have high values of SOM (between 11.2% and 15.8%). When the spatialanalysis was limited to the area occupied by the vineyard, the SOM content was almost the same in theDA-ST2-vineyard (OMSoil = 1.64) and DA-ST3-vineyard (OMSoil = 1.60). These results did not reflecthigher values of SOM in the DA with higher ground cover and partially disagree with those obtainedby Novara et al. [8], who found that, after five years of cover crop soil management in Italian vineyards,there were higher SOC contents in the CC fields compared to the CT fields. That fact could be explainedby the recent short duration of the CC in the study area, lower than one year at the beginning of thefield surveys and around two years at the end of the study. Therefore, more marked differences areexpected to be found in the next years when the CC implementation reach a longer duration.
3.3. OM Enrichment Ratio, Cover Crops, and SDGs
When only the drainage area within the vineyard of each ST was considered, the EROM was similarbetween the two STs—2.61 and 3.07 in ST2 and ST3, respectively (Figure 6A). However, when the totaldrainage area of the two STs were included in the analysis, clear differences appeared between thetwo STs: 1.06 and 2.97 in ST2 and ST3, respectively. At TIP scale and accounting the drainage areawithin the vineyard, the EROM ranged between 0.37 and 3.79 in ST2 and between 2.01 and 4.37 inST3 (Figure 6B). Ruiz-Colmenero et al. [36] found similar EROM in vineyards located in Central Spain,with ratios ranging from 1.4 to 2. The clear temporal changes in the SY and the concentration of OMSed
and EROM over the test period suggest that the management of the CC as a permanent cover insteadof the current use as a temporary cover could help minimize the loss of soil and OM in the intenserainfall events that commonly happen in autumn in the study area. Schütte et al. [47] recommendedthis practice after evaluating soil loss at two different European wine regions (one in Spain and anotherin Austria).
Our research at the Somontano Certified Region in Aragón, where the rainfed vineyard in rollinglandscapes produces high soil losses, demonstrates that there are solutions to achieve a sustainablemanagement. The use of a cover crop of common sainfoin (Onobrychis viciifolia Scop., 1772) in theinter-row area of the vineyards contributed to reduce both the soil and OM losses (from 1.29 to0.35 kgOM ha−1 yr−1). This reduction in 3.6 times was also found when the soil losses in other cropswere measured. Cerdà et al. [48] measured very low soil erosion rates (0.12 Mg ha−1 h−1) in citrusorchards when covered by weeds or catch crops. However, similar rainfall simulation experimentscontributed 15.7 Mg ha−1 h−1 in a clementine plantation managed with herbicides, where no plantcover was present. The key role that vegetation plays in agriculture land has been also assessed byMalik et al. [49] with the use of Lolium multiflorum L., Festuca arundinacea L., Trifolium incarnatum L.,and Lespedeza cuneata (Dumont) G. Don. along 585 days, measuring a reduction in 64%, 61%, 51%,and 37% in soil erosion, respectively.

Land 2020, 9, 230 12 of 16
Land 2020, 9, x FOR PEER REVIEW 11 of 16
3.3. OM Enrichment Ratio, Cover Crops, and SDGs
When only the drainage area within the vineyard of each ST was considered, the EROM was
similar between the two STs—2.61 and 3.07 in ST2 and ST3, respectively (Figure 6a). However, when
the total drainage area of the two STs were included in the analysis, clear differences appeared
between the two STs: 1.06 and 2.97 in ST2 and ST3, respectively. At TIP scale and accounting the
drainage area within the vineyard, the EROM ranged between 0.37 and 3.79 in ST2 and between 2.01
and 4.37 in ST3 (Figure 6b). Ruiz-Colmenero et al. [36] found similar EROM in vineyards located in
Central Spain, with ratios ranging from 1.4 to 2. The clear temporal changes in the SY and the
concentration of OMSed and EROM over the test period suggest that the management of the CC as a
permanent cover instead of the current use as a temporary cover could help minimize the loss of soil
and OM in the intense rainfall events that commonly happen in autumn in the study area. Schütte et
al. [47] recommended this practice after evaluating soil loss at two different European wine regions
(one in Spain and another in Austria).
Figure 6. Mean sediment/soil organic matter enrichment ratio (EROM) in the ST2 and ST3 considering
the whole drainage area or the drainage area within the vineyard (A). Evolution of the EROM at TIP
scale during the text period (B).
Our research at the Somontano Certified Region in Aragón, where the rainfed vineyard in rolling
landscapes produces high soil losses, demonstrates that there are solutions to achieve a sustainable
management. The use of a cover crop of common sainfoin (Onobrychis viciifolia Scop., 1772) in the
inter-row area of the vineyards contributed to reduce both the soil and OM losses (from 1.29 to 0.35
kgOM ha−1 yr−1). This reduction in 3.6 times was also found when the soil losses in other crops were
measured. Cerdà et al. [48] measured very low soil erosion rates (0.12 Mg ha–1 h–1) in citrus orchards
when covered by weeds or catch crops. However, similar rainfall simulation experiments contributed
15.7 Mg ha–1 h–1 in a clementine plantation managed with herbicides, where no plant cover was
present. The key role that vegetation plays in agriculture land has been also assessed by Malik et al.
[49] with the use of Lolium multiflorum L., Festuca arundinacea L., Trifolium incarnatum L., and Lespedeza
cuneata (Dumont) G. Don. along 585 days, measuring a reduction in 64%, 61%, 51%, and 37% in soil
erosion, respectively.
The positive impact of CC in the control of soil erosion is a consequence of two different
processes. The first one is the protective cover of the plant that reduce or avoid the raindrop impact
and the surface wash is also reduced due to the lower runoff velocity as a consequence of the stems
of the plants. The rainfall interception of the plants also reduces the effective rainfall that reach the
soil. This is the main impact of the straw cover that acts as a mulch and is being applied as a quick
strategy to control soil loss [50]. However, the vegetation cover is also relevant to improve soil quality.
Vegetation is a key component to reduce soil losses, as has been demonstrated here, but the plant
cover and the root system also induce an increase in the soil biota, organic matter, aggregate stability,
and soil porosity. Van Hall et al. [51] found an increase in soil organic carbon, total nitrogen, and
aggregate stability and a decrease in soil bulk density and pH along a vegetation succession. This
Figure 6. Mean sediment/soil organic matter enrichment ratio (EROM) in the ST2 and ST3 consideringthe whole drainage area or the drainage area within the vineyard (A). Evolution of the EROM at TIPscale during the text period (B).
The positive impact of CC in the control of soil erosion is a consequence of two different processes.The first one is the protective cover of the plant that reduce or avoid the raindrop impact and thesurface wash is also reduced due to the lower runoff velocity as a consequence of the stems of the plants.The rainfall interception of the plants also reduces the effective rainfall that reach the soil. This is themain impact of the straw cover that acts as a mulch and is being applied as a quick strategy to controlsoil loss [50]. However, the vegetation cover is also relevant to improve soil quality. Vegetation is akey component to reduce soil losses, as has been demonstrated here, but the plant cover and the rootsystem also induce an increase in the soil biota, organic matter, aggregate stability, and soil porosity.Van Hall et al. [51] found an increase in soil organic carbon, total nitrogen, and aggregate stability anda decrease in soil bulk density and pH along a vegetation succession. This was a long-term impact of50 years. At the seasonal scale, Wu et al. [52] measured an increase in the soil quality due to the soilmicrobial biomass and community structure enhancement as a consequence of the Kudzu vine coverin the Jinsha River Valley in southwest China.
The impact of the CC researched at the Somontano wine production area affect the soil clearlyreducing the losses of soil matter, and thus, of organic carbon. This impact will accumulate yearly.Furthermore, there will be an improvement of the soil quality that will result in the reduction of the soillosses to low values, as the long-term measurements demonstrate. The impact of the use of mulchesor cover crops induce a reduction in soil losses in the short term, and after a few years, the soil isimproved due to the reduction of soil and carbon (and water, seeds, biota, etc.) losses. That is whatDerpsch et al. [53] found between 1977 and 1984 in Paraná (Brazil), which is related to the findings ofMazzoncini et al. [54] regarding the link to the improvement in soil organic cover and total nitrogencontent or the findings of Sainju et al. [55] in sandy loam soil in Georgia, USA.
Our findings and the literature review confirm that cover crops are an option to changeunsustainable agriculture management into a management that can contribute to achieve the SDGs ofthe United Nations and the Land Degradation Neutrality challenge [5]. This should be related to the useof more environmentally friendly management strategies in agriculture such as organic farming andregenerative agriculture [56,57]. This is especially relevant for vineyards due to the high erosion ratesmeasured in different parts of the world where rainfall simulator experiments [58], plots under naturalrainfall [59], modelling [60], and long-term measurement strategies such as botanical bench-marks [61]and the improved stock-unearthing method (ISUM) [62] demonstrate that the current situation of thevineyards is not sustainable.
4. Conclusions
To reach the SDGs of the United Nations, transitional changes in the farm management are neededto achieve sustainable production of food and reduce the impact generated by crop management that

Land 2020, 9, 230 13 of 16
threatens soil health. Soil organic matter is a key component of the soil system that needs to be enhancedto reduce the impact of the global warming and reach land degradation neutrality. Our researchdemonstrates that the use of cover crops contributes to reduce soil organic matter losses. Despitesimilar concentrations of organic matter in the soil and sediments that appeared in distinct areas withinthe vineyard, the annual rates of sediment yield and soil organic matter losses were clearly higher inplots with lower plant cover. Over the experimental period, the concentration of organic matter in thesediment showed a negative relationship with the net soil loss. The observed significant differencesbetween the content of organic matter in the sediment in the months with low and moderate-to-highground cover suggested that permanent cover crops should be considered to extend the benefits of theground cover. Overall, cover crops are an efficient strategy to control unsustainable soil and organicmatter losses measured in vineyards, and this is a key contribution to achieve the SDGs of the UnitedNations before 2030.
Supplementary Materials: The following Google Earth file is available online: http://www.mdpi.com/2073-445X/9/7/230/s1.
Author Contributions: All authors made substantial contributions to this work. In particular, M.L.-V. conceivedthe study and participated in all tasks, E.C.-S. participated in the data analysis and mapping, S.Á. participated inthe field surveys and data processing, and A.C. participated in the interpretation of the data and results and thewriting of the manuscript. All authors have read and agreed to the published version of the manuscript.
Funding: This research was funded by the project “Environmental and economic impact of soil loss (soil erosionfootprint) in agro-ecosystems of the Ebro river basin: numerical modelling and scenario analysis (EroCostModel)(CGL2014-54877-JIN)” of the Spanish Ministry of Economy and Competitiveness.
Acknowledgments: We thank Gonzalo Alcalde Fábregas (Fábregas Cellar, D.O. Somontano) for permitting theuse of the vineyards where this research was done. Three reviewers contributed with constructive criticism to thispaper. S.D. Keesstra kindly improved the last draft manuscript.
Conflicts of Interest: The authors declare no conflict of interest. The funders had no role in the design of thestudy; in the collection, analyses, or interpretation of data; in the writing of the manuscript, or in the decision topublish the results.
References
1. UN—United Nations. Transforming our World: The 2030 Agenda for Sustainable Development. ResolutionAdopted by the General Assembly on 25 September 2015. United Nations 21 October 2015, #70/1, pp. 35.Available online: https://www.un.org/ga/search/view_doc.asp?symbol=A/RES/70/1&Lang=E (accessed on 18June 2020).
2. Chasek, P.; Safriel, U.; Shikongo, S.; Fuhrman, V.F. Operationalizing Zero Net Land Degradation: The nextstage in international efforts to combat desertification? J. Arid Environ. 2015, 112, 5–13. [CrossRef]
3. Keesstra, S.; Mol, G.; De Leeuw, J.; Okx, J.; Molenaar, C.; De Cleen, M.; Visser, S. Soil-Related SustainableDevelopment Goals: Four Concepts to Make Land Degradation Neutrality and Restoration Work. Land 2018,7, 133. [CrossRef]
4. Stavi, I.; Lal, R. Achieving Zero Net Land Degradation: Challenges and opportunities. J. Arid Environ. 2015,112, 44–51. [CrossRef]
5. Keesstra, S.D.; Bouma, J.; Wallinga, J.; Tittonell, P.; Smith, P.; Fresco, L.O. The significance of soils and soilscience towards realization of the United Nations Sustainable Development Goals. Soil 2016, 2, 111–128.[CrossRef]
6. Visser, S.; Keesstra, S.; Maas, G.; De Cleen, M.; Molenaar, C. Soil as a basis to create enabling conditions fortransitions towards sustainable land management as a key to achieve the SDGs by 2030. Sustainability 2019,11, 6792. [CrossRef]
7. Ben-Salem, N.; Álvarez, S.; López-Vicente, M. Soil and water conservation in rainfed vineyards with commonsainfoin and spontaneous vegetation under different ground conditions. Water 2018, 10, 1058. [CrossRef]
8. Novara, A.; Minacapilli, M.; Santoro, A.; Rodrigo-Comino, J.; Carrubba, A.; Sarno, M.; Venezia, G.; Gristina, L.Real cover crops contribution to soil organic carbon sequestration in sloping vineyard. Sci. Total Environ.2019, 652, 300–306. [CrossRef]

Land 2020, 9, 230 14 of 16
9. Rodrigo-Comino, J.; Ponsoda-Carreres, M.; Salesa, D.; Terol, E.; Gyasi-Agyei, Y.; Cerdà, A. Soil erosionprocesses in subtropical plantations (Diospyros kaki) managed under flood irrigation in Eastern Spain. Singap.J. Trop. Geogr. 2020, 41, 120–135. [CrossRef]
10. Borrelli, P.; Panagos, P.; Montanarella, L. New insights into the geography and modelling of wind erosion inthe european agricultural land. Application of a spatially explicit indicator of land susceptibility to winderosion. Sustainability 2015, 7, 8823. [CrossRef]
11. Dai, E.; Yin, L.; Wang, Y.; Ma, L.; Tong, M. Quantitative Assessment of the Relative Impacts of Land Use andClimate Change on the Key Ecosystem Services in the Hengduan Mountain Region, China. Sustainability2020, 12, 4100. [CrossRef]
12. García-Ruiz, J.M. The effects of land uses on soil erosion in Spain: A review. Catena 2010, 81, 1–11. [CrossRef]13. Panagos, P.; Borrelli, P.; Poesen, J.; Ballabio, C.; Lugato, E.; Meusburger, K.; Montanarella, L.; Alewell, C.
The new assessment of soil loss by water erosion in Europe. Environ. Sci. Policy 2015, 54, 438–447. [CrossRef]14. Gómez, J.A.; Romero, P.; Giráldez, J.V.; Fereres, E. Experimental assessment of runoff and soil erosion in
an olive grove on a Vertic soil in southern Spain as affected by soil management. Soil Use Manag. 2004, 20,426–431. [CrossRef]
15. Novara, A.; Stallone, G.; Cerdà, A.; Gristina, L. The effect of shallow tillage on soil erosion in a semi-aridvineyard. Agronomy 2019, 9, 257. [CrossRef]
16. Rodrigo-Comino, J.; Keesstra, S.D.; Cerdà, A. Connectivity assessment in Mediterranean vineyards usingimproved stock unearthing method, LiDAR and soil erosion field surveys. Earth Surf. Process. Landf. 2018,43, 2193–2206. [CrossRef]
17. Raya, A.M.; Zuazo, V.D.; Martínez, J.F. Soil erosion and runoff response to plant-cover strips on semiaridslopes (SE Spain). Land Degrad. Dev. 2006, 17, 1–11. [CrossRef]
18. Keesstra, S.; Pereira, P.; Novara, A.; Brevik, E.C.; Azorin-Molina, C.; Parras-Alcántara, L.; Jordán, A.; Cerdà, A.Effects of soil management techniques on soil water erosion in apricot orchards. Sci. Total Environ. 2016, 551,357–366. [CrossRef]
19. Kaye, J.P.; Quemada, M. Using cover crops to mitigate and adapt to climate change. A review. Agron. Sustain.Dev. 2017, 37, 4. [CrossRef]
20. Basche, A.D.; DeLonge, M.S. Comparing infiltration rates in soils managed with conventional and alternativefarming methods: A meta-analysis. PLoS ONE 2019, 14, e0215702. [CrossRef]
21. Chalise, K.S.; Singh, S.; Wegner, B.R.; Kumar, S.; Pérez-Gutiérrez, J.D.; Osborne, S.L.; Rohila, J.S. Cover cropsand returning residue impact on soil organic carbon, bulk density, penetration resistance, water retention,infiltration, and soybean yield. Agron. J. 2019, 111, 99–108. [CrossRef]
22. López-Vicente, M.; García-Ruiz, R.; Guzmán, G.; Vicente-Vicente, J.L.; Van Wesemael, B.; Gómez, J.A.Temporal stability and patterns of runoff and runon with different cover crops in an olive orchard (SWAndalusia, Spain). Catena 2016, 147, 125–137. [CrossRef]
23. Cerdà, A.; Rodrigo-Comino, J.; Giménez-Morera, A.; Novara, A.; Pulido, M.; Kapovic-Solomun, M.;Keesstra, S.D. Policies can help to apply successful strategies to control soil and water losses. The case ofchipped pruned branches (CPB) in Mediterranean citrus plantations. Land Use Policy 2018, 75, 734–745.[CrossRef]
24. Ruiz-Colmenero, M.; Bienes, R.; Eldridge, D.J.; Marques, M.J. Vegetation cover reduces erosion and enhancessoil organic carbon in a vineyard in the central Spain. Catena 2013, 104, 153–160. [CrossRef]
25. García-Díaz, A.; Marqués, M.J.; Sastre, B.; Bienes, R. Labile and stable soil organic carbon and physicalimprovements using groundcovers in vineyards from central Spain. Sci. Total Environ. 2018, 621, 387–397.[CrossRef]
26. Vicente-Vicente, J.L.; García-Ruiz, R.; Francaviglia, R.; Aguilera, E.; Smith, P. Soil carbon sequestrationrates under Mediterranean woody crops using recommended management practices: A meta-analysis.Agric. Ecosyst. Environ. 2016, 235, 204–214. [CrossRef]
27. Guzmán, G.; Cabezas, J.M.; Sánchez-Cuesta, R.; Lora, Á.; Bauer, T.; Strauss, P.; Winter, S.; Zaller, J.G.;Gómez, J.A. A field evaluation of the impact of temporary cover crops on soil properties and vegetationcommunities in southern Spain vineyards. Agric. Ecosyst. Environ. 2019, 272, 135–145. [CrossRef]
28. Rodríguez-Lorenzo, M.; Cibriáin, J.F.; Sagüés, A.; Abad, F.J.; Martínez-Zapater, J.M.; Ibáñez, J. Intra-varietaldiversity for agronomic traits in ‘Garnacha Blanca’. Vitis J. Grapevine Res. 2019, 58, 33–35. [CrossRef]

Land 2020, 9, 230 15 of 16
29. Capó-Bauçà, S.; Marqués, A.; Llopis-Vidal, N.; Bota, J.; Baraza, E. Long-term establishment of natural greencover provides agroecosystem services by improving soil quality in a Mediterranean vineyard. Ecol. Eng.2019, 127, 285–291. [CrossRef]
30. Novara, A.; Pulido, M.; Rodrigo-Comino, J.; Di Prima, S.; Smith, P.; Gristina, L.; Keesstra, S. Long-termorganic farming on a citrus plantation results in soil organic matter recovery. Geogr. Res. Lett. 2019, 45,271–286. [CrossRef]
31. Rodrigo-Comino, J. Five decades of soil erosion research in “terroir”. The State-of-the-Art. Earth Sci. Rev.2018, 179, 436–447. [CrossRef]
32. Wang, X.; Cammeraat, E.L.H.; Cerli, C.; Kalbitz, K. Soil aggregation and the stabilization of organic carbon asaffected by erosion and deposition. Soil Biol. Biochem. 2014, 72, 55–65. [CrossRef]
33. Boix-Fayos, C.; de Vente, J.; Albaladejo, J.; Martínez-Mena, M. Soil carbon erosion and stock as affected byland use changes at the catchment scale in Mediterranean ecosystems. Agric. Ecosyst. Environ. 2009, 133,75–85. [CrossRef]
34. Martínez-Mena, M.; López, J.; Almagro, M.; Albaladejo, J.; Castillo, V.; Ortiz, R.; Boix-Fayos, C. Organic carbonenrichment in sediments: Effects of rainfall characteristics under different land uses in a Mediterranean area.Catena 2012, 94, 36–42. [CrossRef]
35. Lal, R. Soil erosion and gaseous emissions. Appl. Sci. 2020, 10, 2784. [CrossRef]36. Ruiz-Colmenero, M.; Bienes, R.; Marques, M.J. Soil and water conservation dilemmas associated with the
use of green cover in steep vineyards. Soil Tillage Res. 2011, 117, 211–223. [CrossRef]37. López-Vicente, M.; Álvarez, S. Stability and patterns of topsoil water content in rainfed vineyards, olive
groves, and cereal fields under different soil and tillage conditions. Agric. Water Manag. 2018, 201, 167–176.[CrossRef]
38. López-Vicente, M.; Álvarez, S. Influence of DEM resolution on modelling hydrological connectivity in acomplex agricultural catchment with woody crops. Earth Surf. Process. Landf. 2018, 43, 1403–1415. [CrossRef]
39. Biddoccu, M.; Ferraris, S.; Pitacco, A.; Cavallo, E. Temporal variability of soil management effects on soilhydrological properties, runoff and erosion at the field scale in a hillslope vineyard, North-West Italy.Soil Tillage Res. 2017, 165, 46–58. [CrossRef]
40. Gómez, J.A.; Guzmán, G.; Giráldez, J.V.; Fereres, E. The influence of cover crops and tillage on waterand sediment yield, and on nutrient, and organic matter losses in an olive orchard on a sandy loam soil.Soil Tillage Res. 2009, 106, 137–144. [CrossRef]
41. Wang, L.; Huang, X.; Fang, N.F.; Niu, Y.H.; Wang, T.W.; Shi, Z.H. Selective transport of soil organic andinorganic carbon in eroded sediment in response to raindrop sizes and inflow rates in rainstorms. J. Hydrol.2019, 575, 42–53. [CrossRef]
42. Hao, H.X.; Wang, J.G.; Guo, Z.L.; Hua, L. Water erosion processes and dynamic changes of sediment sizedistribution under the combined effects of rainfall and overland flow. Catena 2019, 173, 494–504. [CrossRef]
43. López-Vicente, M.; Quijano, L.; Gaspar, L.; Palazón, L.; Navas, A. Severe soil erosion during a 3-dayexceptional rainfall event: Combining modelling and field data for a fallow cereal field. Hydrol. Process.2015, 29, 2358–2372. [CrossRef]
44. Bieger, K.; Hörmann, G.; Fohrer, N. Detailed spatial analysis of SWAT-simulated surface runoff and sedimentyield in a mountainous watershed in China | [Analyse spatiale détaillée du ruissellement et de l’apport desédiments simulés par SWAT dans un bassin versant montagneux en Chine]. Hydrol. Sci. J. 2015, 60, 784–800.[CrossRef]
45. Klik, A.; Rosner, J. Long-term experience with conservation tillage practices in Austria: Impacts on soilerosion processes. Soil Tillage Res. 2020, 203, 104669. [CrossRef]
46. Gómez, J.A.; Francia, J.R.; Guzmán, G.; Vanwalleghem, T.; Durán-Zuazo, V.H.; Castillo, C.; Aranda, M.;Cárceles, B.; Moreno, A.; Torrent, J.; et al. Lateral transfer of organic carbon and phosphorus by water erosionat hillslope scale in Southern Spain Olive Orchards. Vadose Zone J. 2017, 16, 1–15. [CrossRef]
47. Schütte, R.; Plaas, E.; Gómez, J.A.; Guzmán, G. Profitability of erosion control with cover crops in Europeanvineyards under consideration of environmental costs. Environ. Dev. 2020, 100521. [CrossRef]
48. Cerdà, A.; Rodrigo-Comino, J.; Giménez-Morera, A.; Keesstra, S.D. Hydrological and erosional impact andfarmer’s perception on catch crops and weeds in citrus organic farming in Canyoles river watershed, EasternSpain. Agric. Ecosyst. Environ. 2018, 258, 49–58. [CrossRef]

Land 2020, 9, 230 16 of 16
49. Malik, R.K.; Green, T.H.; Brown, G.F.; Mays, D. Use of cover crops in short rotation hardwood plantations tocontrol erosion. Biomass Bioenergy 2000, 18, 479–487. [CrossRef]
50. de Lima, J.L.M.P.; Santos, L.; Mujtaba, B.; de Lima, M.I.P. Laboratory assessment of the influence of rice strawmulch size on soil loss. Adv. Geosci. 2019, 48, 11–18. [CrossRef]
51. Van Hall, R.L.; Cammeraat, L.H.; Keesstra, S.D.; Zorn, M. Impact of secondary vegetation succession on soilquality in a humid Mediterranean landscape. Catena 2017, 149, 836–843. [CrossRef]
52. Wu, H.; Xiong, D.H.; Xiao, L.; Zhang, S.; Yuan, Y.; Su, Z.A.; Zhang, B.J.; Yang, D. Effects of vegetationcoverage and seasonal change on soil microbial biomass and community structure in the dry-hot valleyregion. J. Mt. Sci. 2018, 15, 1546–1558. [CrossRef]
53. Derpsch, R.; Sidiras, N.; Roth, C.H. Results of studies made from 1977 to 1984 to control erosion by covercrops and no-tillage techniques in Paraná, Brazil. Soil Tillage Res. 1986, 8, 253–263. [CrossRef]
54. Mazzoncini, M.; Sapkota, T.B.; Barberi, P.; Antichi, D.; Risaliti, R. Long-term effect of tillage, nitrogenfertilization and cover crops on soil organic carbon and total nitrogen content. Soil Tillage Res. 2011, 114,165–174. [CrossRef]
55. Sainju, U.M.; Singh, B.P.; Whitehead, W.F. Long-term effects of tillage, cover crops, and nitrogen fertilizationon organic carbon and nitrogen concentrations in sandy loam soils in Georgia, USA. Soil Tillage Res. 2002, 63,167–179. [CrossRef]
56. Altieri, M.A.; Nicholls, C.I.; Montalba, R. Technological approaches to sustainable agriculture at a crossroads:An agroecological perspective. Sustainability 2017, 9, 349. [CrossRef]
57. Eyhorn, F.; Muller, A.; Reganold, J.P.; Frison, E.; Herren, H.R.; Luttikholt, L.; Smith, P. Sustainability in globalagriculture driven by organic farming. Nat. Sustain. 2019, 2, 253–255. [CrossRef]
58. Arnaez, J.; Lasanta, T.; Ruiz-Flaño, P.; Ortigosa, L. Factors affecting runoff and erosion under simulatedrainfall in Mediterranean vineyards. Soil Tillage Res. 2007, 93, 324–334. [CrossRef]
59. Battany, M.C.; Grismer, M.E. Rainfall runoff and erosion in Napa Valley vineyards: Effects of slope, cover andsurface roughness. Hydrol. Process. 2000, 14, 1289–1304. [CrossRef]
60. Paroissien, J.B.; Darboux, F.; Couturier, A.; Devillers, B.; Mouillot, F.; Raclot, D.; Le Bissonnais, Y. A method formodeling the effects of climate and land use changes on erosion and sustainability of soil in a Mediterraneanwatershed. J. Environ. Manag. 2015, 150, 57–68. (In French) [CrossRef]
61. Casalí, J.; Giménez, R.; De Santisteban, L.; Álvarez-Mozos, J.; Mena, J.; de Lersundi, J.D.V. Determination oflong-term erosion rates in vineyards of Navarre (Spain) using botanical benchmarks. Catena 2009, 78, 12–19.[CrossRef]
62. Rodrigo-Comino, J.; Davis, J.; Keesstra, S.D.; Cerdà, A. Updated measurements in vineyards improvesaccuracy of soil erosion rates. Agron. J. 2018, 110, 411–417. [CrossRef]
© 2020 by the authors. Licensee MDPI, Basel, Switzerland. This article is an open accessarticle distributed under the terms and conditions of the Creative Commons Attribution(CC BY) license (http://creativecommons.org/licenses/by/4.0/).