determining the validity of the topographic lidar … determining the validity of the topographic...
TRANSCRIPT

I
DeterminingtheValidityoftheTopographicLidarEquation
by
EneaRrokaj
Aseniorthesissubmittedtothefacultyof
BrighamYoungUniversity–Idaho
inpartialfulfillmentoftherequirementsforthedegreeof
BachelorofScience
DepartmentofPhysics
BrighamYoungUniversity–Idaho
July,2016

II

III
BRIGHAMYOUNGUNIVERSITY–IDAHO
DEPARTMENTAPPROVAL
ofaseniorthesissubmittedby
EneaRrokaj
This thesis has been reviewed by the research committee, senior thesiscoordinator,anddepartmentchairandhasbeenfoundtobesatisfactory.________________ ____________________________________________________Date ToddLines,ThesisAdvisor________________ ____________________________________________________Date JonPaulJohnson,ThesisCommitteeMember________________ ____________________________________________________Date RyanNielson,ThesisCommitteeMember________________ ____________________________________________________Date RichardHatt,ThesisCommitteeMember________________ ____________________________________________________Date EvanHansen,SeniorThesisCoordinator________________ ____________________________________________________Date StephenMcNeil,DepartmentChair

IV

V
ABSTRACT
DeterminingtheValidityoftheTopographicLidarEquation
EneaRrokaj
DepartmentofPhysicsBachelorofScience
ThepurposeofthisexperimentistodeterminethevalidityoftheTopographicLidarEquation.The lidar systemwas built using a class iii-b, 633 nm, 20mW helium-neon laser, aMode 1Celestron114AZ,D=114mmFL=900andadetectorwhichconsistsofacircuitonabreadboard,aDAQandalaptopforsignalanalysis.Datawascollectedinadarkroomwiththelaserbeingtheonlysourceoflight.Todeterminethevoltagegainedbythecircuit,thephotodiodewashitwithdifferent laserpoweroutputs (using theclass iii-b laserwithdifferentneutraldensity filters).Then thephotodiode integrated in the circuitwashitwith the same laser. Thiswasdone todeterminetherelationshipbetweenthevoltagethatthecomputerreadsandthepowerinputofthelidar.Thelaserilluminatedthesurfaceofaclipboard.Theexperimentwasrepeatedmanytimestodetermineifthedatawasconsistent.Thereturnpowerdetectedbythedetectorwasthenconvertedintoavoltagebyusingtherelationshipbetweenthevoltageandthepowerinput.ThiswasconsistentwiththereturnpowerpredictedbytheTopographicLidarEquationwithanerrorof0.48VwhichfallswithintheerrorpredictedbyLabView(0.52V).

VI

VII
Acknowledgements
First,Iwouldliketothankmyfamilyforalltheirloveandsupport-especiallymysweet
wife Allison. Thank you for being patient, supportive and loving during countless nights of
studyingandtests.Withoutyou,Iwouldnotbeheretoday.TotheBYU-Idahofaculty,thankyou
foryourhardworkanddedication.AveryspecialthankstoToddLines,forthetime,dedication,
supportand insightfuladviceas Iwasworkingonthisproject.ToRichardHatt, thankyoufor
teachingmephysics and for believing inme evenwhen I did not believe inmyself. ToRyan
Nielsonthankyouforyourhelp.ToEvanHansen,thankyouforhelpingmewritethisthesis.To
JonPaulJohnsonthankyouforhelpingwiththealignmentoftheopticalsystem.Lastly,Iwould
liketothankmyfellowpeers.Physicsisdonebestwhendonewithfriends.Ihavemadesome
life-longfriendsduringmytimeatthisUniversity.ToNeishanAli,AngelRoystonandBenFarley-
thankyouforyoursupportandfriendship.

VIII
TableofContents
Chapter1Introduction...........................................................................................................11.1 ABriefIntroductiontoLidarSystems...................................................................................11.2LidarApplications.......................................................................................................................3
Chapter2Methods.................................................................................................................42.1BasicSystemDesignofaLidar....................................................................................................42.2TheTransmitter..........................................................................................................................5
2.2.2LaserSafety.................................................................................................................................52.3TheReceiver...............................................................................................................................6
2.3.1TheTelescope.............................................................................................................................62.3.2TheDetector...............................................................................................................................7
2.4MathematicalModelforTheLidar............................................................................................10
Chapter3CalculationsandResults........................................................................................113.1CalculatingtheGeometricFormFactor.....................................................................................113.2PowerInputCalculation...........................................................................................................133.3VoltageDetectedbytheDetector.............................................................................................143.4CalculatingthePowerInputfromtheResponsivityoftheDetector..........................................15
Chapter4Conclusions...........................................................................................................164.1Results......................................................................................................................................164.2FutureWork.............................................................................................................................20
IX
Figure1Basicdesignofthelidarsystem.......................................................................................2Figure2Basiclidardesignusedfortheexperiment......................................................................5Figure3Thetelescope...................................................................................................................7Figure4Circuitdesign....................................................................................................................7Figure5Detectorresponsivity.......................................................................................................9Figure6LabVIEWcode.................................................................................................................10Figure7Overlappingfieldofviewsofthelaserandthetelescope.............................................12Figure8Opticalalignment...........................................................................................................12Figure9Mathematicacodefortheerrorpropagation................................................................14Figure10FrontpaneloftheLabVIEWprogram...........................................................................15Figure11Voltagecalculatedat3.35m........................................................................................17Figure12Voltagecalculatedat2.50m........................................................................................18Figure13Therelationshipbetweentherangeandvoltage........................................................19

1
Chapter1Introduction1.1 ABriefIntroductiontoLidarSystems
Lidar systems are extremely useful deviceswith a large range of applications. They are
broadly used in industry, in space exploration and technology, meteorology, atmospheric
sciencesandbythegovernmentformilitarypurposes.Thereisaresearchgroupatthephysics
departmentofBYU-Idahothatdoesresearchinatmosphericsciences.ForthisprojectIbuilta
lidarsystemtohelpstudentswhowishtoconductresearchinatmosphericscienceshaveaccess
toadevicetohelpthemperformthatresearch.ThemainfunctionofthelidarIbuiltistocalculate
distances, however with proper modification it can also be used to perform the functions
mentionedabove.
Alidar(lightdetectorandranging)issimilartoradarwhichisatoolabletodetectdistance,
velocity,andthelocationofanobjectusingradiowaves.Radiowaveshavealargewavelength
(0.001mto300,000m)andthereforeareveryusefulindetectinglargeobjects.However,alidar
usesalaser(UVtoIRfrequency)insteadofradiowavestodetectthetarget.Alidarcandetect
thevelocity,distance,andlocationofanobject.Lidaroftenuseslightfrequencieswellwithinthe
visiblelightwavelengthandasaresultitcandetectverysmalltargets.Alidarisalightsensor
withitsownlightsource.Itoperatesbysendingatimedpulseoflightfromthelasertothetarget
andbackagain.Itconsistsoftwomaincomponents:atransmitterandareceiver.Thetransmitter
hasalightsource(laser)andanopticalsystem(thepulseofthelidar).Thereceiverconsistsofa
pulsegenerator(usuallyatelescope)andadetectorsystem(thedetectorcapturesthelightand
converts it intoasignal).Thedifferencebetweena lidarandaradar isthata lidarcandetect

2
objectswithanabsolutelocationwhereasradarcandetectanyobjectinthepathoftheradio
wave.Figure1showsthebasicdesignforalidarsystem.(ImageCredit:Lidar
Notes,ToddLines)
Figure1Basicdesignofthelidarsystem
ThelidarsystemIbuiltforthisexperimentconsistsofaclassiii-bhelium-neonlaserwith
awavelengthof633nm,apoweroutput,lightintensityofthelaserasafunctionofsurface,of
20mWandaNewtoniantelescope(brand:Celestron).ADAQconnectedtoabreadboard(with
acircuit)andalaptopthatoperatesaLabVIEWprogramwasalsousedduringthisexperiment.
MoredetailswillbeprovidedonthecircuitdetectorandtheLabVIEWprograminthesectionsto
follow.

3
1.2LidarApplications
Oneapplicationofalidarsystemistodeterminetheaerosolheightdistribution.Byusing
ananalyticsolutiontothelidarequation:𝑃"# =%&'(∗*∗+,∗-
.∗/,∗ 𝜁 ∗ 𝐺 ∗ 𝑇
Thetermspowerinputandpoweroutputwillbeusedabundantlyinthispaperthusitis
importantthattheirmeaningisexplained.Poweroutputisthelightintensity(asafunctionof
surface)generatedbythelaser.Itisgivenbythespecksheetsofthelaser.Powerinputisthe
returnlightintensity(asafunctionofsurface)detectedbythephotodiode.Specificdetailsabout
the topographic lidar equation will be provided in the sections to follow. Considering the
molecularpropertiesoftheatmosphere,andbyconsideringthescatteringofaerosolsFernald,
HermanandReaganwereabletodeterminethetheheightoftheaerosolintheatmosphere.
(Fernald,Herman,&Reagan,1971)1
Lidarsystemsareusefuldevicesinwarfareandmilitaryapplications.Theycandetermine
thechemicalcompositionofsmokecloudsandbydoingso,onecanknowwhatkindofweapon
was detonated to cause the smoke cloud. A newmethod was developed to determine the
chemical compositionof the smokeclouds.Themethod relieson theknowledgeof the total
transmissionthroughthedistantrangeobservedandonapproximationofthebackscatter-to-
extinctionratioineachrangecell(unlessthevalueofbackscatter-to-extinctionratioisknownto
bethesameforeachrangecell).Inthismethod,thefirstorderelasticscatteringsufficesandas
aresulttheusuallidarequationisused.(Godecke,etal.)2
4
Anotherapplicationoflidarisinatmosphericandenvironmentalsciences.Itcandetect
pollutantintheatmosphere.Byusingthenarrowspectralbandwidthofheterodyneradiometers,
one can construct highly selective pollutant sensing devices. The availability of pollutant
absorptionlinesandwavelengthdependenceofheterodynesensitivityfavortheinfra-redregion.
ThissystemisespeciallyefficientindetectingNOpollutionsintheatmosphere.(Menzies,1972)3
Lidar are also used for calculating distances and three dimensionalmapping. Photon-
counting laser mapping is a technique that uses timed photon pulses to illuminate targets.
Combining this technique with the lidar equation, one can calculate distances with great
accuracy. Knowing the time of arrival of each photon to a nanosecond precision allows the
constructionofthree-dimensionmapping.(Priedhorsky,Smith,&Ho,1996)4
Anotherapplicationoflidarisincalculatingthewindspeedattheoceansurfaceusinga
satellite-born lidar. For this method, the data from a single-frequency space-born lidar is
combinedwithsatelliteimaginarytodeterminetheaerosolextinctioncoefficientsandthewind
speedattheoceansurface.(Weinman,1988)4
Chapter2Methods
2.1BasicSystemDesignofaLidar
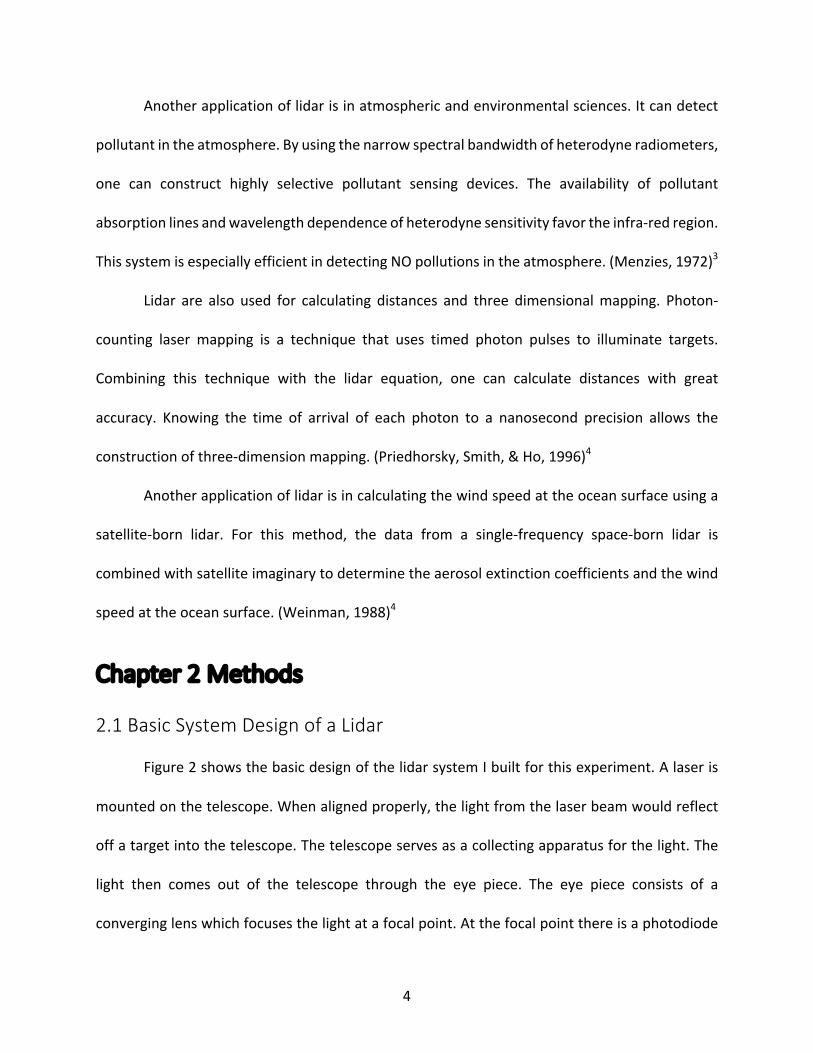
Figure2showsthebasicdesignofthelidarsystemIbuiltforthisexperiment.Alaseris
mountedonthetelescope.Whenalignedproperly,thelightfromthelaserbeamwouldreflect
offatargetintothetelescope.Thetelescopeservesasacollectingapparatusforthelight.The
light then comes out of the telescope through the eye piece. The eye piece consists of a
converginglenswhichfocusesthelightatafocalpoint.Atthefocalpointthereisaphotodiode
5
whichconvertsthelightintoelectriccurrent.Thephotodiodeispartofthedetectorsystem.In
thenextsectionsdetailsaboutthetransmitterandthereceiverusedinthisexperimentwillbe
provided.
Figure2Basiclidardesignusedfortheexperiment
2.2TheTransmitter
Thetwomaincomponentofthetransmitterarethelaserandthepulsegenerator.For
this experiment a pulse transmitter will not be used. The purpose of this experiment is to
determinedistancesinshortrangeswithrelativelylowbackgroundnoise.Thelaserusedforthis
experimentisahelium-neonclassiii-blaserwithawavelengthof633nmandapoweroutputof
20mW.ThelaserbeamisaGaussianbeam.
2.2.2LaserSafety
Laserstandsforlightamplificationbysimulatedemissionofradiation.Likeanytypeof
radiationlightradiationshouldnottreatedlightly.Someofthecommonlaserhazardsareskin
burnsandeyeinjuries.Somecommonskininjuriesarethermalskininjuriesfromahighpower
laser.Thelaserusedforthisexperimenthas20mWpower.Whileworkingwithlasersanother

6
potential hazard is deeper burn penetration caused by lasers with a wave length of 1 µm.
Photochemicalskininjuriesareimportanttoconsiderwhileworkingwithlasers.Sunburn
forscatteredUVlightandthepossibilityofskincancerfromlongtermUVexposurearethetwo
main photochemical hazards. However, for this procedure skin burns will not be a relevant
becausethelaserisonlyat20mWandthewavelengthiswellwithinthevisiblespectrum.
Eyesareverysensitivetohighfrequencyradiation.Whileworkingwithlasersitisalways
recommendedtousinglasereyesafetygoggles.Whileworkingwithlasersoneshouldneverlook
intodirectlyintothelaserbeam.Lookingintoaspecularreflectionofthelaserbeamshouldbe
avoidedaswell.Diffusedreflectionisalsoverydangerousandlookingdirectlyintoscatteredlight
can cause damage to the retna. Lasers can cause serious eye injuries and can even result in
permanentvisionloss.Whenaligningthedevice,lookingthroughtheeyepieceofthetelescope
shouldbeavoided.(Pitsburg,2014)6
Class iii-b lasers operating within the visible spectrum are relatively safe to operate.
However,everytimethelidarisinoperationlasereyesafetygoggleshouldbeworn.
2.3TheReceiver
The receiver consists of collective apparatus, which is a Mode 1 Celestron 114 AZ,
D=114mmFL=900mmtelescopeandthedetector.
2.3.1TheTelescope
Thetelescopeisanintegralpartofthelidarsystem.Itsmainpurposeistocollect
thereflectedlightofthetargetandfocus it intothephotodiode.However,thetelescopeisa
greattooltohelpaligntheopticalsystemandtooptimizethegeometricformfactor.Detailswill
beprovidedinthenextsectionsaboutthegeometricformfactorandopticalsystemalignment.
7
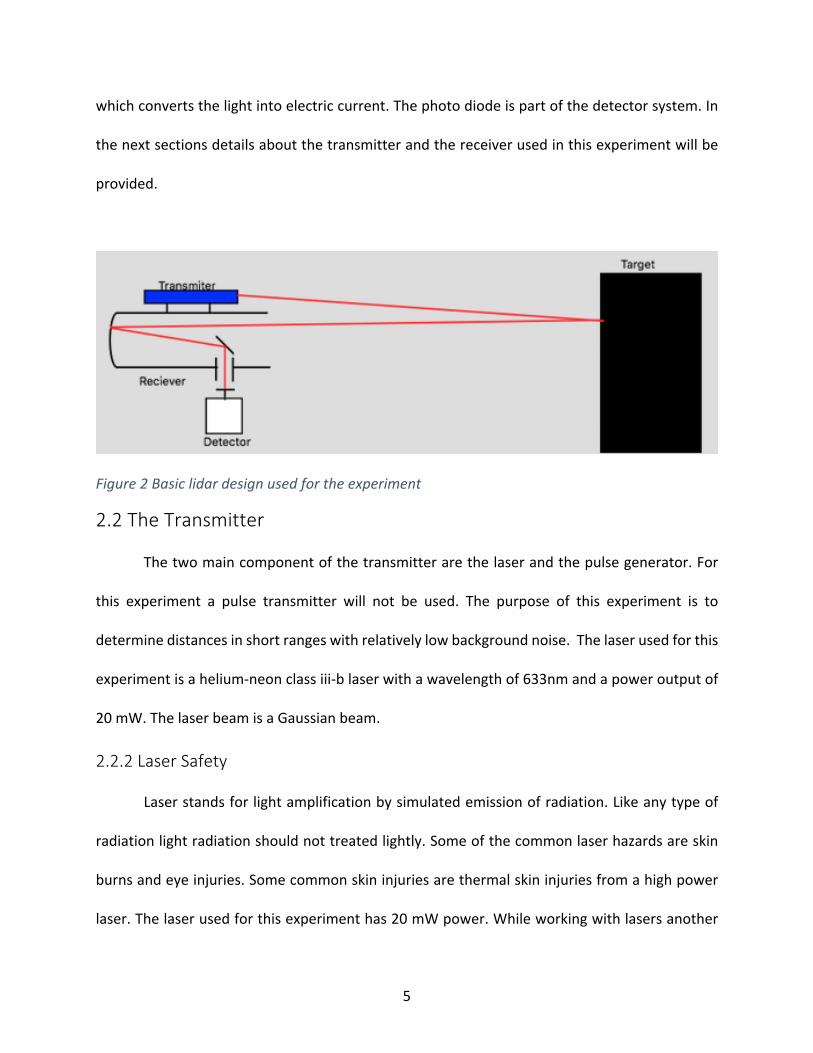
Figure3showsthelidarsystemusedforthisprocedure.Thedetectorhasmanysectionsandit
willbeexplainedindetailthenextsection.
2.3.2TheDetector
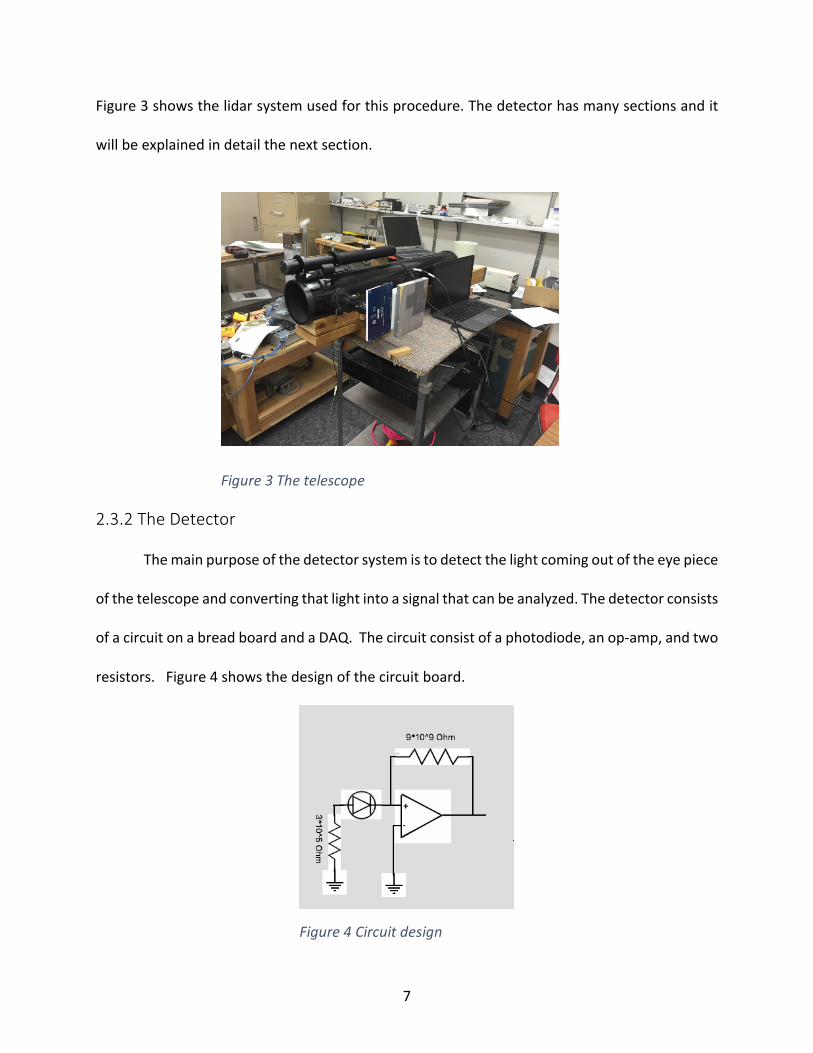
Themainpurposeofthedetectorsystemistodetectthelightcomingoutoftheeyepiece
ofthetelescopeandconvertingthatlightintoasignalthatcanbeanalyzed.Thedetectorconsists
ofacircuitonabreadboardandaDAQ.Thecircuitconsistofaphotodiode,anop-amp,andtwo
resistors.Figure4showsthedesignofthecircuitboard.
Figure3Thetelescope
Figure4Circuitdesign

8
Aphotodiodeisconnectedinseriestoanop-amp.Aphotodiodeisap-njunction.When
photonswithsufficientenergyinteractwiththephotodiodeitcreatesanelectron-holepair.The
holemovestothenextpair,thuscreatingacurrent.Thephotodiodeworksontheprinciplesof
thephotoelectriceffect.Photodiodescangenerateacurrentindarkaswell.Thedarkcurrentfor
thephotodiodeusedinthisexperimentgeneratesa0.03V.However,thecurrentgeneratedfrom
thephotodiodeisnotstrongenoughfortheDAQ.Thephotodiodeisconnectedinseriestothe
op-amp.Theop-amphastwopowerinputsandtworelayvoltagepins.Oneofthevoltagerelay
pinsisconnectedtothephotodiode.Anop-ampamplifiesthevoltagedifferencebetweenthe
tworelayvoltagepins.Theamplifiedvoltagecomesoutoftheoutputpinoftheop-amp.Anop-
amp cannot amplify the voltagedifference tobehigher that it receives from the twopower
inputs. Tominimize the voltage difference between the two input leads of the op-amp and
thereforemaximizingthevoltagegainedbytheop-amp,theoutputoftheop-ampisconnected
toa9megaohmresistorinparallelanditgoesbackintotheotherinputpin.Theoutputpinis
alsoconnectedtothepowerinputoftheDAQAssistant.Toavoidgroundfloatingthephotodiode
iscontactedtoaresistorandconnectedtoground.Todeterminethevoltagegainbythecircuit,
thephotodiodewasilluminatedwithdifferentlaserpoweroutputs(usingtheclassiii-blaserwith
differentneutraldensityfilters).Thenthephotodiodeintegratedinthecircuitwasshinedwith
thesamelaserpoweroutputs.Thisistodeterminetherelationshipbetweenthevoltagethatthe
computerreadsandthepowerinputofthelidar.Thedatawasthenenteredinexcelandacurve
wasfittedtothedata.Figure5showsthedatacollectedtodeterminetheresponsivityofthe
detector.There isonedatapointwhich isskewedandthat isbecauseoneofneutraldensity
filterswasmisplaced.

9
Figure5Detectorresponsivity
TheotherpartofthedetectoristheDAQ.Forthisexperimenta20KHzDAQAssistantis
used(NationalInstruments).DAQisveryusefulfordataacquisitionandcanconnectthelidarto
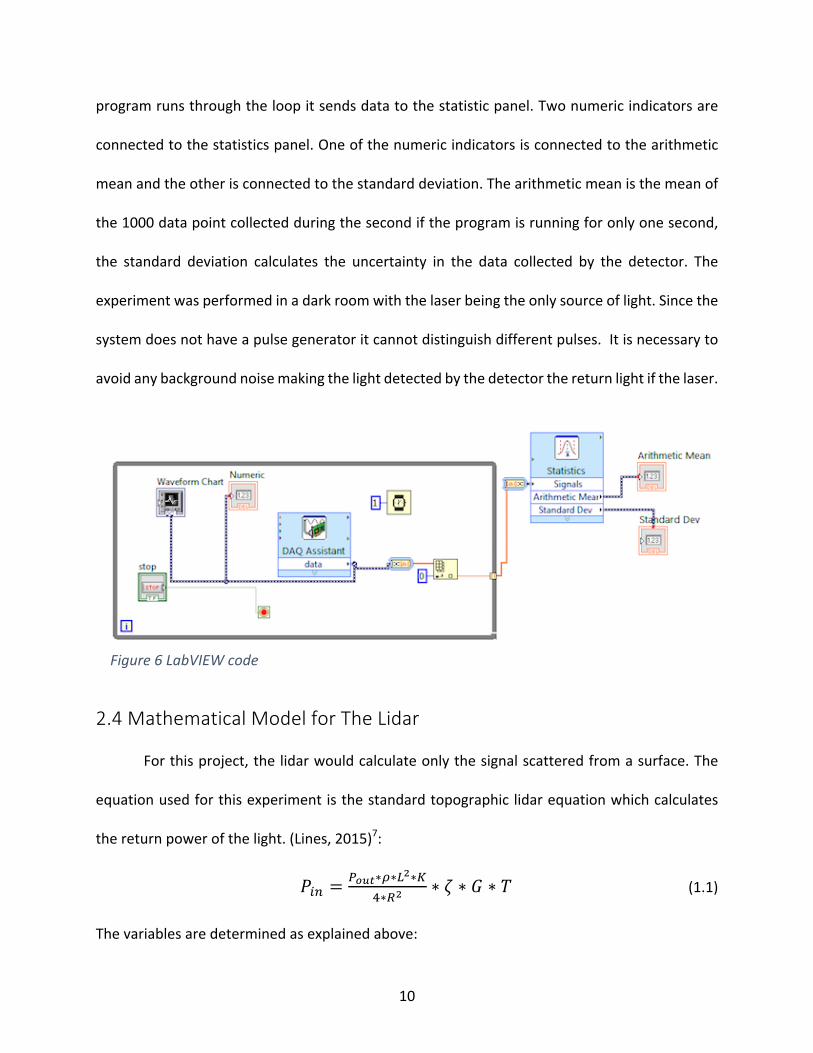
thelaptop.Figure6showstheblockdiagramoftheLabVIEWcodeusedforthisexperimentis
showedbelow.TheLabVIEWprogramforthisprojectconsistofaDAQAssistantthatcollectsthe
data from the circuit board, theoutputof theDAQ is connected to awaveform chart and a
numericindicator.Thiscodeisinsideofawhileloopwhichhashasawaitbuttonadjustingthe
saplingfrequencytoathousandsamplespersecond.Thewhileloophasalsoastopbuttonwhich
is connected toanumeric control adjusting theprogram to stopatadesired time.TheDAQ
Assistantisconnectedtoastatisticpanelthroughaconverterbutton(convertingdynamicdata
coming out of the DAQ Assistant to integer data used by the statistic panel. Each time the
10
programrunsthroughtheloopitsendsdatatothestatisticpanel.Twonumericindicatorsare
connectedtothestatisticspanel.Oneofthenumericindicatorsisconnectedtothearithmetic
meanandtheotherisconnectedtothestandarddeviation.Thearithmeticmeanisthemeanof
the1000datapointcollectedduringthesecondiftheprogramisrunningforonlyonesecond,
the standard deviation calculates the uncertainty in the data collected by the detector. The
experimentwasperformedinadarkroomwiththelaserbeingtheonlysourceoflight.Sincethe
systemdoesnothaveapulsegeneratoritcannotdistinguishdifferentpulses.Itisnecessaryto
avoidanybackgroundnoisemakingthelightdetectedbythedetectorthereturnlightifthelaser.
Figure6LabVIEWcode
2.4MathematicalModelforTheLidar
Forthisproject,thelidarwouldcalculateonlythesignalscatteredfromasurface.The
equationusedforthisexperimentisthestandardtopographiclidarequationwhichcalculates
thereturnpowerofthelight.(Lines,2015)7:
𝑃"# =%&'(∗*∗+,∗-
.∗/,∗ 𝜁 ∗ 𝐺 ∗ 𝑇(1.1)
Thevariablesaredeterminedasexplainedabove:

11
T=0.3𝜌=0.05L=0.114mR=5.83mG=0.921𝜁 = 0.8𝑃89: = 20𝑚𝑊
T is the transmission coefficient of the atmosphere which determines how the
atmosphereeffectsthetransmissionoflightfromthelasersourcetoadistanceRandback.𝜌is
thesurfaceemecivityof the target. Itdetermineshowmuchof the lightshining the target is
reflectedback.Listhereceiveraperturediameter.Ristherangethelidarcovers;itisthedistance
fromthelightsourcetothetarget.Gisthegeometricformfactorwhichdetermineshowwell
the optical system is aligned- that is, how much of the reflected light falls into the return
apparatus.𝜁 is the system spectral transmission factor,which is the ratio of the radiant flux
transmittedthroughtheatmosphereandthereturnfluxthroughit.𝑃"#isthereturnlightpower
ofthelaser.𝑃89:isthelightpowersendbythelaser.
Chapter3CalculationsandResults3.1CalculatingtheGeometricFormFactor
Todeterminethepowerinput,thegeometricformfactormustbecalculatedwithsome
accuracy.Thegeometricformfactordetermineshowmuchofthereturnedlightpowerisactually
focusedonthephotodiode.Anotherwayofexplainingthegeometricformfactorisbylookingat
howmuchoftheilluminatedsurfacebythelaserthefieldofviewofthetelescopeencompass.
Figure7helpsvisualizethisconcept.

12
Figure7Overlappingfieldofviewsofthelaserandthetelescope
Theprojectionofthelaserontheilluminatedsurfaceisconcentriccircleswiththecenter
circlebeingthebrightest.Whenthelaserwasoperatingtheilluminatedsurfacewasmarkedwith
amarker(theperimeterofthecentercircle).Thenthelaserwasturnedoffandthedrawncircle
wasviewedwiththetelescope.Togetageometricformfactorcloseto1,theentirecircledrawn
onthesurfacemustbeviewedthroughthetelescope.Bycalculatinggeometricformfactorone
candeterminehowwell theopticalsystemisaligned.Figure8visuallyrepresentsthe ideaof
aligningtheopticalsysteminsuchawaythatthefieldofviewofthetelescopecanencompass
theilluminatedsurface.Forthisexperiment,theopticalsystemwasalignedinsuchawaythat
theentireilluminatedsurfacecouldbeviewedwiththetelescope.
Figure8Opticalalignment
SincethecollectingapparatusisaNewtoniantelescope,ithastwomirrorsinfrontofeach
otherwiththefrontmirrorblockingsomeofthelightcomingintotheapparatus.Thelaseruses

13
aGaussianbeam,thereflectedbeam(thebrightcircleofthebeam)exceedsthediameterofthe
telescope. To calculate the geometric form factor, the difference of the surfaces of the two
mirrors suffices. Then to determine the geometric form factor the difference in the mirror
surfacesisdividedbythebigmirrorarea.Thebigmirrorofthetelescopehasadiameterof0.114
mandthesmallmirrorhasadiameterof0.032m.Belowisshownthemathematicalformto
calculatethegeometricformfactor:
𝐺 =𝜋 0.114A𝑚A − 0.032A𝑚A
𝜋 ∗ 0.114A𝑚A = 0.921
Erroranalysis:
𝜎𝐺 = (𝜕𝐺𝜕𝐴 𝜎𝐴)
A + (𝜕𝐺𝜕𝑎 𝜎𝑎)
A = 0.0042
3.2PowerInputCalculation
Todeterminethevalidityofthetopographiclidarequation,thelidarilluminatedasurface
acrossoneoftheroomsintheRomneybuilding.Thesurfacewasthebackofaclipboardwitha
surfacereflectivityofthe0.05.Thedistanceacrosstheroomwas5.83m±0.02m.
𝑃"# =%&'(∗*∗+,∗M∗N∗O∗-
.∗/,= 2.11 ∗ 10PQ𝑚𝑊
Thecalculations for theerrorpropagation for thepower input (returnpower)wascalculated
usingaMathematicacode.Figure9showstheMathematicacode:

14
Figure9Mathematicacodefortheerrorpropagation
Theerrorpropagationforthepowerinputis:
𝜎𝑃"# = 8.20 ∗ 10PR𝑚𝑊
3.3VoltageDetectedbytheDetector
Asthereturnlightwasfocusedonthephotodiodeacurrentwasgeneratedinthecircuit
whichwasthenamplifiedbytheop-amp.TheDAQassistantreadthevoltageacrossthecircuit.
After many trials of alignment, the apparatus was ready for operation. LabVIEW read the
arithmeticmeanforthevoltage,generatedbythecircuit,tobe3.15Vandtheerrorinthedata
collectiontobe0.52V.Thatis,thereisnoiseinthesystemsothevoltagewouldfluctuateby0.5
V.Themainsourceofthenoisecomesfromtheinternalresistanceofthephotodiode.Thereare
othertypesofnoisebuttheyarebeyondthescopeofthisexperiment.Figure10showsthefront
paneloftheLabVIEWprogram.

15
Figure10FrontpaneloftheLabVIEWprogram
Theexperimentwasrepeatedmanytimesandtheresultswereconsistent.Table1shows
theresultsfromthedifferenttrialsatarangeof5.83m.
Table1Experimenttrialsatarangeof5.83m
3.4CalculatingthePowerInputfromtheResponsivityoftheDetector
Whendeterminingtheresponsivityofthedetector,therelationshipbetweenthevoltage
readbytheLabVIEWprogramandthepowerinputwasestablished.Themathematicalequation,

16
whichwas derived in excelwhen fitting the data into a curve, below shows the relationship
betweenvoltageandthepowerinput:
𝑉 = 0.4018 ∗ 𝐿𝑜𝑔 𝑃"# + 9.7721 = 2.67𝑉(3.1)
Chapter4Conclusions
4.1Results
Thevoltagecalculatedfromtherelationshipbetweenthevoltageandthepoweroutput
iswithintheerrorcalculatedbyLabVIEW.Thisexperimentwasrepeatedmanytimesandthe
datacollectedwasconsistent.Theexperimentwasconductedinadarkroomwherethelaser
wastheonlysourceoflight.Theexperimentwasperformedattwootherdistances(at3.35m
andat2.50m).Forthe3.35mthepowerinputwascalculatedtobe6.40 ∗ 10PQ𝑊.Usingthe
equation for the responsivity of the detector it was predicted to get 3.12 V. Then LabVIEW
measuredthevoltagetobe3.16Vwithanerrorof0.099V.Figure11showstheresultsofthe
3.35mtrial.

17
Figure11Voltagecalculatedat3.35m
Theexperimentwasrepeatedmanytimes.Table2showstheexperimenttrials.
Table2Experimenttrialsatarangeof3.35m
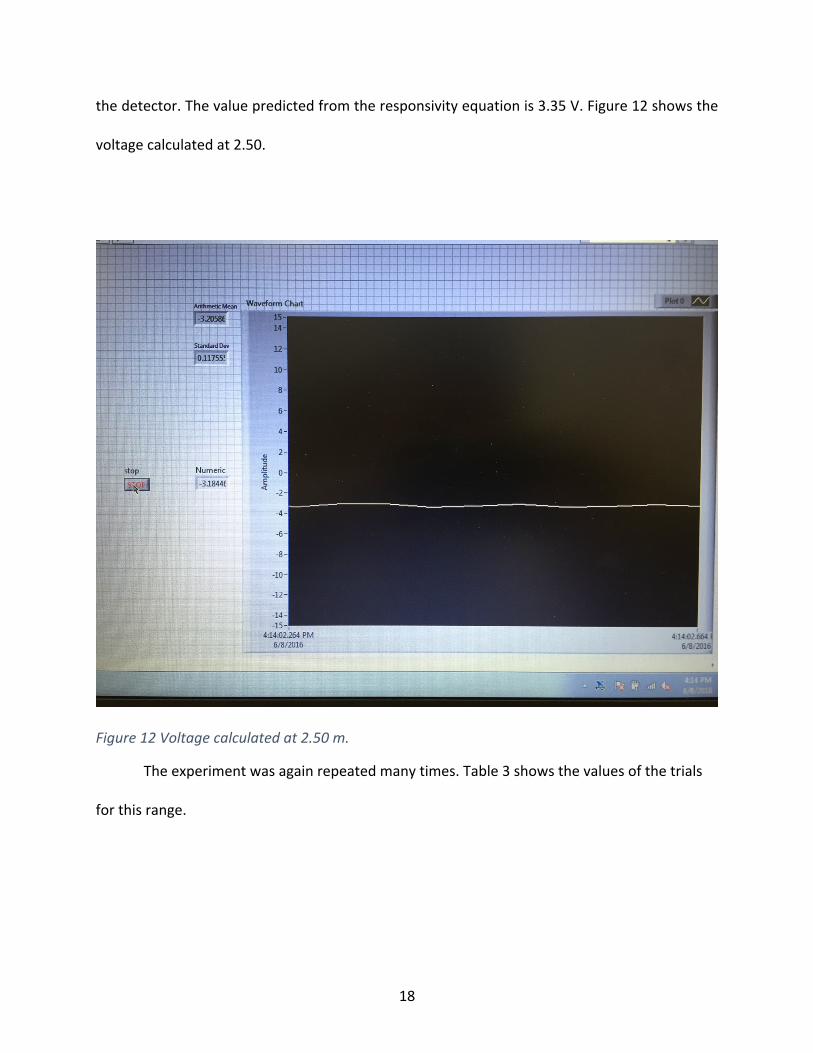
Usingthetopographiclidarequationitwaspredictedapowerinputof1.149 ∗ 10PY𝑊.
Thepredictedpowerinputwasconvertedintovoltsusingtheequationfortheresponsivityof
18
thedetector.Thevaluepredictedfromtheresponsivityequationis3.35V.Figure12showsthe
voltagecalculatedat2.50.
Figure12Voltagecalculatedat2.50m.
Theexperimentwasagainrepeatedmanytimes.Table3showsthevaluesofthetrials
forthisrange.

19
Table3Experimenttrialsatarangeof2.50m
Fromthedataanalysisarelationshipbetweentherangeandthevoltagegeneratedfrom
thedetectorsystemwasestablished.Thefirstsetofdata(at5.83m)collectedhadastandard
deviation bigger than the other two sets of data. This is due to the learning curve in data
collection,thedevicewasnotwarmedwhenthedatawascollected.Theothertwosetsofdata
(3.35mand2.50m)showedaconsistentstandarddeviation.Thedevicewaslefttowarmup
before the datawas collected. The lidar system cannot operate at a range smaller that 1m
because thedetector systemsaturates (12V). Figure13 shows the relationshipbetween the
rangeandthevoltage.
Figure13Therelationshipbetweentherangeandvoltage

20
Atthispointthelidarisefficientonlyincalculatingrangesinthedark.Thisexperiment
provedthetopographiclidarequationtobevalid.Theatmosphericextinctioncoefficientiszero
insidetheroom.However,whenthelidarisusedtocalculatebiggerranges,especiallyifused
outdoors, the atmospheric extinction coefficient increases. The increase in the extinction
coefficientshouldbetakenintoconsiderationwhencalculatingerrorpropagation.
With the equipment provided, this experiment was a success. Considering that the
sampling frequency of theDAQwas 20 KHz, this lidar system is efficient in calculating short
ranges.Ifbiggerrangesneedtobecalculated,aDAQwithfastersamplingfrequency(around1
MHz)isnecessary.Todetecthigherlevelsofpoweroutputabetterop-ampisnecessarytoo.The
detectorsaturatesatabout12V.Tocalculateabiggerrangeapulsegeneratorisneeded,aswell
asaLabVIEWprogramthatcandosignalrecognition.Outdoors,thereismorebackgroundnoise
so it is necessary to recognize the pulse sent out by the lidar. If the lidar is used solely for
atmosphericsciencesanerroratabout1kmintherangeissufficient.
4.2FutureWork
Lidarareveryusefuldeviceswithavarietyofapplicationsasmentionedabove.However,
thelidarIbuiltcanbeimprovedtoperformmorecomplextasks.Apulsegeneratorisnecessary
in distinguishing the pulse produced by the laser from background noises. For a lidar to be
successfulatcompletingthistask,acomplexpulsemustbeproduced.Thatis,toproduceapulse
thatiseasilydistinguishablefromanybackgroundnoise.
TheLabVIEWprogramcodedforthisexperimentonlyrecognizesavoltageinput.Itisvery
efficientindetectingthereturnpowerwhenthelaseristheonlysourceoflight.However,this

21
codewouldnotbeusefulifthelidarwastobeoperatedoutdoors.LabVIEWprovidespowerful
toolsforsignalprocessingunderExpress>Signalprocessing.
A20mWlasercoversadistanceofover100miles,butamorepowerfullasercancover
larger distances. The laser can be easily replaced from the collective apparatus if needed to
calculatelargerdistances.
Thedetector canbe improved tooby replacing theop-ampand thephotodiodewith
betterones.Thecircuitdesignusedisefficientandtheresponsivityofthedetectorhasproved
the topographic lidar equation valid.However, the circuit design canbe improvedand if the
photodiodeandtheop-amparereplacingitmightbenecessarytoreplacethecircuitdesignto
maximizetheresponsivityofthedetector.
Dr.ToddLinesdirectsaresearchgroupofstudentswhoconductresearchinatmospheric
sciences-especiallyicescatteringintheatmosphere.Sofarthedataforthisresearchgroupis
providedbyMichiganStateUniversity.However,withthesuggestedmodificationtothelidar,
conductingicescatteringresearchintheatmospherecanbecollectedusingthelidarIbuilt.This
lidarcanalsobeusedforotherresearchprojectssuchas3Dmapping,chemicalanalysisofthe
pathtraveledbythelaserandlongrangecalculation.However,ifneededtousetheoutsidethe
physicsbuildingperditionmustbeacquiredbythesafetyofficerifBYU-I.

22

23
Bibliography1. Fernald,F.G.,Herman,B.M.,&Reagan,J.A.(1971,November30).Determinationof
AerosolHeightDistributionsbyLidar.JOURNALOFAPPLIEDMETEOROLOGY,11,482-489.
2. Godecke,G.H.,Loveland,R.B.,Lines,R.T.,Gonzales,R.,Thompson,J.,&Yee,Y.P.(n.d.).Alidarinversiontechniqueusingtotalattenuationsystemconstant.
3. Menzies,R.T.(1972,April27).Remotesensingwithinfra-redheterodyneradiometers.Opto-electronics(4),179-182.
4. Priedhorsky,W.C.,Smith,R.,&Ho,C.(1996,January20).Laserrangingandmappingwithphoton-countingdetector.AppliedOptics,35(3),441-452.
5. Weinman,J.A.(1988,October1).Derivationofatmos[hericextinctionprofilesandwindspeedovertheoceanfromasatellite-bornlidar.AppliedOptics,27(19),3994-4001.
6. Pitsburg,U.o.(2014,July).LaserSafetyTraining.Retrievedfromehs.pitt.edu:http://www.ehs.pitt.edu/assets/docs/LaserSafety.pdf
7. Lines,R.T.(2015,0517).LIDARNotes.Unpublished.