determining millennial food buying preferences: …
TRANSCRIPT

University of Kentucky University of Kentucky
UKnowledge UKnowledge
Theses and Dissertations--Community & Leadership Development Community & Leadership Development
2018
DETERMINING MILLENNIAL FOOD BUYING PREFERENCES: DETERMINING MILLENNIAL FOOD BUYING PREFERENCES:
BASED ON PRODUCT MARKETING WITH “BUZZWORDS” BASED ON PRODUCT MARKETING WITH “BUZZWORDS”
Victoria N. Hamilton University of Kentucky, [email protected] Digital Object Identifier: https://doi.org/10.13023/ETD.2018.053
Right click to open a feedback form in a new tab to let us know how this document benefits you. Right click to open a feedback form in a new tab to let us know how this document benefits you.
Recommended Citation Recommended Citation Hamilton, Victoria N., "DETERMINING MILLENNIAL FOOD BUYING PREFERENCES: BASED ON PRODUCT MARKETING WITH “BUZZWORDS”" (2018). Theses and Dissertations--Community & Leadership Development. 40. https://uknowledge.uky.edu/cld_etds/40
This Master's Thesis is brought to you for free and open access by the Community & Leadership Development at UKnowledge. It has been accepted for inclusion in Theses and Dissertations--Community & Leadership Development by an authorized administrator of UKnowledge. For more information, please contact [email protected].

STUDENT AGREEMENT: STUDENT AGREEMENT:
I represent that my thesis or dissertation and abstract are my original work. Proper attribution
has been given to all outside sources. I understand that I am solely responsible for obtaining
any needed copyright permissions. I have obtained needed written permission statement(s)
from the owner(s) of each third-party copyrighted matter to be included in my work, allowing
electronic distribution (if such use is not permitted by the fair use doctrine) which will be
submitted to UKnowledge as Additional File.
I hereby grant to The University of Kentucky and its agents the irrevocable, non-exclusive, and
royalty-free license to archive and make accessible my work in whole or in part in all forms of
media, now or hereafter known. I agree that the document mentioned above may be made
available immediately for worldwide access unless an embargo applies.
I retain all other ownership rights to the copyright of my work. I also retain the right to use in
future works (such as articles or books) all or part of my work. I understand that I am free to
register the copyright to my work.
REVIEW, APPROVAL AND ACCEPTANCE REVIEW, APPROVAL AND ACCEPTANCE
The document mentioned above has been reviewed and accepted by the student’s advisor, on
behalf of the advisory committee, and by the Director of Graduate Studies (DGS), on behalf of
the program; we verify that this is the final, approved version of the student’s thesis including all
changes required by the advisory committee. The undersigned agree to abide by the statements
above.
Victoria N. Hamilton, Student
Dr. Lorraine Garkovich, Major Professor
Dr. Patricia Dyk, Director of Graduate Studies
DETERMINING MILLENNIAL FOOD BUYING PREFERENCES: BASED ON PRODUCT MARKETING WITH “BUZZWORDS”
_________________________________________
THESIS _________________________________________
A thesis submitted in partial fulfillment of the requirements for the degree of Master of Science in Community and Leadership Development
in the College of Agriculture, Food and Environment at the University of Kentucky
By
Victoria Nicole Hamilton
Lexington, Kentucky
Director: Dr. Lorraine Garkovich, Professor of Community and Leadership Development
Lexington, Kentucky
2018
Copyright © Victoria Nicole Hamilton 2018
ABSTRACT OF THESIS
DETERMINING MILLENNIAL FOOD BUYING PREFERENCES: BASED ON PRODUCT MARKETING WITH “BUZZWORDS”
This research focuses on the importance on the Millennial Generation and their perceptions of food buzzwords. Since the Millennial Generation is the largest group purchasing and preparing their own foods, the food industry is becoming dependent on their buying preferences. A survey reflected the participants’ demographics and their buying preferences based on a series of food buzzwords when they are purchasing foods. Results show the Millennial Generation prefers “local” buzzwords. As the Millennial Generation continues to purchase foods for themselves and their families, it can be expected their choices will encourage others to do the same based on their family shopping factors, social interaction, and relationship building traits.
KEYWORDS: Buzzword, Millennial Generation
Victoria Nicole Hamilton
March 2018
DETERMINING MILLENNIAL FOOD BUYING PREFERENCES: BASED ON PRODUCT MARKETING WITH “BUZZWORDS”
By
Victoria Nicole Hamilton
______________________________ Director of Thesis
______________________________ Director of Graduate Studies
March 2018
Dr. Patricia Dyk
Dr. Lorraine Garkovich

Dedicated to my Dad, who taught me to never give up. I love you.
To my brother, thank you for always believing in me, encouraging me and motivating me to be successful.
I am so lucky to have you as a little brother to look up to.
To Maggie, for being my inspiration to keep going!

ACKNOWLEDGEMENTS
I believe people are brought into your life for a reason and I feel most fortunate to thank the people who have impacted my research journey. This is not just a thesis, this is a milestone that was not believed to be completed. Against all odds, it is finally complete, and I want to thank those who, big or small, made this thesis possible and a success.
The following thesis was shaped and inspired by several people:
A huge thank you to my wonderful Thesis Chair, Dr. Garkovich. Thank you for always believing and encouraging me to succeed in my college career. Thank you for always reminding me to do my best and to believe in myself. Thank you for being my biggest cheerleader and reliable mentor and advisor. I really appreciate all the time (years) you guided me on my thesis path!
Thank you to my entire committee for being so patient while I journeyed through my thesis program. Thank you for challenging me and pushing me to do my best! Thank you to all my professors and fellow graduate students for riding along this journey!
Thank you to my “extended” committee of support:
Dr. Stephanie Larson of California - thank you for believing in me and motivating me to continue on. I have always respected your opinion and your mentorship has meant the world to me.
Dr. Temple Northup of Texas, thank you for your guidance on designing my survey.
Kelsey Keene, thank you for inspiring me to go the direction of analyzing buzzwords. Thank you for your friendship, love and support!
Tara, thank you for dragging me to the library and encouraging me to work hard and be the best version of myself.
Thank you to my family and friends for their love and support!
iii
TABLE OF CONTENTS
Acknowledgments…………………………………......………..………………………..iii
List of Tables……………………………………………..………………………..……...v
List of Figures…...……………………………………..…………………..…….…...…..vi
Chapter One: Introduction………………………………………………….……………..1
Chapter Two: Literature Review and Theoretical Foundations………….………..……....5
Theoretical Framework…………………………………………………………....5
Social Constructionism…………………………………………………………....5
Introduction to the Millennial Generation………………………………………...6
Marketing to Millennials…………………………………………………………..9
Chapter Three: Methodology…………………………………………………………….17
Population………………………………………………………………………..18
Survey Implementation…………………………………………………………..19
Chapter Four: Results……………………………………………………………………21
Introduction………………………………………………………………………21
Data Analysis…………………………………………………………………….46
Chapter Five: Conclusions, Recommendations and Implications……………………….47
Limitations……………………………………………………………………….49
Future Research………………………………………………………………….50
Concluding Remarks………………………………………………………….….50
Appendix A: IRB Approval…..………………………………………………………….52
Appendix B: Survey Instrument…………………………………………………………55
References………………………………………………………………………………..66
Vita...........………………………………………………………………………………..69
iv
LIST OF TABLES
Table 4.1 Ages of Survey Participants…………………….……………………………..21
Table 4.2 Home Regions of Survey Participants………….……………………………..22
Table 4.3 Genders of Survey Participants…………………….…………………...……..22
Table 4.4 Education Levels of Survey Participants……………………………………...23
Table 4.5 Major Classifications of Survey Participants……………………….…………23
Table 4.6 Preferred Food Shopping Locations…………………………………………..24
Table 4.7 Preferred Food Shopping Locations, Based on Age…………………………..25
Table 4.8 Preferred Food Shopping Locations, Based on Gender……………………….26
Table 4.9 Preferred Food Shopping Locations, Based on Major Classification…………27
Table 4.11 Influences on Millennials' Food Purchasing Decisions...…………………….28
Table 4.12 Types of Foods Purchased…………………………………………….……..29
Table 4.13 Foods Mostly Purchased at Stores, Based on Age…………………………...29
Table 4.14 Foods Mostly Purchased at Stores, Based on Gender……………………….30
Table 4.15 Foods Mostly Purchased at Stores, Based on Major Classification…………31
Table 4.16 All Buzzword Sorted Based on Mean……………………………………….33
Table 4.17 All Buzzwords Compared by Mean………………………………………….35
Table 4.18 Frequency Rate of Buzzwords……………………………………………….37
Table 4.19 Buzzwords: Top 5 Selected………………………………………………….39
Table 4.20 Media and Food Advertising………………………………………………...41
Table 4.21 Twitter Posts Categorized……………………………………………………42
v
LIST OF FIGURES
Figure 1 Social Construction Theory……………………………………………………..5
Figure 2 Generations Ages Values…………………………………………………….....8
Figure 2.1 Generation Ages in the Workplace…………………………………………....8
Figure 4.1 Twitter Post Wordle………………………………………………………….46
vi

Chapter 1 - Introduction
We are surrounded with brands like Nike, Apple, Microsoft, Starbucks, Ford, Chevy, etc.
but have we looked at the words surrounding us in the grocery store? Organic, GMO
Free, Gluten Free, Free Range, All-Natural, Grass-fed, Heritage, etc… Do we even know
what these words mean? Research has shown many consumers are drawn to brand names,
they prefer purchasing more familiar items. On the other hand, consumers have shown
they can make new decisions about certain products (Kucuk, S. 2011). The brand creates
a relationship with the consumer and they continue to buy, especially in the presence of
an emotional bond (Nowak, Thach, Olsen, 2011).
Storytelling is used to further an emotional connection with consumers. In the food
marketing industry, we use “health” as a way to tell the story to consumers. Health has
become very important to consumers, not only do consumers want great tasting food, but
also food to address nutritional needs; food of “premium quality and affordable; that are
fresh and convenient” (Gilbert, 2000). A marketing idea of promoting “Food as
Medicine” successfully connected to these consumers. This is a group of consumers who
read and compare nutrition labels, appreciate health and content claim labels, select
products with “fresh”, “grown without pesticides”, “high calcium”, “high fiber”, etc. on
the label (Gilbert, 2000). There is a difference between reading and understanding
nutrition labels and there is evidence society has a problem with unhealthy food
consumption (Northup, 2014). Since health risks of becoming overweight and unhealthy
are very high, the need to “examine how food manufacturers communicate nutrition and
health information to consumers” is very important.
11

Many consumers know that not all foods are healthy; accordingly consumers look for
“cues” to help determine if a food product is healthy or not (Northup, 2014). Today’s
food industry is flooded with these “cues” we call buzzwords: Organic, Grass-fed, Non-
GMO, etc. The purpose of the buzzword listed on a product is to create an impression the
particular food is better than a product without the listed buzzword (Northup, 2014). This
relays information about the product to the consumer. We do not question why one
buzzword may be healthier than the other, because as a consumer “we want to be healthy
and feel better about not taking the stairs, driving instead of walking, or eating gluten free
cake instead of moderating our food intake.” We all have been there. Marketers know
the consumers’ wants, they want good foods and to spend less time shopping. The
buzzwords initially make shopping easier by using a few words to tell the consumer if the
food is healthier than others.
For this study, the Millennial Generation was the focus to determine whether or not
buzzwords really do have an impact in their food shopping habits. Since 2015,
Millennials are among the largest group of consumers, according to the U.S. Census
Bureau. They are the generation with the most control of food trends and marketing,
since they are making the most purchases among all generations. A Millennial is
described to live a fast-paced, multi-tasking, social lifestyle (Paquette, Moore, Claveria,
2014). Buzzword marketing fits within the millennial lifestyle. Buzzwords have become
social “cues” to relay information about a food product being healthier than others.
2
Buzzwords also are becoming a group for millennials to self-identify with while shopping
at grocery stores and a connecting topic among relationships.
Social Construction Theory is the process of associating one thing to many values,
meanings, etc. For buzzword marketing, words like “Organic,” “Free Range,” “All-
Natural” connect the buzzword to a meaning outside of the word. The buzzword, in this
case, can have many different meanings to the consumer. The value of the word is given
by the individual and generalized among society. Millennials are curious about the world
around them and want to quickly learn the meaning of buzzwords on their foods.
However, during this quick transaction of information, millennials can get lost in a bunch
of information. They constantly have distractions and if poor messages, experiences, or
ideas reach them before the correct information – they will move on and not realize there
are two sides of the buzzword’s meaning.
Constructionist theory suggests there is a strong connection between design and learning,
which involves making, building, or programming. Each of these theories differ, however
they can work together. Design theorists focus on the final product, while learning
theorists focus on the process, (Kafai and Resnick, 2011).
My theory is consumers focus on the final product and not the process. In the food
system, we are concerned about the process of the food, but we only look at the final
“buzzword” to tell us the information. Consumers are not taking the time to see or
understand the process because the marketing has already done the work for them. In this
3
study, I will ask participants survey questions to see what foods they are buying at
grocery stores and compare these choices to their beliefs in a secondary set of questions
referring to buzzwords associated with the environment, animal health and personal
health. These categories allow the selected buzzwords to be classified into real world
groups the participants can reflect on each word. Since some buzzwords overlap with the
categories, this allows a single buzzword’s value in consumer shopping to be compared
against their value on the environment, animal health and personal health.
4

Chapter 2 - Literature Review
Prior to analyzing the results of this study, it is important to review previous research
to fully understand marketing towards the Millennial Generation. Minimal research has
been reported about millennials connecting to food buzzwords, however there is much
research about marketing trends, brand identification, and consumer interests. For this
study, Social Construction Theory will be used as a theoretical framework to connect
theories of marketing to the Millennial Generation and constructed meanings of
buzzwords.
Social constructionism is based on knowledge of how a society communicates as a way
to seek common understanding (Zaltman, 1997). The process constructs “shared
assumptions about reality” (Zaltman, 1997). Since society is constantly changing and
expanding, social constructs are challenged and modified when different meanings
become relevant. (Zaltman, 1997). Social constructionism reflects human behavior,
cultural symbols and meanings, understanding of relationships, social interactions,
physical objects or symbols with multiple meanings (Zaltman, 1997).
Figure 1: Social Construction Theory
Social Construction Theory
Common Understanding
Shared Assumptions
Changing and Expanding
Organic Free Range Cage-‐Free All-‐Natural
GMO/GMO Free
Relevance
5

Social constructionism relates to how buzzwords give meaning to words like organic,
free range, all-natural – to represent images, ideals, values, etc. to the consumer. These
meanings facilitate the creation of an identity among groups. Social consciousness and
peer pressure approval or disapproval impacts consumers’ food choices (Almerico,
2014). If groups favor a certain food choice, it is more likely for a consumer to choose
the food as their favorite (Almerico, 2014). Food can also become an expression of
identity (Almerico, 2014). Food choice decisions are considered to be a part of
everyday life (Sobal, M.P.H., & Bisogni, 2009). These decisions can become
challenging because there are many different attributes to foods in general, however
social constructs on buzzwords serve as a different way to analyze food decisions.
Temple Northup, professor at the University of Houston, conducted a study among
college students to determine if certain foods with buzzwords were healthier than
others. Students selected between two food labels to select a healthier option based on
the meaning of the buzzwords appearing on the labels (Northup, 2014).
The Millennial Generation may well be the most health conscious generation ever.
Buzzwords have been around for years, but are becoming more of a social “cue” for
consumers to connect with over a food product. Marketers and food manufacturers rely
on the fact that consumers are aware of the word, and the ones who have a positive
experience with the product will continue to purchase more in the future. The concept
of framing has many meanings, but is commonly known as “shaping” messages based
on cognitive psychology (Van Gorp, 2007). Some approaches analyze how media
6

represents a topic to determine a message, while others change phrasing to reflect a
new message (Van Gorp, 2007).
In terms of buzzwords, social constructs give “free-range” the meaning birds weren’t
raised in a cage. The belief can be translated to: “eggs from birds raised cages are bad”
and therefore “cage-free and free-range” eggs must be better. Consumers who connect
with this message, choose to buy the “free-range” eggs because it sounds like it was
better for the bird. The marketing frame is designed to relay the message “eggs are
better from birds not in a cage” and the eggs without the “free-range” label are
assumed to be worse eggs to the consumer.
The second part of the “why” is not explained in this message. Consumers do not think
about the other question, “Why were the birds raised in a cage in the first place?”
Monitoring disease control, laying production, feed intake and egg conversion,
predator and bird safety control, etc. are not glamorous or easily understood topics to
educate the consumer. In the “free-range” buzzword example, it is easy to see the more
information that is shared, the more confusion for those who do not know the process
of food production. Thus, framing consumer food choices with buzzwords helps
consumers make decisions without much additional information.
7

Why millennials?
Congratulations, Millennial Generation! You are the largest consumer group as of 2015.
For years, the Millennial Generation or Gen Y, stood as the second largest group only to
the “Baby Boomer” generation, the largest group of people born from 1946 to 1964. Each
of the figures below illustrates the different characteristics of each generational group.
Figure 2: Generation Ages Values
Figure 2.1: Generation Ages in the Workplace
8
The Millennial Generation is defined as an educated group of young adults between the
ages of 18 to 36 years old, according to the 2015 U.S. Census Bureau. 83.1 million
millennials born around the early 1980s to the early 2000s are shifting how companies
market their products and services. Millennials are unique since they grew up in a digital
world and make many decisions given their relationships within this digital world.
The Millennials, like other generations, establish a community persona with core traits,
values and beliefs. According to Howe and Strauss there are seven core millennial traits:
Special, Sheltered, Confident, Team Oriented, Conventional, Pressured and Achieving
(Emeagwali, 2011). Howe and Strauss are social researchers who named the “Millennial
Generation” and established a set of common traits, which set the generation apart from
prior generations (Bennett, Maton and Kervin, 2008). The seven core traits, are the values
adapted to millennials: “They have a strong importance to their parents and to the nation;
they have become the focus of the youth-protection movement; they are optimistic and
trusting of a better future; have a desire to build group community and form strong peer
connections; they are interested in developing new rules; they feel great pressure to
succeed and meet increasing demands; and they are focused on achievement and meeting
high expectations” (Emeagwali, 2011).
Target: Meet the Millennials
According to Bridgette Croke, Vice President of MyActions - a social platform focusing
on consumer behavioral change, “To best mobilize the millennial generation, we need to
understand what core values and trends drive behavior change” (Croke, 2014). In the
article, “How to engage millennials? Appeal to 3 Core Values, 3 Core Traits,” Croke
9

breaks down the values and traits of the millennial generation. When marketing to this
generation, it is important to remember millennials grew up in a digital world. Digital
tools have surrounded Millennials and finding information has always been at their
fingertips. Millennials are becoming strong critical decision makers over time (Croke,
2014). Millennials have become “riders on the information superhighway” (Brown,
2011). They prefer information associated with the Internet and continue to use e-mail as
a strong form of communication (Brown, 2011). Croke believes the three millennial core
values circulate around Belonging, Recognition and “Need for Ease.”
Belonging
The Millennial Generation responds well to feeling a sense of “belonging” to a group,
campaign and classroom (Nowak, Thach, and Olsen, 2006). Developing social interaction
opportunities and relationships with millennials is key for consumer buy-in.
Understanding their wants and needs is imperative to building these relationships and a
sense of belonging with the Millennial Generation (Nowak, Thach, and Olsen, 2006).
Recognition
The Millennial Generation appreciates recognition, especially in the workforce.
Millennials seek recognition through titles, praise, promotions and pay (Gursoy, Maier,
Chi, 2008). Millennials will share ideas in the workforce, but still look for recognition.
This recognition seeking is looking for an immediate response (Gursoy, Maier, Chi,
2008). The marketing world plays on the millennial need for immediate recognition.
10

Enabling millennials to feel recognized and appreciated strengthens the producer-
consumer relationship.
Strong marketing companies and causes create opportunities for millennials to contribute
to their messages, which appear as a “Cool Factor” (Croke, 2014). The Millennial
Generation seeks new “cool factor” ideas to join and be recognized for their participation.
Marketers position their brand and products to appear “cool” to encourage millennial
participation. Companies use social media as a “cool factor” to develop relationships with
millennial consumers. Companies encourage the group to get involved by participating in
sharing posts, photos and even contests. The millennials can promote companies by using
specific #hashtags; a word or phrase proceeded by the # symbol that can be categorized
or classified over social media and has accompanying text (Merriam-Webster, 2008) and
company social networking handles; a username on an online forum or social media site
(Oxford, n.d.), which drives other viewers to companies’ social media pages and
websites. While the company produces one item for marketing, the need to be recognized
is so powerful among millennials that it is shared at a quick pace on a mass media scale.
This allows millennials to participate, by giving them a “voice” in company marketing
actions, messages and other “cool factors”. Through social media, everything is
shareable, likable and provides easy opportunities for participation to be applauded and
recognized.
11

Need for Ease
Similar to keeping the Millennial Generation involved, it is important to develop quick
and easy ways for millennials to participate in marketing efforts. Since they grew up in a
digital and fast paced world, they want to receive limited, quick and easy information.
This way they can quickly decide “yes” or “no” to participate and continue with their
heavily planned schedules. They live a lifestyle of multitasking, accelerated
communication, constant connection and immediate gratification (Paquette, Moore,
Claveria, 2014).
According to Croke’s three values, establishing trust with millennial consumers is
important to not only sell products or ideas, but to develop strong consumer-producer
relationships and trust and confidence in the brand. Even though the majority of
consumers desire trust, relationships and confidence in brands; the level of belonging,
recognition seeking, and easy processing is imperative to millennial consumers.
Millennial Lifestyle
Millennial lifestyle is said to be one that contradicts traditional marketing and research
methods (Paquette, Moore, Claveria, 2014). They are always multitasking, staying
connected while on the move and prefer to “Google it” prior to making purchases.
Millennials, it is claimed, have very short attention spans due to communicating
concisely through texting, “Tweeting” and #hashtaging; which is believed to have
developed and defined the short attention span trait (Paquette, Moore, Claveria, 2014).
12

Millennials prefer a lifestyle of group collaboration and teamwork; they want to
participate and have their ideas heard (Paquette, Moore, Claveria, 2014).
Millennial Marketing Mistakes
Marketing has picked up on the traits of millennials, but some marketers forget about the
variation within the Millennial Generation (Fromm, 2014). Millennials are a diverse
group who fall within a wide range of differences in taste, behaviors and income levels
(Fromm, 2014). However, millennials not only want to be engaged in company brands,
they also want brands to be functional and incorporate actions for the public good and
take a stance on world-views (Fromm, 2014). This generation believes they can make a
difference in the world and they relate to brands which promote the same values (Nowak,
Thach, and Olsen, 2006).
Brand Equity and Food Marketing
The food marketing industry has really focused on creating branding opportunities to
appeal more to the Millennial Generation. The wine industry has focused on establishing
brand loyalty through emotional marketing to millennials. Wineries targeted millennials
sooner than many other types of firms, in fact as soon as the group reached a target wine
consuming age between 21-29 years (Nowak, Thach, and Olsen, 2006). Emotional
marketing, which is measured by loyal customers spending more money on certain
brands of wine, established “emotional bonds with customers by showing they cared for
customers as people and incorporated lifestyle-based persuasion to build up their
winery’s brand equity” (Nowak, Thach, and Olsen, 2006). Brand equity is “the added
13

value with which a given brand endows a product” (Edell & Moore, 1993, p.196).
Positive emotional marketing develops a sense of belonging, which is a priority to
millennials (Nowak, Thach, and Olsen, 2006). Wineries reached out to the millennials to
establish strong consumer-producer relationships to develop brand loyalty, which not
only increased cash flow, but also their consumer base; millennials shared their
experiences with their friends and introduced new customers to the brand. In a study by
Matthew C. H. Yeung, there is a direct linear relationship between consumer satisfaction
and profitability (Nowak, Thach, and Olsen, 2006), the higher the happiness of customers
the higher economic returns.
Word of Mouth and Brand Loyalty
Keywords like “word of mouth” and “brand loyalty” are important in the food industry
because they drive millennials buying preferences. Brands develop an “extension of the
consumer’s self-concept to offer value as a method of self-expression and self definition”
(Ruane & Wallace, 2015). This allows brands to promote group membership for
millennials to identify with the brand.
Advertising and Brand Equity:
According to Rossolatos, (2014) “brand equity is a function of the level or depth and
scale of brand awareness and the strength, favorability and uniqueness of brand
associations.” The concept itself is multidimensional and encompasses brand loyalty,
brand awareness, perceived quality, brand association and particular brand assets
(Nowak, Thach, & Olsen, 2006). Consumers’ attitudes and “memory structure for a
14

brand” are both influenced by advertising and established brand equity (Edell & Moore,
1993, p.196). “Memory structure for a brand” influences consumers’ processing,
reinforcing images and accessibility of brands (Mitchell, 2013, p. 205). Typically, over
time consumers establish a memory with the brand through multiple exposures and
experiences. Advertising is powerful and persuasive; it traditionally delivers messages of
the brand’s values through different forms of media.
Summary
Commonly known as a “Buzzword,” food movement marketers have adapted the one
word phrase to promote brand values and publicize world views. A “buzzword,” is a
word or a phrase; it is fashionable at a particular time or in particular context (Oxford,
n.d.). Similar to the #hashtag, the “buzzword” depicts the intended message in a quick,
concise manner. The buzzwords in food marketing send cues that relay quick information
to millennials, which conveniently reflects millennial marketing preferences. Millennials
are always on the go, therefore quick and concise informative messages are more
preferable (Paquette, Moore, Claveria, 2014). Food health buzzwords have become the
easiest way to advertise because millennial shoppers will look for “cues” to help them
determine if a product is healthier (Northup, 2014).
Food buzzwords have surged from US organizations with Certified Food Labeling
Programs, which have grown dramatically over the years. Food labeling programs like
the USDA, Food Alliance, Certified Angus, to name a few - are group based and have
specific rules and regulations producers must follow in order to partake in the marketing
15

efforts. Simply, all producers who join and qualify for the program can be associated with
the program’s label. The label allows products to be grouped with the same buzzword,
which make shopping decisions much easier for millennial consumers. Buzzwords such
as USDA Organic, GMO Free, Certified Black Angus Beef, USDA Choice, etc. act as
“cues” to convey the determined message for consumers.
16
Chapter 3 - Methodology
Research Design
In order to effectively analyze the relationship between millennial consumers and their
purchasing of food products associated with buzzwords, the researcher utilized an
Exploratory Design Survey using primarily Likert scales and open questions. The
Exploratory Survey was conducted using a two-part online questionnaire. The first part of
the survey focused on quantitative questions to gather data and the second part asked the
participants to respond to open-ended questions.
The survey entitled, “Determining Millennial Food Buying Preferences Based on Product
Association with Buzzwords”, provided a quantitative data overview of buzzword
preferences and priorities placed on food products by millennial consumers. 2,498
surveys were electronically distributed to students in the College of Agriculture, Food
and Environment. Qualtrics Survey Software housed the survey’s design, creation and
export of results. SPSS software was utilized to analyze the survey responses.
Participants were allotted a one-week period, April 14th to April 21st to complete the
survey. The survey was initially delivered to participants via private e-mail through the
University of Kentucky, College of Agriculture, Food and Environment Listserv on
Tuesday, April 14, 2015. Students were reminded to complete the survey seven days later
on Monday, April 20, 2015.
17

To ensure survey verification, there was a pilot test sent to the thesis committee and
supporting researchers to test possible electronic error, prior to the survey going live for
participants. The open-ended portion of the survey asked participants to reflect on the
buzzwords and purchasing questions and design a “Twitter” post to show their
perspective on food buzzwords. Twitter was selected as the media outlet method because
the responses would be short and reflect the importance of their ideas in the shortest
amount of words.
Sample Population
The study was designed to appeal to College of Agriculture, Food and Environment
students. All students in CAFE, that is, all undergraduate and graduate students in the
College represent the study population. The study population is a direct sample of the
millennial generation, by age and reflecting the diversity of the agriculture, food and
environmental concerns of today’s society. As students in the College of Agriculture,
Food and Environment, their professional opinions are connected to their education. This
group is among the next generation whom will be entering the career and job field,
furthering their education and/or finalizing their “on their own” survival skills as they
begin their journey into established careers after college education.
Survey Design
The sections in the survey begin with the an overview of the survey participants
demographics. This allowed the reseacher to sort the data into groups. The demographics
section is followed by questions addressing the shopping ideals of the participants. This
18

section outlines where the participants grocery shop and what kind of foods they prefer to
purchase. The second half of the survey is the Buzzword section. This is the main focus
of the study and survey. This Buzzword section is broken into three sub-groups:
Environmental, Animal Health, and Personal Health. After survey participants completed
the 3 sub-sections, participants were asked to select their top five most important
buzzwords from all three groups together. The final section of the survey is the media
portion. One question asks participants about food advertisements. The final section asks
participants to be creative and design their own “Twitter” post to promote their own
buzzword preferences. This allows particpants to contribute to the research in a creative
way. Prior to sending the survey live to participants, a pilot test involved sending the
survey to the committee chair, fellow graduate students, and experts in the research field.
This allowed the researcher to check for survey format error, the clarity of the questions,
overall survey appearance and reliabilty, etc.
Survey Implementation
2,498 total surveys where sent through the College of Agriculture, Food and Environment
student listserv. 156 surveys were completed prior to an email reminder and 68 surveys
were completed after the reminder. There were 224 total surveys completed and analyzed
for this study.
Due to incomplete surveys, missing information, or other reasons, only 224 responses
were valid, providing a response rate of 9.76 percent.
Using an online survey
Surveys are among the most popular methods used to gather data (Cobanoglu &
19

Cobanoglu, 2003). However, web-based surveys are only acceptable if the entire
population has access and confidence using the Internet (Cobanoglu & Cobanoglu, 2003).
Since the millennial population is known for their involvement in technology, a web-
based survey best appealed to the sample population. Qualtrics also supports mobile
devices and allows participants to complete the survey on the go. However, with online
surveys there is the possibility for error due to technology problems, incorrect email
address, unfinished surveys, unopened emails. There were no incentives to complete this
survey.
20

Chapter 4 - Results
The purpose of this study is to explore the impact of food marketing buzzwords in terms
of social “buy-in” and shopping purchases made by the millennial generation. The initial
analysis considers participants' food purchasing habits based on their age, geographic
location, gender, educational status and degree, and current residence. The researcher
divided the buzzwords into three categories: Environmental Health, Animal Health and
Personal Health. But first, it is important to describe the characteristics of the entire
sample. Below is an overview of the frequency and descriptive numbers and percentage
distribution of the responses to the survey, “Determining Millennial Food Buying
Preferences Based on Food Buzzword Marketing.” The millennial generation
encompasses people born between the years 1980 – 1997.
Of the 224 survey participants, 93.7% represent the millennial generation and the
remaining 6.3% are older than the millennial generation. Initially, the study was designed
to compare the older population to the millennial generation, but there was not a
sufficient sample size to compare the two groups. However, there is sufficient data within
the millennial population to make comparisons and trends within the group.
Table 4.1 Ages of Survey Participants
Year of Birth Frequency Percent Before 1980 14 6.3
1980-1984 12 5.4 1985-1989 38 17.0 1990-1994 110 49.1 1995-1997 50 22.3
Total 224 100.0
21

Where are the survey participants from? The majority (63.8%) of the survey participants
are from the southeast region, 27.7% of the participants are from outside of the southeast
region, and 8.5% are from outside of the US. Based on this analysis of the survey
participants’ home region, the comparison of regional home of the student participants
will be from inside and outside of the southeast region.
Table 4.2 Home Regions of Survey Participants
Home Region Frequency Percent Midwest - IA, IL, IN, KS, MI, MN, MO, ND, NE, OH, SD, WI
36 16.1
Northeast - CT, DC, DE, MA, MD, ME, NH, NJ, NY, PA, RI, VT
19 8.5
Southeast - AL, AR, FL, GA, KY, LA, MS, NC, SC, TN, VA, WV
143 63.8
Southwest - AZ, NM, OK, TX 2 .9 West - AK, CA, CO, HI, ID, MT, NV, OR, UT, WA, WY
5 2.2
Outside of the US, (If not listed, please add) 19 8.5 Total 224 100.0
What gender are the survey participants? 76.3% of the participants are female, 22.8% are
males and 0.9% chose not to answer.
Table 4.3 Genders of Survey Participants
Gender Frequency Percent Male 51 22.8 Female 171 76.3 Prefer not to answer 2 .9 Total 224 100.0
What education level are the survey participants? 38.4% of the participants are in
graduate school or equivalent and 61.6% of the participants are undergraduates.
22

Table 4.4 Education Level of Survey Participants
Education Level Frequency Percent Freshman 24 10.7 Sophomore 30 13.4 Junior 33 14.7 Senior 51 22.8 Graduate Student 82 36.6 Other: Post-Bac, Post Doc 4 1.8 Total 224 100.0
What major do the survey participants represent? This table shows the grouping of the
majors into four disciplinary areas: Family and Food Science, Social Science, Ag
Science, and Environment/Natural Resources. This recoding of majors will be used to
determine if there are differences in the influence of marketing buzzwords and
purchasing habits of students within academic programs at the University of Kentucky,
College of Agriculture, Food and Environment.
Table 4.5 Major Classifications of Survey Participants
Degree Frequency Percent 1-Family and Food Science: Dietetics, Pre-dietetics,Food Science, Nutrition, Family Science
60 26.8
2-Social Sciences: Agricultural Education, Career andTechnical Education, Community and Leadership Development, Agricultural Economics
59 26.3
3-Ag Sciences: Animal Science, Pre-Vet, Equine,Dairy, Entomology, Agricultural Engineering and Biotechnology
51 22.8
4-Environment and Natural Resources: Plant and SoilSciences, Sustainable Ag, Natural Resource Management, Forestry, Landscape Architecture
54 24.1
Total 224 100.0
23

Where do the millennials in this study buy most of their food? The majority of the survey
participants (75%), shop at conventional, corporate-chain grocery stores, like Kroger,
Meijer, etc. Given the high proportion of respondents who shop at the same type of
grocery store, this variable will not be examined further as a factor in respondents'
purchasing habits.
Table 4.6 Millennials Preferred Food Shopping Locations
Store Frequency Percent Conventional, Corporate-Chains: (Kroger, Meijer, Safeway, Lucky)
168 75.0
Super-Centers: (Wal-Mart, Target, K-Mart) 20 8.9 Membership Based, Wholesale: (Costco, Sam’s Club) 3 1.3 Discounted Supermarkets-Chains: (Aldi, Save-A-Lot) 6 2.7 Corporate Specialty-Food Chains: (Whole Foods, Trader Joe’s, The Fresh Market)
14 6.3
Service Provided Restaurants, Cafeteria, Café’s, Fast Food: (Subway, Campus Dining, Panera, BWW’s, Mad Mushroom)
6 2.7
Co-ops, Locally Owned: (Good Food’s Market & Cafe, Farmer’s Markets)
5 2.2
Other: (Kroger and Walmart, Local and Conventional Chains)
2 .9
Total 224 100.0
Do millennial groups differ in their choice of food shopping location? Within the
millennial sample population, at least 74% from each of the four age groups selected
“Kroger” as their preferred grocery store. 12% of the youngest millennial age: born 1995-
1997 selected Super-Centers as their preferred grocery; compared to the 35.7% of the
oldest group, born before 1980. This group also selected “Kroger” at a 50% preference
level.
24

Table 4.7 Millennials Preferred Food Shopping Locations, Based on Age
Store Before 1980
1980-1984
1985-1989
1990-1994
1995-1997
Total
Conventional, Corporate-Chains: (Kroger, Meijer, Safeway, Lucky)
7 (50.0%)
9 (75.0%)
31 (81.6%)
84 (76.4%)
37 (74.0%)
168 (75.0%)
Super-Centers: (Wal-Mart, Target, K-Mart)
5 (35.7%)
1 (8.3%)
1 (5.3%)
7 (6.4%)
6 (12.0%)
20 (8.9%)
Membership Based, Wholesale: (Costco, Sam’s Club)
0 0 2 (5.3%)
1 (0.9%)
0 3 (1.3%)
Discounted Supermarkets-Chains: (Aldi, Save-A-Lot)
0 0 1 (2.6%)
4 (3.6%)
1 (2.0%)
6 (2.7%)
Corporate Specialty- Food Chains: (Whole Foods, Trader Joe’s, The Fresh Market)
1 (7.1%)
1 (8.3%)
3 (7.9%)
7 (6.4%)
2 (4.0%)
14 (6.3%)
Service Provided Restaurants, Cafeteria, Café’s, Fast Food: (Subway, Campus Dining, Panera, BWW’s, Mad Mushroom)
0 0 0 2 (1.8%)
4 (8.0%)
6 (2.7%)
Co-ops, Locally Owned: (Good Food’s Market & Cafe, Farmer’s Markets)
1 (7.1%)
0 0 4 (4.6%)
0 5 (2.2%)
Other: (Kroger and Walmart, Local and Conventional Chains)
0 1 (8.3%)
0 1 (0.9%)
0 2 (0.9%)
Total 14 100%
12 100%
38 100%
110 100%
50 100%
224 100%
Does gender influence grocery shopping locations? 168 of the male and female
participants or 75% selected Conventional, Corporate-Chains such as Kroger, Meijer, etc.
25
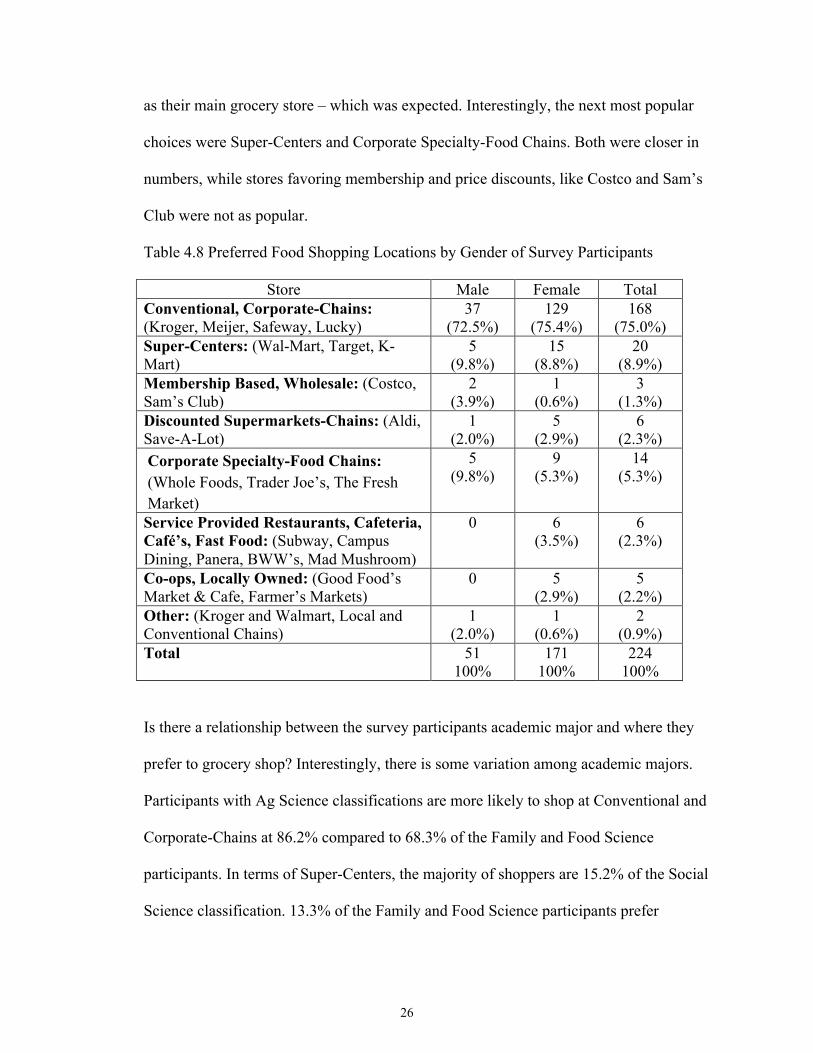
as their main grocery store – which was expected. Interestingly, the next most popular
choices were Super-Centers and Corporate Specialty-Food Chains. Both were closer in
numbers, while stores favoring membership and price discounts, like Costco and Sam’s
Club were not as popular.
Table 4.8 Preferred Food Shopping Locations by Gender of Survey Participants
Store Male Female Total Conventional, Corporate-Chains: (Kroger, Meijer, Safeway, Lucky)
37 (72.5%)
129 (75.4%)
168 (75.0%)
Super-Centers: (Wal-Mart, Target, K-Mart)
5 (9.8%)
15 (8.8%)
20 (8.9%)
Membership Based, Wholesale: (Costco, Sam’s Club)
2 (3.9%)
1 (0.6%)
3 (1.3%)
Discounted Supermarkets-Chains: (Aldi, Save-A-Lot)
1 (2.0%)
5 (2.9%)
6 (2.3%)
Corporate Specialty-Food Chains: (Whole Foods, Trader Joe’s, The Fresh Market)
5 (9.8%)
9 (5.3%)
14 (5.3%)
Service Provided Restaurants, Cafeteria, Café’s, Fast Food: (Subway, Campus Dining, Panera, BWW’s, Mad Mushroom)
0 6 (3.5%)
6 (2.3%)
Co-ops, Locally Owned: (Good Food’s Market & Cafe, Farmer’s Markets)
0 5 (2.9%)
5 (2.2%)
Other: (Kroger and Walmart, Local and Conventional Chains)
1 (2.0%)
1 (0.6%)
2 (0.9%)
Total 51 100%
171 100%
224 100%
Is there a relationship between the survey participants academic major and where they
prefer to grocery shop? Interestingly, there is some variation among academic majors.
Participants with Ag Science classifications are more likely to shop at Conventional and
Corporate-Chains at 86.2% compared to 68.3% of the Family and Food Science
participants. In terms of Super-Centers, the majority of shoppers are 15.2% of the Social
Science classification. 13.3% of the Family and Food Science participants prefer
26
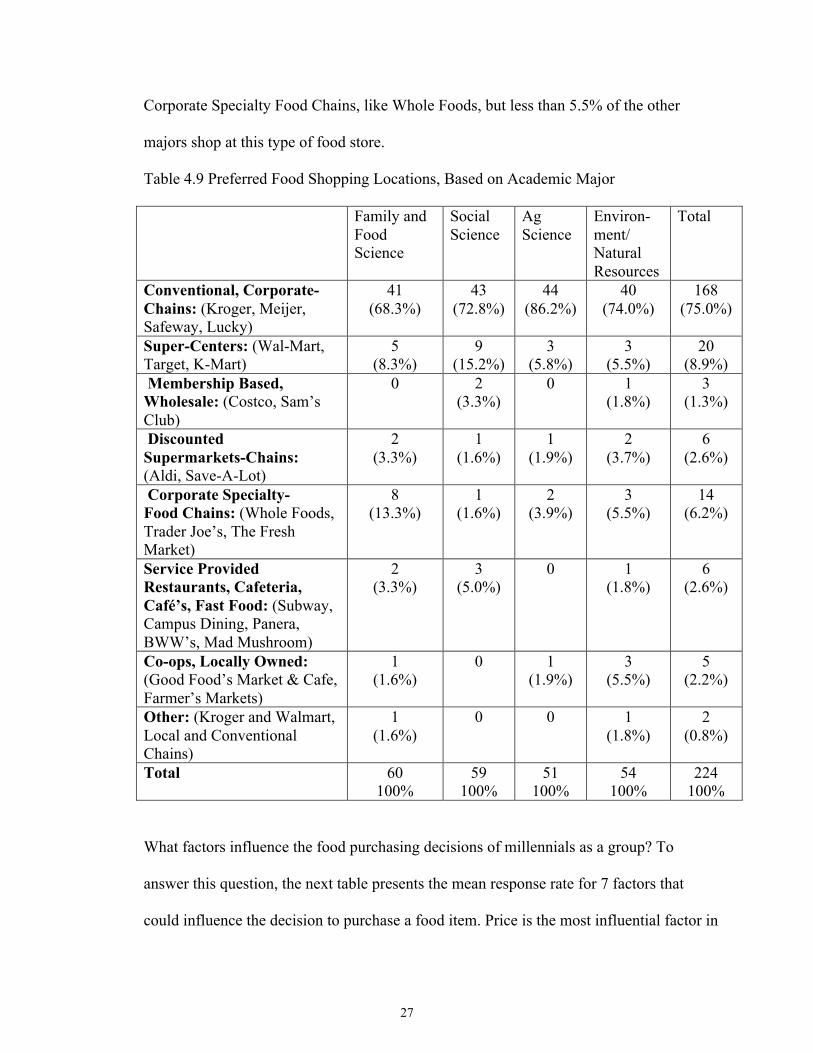
Corporate Specialty Food Chains, like Whole Foods, but less than 5.5% of the other
majors shop at this type of food store.
Table 4.9 Preferred Food Shopping Locations, Based on Academic Major
Family and Food Science
Social Science
Ag Science
Environ- ment/ Natural Resources
Total
Conventional, Corporate-Chains: (Kroger, Meijer, Safeway, Lucky)
41 (68.3%)
43 (72.8%)
44 (86.2%)
40 (74.0%)
168 (75.0%)
Super-Centers: (Wal-Mart, Target, K-Mart)
5 (8.3%)
9 (15.2%)
3 (5.8%)
3 (5.5%)
20 (8.9%)
Membership Based, Wholesale: (Costco, Sam’s Club)
0 2 (3.3%)
0 1 (1.8%)
3 (1.3%)
Discounted Supermarkets-Chains: (Aldi, Save-A-Lot)
2 (3.3%)
1 (1.6%)
1 (1.9%)
2 (3.7%)
6 (2.6%)
Corporate Specialty- Food Chains: (Whole Foods, Trader Joe’s, The Fresh Market)
8 (13.3%)
1 (1.6%)
2 (3.9%)
3 (5.5%)
14 (6.2%)
Service Provided Restaurants, Cafeteria, Café’s, Fast Food: (Subway, Campus Dining, Panera, BWW’s, Mad Mushroom)
2 (3.3%)
3 (5.0%)
0 1 (1.8%)
6 (2.6%)
Co-ops, Locally Owned: (Good Food’s Market & Cafe, Farmer’s Markets)
1 (1.6%)
0 1 (1.9%)
3 (5.5%)
5 (2.2%)
Other: (Kroger and Walmart, Local and Conventional Chains)
1 (1.6%)
0 0 1 (1.8%)
2 (0.8%)
Total 60 100%
59 100%
51 100%
54 100%
224 100%
What factors influence the food purchasing decisions of millennials as a group? To
answer this question, the next table presents the mean response rate for 7 factors that
could influence the decision to purchase a food item. Price is the most influential factor in
27

purchasing products from the grocery store with an average mean of 3.5 on a scale of 0 –
4. Purchasing “Locally Grown and Kentucky Proud” foods is the next most influential
items with a mean of 2.0. US Grown: 1.8, Environmental Impact and Greener: 1.58,
Humane Production and Cage Free: 1.57, Low Fat and Gluten Free and Sugar Free and
Low Carb 1.5, Certified Organic: 1.2. Given that the respondents are all college students,
it is not surprising that price is the most important factor in their purchasing decision.
What is surprising is that none of the other characteristics rose above a mean of 2.05.
This suggests that the limited income of millennials may trump any other value that
might influence their buying decisions.
Table 4.11 Influences on Millennials' Food Purchasing Decisions
Categories N Mean Std.
Deviation Price 222 3.5077 .72623 Locally Grown, Kentucky Proud Products, Family Farm Producers
212 2.0547 1.20167
U.S. Grown 206 1.8612 1.23251 Environmental Impact, Greener 193 1.5803 1.21759 Humane Production, Free Range, Cage Free 192 1.5750 1.25289
Low Fat, Gluten Free, Sugar Free, Low Carb, 100 Calories
193 1.5088 1.29485
Certified Organic 189 1.2905 1.15598 Valid N (listwise) 171
When purchasing groceries, what types of food do the respondents primarily purchase?
61.6% of the survey participants purchase mostly raw and fresh foods, 36.6% purchase
mostly packaged, boxed, or bagged food items, and 1.8% purchase mostly takeaway
prepared food items. For future researchers - this question should have been written as:
28
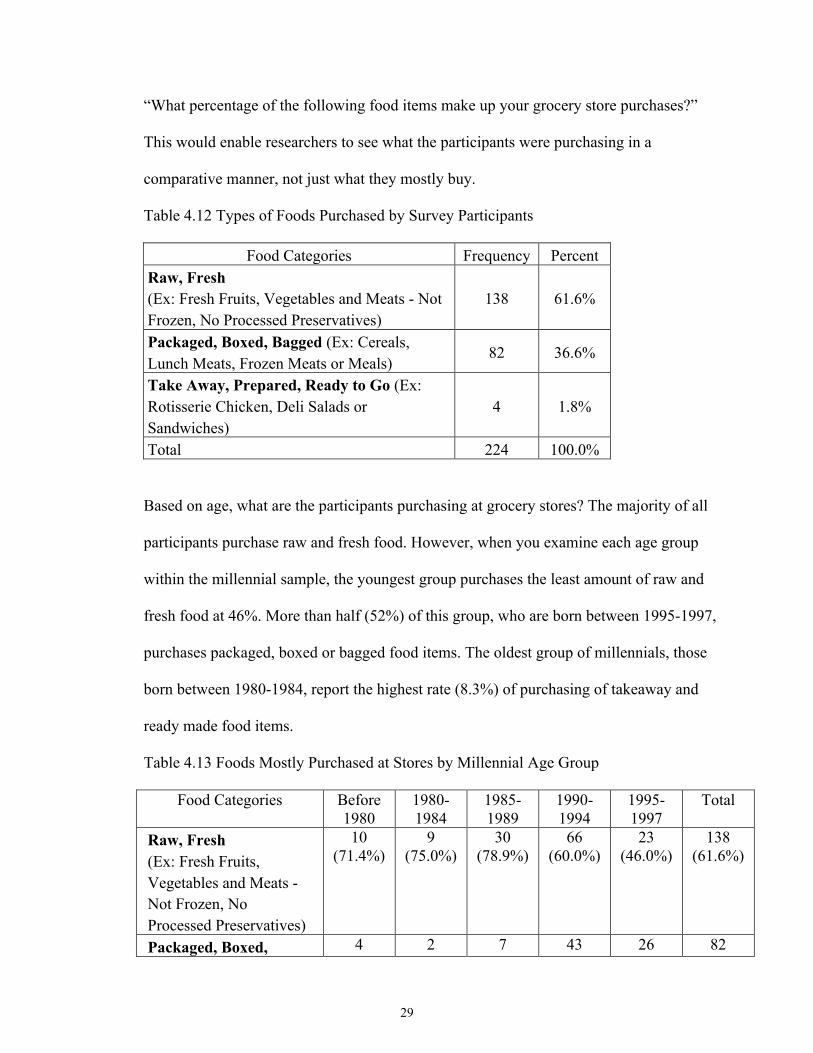
“What percentage of the following food items make up your grocery store purchases?”
This would enable researchers to see what the participants were purchasing in a
comparative manner, not just what they mostly buy.
Table 4.12 Types of Foods Purchased by Survey Participants
Food Categories Frequency Percent Raw, Fresh (Ex: Fresh Fruits, Vegetables and Meats - Not Frozen, No Processed Preservatives)
138 61.6%
Packaged, Boxed, Bagged (Ex: Cereals, Lunch Meats, Frozen Meats or Meals)
82 36.6%
Take Away, Prepared, Ready to Go (Ex: Rotisserie Chicken, Deli Salads or Sandwiches)
4 1.8%
Total 224 100.0%
Based on age, what are the participants purchasing at grocery stores? The majority of all
participants purchase raw and fresh food. However, when you examine each age group
within the millennial sample, the youngest group purchases the least amount of raw and
fresh food at 46%. More than half (52%) of this group, who are born between 1995-1997,
purchases packaged, boxed or bagged food items. The oldest group of millennials, those
born between 1980-1984, report the highest rate (8.3%) of purchasing of takeaway and
ready made food items.
Table 4.13 Foods Mostly Purchased at Stores by Millennial Age Group
Food Categories Before 1980
1980-1984
1985-1989
1990-1994
1995-1997
Total
Raw, Fresh (Ex: Fresh Fruits, Vegetables and Meats - Not Frozen, No Processed Preservatives)
10 (71.4%)
9 (75.0%)
30 (78.9%)
66 (60.0%)
23 (46.0%)
138 (61.6%)
Packaged, Boxed, 4 2 7 43 26 82
29

Bagged (Ex: Cereals, Lunch Meats, Frozen Meats or Meals)
(28.5%) (16.6%) (18.4%) (39.0%) (52.0%) (36.6%)
Take Away, Prepared, Ready to Go (Ex: Rotisserie Chicken, Deli Salads or Sandwiches)
0 1 (8.3%)
1 (2.6%)
1 (0.9%)
1 (2.0%)
4 (1.7%)
Total 14 100%
12 100%
38 100%
110 100%
50 100%
224 100%
Pearson Chi-Square Asymptotic Significance is .034 (8 df). 6 cells (40.0%) have expected count less than 5. The minimum expected count is .21.
What types of foods do male and female millennials purchase at stores? The table below
shows there is no significant difference by gender in the types of foods purchased at
stores. Even given the lack of significance, the results raise some interesting questions.
For example, do the responses reflect actual behavior or, what respondents thought of as
the “socially acceptable” response? In other words, millennials are supposed to be health
conscious, so did they choose the response that most fit the stereotype of their
generation?
Table 4.14 Foods Mostly Purchased at Stores by Millennials' Gender
Food Categories Male Female Total Raw, Fresh (Ex: Fresh Fruits, Vegetables and Meats - Not Frozen, No Processed Preservatives)
32 (62.7%)
105 (61.4%)
138 (61.6%)
Packaged, Boxed, Bagged (Ex: Cereals, Lunch Meats, Frozen Meats or Meals)
18 (35.2%)
63 (36.8%)
82 (36.6%)
Take Away, Prepared, Ready to Go (Ex: Rotisserie Chicken, Deli Salads or Sandwiches)
1 (1.9%)
3 (1.7%)
4 (1.7%)
Total 51 100%
171 100%
224 100%
Is academic major related to what participants purchase at the grocery? 75.9% of
Environmental/Natural Resources participants purchase mostly raw and fresh foods,
30
Table 4.13 Foods Mostly Purchased at Stores by Millennial Age Group (continued)

followed by 66.7% of the Family and Food Sciences participants. 45.7% of the Social
Science and 45% of the Ag Science participants mostly purchase packaged and boxed
food items.
Table 4.15 Foods Mostly Purchased at Stores, Based on Major Classification
Family and
Food Science
Social Science
Ag Science
Enviro/ Natural Resources
Total
Raw, Fresh (Ex: Fresh Fruits, Vegetables and Meats - Not Frozen, No Processed Preservatives)
40 (66.7%)
30 (50.8%)
27 (52.9%)
41 (75.9%)
138 (61.6%)
Packaged, Boxed, Bagged (Ex: Cereals, Lunch Meats, Frozen Meats or Meals)
19 (31.6%)
27 (45.7%)
23 (45.0)
13 (24.0%)
82 (36.6%)
Take Away, Prepared, Ready to Go (Ex: Rotisserie Chicken, Deli Salads or Sandwiches)
1 (1.6%)
2 (3.3%)
1 (1.9)
0 4 (1.7%)
Total 60 100%
59 100%
51 100%
54 100%
224 100%
In summary, the participants in this study seem to prefer purchasing raw, fresh foods
from their stores of choice. In an initial research hypothesis, it was assumed this group
would purchase mostly packaged and ready-made foods to follow their “on the go”
lifestyle. This data suggests the group is more interested in health and buying fresher
foods.
31

Food-related buzzwords and millennials’ purchasing habits
The second half of the survey focuses on the evaluation of food buzzwords and their
influence on food purchasing habits at stores. Participants were asked to rank the
following buzzwords within their designated categories. Here is the breakdown from each
category, based on mean: Environmental Health, Animal Health, and Personal Health.
Environmental Health
When asking millennials to think about buzzwords in connection to the environment,
“locally grown” was the buzzword that had the most influence on their food purchases.
The top three most influential buzzwords listed on a scale of 0 to 4.0: Locally Grown at a
mean value of 2.4, Kentucky Proud at 2.3, and No Pesticides/Herbicides at 2.0. GMO
Free ranked as the lowest at 1.4. Thus, it can be said that for these respondents, GMO
Free products are not an influential buzzword to their purchasing habits. Participants had
the option to write additional buzzwords in each buzzword section. The Environmental
Buzzword write-ins were: All Nature and Natural Ingredients, Cage Free, Fair Trade
Certified, Fresh, Gluten Free, Halal Food, Heirloom, No Artificial Sweeteners, Non-
Organic, and 10 for 10, Sale.
Animal Health
In the Animal Health Buzzword category, the highest ranked buzzword on a scale of 0 to
4.0 is No Antibiotics/Hormones with a mean of 2.3; USDA Beef was ranked at 2.2 and
Fresh Poultry was averaged at 2.0. The three lowest ranked buzzwords are Heritage
Breeds at .90, Corn-Finished at .80, and Kosher (.71). In terms of variation among the
32

means, No Antibiotics/Hormones had the most variance in standard deviation at 1.4,
which suggests that participants disagreed in ranking the importance of this buzzword.
Corn-Finished has the smallest standard deviation from the mean of .95, which means
most participants agreed the Corn-Finished was not as important as other buzzwords
when selecting groceries and does not impact their purchasing habits. The Animal Health
Buzzword write-ins were: Kentucky Raised, Halal Meat, Locally Produced, and Grass-
Finished.
Personal Health
In the Personal Health Buzzword section, Fresh is the most influential buzzword for
millennials. Fresh with a mean of 2.5 on a scale of 0.0 to 4.0, was followed by Whole
Wheat at 2.4 and No Preservatives at 2.2. The two lowest ranked buzzwords were Gluten
Free ranked at .9 and Lactose-Free at .7. No Preservatives has a high variance with a
standard deviation of 1.4, which suggests that many participants disagreed on the level of
importance this buzzword has on their food purchases, even though No Preservatives was
listed with the third highest average mean. The Personal Health Buzzword write-ins
were: Healthy, No Added Nitrates, No Added Sugars or Sweeteners, Soy Free, and No
High Fructose Corn Syrup.
Table 4.16 All Buzzwords Sorted Based on Mean: Grouped in One Table (N = 224)
Buzzwords Valid N
Percent selected
scale value < 0
Mean Std. Deviation
Environmental Health Buzzwords
Locally Grown 209 93.30% 2.4316 1.21729
33

Certified Kentucky Proud 207 92.40% 2.3802 1.30419 No Pesticides / No Herbicides 191 85.30% 2.0157 1.2868 Sustainably Grown 186 83.00% 1.728 1.20682 Eco-Friendly 185 82.60% 1.6071 1.30843 Grass-Fed 183 81.70% 1.5557 1.10703 Certified Organic 183 81.70% 1.5519 1.2656 Green 178 79.50% 1.5073 1.18465 GMO Free 168 75.00% 1.4946 1.33548 Other 1 42 1.1286 1.68498 Other 2 31 0.3419 1.06701
Animal Health Buzzwords
No Antibiotics, Steroids or Hormones
190 84.80% 2.3184 1.4404
USDA Graded Beef 184 82.10% 2.2924 1.36712 Pasture Raised 183 81.70% 2.0164 1.34249 Humanely Slaughtered 180 80.40% 1.9561 1.36616 Free Range or Cage Free 179 79.90% 1.8709 1.36598 Fresh Poultry 177 79.00% 1.7886 1.30339 Family Farm Raised 175 78.10% 1.7378 1.29729 Grass-Fed 172 76.80% 1.6623 1.239 Certified Branded Beef (Angus, Hereford, Harris Ranch)
169 75.40% 1.5556 1.23794
Naturally Raised 165 73.70% 1.5297 1.2327 Heritage Breeds 162 72.30% 1.0819 1.24819 rBGH-free 155 69.20% 0.9753 1.05801 Corn Finished 154 68.80% 0.8675 0.95861 Kosher 149 66.50% 0.7074 1.02279 Other 1 35 0.7086 1.49634 Other 2 29 0.1552 0.72633
Personal Health Buzzwords
Fresh 204 91.10% 2.5961 1.37346 Whole Wheat, Multigrain 195 87.10% 2.459 1.29721 No Preservatives 187 83.50% 2.2348 1.41133 Low-fat, Light 178 79.50% 1.864 1.33728 Low Sodium, Low Cholesterol 177 79.00% 1.7859 1.35983
Fat Free 173 77.20% 1.7525 1.34258
34
Table 4.16 All Buzzwords Sorted Based on Mean: Grouped in One Table (continued)
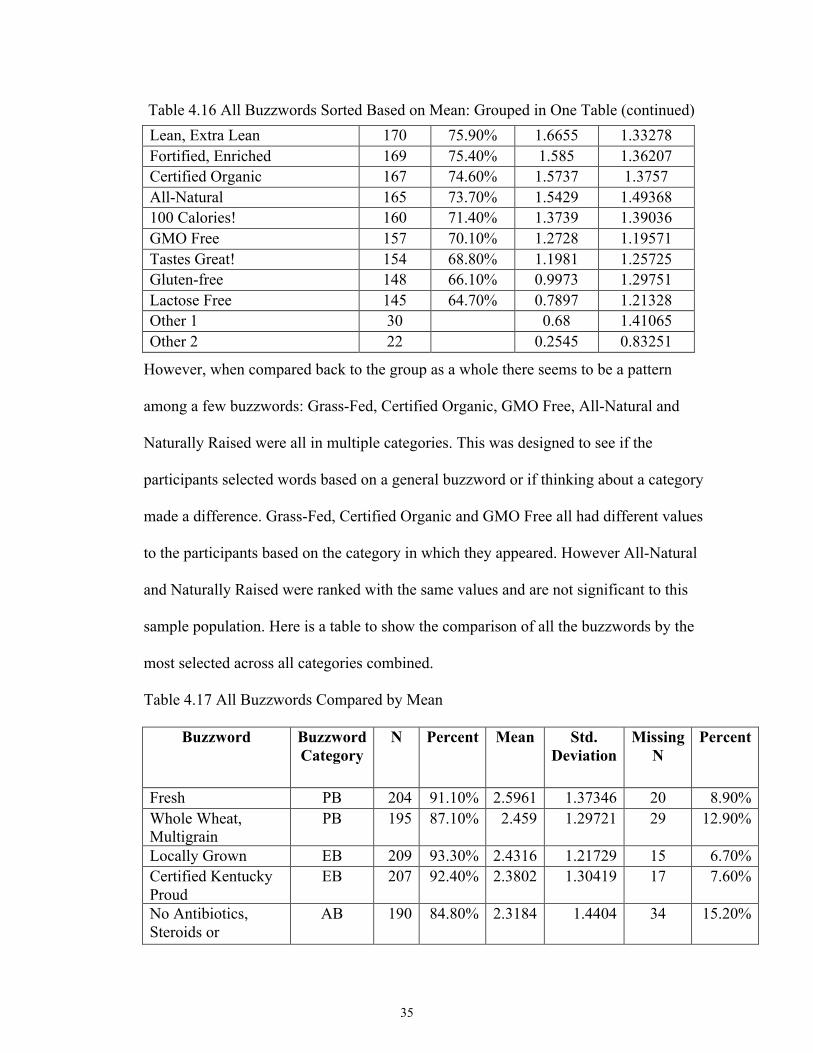
Lean, Extra Lean 170 75.90% 1.6655 1.33278 Fortified, Enriched 169 75.40% 1.585 1.36207 Certified Organic 167 74.60% 1.5737 1.3757 All-Natural 165 73.70% 1.5429 1.49368 100 Calories! 160 71.40% 1.3739 1.39036 GMO Free 157 70.10% 1.2728 1.19571 Tastes Great! 154 68.80% 1.1981 1.25725 Gluten-free 148 66.10% 0.9973 1.29751 Lactose Free 145 64.70% 0.7897 1.21328 Other 1 30 0.68 1.41065 Other 2 22 0.2545 0.83251
However, when compared back to the group as a whole there seems to be a pattern
among a few buzzwords: Grass-Fed, Certified Organic, GMO Free, All-Natural and
Naturally Raised were all in multiple categories. This was designed to see if the
participants selected words based on a general buzzword or if thinking about a category
made a difference. Grass-Fed, Certified Organic and GMO Free all had different values
to the participants based on the category in which they appeared. However All-Natural
and Naturally Raised were ranked with the same values and are not significant to this
sample population. Here is a table to show the comparison of all the buzzwords by the
most selected across all categories combined.
Table 4.17 All Buzzwords Compared by Mean
Buzzword Buzzword Category
N Percent Mean Std. Deviation
Missing N
Percent
Fresh PB 204 91.10% 2.5961 1.37346 20 8.90% Whole Wheat, Multigrain
PB 195 87.10% 2.459 1.29721 29 12.90%
Locally Grown EB 209 93.30% 2.4316 1.21729 15 6.70% Certified Kentucky Proud
EB 207 92.40% 2.3802 1.30419 17 7.60%
No Antibiotics, Steroids or
AB 190 84.80% 2.3184 1.4404 34 15.20%
35
Table 4.16 All Buzzwords Sorted Based on Mean: Grouped in One Table (continued)

Hormones USDA Graded Beef AB 184 82.10% 2.2924 1.36712 40 17.90%
No Preservatives PB 187 83.50% 2.2348 1.41133 37 16.50% Pasture Raised AB 183 81.70% 2.0164 1.34249 41 18.30% No Pesticides / No Herbicides
EB 191 85.30% 2.0157 1.2868 33 14.70%
Humanely Slaughtered
AB 180 80.40% 1.9561 1.36616 44 19.60%
Free Range or Cage Free
AB 179 79.90% 1.8709 1.36598 45 20.10%
Low-fat, Light PB 178 79.50% 1.864 1.33728 46 20.50% Fresh Poultry AB 177 79.00% 1.7886 1.30339 47 21.00% Low Sodium, Low Cholesterol
PB 177 79.00% 1.7859 1.35983 47 21.00%
Fat Free PB 173 77.20% 1.7525 1.34258 51 22.80% Family Farm Raised AB 175 78.10% 1.7378 1.29729 49 21.90% Sustainably Grown EB 186 83.00% 1.728 1.20682 38 17.00% Lean, Extra Lean PB 170 75.90% 1.6655 1.33278 54 24.10% Grass-Fed AB 172 76.80% 1.6623 1.239 52 23.20%
Eco-Friendly EB 185 82.60% 1.6071 1.30843 39 17.40% Fortified, Enriched PB 169 75.40% 1.585 1.36207 55 24.60% Certified Organic PB 167 74.60% 1.5737 1.3757 57 25.40% Grass-Fed EB 183 81.70% 1.5557 1.10703 41 18.30% Certified Branded Beef (Angus, Hereford, Harris Ranch)
AB 169 75.40% 1.5556 1.23794 55 24.60%
Certified Organic EB 183 81.70% 1.5519 1.2656 41 18.30% All-Natural PB 165 73.70% 1.5429 1.49368 59 26.30% Naturally Raised AB 165 73.70% 1.5297 1.2327 59 26.30% Green EB 178 79.50% 1.5073 1.18465 46 20.50% GMO Free EB 168 75.00% 1.4946 1.33548 56 25.00% 100 Calories! PB 160 71.40% 1.3739 1.39036 64 28.60% GMO Free PB 157 70.10% 1.2728 1.19571 67 29.90% Tastes Great! PB 154 68.80% 1.1981 1.25725 70 31.30% Heritage Breeds AB 162 72.30% 1.0819 1.24819 62 27.70% Gluten-free PB 148 66.10% 0.9973 1.29751 76 33.90% rBGH-free AB 155 69.20% 0.9753 1.05801 69 30.80% Corn Finished AB 154 68.80% 0.8675 0.95861 70 31.30% Lactose Free PB 145 64.70% 0.7897 1.21328 79 35.30%
36
Table 4.17 All Buzzwords Compared by Mean (continued)

Kosher AB 149 66.50% 0.7074 1.02279 75 33.50%
*EB: Environmental Buzzwords, *AB: Animal Health Buzzwords, *PB: Personal Health Buzzwords
The following table reports the frequency of buzzwords on a 0 to 4 Likert Scale. Each
buzzword is sorted into a category. No Change reflects the numerical value of true zero,
the buzzword had no impact on participants (scale selector was not moved). The rest
represent the listed value: 0, 1, 2, 3 and 4.
Table 4.18 Frequency Rate of Buzzwords
Buzzwords No Change 0 1 2 3 4
Environmental Health Buzzwords
Locally Grown 15 14 28 34 64 69 6.7% 6.3% 12.5% 15.2% 28.6% 30.8%
Certified Kentucky Proud 17 15 32 38 52 70 7.6% 6.7% 14.3% 17.0% 23.2% 31.3%
No Pesticides / No Herbicides 33 26 35 40 43 47
14.7% 11.6% 15.6% 17.9% 19.2% 21.0% Sustainably Grown 38 27 46 44 38 31
17.0% 12.1% 20.5% 19.6% 17.0% 13.8% Eco-Friendly 39 22 63 50 32 18
17.4% 9.8% 28.1% 22.3% 14.3% 8% Grass-Fed 41 38 51 34 36 24
18.3% 17.0% 22.8% 15.2% 16.1% 10.7% Certified Organic 41 38 43 40 30 32
18.3% 17.0% 19.2% 17.9% 13.4% 14.3% Green 46 34 46 42 31 25
20.5% 15.2% 20.5% 18.8% 13.8% 11.2% GMO Free 56 41 41 29 31 26
25.0% 18.3% 18.3% 12.9% 13.8% 11.6%
Animal Health Buzzwords
37
Table 4.17 All Buzzwords Compared by Mean (continued)

No Antibiotics, Steroids or Hormones 34 27 24 32 35 72
15.2% 12.1% 10.7% 14.3% 15.6% 32.1% USDA Graded Beef 40 20 26 33 44 61
17.9% 8.9% 11.6% 14.7% 19.6% 27.2% Pasture Raised 41 32 40 52 30 29
18.3% 14.3% 17.9% 23.2% 13.4% 12.9% Humanely Slaughtered 44 26 37 42 33 42
19.6% 11.6% 16.5% 18.8% 14.7% 18.8% Free Range or Cage Free 45 32 30 43 35 39
20.1% 14.3% 13.4% 19.2% 15.6% 17.4% Fresh Poultry 47 28 19 44 39 47
21.0% 12.5% 8.5% 19.6% 17.4% 21.0% Family Farm Raised 49 30 31 49 30 35
21.9% 13.4% 13.8% 21.9% 13.4% 15.6% Grass-Fed 52 35 25 42 41 29
23.2% 15.6% 11.2% 18.8% 18.3% 12.9% Certified Branded Beef (Angus, Hereford, Harris Ranch)
55 33 34 43 38 21 24.6% 14.7% 15.2% 19.2% 17.0% 9.4%
Naturally Raised 59 38 35 41 28 23 26.3% 17.0% 15.6% 18.3% 12.5% 10.3%
Heritage Breeds 62 51 57 30 17 7 27.7% 22.8% 25.4% 13.4% 7.6% 3.1%
rBGH-free 69 57 40 27 15 16 30.8% 25.4% 17.9% 12.1% 6.7% 7.1%
Corn Finished 70 54 50 37 5 8 31.3% 24.1% 22.3% 16.5% 2.2% 3.6%
Kosher 75 68 46 20 7 8 33.5% 30.4% 20.5% 8.9% 3.1% 3.6%
Personal Health Buzzwords
Fresh 20 20 18 36 30 100 8.9% 8.9% 8.0% 16.1% 13.4% 44.9%
Whole Wheat, Multigrain 29 21 16 37 51 70 12.9% 9.4% 7.1% 16.5% 22.8% 31.3%
No Preservatives 37 27 26 33 32 69 16.5% 12.2% 11.6% 14.7% 14.3% 30.8%
Low-fat, Light 46 32 32 39 35 40 20.5% 14.3% 14.3% 17.4% 15.6% 17.9%
38
Table 4.18 Frequency Rate of Buzzwords (continued)

Low Sodium, Low Cholesterol 47 38 28 35 39 37
21.0% 17.0% 12.5% 15.6% 17.4% 16.5% Fat Free 51 40 37 34 28 34
22.8% 17.9% 16.5% 15.2% 12.5% 15.2% Lean, Extra Lean 54 38 25 33 38 36
24.1% 17.0% 11.2% 14.7% 17.0% 16.1% Fortified, Enriched 55 48 43 33 27 18
24.6% 21.4% 19.2% 14.7% 12.1% 8.0% Certified Organic 57 43 31 33 27 33
25.4% 19.2% 13.8% 14.7% 12.1% 14.7% All-Natural 59 38 25 36 36 30
26.3% 17.0% 11.2% 16.1% 16.1% 13.4% 100 Calories! 64 53 36 32 25 14
28.6% 23.7% 16.1% 14.3% 11.2% 6.3% GMO Free 67 49 35 26 23 24
29.9% 21.9% 15.6% 11.6% 10.3% 10.7% Tastes Great! 70 41 36 28 15 34
31.1% 18.3% 16.1% 12.5% 6.7% 15.2% Gluten-free 76 59 47 14 8 20
33.9% 26.3% 21.0% 6.3% 3.6% 8.9% Lactose Free 79 72 33 19 8 13
35.3% 32.1% 14.7% 8.5% 3.6% 5.8% After participants ranked all of the buzzwords presented in each category, they were
asked to select the top five buzzwords influencing their food purchasing habits. The most
important buzzwords to the survey participants are Certified Kentucky Proud: selected by
99 participants, Locally Grown: also selected by 99 participants, and Whole
Wheat/Multigrain: selected by 85 participants. The three least important buzzwords to the
survey participants are Corn Finished: selected by 3 participants, Kosher: selected by 3
participants, and Heritage Breeds: selected by 2 participants.
Table 4.19 Buzzwords: Top 5 Selected
Buzzwords Frequency Percent Certified Kentucky Proud 99 44.2 Locally Grown 99 44.2
39
Table 4.18 Frequency Rate of Buzzwords (continued)

Whole Wheat, Multigrain 85 37.9 Fresh 79 35.3 No Preservatives 58 25.9 No Antibiotics, Steroids or Hormones 56 25 Low-fat, Light 52 23.2 All-Natural 46 20.5 Certified Organic 45 20.1 USDA Graded Beef 44 19.6 Low Sodium, Low Cholesterol 38 17 Lean, Extra Lean 37 16.5 No Pesticides / No Herbicides 37 16.5 Family Farm Raised 30 13.4 Fat Free 27 12.1 Certified Branded Beef (Angus, Hereford, etc.) 26 11.6 Humanely Slaughtered 26 11.6 100 Calories! 25 11.2 Tastes Great! 22 9.8 Free Range or Cage Free 20 8.9 Grass-Fed 16 7.1 Eco-Friendly 14 6.3 Naturally Raised 14 6.3 GMO Free 11 4.9 Gluten-free 10 4.5 Lactose Free 9 4 Pasture Raised 9 4 Green 7 3.1 Fortified, Enriched 6 2.7 rBGH-free 4 1.8 Corn Finished 3 1.3 Kosher 3 1.3 Heritage Breeds 2 0.9
Television is the most common location where participants have seen food
advertisements. The least common location for food advertisements is emails or websites
and in newspapers. Participants were given the option to write in other forms of media
and these responses included: in store ads, coupon mailers, flyers and billboards, inside
grocery stores, and word of mouth.
40
Table 4.19 Buzzwords: Top 5 Selected (continued)

Table 4.20 Media and Food Advertising
Media Outlet N Mean Std. Deviation Television 197 2.3371 1.28892 Magazines 167 1.3317 1.13164 Social Media 182 1.2462 1.16290 Radio 163 1.1129 1.12503 E-mail / General Websites 164 1.0683 1.04920 Newspaper 161 1.0385 1.05392
In conjunction with the quantitative survey, participants were asked to create a drafted
Twitter Post with these instructions.
Create a (Drafted) Twitter Post:
Using the fewest amount of words (140 characters), create a post to promote
your own food Buzzword preferences. (This is where you can be creative!)
EXAMPLES:
1. RT “USDA, Certied Black Angus steaks, on sale @Kroger. #KyProud
#TastesGreat!”
2. Local farmers showcasing their Organic tomatoes @KYFarmersMarket
in Downtown Lexington!
The Twitter Posts below represent the creative and “millennial” portion of this survey.
Each Twitter Post was categorized into sections to reflect the following marketing and
framing structures constructed by millennials: Price, Environmental Health, Animal
Health, Personal Health.
41

Table 4.21 Twitter Posts Categorized
Price Broke college kid ? There's a huge #10for10 sale @kroger Stock up on that ramen and Mac n cheese ! Store wide sale @Kroger Fresh-Water Fish on sale at Kroger this week! Less fat and calories, the cheapest products @ Kroger Cheap fresh produce available now! NEW! Low sodium Simply Organic frozen pizza on sale now @Kroger Take $1.00 off with Kroger Plus card
KY Proud / Farmer's Markets/Local @KYProud rocks! Fresh produce on sale @Kroger! Locally grown #KyProud Farmers Market showcasing original #KentuckyProud recipes by UK Dietetics Students. #eatlocal #healthy #kyproud Visited the Farmers Market in downtown Lex to get some fresh food #buylocal #KYproud #KYProud Local farmers raise cage free, farm fresh eggs #KYProud @KYFarmersMarket #comegetem Meet the #KYProud local farmers at the Lexington Kroger @Kroger is now selling so many #KYProud products and I love it! #locallygrown All-natural preservative-free chicken on sale @Kroger. #KyProud moo alert udderly KY milk@walmart#gotmilk#itsgood eat fresh #local Local, cage-free eggs @KYFarmersMarket #KyProud Support your local #familyfarms! #buylocal and be #KentuckyProud when buying your produce! Locally grown, cherry tomatoes @lexingtonfarmersmarket #fresh #nopreservatives #kyproud #tastesgreat! Locally grown=locally loved Support your local farmers!#FarmersMarket #Fresh Kentucky farmers selling humanely slaughtered, cage free chicken @KYFarmersMarket "Extra lean Certified Black Angus fresh beef, on sale @Kroger. #KyProud #buylocal @kyfarmersmarket is open from 8-12 today. Fresh fruit, veggies, meats and arts! #KyProud #ShareTheLex #EatLex Local farmers showcasing their Fresh, Organic berries @KYFarmers Market in Downtown Lexington. Save a farm! Go local! Save biodiversity, choose heirloom varieties! Fresh veg! #KyProud #Nopackaging #lowimpact Best burgers in the bluegrass. #kentuckyproud
42

Naturally raised chicken....@KY FARMERSMARKET Local farms offering CSA shares for produce and meat #KeepitLocal #KnowYourFarmerKnowYourFood Locally grown #kyproud produce on sale at #goodfoodscoop Local farmers showcasing their Organic tomatoes @KYFarmersMarket in Downtown Lexington! #KYProud products now avaliable @Kroger !! #BuyLocal #FromFarmToFork Go local. Go Critchfield's Meats. #kyproud Grill-ready meats on sale @Kroger. #KYProud #funsaturday Nothing better than some #udderlykyproud milk! KY proud family farm raised beef #taste great Fresh, certified organic produced locally grown on family farms @GoodFoodsMarket Family farm raised beef @familyname In-season, locally grown vegetables now at Kroger! @KYFarmersMarket best food in town #TastesGreat Can't wait to get local, fresh, and organic food at the farmers market! Locally grown fresh cucumber @Kroger #kyproud #healthy KY proud food is the way to go!!!! USDA Certified, Local, Organic turnip greens available now @KyFarmersMarket #KyProud Supporting local agriculture, sustainable products, benefiting our community. #FoodForThought @farmersmarket Local, fresh produce available @KYFarmersMarket! Come support your neighbors! "Local Kentucky Proud milk on Walmart shelves! #KYProud #KentuckyDairy Support local farmers at the Farmers Market! Be sure to shop local and help your small farmers by purchasing your favorite meats and veggies at the farmers market this Saturday! #KYProud KY Proud products are the only way to go! #KYProud #KYFRESH @tablethreeten Special of the day features #Organic Whole Wheat pasta dish with Local Grass-Fed Beef #GMOfree #KYProud Many fresh and Kentucky Proud products are now lean and good for you! Find them at your local Farmers market! #KentuckyProud Kyproud Local farmers gathering at @KYFarmersMarket by Rupp on Tuesday; look for their Fresh off our families farm and into your families kitchen, come to Paul's fruit market today for the best local produce around! Organic, Kentucky Proud cucumbers! Kentucky Proud products introduced in Kroger throughout Kentucky Visit your local farmers market for a taste of #locallyproduced #wholewheatmultigrain bread! #familyfarmraised #certifiedkentuckyproud UK farms selling #locallygrown and #allnatural produce on campus for students!
43
Table 4.21 Twitter Posts Categorized (continued)
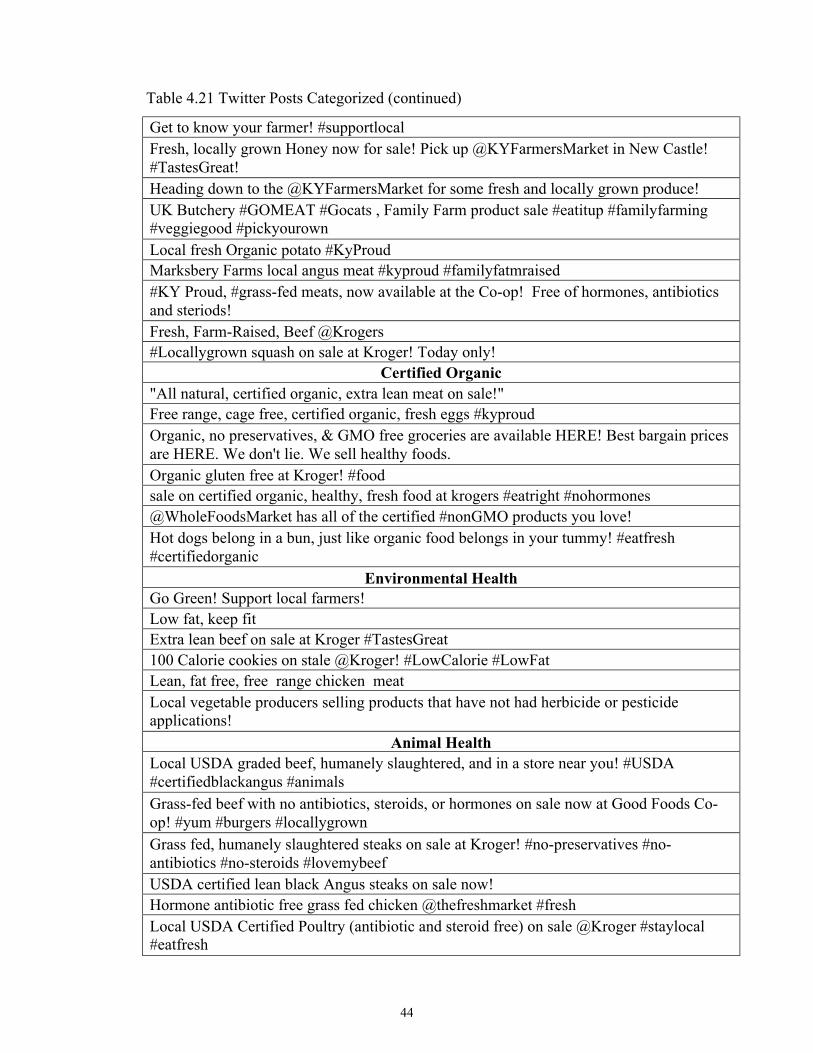
Get to know your farmer! #supportlocal Fresh, locally grown Honey now for sale! Pick up @KYFarmersMarket in New Castle! #TastesGreat! Heading down to the @KYFarmersMarket for some fresh and locally grown produce! UK Butchery #GOMEAT #Gocats , Family Farm product sale #eatitup #familyfarming #veggiegood #pickyourown Local fresh Organic potato #KyProud Marksbery Farms local angus meat #kyproud #familyfatmraised #KY Proud, #grass-fed meats, now available at the Co-op! Free of hormones, antibiotics and steriods! Fresh, Farm-Raised, Beef @Krogers #Locallygrown squash on sale at Kroger! Today only!
Certified Organic "All natural, certified organic, extra lean meat on sale!" Free range, cage free, certified organic, fresh eggs #kyproud Organic, no preservatives, & GMO free groceries are available HERE! Best bargain prices are HERE. We don't lie. We sell healthy foods. Organic gluten free at Kroger! #food sale on certified organic, healthy, fresh food at krogers #eatright #nohormones @WholeFoodsMarket has all of the certified #nonGMO products you love! Hot dogs belong in a bun, just like organic food belongs in your tummy! #eatfresh #certifiedorganic
Environmental Health Go Green! Support local farmers! Low fat, keep fit Extra lean beef on sale at Kroger #TastesGreat 100 Calorie cookies on stale @Kroger! #LowCalorie #LowFat Lean, fat free, free range chicken meat Local vegetable producers selling products that have not had herbicide or pesticide applications!
Animal Health Local USDA graded beef, humanely slaughtered, and in a store near you! #USDA #certifiedblackangus #animals Grass-fed beef with no antibiotics, steroids, or hormones on sale now at Good Foods Co- op! #yum #burgers #locallygrown Grass fed, humanely slaughtered steaks on sale at Kroger! #no-preservatives #no- antibiotics #no-steroids #lovemybeef USDA certified lean black Angus steaks on sale now! Hormone antibiotic free grass fed chicken @thefreshmarket #fresh Local USDA Certified Poultry (antibiotic and steroid free) on sale @Kroger #staylocal #eatfresh
44
Table 4.21 Twitter Posts Categorized (continued)

Local cage free eggs for sale @Whole Foods #KyProud #PerfectProtein #NotAllCoopedUp Humanely slaughtered! (cause that actually means something unlike other buzzwords)
Personal Health 100 calories! packs are low fat with no preservatives. #allnatural Eat healthy! #allnature eating healthy #tastesgreat #healthyliving So excited my favorite all natural, gluten-free granola is on sale @Kroger. #yummy #finallyonsale #excited They finally have #glutenfree biscuits @Kroger! Fresh, local, and good for you! @UKCSA #fresh #shop smart / #eat healthy Eat less, eat Always Have health dietary restrictions? Kroger has low carb items with no preservatives that are lactose-free and gluten-free. #TastesGreat! Wholesome is awesome! Check out the new book on the E2 diet and you will be hooked. New Enriched, multigrain Wheat bread on sale @Walmart. #TastesGreat healthy food RD "Low cholesterol, Lean Chicken with no preservatives, on sale @ Kroger. #TastesGreat #LocallyGrown New Gluten free chips at your local Kroger! It's time to go all natural! Buy #wholegrains for #hearthealth!!! Health foods galore @Kroger. #multigrain #low fat #low sodium All-Natural cookies made with fresh ingredients!
The following is a visual representation, called a Wordle, of all of the Twitter Posts
created by the participants. The Wordle is an online website and creates the image by
evaluating the number of words used with content. The size of the word is dependent on
the number of times the word was used in the text selection. The larger the word in the
image, the more counts of the particular word.
45
Table 4.21 Twitter Posts Categorized (continued)

Figure 4.1 Twitter Post Wordle
In this case, the most reoccurring words throughout the Twitter posts: Local: 32 posts,
Kroger: 28 posts, KYProud: 28 posts, Fresh: 27 posts, sale: 23 posts, Organic: 17,
farmers: 12, now: 12, and free: 11 posts.
Data Analysis Summary
Overall, the data reflects buzzwords do have an impact on millennial food buying
preferences. It seems the group has constructed theories of particular buzzwords and it
reflects in their opinions on what they buy at grocery stores. Their opinions are clearly
expressed in the qualitative section of the study. The Twitter Post question was designed
to allow the participants some freedom to be self-expressive concerning food purchasing
in a world surrounded by buzzwords.
46

Chapter 5 - Conclusions and Recommendations
Summary of the study and its conclusions
This study analyzes the connection between the millennial generation and food
preferences, based on buzzwords. Through a survey, participants were asked a series of
questions about their food purchasing habits. Participants answered questions based on
the influence of buzzwords creating a value on their food. Interestingly enough, the group
had a few differences.
Before explaining the results, it was important to understand the millennial generation
and theory behind the study. Social Constructionism was the theoretical framework to
support this study. It is believed, consumers select a healthier food item based on the
meaning of a buzzword appearing on food labels (Northup, 2014). Social constructs, for
example of buzzwords, are created as a way to seek common understanding of social
reality, and then become a shared assumption about that reality (Zaltman, 1997).
The millennial generation thrives on a sense of belonging to a group, recognition and
ease (Croke, 2014). Research suggests consumers’ food choices can be swayed by social
consciousness and peer pressure approval or disapproval (Almerico, 2014). If groups
favor a certain food choice, it is more likely for a consumer to choose the food as their
favorite (Almerico, 2014). Food can also become an expression of identity (Almerico,
2014). This helps the researcher analyze why some results me grouped in certain ways.
Even though this research only reviews a sample from the College of Agriculture, Food
47

and Environment at the University of Kentucky, the group still demonstrated some
important differences.
When participants where asked about their grocery purchases, 61.6% of participants
stated they purchase raw and fresh foods. However, when you review each age group
within the millennial sample, the youngest group of millennials (those born between
1995-1997) purchases the least amount of raw and fresh food at 46% and are most likely
to purchase packaged, boxed or bagged food items (52%). The oldest group of
millennials (those born between 1980-1984), report the highest rate of purchasing
takeaway and ready-made food items (8.3%).
Interestingly, academic major also seems to have an influence on the types of foods
purchased by millennials. For example, 75.9% of the Environmental/Natural Resources
majors purchase mostly raw and fresh foods, followed by 66.7% of the Family and Food
Sciences majors. But Social Science majors (45.7%) and Ag Science majors (45%) are
most likely to purchase packaged and boxed food items.
The millennial generation is interested in their health, especially its relationship to the
food they consume. But, this is a sample of college students who typically eat on the run
and rarely have as much money as they would like. Given this, I would have assumed
participants would purchase mostly packaged or take away foods. Yet, at least in their
responses, the majority of them purchase raw and fresh foods. Of course, it is possible
48

that they were simply responding with what they assumed was the socially acceptable
answer.
Research found in the literature review shows the millennial generation enjoys making
active decisions about their lifestyle and brands play a huge role in communicating
information to them. It was interesting in the results the millennial respondents agreed
that price was the number one influencer about their food purchasing habits. Yet, they do
not shop at discount or buy-in-bulk stores, in fact, 75% of the participants shop at Kroger.
In a follow up for future research, I would be interested in a qualitative study to see why
these millennials shop at Kroger when price is so important to them. Perhaps it is more
convenient or it is where their parents shopped and so a familiar food store. Or, perhaps
since Kroger is a conventional, corporate-chain, it tends to have everything millennials
might prefer in their stores: Eat Local, All-Natural, price discounts, USDA, etc. Diving
deeper into how millennials mesh their concerns about price with their stated tendency to
purchase raw and fresh foods may help define the social reality of food-related
buzzwords.
Limitations
The limitations of this study could have impacted results. The sample population was
directly from the College of Agriculture, Food and Environment, different colleges at the
University of Kentucky could have reflected different ideas, as well as other universities
across the US surveying the same age of respondents. To reach this group, I worked with
the university to send the survey of the CAFE Student Listserv, students may have not
49

been as inclined to open the email. Other limitations: time of year, length of the survey,
technology options for students and CAFE students. These limitations must be kept in
mind as the results are considered.
Future research
I believe it’s important to think about the foods we put in our bodies and how they are
marketed to us every day. My interest in this topic began from living with roommates and
each of us had different styles of selecting our foods. For example, we each purchased
different types of eggs. One with farm fresh eggs from her family home, one with all
natural cage free eggs: $6 plus, and mine: Kroger brand, the cheaper ones. I realized each
buzzword on our cartons had a story we each were being sold. I wanted to see if there
was a theme among others my age at the collegiate level. After many meetings and
numerous articles, I developed my research and survey to analyze millennial food buying
preferences, based on buzzwords.
After reviewing the results, I realize the results raise more questions than they answered.
My main focus was the buzzwords, but after seeing participants’ answers to where they
shop and what types of foods they purchase, I want to know more of the why. I think a
follow up focus group would have helped answer the questions that emerged after the
survey results were analyzed. I also would recommend expanding the results by
surveying students in other colleges at the University of Kentucky or, millennials at other
universities. I also think the results of this study and others like it could be useful for
grocery stores, like Kroger, to understand the factors that influence millennials'
50
purchasing patterns. Since millennials like to be involved in brands, a grocery store could
develop more ways to attract the millennials, based on a better understanding of their
motivations and preferences.
The concept of a healthy lifestyle is changing. Fast food restaurants, coffee shops,
Starbucks, Panera and many more all add these buzzwords to their menus. Subscription
memberships, like Hello Fresh and Blue Apron also have buzzwords added to their
menus and marketing. The growing use of buzzwords is designed to appeal to all
shoppers, but especially millennials, who are motivated by a desire to share a sense of
belonging to a group combined with eating healthy and making cooking a fun experience
in a few simple steps. There is a need to understand buzzwords, especially in this time of
marketing a diversifying food system. Hopefully this research will spark interest in others
to investigate the millennial market.
51
52

53

54

4/8/2016 Qualtrics Survey Software
https://az1.qualtrics.com/ControlPanel/Ajax.php?action=GetSurveyPrintPreview 1/11
Determining Millennial Food Buying Preferences Based on Product Association withBuzzwords
Default Question Block
.As a College of Agriculture, Food and Environment student, your input will represent thecollege as a whole and infer information about how you will continue to shop in the future.For my Master’s Research, I am implementing this survey to determine if "buzzwords" and trends in millennialbuyers' preferences are connected. A “buzzword” is a word or a phrase; it is fashionable at aparticular time or in particular context (Oxford, n.d.). Your participation will provide inputto develop new marketing techniques for your generation.
Throughout this survey, you will see highlighted words referring to "Food Buzzword"marketing in grocery stores.
1. What year were you born?
Before 1980
1980-1984
1985-1989
1990-1994
1995-1997
After 1997
55

4/8/2016 Qualtrics Survey Software
https://az1.qualtrics.com/ControlPanel/Ajax.php?action=GetSurveyPrintPreview 2/11
2. If you are from the US, which region have you lived in the longest?
If you are not from the US, refer to "Outside of the US."
3. What country do you identify with the most, prior to your enrollment at theUniversity of Kentucky?
4. What is your Gender?
5. What is your classication?
Midwest - IA, IL, IN, KS, MI, MN, MO, ND, NE, OH, SD, WI
Northeast - CT, DC, DE, MA, MD, ME, NH, NJ, NY, PA, RI, VT
Southeast - AL, AR, FL, GA, KY, LA, MS, NC, SC, TN, VA, WV
Southwest - AZ, NM, OK, TX
West - AK, CA, CO, HI, ID, MT, NV, OR, UT, WA, WY
Outside of the US, (If not listed, please add)
Canada
United States
Mexico
Brazil
Spain
France
Japan
Other, (If not listed, please add)
Male
Female
Other
56
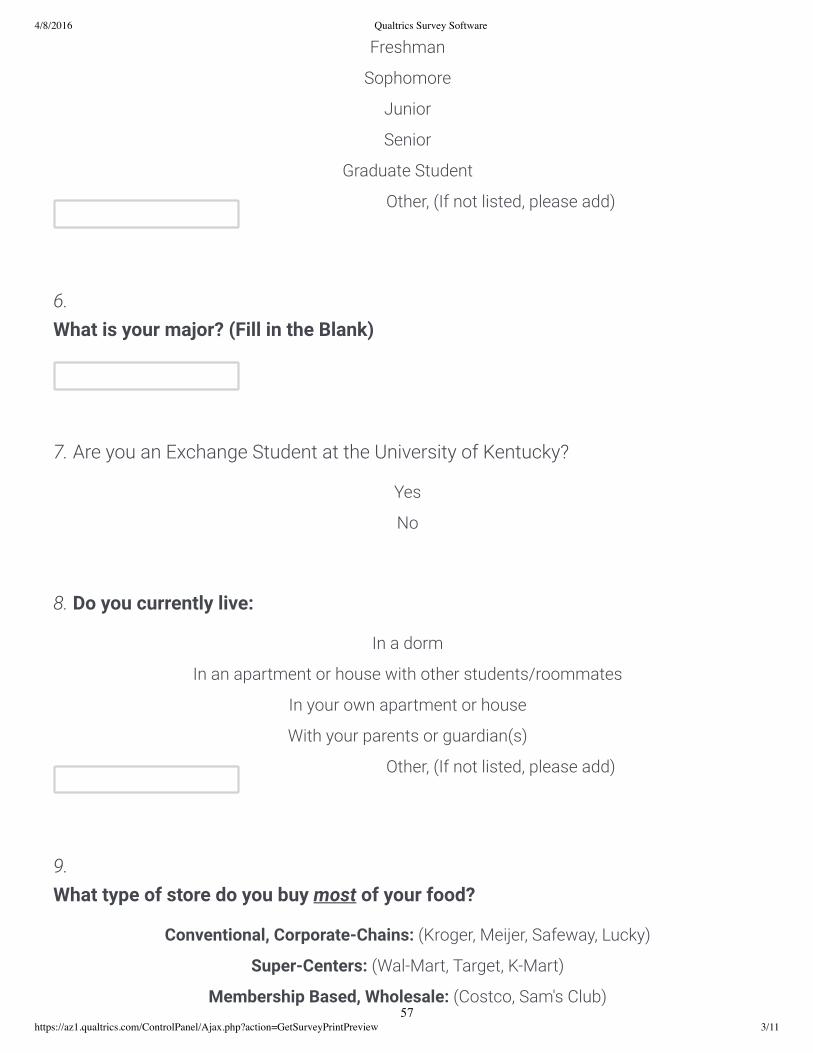
4/8/2016 Qualtrics Survey Software
https://az1.qualtrics.com/ControlPanel/Ajax.php?action=GetSurveyPrintPreview 3/11
6.What is your major? (Fill in the Blank)
7. Are you an Exchange Student at the University of Kentucky?
8. Do you currently live:
9.What type of store do you buy most of your food?
Freshman
Sophomore
Junior
Senior
Graduate Student
Other, (If not listed, please add)
Yes
No
In a dorm
In an apartment or house with other students/roommates
In your own apartment or house
With your parents or guardian(s)
Other, (If not listed, please add)
Conventional, Corporate-Chains: (Kroger, Meijer, Safeway, Lucky)
Super-Centers: (Wal-Mart, Target, K-Mart)
Membership Based, Wholesale: (Costco, Sam's Club)57

4/8/2016 Qualtrics Survey Software
https://az1.qualtrics.com/ControlPanel/Ajax.php?action=GetSurveyPrintPreview 4/11
10.When shopping at the market you selected above, what inuences yourpurchases? Use the sliding scale to record your answers for each category.
Discounted Supermarkets-Chains: (Aldi, Save-A-Lot)
Corporate Specialty-Food Chains: (Whole Foods, Trader Joe's, The Fresh Market)
Convenience Stores: (Rite-Aid, CVS, Walgreen's, Speedway, Thornton's)
Service Provided Restaurants, Cafeteria, Cafés, Fast Food: (Subway, Campus Dining, Panera,BWW's, Mad Mushroom)
Co-ops, Locally Owned: (Good Food's Market & Cafe, Farmer's Markets)
Other: (If not listed, please add)
Certied Organic
Low Fat, Gluten Free,Sugar Free, Low
Carb, 100 Calories
Locally Grown,Kentucky Proud
Products, FamilyFarm Producers
U.S. Grown
Price
Humane Production,Free Range, Cage
Free
EnvironmentalImpact, Greener
Less Important Very Important
0 1 2 3 4
58
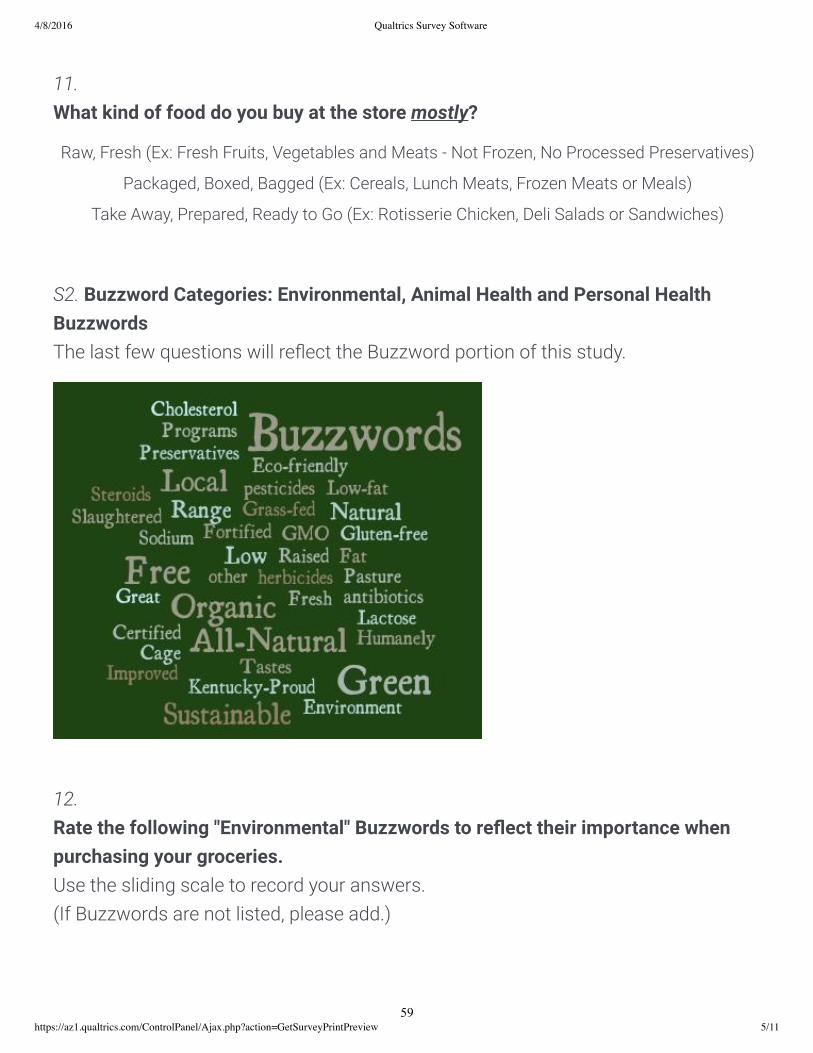
4/8/2016 Qualtrics Survey Software
https://az1.qualtrics.com/ControlPanel/Ajax.php?action=GetSurveyPrintPreview 5/11
11.What kind of food do you buy at the store mostly?
S2. Buzzword Categories: Environmental, Animal Health and Personal HealthBuzzwordsThe last few questions will reect the Buzzword portion of this study.
12.Rate the following "Environmental" Buzzwords to reect their importance whenpurchasing your groceries. Use the sliding scale to record your answers. (If Buzzwords are not listed, please add.)
Raw, Fresh (Ex: Fresh Fruits, Vegetables and Meats - Not Frozen, No Processed Preservatives)
Packaged, Boxed, Bagged (Ex: Cereals, Lunch Meats, Frozen Meats or Meals)
Take Away, Prepared, Ready to Go (Ex: Rotisserie Chicken, Deli Salads or Sandwiches)
59

4/8/2016 Qualtrics Survey Software
https://az1.qualtrics.com/ControlPanel/Ajax.php?action=GetSurveyPrintPreview 6/11
13.Rate the following "Animal Health" Buzzwords to reect their importance whenpurchasing your groceries. Use the sliding scale to record your answers. (If Buzzwords are not listed, please add.)
Eco-Friendly
Grass-Fed
No Pesticides / NoHerbicides
Green
Certied Kentucky Proud
Certied Organic
Locally Grown
Sustainably Grown
GMO Free
Other, if not listed pleaseadd.
Other, if not listed pleaseadd.
Less Important Very Important
0 1 2 3 4
Less Important Very Important
0 1 2 3 460

4/8/2016 Qualtrics Survey Software
https://az1.qualtrics.com/ControlPanel/Ajax.php?action=GetSurveyPrintPreview 7/11
14.Rate the following "Personal Health" Buzzwords to reect their importance whenpurchasing your groceries. Use the sliding scale to record your answers.
Pasture Raised
Humanely Slaughtered
No Antibiotics, Steroidsor Hormones
Free Range or Cage Free
Heritage Breeds
Certied Branded Beef(Angus, Hereford, Harris
Ranch)
Corn Finished
Grass-Fed
USDA Graded Beef
Fresh Poultry
Kosher
rBGH-free
Family Farm Raised
Naturally Raised
Other, if not listed pleaseadd.
Other, if not listed pleaseadd.
61
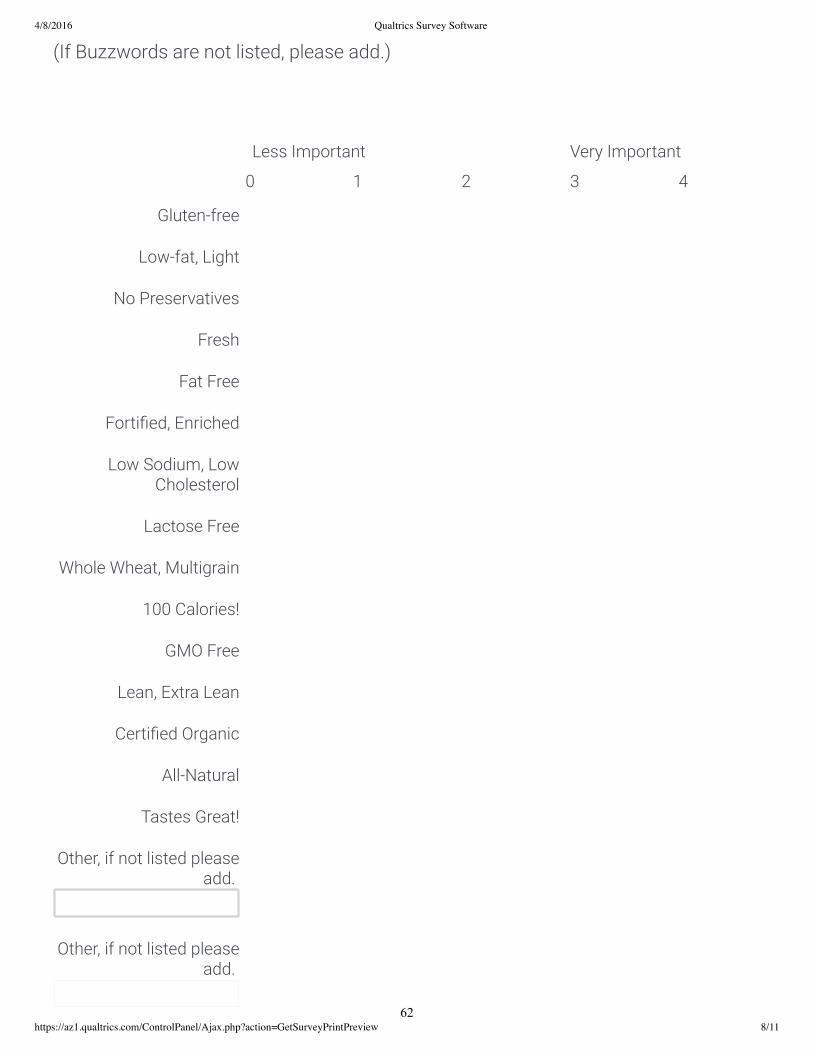
4/8/2016 Qualtrics Survey Software
https://az1.qualtrics.com/ControlPanel/Ajax.php?action=GetSurveyPrintPreview 8/11
(If Buzzwords are not listed, please add.)
Gluten-free
Low-fat, Light
No Preservatives
Fresh
Fat Free
Fortied, Enriched
Low Sodium, LowCholesterol
Lactose Free
Whole Wheat, Multigrain
100 Calories!
GMO Free
Lean, Extra Lean
Certied Organic
All-Natural
Tastes Great!
Other, if not listed pleaseadd.
Other, if not listed pleaseadd.
Less Important Very Important
0 1 2 3 4
62
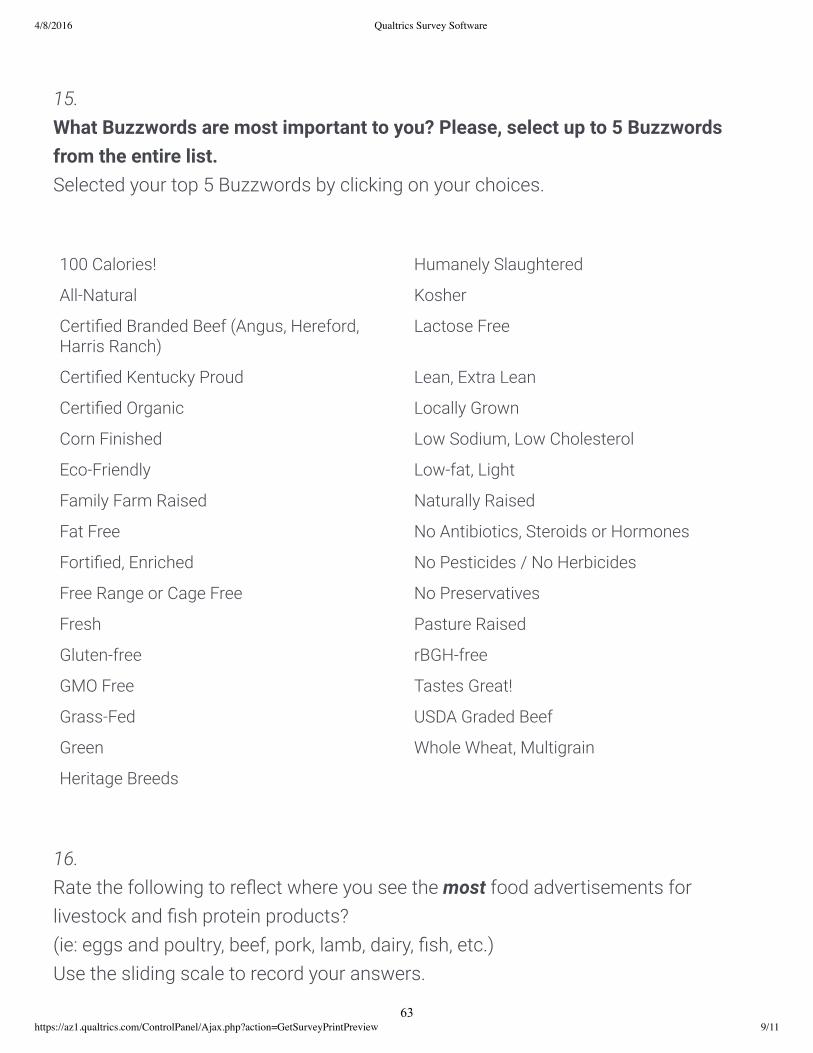
4/8/2016 Qualtrics Survey Software
https://az1.qualtrics.com/ControlPanel/Ajax.php?action=GetSurveyPrintPreview 9/11
15.What Buzzwords are most important to you? Please, select up to 5 Buzzwordsfrom the entire list.Selected your top 5 Buzzwords by clicking on your choices.
16.Rate the following to reect where you see the most food advertisements forlivestock and sh protein products? (ie: eggs and poultry, beef, pork, lamb, dairy, sh, etc.)Use the sliding scale to record your answers.
100 Calories! Humanely Slaughtered
All-Natural Kosher
Certied Branded Beef (Angus, Hereford,Harris Ranch)
Lactose Free
Certied Kentucky Proud Lean, Extra Lean
Certied Organic Locally Grown
Corn Finished Low Sodium, Low Cholesterol
Eco-Friendly Low-fat, Light
Family Farm Raised Naturally Raised
Fat Free No Antibiotics, Steroids or Hormones
Fortied, Enriched No Pesticides / No Herbicides
Free Range or Cage Free No Preservatives
Fresh Pasture Raised
Gluten-free rBGH-free
GMO Free Tastes Great!
Grass-Fed USDA Graded Beef
Green Whole Wheat, Multigrain
Heritage Breeds
63

4/8/2016 Qualtrics Survey Software
https://az1.qualtrics.com/ControlPanel/Ajax.php?action=GetSurveyPrintPreview 10/11
17.Create a (Drafted) Twitter Post:Using the fewest amount of words (140 characters), create a post to promote yourown food Buzzword preferences. (This is where you can be creative!)
EXAMPLES:
RT “USDA, Certied Black Angus steaks, on sale @Kroger. #KyProud #TastesGreat!”
Local farmers showcasing their Organic tomatoes @KYFarmersMarket inDowntown Lexington!
Social Media
E-mail / GeneralWebsites
Television
Magazines
Newspaper
Radio
Other, if not listed pleaseadd.
Less Common Very Common
0 1 2 3 4
64

4/8/2016 Qualtrics Survey Software
https://az1.qualtrics.com/ControlPanel/Ajax.php?action=GetSurveyPrintPreview 11/11
18.Would you be willing to participate in a follow-up discussion (Focus Group) on thetopic for this study?
If so, please email me directly at [email protected] to express your interest inparticipating in the Focus Group.
If not, thank you again for participating in the survey!
Have a wonderful day!
Please feel free to leave comments below. Thank you again for your time!
Block 1
65

References
Almerico, G. M. (2014). Food and identity: Food studies, cultural, and personal identity. Journal of International Business and Cultural Studies, 8, 1.
Bennett, S., Maton, K., & Kervin, L. (2008). The ‘digital natives’ debate: A critical review of the evidence. British journal of educational technology, 39(5), 775-786.
Brown, P. (2011). Teaching the Millennial Students. In Proceedings from the American Society of Business and Behavioral Sciences annual conference. Las Vegas.
Chang, H. C. (2010). A new perspective on Twitter hashtag use: Diffusion of innovation theory. Proceedings of the American Society for Information Science and Technology, 47(1), 1-4.
Cobanoglu, C., & Cobanoglu, N. (2003). The effect of incentives in web surveys: application and ethical considerations. International Journal of Market Research, 45(4), 475-488.
Cornwall, A., & Brock, K. (2005). What do buzzwords do for development policy? A critical look at ‘participation’,‘empowerment’and ‘poverty reduction’. Third world quarterly, 26(7), 1043-1060.
Creswell, J. W. (2014). Research design: Qualitative, quantitative, and mixed methods approaches. Fourth Edition.
Croke, Bridget. (2014). How to engage millennials? Appeal to 3 core values, 3 core traits [Online Article Post] Retrieved from: http://www.greenbiz.com/blog/2014/10/24/engage-millennials-and-gen-z-appealing-values-and-traits
Czaplewski, Olson and McNulty. (2014). Going Green Puts Chipotle in the Black. American Marketing Association,
Edell, J. A., & Moore, M. C. (1993). The impact and memorability of ad-induced feelings: Implication for brand equity. Brand equity and advertising. Advertising’s role in building strong brands, 195-211.
Emeagwali, N. S. (2011). Millennials: Leading the Charge for Change. Techniques: Connecting Education and Careers (J1), 86(5), 22-26.
Fromm, Jeff. (2014). What Changes Will Millennials Force Brands to Make in 2014? [Online Article Post] Retrieved from: http://adage.com/article/guest-columnists/brands-pay-heed-millennials-wield-big-power/290906/
Gilbert, L. (2000). Marketing functional foods: how to reach your target audience.
66

Gursoy, D., Maier, T. A., & Chi, C. G. (2008). Generational differences: An examination of work values and generational gaps in the hospitality workforce. International Journal of Hospitality Management, 27(3), 448-458.
Mitchell, A. A. (Ed.). (2013). Advertising exposure, memory and choice. Psychology Press.
MORRISON, M. (2011). Fast feeders serve up fresh buzzwords. Advertising Age, 82(10), 3-26.
Northup, T. (2014). Truth, lies, and packaging: How food marketing creates a false sense of health. Food Studies, 9.
Nowak, L., Thach, L., & Olsen, J. E. (2006). Wowing the millennials: creating brand equity in the wine industry. Journal of Product & Brand Management, 15(5), 316-323.
Nowak, L., Thach, L., & Olsen, J. E. (2006). Wowing the millennials: creating brand equity in the wine industry. Journal of Product & Brand Management, 15(5), 316-323.
Paquette, Moore, Claveria. (2014). How to engage millennials in customer insight and marketing [Online Article Post] Retrieved from: https://www.visioncritical.com/how-engage-millennials-customer-insight-and-marketing/
Rho, W. J. (2014). Triple Helix for social innovation: the Saemaul Undong for eradicating poverty. Journal of Contemporary Eastern Asia, 13(1), 39-55.
Rossolatos, G. (2014). A methodological framework for projecting brand equity: Putting back the imaginary into brand knowledge structures. Sign Systems Studies, 42(1), 98-136. doi:10.12697/SSS.2014.42.1.05
Ruane, L., & Wallace, E. (2015). Brand tribalism and self-expressive brands: social influences and brand outcomes. Journal of Product & Brand Management, 24(4), 333-348.
Sinek, Simon, Start with Why: How Great Leaders Inspire Everyone to Take Action, Penguin Group, 2009.
Sobal, J., & Bisogni, C. A. (2009). Constructing food choice decisions. Annals of Behavioral Medicine, 38(1), 37-46.
67

U.S. Census Bureau; American Community Survey: 2015, http://www.census.gov/newsroom/press-releases/2014/cb14-219.html>; (11 March 2014). https://www.census.gov/newsroom/press-releases/2015/cb15-113.html
Umit Kucuk, S. (2011). Push-based brand awareness: The role of product availability and in-store merchandising. The International Review of Retail, Distribution and Consumer Research, 21(3), 201-213.
Van Gorp, B. (2007). The constructionist approach to framing: Bringing culture back in. Journal of communication, 57(1), 60-78.
Weilbacher, W. M. (2003). How advertising affects consumers. Journal of Advertising Research, 43(02), 230-234.
Zaltman, Gerald. "Rethinking Market Research: Putting People Back In." Journal of Marketing Research (JMR) 34, no. 4 (November 1997).
Zhang, Y. (2015) The Impact of Brand Image on Consumer Behavior: A Literature Review. Open Journal of Business and Management, 3, 58-62.
Definition References
Buzzword. (n.d.). In Oxford English Dictionaries. Retrieved from Online Oxford Dictionary at http://www.oxforddictionaries.com/us/definition/american_english/buzzword
Handle (n.d.). In Oxford English Dictionaries. Retrived from Online Oxford Dictionary at http://www.oxforddictionaries.com/us/definition/american_english/handle
Hashtag (2008). In Merriam-Webster Dictionaries. Retrived from Online merriam- webster Dictionary at http://www.merriam-webster.com/dictionary/hashtag
68

Vita
1. Place of Birth: Ukiah, California
2. Educational Institutes:
a. Santa Rosa Junior College, 2011
b. University of Kentucky, 2013
B.S Community and Leadership Development
c. University of Kentucky, 2018 (expected)
M.S Community and Leadership Development
3. Victoria Nicole Hamilton
69