determination of the thermal neutron flux in the...
TRANSCRIPT
BUDAPEST UNIVERSITY OF TECHNOLOGY AND ECONOMICS
Institute of Nuclear Techniques (BME NTI)
DETERMINATION OF THE THERMAL NEUTRON FLUX IN
THE CORE OF THE REACTOR
Measurement guide
Authors
Máté Szieberth
Éva M. Zsolnay
Approved by
Szabolcs Czifrus

Determination of the thermal neutron flux in the core of the reactor
HUVINETT 2012 2
Contents
1. Introduction .................................................................................................................................. 3
2. Theory .......................................................................................................................................... 3
2.1. Neutron spectrum and neutron flux distribution in thermal reactors .................................... 3
2.2. Determination of the thermal neutron flux by activation method ......................................... 6
2.2.1. Principle of the method .................................................................................................. 6
2.2.2. Determination of the thermal neutron flux from the activity of the irradiated detector 7
2.2.3. Determination of the absolute value of thermal neutron flux ........................................ 9
2.2.4. Determination of the relative distribution of thermal neutron flux .............................. 12
3. Objective of the measurement .................................................................................................... 14
4. Equipment and materials needed ............................................................................................... 14
4.1. Description of the apparatus to measure the wire activity .................................................. 14
5. Procedure ................................................................................................................................... 15
5.1. Measurement of the relative distribution of the thermal neutron flux ................................ 15
5.2. Measurement to determine the absolute value of thermal neutron flux .............................. 16
6. Evaluation of measurement data ................................................................................................ 16
6.1. Evaluation of the relative distribution of the thermal neutron flux ..................................... 16
6.1.1. Error analysis of the relative flux measurement .......................................................... 16
6.2. Error analysis of the absolute value of the thermal neutron flux ........................................ 17
6.2.1. Estimation of statistical error ....................................................................................... 17
6.2.2. Systematic error ........................................................................................................... 18
7. Knowledge check ....................................................................................................................... 18
8. References .................................................................................................................................. 19

Determination of the thermal neutron flux in the core of the reactor
HUVINETT 2012 3
1. INTRODUCTION
The nuclei of certain naturally occurring isotopes can be transformed into radioactive ones by
exposing the material to neutron radiation, and the activity of the radioactive products produced can
be measured by means of appropriate counter system. In addition to the factors determined by the
conditions of measurement, this activity is affected only by the neutron flux in the point of
irradiation and by the activation cross section of the target material which in the present case, is the
neutron detector. Provided the activation cross section is known, the neutron flux can be determined
by measurement of the activity of the sample irradiated. As the activation cross section of a number
of materials depends on the neutron energy in different way this method will yield information also
on the energy distribution of neutrons.
In the present measurement the thermal neutron flux will be determined using activation
detectors.
2. THEORY
2.1. Neutron spectrum and neutron flux distribution in thermal reactors
Fast neutrons, the energy distribution of which can be seen in Fig. 1., are produced in fission
reactions. In thermal nuclear reactors, the fast neutrons gradually slow down due primarily to the
collisions with the atomic nuclei of the moderator, and a neutron spectrum schematically depicted
in Fig. 2. is formed. Let the density of the neutrons with energies between E and E+dE near a point
r of the detector be n(r,E)dE. Thus, the definition of neutron flux is as follows:
r E v n r E, , , (1)
where v is the velocity of a neutron with energy E. As far as this measurement is concerned, the
most important part of the neutron spectrum is the thermal spectrum, which can approximately be
described by the Maxwell distribution:
kT
Eexp
)kT(
EE,r
2 , E Eth
(2)
where Eth is the more or less arbitrarily chosen upper limit of the thermal region (usually 0.625 eV),
k is the Boltzmann constant, and T is a quantity with dimension of temperature characteristic of the
thermal neutron spectrum.1
By thermal neutron flux we mean the following integral:
th
E
r r E d E
th
,
0
, (3)
which is often written in the following form:
1 It is usually called neutron temperature, which is slightly higher than the absolute temperature of the reactor.

Determination of the thermal neutron flux in the core of the reactor
HUVINETT 2012 4
th thv . nr r , (3a)
where nth is the density of the thermal neutrons around point r, and v is the average velocity of the
thermal neutrons (see below).
H a s a d á s i s p e k tr u m
0
0 .0 5
0 .1
0 .1 5
0 .2
0 .2 5
0 .3
0 .3 5
0 .4
0 .4 5
0 .5
0 .0 0 0 0 0 0 1 0 .0 0 0 0 0 1 0 .0 0 0 0 1 0 .0 0 0 1 0 .0 0 1 0 .0 1 0 .1 1 1 0
E ( M e V )
sp
ek
tru
m (ö
nk
én
ye
s e
gy
sé
g)
Figure 1. The energy spectrum of the fission neutrons
r e a k to r s p e k tr u m
0 .0 1
0 .1
1
1 0
1 .0 0 E - 0 9 1 .0 0 E - 0 8 1 .0 0 E - 0 7 1 .0 0 E - 0 6 1 .0 0 E - 0 5 1 .0 0 E - 0 4 1 .0 0 E - 0 3 1 .0 0 E - 0 2 1 .0 0 E - 0 1 1 .0 0 E + 0 0 1 .0 0 E + 0 1
E ( M e V )
ne
utro
nflu
xu
s
(ö
nk
én
ye
s e
gy
sé
g)
t e rm ik u s n e u t ro n o k
(M a x w e l l s p e k t ru m )
1 / E s p e k t ru m
re z o n a n c iá k
h a t á s a
h a s a d á s i n e u t ro n o k
Figure 2. The schematic energy spectrum of a thermal reactor
In thermal reactors, the spatial change of the neutron flux is significant. In case of a uniform
bare (without reflector) slab reactor core, the spatial distribution of the thermal neutron flux,
according to the reactor theory, is given by the following relationship [1]:
neu
tr
on
flu
x
(arb
it
rary
un
it)
1/E spectrum fission neutrons
thermal neutrons
resonances
neu
tr
on
flux
(arb
itr
ary
unit
)
Determination of the thermal neutron flux in the core of the reactor
HUVINETT 2012 5
)cos()cos()cos()0,00()(thth
c
πz
b
πy
a
πx,Φx,y,zΦ ,
(4)
where δaa 2 , δbb 2 , δcc 2 ,
a , b , c – actual physical dimensions of the core,
δ – extrapolation length.
Accordingly, the distribution of neutron flux along axis z at a given place x0, y0 can be
written:
)()cos()(0000th
zΦc
πzΦ,z,yxΦ , (5)
where
)cos()cos()0,00(00
th0
b
πy
a
πx,ΦΦ .
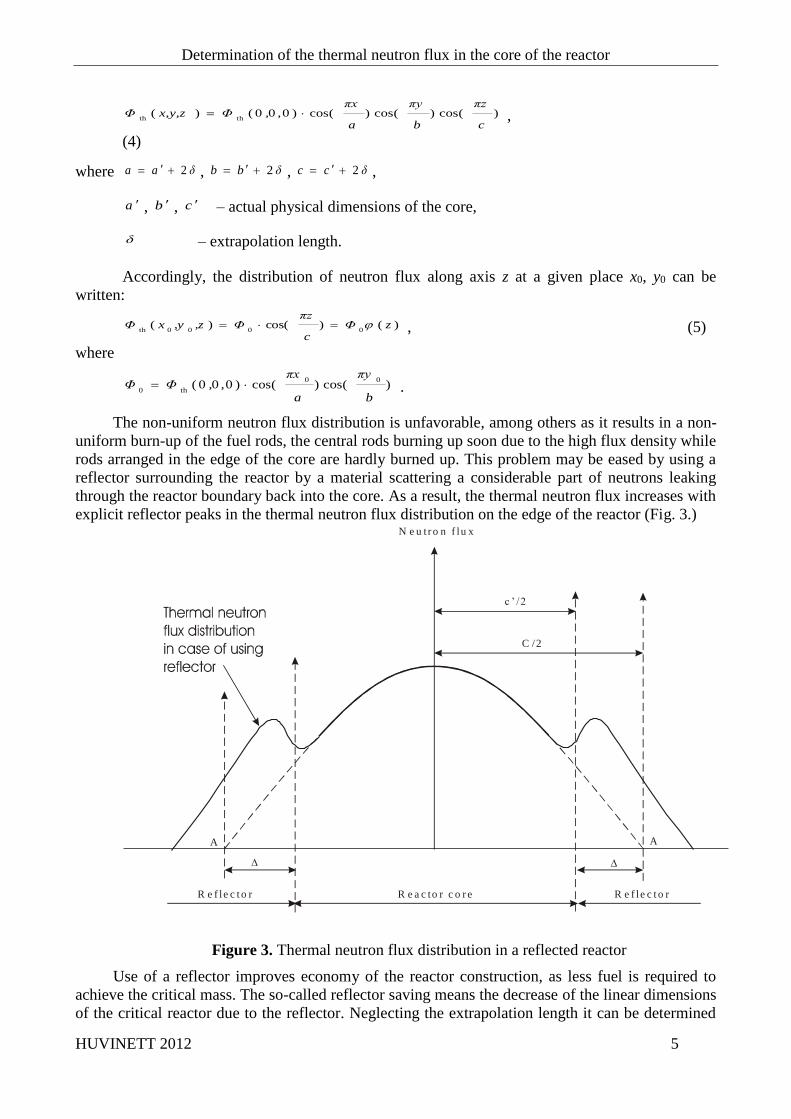
The non-uniform neutron flux distribution is unfavorable, among others as it results in a non-
uniform burn-up of the fuel rods, the central rods burning up soon due to the high flux density while
rods arranged in the edge of the core are hardly burned up. This problem may be eased by using a
reflector surrounding the reactor by a material scattering a considerable part of neutrons leaking
through the reactor boundary back into the core. As a result, the thermal neutron flux increases with
explicit reflector peaks in the thermal neutron flux distribution on the edge of the reactor (Fig. 3.) N e u tr o n f lu x
R e a c to r c o r e R e f le c t o rR e f le c t o r
AA
c ’ /2
C /2
Figure 3. Thermal neutron flux distribution in a reflected reactor
Use of a reflector improves economy of the reactor construction, as less fuel is required to
achieve the critical mass. The so-called reflector saving means the decrease of the linear dimensions
of the critical reactor due to the reflector. Neglecting the extrapolation length it can be determined
Determination of the thermal neutron flux in the core of the reactor
HUVINETT 2012 6
at a good approximation by fitting a function (in the present case a cosine function) to the neutron
flux distribution developing in the core of the reactor and extrapolating the curve to the reflector
area. The extrapolated boundary of the bare critical reactor equivalent to the reflected reactor i.e.
which would produce the same neutron flux distribution within the core as does the reflected reactor
would be at the zero value of this curve (i.e. at zero flux (Fig.3.)).
Hence, reflector saving is understood as the difference between the linear dimensions of the
equivalent bare critical reactor and the reflected critical reactor:
2
cC , (6)
where C – distance between the zero value points of the cosine curve fitted to the neutron flux
distribution inside the core,
c – actual physical dimension of the core.
2.2. Determination of the thermal neutron flux by activation method
2.2.1. Principle of the method
Irradiating an activation detector in thermal neutron flux the reaction rate during activation is
expressed by
TactthNσΦR , (7)
where thΦ – thermal neutron flux [m-2s-1],
actσ – microscopic activation cross section [m2],
TN – number of target atoms in the sample.
The rate of change of radioactive atoms during irradiation is the difference between the rates of
production and decay:
)(d
)(d
TactthtλNNσΦ
t
tN , (8)
where – decay constant of the radioactive nuclei produced [s-1],
t – time [s].
Be 0)0( N at the start of irradiation. Then the solution of the differential equation (8)
using (7):
)1()(t
eR
tN
. (9)
The activity of the detector at the end of irradiation enduring time T:
)1()()(T
eRTNTA
. (10)
The activity at time after finishing the irradiation:
eeRτTA
T)1(),( . (11)
These relationships will, however, be accurate only if each atom of the sample is irradiated by
the same neutron flux. In case of a foil of non-negligible thickness, the average neutron flux will be
lower inside it ( thΦ ) than on the surface (
0
thΦ ), due to neutron absorption. Their ratio is the self-
shielding factor:
Determination of the thermal neutron flux in the core of the reactor
HUVINETT 2012 7
0
th
th
th
Φ
ΦG
. (12)
Finally, the time function of the detector activity is obtained by using the above formulae:
eeNGΦτTA
T)1(),(
Tactthth . (13)
2.2.2. Determination of the thermal neutron flux from the activity of the irradiated detector
In the thermal neutron energy range, the velocity distribution of neutrons follows the Maxwell-
Boltzmann distribution according to which the most probable velocity of the neutrons is:
m
kTv
2
0 , (14)
where k – Boltzmann constant,
T – neutron temperature [K],
m – mass of neutron [g].
At room temperature (20 C = 293 K) v0 = 2200 m/s which corresponds to an energy of
0.025 eV. Again, according to the Maxwell-Boltzmann distribution, the average velocity of
neutrons:
0
π
2vv . (15)
The reaction rate defined by (7) describes the activation process for irradiation in a
monoenergetic neutron flux. As the thermal neutron velocities are different and the cross sections
are dependent on the neutron velocity v, the activation process would be correctly described by:
vNvσvΦR d)()(Tact
0
. (16)
Generally, this would be seriously complicate procedure and, therefore, the integral above is
substituted by the product in (7) where the values thΦ and act
σ will be determined in concordance
with each other in such a way that their product yields the actual reaction rate according to (16). For
instance, it is customary to define neutron flux 00thvnΦ , where v0 is the most probable velocity
of neutrons according to (14), n is the total density of thermal neutrons. In this case, the reaction
rate for a 1/v detector ( ~ 1/v) and non-distorted Maxwell-Boltzmann spectrum will be obtained
from:
Tact 0,0NnvR , (17)
where act 0, – activation cross section belonging to the most probable velocity of Maxwell-
Boltzmann distribution.
Defining the thermal neutron flux as vnΦ th (where v is the average velocity of thermal
neutrons according to (15)), involves a cross section act ,v which, in case of a cross section ‘1/v’
and a neutron temperature Tn is given by:
n
0
act ,0nact ,
2)(
T
TT
v
(18)
and T0 = 293 K.
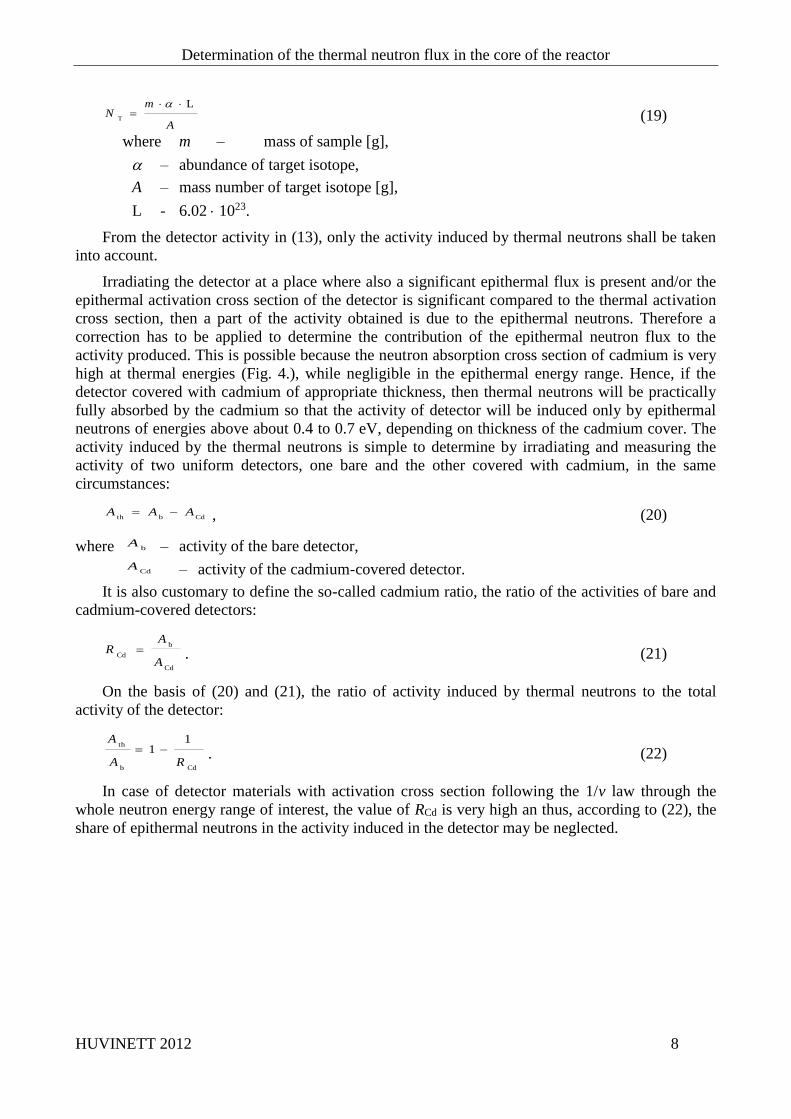
The number of target nuclei NT :
Determination of the thermal neutron flux in the core of the reactor
HUVINETT 2012 8
A
mN
L
T
(19)
where m – mass of sample [g],
– abundance of target isotope,
A – mass number of target isotope [g],
L - 6.02 1023.
From the detector activity in (13), only the activity induced by thermal neutrons shall be taken
into account.
Irradiating the detector at a place where also a significant epithermal flux is present and/or the
epithermal activation cross section of the detector is significant compared to the thermal activation
cross section, then a part of the activity obtained is due to the epithermal neutrons. Therefore a
correction has to be applied to determine the contribution of the epithermal neutron flux to the
activity produced. This is possible because the neutron absorption cross section of cadmium is very
high at thermal energies (Fig. 4.), while negligible in the epithermal energy range. Hence, if the
detector covered with cadmium of appropriate thickness, then thermal neutrons will be practically
fully absorbed by the cadmium so that the activity of detector will be induced only by epithermal
neutrons of energies above about 0.4 to 0.7 eV, depending on thickness of the cadmium cover. The
activity induced by the thermal neutrons is simple to determine by irradiating and measuring the
activity of two uniform detectors, one bare and the other covered with cadmium, in the same
circumstances:
CdbthAAA , (20)
where bA – activity of the bare detector,
CdA – activity of the cadmium-covered detector.
It is also customary to define the so-called cadmium ratio, the ratio of the activities of bare and
cadmium-covered detectors:
Cd
b
Cd
A
AR . (21)
On the basis of (20) and (21), the ratio of activity induced by thermal neutrons to the total
activity of the detector:
Cdb
th1
1RA
A . (22)
In case of detector materials with activation cross section following the 1/v law through the
whole neutron energy range of interest, the value of RCd is very high an thus, according to (22), the
share of epithermal neutrons in the activity induced in the detector may be neglected.

Determination of the thermal neutron flux in the core of the reactor
HUVINETT 2012 9
1 .0 0 E - 0 2
1 .0 0 E - 0 1
1 .0 0 E + 0 0
1 .0 0 E + 0 1
1 .0 0 E + 0 2
1 .0 0 E + 0 3
1 .0 0 E + 0 4
1 .0 0 E + 0 5
1 .0 0 E - 0 2 1 .0 0 E - 0 1 1 .0 0 E + 0 0 1 .0 0 E + 0 1 1 .0 0 E + 0 2 1 .0 0 E + 0 3
E ( e V )
(n
, ) h
atá
sk
er
es
ztm
ets
ze
t (b
arn
)
D y - 1 6 4
C d - 1 1 3
A u - 1 9 7
Figure 4. Total microscopic cross section of Dy, Au and Cd vs. neutron energy
Using a bare detector and a cadmium covered detector of identical masses, the thermal neutron
flux is calculated from relationships (13), (18), (19) and (20) as follows:
Φth =1
NTσ
v , act (T n)Gth
⋅eλ τ
1− e− λT [Ab(τ )− ACd (τ )]
. (23)
2.2.3. Determination of the absolute value of thermal neutron flux
The following series of reactions will take place in gold irradiated by neutrons:
A u1 9 7
7 9A u
1 9 7
7 9
( n , A u
7 9
1 9 8
7 9
( n , A u
7 97 9
( n , A u
7 9
2 0 0
H g1 9 8
8 0H g
1 9 9 m
8 0
H g1 9 9
8 0
H g2 0 0
8 0
( ,
( ,
( ,
T = 6 4 .6 8 h1 / 2
T = 3 .1 4 d1 /2
T = 4 8 m in1 /2
T = 4 2 m in1 /2
(
Of this multi-step reaction series, actually it is sufficient to take the first one into consideration
because the activation of 198Au by neutron capture can be neglected because of the experimental
conditions (th, act, irradiation time etc., see later).
In the range of thermal neutron energies, the activation cross section of 197Au follows the law
Determination of the thermal neutron flux in the core of the reactor
HUVINETT 2012 10
1/v but it has a number of resonance peaks in the resonance region (see Fig. 4.) stressing the role of
cadmium correction according to (19).
The absolute value of the thermal neutron flux can be determined by gold activation. The
absorption cross section of the 197Au isotope is also depicted in Fig. 4. The following reaction series
takes place in gold irradiated by neutrons:
7 9
1 9 7
7 9
1 9 8 6 4 6 8
8 0
1 9 8A u A u H g
n ó ra( , ) , ( , )
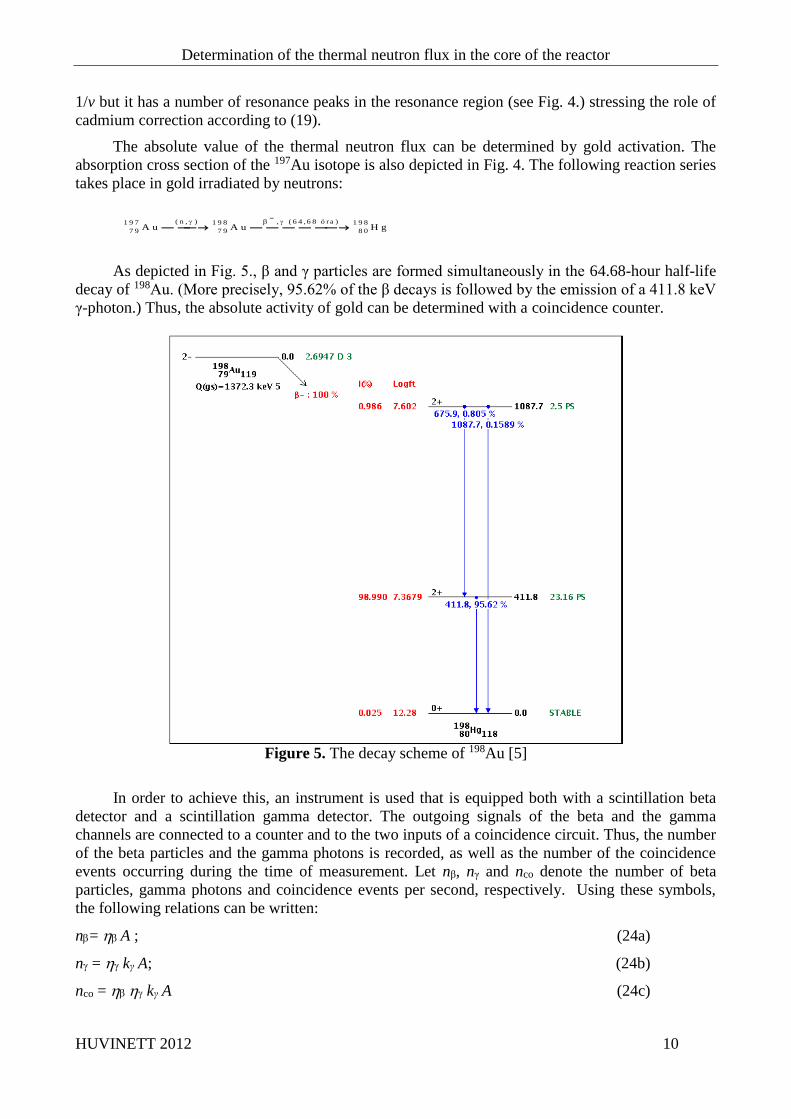
As depicted in Fig. 5., β and γ particles are formed simultaneously in the 64.68-hour half-life
decay of 198Au. (More precisely, 95.62% of the β decays is followed by the emission of a 411.8 keV
γ-photon.) Thus, the absolute activity of gold can be determined with a coincidence counter.
Figure 5. The decay scheme of 198Au [5]
In order to achieve this, an instrument is used that is equipped both with a scintillation beta
detector and a scintillation gamma detector. The outgoing signals of the beta and the gamma
channels are connected to a counter and to the two inputs of a coincidence circuit. Thus, the number
of the beta particles and the gamma photons is recorded, as well as the number of the coincidence
events occurring during the time of measurement. Let nβ, nγ and nco denote the number of beta
particles, gamma photons and coincidence events per second, respectively. Using these symbols,
the following relations can be written:
n= A ; (24a)
n = kγ A; (24b)
nco = kγ A (24c)
Determination of the thermal neutron flux in the core of the reactor
HUVINETT 2012 11
where ηβ and ηγ are the efficiency of the beta and the gamma detectors, kγ is the frequency of the γ-
line, and A is the number of decays per second in the foil, i.e. the activity of the sample. The
following expression can be derived:
A (Bq) = co
γβ.
n
nn
(25)
It can be seen that the activity of the sample can be obtained without knowing the efficiency
values.
The measuring instrument is composed of a beta and a gamma scintillation detector, two
single channel analyzers (differential discriminators), three counters and a coincidence circuit. The
signals from the detector arrive in the single channel analyzers, with the aid of which the required
range can be selected both from the beta and the gamma spectra. (This is important for reducing the
background.) The coincidence circuit, also called the AND gate, has (at least) two inputs and one
output. A pulse only appears on the output if signals arrive at the inputs simultaneously. Of course,
the time difference of the temporal coincidence of the signals has to be specified: signals arriving at
the coincidence counter with a time difference smaller than a given time interval τ are detected as
simultaneous; τ is called the resolving time of the instrument. Two of the three counters are
connected directly to the output of the single channel analyzer and count nγ and nβ, while the third
one counts nco. The counters are synchronized so that they can be turned on simultaneously and
count for the same amount of time.
During the measurement, the fact that the beta detector is to some extent also sensitive to
gamma radiation has to be taken into consideration. This is the so-called gamma sensitivity of the
beta detector, which can be determined by placing a beta absorber (a plastic foil) on the side of the
sample that faces the beta detector. The counting rate n in the β channel obtained in this way is the
gamma sensitivity of the beta detector.
Another correction has to be applied because of random coincidences. The number nrnd of the
random coincidences per unit time is:
nrnd = 2 n n (26)
where τ is the unlock time of the coincidence instrument, while nβ and nγ are the counting rates in
the beta and the gamma channels. Accordingly, the activity of the foil is:
A = co
n
nn
nnn
hnnn
coγ,β,rndko
γγβγβ))((
(27)
where hγ is the counting rate of the gamma background (cps), nβγ is the counting rate measured in
the beta branch when applying the beta absorber (this includes the value of the beta background hβ
as well), n,,co is the coincidence counting rate when applying the absorber, while the primed
quantities are the corrected beta, gamma and coincidence counting rates, respectively.
In the case of the usually applied ‘AND’ type coincidence circuits, resolving time τ is the sum of
the duration of the signals on the input of the coincidence circuit. Since the signals, which are 0.5 μs
long standard logic pulses (TTL), arrive at the inputs from the single channel analyzers, resolving
time can be considered 0.5 μs. Based on expressions (24c) and (25), it can be easily seen that if the
condition
were met, the number of random coincidences would be equal to that of true coincidences. In our
case, we would need a 0.51 MBq activity source for this to be true. Since the activity of the source
Determination of the thermal neutron flux in the core of the reactor
HUVINETT 2012 12
we use is lower than that by several orders of magnitude, nrnd can in most practical cases be
neglected.
In the range of thermal neutron energies, the activation cross section of 197Au follows the
law 1/v, but it has a number of resonance peaks in the resonance region (see Fig. 6.). The highest
resonance occurs at 4.47 eV, where σc = 9890 barn. Therefore, cadmium correction according to
(20) plays an important role here. Thus, the activity of an irradiated foil has to be determined both
with and without a Cd cover.
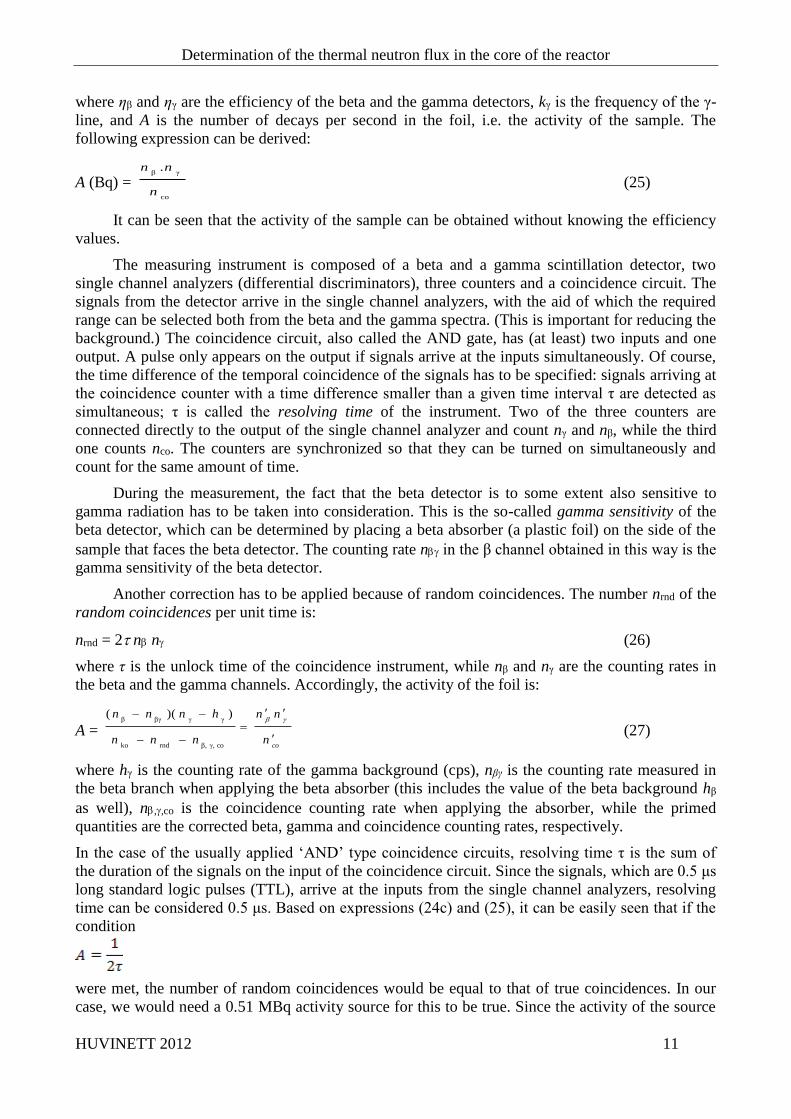
Table 1. summarizes the measurements to be performed in order to determine the absolute
value of the thermal neutron flux.
Table 1. The measurements to be performed in order to determine the absolute value of the thermal
neutron flux using the coincidence method
without β-shield with β-shield
β γ coincidence β γ coincidence
bare foil nβ nγ nco nβγ nβγ,co
Cd-claded
foil nβ nγ nco nβγ nβγ,co
no foil hγ
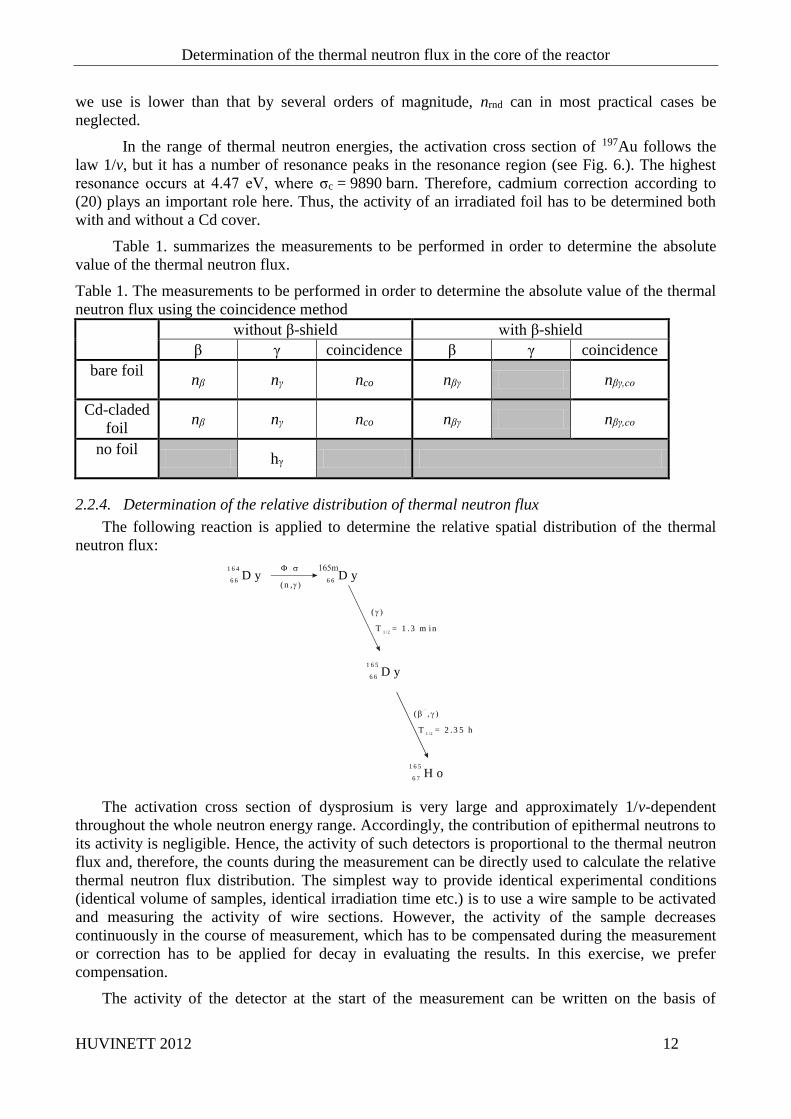
2.2.4. Determination of the relative distribution of thermal neutron flux
The following reaction is applied to determine the relative spatial distribution of the thermal
neutron flux:
1 6 4
D y6 6
( n , 6 6
D y1 6 5
6 6
H o1 6 5
6 7
(
T = 1 .3 m in1 / 2
T = 2 .3 5 h1 /2
(
D y
The activation cross section of dysprosium is very large and approximately 1/v-dependent
throughout the whole neutron energy range. Accordingly, the contribution of epithermal neutrons to
its activity is negligible. Hence, the activity of such detectors is proportional to the thermal neutron
flux and, therefore, the counts during the measurement can be directly used to calculate the relative
thermal neutron flux distribution. The simplest way to provide identical experimental conditions
(identical volume of samples, identical irradiation time etc.) is to use a wire sample to be activated
and measuring the activity of wire sections. However, the activity of the sample decreases
continuously in the course of measurement, which has to be compensated during the measurement
or correction has to be applied for decay in evaluating the results. In this exercise, we prefer
compensation.
The activity of the detector at the start of the measurement can be written on the basis of
Determination of the thermal neutron flux in the core of the reactor
HUVINETT 2012 13
formula (13):
eeNGzΦτzA
T)1()(),(
Tactthth . (28)
Provided the activity of the detector is not reasonably large compared with the dead time of the
counting apparatus, the measured intensity I() will be proportional to the activity of the sample:
)()( τηAτI (29)
where – efficiency of counting apparatus.
The measurement delivers the total number of counts during a finite measuring period tm:
m
d)(
t
ttIB
(30)
or
m
0
d)(
t
tteτηAB
(31)
Hence:
)1)(( m
teτηA
B
. (32)
The activity of the sample:
mt
e1
B λ)τ(A
. (33)
If the measuring period is short ( tm 0), then B A () tm , and A() B / ( tm). The
number of counts during the measurement can be determined using formulas (28) and (33):
ee
eNGzΦτzB
t
T
1)1(
)(),( mTactth
th . (34)
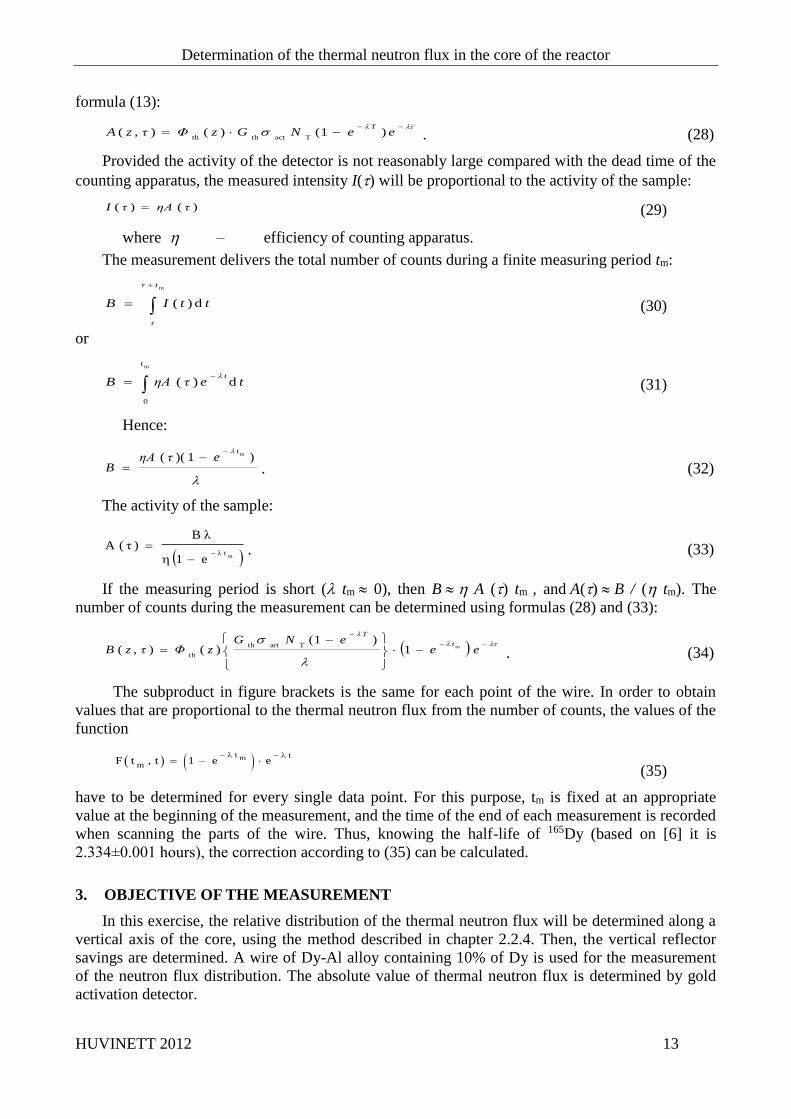
The subproduct in figure brackets is the same for each point of the wire. In order to obtain
values that are proportional to the thermal neutron flux from the number of counts, the values of the
function
F t t e em
t tm,
1
(35)
have to be determined for every single data point. For this purpose, tm is fixed at an appropriate
value at the beginning of the measurement, and the time of the end of each measurement is recorded
when scanning the parts of the wire. Thus, knowing the half-life of 165Dy (based on [6] it is
2.334±0.001 hours), the correction according to (35) can be calculated.
3. OBJECTIVE OF THE MEASUREMENT
In this exercise, the relative distribution of the thermal neutron flux will be determined along a
vertical axis of the core, using the method described in chapter 2.2.4. Then, the vertical reflector
savings are determined. A wire of Dy-Al alloy containing 10% of Dy is used for the measurement
of the neutron flux distribution. The absolute value of thermal neutron flux is determined by gold
activation detector.

Determination of the thermal neutron flux in the core of the reactor
HUVINETT 2012 14
4. EQUIPMENT AND MATERIALS NEEDED
Reactor + pneumatic rabbit system for sample delivery
Plexiglass rod to hold the wire
Coincidence instrument
Wire activity measuring apparatus (controlled by a PC)
Wire of Dy-Al alloy
Foil of Dy-Al alloy
Gold foils
Al and Cd capsules for covering the foils
Radiation protection equipment (rubber gloves, pincers etc.)
4.1. Description of the apparatus to measure the wire activity
A wire of Dy-Al alloy is used to determine the spatial distribution of the thermal neutron flux. The
activity as a function of position along the Dy-Al wire is determined with a so-called wire activity
measuring apparatus. Since the wire is positioned along the axial coordinate z, instead of writing
B(r,t) in expression (34), we now write B(z,t). The wire activity measuring apparatus consists of the
following parts:
tooth-racked mounting rail in which the wire is fastened
lead tower through which the wire holding rail can be pushed
scintillation beta measuring head fitted into the lead tower, and a copper collimator below it
so that it ‘sees’ only a few mm part of the wire
stepper motor which makes forwarding the rail below the detector possible
stepper motor control unit connected to a computer via a USB port
digital spectrum analyser (Canberra DSA 1000) for processing the signals of the beta
measuring head, also connected to the computer
computer with data acquisition software (GenieMot)
Determination of the thermal neutron flux in the core of the reactor
HUVINETT 2012 15
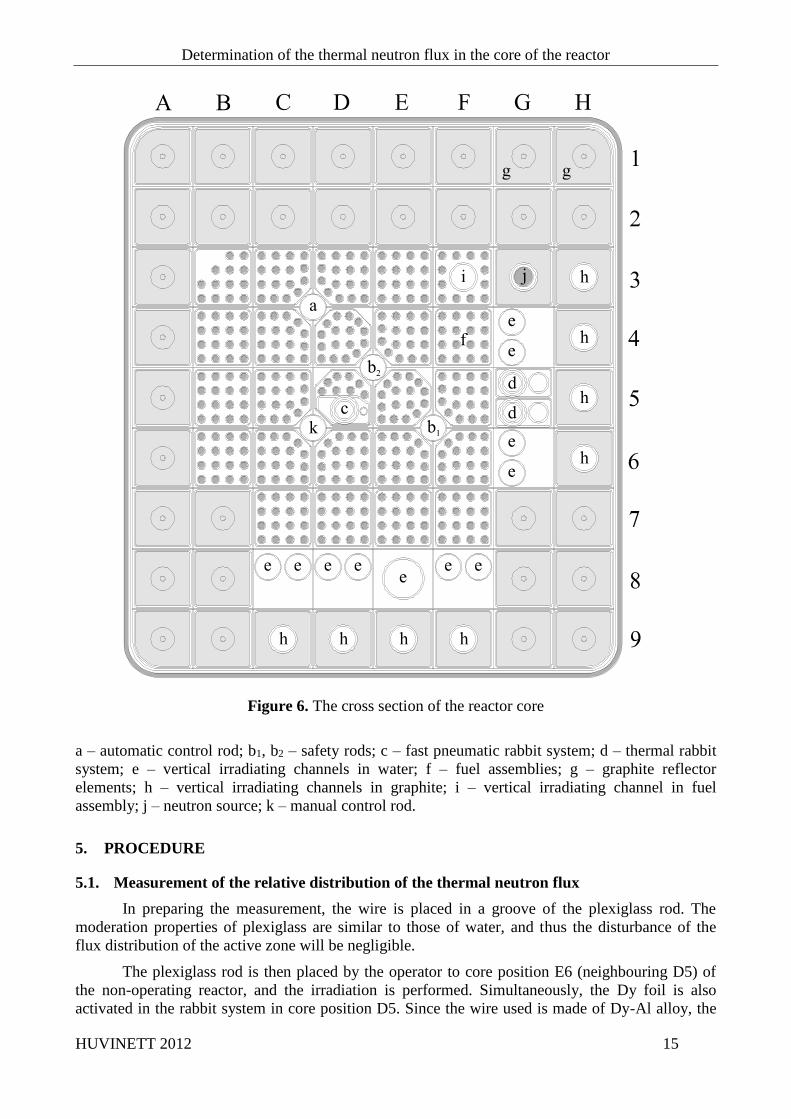
Figure 6. The cross section of the reactor core
a – automatic control rod; b1, b2 – safety rods; c – fast pneumatic rabbit system; d – thermal rabbit
system; e – vertical irradiating channels in water; f – fuel assemblies; g – graphite reflector
elements; h – vertical irradiating channels in graphite; i – vertical irradiating channel in fuel
assembly; j – neutron source; k – manual control rod.
5. PROCEDURE
5.1. Measurement of the relative distribution of the thermal neutron flux
In preparing the measurement, the wire is placed in a groove of the plexiglass rod. The
moderation properties of plexiglass are similar to those of water, and thus the disturbance of the
flux distribution of the active zone will be negligible.
The plexiglass rod is then placed by the operator to core position E6 (neighbouring D5) of
the non-operating reactor, and the irradiation is performed. Simultaneously, the Dy foil is also
activated in the rabbit system in core position D5. Since the wire used is made of Dy-Al alloy, the
Determination of the thermal neutron flux in the core of the reactor
HUVINETT 2012 16
samples have to rest for at least 20 minutes after irradiation to permit the interfering activity of Al to
decay. (The half-life of the 28Al is 2.24 minutes.) Then the wire is removed from the plexiglass rod
and placed into the wire activity measuring apparatus. In the measurement, β- particles from the
decay of 165Dy are detected.
First the Dy foils irradiated with and without a cadmium cover are measured with the aid of
the beta measuring head. By comparing the number of counts, it can be verified that the assumption
that only a negligibly small part of the activity originates from the reactions induced by the
epithermal neutrons is true. Thus, the activity distribution of the wire irradiated without the cover
will indeed yield the distribution of the thermal flux.
Subsequently, the holding rail has to be pushed into the starting position and the
measurement points and measurement time have to be set on the computer. The spectrum range in
which the numbers of counts are summarized has to be set as well. At the end of the measurement
an ASCII file is obtained, the rows of which contain the position, the number of counts acquired
during the time of measurement in the pre-selected spectrum range, and the time of completion of
the measurement in the given position.
5.2. Measurement to determine the absolute value of thermal neutron flux
In the irradiation channel in core position D5 two gold foils of identical size and mass – one
bare while the other in cadmium cover – are irradiated. The foils in a polyethylene sample holder
are forwarded to the operating reactor by means of the pneumatic rabbit system joining the
irradiation channel. Record the time of the end of irradiation and measure time t elapsed until the
measurement of the activity of the individual foils. Take the activity of the sample corresponding to
the Abare and ACd values in (20) with the coincidence counter.
6. EVALUATION OF MEASUREMENT DATA
6.1. Evaluation of the relative distribution of the thermal neutron flux
According to expression (35), the decay time correction has to be performed on the numbers
of counts measured in the individual points. The position dependence of the corrected data points
obtained in this way is proportional to that of the thermal neutron flux distribution (cf. (34)). Plot
the data points, then determine the axial reflector saving using formula (6) by fitting a cosine
function to the central section of the measured curve according to formula (5).2
6.1.1. Error analysis of the relative flux measurement
It is known from probability theory that the distribution of the number of counts follows the
Poisson distribution. Consequently, the variance of the individual numbers of counts is equivalent
to their expected value. The latter is approximated by the numbers of counts, so the following
expression is usually true:
D B M B Bi i i
2
. (36)
This approximative formula is valid with the same condition as the measurement method
itself: dead time and the effects of the background can both be neglected. The simplest way of
correcting dead time is providing the time of measurement tm as live time. However, it is important
to make sure that dead time does not exceed a few percent even in the case of the highest numbers
of counts.
2 Usually a suitable curve fitting software is needed to perform this task.
Determination of the thermal neutron flux in the core of the reactor
HUVINETT 2012 17
6.2. Error analysis of the absolute value of the thermal neutron flux
Error analysis of the absolute value of the thermal neutron flux is considerably more difficult
than that of the relative distribution. First of all, two types of errors need to be differentiated
between: the statistical error and the systematic error.3
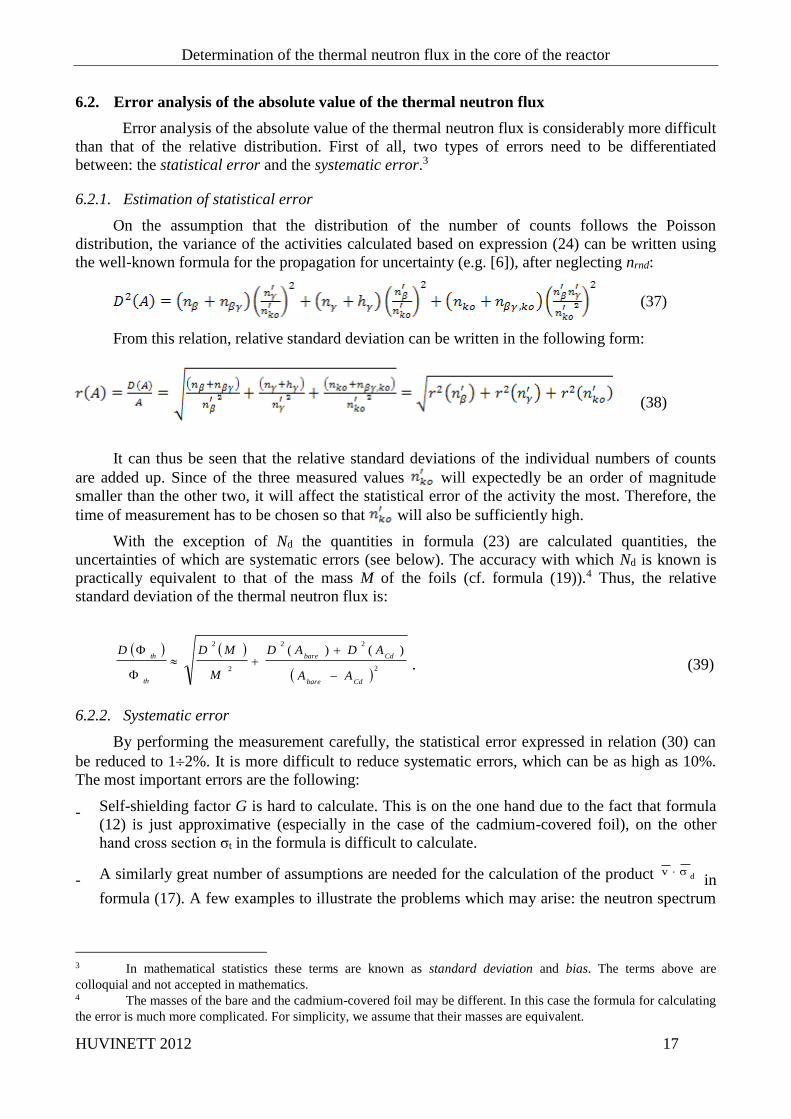
6.2.1. Estimation of statistical error
On the assumption that the distribution of the number of counts follows the Poisson
distribution, the variance of the activities calculated based on expression (24) can be written using
the well-known formula for the propagation for uncertainty (e.g. [6]), after neglecting nrnd:
(37)
From this relation, relative standard deviation can be written in the following form:
(38)
It can thus be seen that the relative standard deviations of the individual numbers of counts
are added up. Since of the three measured values will expectedly be an order of magnitude
smaller than the other two, it will affect the statistical error of the activity the most. Therefore, the
time of measurement has to be chosen so that will also be sufficiently high.
With the exception of Nd the quantities in formula (23) are calculated quantities, the
uncertainties of which are systematic errors (see below). The accuracy with which Nd is known is
practically equivalent to that of the mass M of the foils (cf. formula (19)).4 Thus, the relative
standard deviation of the thermal neutron flux is:
2
22
2
2)()(
Cdbare
Cdbare
th
th
AA
ADAD
M
MDD
. (39)
6.2.2. Systematic error
By performing the measurement carefully, the statistical error expressed in relation (30) can
be reduced to 12%. It is more difficult to reduce systematic errors, which can be as high as 10%.
The most important errors are the following:
- Self-shielding factor G is hard to calculate. This is on the one hand due to the fact that formula
(12) is just approximative (especially in the case of the cadmium-covered foil), on the other
hand cross section σt in the formula is difficult to calculate.
- A similarly great number of assumptions are needed for the calculation of the product vd
in
formula (17). A few examples to illustrate the problems which may arise: the neutron spectrum
3 In mathematical statistics these terms are known as standard deviation and bias. The terms above are
colloquial and not accepted in mathematics. 4 The masses of the bare and the cadmium-covered foil may be different. In this case the formula for calculating
the error is much more complicated. For simplicity, we assume that their masses are equivalent.
Determination of the thermal neutron flux in the core of the reactor
HUVINETT 2012 18
to be used in formula (16) is only known from calculations, the cross section of the ratio is only
known with a finite accuracy, etc.
- Decay constant λ in formula (13) is known with a finite accuracy only. However, the effect of
this is only in the order of magnitude of one thousandth (e.g. the half life of 198Au based on [6]
is 2.6948±0.0012 days). Further inaccuracies stem from the fact that the activation factor
containing T ‘assumes’ that at the beginning of activation the sample gets in the irradiation
position, and back, instantaneously. This can be corrected if instead of equation (8), a
differential equation considering the real time dependence of the neutron flux during the
movement of the sample is solved. However, if the time of activation lasts 10 s or longer, this
correction is below 1%.
In the end, it can be seen that because of the numerous systematic errors we cannot actually
speak about measuring the neutron flux. What we can achieve is the approximative determination of
the neutron flux, the value of which is strongly dependent on the assumptions made during the
evaluation.
7. KNOWLEDGE CHECK
1. How do we define the scalar neutron flux? What is its dimension?
2. Characterize the spatial distribution of thermal neutron flux in a bare and a reflected
reactor!
3. What is the principle of determination of the thermal neutron flux by activation method?
4. Why do we use cadmium cover for one of the gold samples and how do we define the
cadmium ratio?
5. Why is it not necessary to use cadmium cover for the dysprosium (Dy-Al alloy) wire?
6. How is the absolute value of the thermal neutron flux determined?
7. What statistical and systematic errors occur when determining the value of the thermal
neutron flux?
8. REFERENCES
[1] Duderstadt, J. J., Hamilton, L. J.: Nuclear Reactor Analysis, John Wiley & Sons, New York,
1976.
[2] Bell, G., Glastone, S.: Nuclear Reactor Theory, Litton Educational Publishing, Inc., 1970.
[3] Szatmáry Zoltán: Bevezetés a reaktorfizikába, Akadémiai Kiadó, Budapest (2000)
[4] Csom Gyula: Atomerőművek üzemtana I., A reaktorfizika és –technika alapjai, Műegyetemi
Kiadó (1997)
[5] NuDat 2 database, National Nuclear Data Center, Brookhaven National Laboratory,
http://www.nndc.bnl.gov/nudat2/
[6] Jagdish K. Tuli: Nuclear Wallet Cards, National Nuclear Data Center, Brookhaven National
Laboratory, Upton, New York, U.S.A. (2000)
Determination of the thermal neutron flux in the core of the reactor
HUVINETT 2012 19
[7] Szatmáry Zoltán: Mérések kiértékelése, egyetemi jegyzet, BME Természettudományi Kar,