determination of the effect of dumpsites on aquifer at port … · wenner-alpha with 21 electrodes...
TRANSCRIPT
IOSR Journal of Applied Physics (IOSR-JAP)
e-ISSN: 2278-4861.Volume 9, Issue 6 Ver. I (Nov. - Dec. 2017), PP 41-54
www.iosrjournals.org
DOI: 10.9790/4861-0906014154 www.iosrjournals.org 41 | Page
Determination of the Effect of Dumpsites on Aquifer At Port
Harcourt Metropolis, Rivers State, Nigeria
Agbemuko Ojo S1, I. Tamunobereton-Ari
2, S. A. Ngah
3
1,2,3,Department of Physics, Rivers state University, Port Harcourt, Nigeria
Corresponding Author: Agbemuko Ojo
__________________________________________________________________________________________
Abstract: 2D geoelectrical method combined with vertical electrical sounding was employed in the study.
Physico- chemical analysis of sample of borehole water at dumpsites and neutral site were also conducted. The
longitudinal conductance of the layers was calculated and prospective capacity of underline bedrock in each
site determined. The result of the VES survey interpreted with WIN RESIST version 1.The 2D Data was process
with RES2DINV software, Both Vertical electrical sounding (VES) and 2D tomography shows two distinct zone
of low resistivity of 0.42 Ωm to 12.3 Ωm indicating leachate infected area and zone of high resistivity value of
1032.0Ωm, and 5572.3Ωm, indicating landfill gases. The result of Physico-chemical analysis of water shows
samples that are far from WHO recommendation, high Turbidity (Eliozu), high dissolve salt (Rumuepirikom)
and high Electrical conductivities at Rumuepirikom. The sites have multi aquifer zone ranges from 23.3m, 40m
and beyond. The results show that underground water at the two Dumpsites is polluted. Two types of lithology
exist in the area-Top soil, clay, lateritic soil, sand soil, coarse sand on one part and Top soil, clay/silt sand, fine
sand, sand and gravel, coarse sand on the other part. The Dumpsites have poor protecting capacity.
Keywords: Aquifer, Dumpsite, Leachate, Resistivity, Tomography.
----------------------------------------------------------------------------------------------------------------------------- ----------
Date of Submission: Date of acceptance:
---------------------------------------------------------------------------------------------------------------------------
I. Introduction
There are lots of environmental hazards associated with dump site, affluence discharge, the ugly sight,
the decomposed waste both organic and inorganic materials that form salt seep and percolate into the subsurface
soil have adverse effect on human life. The inhabitants of land fill area depend on underground source of water
supply. However, 90% of human activities require the use of water, and access to clean potable, uncontaminated
water is necessary for healthy living. The fact remains that the population in the urban area increases daily as
such more wastes are generated daily. The manner of which wastes are disposed is a concern to the
environmentalist, Government and the world body (WHO). The fast means of disposing the waste lead to
indiscriminate manner of locating dump sites. It is usually a borrow pit within undeveloped area which within
two to five years often turn to be densely populated due to urban migration.
Most of the dump sites in the study area are borrow pits where laterite (red sand) had been excavated
for the purpose of filling embankment during construction of major roads and oil locations. Increase in demand
for home ownership from the past twenty years has accelerated physical development in Port Harcourt
municipality hence these borrow pits turned to dump sites are now within the centre of urban area. The residents
in the area of study depend on ground water as the source of fresh water which is obtained through boreholes,
these boreholes are drilled within or around the dumpsites, the contamination of borehole water through the flow
of leachate is most probable in the present of rainfall in this circumstances.
Aquifer is a porous water-bearing stratum of sand and gravel of subsurface rock often serves as
reservoir for underground water. While leachate is liquid contaminants that generate from decomposed organic
waste, the present of water or water collecting through the waste generate more of these contaminants. Its
generation is affected by rainfall, topography, landfill cover, vegetation and type of waste. In unlined landfills
the leachate continues to seep into the ground this may contaminate both surface water and underground water.
Nearby stream and rivers on downward slope terrain are easily polluted by the migration of the leachate. The
challenge in third world is how Dump sites or Landfills are built to prevent waste from contaminating soil and
ground water source. Efforts have been made by Geoscientists and Geologists on the movement of leachate at
Dump sites unto aquifer, the research works is necessary going by the importance of water to human live and
urban migration that increase Port Harcourt city population every year.
1.1 STUDY AREA
The study area is within Port Harcourt municipality covering Port Harcourt Local Government area and
Obio/Akpor Local Government of Rivers state, Nigeria. It is within the heart of Niger delta region of Nigeria
and Niger delta sedimentary basin of Akata, Agbada and Benin formation. The dump sites are located at
Rumuepirikom, Eliozu town, all within densely populated area of Port Harcourt metropolis. The study area is

Determination of the Effect of Dumpsites on Aquifer At Port Harcourt….
DOI: 10.9790/4861-0906014154 www.iosrjournals.org 42 | Page
cover between the longitude 06ᴼ 54’ 30’’E, and 07ᴼ 03 09’’E and between latitude 04ᴼ 45’ 27’’N and 04ᴼ 58’
22’’N. (Fig.1.1 and Fig.1.2).
Figure 1.1: Relative position of dump sites on Greater Port harcourt map.
Figure 1.2: Map of Obio/Akpor and Port Harcourt local Government area showing the study area.
1.3 Hydrogeology And Geology Of The Study Area.
The study area is within the Niger Delta region of oil and gas zone of Port Harcourt municipality a
deltaic environment, (Fig.1.2). The geological formation consist of Benin formation of Delta environment, this
region favours agriculture, fishing, oil and gas exploration and steady flow of aquifer. The top soil is usually
over lay with clay soil, lateritic soil followed by coarse sand and fine sand. The depth of water table ranges from
3m to 15m below ground level [1]. Existing borehole within this area is within 15m to 40metres.

Determination of the Effect of Dumpsites on Aquifer At Port Harcourt….
DOI: 10.9790/4861-0906014154 www.iosrjournals.org 43 | Page
1.4 Geography, Climate And Vegetation
The annual rainfall in a basin determines the water input into the basin, the annual rainfall in Niger
Delta is from 500m per annual at the coasts to about 300mm at the Northern part of the delta [2].
The topography is flat with thick vegetation partly mangrove at the southern part toward the creek and
deciduous forest toward the north, the climatic environment favour agriculture, subsidence farming. The rainfall
is heavy with intermittent rainfall, the runoff and infiltration rate is fast. A long period of rainfall in the month of
August, September and October is predominant at the study area, in this period the infiltration rate is low as a
result of rise in water table level. The communities are agrarian but in flow of oil companies accelerate the
growth of the population and the urbanization of the study area thereby erasing farming activities in the
metropolis. The climatic nature of the study area and it geological formation makes them vulnerable to aquifer
contamination.
II. Methodology Schlumberger array and Wenner array methods were combined in this investigation. Schlumberger was
employed for vertical electrical sounding. This method probes deep into the subsurface rock thereby revealing
the lithology and discovering of aquifer zone. Wenner configuration was used for the Two – Dimensional
survey this was due to its sensitivity to lateral variation in resistivity. Profile section could be carried out along
parallel lines eastward or westward producing series of resistivity variation that could produce a contour map of
the area thereby given an insight into zone of contaminants.
2.1 Field Procedure And Data Collection
2.1.1 Vertical Eletrical Sounding (Ves) Using Schlumberger Array
Four electrodes were planted on ground surface at a measurable separation with a common mid-point.
Two potential electrodes place in between two current electrodes; series of observations were recorded at a
separate electrode constant between the two potential electrodes. The two potential electrodes separation kept
constant while the two current electrodes were moved in opposite direction, after some distance interval the two
potential electrodes distance were changed for another series of observations moving along the current
electrodes , as the separation between current electrodes is increased so is the depth of penetration. Fig.2.1.
A distance of 200m-300m were covered in most of the VES points due to space constrain.
Figure 2.1: Schematic Diagram of schlumberger array field method
The apparent resistivity is obtained in the general formula 1from Fig.2.1
ρa = 𝟐𝝅𝜟𝑽
𝑰{ 𝟏
𝑨𝑴−
𝟏
𝑴𝑩 −
𝟏
𝑨𝑵−
𝟏
𝑵𝑩 }
(1)
Hence ρa= 𝝅
𝟒 𝜟𝑽
𝑰[𝑨𝑩²−𝑴𝑵²
𝑴𝑵] (2)
Where K = 𝝅
𝟒 [
𝑨𝑩²−𝑴𝑵²
𝑴𝑵] (3)
∴ ρa = 𝜟𝑽
𝑰𝑲 (4)
ρa is apparent resistivity of an electrically homogeneous media. A table of field electrode separation
observation data was made of AB/2, MN/2, R, and K. Value of K calculated from equation 3. A minimum of
two vertical electrical sounding were conducted at the dump sites and one at the neutral site at Rivers state

Determination of the Effect of Dumpsites on Aquifer At Port Harcourt….
DOI: 10.9790/4861-0906014154 www.iosrjournals.org 44 | Page
university Port Harcourt. SAS 300C Tarameter was used for this investigation. The resistance at every electrode
stations was recorded. Knowing the resistance value couple with K – factor as computed, the apparent resistivity
was calculated these values were keyed into Schlumberger WINRESIST Software through excel. The software
automatically generated model curves using the resistivity, electrode distance and number of layers. After series
of iteration the final marching curve was produced with calculated resistivity of available layers and thickness
with depth.
2.2 Two – Dimensional Resistivity Survey.
Resistivity is a fundamental material property which is a measure of the materials opposition to the
flow of current [3]. It is measured by injecting current into the ground through two electrodes planted on the
ground surface, the potential difference due to the current is observed through two potential electrodes. The field
observation involved linear array arrangement of current and potential electrodes. The field observation was of
Wenner-alpha with 21 electrodes observation at Rumuepirikom, 25 electrodes observation at Eliozu dumpsite.
The electrodes constant was 5 meters interval while data observations were conducted at 5m, 10m, 15m, 20m,
25m, 30m electrode spacing respectively. Fig.2.2 shows the arrangement of the electrodes for the field
observation. Electrode 1 and 4 in Fig.2.3 are current electrodes while electrode 2 and 3 were potential electrodes
on 5 meter electrode interval of constant (a= 5meters) having the first midpoint between 2 and 3, the next
selection of electrode goes to 2, 3, 4 and 5 with 3 and 4 acting as potential electrode, this was done until the last
electrode 21 or 25. For the possible 25 electrodes 22 possible observations were made.
The next observation was on 10 meters spacing. Electrode 1, 3, 5 and 7 are used for the first
measurement followed by electrode 2, 4, 6, and 8. 19 possible observations were recorded this was carried to n=
6 of 30meters with seven possible measurement, thus there are E- (n x 3) possible observation for Wenner-
alpha configuration were ‘E’ is the number of electrode to be observed ‘n’ is the set number of observation
.Hence for 25 electrodes where n = 3. 16 possible observations will be recorded. 25 – (3x3) = 16. The
electrodes were moved from one end of the line to the other in leap frog manner (arrow in Fig. 2.2).
Figure 2.2: Wenner alpha configurations
Figure 2.3:The arrangement of electrodes for 2-D Imaging. (The dots indicate midpoint-point).

Determination of the Effect of Dumpsites on Aquifer At Port Harcourt….
DOI: 10.9790/4861-0906014154 www.iosrjournals.org 45 | Page
The instrument display the resistance while the electrode geometric K calculated for every set of electrodes
observations. The apparent resistivity computed using excel format.
From figure 2.2 AM = MN = NB = a also AM = NB = a, MB = AN = 2a
From the general formula for electrode configuration, ρa = 𝟐𝝅𝜟𝑽
𝑰{ 𝟏
𝑨𝑴−
𝟏
𝑴𝑩 −
𝟏
𝑨𝑵−
𝟏
𝑵𝑩 }
Therefore ρa = 𝟐𝝅𝜟𝑽
𝑰{ 𝟏
𝒂−
𝟏
𝟐𝒂 −
𝟏
𝟐𝒂−𝟏
𝒂 }
Where K = 𝟐𝝅
{ 𝟏
𝒂−
𝟏
𝟐𝒂 −
𝟏
𝟐𝒂−𝟏
𝒂 }
hence K = 2πa
Thus ρa = 𝜟𝑽
𝑰𝑲 Where ρa = apparent resistivity.
A table of observations showing the interval of electrode, midpoint probed, the Terameter displayed resistance,
the computed value of K for every ‘a’ and final resistivity in ohm-m was designed and used for the recording.
The data in text file format was import into RES2DINV software for processing.
III. Field Results, Discussion And Interpretation 3.1 Vertical Electrical Sounding Data Processing
The raw data from Schlumberger arrays observations in all the VES stations were saved into excel
format, the values of AB/2, MN/2 and apparent resistivity were imported to WIN RESIST version 1 software
which subsequently computed the resistivity values of layers their thickness and depth respectively, the
inversion curve is automatically displayed. The curve type ranges from H. KH, HKH. The combination of the
resistivity and layer thickness was used to compute the longitudinal conductance of layers [4]. High longitudinal
conductors indicate high protective capacity (S). S= ∑ (hi/Рi) - (summation of all layers) Table 3.1. The
protective capacity of the layer impedes or increases the rate of movement of the leachate into aquifer.
Table: 3.1 Protective Capacity Rating (Hemnet, 1976) Sum of longitudinal conductance (mhs) Overburden protective capacity classification
<0.1 Poor
0.1-0.19 Weak
0.2-0.69 Moderate
0.7-1.0 Good
3.1.1.1: Rumuepirikom Dumpsite Ves Station
Rumuepirikom is a local dump site it is no longer manage by the government, it is located within a
thickly populated area Fig.3.2. Part of the site has been reclaimed for residential houses. The VES station curve
is shown in Fig.3.3 below. The curve type is HKH .The numbers of layers in the probe is six with a discrete
layer 7. Resistivity, depth and geological formation are indicated in Table 3.2.
Figure 3.2: Rumuepirikom dump site Field diagram

Determination of the Effect of Dumpsites on Aquifer At Port Harcourt….
DOI: 10.9790/4861-0906014154 www.iosrjournals.org 46 | Page
Figure 3.3: Rumuepirikom VES station.
Table 3.2: Rumuepirikom VES Station Result LAYERS RESISTIVITY THICKNESS DEPTH GEOLOGICAL
INTERPRETATION
1 2
16.9 5.5
0.5 0.8
0.5 1.3
Top soil black Sub top soil
3
4 5
6
7
73.8
4.0 2.0
55.2
207.7
2.1
2.6 8.0
13.7
-
3.4
6.0 13.9
27.6
-
Clay
Sand soil Sand soil
Sand and gravel
3.1.1.2 Eliozu Dump Site Ves Station
Three VES stations were carried out at this dump site, at the North - South section of the site and one at
the East. Lack of space constrains investigation on the western section of the dump site, Fig.3.6.The marching
curve is as giving in Fig. 3.7a,b&c.VES 1 is of H- type curve, VES 2 is of KH- type curve while VES 3 is of H –
type curve. The numbers of layers with corresponding resistivity thickness and depth are shown on Table 3.4a,
b&c.
Figure 3.6. Eliozu Dump site field diagram.

Determination of the Effect of Dumpsites on Aquifer At Port Harcourt….
DOI: 10.9790/4861-0906014154 www.iosrjournals.org 47 | Page
Figure 3.7a: Eliozu dumpsite VES 1
Figure 3.7b: Eliozu Dumpsite VES 2
Figure 3.7c: Eliozu Dumpsite VES 3

Determination of the Effect of Dumpsites on Aquifer At Port Harcourt….
DOI: 10.9790/4861-0906014154 www.iosrjournals.org 48 | Page
Table 3.4 a, b&c: Eliozu dumpsite VES points result
A: VES 1 Layers Resistivity Thicknes Depth Geological Interpretation
1 52.2 1.0 1.0 Top Soil
2 37.5 1.5 2.5 Clay
3 19.4 3.6 6.1 Clay Sand Soil
4 8.7 8.8 14.9 Sand
5 55.8 11.5 26.4 Sand And Gravel
6 316.5 - -
B: VES 2 Layers Resistivity Thicknes Depth Geological
Interpretation
1 40.2 0.9 0.9 Top Soil
2 753.0 2.9 3.8 Clay
3 135.3 4.5 8.3 Laterite
4 109.1 8.0 16.3 Sand
5 150.6 14.3 30.6 Sand
6 1032.0 - -
C: Ves 3 Layers Resistivity Thickness Depth Geological Interpretation
1 122.3 0.6 0.6 Black Top Soil
2 6.3 0.6 1.2 Top Soil
3 1.4 0.9 2.1 Clay
4 13.6 0.7 2.8 Clay
5 144.2 1.3 4.1 Clay
6 401.7 1.8 5.9 Laterite
7 5572.3 13.1 19.1 Sand
8 20585.6 - -
3. 2 Two Dimensional Resistivity Survey Data Processing And Intepretation
The field data results of the Wenner-alpha resistivity observations were processed automatically using
RES2DINV software. The result is presented in three pseudo – sections. Measured apparent resistivity pseudo-
section is displayed first follow by the calculated apparent resistivity pseudo-section; by 2 to 3 iterations the
final inverse model resistivity is displayed. The pseudo- section is displayed by plotting the data points using the
length axis (x-axis) for along the survey line against the depth for the electrode separation. (Y-axis). The
corresponding apparent resistivities for the plotted points are then used to contour the variation in apparent
resistivity along the surveying line.Fig.3.8.
3.2.2 Rumuepirikom Dumpsite
Fig.3.8 is the parallels profile results at Rumuepirikom dump site, the two profile lines are fifty meters
apart. Profile 1 was conducted on the decomposed heap of waste, while profile 2 was by the edge of major road
accessing the dump site. The root means square error in profile 1 is 11.0% and in profile 2 is 6.3% showing a
best fit iteration. Fig.3.8a shows that the entire area is contaminated with heavily impacted section going down
beyond 30m, land fill gases of ammonia or methane can be seen mapped at 90m along the profile at 4.5m depths
from the inverse model section. Profile 2 tomography is shown on Fig.3.8b. Leachate flow is observed at 75
meters heavily impacted from 6.5m depth. The results indicate aquifer contamination is possible in this regard.
Existence of land fill gasses, chemical substance were mapped traversing from 2m to 50 meters along the
traverse line this sank deep down to infiltrate water body.
The VES station is located at coordinate point 275 319, 32mE, 533712.70mN which is about 75-80
meters along the profile line 2.The 2nd
, 4th and 5th
layers have low resistivity of 5.5Ω m, 4.0Ωm and 2Ωm at
depth of 1.3m, 6.0m and 13.9m to 27.6m respectively these layers are contaminated zone of leachate plumes
Fig.3.3 The result collaborates with the 2D resistivity imaging at this site. It thus indicates that underground
water that exists within 30m has been contaminated.
A bore hole drilled at about 15 meters from this traverse line and VES point by the Church occupying a
portion of the site has been observed unsaved for drinking (contaminated).

Determination of the Effect of Dumpsites on Aquifer At Port Harcourt….
DOI: 10.9790/4861-0906014154 www.iosrjournals.org 49 | Page
Figure 3.8a: Rumuepirikom profile 1 pseudosection
Figure 3.8b: Rumuepirikom profile 2 pseudosection
Determination of the Effect of Dumpsites on Aquifer At Port Harcourt….
DOI: 10.9790/4861-0906014154 www.iosrjournals.org 50 | Page
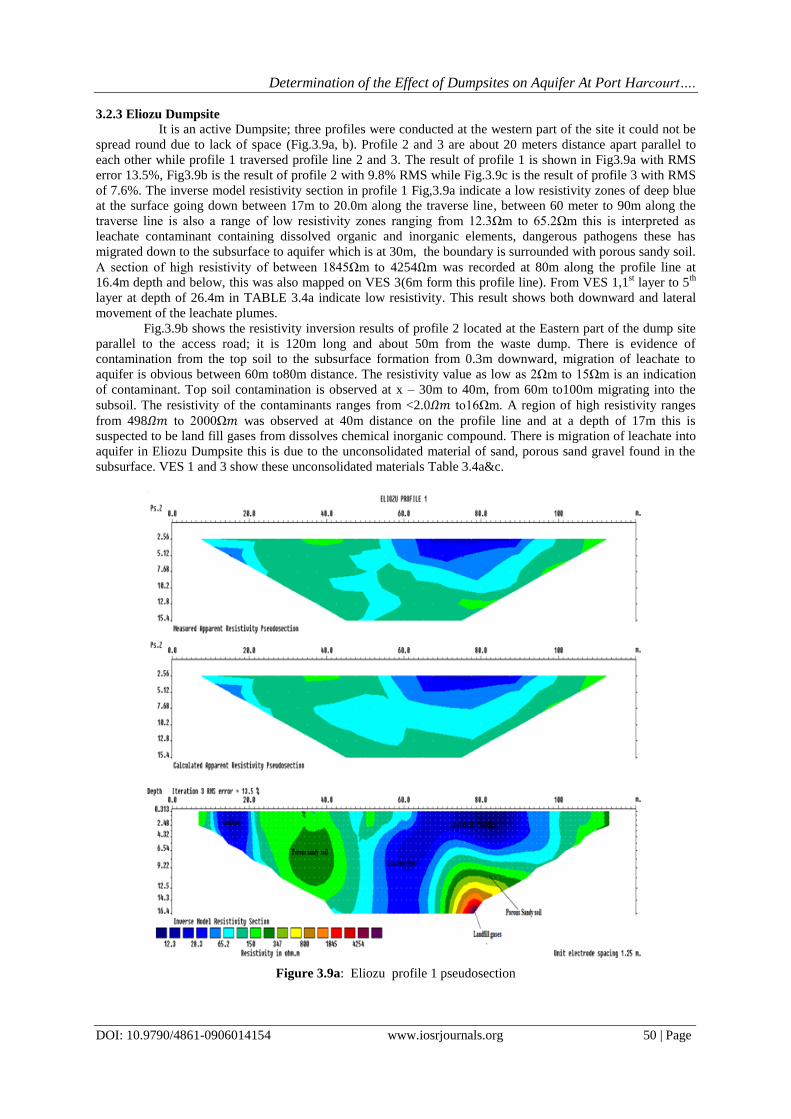
3.2.3 Eliozu Dumpsite
It is an active Dumpsite; three profiles were conducted at the western part of the site it could not be
spread round due to lack of space (Fig.3.9a, b). Profile 2 and 3 are about 20 meters distance apart parallel to
each other while profile 1 traversed profile line 2 and 3. The result of profile 1 is shown in Fig3.9a with RMS
error 13.5%, Fig3.9b is the result of profile 2 with 9.8% RMS while Fig.3.9c is the result of profile 3 with RMS
of 7.6%. The inverse model resistivity section in profile 1 Fig,3.9a indicate a low resistivity zones of deep blue
at the surface going down between 17m to 20.0m along the traverse line, between 60 meter to 90m along the
traverse line is also a range of low resistivity zones ranging from 12.3Ωm to 65.2Ωm this is interpreted as
leachate contaminant containing dissolved organic and inorganic elements, dangerous pathogens these has
migrated down to the subsurface to aquifer which is at 30m, the boundary is surrounded with porous sandy soil.
A section of high resistivity of between 1845Ωm to 4254Ωm was recorded at 80m along the profile line at
16.4m depth and below, this was also mapped on VES 3(6m form this profile line). From VES 1,1st layer to 5
th
layer at depth of 26.4m in TABLE 3.4a indicate low resistivity. This result shows both downward and lateral
movement of the leachate plumes.
Fig.3.9b shows the resistivity inversion results of profile 2 located at the Eastern part of the dump site
parallel to the access road; it is 120m long and about 50m from the waste dump. There is evidence of
contamination from the top soil to the subsurface formation from 0.3m downward, migration of leachate to
aquifer is obvious between 60m to80m distance. The resistivity value as low as 2Ωm to 15Ωm is an indication
of contaminant. Top soil contamination is observed at x – 30m to 40m, from 60m to100m migrating into the
subsoil. The resistivity of the contaminants ranges from <2.0𝛺𝑚 to16Ωm. A region of high resistivity ranges
from 498𝛺𝑚 to 2000Ω𝑚 was observed at 40m distance on the profile line and at a depth of 17m this is
suspected to be land fill gases from dissolves chemical inorganic compound. There is migration of leachate into
aquifer in Eliozu Dumpsite this is due to the unconsolidated material of sand, porous sand gravel found in the
subsurface. VES 1 and 3 show these unconsolidated materials Table 3.4a&c.
Figure 3.9a: Eliozu profile 1 pseudosection

Determination of the Effect of Dumpsites on Aquifer At Port Harcourt….
DOI: 10.9790/4861-0906014154 www.iosrjournals.org 51 | Page
Figure 3.9b: Eliozu profile 2 pseudosection
Figure 3.9c: Eliozu profile 3 Pseudosection
IV. Calculation Of Ves Overburden Thickness

Determination of the Effect of Dumpsites on Aquifer At Port Harcourt….
DOI: 10.9790/4861-0906014154 www.iosrjournals.org 52 | Page
The Dump sites have poor protecting capacity, they are less than critical value of 1.0 Siemens, and it indicates
that these sites do not have sufficient confined layers of clay or shale that may impede or slow down the rate of
leachate percolation into aquifer. The underlying rocks are sand and gravel that are porous; these are the zone of
water body. (Table 4:10).
Table 4:1. Calculation of VES Overburdens Thickness. VES points Coordinates
Location layer Resistivity Ωm
Thickness Litho logy Longitudinal conductance
Protective capacity
VES 1 RUMUEPIRI
KOM
1
2 3
4
16.9
5.5 73.8
4.0
0.5
0.8 2.1
2.6
Top soil
Sub top soil Clay
sand
0.0296
0.1455 0.0285
0.650
0.2036
Moderate
VES 1 ELIOZU 1 2
3
4
52.2 37.5
19.4
8.7
1.0 1.5
3.6
8.8
Top soil Clay
Clay/ sand
sand
0.0192 0.0400
0.1856
1.0115
0.0592 Poor
VES 2 ELIOZU 1 2
3
4
40.2 753.0
135.3
109.1
0.9 2.9
4.5
8.0
Top soil Clay
Literate
sand
0.0224 0.039
0.0333
0.0733
0.0947 Poor
VES 3 ELIOZU 1
2
3 4
5
6
122.3
6.3
1.4 13.6
144.2
401.7
0.6
0.6
0.9 0.7
1.3
5.9
Top soil
(dry)
Top soil Clay
Clayed
Clayed sand
Laterite
0.0049
0.0952
0.6429 0.0515
0.0090
0.0147
0.1001
poor
VES I RUST(Control
)
1
2 3
4
42.9
60.9 198.2
24.4
1.2
3.0 5.8
14.3
Top soil
Clayed soil Lateritic
soil
Clayed sand
0.0280
0.0493 0.0293
0.5861
0.6927 Moderate
V. Physico-Chemical Analysis Of Water
The physico-Chemical analysis of the underground water obtained from the borehole around the dump
sites were carried out with standard method of ALPHA 1998 20th
Edition by Institute of pollution studies Rivers
state university, Nkpolu-oroworukwo, Port Harcourt. The results were compared with World health
Organisation (WHO) 2004 standard. The results are shown in TABLE 5.1 PH values for all the samples were
less than WHO standard except Rumuepirikom 7.0. Although PH has no direct impact on consumer it said to be
necessary in all stages of water treatment to ensure satisfactory water clarification and disinfection [5].
Electrical conductivity at Rumuepirikom is 1989µs/cm, this indicate high salinity, Eliozu at 333µs/cm .
Turbidity in Eliozu is higher than the rest and above WHO Standard; this impurity is as a result sloppy and
swampy terrain of this section of the Dumpsite. Surface water flow downstream along this section this might
have carried along impurity and micro organism that seep through to the well. Turbidity is caused by suspended
particles both organic and inorganic in clay. The visible cloudiness of the water poses a sign of danger to
consumer who may perceive the colour as a sign of impurity and contaminations which are injurious to health.
Total dissolved salt is higher in Rumuepirikom 1390mg/l than the WHO Standard of 600mg/l
Phosphate content is generally within same range of or less than 0.05. Phosphate generally helps plants to grow.
Also Nitrate values are all less than WHO recommendation, hence, good for drinking all things being equal.
High chloride concentration affect the taste and palatability of the water, only sample from Rumuepirikom
dump site is higher than the rest, however it is still within the limit of WHO standard. Iron concentration is
below 0.3mg/l limit in all the samples. Lead and Sodium are also less but the Total Heterotrophic Bacterial
(THB) contents are higher in all the sites, control well is 250cfu/100ml compare to limit of less than or equal
to100cfu/100ml. The high value of THB is a sign of possible growth of bacteria that may be dangerous to
human health. Heterotrophies are organisms including bacteria, yeasts and moulds that require an external
source of organic carbon for growth. Temperature values are within the range of 29.1 to 31.9 degree centigrade.
Temperature plays an important role in portability of water, cool water is more palatable than warn water, high
water temperature have been said to enhance the growth of microorganism and may increase problems related to
taste , odour, colour and corrosion [5].

Determination of the Effect of Dumpsites on Aquifer At Port Harcourt….
DOI: 10.9790/4861-0906014154 www.iosrjournals.org 53 | Page
Table 5.1 Result Of Physico-Chemical Water Analysis No Parameters Eliozu Rumuoepirikom UST (control) WHO 2004
1 pH 6.2 7.0 5.8 6.5-8.5
2 Temp. (◦c) 31.7 29.1 29.2
3 EC(uS/cm) 333 1989 292
4 Salinity (%0) 0.16 1.0 0.13
5 Turbidity NTU) 38.1 0 0 5
6 TDS (mg/I) 237 1390 203 600
7 Phosphate (mg/I) <0.05 <0.05 <0.05
8 Nitrate (mg/I) 0.22 0.21 0.11 50
9 Sulphate (mg/I) 1.7 3.0 1.5 250
10 Chloride (mg/I) 3.0 123.5 <1.0 250
11
T .AIK (mg/I) 2 6 2 250
12 T. Hard. (mg/I) 2.2 29.0 0.7 100-300
13 Calcium (mg/I) 0.877 2.707 0.300
14 Magnesium (mg/I) <0.001 5.418 <0.001
15 Iron (mg/I) <0.001 <0.001 <0.001 0.3
16 Lead (mg/I) <0.001 <0.001 <0.001
17 Potassium (mg/I) 0.578 34.35 0.374
18 Sodium (mg/I) 8.836 72.98 <0.001
19 THB (CFU/100ml) 3.2x10² 4.4x10² 2.5x10² ≤100
20 TCB(MPN/ml Nil Nil Nil 0-2
21 FCB(MPN/ml) Nil Nil Nil 0
Note : <0.5 = Lass than detection limit; ND = Not detected
VI. Conclussion The geology of the site revealed: 1.Top soil/litmus, clay, lateritic soil sand and coarse sand and 2:
Top soil, clay/silt sand, fine sand, sand and gravel and coarse sand. Most of the Dump sites have poor protecting
capacity, they are less than critical value of 1.0 Siemens, Rumuepirikom is moderate and Eliozu have poor
protective capacity. It indicates that these sites do not have sufficient confined layers of clay or shale that may
impede leachate percolation into aquifer. The underlying rocks are sand and gravel that are porous; these are the
zone of water body. The aquifer zone in the area of study ranges from 26m depth to 46.3m (Table 6.1) the result
is in synergy with Ugwu, S.A. el at (2009) work that discovered uncontaminated fresh water at University
Demonstration secondary school and a Dumpsite along East-West road near Choba Town at depth of 23.3m. [6].
Table 6.1. Aquifer depth in the study area SITES DEPTH (m)
Rumuepirikom zone 30
Eliozu zone 26.4
RUST arena 40.3
The survey revealed two Zones of low and high resistivity, the low resistivity zone are contaminants
while the zone of high resistivity contains gases that formed from carbon and organic substance emanated from
decomposed chemical waste. The two Dumpsites aquifer is confirmed to be contaminated with leachate. The
bedrock protective capacity in the study area is weak, hence leachate present a potential contamination to
surface and underground water in the study area. Leachate constitutes a hazard to the local aquifer and should be
tamed.Therefore, Cleaning and cleansing of environment by relocation of dumpsite should be done regularly as
the local communities continue to experience physical Development and expansion, Proper evaluation of
protective capacity of the subsurface rock using geoeletrical survey should be carried out before Dumpsite is
approved. Periodic monitoring of the percolation of the leachate plume should always be carried out to ascertain
the rate of seepage of contaminant to the subsurface rock. This work has indeed show that geo electrical Survey
is useful in the investigation of contaminants in land fill, a further integrated approach combining seismic
refraction method could also suffice.
Acknowledgement Our appreciation goes to all those who participated in the field work, Institute of pollution studies
Rivers State University Port Harcourt and to the management of Rivers State Environmental management
Board Rumueme, Port Harcourt Nigeria.
Reference [1]. Ofodile M. E, An approach to groundwater study and development in Nigeria (Mecon Services Ltd, Ranchi.1991 pp.138-148). [2]. Etu-Efeofor, J.O. and Odigi M. I, Water supply problems in the eastern Niger Delta. Journal of mining

Determination of the Effect of Dumpsites on Aquifer At Port Harcourt….
DOI: 10.9790/4861-0906014154 www.iosrjournals.org 54 | Page
[3]. geology.20 (1, 2) 1983, 183-193.
[4]. Sara Michelle Monaha. Investigating fault structure using Electrical Resistivity Tomography. Bsc project, California Polytechnic
[5]. State University, San Luis Obispo, 2013. [6]. Golam, S. S, Keramat M, Shahid M. Deciphering transmissivity and hydraulic conductivity of the aquifer by vertical electrical
[7]. Sounding (VES) experiments in Northwest Bangladesh, Appl. Water science, 2014.
[8]. World Health Organisation, Guideline for Drinking-water quality, vol.1 of Recommendations [9]. WHO, Geneva, Switzerland, 4th Edition 2011.
[10]. Ugwu, S.A.; Nwosu, J.I .Effect of waste Dumps on Groundwater in Choba using Geophysical Method. Journal of Applied Science
[11]. Environmental management March, 2009 vol.13 (1)85-89.
Agbemuko Ojo S Determination of the Effect of Dumpsites on Aquifer At Port Harcourt
Metropolis, Rivers State, Nigeria.” IOSR Journal of Applied Physics (IOSR-JAP) , vol. 9, no.
6, 2017, pp. 41-54.