determination and prediction of risk to soil compaction
TRANSCRIPT

INTERUNIVERSITY PROGRAMME IN
PHYSICAL LAND RESOURCES
Ghent University Vrije Universiteit Brussel
Belgium
Determination and Prediction of Risk to Soil Compaction from Agricultural Operations
Promoter:
Prof. dr. ir. Wim Cornelis
Master dissertation submitted in partial fulfillment of the requirements for the degree of Master of Science in Physical Land Resources by Elmer Alosnos
2014-2015
I C E

i
This is an unpublished M.Sc dissertation and is not prepared for further distribution. The author and the promoter give the permission to use this Master dissertation for consultation and to copy parts of it for personal use. Every other use is subject to the copyright laws, more specifically the source must be extensively specified when using results from this Master dissertation. Gent, The Promoter, The Author, Prof. dr. ir. Wim Cornelis Elmer Alosnos

ii
Acknowledgment
The author is grateful to Prof. Wim Cornelis for his guidance and constructive criticism.
The author would also like to acknowledge the help received from the technicians responsible
for laboratories used during the experiment namely, Maarten Volckaert, Jan Van der Perre,
and Filip Van Boxstael.
Grateful thanks is also due to the Flemish Inter-University Council (VLIR) for funding my
master program.
I am grateful to Jan de Pue for teaching me how to use Python program.
The moral support of Mary Rose Uy as well as the family of Bing Requieron is also very
much appreciated.
I am also indebted to my professors for sharing me their wisdom and to my classmates for
encouragement and wonderful experiences.
During my long stay in Ghent there were moments when the support of friends became of
paramount importance. I would like to thank these friends Daphne, Clod, Dan, Nina, Camar,
Dennis, Kristine, Nick, Hyzel, and Geoffrey for their moral support.
Special thanks to my ever loving family, good friends, and most of all to Almighty God.

iii

iv
Table of Contents
Acknowledgment ....................................................................................................................... ii List of Figures ............................................................................................................................ v List of Tables ............................................................................................................................ vi List of Abbreviations ............................................................................................................... vii
Abstract .................................................................................................................................. viii 1. INTRODUCTION ............................................................................................................. 1
1.1 Background ...................................................................................................................... 1 1.2 Research objectives .......................................................................................................... 3 1.3 Organization of the thesis ................................................................................................ 4
2. REVIEW OF LITERATURE ............................................................................................ 5 2.1 Soil compaction processes and its implications ............................................................... 5 2.2 Methods of identifying compact soil ............................................................................... 6
2.3 Soil compression test and precompression stress ............................................................ 7 2.3.1 Methods of calculating PCS from soil compression curve ....................................... 8 2.3.2 Factors influencing soil deformation behavior during compression test ................ 10
2.4 Soil quality indicators of soil degradation by compaction ............................................. 10
2.5 Indirect methods of PCS determination by pedotransfer functions ............................... 11 2.5.1 Pedotransfer functions ............................................................................................ 11 2.5.2 Existing PTFs used for predicting PCS and other soil mechanical properties ....... 12
3. MATERIALS AND METHODS ......................................................................................... 16
3.1 Study area....................................................................................................................... 16 3.2 Field sampling and soil analysis .................................................................................... 17
3.3 Laboratory test ............................................................................................................... 17 3.3.1 Apparatus ................................................................................................................ 18 3.3.2 Preparation of soil samples ..................................................................................... 18
3.3.3 Compression tests ................................................................................................... 19
3.4 Determination of PCS .................................................................................................... 19 3.5 Development of pedotransfer functions ......................................................................... 21 3.6 Measurement of soil hydraulic properties...................................................................... 23
3.7 Determination of soil structural quality and vulnerability to compaction ..................... 23 3.8 Statistical analysis .......................................................................................................... 24
4. RESULTS AND DISCUSSIONS ........................................................................................ 25
4.1 Soil quality assessment and risk of compaction ............................................................ 25 4.2 Mechanical susceptibility of soil to compaction ............................................................ 30
4.2.1 Calculated PCS values ............................................................................................ 30 4.2.2 Influence of land use and soil depth on PCS variability ......................................... 34
4.3 Indirect estimation of PCS using pedotransfer function ................................................ 35
4.3.1 Potential predictors of PCS ..................................................................................... 35
4.3.2 Development of regression-based PTFs ................................................................. 36 4.4 Influence of compression test methods on soil deformation behavior .......................... 40
4.4.1 Stress-strain relationships ....................................................................................... 40
4.4.2 Effects of loading duration and initial water potential on PCS .............................. 40 4.4.3 Effect on pore water pressure ................................................................................. 43
5. CONCLUSION .................................................................................................................... 45 6. LITERATURE CITED ........................................................................................................ 47

v
List of Figures
Figure 1. Geographical locations of the sampling fields (red crosshairs) ................................ 16 Figure 2. Standard oedometer used for uniaxial confined compression test. .......................... 18
Figure 3. Variation of clay, silt, and sand content in the dataset used to develop PTFs. ......... 22 Figure 4. Relationship between clay content and (a) dry bulk density and (b) saturated
hydraulic conductivity. Dash lines in red and blue corresponds to bulk density at PD
= 1.75 g cm-3 and PD = 1.4 g cm3, respectively. ..................................................... 26 Figure 5. Average packing density (PD) for different locations and land use. Dash lines in red
and blue indicates a threshold value for high risk (PD > 7.5 g cm-3) and low risk
(<1.4 g cm-3) in soil degradation by compaction, respectively. ............................... 28 Figure 6. Average packing density (PD) for different locations and soil depth. Dash lines in
red and blue indicates a threshold value for high risk (PD > 7.5 g cm-3) and low risk
(<1.4 g cm-3) in soil degradation by compaction, respectively. ............................... 28 Figure 7. Average air capacity (% vol.) for different locations and land use. Dash line in red
indicates a threshold value (AC < 5% vol.). ............................................................. 28
Figure 8. Average Ksat values for different locations and land use. Dash line in red indicates
a threshold value (Ksat < 10 cm/day). ...................................................................... 29
Figure 9. Stress-strain curves at (a) pF=1.8, (b) pF=2.0, and (c) pF=2.5 water potential for all
sites. Data shown are averages of six values (from cropland center, cropland
headland and grassland, at depths of 40 cm and 70 cm). .......................................... 32 Figure 10. Comparison of PCS values derived by different methods. Pearson correlation
coefficients are shown in the upper right corner and scatter plots with smoothed
lines are shown in the lower left corner. ................................................................... 33 Figure 11. Average PCS (C_DK) of soils from different locations. ........................................ 33
Figure 12. PCS (C_DK) values at different land use and soil depths. ..................................... 34
Figure 13. Average VCI values for different locations and land use....................................... 35
Figure 14. Measured versus PTF-predicted PCS (log kPa) for soil samples collected from
cropland..................................................................................................................... 39
Figure 15. Measured versus PTF-predicted PCS for soil samples collected from grassland .. 39 Figure 16. One-dimensional compression curves for soil samples pre-wetted at different
water potential (pF=1.8, 2.0, and 2.5). Vertical stress is in logarithmic scale. ......... 41
Figure 17. One-dimensional compression curves for soil samples compressed at different
loading durations (T=1, 10 and 30 min). Vertical stress is in logarithmic scale. ..... 41
Figure 18. Precompression stress values derived using different methods. Points represent
mean values of three to four replicate measurements, errors bars are 95% confidence
interval. ..................................................................................................................... 42
Figure 19. Influence of initial water potential and loading duration (values used were
determined using the C_DK method. ........................................................................ 42
Figure 20. Typical result of an oedometer test (at pF=2.0 and T=10 min) showing the loading
sequence, vertical displacement, and pore water pressure changes. ......................... 44

List of Tables
Table 1. Existing pedotransfer functions used to predict PCS and other soil mechanical
properties.......................................................................................................................... 14
Table 2. Existing pedotransfer functions used to predict PCS and other soil mechanical
properties (continued) ...................................................................................................... 15 Table 3. Classification of soil structure quality (adopted from Lebert, 2010). Maximum
threshold for packing density was modified. ................................................................... 23 Table 4. Classification of soil structure quality (adopted from Lebert, 2010). Maximum
threshold and unit for packing density was modified. ..................................................... 24 Table 5. Classification of soil structure quality (adopted from Lebert, 2010). ........................ 24 Table 6. Site characteristics and soil physical properties ........................................................ 27 Table 7. Mean values of StI (%) for different locations and land use. .................................... 29
Table 8. Soil quality index (SQI) scores for different locations and land use. ........................ 30 Table 9. Pearson’s correlation matrix between soil properties (predictors) and PCS values. . 37 Table 10. List of PTFs to predict precompression stress of arable soils with different land use.
The equations represent the best subset regression results and their mean absolute error
(MAE), root mean square error (RMSE), and adjusted R2 values. ................................. 38
`

vii
List of Abbreviations
BD Bulk density
kPa Kilopascal
Ksat Saturated hydraulic conductivity
OC Organic carbon
PTFs Pedotransfer functions
PCS Precompression stress
PD Packing density
PST Plate sinkage test
SCI Susceptibility to compaction index
SQI Soil quality index
VCI Vulnerability to compaction index
VCL Virgin compression line

viii
Abstract
Growing pressures on land resources and mismanagement often leads to deterioration of soil
quality, hence alters the functioning capacity of the soils and impairs its provisioning of
ecosystem services. Among various threats to soil quality, soil compaction due to advanced
farm mechanization may be regarded as one of the most challenging for both farm managers
and policy-makers. This study was conducted to evaluate the structural quality of the soil and
its susceptibility to deformation by mechanical loads. These information are vital in gauging
the vulnerability of arable soils against inevitable threats of compaction. These were achieved
through measurements and analysis of various soil quality indicators associated with
compaction, of which precompression stress (PCS) was considered the most important and
main focus of this research. The PCS was measured using different methods found in
literature and was used, together with other indicators (e.g. air capacity, bulk density,
saturated hydraulic conductivity), to evaluate the vulnerability of soils to degradation by
compaction. Overall, soil structural quality was found intermediate and susceptibility to
compaction was low to medium, thus the vulnerability to compaction can be considered
moderate in East Flanders, Belgium. Difficulties associated with measurement of PCS in both
laboratory and field are a reasonable cause of concern to develop an indirect method using
already available soil information. The underlying relationships between PCS and other soil
physical properties (e.g. bulk density, texture, soil organic carbon, calcium carbonate content,
water tension) were investigated using pedotransfer functions (PTFs). The PTFs developed in
this study can able to predict PCS values of cropland and grassland soils, though further
research is still needed to improve these PTFs to a reasonable degree of predictive capability.
Also, the study demonstrated that soils have different deformation behavior when subjected
to uniaxial compression at different loading duration and initial water potential. Soil
compression under short-time loading (1 to 30 minutes) simulates soil deformation which
occurs under wheel loads of short-time durations. Though the interaction effects of these two
important factors during compression test on PCS was not able to be captured well, their
main effects on stress-strain behavior of the soil were found significant as manifested in the
soil compression curves. It was found that the initial water potential has a significant
influence on PCS values. The PCS tends to be higher with decreasing water potential.

1
1. INTRODUCTION
1.1 Background
Enhanced soil quality is a key component of sustainable agriculture (Lal, 1998). However,
this is compromised by growing pressures on land resources that leads to deterioration of soil
quality, hence alters the functioning capacity of the soils and impairs its provisioning of
ecosystem services. Among various threats to soil quality, soil compaction may be regarded
as one of the most challenging that may have economic and environmental consequences for
world agriculture (Soane & van Ouwerkerk, 1995). In Europe, the Commission of the
European Communities (2006) recognized soil compaction as one of the five most frequent
threats to soil quality, mainly caused by expansion of highly mechanized crop production
systems with intensive field traffic (Crescimanno et al., 2004; Toth, 2008). In contrast to
other types of soil degradation processes, soil compaction is more difficult to detect since it
occurs below the ground and its symptoms are often obscured by other site problems. As no
single universal method is currently available to identify compacted soils (Batey and
McKenzie, 2006), its geographical distribution and total area affected is only roughly known.
Globally, an estimated 68 million hectares are affected by human-induced soil compaction
where Europe and Africa contribute around 49% and 26%, respectively (Bouma and Batjes,
2000). Moreover, an estimated 36% of European subsoils were classified as highly
susceptible to compaction (Jones et al., 2003; Van Camp et al., 2004). Unlike topsoil
compaction that is partly reversible and can be loosened every cropping season, subsoil
compaction is more persistent and extremely difficult to correct since it is below the normal
tillage zone (Hakansson and Reeder, 1994). From a perspective of sustainable soil
management, a good soil quality requires the uncompromising criterion that no subsoil
compaction can be accepted (Van den Akker and Schjonning, 2004).
Since it would take several decades to restore compacted soil it is extremely important to
devise preventive measures against further compaction in order to regenerate soil functions
and avoid long-term irreversible deterioration. One of the technical approaches widely
advocated is optimization of machinery use on farms with emphasis on reducing the
overburden pressure it induced on soil by adjusting wheel loads to the soils’ carrying
capacity. Over the past years there have been an increasing amount of literatures that

2
documented the mechanisms involved on how mechanical stress induced by farm machinery
tires propagates and distributes into the underlying soil layer (e.g. Van den Akker, 2004;
Keller, 2005; Keller et al, 2007; Arvidsson and Keller, 2007; Lamande and Schjonning, 2011;
Cueto et al., 2013). In contrast, it appears that only few attempts have been made to account
precisely how soil behaves during and after repeated wheeling (e.g. Keller et al., 2005) which
is equally important in evaluating soil compaction risks. Van den Akker and Schjonning
(2004) cited that one of the main constraints is the insufficient data on soil mechanical
strength.
Some researchers introduced the concept of precompression stress (PCS) as an indicator to
assess the mechanical strength of soils and eventually used PCS as a conservative criterion
for susceptibility to compaction (Horn 1981; Horn 1988; Lebert, 1989; Kirby; 1991; Veenhof
and McBride, 1996; Horn and Fleige, 2003; Imhoff et al., 2004; Rucknagel et al., 2007).
Originally based on the work of Casagandre (1936) using saturated soil medium, PCS can be
derived from a soil compression curve (or stress-strain curve) generated from laboratory
testing of intact unsaturated soils subjected to one-dimensional confined compression. PCS
denotes a transition point in the compression curve at which the compressive behavior of soil
turns from being elastic into plastic. The risk of undesirable changes in soil structure due to
compaction can be minimized by limiting the mechanically applied effective stress to below
the PCS values (Horn and Lebert, 1994; Alexandrou and Earl, 1998; Dawidowski et al.,
2001).
Despite of the potential use of PCS as a precautional value for mechanical stress in order to
avoid soil compaction, synthesizing earlier studies reveals that using PCS as an exact limit to
distinguish between elastic and plastic soil deformation is deemed controversial (Arvidsson
and Keller, 2004; Keller et al., 2004; Mosaddeghi et al., 2007). Cavalieri et al. (2008)
recently reported the performance comparison of different methods to derive PCS. As
expected, estimated PCS values of various methods tested differed significantly. Moreover,
Keller et al. (2011) argued that using a semi-logarithmic type of stress-strain diagram may
lead to misinterpretation of soil mechanical behavior. Furthermore, Keller and Lamande
(2013) found a contrasting stress-strain behavior of soils obtained in-situ during wheeling
experiments and those measured in standard laboratory tests.
While it remains unclear how these choice of calculation methods and soil testing procedures
will infer on actual PCS values, it will be interesting to pursue whether such variations in

3
PCS are influenced by two key parameters during compression test – preset matric suction
and loading duration. Another question worth pursuing is whether there is a functional
relationship between PCS and other soil properties associated with soil compaction. Previous
studies showed that PCS increases with decreasing loading time and that the effect of loading
time on PCS is larger the more fine-textured the soils (Horn et al., 1994; Lebert et al., 1989).
On the other hand, Berli et al. (2003) reported that PCS increased approximately linearly with
the logarithm of negative initial soil water potential, and the dependence was stronger in the
subsoil than the topsoil. However, there is no report about the combined effects of loading
duration and initial matric suction on PCS.
Another major constraint in PCS measurements are that in general practice, very large soil
samples have been used and the conventional oedometer test is very rigorous and time-
consuming. The problem is often amplified by the lack of easily-accessible and representative
soil mechanical properties that makes the prediction of soil compaction a difficult task.
Interestingly, use of pedotransfer functions (PTF) as predictive means of estimating the soil
mechanical properties needed for soil compaction modeling have been suggested (Lebert and
Horn, 1991; Alexandrou and Earl, 1998; Imhof et al., 2004; van den Akker, 2004; Rucknagel
et al., 2007). However, one caveat in using PTFs is that they cannot be used directly to other
locations with different soil conditions than where they have been originally developed. To
augment the need for indirect estimate of soil mechanical properties with less time and effort,
development of new PTFs was carried out in this study.
1.2 Research objectives
The purpose of this study was to predict the precompression stress (PCS) as a criterion for
susceptibility to soil compaction and investigate how the variations in mechanical testing
procedures will influence its measurements. The specific objectives were to
1) gain insights on how the measurements of PCS are influenced by loading duration and
soil wetness (preset matric potential of -6 kPa, -10 kPa and -33 kPa) and how
persistent is soil wetness under uniaxial confined compression test;
2) demonstrate the dependency of PCS values on how stress-strain curve is expressed
(strain as dry bulk density or void ratio and stress as linearly or logarithmically) and
method of calculation (e.g., regression methods, fitting methods);

4
3) investigate the functional relationship between PCS and other readily available soil
properties associated with soil compaction, namely texture, organic carbon content,
particle size distribution, bulk density, matric potential and land use.
Moreover, as this study is partly based on a dataset developed from soil samples taken at
various locations in Flanders that are representative for actual agricultural land use, i.e.
cropland and grassland, the actual state of soil quality in relation to soil compaction will be
evaluated.
1.3 Organization of the thesis
The manuscript has been organized in five chapters. Introduction and the objectives of the
study are covered in Chapter 1. Chapter 2 gives an overview of literature reviewed on causes
and effects of soil compaction, precompression stress, and pedotransfer functions. Chapter 3
elaborates the scope of the study as well as the materials and methods used. Chapters 4
present results and discussion, while major conclusions and recommendations were given in
Chapter 6.

5
2. REVIEW OF LITERATURE
2.1 Soil compaction processes and its implications
Production risks associated with deterioration of soil structure such as soil compaction
become more prevalent nowadays and are likely to increase in the future (Batey, 2009).
Considering the important role played by several interacting factors related to machine, soil,
crop, and weather, soil compaction is now regarded as a multi-disciplinary problem with
world-wide importance (Soane and Ouwerkerk, 2013). Reduced porosity and increased shear
strength due to densification of soil structure are among the common features of a compacted
soils. Compaction may occur on the land surface, within the tilled layer, or subsoil layers and
may vary in thickness of up to 100 mm or sometimes even more (Chamen et al., 2003; Hatley
et al., 2005; Sinnett et al., 2006; Eckelman et al., 2006).
Natural processes such as weight of overlying soil, rain impact, drying and shrinking of clay,
and penetration of plant roots normally induce compaction on soil. However, soil compaction
as a result of advanced farm mechanization is the most alarming one. As world agriculture is
challenged to achieve a viable production to feed the ever-growing populations, the need for
highly efficient field operations often associated with use of heavy machinery becomes
inevitable. For instance, increased tractor power has allowed growers to cultivate in more
marginal conditions and to greater depth. Though soil compaction is prevalent in Europe and
North America, recent evidences of compaction were also reported in tropical countries.
Fortunately, exciting new opportunities recently emerged in addressing soil compaction
issues. The advent use of decision support system (DSS) in agriculture paved a way in order
to establish useful recommendations for appropriate soil management practices and site-
specific solutions to soil compaction problems (Canillas and Salokhe, 2001). Through
effective DSS, farmers can predict the potential impact of several factors such as tire
specifications, wheel load, inflation pressure, and soil properties on soil structure. For
instance, web-based decision support tools such as Terranimo (http://www.terranimo.dk)
have been introduced in some countries in Northern and Central Europe which enables to
simulate the complex dynamics when arable soil is loaded with machinery. The tool is useful
for farmers and their advisors interested in reducing compaction of their soils by simply
modifying the machinery operating conditions with the prevailing soil characteristics.

6
There are a myriad of problems associated with severely compacted soils. Reduced pore
volume and connectivity will cause a significant reduction in air and water permeability
(Alakukku et al., 2003; Pitola et al., 2005; Zhang et al., 2006; Matthews et al., 2010; Whalley
et al., 2012; Chen et al., 2014), which indirectly influences other soil and plant growth
processes that mutually link on them such as soil CO2 and O2 exchange (Simojoki et al.,
1991), nutrient uptake (Arvidsson, 1999; Alakukku, 2000), and crop-water use efficiency
(Radford et al., 2001). Other indirect effects of soil compaction are increased tillage draft
requirement (Arvidsson, 1998), increased greenhouse gases emission (Ball et al., 1999),
increased soil C:N ratio (De Neve and Hofman, 2000), and increased runoff and topsoil
erosion (Fullen, 1985). Deterioration of soil structure has a negative effect on crop yields due
to restricted root growth, less biological activity, and decrease in plant available water
(Schjonning and Rasmussen, 1994; Arvidsson and Hakansson, 1996; Hansen, 1996). For
example, a series of experiments by Stalham et al. (2007) showed that soil compaction
reduced rooting density and maximum depth of rooting as well as delayed emergence of
potato. However, some studies have shown that moderate compaction might be beneficial to
some crops (Arvidsson and Hakansson, 2014). The influence of compaction on pore
geometry is quite difficult to understand since it depends on the structure and related pore
types prior to compaction, soil composition and water content, and on the intensity of
compaction.
Surprisingly, despite the voluminous pile of published papers on soil compaction and on
measures to combat the phenomenon, little is done in practice to effectively address
compaction processes.
2.2 Methods of identifying compact soil
Identification and quantification of both natural and machinery induced soil compaction are
becoming more crucial especially for sustainable soil management. Nowadays, a variety of
methods are available to detect compact soils. Among them are the visual and tactile
assessment methods (Daniells and Larsen, 1991; McKenzie, 2001; Ball and Douglas, 2003;
Spoor et al., 2003; Batey & McKenzie, 2006; Ball et al., 2007; Shephered, 2009;), predictive
methods based on computer modeling (Smith, 1987; Tranter et al., 2007), and use of field
sensors such as soil penetrometers (Sharifi et al., 2007). The Visual Evaluation of Soil
Structure (VESS, Ball et al., 2007), which is an evolution of the Peerlkamp method
(Peerlkamp, 1967), is an example of combined visual and tactile assessment of soil quality

7
that can enable to pinpoint specific problems such as compaction, impeded drainage, and
restriction to roots. Field indicators used to identify compacted soil include waterlogging on
the surface layers, increased soil strength, reduction in visible porosity, changes to soil
structure, soil color and distribution of roots and soil moisture (Spoor et al., 2003; Batey and
McKenzie, 2006; Pulido Moncada et al., 2014). Soil penetrometers are useful tools that
measure the soil penetrability and can detect differences in soil strength within a soil profile.
Soil compaction is often measured by the increase in bulk density, except for swelling soils
where bulk density changes with changes in soil water content (Lal, 2006).
2.3 Soil compression test and precompression stress
In order to have a meaningful simulation of soil compaction susceptibility to mechanical
loads, knowledge on how pressure induced by machinery tires is distributed into the soil
profile and how the soil responds against mechanical stress is very essential. In principle,
since soil does not behave as a rigid body and essentially is a frictional material it tends to
deform once exposed to external stress. During field traffic, mainly three types of forces are
exerted on the soil - downward acting forces due to wheel load, shear forces imposed by
driven wheel and wheel slip, and vibration forces transmitted from the engine to wheel or
track (Alakukku, 1999). The exerted mechanical stresses are then resisted by the internal soil
strength (Fredlund and Vanapalli, 2002). If the exerted force is relatively higher than the soil
strength, considerable deformation of soil structure can be expected. Soil compaction can be
prevented by adjusting the number, size, width, and tire inflation pressure of the wheel load
to match the prevailing soil strength conditions (Lebert and Horn, 1991; Hakansson, 1994).
In the laboratory, the compressive strength of soil is usually measured using a triaxial or
uniaxial compression apparatus (oedometer). In an oedometer test, the lateral strain is fully
prevented by a cylindrical stiff ring in which the sample is enclosed, whereas in a triaxial test
both the compressive and shear behaviors of soil is measured. The triaxial cell apparatus
allows for applying an axial vertical stress and lateral confining stress by means of a piston
and hydrostatic pressure, respectively. However, since oedometer tests are less time-
consuming and easier to use than triaxial tests, they are widely used in soil mechanics. The
in-situ plate sinkage test (PST) is commonly used in the field, but it is expensive and time
consuming (Mosaddeghi et al., 2003). Also, Mosaddeghi et al. (2006) showed that PCS is
significantly lower when measured under a confined compression test than that measured by
PST. They attributed the difference in PCS values to possible distortion of the stress-strain

8
curve measured in the confined compression test as a result of sampling disturbance and
boundary conditions. Considering a same density and water content, the recently disturbed
soil may have lower strength than undisturbed soil since some bonds between the particles
are broken in disturbed samples (Pytka et al., 1995).
On the other hand, Earl (1997) reported that data from PST are almost comparable to those
obtained from confined compression test at stresses lower than 300 kPa. Alexandrou and Earl
(1995) pointed out that for stresses higher than 300 kPa, the soil deformation exhibited by the
further downward movement of the plate cannot be attributed to compaction anymore but is a
result of extra lateral deformation of soil. Moreover, Dawidowski et al. (2001) and Keller et
al. (2004) measured PCS by using PST apparatus and oedometer, respectively, and they
concluded that the compression values derived from PST and oedometer did generally not
differ significantly from one another. Although laboratory tests can never mimic exactly the
mechanical stress as well as the air and water drainage situation in the soil environment of the
field, an isotropic strain state appearing during uniaxial testing on soil cores and assuming
that lateral strains are negligible in the subsoil (Koolen and Kuipers, 1983), the oedometer
test can be considered a sufficiently good approximation of the strain state in the subsoil
under a running wheel.
Results of soil compression tests are normally presented in terms of stress-strain
relationships. Change in soil volume, either expressed as void ratio or dry bulk density, are
plotted against the corresponding applied stresses. A curve is then fitted to the set of points
and the soil recompression line (RCL), virgin compression line (VCL), and point of
maximum curvature are drawn manually or by using computer programs. Finally, important
soil mechanical parameters such as compression index (Cc, slope of the VCL) and PCS are
determined.
2.3.1 Methods of calculating PCS from soil compression curve
There are several procedures presented in literature to determine PCS from the semi-
logarithmic type of soil compression curve (Dias and Peirce, 1995; Arvidsson and Keller,
2004; Baumgartl and Koch, 2004; Gregory et al., 2006; Cavalieri et al., 2008). Among these
methods, the procedure based on Casagandre (1936) that was developed empirically to
determine a preconsolidation stress (which originated from civil engineering), may be
regarded as a standard method. According to this method, if one draws two straight lines

9
(tangent and parallel to the x-axis) at the point of maximum curvature in the stress-strain
curve, the PCS can be found as the point of intersection of the bisector of the angle between
these two lines and the extended virgin compression line. However, the original Casagandre
method is purely graphical and therefore the visual determination can be subjective and scale-
dependent. The method is even more problematic when the compression curve is less
distinguished or does not show a clear bend as demonstrated by gradual transition between
recompression curve and VCL (Berli, 2001). Schmertmann and Asce (1955) had similar
observation and they suggested to use Casagandre’s method for tests with a steep VCL slope
and a clearly defined point of maximum curvature. Dawidowski and Koolen (1994) found a
way to transform the graphical method of Casagandre into a computerized method by
developing a mathematical procedure to approximate PCS. They tested their method on
undisturbed samples which were subjected to uniaxial compression using universal
compression testing machine and their results showed that their mathematical method can
also be applied to compressive curves with relatively small curvature.
Several options have been suggested on fitting mathematical equations to data points in the
compressive curve such as hyperbolic (Koolen, 1974), logarithmic (Bailey et al., 1986),
fourth-grade polynomial (Arvidsson and Keller, 2004), or a continuous S-shaped function
based on the hydraulic model of van Genuchten (Baumgartl and Kock, 2004). For instance,
the fitting method of Arvidsson and Keller (2004) was carried out mathematically where the
first and second derivative of the fitted polynomial curve corresponds to the tangent of the
line and the point of maximum curvature, respectively. Baumgartl and Kock (2004) modeled
the volume change with stress using the van Genuchten equation where the parameters α and
n of the model were calculated by using the software RETC (U.S. Salinity Laboratory, 1999).
Aside from Casagandre’s method, some researchers used other methods to estimate PCS such
as the stress ordinate at the intersection of VCL and regression line fitted on either the first 2,
3, 4 or 5 points of the compression curve (Dias Junior and Pierce, 1995), intersection of VCL
and x-axis at zero strain (Dias Junior and Pierce, 1995; McBride and Joosse, 1996), and stress
at predefined strain (Arvidsson and Keller, 2004). However, different methods used to
approximate PCS will yield significantly different values and therefore they are not
interchangeable (Arvidsson and Keller, 2004; Cavalieri et al., 2008).

10
2.3.2 Factors influencing soil deformation behavior during compression test
The uniaxial compression test is widely used to study the compressive behavior of arable
soils, but not in a standardized way. Several factors such as sample dimension, initial soil
conditions, compression method (initial stress, loading duration, loading increments), and
laboratory condition can influence the test results and eventually the shape of the soil
compression curve. During a compression test, the main sources of errors that can be
attributed to sample ring dimensions are ring wall-soil friction, unevenness and disturbance
of the upper and lower surface, and nonsuit of the sample at the cylinder walls (Muhs &
Kany, 1954; Leussink, 1954; Schmidbauer, 1954). Avoiding using high cores with small
diameter can minimize sample disturbance and sidewall friction. Normally, a ratio of
diameter (d) to height (h) of about d/h = 5 is functional and would yield an error within
reasonable limits.
Soil moisture content is considered the most sensitive and dominant property affecting soil
strength (Dawidowski and Lerink, 1990). In general, the strength of an unsaturated soil drops
rapidly when soil moisture content increases. As the soil dries the VCL is shifted up to the
right, indicating that more stress is needed to deform the soil.
In soil mechanics, most common oedometer testing procedure is the incremental loading
where each increment of load is applied instantaneously and is allowed to act long enough to
complete primary consolidation (Terzaghi et al, 1996). Bakker et al. (1995) suggested that it
is crucial to establish soil mechanical parameters with loading rates similar to those expected
in the field. For this purpose, different authors used a loading time of approximately 20 sec
(Etana and Comia, 1995), 60 sec (Angers, 1990), 10 min (O’Sullivan), and 30 min (Larson et
al., 1980; Keller and et al., 2011). Koolen (1974) recommended a uniaxial test with constant-
rate-of-strain. where the soil is subjected to a constant rate of axial deformation.
2.4 Soil quality indicators of soil degradation by compaction
Soil structural quality indicators serves as a yardstick of soil susceptibility to degradation by
compaction. Soil structural quality can be determined by evaluation of some soil functions
and soil physical properties that are directly affected by soil compaction. Lebert et al. (2004),
as cited by Lebert et al. (2007), suggested a list of possible indicators like air capacity, dry
bulk density, air permeability, oxygen diffusivity, available water capacity, water
conductivity, root length density, penetration resistance, and visual classification of soil

11
morphology. Some of these parameters were selected by ENVASSO project as potential
indicators for soil susceptibility to compaction, such as bulk density, air capacity, and
saturated hydraulic conductivity (Huber et al., 2008). Lebert (2010) also used these indicators
to assess the vulnerability to compaction of agricultural subsoils in Germany. In Netherlands,
van den Akker and Hoogland (2011) assessed the susceptibility of agricultural soils to
compaction as a function of texture and packing density.
2.5 Indirect methods of PCS determination by pedotransfer functions
While direct measurements are apparently the most exact determination of PCS, they are
often time-consuming and laborious, require expensive and sophisticated devices and skilled
technicians, and are impractical for wide-scale applications due to large spatio-temporal
variability of soil properties. In addition, obtaining equivalent soil mechanical measures in a
laboratory setting requires major sampling, resulting in a destructive investigation of the soil
(Carter and Gregorich, 2008). Accurate and rapid quantification of such soil property without
adding much complexity and financial burdens to the users should be taken into account
especially for developing countries. Because of these impediments, soil scientists devised an
alternative to direct approximation of soil properties that are difficult to measure - a more
simpler and rapid but less expensive indirect method known as pedotransfer functions (PTF).
2.5.1 Pedotransfer functions
The Encyclopedia of Agrophysics (2011) defined pedotransfer functions as “equations or
algorithms expressing relationship between soil properties different in difficulty of their
measurement or their availability”. The basic premise of pedotransfer functions is that since
soil properties and processes are mutually linked, there must be a specific set of soil
properties explicitly determining other properties. Although the concept of PTF has long been
used in the past to estimate soil properties that are hard to determine, the term was coined for
the first time by Bouma (1989) and since then has gained worldwide recognition as a new
field of research in soil science, water resources, agronomy, and environmental sciences
(Tranter et al., 2006).
Strong and renewed interest in empirical PTFs is mainly a result of new methods and tools
becoming available for PTF development including statistical regression, data mining
techniques, and machine learning algorithms. The advantages of using statistical regression

12
are that rigorous estimates of the statistics of the predicted values and the coefficients in the
PTF equations can be obtained. However, constructing PTFs using statistical regression
requires a lot of iteration steps, such as deciding which properties are to be used as predictors
and which regression equation to use (Pachepsky and van Genuchten, 2011). For this reason,
PTF development recently has employed data mining techniques and machine learning
algorithms wherein appropriate predictors and equations are automatically selected (Botula et
al., 2012).
2.5.2 Existing PTFs used for predicting PCS and other soil mechanical properties
Though most of the PTFs reported in literature pertain to the estimation of soil water
retention and saturated hydraulic conductivity (see review paper of Botula et al., 2014), a
mathematical function can also be used in predicting soil mechanical properties associated
with compaction. To date a handful of research works were already done to estimate the most
important mechanical parameters widely used in soil compaction models (Keller et al., 2007).
A summary of these so-called PTFs are shown in Table 1. Soil initial bulk density, water
content or tension, clay content, and OM content were seemingly used in most of these listed
PTFs as predictor for PCS and compression index (Cc), except Kirby (1991) who investigated
the dependence of PCS and Cc of Australian Vertisols on the state of the soil, of which
liquidity index and void ratio emerged as good predictor. For instance, Gupta and Larson
(1982) predicted Cc based on clay content. Lebert and Horn (1991) developed regression
equations with high degree of significance (r2 > 0.7) to predict soil strength for two water
tensions (pF 1.8 and pF 2.5, with pF being the log of tension with the latte expressed in cm)
as a function of soil bulk density, shear strength parameters (cohesion c and angle of internal
friction ), air capacity, available and non-available water capacity, saturated hydraulic
conductivity, and OM content. Apparently based on these equations, the effect of moisture
content on soil strength is clearly defined. The drier the soil is, the stronger it gets, but its
stability decreases when soil gets wetter. Over a decade later, these PTFs of Lebert and Horn
(1991) were used in Germany as an indicator for the identification of harmful subsoil
compaction (Horn and Fleige, 2003, 2009). Fritton (2008) validated and extended the use of
Lebert-Horn PTFs to estimate the PCS and maximum depth of compaction of agricultural
soils in Pennsylvania, USA. Also, Van De Vreken et al. (2009) used them to map the risk of
soil compaction in the Flemish Region of Belgium.

13
Imhoff et al. (2004) investigated the compressive behavior of a Brazilian Hapludox and
found a significant multiple correlation (r2 = 0.70) between PCS and initial bulk density,
water content, and clay content. A similar observation was also reported by Saffih-Hdadi et
al. (2009) and An et al. (2015) when they investigated the compaction susceptibility of
different soils in France and China, respectively. The findings of Imhoff et al. (2004), Saffih-
Hdadi et al. (2009), and An et al. (2015) highlighted the clear effect of initial soil water
content, initial dry bulk density, and soil texture on PCS. They showed that PCS was
positively correlated with soil bulk density and negatively correlated with initial soil water
content. A positive correlation between PCS and soil bulk density was also reported earlier
by Lebert and Horn (1991), Alexandrou and Earl (1998), Canarache et al. (2000), Silva et al.
(2000,2002), whereas a significant negative correlation between PCS and water content was
also observed by Alexandrou and Early (1998), Defossez et al. (2003), Imhoff et al. (2004)
and Mosaddeghi et al. (2006).
However, Keller et al. (2007) noted that the predictive performances of some of these
existing PTFs are not well evaluated and their reliabilities are not well known. Therefore,
those PTFs which are based on native data, provide flexibility of appending reference
databases, and with acceptable predictive performance, should be preferred than generic
PTFs (Patil et al., 2012).

14
Table 1. Existing pedotransfer functions used to predict PCS and other soil mechanical properties
Source Property Predictors Soil Class N FTP equations
R2
Gupta and
Larson
(1982)
Compression
index, Cc
Clay content, %
clay (g 100 g-1)
Expanding clay
Non-expanding
clay
54
54
Cc = 2.033 x 10⁻¹ + 1.423 x 10⁻² (%clay) – 1.447 x 10⁻⁴ (%clay)
Cc = 1.845 x 10⁻¹ + 1.205 x 10⁻² (%clay) – 1.108 x 10⁻⁴ (%clay)
0.79
0.89
Lebert
and Horn
(1991)
Precompression
stress, PCS
Internal friction, Ø
(ᴼ); cohesion, c
(kPa); bulk density,
ρb (Mg m-3); air
capacity, Lk (%,
v/v); available
water capacity, nFk
(%, v/v); non-
available water
capacity, TW (%,
v/v); saturated
hydraulic
conductivity, kf
(x103 cm s-1);
organic matter, OM
(g 100 g-1)
Sand
Sandy Loam
Silt
Clay and Clay
Loam (<35%)
Clay and Clay
Loam (>35%)
307
PCS (pF=1.8) = 438.10ρb – 0.0008(Ø1.8)3 – 3.14TW – 0.11(nFk1.8)2 – 465.60
PCS (pF=2.5) = 410.75ρb – 0.0007(Ø2.5)3 – 3.41TW – 0.35(nFk2.5)2 – 384.71
PCS (pF = 1.8) = 169.30ρb - 29.03(OM)0.5 + 6.45kf + 32.18 log(C1.8) – 9.44 Ø1.8
+ 27.25 sin(TW) + 119.74 log(nFk1.8) + 19.51
PCS (pF = 2.5) = 89.50ρb – 23.99(OM)0.5 + 2.89kf +125.76 log(C2.5) – 1.14 Ø2.5
+ 26.90 sin(TW) + 51.46 log(nFk1.8) + 77.25
PCS (pF = 1.8) =374.15ρb - 4.10OM + 3.38Lk1.8 - 1.58(kf)-0.5 + 1.79C1.8 + 1.09(TW)
- 6.37(Ø 1.8)0.67 + 0.088(nFk1.8)2 - 472.77
PCS (pF = 2.5) =460.71ρb – 20.33OM + 9.088Lk2.5 – 2.38(kf)-0.5 + 2.86C2.5 +
4.50(TW) - 20.96(Ø 2.5)0.67 + 0.304(nFk2.5)2 – 610.62
PCS (pF = 1.8) =0.843ρb – 0.544(kf)0.33 + 0.022TW + 7.03(C1.8)-1 + 0.024 Ø 1.8
– 0.015nFk1.8 + 0.725
PCS (pF = 2.5) =0.844ρb – 0.456(kf)0.33 + 0.026TW + 12.88(C2.5)-1 + 0.003 Ø 2.5
– 0.016nFk2.5 + 1.419
PCS (pF = 1.8) =4.59ρb – 1.02OM – 16.43(kf)0.33 + 0.31TW – 1.57nFk1.8 + 3.55C1,8
+ 1.18 Ø1.8 – 18.03
PCS (pF = 2.5) =70.65ρb – 0.55OM – 7.01(kf)0.33 + 1.32TW +– 1.08nFk2.5 + 1.72C2.5
+ 1.05 Ø2.5 – 100.94
0.778
0.710
0.828
0.874
0.765
0.847
0.808
0.804
0.774
0.763

15
Table 2. Existing pedotransfer functions used to predict PCS and other soil mechanical properties (continued)
Source Property Predictors Soil Class N FTP equations
R2
Kirby
(1991)
Precompression
Stress, PCS
Compression
index, Cc
Liquid index IL; void ratio at pc,
epc; saturation at epc, Sepc
Void ratio at pc, epc; saturation at
epc, Sepc
All soils
All soils
170
PCS = exp(5.856 – 4.352 IL – 1.074 epc)
Cc = 0.229 + 0.1736epc – 0.400Sepc
0.682
0.514
Imhoff et
al. (2004)
Precompression
Stress, PCS
Compression
index, Cc
Clay content, CC (g 100 g-1);
initial bulk density, ρb (Mg m-3);
water content, w (g g-1)
All soils
CC < 29.42
CC > 29.42
50
PCS = -566.764 + 442.891 ρb + 4.338CC – 773.057w
Cc = 0.248 + 0.006CC – 0.121ρb
Cc = 0.416 – 0.121ρb
0.70
0.77
0.77
Saffih
Hdadi et
al. (2009)
Precompression
Stress, PCS
Compression
Index, Cc
Initial water content, w (% g g-1);
initial bulk density, ρb (Mg m-3)
Very fine
Fine
Medium fine
Medium
Coarse
PCS = 7.71 + 112.21ρb – 2.82w
Cc = 2.37 – 1.18ρb – 0.017w
PCS = 4.19 + 202.54ρb – 10.92w
Cc = 1.85 – 0.91ρb – 0.012w
PCS = -223.71 + 347.47ρb – 7.93w
Cc = 1.36 – 0.59ρb – 0.010w
PCS = -136.87 + 155.19ρb
Cc = 1.27 – 0.628ρb – 0.006w
PCS = -220.68 + 191.45ρb – 2.77w
Cc = 1.36 – 0.77ρb – 0.005w
0.88
0.95
0.95
0.98
0.76
0.78
0.5
0.74
0.57
0.87

16
3. MATERIALS AND METHODS
3.1 Study area
The study area East Flanders is found at the Dutch-speaking northern portion of Belgium
(Figure 1). Geographically, Flanders is generally flat, agriculturally fertile, densely populated
and highly urbanized area. It shares its borders with France in the west, the Netherlands in the
north and east, and Wallonia in the south. The climate is maritime temperate with significant
precipitation in all seasons (Koppen climate classification: Cfb; average temperature is 3 °C
in January and 21 °C in July; the average precipitation is 65 mm in January and 78 mm in
July). Flanders has two main geographical regions – the coastal Yser basin plain (consists
mainly of sand dunes and clayey alluvial soils in the polders) in the north-west and a central
plain. The central plain consists of the lowermost Scheldt basin (smooth, slowly rising fertile
area irrigated by many waterways), the Campine region (having sandy soils) and the Meuse
basin.
Figure 1. Geographical locations of the sampling fields (red crosshairs)

17
3.2 Field sampling and soil analysis
In this study, two different datasets were established. For dataset one, a total of 126 intact
cores were taken for determining PCS and another 41 cores was taken to determine soil
hydraulic properties at the same location. Those cores were already taken in 2012-2013, prior
to this dissertation. Some information about sampling and soil tests will be provided in
section 3.5. For dataset two, a total of 36 cores of undisturbed soils were taken from the
center (40 to 45 cm depth) of a cropped field (spring barley) near Ghent, Belgium using a
stiff confining PVC tubes with a sharpened edge. A 2m x 2m pit was dug to a depth of 70 cm
and undisturbed samples were taken manually by pushing the sharpened side of the PVC
cylinder vertically into the horizontal soil surface using a hammer and improvised tube
holder. Plastic caps were used to seal and protect the soil samples inside the cylinders from
disturbance during transportation. Prior to the compression test, all intact/undisturbed soil
samples were placed on top of sandboxes/pressure plates and gradually subjected to either of
three preset matric potentials of -6 kPa (pF=1.8), -10 kPa (pF=2) and -33 kPa (pF=2.5).
Basic soil properties such as dry bulk density, porosity, organic matter content, clay content,
particle size distribution, and saturated hydraulic conductivity (Ksat) were determined using
standard methods used in the Laboratory of Soil Physics, Ghent University. Sand, silt and
clay content was determined using the sieve-pipette method. For OM content and bulk
density, the loss-on ignition method (temperature at 550ᴼ C) and oven-drying method (Blake
and Hartge, 1986) were used, respectively.
3.3 Laboratory test
The experiment was composed of nine treatments (three different matric potentials vs. three
different loading durations) with four replications per treatment (except when otherwise
mentioned). The uniaxial confined compression tests using a standard oedometer was done at
the Laboratory of Geotechnics, Ghent University. The oedometer test simulates vertical stress
applied to soil in the field by a tire. The soil sample (approximately 63.5 mm in diameter,
25.4 mm in height) was confined in a stiff ring and loaded in a vertical direction. The stiff
ring prevented the sample from lateral deformation. During the compression test, axial stress
was applied and the resulting displacement was measured.

18
3.3.1 Apparatus
The oedometer contained a loading device, a compression cell, and devices to record the
applied stress and the resulting displacement (Figure 2). The uniaxial stress in vertical
direction was applied to the soil specimen by dead weights. The compression cell was a
circular metal ring which enclosed the soil between two porous plates.
Figure 2. Standard oedometer used for uniaxial confined compression test.
3.3.2 Preparation of soil samples
Undisturbed soil samples conditioned to different matric potentials (-6, -10 and -33 kPa) were
cut directly from a larger soil core and inserted into the oedometer ring/cell. Excess soil was
carefully carved away. Porous stones were placed beneath and above the soil sample to
ensure free drainage. A rigid loading cap was placed on top of the upper porous stone and
then the assembly was placed into the oedometer loading frame. [The loading frame is
designed to load the specimen through a yoke assembly and one of three alternative beam
ratios. The beam is fitted with a counterbalance weight and beam support jack. The cell
platform is fitted with a central spigot to ensure accurate centering of the cell under the
loading yoke].

19
3.3.3 Compression tests
Sequential (stepwise) loading of the soil cores was carried out as described by Eriksson
(1982). A sequence of stress levels was applied to the soil, each being double the previous
value (e.g. 12, 25, 50, 100, 200, 400, and 800 kPa). Stress corresponding to the first stress
level was applied and maintained for the desired loading duration per stress level (T1 = 1 min,
T2 = 10 min, and T3 = 30 min). The step was repeated for the next stress level until the last
stress level was reached. The compression or vertical displacement (accuracy ± 0.001 mm) of
the soil sample at the end of each loading was recorded by a potentiometric displacement
transducer. Also, the pore water pressures were measured by a micro-tensiometer that was
inserted vertically into the soil sample through the hole in the lower sinter metal plate. To
avoid compacted and disturbed zones around the tensiometer tip, a hole of the size of the
tensiometer tip was bored with a hollow drill. After a maximum stress level was applied, the
soil sample was unloaded by decreasing the weights incrementally.
3.4 Determination of PCS
Initial wet mass of the samples (Ms) was determined in the oedometer ring by measuring the
mass of the ring with sample and subtracting the tare mass of the ring. Initial height (ho) of
the samples was determined to the nearest 0.025 mm (0.001 in) by taking the average of at
least four evenly spaced measurements over the top and bottom surfaces of the sample using
a dial comparator. Initial volume of the samples (V) was computed to the nearest 0.25 cm3
(0.015 in3) from the diameter of the ring and initial sample height.
Based on the results of the compression test, a stress-strain relationship for each sample was
presented graphically by plotting the logarithm of the applied stress (log-σ) and the
corresponding volumetric strain (expressed as void ratio, e) at the x-axis and y-axis,
respectively. Void ratio is calculated from the measured displacement (Δh) as
2
0( ) ( )( ) 1 1s s
s s
V h r h he h
M M
(1)
where V, r, Ms and h0 are the volume, radius, and initial height of the cylindrical soil sample,
respectively.

20
From the stress-strain curve the compression index (Cc, slope of the VCL) was calculated by
)log( ''
1
1
vav
ac
eeC
(2)
where e is the void ratio and σ the applied normal stress.
The following methods were used to determine the PCS values:
1) C_DK: Casagandre’s graphical method
2) AK_2: stress at the intersection of VCL with the x-axis at strain = 0
3) AK_3: stress at a predefined strain of 2.5%
4) AK_4: stress at the intercept of the VCL and a regression line with the first two points
of the curve
5) AK_5: stress at the intercept of the VCL and regression line with the first three points
of the curve
6) Gea_3: fitting of three-parameter Gompertz type equation to stress-strain curve
7) Gea_4: fitting of four-parameter Gompertz type equation.
The C_DK method was used by Davidowski and Koolen (1974) based on Casagandre (1930)
graphical procedure. AK_2, AK_3, AK_4, and AK_5 corresponds to the four methods used
by Arvidsson and Keller (2004). Gea_3 and Gea_4 are the modified (3 parameters) and the
original (4 parameters) Gompertz function used by Gregory et al. (2006), respectively.
For curve fitting in method 1 to 5, the fourth-order polynomial function (Eq. 3) was used
where first and second derivatives (Eq. 4 and 5) correspond to tangent of the line and point of
maximum curvature in the stress-strain curve:
4 3 2
10 10 10 10(log ) (log ) (log ) (log )e a PCS b PCS c PCS f PCS g (3)
3 2
10 10 10
10
4 (log ) 3 (log ) 2 (log )(log )
dea PCS b PCS c PCS f
d PCS (4)
22
10 102
10
12 (log ) 6 (log ) 2(log )
d ea PCS b PCS c
d PCS (5)

21
For method 6 and 7, the first (Eq. 7) and second derivatives (Eq. 8) of the Gompertz function
(Eq. 6) were calculated as follows:
10exp exp( ((log ) ))e a c b PCS m (6)
10 10
10
exp( exp( ((log ) ))) exp( ((log ) ))(log )
debc b PCS m x b PCS m
d PCS (7)
22
102
10
10 10
exp( exp( ((log ) )))(log )
exp( ((log ) )) exp( ((log ) )) 1
d eb c b PCS m x
d PCS
b PCS m x b PCS m
(8)
All the calculations were executed using Python scripts developed by Soil Physics Group,
Ghent University.
3.5 Development of pedotransfer functions
A separate dataset available at the Soil Physics Group was used to develop PTFs. The dataset
contains PCS data of 126 soil samples collected from seven sampling sites within Flanders,
Belgium with varying texture (Figure 3), bulk density, particle size distribution (expressed as
% clay, sand and silt), organic carbon content, land use, degree of compaction, and wetness.
It covers the seven major soil textural classes according to the Belgian Textural
Classification, i.e., Z (sand), S (loamy sand), P (light sandy loam), L (sandy loam), A (silt
loam), E (clay), and U (heavy clay). More details is available on this link:
http://www.labsoilscience.ugent.be/docs/pdf/soilmaplegend.pdf. At each site samples were
taken at three different locations (headland of cropland, central within cropland, grassland)
from the subsoil at depths of 40 and 70 cm. Each sample contains a set of different PCS
values which corresponds to the seven methods that have been used to derive PCS from the
stress-strain curve.
The PTFs were developed using a stepwise multiple linear regression (SMLR) which is a
combination of forward and backward selection techniques. The R software (R Foundation
for Statistical Computing, 2015) was used to develop the PTFs. The selection of the
predictors to develop the PTFs was done on a semi-hierarchical basis and the stepwise
regression procedure helped select the significant ones out of the available predictors.
22
Figure 3. Variation of clay, silt, and sand content in the dataset used to develop PTFs.
To evaluate the predictive ability of the developed PTFs, three statistical measures were used
- the mean absolute error (MAE), the root mean square error (RMSE) and coefficient of
determination (R²).
MAE = 1
1( )
t
i i
N
p m
it
PCS PCSN
(9)
RMSE = 2
1
1( )
t
i i
N
p m
it
PCS PCSN
(10)
R² =
2
1
2 2
1
( )( )
( ) ( )
t
i i i i
t
i i i i
N
p p m m
i
N
p p m m
i
PCS PCS PCS PCS
PCS PCS PCS PCS
(11)
where piPCS is the predicted precompression stress for soil sample i (kPa), miPCS is the
measured precompression stress for soil sample i (kPa), and Nt is the number of samples in
the test dataset.
0
10
20
30
40
50
60
70
80
90
100
0 10 20 30 40 50 60 70 80 90 100
% c
lay
% sand
clay
siltyclay
siltyclay loam
silt loam
silt
loam
sandy loam loamysand
sand
sandy clay loam
sandy
clay loam

23
3.6 Measurement of soil hydraulic properties
The Ksat was determined using the falling head (for less permeable soils) and constant head
(for highly permeable soils) permeameter tests with a closed system (Eijelkamp Agrisearch
Equipment, the Netherlands). Soil water retention curves (SWRC) was constructed using the
data from soil water contents at eight different water potentials. The sand box apparatus
(Eijelkamp Agrisearch Equipment, the Netherlands) was used to drain the soil at -10, -30, -
50, -70, and -100 cm water potentials. For water potentials of 1/3, 1, and 15 bars the pressure
plates (Soil Moisture Equipment, Santa Barbara, C.A., USA) were used based on the
procedure described by (Cornelis et al., 2005). The RETC software was used to predict Ksat
and SWRC based on the parametric model of van Genuchten (1990).
3.7 Determination of soil structural quality and vulnerability to compaction
In this study, soil quality index (SQI), susceptibility to compaction index (SCI), and
vulnerability to compaction index (VCI) were determined. For determination of SQI, a set of
soil parameters proposed by Lebert et al. (2007) were used to detect soil structure damage by
compaction which includes packing density, air capacity, and saturated hydraulic
conductivity (Table 2). A soil structure damage is possible when all these three parameters
exceed the threshold limits of a sufficient soil structure at the same time (AC < 5% vol., Ksat
< 10 cm/d and PD > 1.75 g cm-3).
Table 3. Classification of soil structure quality (adopted from Lebert, 2010). Maximum
threshold for packing density was modified.
a) Packing
density
(g cm-3)
b) Air
capacity
(% vol.)
c) Sat. water
conductivity
(cm/d)
Index
Score
Category Class of soil
structure quality
≥ 1.75 < 5 < 10 5 very low Round off from
average of classes
a), b), c) =
(a + b + c) / 3
1.7 - < 1.75 5 - < 7 10 - < 40 4 low
1.6 - < 1.7 7 - < 13 40 - < 100 3 medium
1.4 - < 1.6 13 - < 26 100 -< 300 2 high
< 1.4 ≥ 26 ≥ 300 1 very high
Classification of susceptibility to compaction based on PCS values is shown in Table 3. The
lower the PCS the higher the susceptibility to mechanical compaction. Finally, Table 4 was
used to classify the soil vulnerability to compaction based on principle that soil with the
lowest structural quality and highest susceptibility to compaction is the most vulnerable to

24
further mechanical compaction. Vulnerability to compaction was classified into very high =
5, high = 4, medium = 3, low = 2, and very low =1.
Table 4. Classification of soil structure quality (adopted from Lebert, 2010). Maximum
threshold and unit for packing density was modified.
Precompression
Stress (kPa)
Index Score
Name of class
Susceptibility to compaction
Category
< 80 5 very low very high
80 - < 120 4 low high
120 - < 160 3 medium medium
160 - < 200 2 high low
≥ 200 1 very high very low
Table 5. Classification of soil structure quality (adopted from Lebert, 2010).
Soil structural
quality (SQI)
Index Score
Susceptibility to
compaction (SCI)
Index Score
Index Score
(SQI + SCI)/2
Vulnerability to
compaction
Category
5 5 5 very high
4 4 4 high
3 3 3 medium
2 2 2 low
1 1 1 very low
3.8 Statistical analysis
R software (R Foundation for Statistical Computing, 2015) was used for data processing,
graphical presentations, and statistical analysis. Normality tests, analysis of variance
(ANOVA), and Tukey’s HSD test (at P < 0.05) were performed to analyze statistical
differences and to discriminate between means. Correlation analysis was carried out to study
the interactive effects of the levels of loading duration and water potential on PCS values.

25
4. RESULTS AND DISCUSSIONS
4.1 Soil quality assessment and risk of compaction
Basic properties of soils (dataset one) from seven locations evaluated by this study are
summarized in Table 6. A total of 126 soil samples from different land use (cropland and
grassland) and soil depths (40 and 70 cm) were brought to the lab for soil analysis. Most of
the soil samples were classified as silt loam and loamy sand according to USDA
classification. In terms of soil quality, bulk density (BD), air-filled pore volume or air
capacity (AC), and saturated hydraulic conductivity (Ksat) were used as primary indicators.
Acceptability, practicability, relevance for policy-makers, and usefulness for users were the
main criteria used for selection of these indicators (Huber et al., 2008). BD which can be
measured directly in the field is commonly used as primary indicator of soil packing density
and compaction. It is also a good indicator of soil macro-porosity. On the other hand, Ksat or
permeability integrates the importance of soil structure, oxygen diffusion capacity,
rootability, and soil biological activity (Huber et al., 2008). Carpenter et al. (1985) supposed
that the most detrimental effect of soil compaction on soil physical properties is the drastic
reduction in hydraulic conductivity that may cause excessive soil erosion and crop yield
reduction due to reduced infiltration, increase run-off and poor drainage. In addition to the
primary indicators, the structural quality index (StI) as an indicator for soil structural
degradation associated with organic carbon depletion was included (Pieri, 1992; Moncada et
al., 2013).
Based on the result of soil analysis, higher BD can be found in the upper part (40 cm) of the
subsoil in croplands, whereas in grasslands the BD is higher in the lower part (70 cm) of the
subsoil. In arable soils, the upper part of the subsoil, also called plough pan layer or
restricting layer, is the zone of most importance for identifying compaction (Huber et al.,
2008). In croplands, the higher BD in upper part of the subsoil can be caused by tractor tires
driving directly on the subsoil during ploughing or due to the pressures transmitted by heavy
wheel loads from topsoil down to the subsoil (Huber et al., 2008). However, it is important to
note that some of these soils may have inherent compacted layers such as soils that have hard
pans or cemented layers resulting from chemical precipitation of Fe, Mn, and Si.

26
In literature, a total pore volume of at least 40% is considered as a threshold for better root
penetration and oxygen supply (Hidding and van den Berg, 1961; Bakker et al., 1987; Tacket
and Pearson, 1964). This corresponds to BD of about 1.6 g cm-3 in coarse textured soils
(sands, loamy sands) with low organic matter. However, threshold values for BD also
depends on clay content and allowable soil packing density (PD). Compact soils are
characterized of having high packing density and lower air capacity. In general, a packing
density of 1.75 g cm-3 is considered as threshold value for compaction indicating detrimental
effects in the subsoil. Figure 4a shows the variability in measured BD at different clay
content where the red and green lines indicates the upper limit (PD =1.75 g cm-3) and lower
limit (PD = 1.4 g cm-3) for BD. It showed that limit for BD at any desired PD threshold tends
to decrease at higher clay content. As shown in Figure 5, most of the sites evaluated have
medium risk (1.4 > PD > 1.75) of soil compaction except those some part of Melle (CH and
GL), Wortegem (CH), and Zwalm (CC and CH). In Melle and Zwalm, the upper part of their
subsoil have higher risk (PD > 1.75 g cm3) of soil compaction (Figure 6).
Figure 4. Relationship between clay content and (a) dry bulk density and (b) saturated
hydraulic conductivity. Dash lines in red and blue corresponds to bulk density at
PD = 1.75 g cm-3 and PD = 1.4 g cm3, respectively.
Mean values of soil AC (at 6 kPa water tension) are shown in Figure 7. Lebert et al. (2007)
suggested a threshold value of < 5% for AC which can be related to soils with a very low
structural quality. All locations evaluated in this study have AC values higher than the
threshold limit and this might be due to the inherent texture of the soils. In general, loamy
sand had the largest capacity for air as they have larger pores than silt or clayey soils.
0.0
0.5
1.0
1.5
2.0
0 10 20 30
BD
(M
g/m
³)
Clay (%)
(a)
0
100
200
300
400
0 10 20 30
Ksa
t (c
m/d
ay)
Clay (%)
(b)
27
Table 6. Site characteristics and soil physical properties
Location Land
Use
Geographic
Coordinates Soil Texture
(USDA) BD
(Mg/m³)
Sand Silt Clay OC CaCO₃
(%)
Baaigem
CC 50.93° N 3.73° E Silt Loam 1.5 13.1 73.2 13.8 0.4 0.0
CH 50.93° N 3.73° E Silt Loam 1.6 12.4 74.9 12.8 0.2 0.0
GL 50.93° N 3.73° E Silt Loam 1.5 13.9 74.2 11.9 0.3 0.0
Landuit
CC 50.97° N 3.67° E Loamy Sand 1.6 81.0 12.0 7.1 0.3 0.0
CH 50.97° N 3.67° E Loamy Sand 1.6 84.5 10.5 5.0 0.6 0.1
GL 50.97° N 3.67° E Loamy Sand 1.7 86.7 8.6 4.8 0.3 0.0
Melle
CC 50.98° N 3.77° E Loam 1.6 42.0 45.3 12.7 0.2 0.1
CH 50.98° N 3.77° E Loam 1.6 38.2 46.0 15.8 0.2 0.1
GL 50.98° N 3.77° E Loam 1.7 45.5 41.4 13.2 0.2 0.0
Moortsele
CC 50.95° N 3.77° E Loamy Sand 1.6 87.3 5.1 7.7 0.1 0.0
CH 50.95° N 3.77° E Loam 1.6 62.3 23.6 14.2 0.1 0.0
GL 50.95° N 3.77° E Loamy Sand 1.5 80.6 5.9 13.5 0.1 0.1
Wortegem
CC 50.86° N 3.52° E Silt Loam 1.6 27.9 56.5 15.6 0.9 0.0
CH 50.86° N 3.52° E Silt Loam 1.7 29.6 57.4 13.1 0.6 0.0
GL 50.86° N 3.52° E Silt Loam 1.6 31.8 58.9 9.4 0.3 0.4
Zevergem
CC 50.96° N 3.68° E Silt Loam 1.5 29.2 53.5 17.3 0.4 4.3
CH 50.96° N 3.68° E Silt Loam 1.4 15.3 57.5 27.3 0.8 4.5
GL 50.96° N 3.69° E Silt Loam 1.4 23.5 61.5 15.1 0.5 3.8
Zwalm
CC 50.89° N 3.73° E Silt Loam 1.6 15.7 70.1 14.2 0.3 0.0
CH 50.88° N 3.73° E Silt Loam 1.7 25.3 61.9 12.9 0.2 7.8
GL 50.88° N 3.73° E Silt Loam 1.5 24.4 60.8 14.9 0.3 0.0 CC: cropland center, CH: cropland headland, GL: grassland, OC: soil organic carbon, CaCO3: calcium carbonate content,
BD: dry bulk density
Saturated hydraulic conductivity is a direct measure of infiltration capacity and filtering
capability of the soil. A threshold value of < 10 cm day-1 is commonly used especially for
stagnic horizons in Western European soils (Werner and Paul, 1999; Lebert et al., 2007;
Bhattacharya, 2014). Figure 8 shows the mean Ksat values of different land use types in all
locations. Most sites except Moortsele and Zwalm have recorded Ksat lower than 10 cm day-
1. Also in those areas, it seems that Ksat was always higher in the headlands than the center of
the field. This is not the case in Moortsele and Zwalm where Ksat was higher at cropland
center compared to headlands. Due to very high variance in Ksat measurement, no
generalization can be made with regards to the observed differences in Ksat values.

28
Figure 5. Average packing density (PD) for different locations and land use. Dash lines in red
and blue indicates a threshold value for high risk (PD > 1.75 g cm-3) and low risk
(<1.4 g cm-3) in soil degradation by compaction, respectively.
Figure 6. Average packing density (PD) for different locations and soil depth. Dash lines in
red and blue indicates a threshold value for high risk (PD > 1.75 g cm-3) and low
risk (<1.4 g cm-3) in soil degradation by compaction, respectively.
Figure 7. Average air capacity (% vol.) for different locations and land use. Dash line in red
indicates a threshold value (AC < 5% vol.).
1.0
1.2
1.4
1.6
1.8
2.0
Baaigem Landuit Melle Moortsele Wortegem Zevergem Zwalm
PD
(g
/cm
³)CC CH GL
1.0
1.2
1.4
1.6
1.8
2.0
Baaigem Landuit Melle Moortsele Wortegem Zevergem Zwalm
PD
(g
/cm
³)
40 cm 70 cm
0
10
20
30
40
50
Baaigem Landuit Melle Moortsele Wortegem Zevergem Zwalm
AC (%
vol.
)
CC CH GL
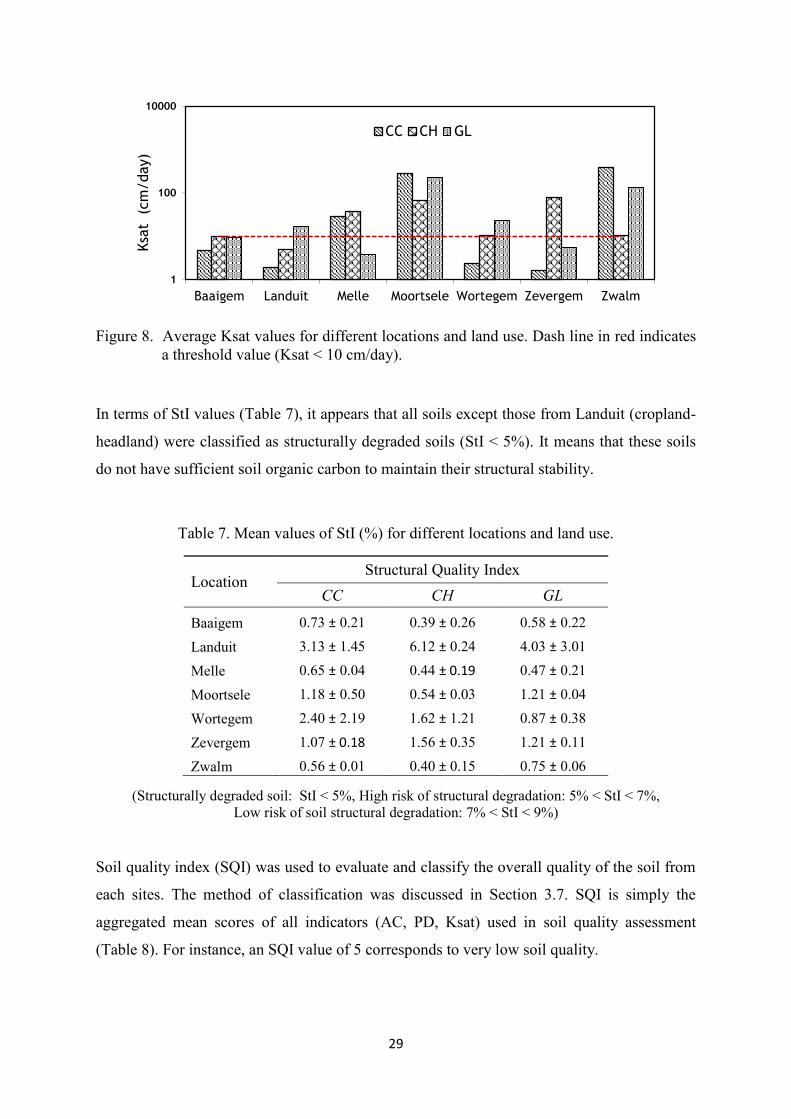
29
Figure 8. Average Ksat values for different locations and land use. Dash line in red indicates
a threshold value (Ksat < 10 cm/day).
In terms of StI values (Table 7), it appears that all soils except those from Landuit (cropland-
headland) were classified as structurally degraded soils (StI < 5%). It means that these soils
do not have sufficient soil organic carbon to maintain their structural stability.
Table 7. Mean values of StI (%) for different locations and land use.
Location Structural Quality Index
CC CH GL
Baaigem 0.73 ± 0.21 0.39 ± 0.26 0.58 ± 0.22
Landuit 3.13 ± 1.45 6.12 ± 0.24 4.03 ± 3.01
Melle 0.65 ± 0.04 0.44 ± 0.19 0.47 ± 0.21
Moortsele 1.18 ± 0.50 0.54 ± 0.03 1.21 ± 0.04
Wortegem 2.40 ± 2.19 1.62 ± 1.21 0.87 ± 0.38
Zevergem 1.07 ± 0.18 1.56 ± 0.35 1.21 ± 0.11
Zwalm 0.56 ± 0.01 0.40 ± 0.15 0.75 ± 0.06
(Structurally degraded soil: StI < 5%, High risk of structural degradation: 5% < StI < 7%,
Low risk of soil structural degradation: 7% < StI < 9%)
Soil quality index (SQI) was used to evaluate and classify the overall quality of the soil from
each sites. The method of classification was discussed in Section 3.7. SQI is simply the
aggregated mean scores of all indicators (AC, PD, Ksat) used in soil quality assessment
(Table 8). For instance, an SQI value of 5 corresponds to very low soil quality.
1
100
10000
Baaigem Landuit Melle Moortsele Wortegem Zevergem Zwalm
Ksa
t (
cm
/day)
CC CH GL

30
Table 8. Soil quality index (SQI) scores for different locations and land use.
(1-very high, 2-high, 3-medium, 4-low, 5-very low)
Location Land
Use
Index Scores
AC PD Ksat SQI
Baaigem
CC 2 3 5 3
CH 2 4 5 4
GL 2 2 5 3
Landuit
CC 2 4 5 4
CH 2 3 5 3
GL 2 4 4 3
Melle
CC 2 4 4 3
CH 2 5 4 4
GL 2 5 4 4
Moortsele
CC 1 3 2 2
CH 2 4 3 3
GL 1 2 2 2
Wortegem
CC 2 4 5 4
CH 2 5 4 4
GL 2 3 4 3
Zevergem
CC 2 3 5 3
CH 2 3 3 3
GL 2 2 5 3
Zwalm
CC 2 5 2 3
CH 2 5 4 4
GL 2 3 2 2
Calculated SQI values ranged from 2 to 4 indicating neither very low nor very high soil
quality in all the evaluated sites. Overall soil quality based on AC only was found high, but
tends to be lower once other indicators like PD and Ksat were included. Result of the soil
quality assessment only indicates that immediate intervention is needed in order to maintain
or safeguard the quality of these soils against further degradation by compaction.
4.2 Mechanical susceptibility of soil to compaction
4.2.1 Calculated PCS values
The likelihood or susceptibility of the soil to compact depends on several cross-cutting
influences of soil properties, climate, land use, drainage conditions, and farm management. In
practice, the most commonly used and very useful indicator of soil vulnerability to

31
compaction is the soil strength or the capacity of the soil to bear loads, and precompression
stress is the most widely used as indicator for soil strength (Lebert and Horn, 1991).
In this study, results of the confined compression test of 126 soil samples at different initial
matric suctions (-6, -10, and -33 kPa) were used to plot the soil compression curves (SCC) as
shown in Figure 9. In general, the SCC which is the graphical representation of the stress-
strain relationships of soils subjected to mechanical stress, has a sigmoidal S-shape due to
logarithmic scaling of the x-axis (log of the applied stress). The point in a curve with a
smallest radius of curvature and the straight portion of the curve (virgin compression line)
may be considered as the most crucial parts in determining two important soil mechanical
parameters – compression index (Cc) and PCS. The PCS values were determined using
different methods presented in literature, such as the one used by Davidowski and Koolen
(1974) based on Casagandre (1930) method, the four methods used by Arvidsson and Keller
(2004), and the modified (3 parameters) and original (4 parameters) Gompertz function used
by Gregory et al. (2006).
Comparison of PCS values derived from the compression curve using different methods
(C_DK, AK_2, AK_3, AK_4, AK_5, Gea_3, and Gea_4) is given in Figure 10. Highest
correlation was found between AK_4 and AK_5 (r = 0.92), whereas the lowest correlation
was found between C_DK and Gea_3 (r = 0.09). While other methods exhibited a positive
correlations with one another, only Gea_3 was inversely correlated with AK_4 (r = -0.18) and
AK_5 (r = -0.20). Highest correlation between AK_4 and AK_5 is not surprising since the
determination of PCS according to these methods is based on the first successive two or three
points of the curve, of which the variation in slope of the fitted line is not very sensitive to
smaller load increments especially if the soil had experienced considerable compaction in the
past. The significant differences in PCS values is just an indication that the method to be used
to determine PCS must be carefully chosen (Cavalieri et al., 2008).
Figure 11 shows the average PCS (C_DK) of soils sampled from seven locations. The
average PCS (C_DK) values for all soils at -6, -10, and -33 kPa water potential were 352,
344, and 419 kPa, respectively. Based on the classification of PCS proposed by Lebert and
Schafer (2005), the PCS values obtained in this study were found very high (PCS > 200 kPa)
especially for cropland soils.

32
Figure 9. Stress-strain curves at (a) pF=1.8, (b) pF=2.0, and (c) pF=2.5 water potential for all
sites. Data shown are averages of six values (from cropland center, cropland
headland and grassland, at depths of 40 cm and 70 cm).

33
Figure 10. Comparison of PCS values derived by different methods. Pearson correlation
coefficients are shown in the upper right corner and scatter plots with smoothed
lines are shown in the lower left corner.
Figure 11. Average PCS (C_DK) of soils from different locations.
C_DK
50 150
0.73 0.39
200 600
0.74 0.79
100 300
0.09
100
400
700
0.56
50
150 AK_2
0.71 0.60 0.65 0.50 0.85
AK_3
0.22 0.30 0.43
50
200
0.62
200
600 AK_4
0.92 -0.18 0.43
AK_5
-0.20
100
400
0.39
100
300
Gea_3
0.62
100 400 700 50 150 300 100 300 500 0 400 800
0400
1000
Gea_4

34
4.2.2 Influence of land use and soil depth on PCS variability
Figure 12 shows the variations in PCS values at different land use and soil depths. Among the
three land use evaluated, highest PCS was recorded in the headland at both depths. This can
be attributed to frequent passes of tractor wheels along this section of the cropland.
Headlands serves as field entrances and turning points for field machinery. In cropland center
and grassland, the upper part of the subsoil have higher PCS than the lower part. Apart from
differences on exposure of soil to field traffic, differences in pedological processes, soil
moisture conditions, and swelling-shrinking intensity (Keller et al., 2004) might be the main
reasons of the observed differences in PCS.
Figure 12. PCS (C_DK) values at different land use and soil depths.
4.2.3 Assessment of soil vulnerability to mechanical compaction
Vulnerability to compaction index (VCI) was used to assess the current capacity of the soils
to carry loads without significant damage to soil structure. Vulnerability of the soil to
compaction mainly depends on its structural quality and susceptibility to be compacted under
mechanical loading. As already discussed in Section 3.7, both results of the soil quality
assessment and PCS analysis were vital inputs in order to determine the VCI value for each
location and land use type evaluated in this study as summarized in Figure 13. All locations
have VCI values less than 3 indicating low to medium vulnerability to degradation by
mechanical compaction. This low VCI can be attributed to the present mechanical strength of
the soil which have been found very high (PCS > 200 kPa) due to previous stress history of
the soil which have preserved within the soil structure. Soils with high PCS values are
structurally stable and less susceptible to further compaction since higher stress is required in
order to distort their internal structure. D’Or and Destain also conducted a compaction risk

35
assessment in Wallonia (Belgium) based on the estimation of probability of exceeding the
PCS due to application of loads, but using the PCS values derived from pedotransfer
functions of Horn and Fleige (2003). They found a PCS values higher than 120 kPa at almost
more than half of Wallonia territory in pF between 1.8 and 2.5. Their findings also showed
that risks of subsoil compaction exist mainly in loamy forest soils.
Figure 13. Average VCI values for different locations and land use.
4.3 Indirect estimation of PCS using pedotransfer function
4.3.1 Potential predictors of PCS
Linear relationships were evaluated between PCS and other soil properties such as particle
size distribution (% of clay, silt, and sand), calcium carbonate content (CaCO3), organic
carbon content (OC), soil-water potential (PF), dry bulk density (BD), wet bulk density
(WBD), bulk density ratio (BDR) saturated hydraulic conductivity (Ksat), clay/sand ratio
(CSR), soil textural class (based on Belgian textural triangle), structural quality index (SQI),
and soil packing density (PD). A potential subset of these soil properties were then selected
through stepwise regression to construct optimal PTFs that can be used to predict PCS. The
Pearson’s correlation coefficients between predictors and PCS values are shown in Table 9.
Among soil properties, silt vs. sand has the highest negative correlation (r = -0.98) followed
by PD vs. BD (r = 0.91) and PD vs. WBD (r = 0.85). It implies that PD can be a good
substitute for BD since it also accounts the influence of clay content on soil structural quality.
Between predictor variables and PCS, highest correlation (r = 0.42) was obtained between
BDR vs. PCSAK5, followed by BD vs. PCSAK5 (r = 0.38), and DBR vs. PCSAK4 (r
= 0.35). The
1.0
2.0
3.0
4.0
5.0
Baaigem Landuit Melle Moortsele Wortegem Zevergem Zwalm
VCI
CC CH GL

36
PCSGea4 is poorly correlated with all the predictors, while only PCSGea3 showed a negative
correlation (r = -0.29) with BD. Most findings in literature (e.g. Saffih–Hdadi et al., 2009;
Imhof et al., 2004) showed that soil strength is positively correlated with BD and so the PCS.
4.3.2 Development of regression-based PTFs
A series of stepwise multiple regressions have been performed to find a reliable linear
functions that can be used to predict PCS from a combinations of a set of predictor variables.
At the outset, initial PTFs were derived using the complete dataset (N=126) of which Sn, Si,
Cl, OC, pF, DBD, and texture were used as the only predictors. Imhof et al. (2004) also used
BD and clay content to predict compression index and PCS. For practical reasons, the wet
bulk density (WBD) and saturated hydraulic conductivity (Ksat) were not included in the
analysis since in practice, measurements of these variables is not easy and time-consuming.
Results of the initial runs showed that developed PTFs had very low predictive performances
in terms of their MAE, RMSE and R2 values. The next approach then was to include other
variables such as CSR, SQI, and PD as predictors and also the dataset was splitted into two
groups based on land use (cropland, grassland) and then new PTFs were developed for each
type of land use. The developed PTFs specific for each land use type showed a better
predictability than those PTFs derived using the complete dataset. A summary of these
developed PTFs is presented in Table 10.
Reliability of new PTFs have been evaluated in terms of their accuracy in predicting PCS
using information from readily available and easy to measure soil properties. Cropland PTF
that used PCS values calculated using AK_5 method outperformed other PTFs, whereas in
grassland the one that used PCS of AK_2 showed a better predictive performance than others.
Grouping the dataset by land use and including some indices used in soil quality assessment
such as PD and SQI substantially improved the predictive performance of PTFs. By
comparing two sets of PTFs developed specifically for each type of land use, the grassland
PTFs have higher coefficient of determination (R2 > 0.40) compared to cropland PTFs. This
may indicates that the underlying causal factors of the PCS variability in cropland is
somehow more complex than grassland which cannot be deduced from soil properties alone.

37
Table 9. Pearson’s correlation matrix between soil properties (predictors) and PCS values.
Sn: sand (%), Si: silt (%), Cl: clay (%),OC: organic carbon content (%), Ca: CaCO3, PF: log of water potential, BD: dry bulk density (Mg/m³), WBD: wet bulk density
(Mg/m³), BDR: DBD/WBD ratio, Ksat: saturated hydraulic conductivity (cm day-1), CSR: clay/sand ratio, SQI: soil structural quality index, PD: packing density (g cm-3)
Sand Silt Clay OC Ca PF BD WBD BDR Ksat CSR StI PD PCSCDK PCSAK2 PCSAK3 PCSAK4 PCSAK5 PCSGea3 PCSGea4
Sand 1
Silt -0.98 1
Clay -0.6 0.45 1
OC -0.17 0.16 0.12 1
Ca -0.28 0.24 0.33 0.1 1
PF 0 0 0 0 0 1
BD 0.23 -0.14 -0.52 -0.14 -0.16 0.04 1
WBD -0.25 0.31 -0.14 0 0.07 -0.19 0.79 1
BDR 0.69 -0.63 -0.66 -0.24 -0.36 0.3 0.58 -0.04 1
Ksat 0.13 -0.15 0.03 -0.13 -0.09 -0.05 -0.19 -0.27 0.05 1
CSR -0.7 0.61 0.81 0.24 0.26 0 -0.53 -0.12 -0.7 0.01 1
StI 0.53 -0.49 -0.47 0.54 -0.13 0 0.15 -0.08 0.31 -0.11 -0.28 1
PD -0.03 0.05 -0.11 -0.11 -0.03 0.04 0.91 0.85 0.35 -0.21 -0.22 -0.06 1
PCSCDK 0.15 -0.13 -0.16 -0.04 -0.09 0.17 0.29 0.06 0.4 0.03 -0.22 -0.02 0.26 1
PCSAK2 0.1 -0.1 -0.05 -0.09 -0.11 0.19 0.15 -0.05 0.32 0.08 -0.07 -0.06 0.15 0.73 1
PCSAK3 0.07 -0.03 -0.2 -0.07 -0.1 0.05 0.25 0.16 0.21 -0.02 -0.07 0.05 0.19 0.39 0.71 1
PCSAK4 0.12 -0.09 -0.2 -0.04 -0.05 0.16 0.34 0.16 0.35 0.03 -0.23 -0.01 0.3 0.74 0.6 0.22 1
PCSAK5 0.18 -0.14 -0.29 -0.06 -0.07 0.17 0.38 0.14 0.42 0.08 -0.28 0.02 0.3 0.79 0.65 0.3 0.92 1
PCSGea3 -0.14 0.09 0.31 -0.08 -0.06 0.16 -0.29 -0.28 -0.08 0.03 0.28 -0.15 -0.19 0.09 0.5 0.43 -0.18 -0.2 1
PCSGea4 -0.15 0.14 0.12 -0.03 -0.04 0.16 0.06 0.04 0.07 0.02 0.08 -0.15 0.13 0.56 0.85 0.62 0.43 0.39 0.62 1

38
Table 10. List of PTFs to predict precompression stress of arable soils with different land use. The equations represent the best subset regression
results and their mean absolute error (MAE), root mean square error (RMSE), and adjusted R2 values.
Method LU PTF Equations MAE RMSE R² R²(adj)
C_DK CL log(PCS) = -90.27 + 0.89*Cl + 0.92*Sn + 0.92*Si + 0.24*OC + 0.19*PF - 5.24*SQI + 0.54*PD 0.15 0.21 0.35 0.29
GL log(PCS) = -142.7 - 0.10*Tx + 1.48*Cl + 1.44*Sn + 1.43*Si + 1.01*PD 0.15 0.23 0.40 0.32
AK_2
CL log(PCS) = 0.48 + 0.01*Sn + 0.01*Si + 0.17*PF - 2.27*SQI 0.14 0.18 0.18 0.14
GL log(PCS) = -191.02 -0.13*Tx +1.96*Cl +1.91*Sn +1.90*Si -0.03*Ca +0.14*PF +6.05*SQI
+1.19*PD 0.10 0.15 0.67 0.59
AK_3 CL log(PCS) = -0.47 + 0.03*Sn + 0.03*Si + 0.13*CSR 0.17 0.22 0.16 0.13
GL log(PCS) = -0.51 - 0.06*Tx + 0.01*Sn + 1.40*BD + 0.4*CSR - 3.16*SQI 0.14 0.20 0.34 0.25
AK_4 CL log(PCS) = 1.14 + 0.15*OC + 2.33*BD + 0.17*PF - 4.86*SQI - 1.69*PD 0.13 0.18 0.38 0.34
GL log(PCS) = -153.02 - 0.1*Tx 1.57*Cl + 1.54*Sn + 1.53*Si + 4.65*SQI + 1.04*PD 0.12 0.17 0.44 0.34
AK_5 CC
log(PCS) = 1.15 + 0.002*Sn + 0.21*OC + 3.75*BD + 0.16*PF + 0.14*CSR - 7.35*SQI -
3.06*PD 0.13 0.44 0.44 0.38
GL log(PCS) = -145.27 - 0.09*Tx + 1.49*Cl + 1.46*Sn + 1.46*Si + 3.12*SQI + 0.96*PD 0.10 0.15 0.48 0.39
Gea_3
CC log(PCS) = 2.85 - 0.14*Cl - 0.08*OC - 0.01*Ca - 16.67*BD + 0.07*PF + 16.25*PD 0.10 0.13 0.30 0.25
GL log(PCS) = -80.86 -0.05*Tx +0.86*Cl +0.82*Sn +0.82*Si -0.03*Ca +0.15*PF +4.89*SQI
+0.4*PD 0.08 0.11 0.58 0.48
Gea_4
CC log(PCS) = 2.03 - 0.16*Cl - 0.003*Sn - 16.77*BD + 0.13 *PF + 16.96*PD 0.18 0.23 0.13 0.08
GL log(PCS) = -259.02 -0.15*Tx +2.67*Cl +2.58*Sn + 2.58*Si +0.21*PF -0.34*CSR +10.38*SQI
+1.59*PD 0.14 0.20 0.64 0.55
LU: land use (CL - cropland, GL - grassland), log(PCS): logarithm of precompression stress (log-kPa), Sn: sand (%), Si: silt (%), Cl: clay (%), BD: dry bulk density
(Mg/m³), CSR: clay/sand ratio, OC: organic carbon content (%), Ca: CaCO3, Tx: texture (coded var.), PF: log of water potential, SQI: soil structural quality index (%),
PD: packing density (g/cm³)

39
Figure 14. Measured versus PTF-predicted PCS (log kPa) for soil samples collected from
cropland.
Figure 15. Measured versus PTF-predicted PCS for soil samples collected from grassland
.

40
4.4 Influence of compression test methods on soil deformation behavior
4.4.1 Stress-strain relationships
Effects of initial soil water potential (pF=1.8, 2.0, and 2.5) and the oedometer loading
duration (T=1, 10, and 30 min) on PCS were investigated. Results of confined compression
tests for all treatments showed that initial water potential have significant influence on the
stress-strain behavior of soil (Figure 16). Total volumetric strain tends to be higher with
decreasing water potential (more negative hence drier). It can be seen at lower water potential
that the compression range of the curve is shifted towards the right. On the other hand, higher
deformations were recorded for soils subjected to longer loading durations (Figure 17). In
general, there was no appreciable steep bend on stress-strain curves observed in all treatments
indicating that the soils may had exposed to slight compaction in the past. Substantial strain
occurred during the initial 15-20 sec of each loading stage.
4.4.2 Effects of loading duration and initial water potential on PCS
Figure 18 shows the calculated PCS using different methods for different treatments. In order
to compare the results of different treatments, the PCS values calculated using the standard
Casagandre (C_DK) method were choosen. Analysis of variance (ANOVA) showed that
there is no significant interaction effect between loading duration and initial water potential
on PCS (p=0.358). However, there is very strong evidence that the different levels of water
potential do not all have the same effects on PCS can be observed (p=0.358). It showed that
the PCS increases with decreasing (more negative) water potential irrespective of loading
duration used and this effect was highly significant (p=0.0003). The results obtained in this
study confirm the observation by other researchers that PCS increases with increasing soil
suction (Alexandrou and Earl, 1998; Defossez et al., 2003; Imhoff et al., 2004; Mosaddeghi
et al., 2006). Water influences the structural stability and strength of soil since it acts both as
a lubricant and as a binding agent of soil particulates (Carter and Gregorich, 2007). On the
other hand, despite of the noticeable change in stress-strain curve pattern when soil is
subjected to longer loading duration, it has no significant influence on PCS values (p=0.568).
Among all treatments, the lowest and highest PCS obtained were 99.5 kPa (pF=1.8, T=1 min)
and 270 kPa (pF=2.5, T=1 min), respectively.

41
Figure 16. One-dimensional compression curves for soil samples pre-wetted at different
water potential (pF=1.8, 2.0, and 2.5). Vertical stress is in logarithmic scale.
Figure 17. One-dimensional compression curves for soil samples compressed at different
loading durations (T=1, 10 and 30 min). Vertical stress is in logarithmic scale.
C_DK AK_2 AK_3

42
AK_4 AK_5 Gea_4
Figure 18. Precompression stress values derived using different methods. Points represent
mean values of three to four replicate measurements, errors bars are 95%
confidence interval.
Figure 19. Influence of initial water potential and loading duration (values used were
determined using the C_DK method.
pF=1.8 pF=2.0 pF=2.5
Initial Water Potential
Pre
co
mp
ressio
n S
tre
ss (
kP
a)
01
00
20
03
00
40
05
00
T=10min
T=1minT=30min
pF=1.8 pF=2.0 pF=2.5
Initial Water Potential
Pre
co
mp
ressio
n S
tre
ss (
kP
a)
01
00
20
03
00
40
05
00
T=10min
T=1minT=30min
pF=1.8 pF=2.0 pF=2.5
Initial Water Potential
Pre
co
mp
ressio
n S
tre
ss (
kP
a)
01
00
20
03
00
40
05
00
T=10min
T=1minT=30min
pF=1.8 pF=2.0 pF=2.5
Initial Water Potential
Pre
co
mp
ressio
n S
tre
ss (
kP
a)
01
00
20
03
00
40
05
00
T=10min
T=1minT=30min
pF=1.8 pF=2.0 pF=2.5
Initial Water Potential
Pre
co
mp
ressio
n S
tre
ss (
kP
a)
01
00
20
03
00
40
05
00
T=10min
T=1minT=30min
pF=1.8 pF=2.0 pF=2.5
Initial Water Potential
Pre
co
mp
ressio
n S
tre
ss (
kP
a)
01
00
20
03
00
40
05
00
T=10min
T=1minT=30min

43
4.4.3 Effect on pore water pressure
Changes in pore water pressure (PWP) during the whole period of compression test were
monitored using a micro-tensiometer mounted at the base of the oedometer ring. Though it
was expected during the start of the test (no applied stress) that the tensiometer will record
the PWP similar to that of the initial water potential of the soil sample, this was not achieved
as all of the initial readings were above the preset soil water potentials. The PWP response
shows an interesting phenomenon when soil compression tests were done at different loading
durations and soil water potentials. For instance, in slightly wet soils (pF=1.8 and 2.0), the
PWP did not vary much and water still remained under suction during the application of
smaller loads but PWP began to increase when applied stresses became larger until the
tensiometer registered a positive PWP indicating that the soil is at 100% saturation (Figure
20).
On the other hand, the loading duration had an influence on PWP at higher applied stresses.
For longer loading duration (30 min), PWP could reach its peak and then it declined until the
start of the next loading cycle. For short loading durations (1 and 10 min), it was quite
difficult to measure the peak PWP at every loading stage since no drop in PWP could be
observed and it continued to rise until the maximum stress was applied. Fast straining (short
loading duration) restricts the time needed for dissipation of pore water pressure. In the case
of drier soils (pF=2.5), the pore water remained under suction throughout the whole period of
compression test. In unsaturated soils the degree of saturation is less than 100% and the pore
water pressure is negative due to surface tension of pore water in soil voids causing a suction
effect on surrounding particles. Therefore, in this case little water movement is required for
compression.

44
Figure 20. Typical result of an oedometer test (at pF=2.0 and T=10 min) showing the loading
sequence, vertical displacement, and pore water pressure changes.

45
5. CONCLUSION
Both soil quality and susceptibility of the soil to structural deformation by mechanical loads
were evaluated in this study. These information are vital in gauging the vulnerability of
arable soils against inevitable threats of compaction. Different levels of exposure of these
soils to compaction were also considered in order to understand the spatial variability of
compaction risks at the farm-scale level. For instance, it was found out in this study that there
is a huge variability in measured values of soil quality indicators used in terms of varying
land use and soil depths. Overall, soil structural quality was found intermediate and
susceptibility to compaction was low to medium, thus the vulnerability to compaction can be
considered moderate in East Flanders, Belgium.
Difficulties associated with measurement of PCS in both laboratory and field are a reasonable
cause of concern to develop an indirect method using already available soil information.
There is a general consensus among soil scientists that soil properties are interrelated to each
other. In this study, the underlying relationships between PCS and other soil physical
properties were investigated using pedotransfer functions. The accuracy and applicability of
these pedotransfer functions depends on the quality of the dataset used, choice of potential
predictors, and modeling techniques which have been addressed in this study. The newly
developed PTFs can able to predict PCS values of cropland and grassland soils, however,
further research is needed to improve these PTFs to a reasonable degree of predictive
capability.
Several theoretical methods were proposed by various authors to determine PCS from the
stress-strain relationship of soil subjected to axial compression. In literature, most of the PCS
data used to develop PTFs were calculated based on Casagandre method. However, they still
differ on soil compression methods used in terms of sample dimension, initial soil wetness,
and loading duration. Since it’s difficult to conclude which method to determine PCS is the
better one, using the Casagandre method which is commonly used in saturated soil mechanics
to detect the bearing capacity of the soils is considered reasonable, though further
investigation is needed to warrant its validity especially for studying compaction properties of
agricultural soils.
Also, the study demonstrated that soils have different deformation behavior when subjected
to uniaxial compression at different loading duration and initial water potential. Soil

46
compression under short-time loading (1 to 30 minutes) simulates soil deformation which
occurs under wheel loads of short-time durations. Though the interaction effects of these two
important factors during compression test on PCS was not able to be captured well, their
main effects on stress-strain behavior of the soil were found significant as manifested in the
soil compression curves. Wetter the soil and longer the stress applications often results in
higher compaction. It was found that the initial water potential has a significant influence on
PCS values. The PCS tends to be higher with decreasing water potential. The influence of
these two factors on soil compaction behavior could also be linked to pore water pressure
dynamics during compression tests.

47
6. LITERATURE CITED
Alakukku, L. (1999). Soil Compaction due to wheel traffic. Agricultural and Food Science in
Finland, 8: 333–351.
Alexandrou, A. & Earl, R. (1998). The relationship among the pre-compaction stress,
volumetric water content and initial dry bulk density of soil. Journal of Agricultural
Engineering Research, 71, 75–80
Arvidsson, J., & Keller, T. (2004). Soil precompression stress: I. A survey of Swedish arable
soils. Soil and Tillage Research
Arvidsson, J., & Keller, T. (2007). Soil stress as affected by wheel load and tyre inflation
pressure. Soil and Tillage Research, 96(1-2), 284–291.
Ball, B.C. & Douglas, J.T. (2003). A simple procedure for assessing soil structural, rooting
and surface conditions. Soil Use and Management, 19, 50–56.
Ball, B. C., Batey, T., and Munkholm, L. J. (2007). Field assessment of soil structural quality
– a development of the Peerlkamp test. Soil Use and Management, 23, 329–337.
Batey, T., & McKenzie, D. C. (2006). Soil compaction: Identification directly in the field.
Soil Use and Management, 22(2), 123–131.
Baumgartl, T., & Koeck, B. (2004). Modelling volume change and mechanical properties
with hydraulic models. Soil Sci. Soc. Am. J., 68, 57–65
Berli, M., Kirby, J. M., Springman, S. M., & Schulin, R. (2003). Modelling compaction of
agricultural subsoils by tracked heavy construction machinery under various moisture
conditions in Switzerland. Soil and Tillage Research, 73, 57–66.
Bouma, J., (1989). Using soil survey data for quantitative land evaluation. Advances in Soil
Science, 9, 177-213.
Bouma, J. & Batjes, N.H. (2000). Trends of world-wide soil degradation. In: Bodenschutz,
(ed. R Bocker). Hoehenheimer Umwelttagung 32, Hoehenheim, pp. 33-43
Canillas, E. C., & Salokhe, V. M. (2001). Regression analysis of some factors influencing
soil compaction. Soil and Tillage Research, 61(3-4), 167–178.
Cavalieri, K. M. V., Arvidsson, J., da Silva, A. P., & Keller, T. (2008). Determination of
precompression stress from uniaxial compression tests. Soil and Tillage Research, 98,
17–26.
Casagandre, A. (1936). The determination of pre-consolidation load and its practical
significance. In: Proceedings of the First International Conference on Soil Mechanics
and Foundation Engineering, Vol. 3, 22-26 June 1936. Harvard University, Cambridge,
MA, USA, pp. 60-64

48
Chen J.Z., Tan M.Z. and Gong Z.T. (2002) Soil degradation: a global problem endangering
sustainable development. Chinese Journal of Geographical Science, 12, 243–252.
Chen, G., Weil, R. R., & Hill, R. L. (2014). Effects of compaction and cover crops on soil
least limiting water range and air permeability. Soil and Tillage Research, 136, 61–69.
Crescimanno, G., Lane M, Owens P, Rydel B, Jacobsen O, Düwel O, Böken H, Berényi-
Üveges Castillo V, Imeson A. (2004) Final Report, Working Group on Soil Erosion,
Task Group 5: Links with organic matter and contamination working group and
secondary soil threats. European Commission, Directorate-General Environment,
Brussels.
Cornelis WM, Khlosi M, Hartmann R, Van Meirvenne M, De Vos B. (2005). Comparison of
unimodal analytical expressions for the soil–water retention curve. Soil Science Society
of America Journal 69: 1902–1911.
Daniells, I.G. & Larsen, D.L. (1991). SOILpak: a soil management package for cotton
production on cracking clays. NSW Agriculture, Narrabri, NSW, Australia.
Dawidowski, J. B., & Koolen, a. J. (1994). Computerized determination of the
preconsolidation stress in compaction testing of field core samples. Soil and Tillage
Research, 31(2-3), 277–282.
Dawidowski, J.B., Morrison, J.E., Snieg, M. (2001). Measurement of soil layer strength with
plate sinkage and uniaxial confined methods. Transactions of the Asae, 44, 1059–1064.
Dias Junior, M. S., & Pierce, F. J. (1995). A simple procedure for estimating preconsolidation
pressure from soil compression curves. Soil Technology, 8(2), 139–151
Eckelman, W., Baritz, R., Bialousz, S., Bielek, P., Carre, F., Houskova, B., Jones, R. J. A.,
Kibblewhite, M., Kozak, J., La Bas, Ch, Toth, G., Varallyay, G., Halla, M. Y., and
Zupan, M., 2006. Common Criteria for Risk area Identification According to Soil
Threats. Italy: JRC Ispra. ESBN Research Report No. 20, EUR 22185 EN.
Fredlund, D.G. and Vanapalli, S.K. (2002), Shear strength of unsaturated soils. Agronomy
Soil Testing Manual, Agronomy Society of America, pp. 329-361.
Fritton, D. D. (2008). Evaluation of pedotransfer and measurement approaches to avoid soil
compaction. Soil & Tillage Research, 99(2), 268-278.
Gregory, a. S., Whalley, W. R., Watts, C. W., Bird, N. R. a, Hallett, P. D., & Whitmore, a. P.
(2006). Calculation of the compression index and precompression stress from soil
compression test data. Soil and Tillage Research, 89, 45–57.
Håkansson, I., & Reeder, R. C. (1994). Subsoil compaction by vehicles with high axle load—
extent, persistence and crop response. Soil and Tillage Research, 29(2-3), 277–304.
Hamza, M. A., & Anderson, W. K. (2005). Soil compaction in cropping systems: A review of
the nature, causes and possible solutions. Soil and Tillage Research, 82, 121–145.
49
Horn, R. (1988). Compressibility of arable land. In: J. Drescher, R. Horn and M. de Boodt
(Eds), Impact of water and external forces on soil structure. Catena Supplement 11, pp.
53-71.
Horn, R., & Fleige, H. (2003). A method for assessing the impact of load on mechanical
stability and on physical properties of soils. Soil and Tillage Research, 73, 89–99.
Huber, S., Prokop, G., Arrouays, D., Banko, G., Bispo, A., Jones, R.J.A., Kibblewhite, M.G.,
Lexer, W., Möller, A., Rickson, R.J., Shishkov, T., Stephens, M., Toth, G. Van den
Akker, J.J.H., Varallyay, G., Verheijen, F.G.A., Jones, A.R. (eds) (2008). Environmental
Assessment of Soil for Monitoring: Volume I Indicators & Criteria. EUR 23490 EN/1,
Office for the Official Publications of the European Communities, Luxembourg, 339pp.
Imhoff, S., da Silva, A. P., & Fallow, D. (2004). Susceptibility to compaction, load support
capacity, and soil compressibility of Hapludox. Soil Science Society of America Journal,
68, 17–24.
Jones, R. J. A, Spoor, G., & Thomasson, a. J. (2003). Vulnerability of subsoils in Europe to
compaction: A preliminary analysis. Soil and Tillage Research, 73, 131–143.
Keller, T., 2004. Soil Compaction and Soil tillage – Studies in Agricultural Soil Mechanics.
Acta Universitatis Agriculturea Sueciae, Agraria 489. Ph.D.-thesis. 75pp.
Keller, T., Arvidsson, J., Dawidowski, J. B., & Koolen, A. J. (2004). Soil precompression
stress: II. A comparison of different compaction tests and stress-displacement behaviour
of the soil during wheeling. Soil and Tillage Research, 77, 97–108.
Keller, T. (2005). A Model for the prediction of the contact area and the distribution of
vertical stress below agricultural tyres from readily available tyre parameters.
Biosystems Engineering, 92(1), 85–96.
Keller, T., Défossez, P., Weisskopf, P., Arvidsson, J., & Richard, G. (2007). SoilFlex: A
model for prediction of soil stresses and soil compaction due to agricultural field traffic
including a synthesis of analytical approaches. Soil and Tillage Research, 93(2), 391–
411.
Keller, T. & Lamandé, M. (2010). Challenges in the development of analytical soil
compaction models. Soil and Tillage Research 111, 54–64.
Keller, T., Lamandé, M., Schjønning, P., & Dexter, A. R. (2011). Analysis of soil
compression curves from uniaxial confined compression tests. Geoderma, 163(1-2), 13–
23.
Kirby, J.M. (1991). Critical-state soil mechanics parameters and their variation for Vertisols
in eastern Australia. J. Soil Sci. 42, 487–499.
Lal, R. (1998). Basic concepts and global issues: soil quality and agricultural sustainability.
In: Lal, R (Ed.), Soil Quality and Agricultural Sustainability. Ann Arbor Science,
Chelsea, MI, USA, pp. 3–12.

50
Lal, R. (2006). Encyclopedia of Soil Science, Second Edition, Vol I, Vol II. Taylor &
Francis, Boca Raton, FL.
Lamandé, M., & Schjønning, P. (2011). Transmission of vertical stress in a real soil profile.
Part III: Effect of soil water content. Soil and Tillage Research, 114, 78–85.
Lebert, M., & Horn, R. (1991). A method to predict the mechanical strength of agricultural
soils. Soil and Tillage Research, 19, 275–286.
Lebert, M., Böken, H., & Glante, F. (2007). Soil compaction-indicators for the assessment of
harmful changes to the soil in the context of the German Federal Soil Protection Act.
Journal of Environmental Management, 82(3), 388–397.
Lebert, M. (2010). A method to assess the vulnerability of agricultural subsoils to
compaction. World, (August), 2008–2011.
McKenzie, D.C. (2001). Rapid assessment of soil compaction damage. II. Relationships
between the SOILpak score, strength and aeration measurements, clod shrinkage
parameters and image analysis data on a Vertisol. Australian Journal of Soil Research,
39, 127–141.
Mosaddeghi, M. R., Hemmat, A., Hajabbasi, M. A., & Alexandrou, A. (2003). Pre-
compression stress and its relation with the physical and mechanical properties of a
structurally unstable soil in central Iran. Soil and Tillage Research, 70, 53–64.
Mosaddeghi, M. R., Hemmat, A., Hajabbasi, M. A., Vafaeian, M., & Alexandrou, A. (2006).
Plate sinkage versus confined compression tests for in situ soil compressibility studies.
Biosystems Engineering, 93, 325–334.
Peerlkamp, P.K. (1967). Visual estimation of soil structure. In: West European methods for
soil structure determination II (eds M. de Boodt, H. Frese, A.J. Low & P.K. Peerlkamp),
pp. 11–12. State Faculty of Agricultural Science, Ghent, Belgium.
Pulido Moncada, M., Gabriels, D., Cornelis, W., & Lobo, D. (2013). Comparing Aggregate
Stability Tests for Soil Physical Quality Indicators. Land Degradation & Development,
n/a–n/a. doi:10.1002/ldr.2225
Pulido Moncada, M., Gabriels, D., Lobo, D., Rey, J. C., & Cornelis, W. M. (2014). Visual
field assessment of soil structural quality in tropical soils. Soil and Tillage Research,
139, 8–18.
Rücknagel, J., Hofmann, B., Paul, R., Christen, O., & Hülsbergen, K. J. (2007). Estimating
precompression stress of structured soils on the basis of aggregate density and dry bulk
density. Soil and Tillage Research, 92, 213–220.
Saffih-Hdadi, K., Défossez, P., Richard, G., Cui, Y. J., Tang, A. M., & Chaplain, V. (2009).
A method for predicting soil susceptibility to the compaction of surface layers as a
function of water content and bulk density. Soil and Tillage Research, 105, 96–103.

51
Sharifi, A., Godwin, R.J., O’Dogherty, M.J. & Dresser, M.L. (2007). Evaluating the
performance of a soil compaction sensor. Soil Use and Management, 23, 171–177.
Smith, D.L.O. (1987). Measurement, interpretation and modelling of soil compaction. Soil
Use and Management, 3, 87–93.
Soane, B. D., & van Ouwerkerk, C. (1995). Implications of soil compaction in crop
production for the quality of the environment. Soil and Tillage Research, 35(1-2), 5–22.
Spoor, G., Tijink, F. G. J., & Weisskopf, P. (2003). Subsoil compaction: Risk, avoidance,
identification and alleviation. Soil and Tillage Research, 73(1-2), 175–182.
Tranter, G., Minasny, B., McBratney, A.B., Murphy, B., McKenzie, N.J., Grundy, M. &
Brough, D. (2007). Building and testing conceptual and empirical models for predicting
soil bulk density. Soil Use and Management, 23, 437–443.
Van Den Akker, J. J. H. (2004). SOCOMO: A soil compaction model to calculate soil
stresses and the subsoil carrying capacity. Soil and Tillage Research, 79, 113–127.
Van Genuchten, M.T. (1980). A closed-form equation for predicting thehydraulic
conductivity of unsaturated soils. Soil Sci. Soc. Am. J. 44, 892–898.
Whalley, W. R., Matthews, G. P., & Ferraris, S. (2012). The effect of compaction and shear
deformation of saturated soil on hydraulic conductivity. Soil and Tillage Research, 125,
23–29.
Zhang, S., Grip, H., & Lövdahl, L. (2006). Effect of soil compaction on hydraulic properties
of two loess soils in China. Soil and Tillage Research, 90, 117–125.