determinants of technology adoption in mexico
TRANSCRIPT

WpS X-7
POLICY RESEARCH WORKING PAPER 278 0
Determinants of Technology Adoptionin Mexico
Gladys L6pez-Acevedo
The World BankLatin America and the Caribbean RegionPoverty Reduction and Economic Management Sector UnitFebruary 2002
Pub
lic D
iscl
osur
e A
utho
rized
Pub
lic D
iscl
osur
e A
utho
rized
Pub
lic D
iscl
osur
e A
utho
rized
Pub
lic D
iscl
osur
e A
utho
rized

POLICY RESEARCH WORKING PAPER 2780
Abstract
L6pez-Acevedo tries to identify the impact of firm-, have highly skilled workers, are near the U.S. border,region-, and industry-specific characteristics on and are owned by foreign entities. Also, bigger firms,technology adoption by Mexican firms. Cross-sectional firms with a large share of highly skilled workers, andand panel data from 1992-99 show that the firms most firms that train workers, use intensively more complexlikely to adopt new technology are large, train workers, technologies in their production process.
This paper-a product of the Latin America and the Caribbean Region, Poverty Reduction and Economic ManagenmentSector Unit-is part of a larger effort in the region to reduce poverty and inequality through human capital investment.Copies of the paper are available free from the World Bank, 18 18 H Street NW, Washington, DC 20433. Please contactMichael Geller, room 14-046, telephone 202-458-5155, fax 202-522-2112, email address mgeller@y worldhank.org. PolicyResearch Working Papers are also posted on the Web at http://econ.worldbank.org. The author may be contacted atgacevedoCtworldbank.org. February 2002. (40 pages)
The Policy Research Working Paper Series disseminates the findings of wvork in progress to encourage the exchange of ideas aboutdevelopment issues. An objective of the series is to get the findings out quickly, even if the presentations are less than filly polished. Thepapers carry the names of the authors and shouild be cited accordingly. The findings, interpretations, and conclusions expressed in thispaper are entirely those of the authors. They do not necessarily represent the view of the World Bank, its Execuitive Directors, or the
countries they represent.
Produced by the Research Advisory Staff

Mexico - Technology, Wages, and Employment
DETERMINANTS OF TECHNOLOGY ADOPTION IN MEXICO
Gladys L6pez-Acevedol
JEL Codes: L60 ; L20 ; J31 and J38.
1 This research was completed as part of the "Mexico - Technology Wages and Employment" study at the WorldBank. We are grateful to the INEGI for providing us with the data. Joseph S. Shapiro and Erica Soler providedvaluable research and editorial support.


1. Introduction
The creation of new knowledge will not necessarily be at the core of Mexico's technological
evolution, but rather the adoption and application of existing technological knowledge developed
abroad (Bell and Pavitt 1992). In turn, the country's ability to adopt and apply technological
knowledge will be crucially shaped by its absorptive capacity, defined as its capability to learn
and adopt knowledge developed abroad (Audretsch 1995; Cohen and Levinthal 1989).
Moreover, a threshold level of knowledge and technological achievement are prerequisites to
developing significant absorptive capacity (Dosi, Pavitt, and Soete 1990; OECD 1997).
Technology diffuses through many channels. Most technology research in Mexico takes
place on university campuses and receives government guidance (OECD 2000). Therefore, it is
important to measure the impact of government initiatives on new technology adoption (TA) by
firms. This paper seeks to identify the impact that TA policies, firm- and industry-specific factors
have on TA by Mexican firms.
In this effort, we offer two innovations. First, we present detailed analysis of the
heterogeneity involved in TA. Most work uses limited measures of technology, such as research
and development (R&D). Our rich data not only allows us to examine the effect of R&D
spending, but also to look at different types of technology. Second, we measure the effect of
policy measures designed to promote TA. By combining location-specific data of firm
characteristics with data on govermment policies and regional structure, we understand better
how exogenously determined factors affect TA.
We present this paper in six parts, beginning with the Introduction. Section 2 reviews
literature on determinants of TA; Section 3 describes TA patterns in Mexico; Section 4 presents
cross-sectional results; Section 5 presents panel data results, and Section 6 offers conclusions.
3

2 Determinants of Technology Adoption
Technology diffusion occurs when a user adopts technology that the user did not invent.
Whenever a firn uses a technology developed by another company, the firm experiences the
benefits of technology diffusion. In Mexico, where private R&D investment is very low
compared to other countries and new technologies are costly, effective technology diffusion is
crucial. In essence, technology diffusion is just a special case of TA.
In an analysis of Mexico, Blomstrom, Kokko, and Zejan (1992) investigate what policy
measures encourage multinational corporations (MNCs) to bring technologies into countries
outside their headquarters. Since much technology used in Mexico is developed outside of
Mexico, such encouragement can be crucial. They find that local competition most encourages
imports of technology by MNC subsidiaries. Thus, a way to maximize the inflow of modem
technology is to create a competitive environment in which firms must operate.
Foreign direct investment (FDI) is the major technology diffusion channel in developing
countries like Mexico (OECD 2000). Since MNCs undertake much of international R&D, they
also determine international technology flows. Most developing countries have limited R&D
budgets and heavily depend on foreign-developed technology. It may be that MNC subsidiaries
use advanced technologies in international markets and provide technical training to local firms
through FDI and worker training, thereby adding to the country's human capital base and
increasing technology through FDI.
Others doubt that the technology of MNCs benefits local producers (Blomstrom and
Kokko 1998). Some authors argue that MNCs keep technology within their own control, so
geographic technology transfer occurs but technology diffusion to other companies does not
(Cantwell 1989; Haddad and Harrison 1993; Aitken and Harrison 1992). Blomstrom (1989)
suggests that technology transfers to domestic firms come from spillovers rather than from
formal transactions (Caves 1974; Globerman 1979; Blomstrom and Persson 1983; Blomstrom
and Wolff 1994).
4

Besides investigating what kind of environment encourages TA, research also examines
what firm-type is most likely to adopt technology. Firm size is a widely-recognized determinant
of TA. Larger firms tend to support the high costs of new technology, and may find a broader
range of technologies that meet their needs. The larger a firm's size, the more technology it
adopts. Several studies have confirmed this finding (Mansfield 1961; Davies 1979; Romeo 1975;
Globerman 1975), and it may be the most robust determinant of TA.
Trade liberalization is a major tool of increasing competition, and in support of
Blomstrom and others (1992), several studies correlate liberalization with technology diffusion
(Grossman and Helpman 1991, Romer 1994, and Young 1991, find that trade liberalization
contributes to economic growth through productivity growth). Liberalization increases the
variety of intermediate inputs to manufacturing, facilitates knowledge-transfers, amplifies
learning-by-doing effects, and increases the size of consumer markets. These changes encourage
diversification within a firm and, correspondingly, TA. Romer (1994) argues that trade
distortions may effect productive efficiency by preventing the implementation of new
technology, and by limiting the incentive to develop new products. Iscan (1998) finds that after
liberalization, total factor productivity (TFP) in Mexican manufacturing increased in conjunction
with firm exports.
Firms that export might face more competition abroad and so feel pressure to adopt
technology. A recent World Bank and INEGI study (2000) tested the direction of causality
between exporting and enterprise performance. The study attempted to relate exports and inter-
firm linkages to TA and technical training, but found that the relationship was statistically
insignificant.
Another determinant of TA is the availability of appropriately complex technology. Like
other variables, its effect is unclear from a theoretical perspective. Some authors argue that the
advanced technology used by many MNCs is too complex to improve basic manufacturing in
developing countries (Lapan and Bardhan 1973; Cantwell 1989; Haddad and Harrison 1993).
Others argue that some technical gap between the host country and the MNC is necessary for the
5

host country to receive any benefit, so spillovers grow proportionally with the technology gap
(Blomstrom and Wang 1992; Blomstrom and Wolff 1994).
Torres (2000) provides an interesting result using state-level basic factor analysis. The
author finds that science ability, represented by variables like public expenditure on R&D,
number of universities, number of published articles, and number of researchers, significantly
influences technology diffusion.
In sum, the literature finds that variables such as FDI, local competition, complexity of
available technology, trade liberalization, foreign capital in a firm, and regional science ability
influence a firm's use of technology. To paint a full picture of technology diffusion, we include a
broad array of variables representing all of these factors.
3. Patterns of Technology Adoption: Descriptive Statistics
In this section we discuss what kinds of firms most frequently adopt new technology. We
use data from the National Survey of Employment, Salaries, Technology, and Training
(ENESTYC) for 1992 and 1999.
Since this section uses simple statistical averages rather than regressions controlling for
relevant variables, the reader should not interpret cause (size encourages adoption) from
correlation (larger firns adopt more). Studies on technology diffusion in North America and
Europe identify firm size as a significant determinant of TA; Figure 1 shows similar results for
Mexico. In 1999, while more than 40 percent of all Mexican manufacturing firms adopted some
type of new technology, the exact share increases in conjunction with firm size. While only 38
percent of microenterprises adopted new technology, 78 percent of small enterprises, 87 percent
of medium-size enterprises, and 93 percent of large enterprises adopted new technology in 1999.
The relationship between TA and firm size did not change between 1992 and 1999. But
TA was considerably lower in 1992 for all firm sizes than it was in 1999. Prior to trade
liberalization, less than 30 percent of firms had engaged in TA-microenterprises had a TA rate
6

of just under 25 percent, small enterprises had a TA rate of 53 percent, medium-size enterprises
had a TA rate of 71 percent, and large enterprises had a TA rate of 80 percent.
Figure 1. TA by Firm Size, 1992 versus 1999
F -° -- -- |-- -- - -C --
100
05 nnl _ ______ * -_*__
I _ Micr-nl dwn Lre Ttu
80- - - -
70.
o 60 -- -- _0[199
50. - -
Tb40 1 sii y
30~ -
20----
10 -
Micro SmallMediumn Large Total
Source. Author's calculations based on ENESTYC 92 and 99.
Table 1 shows that TA in 1999 varies considerably between different types of
technology, decreasing with the complexity of the technology adopted.2 The TA rate varies from
20 percent for manual equipment to 0.8 percent for computerized numeric controlled machinery
(CNCM). Large firms are the most likely to adopt robots. However, adoption rates for numeric
controlled machinery (NCM) and CNCM vary considerably across firn size. Only 0.6 percent of
microenterprises had adopted numeric controlled or computerized technology. However, 10.4
percent of small enterprises, 16.6 percent of medium-size enterprises, and 21 percent of large
enterprises adopted this kind of technology. Thus, larger firms seem to adopt more complex
technology than their smaller counterparts.
Table 1. TA by Technology Type and Firm Size, 1999Percent of firms that adopt technology
Type of technology Micro Small Medium Large All
Manual equipment 20.0 18.2 12.8 6.5 19.7Automatic equipment 10.6 22.4 18.7 16.4 11.5Machinery tools 7.2 26.7 38.6 47.3 9.3NCM 0.5 4.4 4.9 5.5 0.9CNCM 0.1 6.0 11.7 15.5 0.8Robots 0.0 0.0 0.7 1.5 0.0
Source: Author's calculations based on ENESTYC 99.
2 Annex I shows descriptive statistics for 1992.
7

The propensity of TA for firms engaged in training their workers also increases in
conjunction with firm size. While TA rates and reliance on worker training positively correlate,
the links between them vary considerably across finn size. Figure 2 shows that only 36 percent
of microenterprises without training adopted technology, but 67 percent of the microenterprises
that did provide training adopted technology. This difference in TA by training condition is less
noticeable for large firms, where 88 percent of the firms without training adopted technology
versus 93 percent of the firms that train workers.
Figure 3 shows that export-oriented firms have higher TA rates (83 percent) than non-
export oriented firms (41 percent). This rate varies by firm size, but as in the training case, the
difference in TA between export-oriented firms and other firrns is much higher for
microenterprises than for other firm sizes.
Figure 2. TA by Training and Firm Size, 1999 Figure 3. TA by Export Status and Firm Size, 1999r
9 0 - __-__ _ I } 9 0 1- - ._ _ _ - - - _ _ ..........................
s00 l l 0 i K70--- 70
a5'60- - 60 ~ -- -
50- so__
tt0 _ _ ~~~~ ,_ 10
40 40I
30- 30
20 ~~~~~~~- 20-
to ~ ~ ~ - / ~10 ' -
S U ~~~~~~~~~~~~~~~~~~~~~~0Micro Small Medium Large All Micro Small Medium Large All
n Fimtha athtroir ltvoeo Ushom n E.poe orim nnes U OthrSirms
Source: Author's calculations based on ENESTYC 99. Source: Author's calculations based on ENESTYC 99
Figure 4 shows that TA rates vary between different manufacturing industries. TA is
relatively high in basic metal industries (81 percent), chemical products, oil derivatives, and coal
(67 percent), and metal products, machinery and equipment (61 percent). Just as TA varies
across industries, it also varies for each firm size within an industry (Table 2).
8

Figure 4. TA by Industry, 1999
90
> 80
70
60
'~50
40
20 --- -
II~~~~~~~~~~~~~~~~~~~~~~~~~~~~~~~~~~~~~~~~I
Source: Author's calculations based on ENESTYC 99.
Table 2. TA by Industry and Firm Size, 1999Division Percent of firms that adopt technology
Micro Small Medium Large AllFood, beverage, tobacco 32.1 66.2 86.3 91.6 33.9Textiles, clothing, leather 26.2 84.6 86.1 92.4 34.2Wood, wood products 42.5 78.5 77.4 85.9 44.3Paper, paper products 47.6 81.9 79.1 89.7 51.8Chemical products, oil derivatives, coal 55.6 77.6 91.8 94.6 66.6Non-metallic minerals 27.0 65.5 86.3 88.0 28.8Basic metal industries 61.2 89.8 87.6 98.0 81.1Metal products, machinery, equipment 58.4 83.7 91.4 94.0 61.5Other manufacturing industries 43.6 62.4 89.1 97.1 46.2
Source Author's calculations based on ENESTYC 99.
TA also varies within regions, with firms located in the North having the highest
adoption rates. As Figure 5 shows, in 1999, 53 percent of Northern firrns adopted technology, 43
percent of firms in the Capital adopted technology, 41 percent of firms in the Center region
adopted technology, and only 32 percent of Southern firms adopted technology. We also observe
that TA increased within each region between 1992 and 1999.
Figure 6 shows the adoption of different technology types by region. We observe that
more than 25 percent of firms in the Central region adopt more complex technology (NCM,
9

CNCM, and robots). In the South only 15 percent of firms adopt more complex technology. The
most prevalent technology in all regions is machinery tools.
Figure 5. TA by Region, 1992 versus 1999
60
o50
40 _
o L~30 - __ 1992
Figure 6. T R o T1999
20
10-
0
North Center South Capital
Source: Author's calculations based on ENESTYC 92 and 99.
iure 6. TA by Region and Technology Type, 1992-1999
North Center
*a d...scq..ps. 45m.S14 N 17\0% II \h;cc,yWlS
M_lc_ps \ \ ~~~~~~53.K6X _
0 506X3% N~~~~~~~~~~~~~~C CM
It9 CM 3 X 1~~~ ~ ~~~~~~~~~~~~6 5% *5
Capital South
43% i 61%
CNCR NCM CCM NCM,_._ 3ase on the E16% *9 a
Source: Author's calculations based on the ENESTYC 1992-99 panel.

4. Technological Adoption: The Cross-Sectional Approach
4.1. Mlethodology
As Kokko (1994) notes, empirical approaches to technology transfer generally model
labor productivity of local firms as a function of the market share of multinational subsidiaries
and of the other variables described in section 2 (Caves 1974; Globerman 1979; Blomstrom and
Persson 1983). If evidence shows that the presence of multinational corporations (MNCs)
increased the labor productivity of local firms, a study concludes that spillovers took place.
Grether (1999) uses a different production function to examine Mexico.3 The author first
estimates a firm's multifactor productivity. She uses this measure rather than labor productivity
because multifactor productivity is not biased by changes in the input mix. In her view, an
increase in multifactor productivity may reflect the acquisition of an additional input, so smaller
efficiency dispersion suggests superior technology diffusion. She then computes a multivariate
regression using plant-specific, sector-specific, and location-specific variables as possible
determinants of technology diffusion.
Since the ENESTYC has information on the different types of technology that firms
adopt, we need not assume (as we would have to in a production function approach) that a new
technology input increases productivity.
This section estimates TA likelihood using cross-sectional logits for 1992 and 1999. The
advantage of the cross-sectional models is that they enable comparison between TA changed in
the early 1990s to TA later in the decade. Since Mexico experienced exogenous shocks during
our sample period from the North American Free Trade Agreement (NAFTA) and the 1994
crisis, a sudden structural change took place during our survey. Therefore we expect that patterns
from the first part of the 1 990s might not continue through the rest of the decade.
In order to understand this change thoroughly, we use three categories of absorptive
capacity - firm-, industry-, and region-specific factors. We measure firm-specific factors by
including dummy variables for firm sizes, firm age, labor skill level, R&D spending, foreign
ownership of the firm, subsidiary firm, export tendency, formal training, maquila status, and
union status. We measure firm age in years after startup. Literature provides strong evidence that
TA likelihood positively relates to firm age. We know considerably less about the impact of
foreign ownership on the likelihood of TA. The absorptive capacity may be greater and the cost
of adopting technology lower if a firm has strong links to foreign enterprises. This would suggest
a positive relationship, thus the share of capital in the firm held by foreign owners positively
correlates with TA.
A skilled and educated workforce also enhances the absorptive capacity of a firm (Cohen
and Levinthal 1989). We measure the shares of the firm employment accounted for by highly
skilled, semi-skilled, and less-skilled workers. Since highly skilled workers enhance a firm's
absorptive capacity, we expect that TA likelihood increases with a firm's skill base. We also
expect that worker training to increase human capital increases absorptive capacity. We include a
dummy variable reflecting if the trainer that the firm hires comes from the public sector.
Another dimension of absorptive capacity is R&D. Investment in R&D, measured as the
share of firm expenditures accounted for by R&D spending, should increase TA likelihood. But
this measure does not include investment destined for technological transfer or equipment
acquisition. To account for this exclusion, we include a variable that exclusively measures firm's
expenditures on technology transfer or equipment acquisition. We expect this variable to
positively correlate with TA.
Since R&D from different sources may have different impacts on absorptive capacity, we
include dummy variables to reflect five different R&D sources: consulting firms, public research
institutions, private research institutions, the non-R&D department of the firm, and the R&D
3Alternative methodologies, such as the framework that Fare, Grosskopf, and Lovell (1994) use, allow us toestimate productive efficiency
12

department of the firm. Clearly, R&D more closely linked to the firm's production will have
greater influence on the firm's absorptive capacity.
Since maquilas are foreign assembly plants with distinct industry groups and policy
regulation, we measure whether maquilas are more likely to adopt technology.
We measure industry-specific factors by including dummy variables for each of the nine
major manufacturing sectors: (1) food, beverages, and tobacco; (2) textiles, clothing, and leather;
(3) wood and wood products; (4) paper and paper products; (5) chemicals, oil derivatives, and
coal; (6) non-metallic mineral products; (7) basic metal industries; (8) metal products,
machinery, and equipment; and (9) other manufacturing industries.
To determine the effect of location, we include three measures of regional science
capacity, which we hypothesize to correlate with absorptive capacity: individuals with a science
degree, government expenditure on R&D, and researchers registered in the federal or state
systems. We measure these as percentages of the population by state.
To develop a fuller understanding of technology, we distinguish between five types of
technology that a manufacturing firm may adopt: (1) any type of technology; (2) automatic
equipment; (3) machinery tools; (4) CNCM, and (5) robots.
4.2. Empirical evidence
Although we have results of varying significance for all firm, industry, and region
specific factors, we only discuss statistically significant results. A tabular presentation of the
results from the best logit model appears in Tables A2. 1 and A2.2.
A. Any type of technology
Firm factors. Firm size strongly correlates with TA likelihood, as microenterprises are
less likely to adopt technology than their larger counterparts. On the whole, TA likelihood
13

positively relates to firm size, even after controlling for factors that could cause bias. In 1999, a
firm's age negatively relates to TA likelihood, while there is no significant relationship in 1992.
A strong positive relationship between the shares of different skills labor and TA likelihood
appears in both years. Firms providing formal training are also more likely to adopt technology.
In 1999, public training is positively correlated with the likelihood of TA. TA likelihood
correlates both with R&D intensity and with transferred technology. Firm R&D investment
promoted TA in both years. In 1999, it appears that R&D from public research institutions, from
a firm's own research department or from another department encouraged TA, while in 1992
only R&D from public research institutions encouraged TA. A firm's status as a maquila related
negatively to TA likelihood in 1992, but related positively in 1999; the same results appear in
subsidiary firms. Union presence positively relates to TA likelihood.
Industry factors. Controlling for firm-specific characteristics, TA likelihood is
significantly lower in textiles, clothing, leather, wood, wood products, and in non-metallic
mineral product industries than in other industries. Understandably, these are three industries
where technology plays little role in production. In contrast, firms in basic metal industries, and
firms producing goods that do not fit in one of the eight standard categories exhibit a markedly
higher likelihood of TA.
Regional Factors. Science graduates and researchers per capita are positively correlated
with the likelihood of TA. But, surprisingly, there is a negative relation with public expenditure
in R&D and TA likelihood.
B. Automatic equipment
Firm factors. Small firms have a higher likelihood of adopting automatic equipment than
other firms in 1999. The effect of firm age in the likelihood of TA shifted from positive in 1992
to negative in 1999. Foreign ownership firms are less likely to adopt automatic equipment than
other firms. Subsidiary firms increase the likelihood of adopting automatic equipment in 1999,
but in 1992 subsidiary firms are less likely to adopt automatic equipment. The shares of semi-
skilled and low skilled workers positively relate to the adoption of automatic equipment. In 1999,
14

formal training correlates positively and strongly with the likelihood of adopting automatic
equipment, but hiring a public trainer correlates negatively with the adoption of this technology.
A firm's R&D investment is only significant in 1992. In this year, a firm's investment in
technology transfer increases its likelihood of adopting automatic equipment, while the firm's
investment in R&D has the opposite effect. Also in 1992, R&D from public institutions
increased the likelihood of adopting automatic equipment. Export-oriented firms are more likely
to adopt automatic equipment than other firms in 1999, while in 1992 the presence of a union
increased a firm's likelihood of adopting automatic equipment.
Industry factors. Adoption of automatic equipment is quite likely in all industries in
1999, but most likely in basic metal industries.
Regional factors. The frequency of science graduates seems to lower the likelihood of
adopting automatic equipment in 1999, but it increased the likelihood in 1992. The effect of
location changed markedly from 1992 to 1999. In 1992, firms in the Central region were the
most likely to adopt automatic equipment and firms in the Capital region were the least likely to
adopt automatic equipment. However, in 1999, firms in the Capital region were the most likely
to adopt automatic equipment, and firms in the South were the least likely to adopt automatic
equipment.
C. Machinery tools
Firm factors. The adoption of machinery tools strongly correlates with firm size, as large
firms are more likely to adopt machinery tools than medium firms, which in turn are more likely
to adopt machinery tools than small firms. Firms age reduces the likelihood of adopting
machinery tools. High shares of semi-skilled and low skilled workers encourage adoption of
machinery tools. Formal training strongly and positively correlates with the likelihood of
adopting machinery tools, and public training also increases the likelihood of adopting
machinery tools. A firm's investment in R&D and technology transfer increases the likelihood of
adopting machinery tools. In 1999, R&D from public institutions and a firm's department other
than R&D represented a higher likelihood of adopting machinery tools. Maquila firms are less
15

likely to adopt machinery tools than other firms. In 1992, export-oriented firms were less likely
to adopt machinery tools than other firms, while in 1999 firms with a union were more likely to
adopt machinery tools.
Industry factors. In 1992, the food, beverages, and tobacco industry was the least likely to
adopt machinery tools. In 1999, paper and paper products firms were the most likely to adopt
machinery tools.
Regional factors. In 1992, prevalence science graduates and researchers decreased the
likelihood of adopting machinery tools, but in 1999 their prevalence had no significant effect on
the adoption of machinery tools. Firms located in the Capital region were the most likely to
adopt machinery tools in 1992. In 1999, a firm's location in the Capital region did not affect its
TA likelihood, but firms in the Central and South regions were still less likely to adopt
machinery tools than firms in the North.
D. Computerized numeric controlled machinery
Firm factors. The adoption of CNCM also strongly correlates with firm size. Formal
training strongly increases the likelihood of adopting CNCM. A firm's investment in R&D
positively correlates with the adoption of CNCM in 1999; the same is true of R&D from a firm's
department other than R&D.
Industry factors. In 1992, the paper, paper products, and chemical products industries
were the most likely to adopt CNCM. In 1999, the metal products, machinery, equipment, paper
and paper product industries were the most likely to adopt CNCM.
Regional factors. In 1992, the nearby presence of science graduates and researchers
increased a firm's likelihood of adopting CNCM, while public expenditure in R&D reduced the
likelihood of adopting this technology type. Firms located in the Capital region were the least
likely to adopt CNCM in 1992.
16

E Robots
Results for robots are insignificant due to insufficient observations. The proportion of
firms that reported adopting robots is very small. Nevertheless, there is a strong correlation
between firm size and robot adoption appears despite the small sample.
To relate a variable to technologies of different complexity, we estimated multinomial
logit models for 1992 and 1999. These estimations included six types of technology: manual
equipment, automatic equipment, machinery tools, NCM, CNCM, and robots. We can order
these technology types from simple manual technology to highly complex CNCM and robots.
The results appear in Tables A2.3 and A2.4. An increasing importance of firm size and skilled
workers with the likelihood of adopting more complex technology can be appreciated.
5. Determinants of Technology Adoption: Panel Estimation
5. 1. Methodology
The cross-sectional approach gives us a photo album of single-year snapshots that show
TA patterns at different times. Panel data gives us real time video showing how patterns change.
To put it in another way, cross-sectional data gives us points on a curve. Panel estimation shows
curve slope at different points, but we need both levels and rates of change to fully understand
TA. Another benefit of using both types of analysis is that, while results for a particular category
may be insignificant for cross-sectional estimation, the results may become significant in panel
estimation. In order to understand TA determinants better, we use the following probit model
(following Tan (2000)):4
Pr(Adopt)it = ±,) + A3jXi- + / 2Share, + / 3Regiont + , (1)
where:
Adopt,t = a dummy variable denoting technology adoption in period t for firm i;
17
XU5, = a vector of firm attributes; 5
Sharet = the rate of technology adoption at time period t, differentiated by
technology type;
Region, = the geographical region where the firm is located at time period t;
= normal regression error.
5.2. Empirical Evidence
Results from the best probit random effects model are shown in Tables A3. 1 -A3.3. These
tables summarize estimations for the 1992-95, 1995-99 and 1992-99 periods. The results
distinguish five types of technology: (1) any technology type; (2) automatic equipment; (3)
machinery tools; (4) CNCM, and (5) robots.
A. Firm Factors
Size. For the 1992-99 period, medium and large firms, 57 percent and 66 percent
respectively, are more likely than micro and small firms (the omitted category) to adopt some
type of technology. Large firms are 43 percent more likely to adopt machinery tools and 93
percent more likely to adopt CNCM. Medium-size firms are also more likely than micro and
small firms to adopt machinery tools and CNCM. For the 1992-95 period, firm size negatively
correlates with TA, while in the 1995-99 period the correlation is positive. This result may come
about because NAFTA and the economic crisis of 1994 encouraged medium and large
manufacturing firms to acquire technology to compete globally.
Age. Adoption of machinery tools positively relates to firm age, while adoption of
automatic equipment negatively relates to firn age. One reason for this is that our sample only
includes firms that survived through the entire period. Surviving small firms may be more
flexible than surviving large firms.
4 To control for persistent technology adoption, equation (1) was also estimated following Wooldridge's (2001)methodology. The parameter estimates remain robust to those shown in Annex 3.
18

Foreign ownership. For the 1992-99 period, foreign ownership increased the probability
of adopting automatic equipment and TA overall by 23 percent. For the 1995-99 period, foreign
ownership increased the probability of acquiring robots by 42 percent. For the 1992-95 period,
foreign ownership had an important influence on the adoption of CNCM.
Skill. Skilled workers and human capital tend to enhance the absorptive capacity of firms
(Cohen and Levinthal 1989). We expect that the presence of skilled labor will encourage TA, but
that unskilled labor will negatively relate to TA. Results show that, for the 1992-95 period, the
number of highly skilled employees positively correlates with TA, and for the 1992-99 period, it
positively correlates with the adoption of automatic equipment. The number of professionals,
technical employees, managerial employees, and semi-skilled workers shapes a firm's TA
patterns.
Training. Intuitively, training workers should enhance a firm's absorptive capacity. The
positive and significant coefficient of the training variable in our regression suggests that training
does indeed enhance absorptive capacity. For the 1995-99 and 1992-99 periods, training
positively correlates with TA. For the 1992-99 period, a firm that trains workers is 20 percent
more likely to adopt some type of technology, and 41 percent more likely to adopt CNCM than a
firm that does not provide training. For the 1992-95 and 1995-99 periods, training positively
correlates with the adoption of more complex technology, like CNCM.
R&D. Firm investment in R&D is also positively related to the adoption of complex
technology. Moreover, a firm's investment in technology transfer increases the probability of
adopting CNCM in the 1992-95 and 1992-99 periods, and increases the probability of adopting
robots in the 1995-99 period.
Maquila. The technology performance of maquila firms differed between 1992-95 and
1995-99. We find that the probability of TA for maquila firms in the earlier period is 10 percent
5 We lag skill shares by one period (to the previous period's levels) to preclude bias from skill changes that occurduring the period of technology adoption. The use of lagged skill shares measures restricts the sample of firms.
19

higher than for non-maquila firms. However, in the later period, it is 32 percent lower than for
other firms.
Exports. For the 1992-95 period, a firm's status as an export-oriented firm positively
correlated with TA, and specifically with automatic equipment. However, we observe a negative
relationship between exports and the adoption of machinery tools for the 1995-99 period. The
1992-99 period had no significant relations between export-oriented firms and the adoption of
different types of technology.
B. Regional Factors
For the 1992-99 period, firms in Mexico City seemed less likely than firms in the North
(the omitted category) to adopt some type of technology. There was a similarly strong
relationship for the adoption of machinery tools. Surprisingly, for the 1995-99 period, firms in
the Central and South regions were more likely to adopt CNCM than firms in the North. For the
1992-95 period, firms in the South and Capital regions were less likely to adopt technology than
firms in the North. We can conclude that, in general, firms located in the North are more likely to
adopt technology than firms located in other regions.
C. Technology Diffusion Rate
Significant limitations only allow us to estimate technology diffusion for the 1992-99
period. The effect of the technology diffusion rate is positive for the adoption of any type of
technology, automatic equipment, and machinery tools, suggesting that a firm is more likely to
adopt a technology if other firms are using the technology.
5.3 Technological Intensity
Another measure of TA involves not just whether a firm adopts technology, but the
degree to which it uses this technology. We refer to this degree as the intensity in the use of new
technology. We measure technological intensity as the share of production equipment that the
20

technology accounts for. Tables A3.4-A3.6 compare technological intensity for six types of
technology: manual equipment, automatic equipment, machinery tools, NCM, CNCM, and
robots.
From the panel tobit estimations for the 1995-99, and 1992-99 periods, we find that
intensity in the use of more complex technologies is positively correlated with firm size.
However, for the 1992-95 period, we find that the opposite relation: larger firms are negatively
correlated with the intensity in the use of more complex technologies. We also find that the share
of semi-skilled and unskilled workers, for the 1992-99 period, reduces the intensity in the use of
NCM, for the 1995-99 period, reduces the intensity in the use of manual equipment, and for the
1992-95 period increases the intensity in the use of machinery tools.
For the 1992-99 period, training increases the intensity in the use of automatic equipment
and CNCM, for the 1995-99 period. For the 1992-95 and 1995-99 periods, training is positively
correlated with the use of more complex technologies, while it reduces the use of more simple
technologies. We find the same patterns with investments in R&D, for all the three periods, R&D
increases the intensity in the use of more complex technologies, while it reduces the intensity in
the use of more simple technologies such as manual equipment and machinery tools.
For the three periods, export oriented firms are positively correlated with the intensity in
the use of robots, while the presence of a union reduces the intensity in the use of machinery
tools. The fact that a firm has joint activities has no effect in the technological intensity. Finally,
firms located in the North are related with more intensively use of automatic equipment, and less
intensively use of machinery tools, than the other regions.
6. Prolonged Activity
We want to be able to predict the likelihood of a firm's activity at time t+I by knowing
its actions at time t. To summarize this analysis, Table A4.1 shows conditional means for certain
types of activity in 1999, given the activities in 1992.
21

We find consistency in export, training, and technology activities over time. In other
words, a firm that receives over half its sales from exports, trains its workers, or adopts
technology in 1992 is quite likely to do so again in 1999. In addition worker training precedes
and strongly correlates with TA. A firm that did not adopt technology but did train its workers in
1992 has an 89 percent likelihood of adopting technology in 1999. The same phenomenon
appears with exports: a firm that exported but did not adopt technology in 1992 has a 79 percent
chance of adopting technology in 1999. Although part of this increase in technology adoption
between periods is exogenous-TA rates for all firms increased by five to twenty-five percent
between 1992 and 1999 (Figure 2)-the exogenous effect cannot explain all of the increase for
non-adopting export and training firms.
7. Conclusions
Two main conclusions appear from this paper. First, we can generally predict a firm's TA
likelihood by knowing a few of its characteristics. TA likelihood increases with firm size. Firms
that train workers, have a high share of skilled labor, have a high proportion of foreign capital,
have large R&D budgets, and are located in the North are most likely to adopt new technologies.
Moreover, subsidiary firms and firms with a union strongly increase the likelihood of TA in
1999. Firms adopting the most complex technologies are large, train workers, and have large
R&D budgets. There is an increasing amount of skilled workers with the likelihood of adopting
more complex technology. Also, larger firms, firms with a large share of highly skilled workers,
and firms that train workers use intensively more complex technologies in their production
process.
Second, public policy can influence TA pattems in two main ways. The first is direct-by
sponsoring formal training, funding R&D, or facilitating the formation of clusters or backward
linkages, for example. The second mechanism is broader and develops through changes in the
extemal enviromnent. NAFTA, for example, appears to have significantly increased TA
likelihood. Overall, TA rates increased considerably between 1992 and 1999.
22

The OECD (2000) emphasizes that governments can improve the effectiveness of R&D
expenditure by supporting proliferation of venture capital and credit institutions. Public/private
partnerships with selective participation also maximize the value of government R&D
expenditure. These partnerships could take the form of shared seminars, working groups, or
regular discussion meetings. Inviting private sector representatives to policy planning meetings
offers a good way of integrating public priorities with private needs. Additionally, public
research expenditure should focus on basic knowledge and broad findings that can aid a wide
variety of industries.
23

References
Aitken, B. and A. Harrison. 1992. "Does Proximity to Foreign Firms Induce Technology Spillovers?Evidence from Panel Data." MIT, Cambridge. Processed.
Bell, M. and K. Pavitt. 1992. "Accumulating Technological Capability in Developing Countries."Proceedings of the World Bank Annual Conference on Development Economics, Supplement to TheWorld Bank Economic Review and The World Bank Research Observer, Washington D.C.
Blomstrom, M. 1989. Foreign Investment and Spillovers. London, Routledge.
Blomstrom, M. and A. Kokko. 1998. "Multinational Corporations and Spillovers." Journal of EconomicSurvey 12(3) :247-77.
Blomstrom, M., A. Kokko and M. Zejan. 1992. "Host Country Competition and Technology Transfer byMultinationals." Working Paper 4131. National Bureau of Economic Research.
Blomstrom, M. and E. N. Wolff. 1994. "Multinational Corporations and Productivity Convergence inMexico." In W. Baumol, R. Nelson and E. Wolff, eds., Convergence of Productivity: Cross-NationalStudies and Historical Evidence. New York: Oxford University Press :263-84.
Blomstrom, M. and H. Persson. 1983. "Foreign Investment and Spillover Efficiency in anUnderdeveloped Economy: Evidence from the Mexican Manufacturing Industry." WorldDevelopment 11(6) :493-501.
Blomstrom, M. and J. Y. Wang. 1992. "Foreign Investment and Technology Transfer: A Simple Model."European Economic Review 36(1):137-55.
Cantwell, J. 1989. Technological Innovation and Multinational Corporations. Oxford: Basil Blackwell.
Caves, R. E. 1974. "Multinational Firms, Competition, and Productivity in Host-Country Markets."Economica 41(162) :176-93.
Cohen, W. M. and D. A. Levinthal. 1989. "Innovation and Learning: The Two Faces of R&D." EconomicJournal 99(397) :569-96.
Davies, S. 1979. Diffusion of Process Innovations. Cambridge: Cambridge University Press.
Dosi, G., K. Pavitt and L. Soete. 1990. The Economics of Technical Change and International Trade.New York: New York University Press.
Globerman, S. 1975. "Technological Diffusion in the Canadian Tool and Die Industry." Review ofEconomics and Statistics 5 7(4) :428-34.
---------. 1979. "Foreign Direct Investment and Spillover Efficiency Benefits in Canadian ManufacturingIndustries." Canadian Journal ofEconomics 12(1):42-56.
Fare, R., S. Grosskopf, and C. A. Lovell. 1994. Production Frontiers. Cambridge University Press.
Grether, J.M. 1999. "Determinants of Technological Diffusion in Mexican Manufacturing: A Plant-LevelAnalysis." World Development 27(7) :1287-98.
Grossman, G. and E. Helpman. 1991. Innovation and Growth in the Global Economy. Cambridge MA:MIT Press.
24

Haddad, M. and A. Harrison. 1993. "Are there Positive Spillovers From Foreign Direct Investment?Evidence From Panel Data for Morocco." Journal of Development Economics 42(1) :51-74.
Iscan, T. 1998. "Trade Liberalisation and Productivity: A Panel Study of the Mexican ManufacturingIndustry." Journal of Development Studies 34(5) :123-48.
Lapan, H. and P. K. Bardhan. 1973. "Localized Technical Progress and Transfer of Technology andEconomic Development." Journal of Economic Theory 6(6) :585-95.
Mansfield, E. 1961. "The Speed of Response of Firms to New Techniques." Quarterly Journal ofEconomics 77.
OECD (Organisation for Economic Co-operation and Development). 1997. Diffusing Technology toIndustry. Government Policies and Programmes. Paris.
---------. 2000. Science, Technology and Industry Outlook. Paris.
Romeo, A. 1975. "Inter-industry and Inter-firm Differences in the Rate of Diffusion of an Innovation."Review of Economics and Statistics 57(2) :311-319.
Romer, P. 1994. "New Goods, Old Theory, and the Welfare Costs of Trade Restrictions." Journal ofDevelopment Economics 43(1):5-38.
Tan, H. 2000. "Technological Change and Skills Demand: Panel Evidence from MalaysianManufacturing." Working Paper. The World Bank Institute.
Torres, E. 2000. "Diferencias Estatales en la Especializaci6n Tecnologica y Cientifica de Mexico."CONACYT (Consejo Nacional de Ciencia y Tecnologia). Processed.
Wooldridge, J. M. 2001. "The Initial Conditions Problem in Dynamic, Nonlinear Panel Data Models withUnobserved Heterogeneity." Michigan State University, Department of Economics. Processed.
World Bank. 1998a. "Enhancing Total Factor Productivity Growth." Report No. 17392-ME (GrayCover).
---------. 1998b. "Knowledge and Innovation Project." PAD, Report No. 17896.
---------. 2000. "Export Dynamics and Productivity: Analysis of Mexican Manufacturing in the 1990s."Report No. 19864-ME (Green Cover), September.
Young, A. 1991. "Learning by Doing and the Dynamic Effects of International Trade." Quarterly Journalof Economics 106(2) :369-405.
25
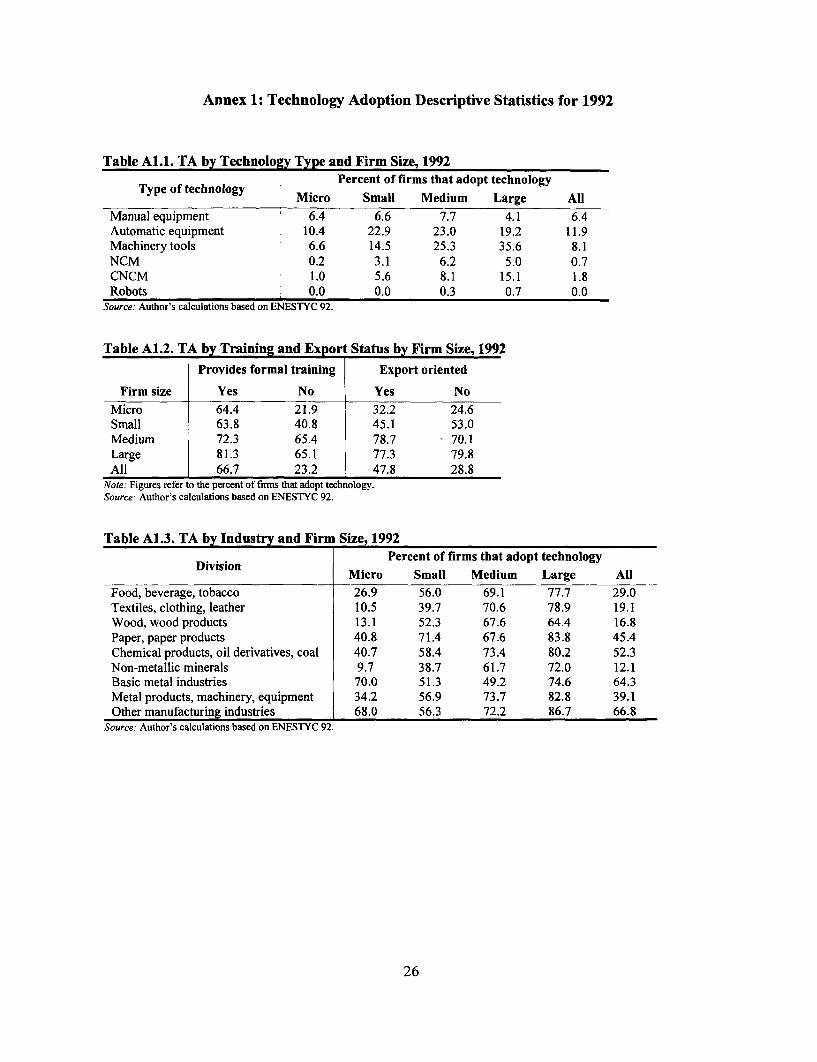
Annex 1: Technology Adoption Descriptive Statistics for 1992
Table A1.1. TA by Technology Type and Firm Size, 1992Percent of firms that adopt technology
Type of technology Micro Small Medium Large All
Manual equipment 6.4 6.6 7.7 4.1 6.4Automatic equipment 10.4 22.9 23.0 19.2 11.9Machinery tools 6.6 14.5 25.3 35.6 8.1NCM 0.2 3.1 6.2 5.0 0.7CNCM 1.0 5.6 8.1 15.1 1.8Robots 0.0 0.0 0.3 0.7 0.0
Source: Author's calculations based on ENESTYC 92.
Table A1.2. TA by Training and Ex ort Status by Firm Size, 1992Provides formal training Export oriented
Firm size Yes No Yes NoMicro 64.4 21.9 32.2 24.6Small 63.8 40.8 45.1 53.0Medium 72.3 65.4 78.7 70.1Large 81.3 65.1 77.3 79.8All 66.7 23.2 47.8 28.8
Note: Figures refer to the percent of firms that adopt technology.Source: Author's calculations based on ENESTYC 92.
Table A1.3. TA by Industry and Firm Size, 1992Division Percent of firms that adopt technology
Division Micro Small Medium Large All
Food, beverage, tobacco 26.9 56.0 69.1 77.7 29.0Textiles, clothing, leather 10.5 39.7 70.6 78.9 19.1Wood, wood products 13.1 52.3 67.6 64.4 16.8Paper, paper products 40.8 71.4 67.6 83.8 45.4Chemical products, oil derivatives, coal 40.7 58.4 73.4 80.2 52.3Non-metallic minerals 9.7 38.7 61.7 72.0 12.1Basic metal industries 70.0 51.3 49.2 74.6 64.3Metal products, machinery, equipment 34.2 56.9 73.7 82.8 39.1Other manufacturing industries 68.0 56.3 72.2 86.7 66.8
Source: Author's calculations based on ENESTYC 92.
26
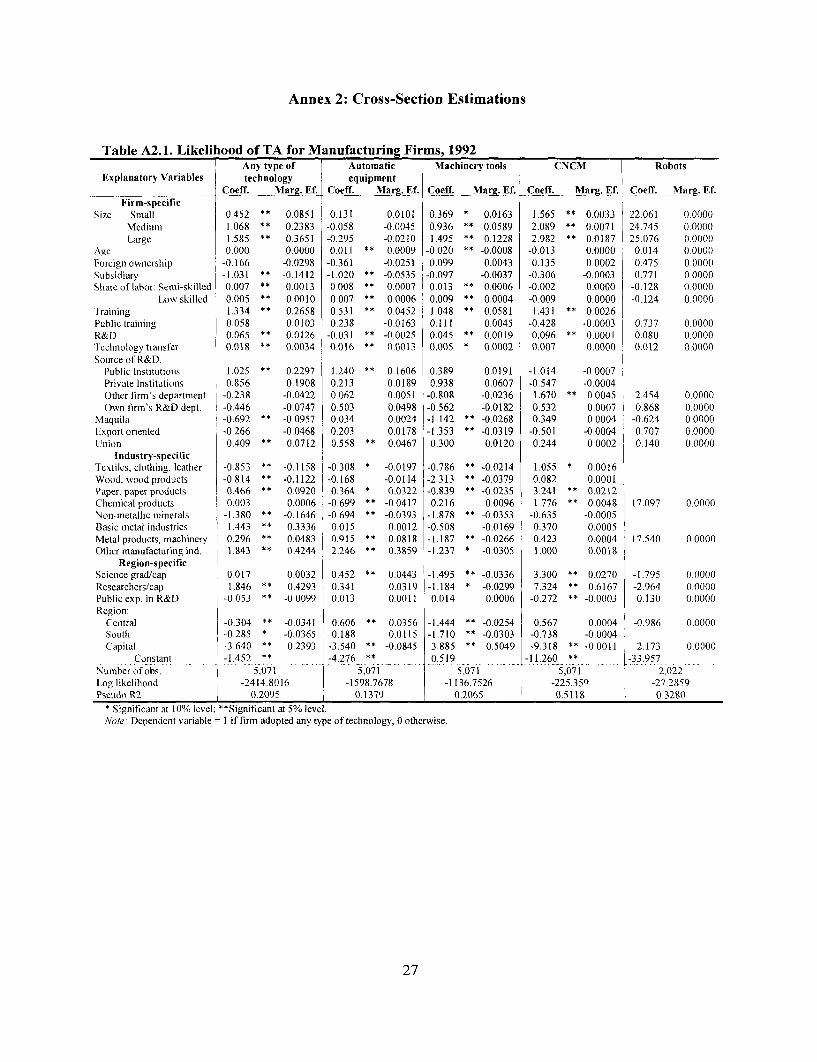
Annex 2: Cross-Section Estimations
Table A2.1. Likelihood of TA for Manufacturing Firms, 1992Any type of Automatic Machinery tools CNCM Robots
Explanatory Variables technology equipmentCoeff. Marg. Ef. Coeff. Mlarg. Ef. Coeff. Marg. Ef. Coeff. Marg. EL Coeff. Marg4f.
Firm-specificSize: Small 0.452 ** 0.0851 0.131 0.0101 0.369 * 0.0163 1.565 * 0.0033 22.061 0.0000
Medium 1.068 ** 0.2383 -0.058 -0.0045 0.936 * 0.0589 2.089 ** 0.0071 24.745 0.0000Large 1.585 ** 0.3651 -0.295 -0.0210 1.495 ** 0.1228 2.982 ** 0.0187 25.076 0.0000
Age 0.000 0.0000 0.011 ** 0.0009 -0,020 ** -0.0008 -0.013 0.0000 0.014 0.0000Foreign ownership -0.166 -0.0298 -0.361 -0.0251 0.099 0.0043 0.135 0.0002 0.475 0.0000Subsidiary -1.031 ** -0.1412 -1.020 ** -0.0535 1-0.097 -0.0037 -0.306 -0.0003 0.771 0 0000Share of labor: Semi-skilled 0.007 ** 0.0013 0.008 ** 0.0007 0.013 ** 0.0006 -0.002 0.0000 -0.128 0.0000
Low skilled 0.005 ** 0.0010 0.007 ** 0.0006 0.009 ** 0.0004 -0.009 0.0000 -0.124 0.0000Traininig 1.334 ** 0.2658 0.531 ** 0.0452 1.048 0.0581 1.431 ** 0.0026Public training 0.058 0.0103 -0.238 -0.0163 0.111 0.0045 -0.428 -0.0003 0.737 0.0000R&D 0.065 ** 0.0126 -0.031 ** -0.0025 0.045 ** 0.0019 0.096 * 0.0001 0.080 0.0000'I-echnology transfer 0.018 ** 0.0034 0.016 * 0.0013 0.005 * 0.0002 0.007 0.0000 0.012 0.0000Source of R&D.
Public Institutions 1.025 ** 0.2297 1.240 ** 0.1606 0.389 0.0191 -1.014 -0.0007Private Institutions 0.856 0.1908 0.213 0.0189 0.938 0.0607 -0.547 -0.0004Other firm's department -0.238 -0.0422 0.062 0.0051 -0.808 -0.0236 1.670 ** 0.0045 2.454 0.0000Own firm's R&D dept. -0.446 -0.0747 0.503 0.0498 -0.562 -0.0182 0.532 0.0007 0.868 0.000()
Maquila -0.692 ** -0.0957 0.034 0.0024 -1.142 ** -0.0268 0.349 0.0004 -0.624 0.0000Exportoriented -0.266 -0.0468 0.203 0.0178 1 t.353 ** -0.0319 -0.501 -0.0004 0.707 0.0000UJnion 0.409 ** 0.0712 0.558 ** 0.0467 0.300 0.0120 0.244 0.0002 1 0.140 0.0000
Industry-specificTextiles, clothing, leather -0.853 ** -0.1158 -0.308 * -0.0197 -0.786 ** -0.0214 1.055 * 0.0016Wood, wood products -0.814 ** -0.1122 -0.168 -0.0114 -2.313 ** -0.0379 0.082 0.0001Paper, paper products 0.466 ** 0.0920 0.364 * 0.0322 -0.839 ** -0.0235 3.241 ** 0.0212Chemical products 0.003 0.0006 -0.699 ** -0 0417 0.216 0.0096 1.776 ** 0.0048 17.097 0.0000Non-metallic minerals -1.380 ** -0.1646 -0.694 ** -0.0393 -1.878 ** -0.0353 -0.635 -0.0005Basic metal industries 1.443 ** 0.3336 0.015 0.0012 -0.508 -0.0169 0.370 0.0005Metal products, machinery 0.296 ** 0.0483 0.915 ** 0.0818 -1.187 ** -0.0266 0.423 0.0004 17.540 0.0000Other manufacturing ind. 1.843 ** 0.4244 2.246 i* 0.3859 -1.237 * -0.0305 1.000 0.0018
Region-specificScience grad/cap 0.017 0.0032 0.452 ** 0.0443 |-1.495 ** -0.0336 3.300 ** 0.0270 -1.795 0.0000Researchers/cap 1.846 0.4293 0.341 0.0319 -1.184 * -0.0299 7.324 ** 0.6167 -2.964 0.0000Public exp. in R&D -0.053 ** -0.0099 0.013 0.0011 0.014 0.0006 -0.272 ** -0.0003 0.130 0.0000Region:
Central -0.304 ** -0.0341 0.606 ** 0.0356 -1.444 ** -0.0254 0.567 0.0004 -0.986 0.0000South -0.285 * -0.0365 0.188 0.0115 -1.710 ** -0.0303 -0.738 -0.0004Capital -3.640 ** -0.2393 -3.540 ** -0.0845 3.885 ** 0.5049 -9.318 ** -0.0011 2.173 0.0000
Constant -1.452 ** -4.276 ** 0.519 -11.260 ** -33.957Numbero ohs. 071.5071 5,071 5,071 2,022Log likelihood -2414.8016 -1598.7678 -1136.7526 -225.359 -27.2859Pseudo R2 0.2095 0.1379 0.2065 0.5118 0.3280
* Significant at 10% level; **Significant at 5% level.Note Dependent variable = I if firm adopted any type of technology, 0 otherwise.
27

Table A2.2. Likelihood of TA for Manufacturing Firms, 1999Any type of Automatic Machinery tools CNCM Robots
Explanatory Variables technology equipmentCoeff. Marg. Ef. Coeff. Marg. Ef. Coeff. Marg. Ef. Coeff. Marg. EL Coeff. Marg. Ef.
Firm-specificSize: Small 1.100 *' 0.0002 0.570 ** 0.0491 0.941 ** 0.0691 2.894 ** 0.0126 14.937 ** 0.0000
Medium 1.311 ** 0.0002 0.290 0.0239 1.319 ** 0.1233 3.575 ** 0.0294 16.861 0.0003Large 1.760 0.0002 -0.029 -0.0021 1.717 * 0.1893 3.789 ** 0.0365 17.058 ** 0.0004
Age -0.040 ** 0.0000 -0.015 ** -0.0011 -0.015 ** -0.0008 -0.008 0.0000 0.000 0.0000Foreign ownership -0.694 -0.0003 -1.346 ** -0.0578 0.426 0.0270 -0.199 -0.0002 0.657 0.0000Subsidiary 0.541 * 0.0001 0.525 ** 0.0445 -0.220 -0.0099 0.459 0.0005 0.608 0.0000Share of labor: Semi-skilled 0.005 ** 0.0000 0.013 *t 0.0010 0.008 ** 0.0004 0.008 0.0000 0.082 0.0000
Low skilled 0.008 ** 0.0000 0.007 ** 0.0005 0.007 ** 0.0004 0.001 0.0000 0.086 0.0000Training 0.469 ** 0.0001 0.457 ** 0.0347 0.405 ** 0.0219 1.236 ** 0.0018 0.558 0.0000Public training 0.402 ** 0.0001 -0.555 ** -0.0308 0.463 *+ 0.0277 0.378 0.0004 0.303 0.0000R&D 2.854 ** 0.0003 0.029 ** 0.0021 0.043 ** 0.0023 0.015 0.0000 0.029 0.0000Technology transfer 0.371 ** 0.0001 -0.056 -0.0040 0.179 * 0.0103 -0.021 0.0000 0.167 0.0000Source of R&D:
Public Institutions 2.602 * 0.0003 -0.474 -0.0286 1.439 ** 0.1430 -0.830 -0.0005 -0.083 0.0000Private Institutions -0.252 -0.0001 -1.507 -0.0431 -0.424 -0.0003Otherfirm'sdepartment 3.989 ** 0.0003 1.038 0.1170 1.238 * 0.1135 -1.230 -0.0006Own firm's R&D dept. 3.197 ** 0.0003 0.710 * 0.0701 -0.155 -0.0076 0.396 0.0004 0.860 0.0000
Maquila 0.356 ** 0.0001 0.178 0.0129 -0.417 ** -0.0171 -0.020 0.0000 0.026 0.0000Exportoriented 0.527 0.0001 0.654 ** 0.0620 0.180 0.0101 -0.283 -0.0002 0.115 0.0000Union 0.568 ** 0.0001 -0.018 -0.0012 0.487 *e 0.0288 -0.505 -0.0003 0.788 0.0000
Industry-specificTextiles, clothing, leather 0.204 * 0.0000 0.744 ** 0.0623 -0.558 ** -0.0207 0.016 0.0000 -0.418 0.0000Wood, wood products 0.355 ** 0.0001 1.615 ** 0.1811 -1.664 ** -0.0423 -1.651 -0.0007 -0.300 0.0000Paper, paper products 0.915 ** 0.0002 0.465 ** 0.0389 0.602 ** 0.0388 1.016 * 0.0015 -0.032 0.0000Chemical products 0.675 ** 0.0001 0.940 * 0.0982 0.257 0.0147 0.393 0.0004 -0.831 0.0000Non-metallic minerals 0.099 0.0000 0.102 0.0071 -1.487 ** -0.0409 -0.882 -0.0005 0.434 0.0000Basic metal industries 1.452 * 0.0002 2.139 * 0.3442 -0.405 -0.0179 -0.535 -0.0004 0.038 0.0000Metal products, machinery 0.776 ** 0.0001 1.852 ** 0.2034 -1.195 * -0.0342 1.196 ** 0.0015 0.804 0.0000Other manufacturing ind. 0.960 ** 0.0002 1.381 * 0.1730 -0.646 -0.0256 -1.056 -0.0006 0.404 0.0000
Region-specificScience grad/cap 0.304 * 0.0001 -0.244 -0.0163 -0.074 -0.0038 0.117 0.0001 0.069 0.0000Researchers/cap 1.071 * 0.0002 -0.314 -0.0203 0.518 0.0347 -0.586 -0.0004 -0.640 0.0000Public exp. in R&D -0.046 * 0.0000 -0.009 -0.0006 -0.026 -0.0014 0.006 0.0000 0.009 0.0000Region:
Central 0.068 0.0000 0.117 0.0039 -0.391 * -0.0084 0.199 0.0002 0.589 0.0000South 0.164 0.0000 -0.439 * -0.0233 -0.325 -0.0128 -0.234 -0.0002 2.082 0.0000Capital -0.732 -0.0003 2.291 ** 0.3249 0.214 0.0111 2.959 0.0119 2.392 0.0000
Constant -2.192 * -3.337 * -2.382 * -7.898 ** -32.705Number of obs. 7,220 7,207 7,220 7,22 7,165Log likelihood -2629.3164 -2216.7957 -1786.7886 -205.736 -9.8271Pseudo R2 0.4654 0.1424 0.1998 0.4059 0.4412* Significant at 10% level; *"Significant at 5% level.Note: Dependent variable = I if firm adopted any type of technology, 0 otherwise.
28

Table A2.3. Multinomial Logit Rsults for Technology Adoption in Manufacturing Firms, 1992Manual Automatic Machinery tools NCM CNCM Robots
Explanatory Variables equipment equipment______________________ Coeff. Z-St. -Coeff. Z-St. Coeff Z-St. Coeff. Z-St. Coeff. Z-SI. Coeff. Z-St.Firm-specific
Size Sinall 0,089 0.35 0.317 1.90 0.378 1 86 1.452 ** 2.56 1.128 ' 3.14 25.556 0.00Medium 0.577 1.22 0.520 1.61 1.213 * * 3 54 2.168 2.97 1 965 3.59 28.803 0.00Large 0.116 0.16 0.742 1.69 1.893 * 4.46 2.175 ** 2.431 3.052 5.00 29.690 0.00
Age 0.005 1.10 0.010 2.90 -0.010 - -2.00 0 015 1.14 -0.012 -1.06 -0.003 -0 04Foreign owniership 0.376 0.63 -0.140 -0.32 -0.079 -0.18 0.511 0.71 -0.613 -1.00 0.967 0.37Suibsidiary -1.061 -2 42 -1 0988 -4.39 -0.599 -2.19 -1.369 **-2.03 -1.1 13 -2 27 0.108 0.04Seini-skilled workers -0.003 -1.09 0 008 4.11 0.012 4.67 0.017 1.00 0.004 0 61 -0.132 -0 36Less skilled workers 0.003 1.46 0.005 2.59 0.010 ~s 4.19 0.009 0.55 -0.003 -0.46 -0 136 -0.38Trainiing 0.989 3.29 0.782 4.27 1.388 6.28 2.705 ** 5.05 2.575 7.56 19 443 0.00Public trainilig 1.008 0* 3.10 0.101 0.46 0.559 ** 2.34 -0.475 -1.09 -0.306 -0.92 0.939 0 34Techniology tranisfer 0.026 6 35 0.029 ** 8.96 0.029 ** 8.40 0.019 * 1.75 0.032 ** 5.72 0 046 1 17Maquila -1.077 * -4.46 -0.114 -0.84 -1.097 **-5.37 0.123 0.30 0.866 3.28 -0.714 -0.27Export oriented 0.776 1.54 0.163 0.39 -1.384 *-2.34 -0.122 -0.12 -0.577 -0.66 0.678 0.23Unioni -0 363 -1.61 0.614 * 4 22 0.398 2.17 0.424 0.86 -0.054 -0.17 0.453 0.15
Region-specificScience grad/cap 0 861 ** 2.87 0.737 ** 3.13 -0.976 -3.82 0.678 0.61 2.756 4.10 -1.244 -0.22Researchersicap 03.768 0.71 1.201 2.25 0.009 0.01 0.707 0.33 7.100 7.35 -2.313 -0.16Public exp. ini R&D3 -0.060 -1.74 -0.021 -1.08 -0.021 -082 0.020 0 25 -0.233 -5.89 0.112 0.22Region:
Central 0.227 0.92 0.385 Os 2.26 -1.471 00-8.31 0.00 .0 -0.017 -0.04 -1.254 -0 36Souith 0.9899* 3.44 0.038 0.17 -1.443 ' -6.78 -1.027 -0.72 -1.771 -1.54 -32.089 0.00Capital 1.595 0.89 -4.416 -6.19 1 449 1.10 -5.427 * -1.87 -11.706 -9.07 0.138 0.01
Conistanit -3.893 ** -7.90, -4.053 ' -10.26 -01679 -1 75 -9.238 **-4 03 -8.983 0~-7.26 -38 897
*Significant at 10% level; `*Significant at 5% level.Note: Dependent variable 1 if firm adopted manual equipment, 2 if firm adopted automatic equipment, 3 if firm adopted machinery tools, 4 if
firm adopted NCM, 5 if firma adopted CNCM, 6 if firm adopted robots, and 0 otherwise. The comparison group is no adoption of newtechnology.
Table A2.4. Multinomial Logit Results for Technology Adoption in Manufacturing Firms, 1999Manual Automatic Machinery NCM CNCM Robots
Explanatory Variables equipment equipment ZS. Ceftools ZS. cef ZS. Cef ZS.-t_______________________Coeff. Z-St. Coeff ZS.-Cef -t. off -t. off Zt. Coeff Z-.
Size; Smnall 0.468 * ~ 2.74 1.281 ** 7.61 1.509 8.87 1.869 *04.81 3.607 0* 7.64: 39.461 1.16Medium 0.396 0.84 1.392 3.15 1.968 ** 4.83 1.686 2.23 4.439 6.40 41.490 1.20Large 0.142 0.20 1.678 ** 2.72 2.556 4.56 2.334 *0 2.64 5.089 0* 6.18 42.186 1.20
Age -0.056 *0 -12.87 -0.042 *0 -8.72 -0.040 -7.92 -0.049 -3.47 -0.043 ~s-3.72 -0.036 -0.74Foreigni owniershiip -0.793 -1.22 -1.016 * -1.64 -0.308 -0.56 -0.880 -0.95 -0.265 -0 37 0 450 0 23Stibsidiary 0.189 1.37 0.239 1.55 0.128 0.75 0.500 1.28 0.580 1.53 1.055 0.55Semi-skilled workers 0.000 0.31 0.013 9.97 0.012 *0 7.61 0.001 0 24 0.012 1.17 0.074 0.21Lets skilled workers 0.006 0* 6.23 0.008 0 5.42~ 0.009 00 4.93 0.003 0.58 0.003 0.29 0.075 0.22Traininig 0.632 * 4.26 0.971 *5 6.31 0.900 ** 5.321 2.334 00 5.82 1.941 ** 4.16 1.334 0.35Puiblic trai[iinig 0.422 *0 2.06 0.075 0.35 0.831 ' 3.99 0.882 2.32 0.903 00 2.33 0.950 0.46Technology transfer 0.740 0* 5.20 0.706 0* 4,89 0.740 0* 5.19 0.564 1.55 0.727 3 92 0.959 * 75Maquila 0.065 0 54 0.079 0.54 -0.328 * -1.84 -0.399 -0.88 -0.222 -0.53 -0.365 -0.19Export oriented 0.871 *0 2.53 1.194 *0 3.38 0.575 1.51 0.597 0.91 0.498 0.78 1 029 0.48Uniioni 0.680 0* 4.78 0.281 * 1.70 0.650 0* 3.94 0.531 1.37 -0.046 -0.13 1.276 0 52
Region-specificScience grad/cap 0.206 1.62 -0.170 -1.10 -0.248 -1.39 -1.165 *0-2.08 0.174 0.25 -0.046 -0.01Researcheisscap -0.186 -0.46 -1.033 * -1.89 -0.556 -0.98 -5.451 -3.00 -2.081 -1.02 -1.936 -0.19Public exp. ini R&D 0 014 0.98 0.019 1.02 0 013 0 68 0.190 0* 3 18 0.055 0.81 0.044 0.13Regiotn:
Ceiitral -0 III -1.11 -0.083 -0.70 -0.582 00-4.53 -1.023 0*-2.53 -0.045 -0.09 0.178 0 07Southi -0.182 -1.~24 -0.456 *0 -2.50 -0.545 *0-2.76 -0 152 -0.27 -0.548 -0.55 1 459 0.41Capital -1.399 00 -23 2.430 2.76 1.093 1.24 5.211 * 1.76 4.415 1.30 4.441 0.25
Constaist -1.190 * 52 -1.716.0* -6.14 -1.844 0* -5.77 -2.998 *0-3.01 -6 945 o-4.691 -54.322Number of obs. =7,220 L. 5ite, ,:,,1.-0 R... P2.I i
0Significant at 10% level; "*Significant at 5% level.Note: Dependent variable = I if firm adopted manual equipment, 2 if firm adopted automatic equipment, 3 if firmn adopted machinery tools, 4 if
firm adopted NCM. 5 if firma adopted CNCM, 6 if firm adopted robots, and 0 otherwise. The comparison group is no adoption of newtechnology.
29

Annex 3: Panel and Intensity Estimations
Table A3.1. Probit Results for TA in Manufacturing Firms, 1992-1995F Any type of Automatic Machinery tools CNCM Robots
Explanatory I technology equipmentVariables Coeff. Marg. Ef. Coeff. Marg. Ef. Coeff. Marg. Ef. Coeff. Marg. Ef. Coeff. Marg. Ef.
Firm-specificSize: Medium -0.4654 -0.0948 -0.1252 -0.0192 -0.3380 * -0.0504 .0.5987 **0.0639 -0.4280 -0.0049
Large -0.9472 -0.1994 -0.4574 -0.0701 -0.8626 **-0.1211 -1.1654 *'-0.1118 -7.8429 -0.0166Age -0.0008 -0.0002 -0.0036 * -0.0007 0.0051 **0.0010 -0.0031 -0.0005 -0.0198 -0.0003Foreign ownership 0.3595 0.0750 0.1187 0.0 195 0.0139 0.0023 0.2407 **0.0327 0.6557 0.0118Labor: Highly skilled 0.0076 * 0.0019 0.0037 0.0007 0.0041 0.0008 -0.0056 -0.0008 0.0115 0.0002
Semi-skilled 0.0001 0.0000 -0.0001 0.0000 0.0001 0.0000 0.0001 0.0000 0.0000 0.0000Low skilled 0.0002 ** 0.0001 -0.0001 0.0000 0.0002 * 0.0000 0.0001 0.0000 0.0000 0.0000
Training 0.0800 0.0065 -0.0704 -0.0043 0.0934 0.0059 0.1244 * 0.0062 0.2719 0.4876R&D 0.0045 0.0011 0.0009 0.0002 0.0032 **0.0006 0.0044 **0.0007 0.0026 0.0000Technology transfer 0.4148 ** 0.1023 -0.0251 -0.0048 0.0855 * 0.0169 0.2501 **0.0410 -0.4019 -0.0054Maquila 0.0977 * 0.0183 0.0469 0.0068 0.0672 0.0099 0.1196 0.0140 -0.2756 0.4876Export oriented 0.2516 ** 0.0601 0.3583 ** 0.0709 0.0809 0.0153 0.0300 0.0044 0.1758 0.0030Union 0.0452 0.0028 -0.0565 -00027 0.0265 0.0013 0.1183 0.0046 0.0440 0.0002
Region:Central -0.0828 -0.0115 -0.0187 -0.0020 -0.0782 -0.0083 0.0217 0.0018 0.5478 0.0058South -0.1736 * -0.0403 -0.2052 -0.0348 0.0157 0.0028 -0.1653 -0.0223 -7.6690 -0.0166Capital -0.1532 ** -0.0299 -0.0082 -0.0012 -0.2397 **-0.0347 0.1317 0.0161 0.1930 0.0026
Constant -0.0658 -0.8221 **-1.1248 **-1.4916 **-2.7130
Log likelihood ~-2033.2656 I16.49 -1442.3422 -965.6919 -116.916*Significant at 10% level; "*Significant at 5% level.
Notes: 1. Dependent variable = I if the firmn adopted any type of new technology, 0 otherwise.2. Technology diff-usion rate was dropped due to collinearity.3. Skill shares are lagged one period.4. Number of observations =3,293; number of groups =3,293.
Table A3.2. Probit Results for TA in Manufacturing Firms, 1995-1999Any type of Automatic Machinery tools CNCM Robots
Explanatory technology equipmentVariables Coeff. Marg. Ef. Coeff. Marg. Ef. Coeff. Marg. Ef. Coeff. Marg. Ef. Coeff. Marg. Ef.
Firm-specificSize: Medium 0.4670 * 0.0427 0.0234 0.0024 0.3846 * 0.0531 0.3166* 0.0338 0.0047 0.0001
Large 0.6922 0.0599 -0.0830 -0.0082 0.5115 **0.0691 0.4888 **0.0522 0.0429 0.0007Age -0.0031 -0.0005 -0.0045 * -0.0008 0.0025 0.0006 -0.0004 -0.0001 -0.0032 -0.0001tForeign ownership 0.1491 0.0222 -0.0827 -0.0130 -0.0010 -0.0002 0.1257 0.0208 0.4161 * 0.0137Labor: Highly skilled 0.0078 0.0014 0.0028 0.0005 0.0041 0.0010 0.0020 0.0004 -0.0305 -0.0010
Sem-i-skilled 0.0003 0.0000 -0.0006 *.-0.0001 0.0002 0.0000 0.0002 0.0000 0.0000 0.0000Low sk-illed -0.0001 0.0000 0.0000 0.0000 -0.0001 0.0000 -0.0001 0.0000 0.0003 0.0000
Training 0.3956 ** 0.0084 -0.1443 -0.0032 0.0416 0.0013 0.7484 0.0172 4.4212 0.0221Technology transfer -0.0585 -0.0106 -0.1000 -0.0179 -0.0972 -0.0240 0.1147 0.0218 0.1836 **0.0064
Maquila -0.3195 -0.0491 -0.1085 -0.0158 -0.0492 -0.0099 0.0517 0.0078 -0.4858 -0.0105Export oriented 0.0349 0.0056 0.0480 0.0081 -0.1747 *-0.0392 0.0374 0.0064 0.2439 0.0079Union -0.1668 -0.0034 -0.1807 -0.0037 -0.0505 -0.0014 -0.0543 -0.0011 4.4508 0.0205
Region:Central -0.0087 -0.0009 -0.0751 -0.0076 -0.1640 **-0.0226 0.2613 **0.0278 0.1181 0.0022South 0.0580 0.0095 -0.3375 * 00533 -0.0439 -0.0102 0.2899 * 0.0535 0.1829 0.0059Capital -0.1519 -0.0207 -0.0628 -0.0085 -0.0847 -0.0156 0.1895 0.0270 0.3241 0.0086
Constant 0.2471 -0.5688 **-0.5561 **-2.4005 **-11.0014
Log likel-hood -598 o8'i' -64(i - 465 -6 9%4 * I*Significant at I0% level; "*Significant at 5% level.
Notes: 1. Dependent variable = 1 if the firm adopted any type of new technology, 0 otherwise.2. Technology diffusion rate was dropped due to collinearity.3. Skill shares are lagged one period.4. Number of observations = 1,702; number of groups = 1,702.
30

Table A3.3. Probit Results for TA in Manufacturing Firms, 1992-1999Any type of Automatic Machinery tools CNCM Robots
Explanatory Variables technology equipmentCoeff. Marg. Ef. Coeff. Marg. Ef. Coeff. Marg. Ef. Coeff. Marg. Ef. Coeff. Marg. Ef.
Firm-specificSize: Medium 0.5677 ** 0.0626 0.2373 0.0351 0.2987 ** 0.0610 0.6368 ** 0.0712 -0.1330 -0.0017
Large 0.6572 ** 0.0583 0.0310 0.0037 0.4350 ** 0.0682 0.9297 * 0.0843 -0.2672 -0 0026Age -0.0009 -0.0001 -0.0037 * -0.0009 0.0041 ** 0.0010 -0.0017 -0.0003 -0.0081 -0.0002Foreign ownership 0.2797 ** 0.0387 0.2369 ** 0.0502 -0.0750 0.0000 0.0566 0.0076 0.2455 0.0055Labor Highly skilled 0.0109 * 0.0019 0.0063 * 0.0015 0.0022 0.0191 -0.0045 -0.0008 0.0112 0.0003
Semi-skilled 0.0003 0.0001 -0.0004 ** -0.0001 0.0001 0.0187 0.0001 0.0000 0.0003 * 0.0000Low skilled 0.0004 * 0.0001 0.0002 0.0000 0.0001 0.0186 0.0001 0.0000 0.0000 0.0000
Training 0.2106 ** 0.0058 -0.0678 -0.0025 0.1057 0.0221 0.4147 ** 0.0103 4.3972 0.0197R&D 0.0029 0.0006 0.0013 0.0003 0.0014 0.0190 0.0021 0.0004 0.0035 0.0001Technology transfer 0.0774 0.0139 -0.1456 -0.0366 0.0138 0.0209 0.1262 * 0.0221 0.0289 0.0007Maquila -0.0944 -0.0114 -0.0803 -0.0160 0.0280 0.0257 0.0957 0.0142 -0.3871 -0.0061Export oriented 0.0631 0.0106 -0.0993 -0.0234 -0.1565 -0.0159 0.2328 0.0396 -0.0895 -0.0017Union -0.1130 -0.0019 -0.1685 -0.0038 -0.1420 0.0155 -0.0275 -0.0005 4.9396 0.0123
Region:Central -0.1264 -0.0112 -0.0158 -0.0018 -0.2335 * -0.0077 0.1500 0.0129 0.1647 00018South -0.2131 -0.0387 -0.1804 -0.0421 -0.1246 -0.0077 0.0351 0.0063 -5.6082 -0.0226Capital -0.2012 * -0.0310 0.0218 0.0042 -0.3380 ** -0.0403 0.2027 0.0277 0.3089 0.0057Technology diffusion rate 0.0407 * 0.0087 0.5701 ** 0.1411 0.0476 ** 0.0300 0.0194 0.0034 -0.4093 -0.0081
Constant ) -2.3784 ** -9.2729 . -1.9412 * -2.6713 ** 11.3325Log IIk0It . J I i- 1 .I1 -11 | -1253.5804 -833.0133 -84.3751
Significant at 10% level; **Significant at 5% level.Notes: 1. Dependent variable = I if the firm adopted any type of new technology, 0 otherwise.
2. Skill shares are lagged one period.3. Number of observations = 2,089; number of groups = 1,066.
31

Table A3.4. Tobit Results for TI in Manufacturing Firms, 1992-1995Manual Automatic Machinery NCM CNCM Robots
Explanatory equipment equipment toolsVariables Coeff. Z-St. Coeff Z-St. Coeff Z-St. Coeff Z-St. Coeff Z-St. Coeff Z-St.
Firm-specificSize: Medium 5.101 *P 5.02 -5.891 ** -5.15 7.446 ** 5.45 -1.774 ** -2.88 -2.867 ** -5.03 -0.478 * -2.30
Large 14.941 ** 9.69 -10.576 ** -6.14 3.093 1.51 -5.231 ** -5.61 -5.928 ** -6.92 -0.719 ** -2.29Age -0.019 -0.79 0.018 0.66 0.009 0.28 0.015 1.04 -0.028 * -2.06 -0.004 -0.89Foreignownership 1.714 1.53 2.825 ** 2.23 -8.055 ** -5.32 -0.350 -0.51 1.269 ** 2.01 0.314 1.37Semi-skilledworkers -0.015 -0.50 -0.002 -0.06 0.118 't 3.18 -0.017 -0.98 0.024 1.53 0.003 0.59Less skilled workers -0.019 -0.64 0.004 0.11 0.150 ** 4.07 -0.023 -1.35 -0.003 -0.17 0.003 0.49Training 0.885 1.08 1.902 ** 2.20 -2.342 ** -2.30 0.653 1.36 -0.439 -1.03 -0.037 -0.23R&D -0.066 ** -2.89 0.125 * 5.26 -0.067 ** -2.37 0.002 0.15 0.077 * 6.53 -0.007 -151Technology transfer -2.166 ** -2.11 1.368 1.24 -1.947 -1.49 0.768 1.26 1.885 1 3.45 -0.129 -0.63Maquila 1.139 1.23 -2.126 ** -2.05 -0.649 -0.53 -0.024 -0.04 0.447 0.87 0.114 0.60Export oriented -0.325 -0.17 -2.542 -1.24 1.650 0.67 0.268 0.24 0.634 0.62 0.692 * 1.84Union -0.568 -0.56 2.771 ** 2.50 -2.537 * -1.92 0.432 0.71 -0.588 -1.07 -0.209 -1.03Joint activities 0.036 0.62 -0.003 -0.05 -0.026 -0.36 0.048 1.41 -0.025 -0.81 0.001 0.07
Industry specificFood, beverages, tobacco -1.225 -0.95 4.310 ** 2.96 -0.983 -0.57 -2.216 ** -2.83 0.075 0.10 -0.368 -1.39Textiles, clothing, leather -0.466 -0.35 -6.890 * -4.63 8.701 r 4.89 -0.449 -0.56 0.297 0.40 -0.246 -0.91Wood,woodproducts 0.010 0.01 -11.397 ** -5.08 18.706 ** 6.98 -2.379 * -1.97 -1.255 -1.12 -0.350 -0.86Paper, paper products -8.078 ** -4.76 -3.102 -1.62 1,027 0.45 4.778 ** 4.64 4.727 ** 4.96 -0.092 -0.27Non-metallic minerals 2.137 1.11 -0.784 -0.36 -4.324 * -1.67 -2.937 ** -2.52 0.632 0.58 0.045 0.11Basic metal industries 1.513 0.67 -3.788 -1.49 6.047 ** 1.99 -2.544 * -1.86 1.410 1.11 -0.147 -0.32Metal prod., machinery 1.648 1.30 -10.233 * -7.24 10.021 ** 5.94 -0.643 -0.84 2.324 ** 3.31 0.546 ** 2.12Othermanufacturingind. -2.131 -0.70 -1.974 -0.58 5.967 1.46 0.222 0.12 -0.491 -0.29 0.260 0.42Exports -0.071 ** -3.05 -0.047 ** -2.02 0.076 ** 2.77 -0.015 -1.09 -0.052 ** -4.52 -0.009 * -2.10
Region:Central -0.973 -1.02 -1.797 * -1.67 1.048 0.81 0.122 0.21 0.890 * 1.66 0.047 0.24South 5.522 ** 3.42 -3.939 ** -2.16 -2.741 -1.26 -0.396 -0.40 -1.101 -1.21 -0.245 -0.74Capital -1.934 * -1.71 -3.935 ** -3.08 5.012 ** 3.28 0.287 0.42 0.312 0.49 -0.378 -1.63
Constant 22.391 ** 6.87 26.997 ** 7.65 20.481 ** 4.90 8.831 ** 4.55 5.541 ** 3.17 1.042 1.61Log likelihood I -31526.285 -31924.904 -33021772 -28043.063 -27286.233 -20792.54
* Significant at 10% level; **Significant at 5% level.Notes: 1. Dependent variable = share of technology use in the production process.
2. Number of observations = 6,586; number of groups = 3,293.
32

Table A3.5. Tobit Results for TI in Manufacturing Firms, 1995-1999Manual tAutomatic Machinery NCM CNCM Robots
Explanatory equipment equipment toolsVariables Coeff. Z-St. Coeff Z-SL Coeff Z-St. Coeff Z-St. Coef Coeff Z-St.
Firm-specificSize: Medium -2.779 -1.62 4.157 * 1.92 -2.804 -1.28 -0.737 -0.76 1.044 0.88 0.098 0.25
Large -5.122 ** -2.91 8.350 * 3.75 -8.558 ** -3.83 0.634 0.64 3.433 ** 2 81 0.578 1.44Age -0.006 -0.23 0.008 0.23 0.009 0.25 0.012 0.81 -0.016 -0.82 -0.008 -1.35Foreign ownership -0.332 -0.22 -0.906 -0.47 -1.561 -0.80 -1.732 ** -2.03 0.816 0.76 1.779 ** 5.10Semi-skilledworkers -0.118 ** -2.24 0.100 1.51 0.017 0.26 -0.038 -1.26 0.037 1.01 -0.006 -0.46Lessskilledworkers -0.112 ** -2.16 0.066 1.02 0.087 1.30 -0.042 -1.41 -0.010 -0.27 -0.003 -0.27Training -3.171 ** -2.14 3.844 ** 2.05 -4.337 -2.28 0.281 0.33 2.743 ** 2.66 0.193 0.56R&D -0.073 ** -3.03 -0.012 -0.40 -0.031 -1.00 0.044 ** 3.15 0.068 ** 4.08 -0.001 -0.19Technology transfer -0.492 -0.61 -0.787 -0.77 0.089 0.09 0.723 1.56 -0.331 -0.59 0.208 1.10Maquila 0.085 0.07 0.064 0.04 -0.805 -0.51 0.139 0.20 0.809 0.94 -0.257 -0.91Export oriented 3.297 * 1.86 -0.842 -0.38 -2.160 -0.96 -0.541 -0.55 0-424 0.34 0.825 ** 2.03Union -0.084 -0.05 4.099 ** 2.02 -4.772 ** -2.35 2.863 ** 3.21 -0.930 -0.83 -0 204 -0.56Joint activities -0.009 -0.15 0.063 0.80 -0.085 -1.06 -0.012 -0.33 0.023 0.52 0.041 ** 2.83
Industry specificFood, beverages, tobacc( -0.586 -0.31 5.664 ** 2.34 -3.795 -1.59 -1.732 * -1.66 -0.310 -0.23 0.178 0.42Textiles, clothing, leathe| 0.500 0.29 -0.537 -0.25 0.866 0.40 -2.021 ** -2.13 0.524 0.44 0.163 0.42Wood, wood products 6.598 * 2.23 -7.672 ** -2.05 5.367 1.45 -2.670 * -1.65 -1.430 -070 -0.399 -0.61Paper,paperproducts -10.169 ** -4.38 1.704 0.58 -1.135 -0.39 0.507 0.40 6.311 ** 3.91 0.569 1.10Non-metallic minerals -0.884 -0.33 -3.956 -1.16 1.162 0.35 -2.964 * -2.02 3.329 * 1.78 1.473 *' 2.46Basic metal industries -0.583 -0.18 -2.155 -0.51 3.983 0.96 -1.341 -0.74 -0.384 -0.17 -0.546 -0.73Other manufacturing ind -0.268 -0.07 -1.971 -0.38 2.846 0.55 4.078 * 1.81 -3.637 -1.27 -0.489 -0.53Exports -0.031 -0.79 -0.202 * -4.14 0.179 ** 3.72 0.016 0.77 0.015 0.54 0.020 ** 2.36
Region:Central -0.908 -0.69 -2.188 -1.32 1.963 1.20 0.497 0.70 -0.365 -0.40 0.519 * 1.78South 3.120 1.40 -7.987 ** -2.82 6.432 ** 2.31 -0.804 -0.66 -4.269 ** -2.75 0.050 0.10Capital -2.612 * -1.74 -2.198 -1.16 3.226 * 1.72 0.711 0.87 0.006 0.01 -0.073 -0.22
Constant 40.224 ** 7.50 17.318 ** 2.56 35.211 ** 5.15 6.380 ** 2.11 2.260 0.61 0.107 0.09I oyS Ise11 t 1-n oI'l.11 16; | -FJ .s A'4i 4q 1 1 n '
* Significant at 10% level; **Significant at 5% level.Notes: 1. Dependent variable = share of technology use in the production process.
2. Metal products, machinery, and equipment industry was dropped due to collinearity.3. Number of observations = 3,419; number of groups = 1,717.
33

Table A3.6. Tobit Results for TI in Manufacturing Firms, 1992-1999Manual Automatic Machinery tools NCM CNCM Robots
Explanatory equipment equipmentVariables Coeff. Z-St. Coeff Z-St. Coeff Z-St. Coeff Z-St. Coeff Z-St. Coeff Z-St.
Firm-specificSize: Medium -5.623 ** -2.88 4.068 1.56 -1.832 -0.69 0.964 0.77 2.580 ** 1.97 -0.270 -0.61
Large -6.505 ** -3.27 7.775 ** 2.92 -6.624 ** -2.45 2.100 * 1.65 3.603 ** 2.69 0.176 0.39Age 0.001 0.05 0.024 0.62 0.011 0.28 0.015 0.84 -0.032 * -1.65 0.002 0.24Foreign ownership 2.421 1.63 -1.552 -0.78 -0.958 -0.47 -1.227 -1.30 -0.275 -0.27 0.541 1.61Semi-skilled workers -0.041 -0.57 0.092 0.96 -0.038 -0.39 -0.106 ** -2.23 0.026 0.53 0.014 0.84Less skilled workers -0.045 -0.63 0.081 0.85 0.009 0.09 -0.102 ** -2.16 -0.008 -0.17 0.009 0.56Training -0.037 -0.03 4.470 ** 2.50 -2.116 -1.16 -0.992 -1.13 1.602 * 1.78 -0.253 -0.81R&D -0.033 -1.27 0.055 1.62 -0.066 * -1.88 0.014 0.80 0.100 ** 5.86 -0.005 -0.85Technology transfer -1.549 -1.43 -1.222 -0.85 -0.201 -0.14 0.115 0.16 2.074 ** 2.88 -0.136 -0.54Maquila -0.032 -0.03 -1.687 -1.02 2.581 1.53 -0.164 -0.21 -0.048 -0.06 -0.075 -0.27Export oriented -1.536 -0.76 0.171 0.06 -0.856 -0.31 -0.844 -0.65 1.858 1.37 1.784 ** 3.86Union 4.854 * 2.82 -1.898 -0.82 -5.930 ** -2.53 3.051 ** 2.77 0.063 0.05 -0.373 -0.95Jointactivities -0.009 -0.14 0.082 0.97 -0.088 -1.02 -0.010 -0.24 0.048 1.14 0.045 ** 3.06
Industry specificFood, beverages, tobacco 1.139 0.61 6.082 ** 2.41 -3.699 -1.46 -2.707 ** -2.32 -0.111 -0.09 -0.109 -0.26Textiles, clothing, leather -0.047 -0.03 -1.249 -0.55 4.730 ** 2.06 -0.372 -0.35 -0.474 -0.42 -0.414 -1.10Wood, woodproducts 7.418 *a 2.62 -6.518 * -1.69 6.420 * 1.65 -1.783 -1.00 -1.786 -0.93 -0.542 -0.85Paper, paper products -7.701 ** -3.45 -1.888 -0.62 -0.067 -0.02 0.564 0.40 7.818 ** 5.16 0.253 0.50Non-metallic minerals -0.213 -0.08 4.105 1.12 -3.277 -0.89 -4.801 ** -2.84 2.057 1.12 0.158 0.26Basic metal industries 2.517 0.86 4.407 -1.11 6.577 1.64 -2.287 -1.23 -0.966 -0.49 -0.430 -0.65Othermanufacturingind. -4.275 -1.19 12.622 * 2.59 -2.560 -0.52 -1.618 -0.71 -3.892 -1.60 -0.887 -1.09Exports 0.016 0.44 -0.217 ** -4.33 0.199 ** 3.95 0.002 0.07 0.024 0.98 0.008 0.94
Region:Central -2.607 ** -1.98 -2.408 -1.35 4.232 * 2.35 -0.051 -0.06 0.261 0.29 0.205 0.69South 0.937 0.38 -9.704 * -2.90 7.343 * 2.18 -0.257 -0.17 -1.273 -0.76 0.050 0.09Capital -1.174 -0.77 -4.237 * -2.04 4.606 ** 2.21 -0.062 -0.06 0.436 0.42 -0.196 -0.57
Constant 25.029 ** 3.49 20.594 ** 2.18 37.265 ** 3.85 14.040 ** 3.01 0.639 0.13 -0.028 -0.02l1og lieIihhod *1465' 13s 1 5I18:31 l b99u36 -13326 97 J -1 33t.2 5% | -l.1l 8I '
* Significant at 10% level; **Significant at 5% level.Notes: 1. Dependent variable =share of technology use in the production process.
2. Metal products, machinery, and equipment industry was dropped due to collinearity.3. Number of observations = 3,155; number of groups = 1,066.
34

Annex 4: Transition Matrix
Table A4.1. Transition Matrix for Firms in Year t and t+n, 1992-19991992 1999
% of firms Technology Training % Exports %Activity from the total -
Continue Stop Continue Stop Continue Stop
No Technology Adoption 27.00 70.28 29.72
Technology Adoption 73.17 78.27 21.73
No Training 18.00 60.78 39.22
Training 82.00 93.07 6.93
No Exports 95.40 3.64 96.36
Exports 4.60 71.43 28.57
Technology Adoption
Given no training 6.80 65.52 34.48
Given training 41.20 67.80 32.20
Given no training and no exports 6.47 65.94 34.00
Given training and no exports 34.00 67.66 32.34Given exports but no training 0.42 57.14 42.86
Given training and exports 1.30 71.43 28.57
No Technology Adoption
Given no training 2.00 28.00 72.00
Given training 6.70 51.41 48.59
Given no training and no exports 1.90 26.83 73.17
Given training and no exports 6.30 49.63 50.37
Given exports but no training 0.09 50.00 50.00
Given training and exports 0.32 85.71 14.29
Training
Given no adoption and no exports 1.90 88.89 11.11
Given adoption and no exports 0.00
Given exports but no adoption 0.32 0.00 100.00
Given training and exports 1.30 92.86 7.14
ExportsGiven no adoption and no training 0.00Given no adoption and training 0.32 78.57 21.43Given adoption and training 1.31 50.00 50.00Given adoption 1.60 77.14 22.86 l
Source: Author's calculations based on ENESTYC 92 and 99.
35

APPENDIX A
INEGI has compiled the National Survey of Employment, Salaries, Technology, and
Training (ENESTYC). The Ministry of Labor co-designed the questionnaire, which gathered rich
information on training, technology, wages, employment, forms of labor contracting, and internal
plant organization of Mexican manufacturing firms. The government conducted the survey in
1992, 1995, and 1999, but its questions on technology ask whether the firm adopted technology
in the periods 1989-1992, 1994-1995, or 1997-1999, respectively. Our references to the time of
technology adoption mention only the final year of the period (e.g. 1992 rather than 1989-1992).
Data from the 1992 survey includes 5,071 firms, from the 1995 survey includes 5,242 firms, and
from the 1999 survey includes 7,429 firms.
A valuable feature of ENESTYC is that it allows us to identify the same firm in 1992,
1995, and 1999. Nonetheless, we should qualify our estimations with survivor bias. Only firms
that exist in all three years can be included in the panel database. As Audretsch (1995) shows,
survival likelihood is strikingly low for small and new enterprises and increases with firm size
and age. Thus, the panel includes an unrepresentatively high number of large and mature firms.
While random observation selection should not cause bias in our resulting estimations, surviving
firms are not randomly selected. Darwinian selection of extant firms means that the firms in our
sample tend to be more efficient and have better performance than an average Mexican firm.
Another advantage of this database is the broad spectrum of firm sizes included by
industry, shown in tables B.1-B.3. The rich information available in ENESTYC allows us to
distinguish technology diffusion policies for firms of different size and character.
INEGI also conducts the Annual Industrial Survey (EIA). The survey covers 6,500
manufacturing plants throughout Mexico that account for 80 percent of production in each
industry group. Since the survey attempts to cover the majority of manufacturing production but
not a majority of plants in all categories, our sample includes all large plants and most medium-
sized scale plants, but few small-scale plants and very few microenterpise plants.
36

We link the ENESTYC panels to firms in the EIA. This allows us to combine EIA data
on productivity, labor, value-added, and capital with ENESTYC variables for the plants common
to both surveys. The panels also include some regional variables using the Indicators of
Scientific and Technology Activity in Mexico from the National Council of Science and
Technology (CONACYT). A description of the variables in the panels appears in the Appendix.
The 1992-95 panel has 3,293 firms, the 1995-99 panel has 1,717 firms, and the 1992-99 panel
has 1,066 firms.
The information on individual establishments that INEGI gathers through its
questionnaires (which law requires firms to answer) is legally confidential, and INEGI is unable
to give the raw data to outside agencies. Therefore, we followed an established procedure in
which most data analysis was done in INEGI's Aguascalientes headquarters with the support of
INEGI personnel. Nevertheless, the reader should bear in mind the limitations on data analysis
imposed by this institutional arrangement.
37

APPENDIX B
Table B.1. Manufacturing Firms in the 1992-1995 Panel by Industry and SizeSize
Division All Large Medium Small MicroTotal 3,293 352 576 1,099 1,266Food, beverage and tobacco 669 105 114 163 287Textiles, clothing, leather 551 36 93 231 191Wood and wood products 149 28 42 61 18Paperandpaperproducts 219 16 31 103 69Chemical products 494 40 94 185 175Non-metallic minerals 161 45 31 25 60Basic metal industries 102 13 13 39 37Metal products, machinery 897 65 147 272 413Other manufacturing industries 51 4 11 20 16Source: 1992-95 ENESTYC Panel.
Table B.2. Manufacturing Firms in the 1995-1999 Panel by Industry and SizeSize
Division All Large Medium Small MicroTotal 1,717 829 737 145 6Food, beverage and tobacco 372 232 114 26Textiles, clothing, leather 273 133 113 23 4Wood and wood products 57 19 32 6Paper and paper products 146 54 83 9Chemical products 306 126 153 26 1Non-metallic minerals 75 32 33 10Basic metal industries 41 21 15 5Metal products, machinery 419 198 183 37 1Other manufacturing industries 28 14 11 3Source: 1995-99 ENESTYC Panel.
Table B.3. Manufacturing Firms in the 1992-1999 Panel by Industry and SizeSize
Division All Large Medium Small MicroTotal 1,066 554 439 72 1Food, beverage and tobacco 227 154 63 10Textiles, clothing, leather 162 70 80 12Wood and wood products 36 9 19 8Paper and paper products 95 36 52 7Chemical products 190 86 87 16 1Non-metallic minerals 46 34 10 2Basic metal industries 36 18 18Metal products, machinery 257 138 102 17Other manufacturing industries 17 9 8Source: 1992-99 ENESTYC Panel.
38

APPENDIX C
1992-99 Panel Variables Description
Variable Description Value
From the ENESTYCFirm size according to the number of workers:Micro I - 15 Dummy for each size
Firm size Small 16 - 100 1= if the firm belongs to a certain sizeMedium 101 -250 0= otherwise.Large 250 - moreManufacturing industries:1) Food, beverages, and tobacco2) Textiles, clothing, and leather3) Wood and wood products
Division 4) Paper, paper products, printing, and publishing Dummy for each industry5) Chemicals, oil derivatives, and coal 0= iotherwise.6) Non-metallic mineral products7) Basic metallic industries8) Metallic products, machinery, and equipment9) Other manufacturing industries
Total workers Number of workers in the firm. ContinuousRegions: Dummies
Includes the states of Baja California, BajaCalifornia Sur, Coahuila, Chihuahua, Durango, I= if the firm is located in the North,
North Nuevo Le6n, Sinaloa, Sonora, Tamaulipas, and 0= otherwise.Zacatecas.Includes the states of: Aguascalientes, Colima,Guanajuato, Hidalgo, Jalisco, Mexico, 1= if the firm is located in the Center,
Center Michoacan, Morelos, Nayarit, Puebla, Queretaro, 0= otherwise.San Luis Potosi, and Tlaxcala.Includes the states of Campeche, Chiapas, I= if the firm is located in the South,
South Guerrero, Oaxaca, Quintana Roo, Tabasco, 0= otherwise.Veracruz, and Yucatan.
Capital Distrito Federal I= if the firm is located in the Capital,Capital Distrito Federal 0= otherwise.
Years Firm's age. ContinuousDummy
Foreign capital Percentage of foreign capital in the firm. I= if foreign capital in the firm > 50%,0= otherwise.Dummy
Subsidiary Subsidiary firm. 1= if the firm is a subsidiary,0= otherwise.
Joint activities Number of firms with joint activities. ContinuousR&D Firm's investment in R&D (it does not include Continuous
technology transfer or equipment acquisition).Technology transfer Firm's investment in technological transfer. Continuous
Categorical
Type of technology that the firm adopts: 0= Manual equipmentI) Manual equipment 2= Automatic equipment2) Automatic equipment 3= Machinery tools
Technology type 3) Machinery tools 3= machinery4) Numeric controlled machinery 4= Numeric controlled machinery5) Computerized numeric controlled machinery 6= Robots6) Robots Dummies
I= if the firm adopts a certain type of technology,
39

0= otherwise.Dummy
Technological Intensity in the use of a certain type of I= if the use in production of a certain type ofintensity technology. technology > 40%,
0= otherwise.Highly skilled workers Number of executives and managers in the firm. ContinuousSemi-skilled workers Number of production workers in the firm. ContinuousUnskilled workers Number of general workers in the firm. ContinuousShare of highly skilled Share of highly skilled workers from the total of Ranks between 0-100workers workers in the firm.Share of semi-skilled Share of semi-skilled workers from the total of Ranks between 0-100workers workers in the firm.Share of unskilled Share of unskilled workers from the total of Ranks between 0-100workers workers in the firm.
DummyTraining Training for workers. I= if firm provides training,
0= otherwise.Dummy
Source of training Source of the training that the firm provides. I= if the training comes from the public sector,0= otherwise.Dummy
Union Existence of a union in the firm. I= if a union exists,0= otherwise.
Source of R&D:I) Consulting firms Dummy for each source
Source of R&D 2) Public institutions 1= if the firm's R&D is from a certain source,
4) A firm's department other than R&D5) Own firm's R&D department
DummyExports Firm's market orientation 1= if foreign sales > 50%,
0= otherwise.Dummy
Maquila Firms dedicated to maquila activities. 1= if maquila0= otherwise.
Technology diffusion Proportion of firmns that adopted technology in a Ranks between 0-100rate given year.From the EIA
Percentage of exports from total sales, by RanksIndustry exports JindustrRank between 0-100Iidsry.
Regional variables from CONACYTScience graduates Percentage of individuals with a degree in Science Continuous
from the total population, by state.
Graduates Percentage of individuals that got a degree from Continuousthe total population, by state.Percentage of researchers registered in both
Researchers federal and state systems from the total Continuouspopulation, by state.
Public R&D per capita Federal expenditure in R&D per capita, by state. Continuous
Public R&D Percentage of the federal expenditure in R&D Continuousfrom the total federal expenditure, by state.
40

Policy Research Working Paper Series
ContactTitle Author Date for paper
WPS2765 Inequality Aversion. Health Adam Wagstaff January 2002 H. SladovichInequalities, and Health Achievement 37698
WPS2766 Autonomy. Participation, and Learning Gunnar S. Eskeland January 2002 H. Sladovichin Argentine Schools: Findings and Deon Filmer 37698Their Implications for Decentralization
WPS2767 Child Labor: The Role of Income Rajeev H. Dehejia January 2002 A. BonfieldVariability and Access to Credit in a Roberta Gatti 31248Cross-Section of Countries
WPS2768 Trade, Foreign Exchange. and Energy Jesper Jensen January 2002 P. FlewittPolicies in the Islamic Republic of David Tarr 32724Iran: Reform Agenda. EconomicImplications, and Impact on the Poor
WPS2769 Immunization in Developing Countries: Varun Gauri January 2002 H. SladovichIts Political and Organizational Peyvand Khaleghian 37698Determinants
WPS2770 Downsizing and Productivity Gains Martin Rama January 2002 H. SladovichIn the Public and Private Sectors Constance Newman 37698of Colombia
WPS2771 Exchange Rate Appreciations, Labor Norbert M. Fiess February 2002 R. lzquierdoMarket Rigidities, and Informality Marco Fugazza 84161
William Maloney
WPS2772 Governance Matters Il: Updated Daniel Kaufmann February 2002 E. FarnandIndicators for 2000-01 Aart Kraay 39291
Pablo Zoido-Lobat6n
WPS2773 Household Enterprises in Vietnam: Wim P. M. Vijverberg February 2002 E. KhineSurvival, Growth. and Living Jonathan Haughton 37471Standards
WPS2774 Child Labor in Transition in Vietnam Eric Edmonds February 2002 R. BonfieldCarrie Turk 31248
WPS2775 Patterns of Health Care Utilization in Pravin K. Trivedi February 2002 R. BonfieldVietnam: Analysis of 1997-98 31248Vietnam Living Standards Survey Data
WPS2776 Child Nutrition, Economic Growth, Paul Glewwe February 2002 E. Khineand the Provision of Health Care Stefanie Koch 37471Services in Vietnam in the 1990s Bui Linh Nguyen
WPS2777 Teachers' Incentives and Professional Gladys L6pez-Acevedo February 2002 M. GellerDevelopment in Schools in Mexico 85155

Policy Research Working Paper Series
ContactTitle Author Date for paper
WPS2778 Technology and Firm Performance Gladys L6pez-Acevedo February 2002 M. Gellerin Mexico 85155
WPS2779 Technology and Skill Demand Gladys L6pez-Acevedo February 2002 M. Gellerin Mexico 85155