determinants of tax administration efficiency: a
TRANSCRIPT
i
DETERMINANTS OF TAX ADMINISTRATION EFFICIENCY:
A STUDY OF BAUCHI STATE, NIGERIA.
SHAMSUDEEN LADAN SHAGARI
MASTER OF INTERNATIONAL ACCOUNTING
UNIVERSITY UTARA MALAYSIA
July 2014

ii
DETERMINANTS OF TAX ADMINISTRATION EFFICIENCY: A
STUDY OF BAUCHI STATE, NIGERIA.
By
SHAMSUDEEN LADAN SHAGARI
Thesis submitted to
Othman Yeop Abdullah Graduate School of Business,
Universiti Utara Malaysia,
In Partial Fulfillment of the Requirement for the Master of Sciences
(International Accounting)
iii
PERMISSION TO USE
In presenting this project paper in partial fulfillment of the requirements for a Post Graduate
degree in MSc. International Accounting from the Universiti Utara Malaysia (UUM), I agree
that the Library of this university may make it freely available for inspection. I further agree
that permission for copying this project paper in any manner, in whole or in part, for scholarly
purposes may be granted by my supervisor or in her absence, by the Dean of Othman Yeop
Abdullah Graduate School of Business where I did my project paper. It is understood that any
copying or publication or use of this project paper parts of it for financial gain shall not be
allowed without my written permission. It is also understood that due recognition shall be
given to me and to the UUM in any scholarly use which may be made of any material in my
project paper.
Request for permission to copy or to make other use of materials in this thesis in whole or in
part should be addressed to:
Dean of Othman Yeop Abdullah Graduate School of Business
Universiti Utara Malaysia
06010 UUM Sintok
Kedah Darul Aman

iv
ACKNOWLEDGEMENT
Praise be to Almighty Allah the Lord of the entire Cosmos, the Lord of Mankind and Jinns,
the Master of the kingship, He gives honour to whom He pleases. I indeed give glory to Allah
for making to complete this project paper. I would like to thank Dr. Natrah Saad for her
support, encouragement and patience throughout this study. I sincerely appreciate her
consistent contribution.
I would like to further extend my appreciation to my friend Abdulsalam Mas’ud for his advice
and contribution, a big thank you also goes to Yusuf Abdullahi and Aminu Ahmad for their
sincere observations and moral supports.
My appreciation also goes to my parents for their constant prayers, encouragements, moral
and financial support throughout my studies. I would also like to thank my beloved wife for
her patience, understanding, and cooperation. My appreciation to also goes to my Brother
Rislanu, Buhari and all other members of my family for their constants prayers and well wish
messages.
Finally, my sincere appreciation goes to the Bauchi State University, Gadau for given me the
opportunity to study and constant support for my studies. I thank the management and staff of
Bauchi State Board of Internal Revenue for their support during the field work.

v
ABSTRACT
This study examines the determinants of tax administration efficiency. Tax is a medium
which countries across the globe depend upon so as to carry out the mandate of their citizens.
Unfortunately, the Nigerian tax system is faced with challenges, such as loss of revenue
through high level of tax defaulters from both the legislative arm of the government and
public institutions, corruption and financial irregularities and limited government
administrative capability. Tax, as a percentage of the Gross Domestic Product (GDP),
contributes only seven percent to the Nigerian economy which is below the minimum
benchmark of 15% of low income African countries. Therefore, this study examines the
influence of autonomy of the State Board of Internal Revenue (SBIR), use of information and
communications technology, public enlightenment, strong auditing practice, motivation and
incentives and perceived corruption on tax administration efficiency in Nigeria. A mixed
research design was used, and data was collected through survey and interview. A total of 124
questionnaires were collected out of 144 questionnaires that were administered. The data was
analysed to answer the research questions. The study revealed that there is a significant
relationship between tax administration efficiency and: autonomy of board of internal
revenue, information and communications technology and public enlightenment. The study
further revealed that there is no significant relationship between tax administration efficiency
and strong audit practice and motivation and incentives and perceived corruption. The
qualitative findings of this study indicate that reformation and restructuring of the tax system
and granting of autonomy can help to boost revenue generation and administration efficiency.
The qualitative findings further reveal that autonomy, public enlightenment and use of
information and communications technology are some of the determinants of tax
administration efficiency. Given the findings from the study, it is recommended that
government should put an effective measure in place to collect taxes from tax defaulters
across the different groups of the economy.
Key words: tax administration efficiency, autonomy.

vi
ABSTRAK
Kajian ini mengkaji faktor-faktor penentu kecekapan pentadbiran cukai. Cukai adalah
medium kebergantungan bagi negara-negara di seluruh dunia untuk menjalankan mandat
kepada rakyat masing-masing. Malangnya, sistem cukai Nigeria berhadapan dengan cabaran,
seperti kehilangan hasil melalui tahap pembayaran cukai daripada kedua-dua institusi
perundangan kerajaan dan institusi awam, rasuah dan penyelewengan kewangan dan
keupayaan kerajaan pentadbiran yang terhad. Cukai, sebagai peratusan daripada Keluaran
Dalam Negara Kasar (KDNK), menyumbang hanya tujuh peratus kepada ekonomi Nigeria
iaitu di bawah tahap minima sebanyak 15% daripada pendapatan negara-negara Afrika. Oleh
itu, kajian ini meneliti pengaruh autonomi Lembaga Negeri Hasil Dalam Negeri (SBIR),
penggunaan teknologi maklumat dan komunikasi, kesedaran awam, amalan pengauditan,
motivasi dan insentif dan rasuah ke atas kecekapan pentadbiran cukai di Nigeria. Satu reka
bentuk penyelidikan campuran telah digunakan, dan data dikumpulkan melalui kaji selidik
dan temubual. Sebanyak 124 soal selidik telah dikumpul daripada 144 soal selidik yang
diedar. Data telah dianalisis untuk menjawab persoalan kajian. Keputusan kajian
menunjukkan terdapat hubungan yang signifikan antara kecekapan pentadbiran cukai dan
autonomi lembaga hasil, teknologi maklumat dan komunikasi, kesedaran awam dan rasuah.
Kajian itu juga mendedahkan bahawa terdapat hubungan yang signifikan antara kecekapan
pentadbiran cukai dan amalan audit yang kukuh dan motivasi serta insentif. Penemuan
kualitatif kajian juga menunjukkan bahawa reformasi dan penstrukturan semula sistem cukai
dan pemberian autonomi boleh membantu meningkatkan penjanaan pendapatan dan
kecekapan pentadbiran. Penemuan kajian kualitatif menunjukkan bahawa autonomi,
kesedaran awam dan penggunaan teknologi maklumat dan komunikasi adalah sebahagian
daripada penentu kecekapan pentadbiran cukai. Oleh itu , kajian ini mencadangkan bahawa
kerajaan perlu meletakkan langkah yang berkesan untuk memungut cukai daripada pelbagai
kumpulan dengan taraf ekonomi yang berbeza.
Kata kunci: kecekapan pentadbiran cukai, autonomi.
vii
TABLE OF CONTENT
PERMISSION TO USE ………………………………………………………………... III
ACKNOWLEDGEMENT ……………………………………………………………... IV
ABSTRACT ……………………………………………………………………………. V
ABSTRAK ………………………………………………………………………………. VI
TABLE OF CONTENT ………………………………………………………………... VII
LIST OF APPENDICES ……………………………………………………………….. XI
LIST OF TABLES ……………………………………………………………………… XII
LIST OF ABBREVIATIONS ………………………………………………………….. XIII
CHAPTER ONE: INTRODUCTION
1.1 Introduction …………………………………………………………………………. 1
1.2 Background of the Study ……………………………………………………………. 1
1.3 Problem Statement ………………………………………………………………….. 2
1.4 Research Objectives ………………………………………………………………… 4
1.5 Research Questions …………………………………………………………………. 5
1.6 Significance of the Study …………………………………………………………… 6
1.7 Scope of the Study ………………………………………………………………….. 6
1.8 Organization of Chapters ……………………………………………………………. 7
CHAPTER TWO: LITERATURE REVIEW
2.1 Introduction …………………………………………………………………………. 9
2.2 Nigerian Tax System ………………...……………………………………............... 9
2.2.1 Nigerian Tax Policy…………………………………………………….......... 10
viii
2.2.2 Nigerian Tax Law …………………………………………………………… 11
2.2.3 Tax Administration in Nigeria ……………………………………………… 11
2.2.3.1 Federal Inland Revenue Service …………………………… 12
2.2.3.2 State Internal Revenue …………………………………….. 13
2.2.3.3 Local Government Revenue Committee ………………….. 13
2.3 Overview of Tax Administration Efficiency …………………………………… 14
2.3.1 Autonomy of Board of Internal Revenue and Tax Administration …………. 17
2.3.2 Information and Communication Technology and Tax Administration
Efficiency ………………………………………………………………. 19
2.3.3 Strong Auditing Practice and Tax Administration Efficiency ……………… 21
2.3.4 Public Enlightenments and Tax Administration Efficiency ………………… 22
2.3.5 Motivation and Incentives and Tax Administration Efficiency …………….. 24
2.3.6 Perceive Corruption and Tax Administration ……………………………….. 26
2.3 The Research Framework …………………………………………………………… 28
2.4 Summary of Chapter ………………………………………………………………… 30
CHAPTER THREE: METHODOLOGY
3.1 Introduction ………………………………………………………………………… 31
3.2 Research Design ……………………………………………………………………. 31
3.2.1 Survey ……………………………………………………………………….. 31
3.2.1.1 Questionnaires Description ………………………………………….. 32
3.2.1.2 Population of the Study ………………………………………………. 32
ix
3.2.1.3 Sample and Sampling Technique ……………………………………. 32
3.2.1.4 Sample Size …………………………………………………………. 33
3.2.1.5 Variable Measurement ……………………………………………… 34
3.2.1.6 Operational Definition of Terms …………………………………… 35
3.2.1.7 Data Analysis Techniques ………………………………………….. 37
3.2.2 Interview …………………………………………………………………… 39
3.2.2.1 Sampling Size of the Interview …………………………………….. 39
3.2.2.2 Data Collection Approach ………………………………………….. 40
3.3 Summary ……………………………………………………………………………. 40
CHAPTER FOUR: ANALYSIS AND DISCUSSION
4.1 Introduction ………………………………………………………………………… 41
4.2 Response Rate ……………………………………………………………………… 41
4.3 Background of Respondents ……………………………………………………….. 42
4.4 Descriptive Analysis ……………………………………………………………….. 44
4.4.1 Tax Administration Efficiency ………………………………………. 44
4.4.2 Autonomy of Board of Internal Revenue ……………………………. 45
4.4.3 Information and Communications Technology ……………………… 45
4.4.4 Strong Audit Practice …………………………………………………. 46
4.4.5 Public Enlightenment …………………………………………………. 47
4.4.6 Motivation and Incentives …………………………………………….. 47
4.4.7 Perceived Corruption ………………………………………………….. 48
4.5 Factor Analysis ……………………………………………………………………… 48

x
4.6 Reliability Analysis …………………………………………………………………. 49
4.7 Correlation Analysis ………………………………………………………………… 50
4.8 Multiple Regression Analysis ………………………………………………………. 53
4.9 Summary …………………………………………………………………………… 54
CHAPTER FIVE: QUANTITATIVE ANALYSIS
5.1 Introduction …………………………………………………………………………. 55
5.2 The of Efficiency of the Board ……………………………………………………. 55
5.3 Determinants of Board Efficiency ………………………………………………… 57
5.4 Strategies that Improve the Efficiency of Board………………………………….. 58
5.5 Summary …………………………………………………………………………… 59
CHAPTER SIX: DISCUSSION CONCLUSION AND RECOMMENDATION
6.1 Introduction …………………………………………………………………………. 60
6.2 Discussion of Findings…………………………………………………………….. 60
6.3 Conclusion ………………………………………………………………………… 62
6.4 Recommendations ………………………………………………………………….. 62
REFERENCES

xi
LIST OF APPENDICES
Appendix 1: Questionnaire ………………………………………………………………. 75
Appendix 2: Measurement of Variables …………………………………………………. 79
Appendix 3: Descriptive Statistics ………………………………………………………. 83
Appendix 4: Reliability Analysis ……………………………………………………… 86
Appendix 5: Factor Loading Analysis ………………………………………………….. 92
Appendix 6: Correlation Analysis ………………………………………………………. 96
Appendix 7: Regression Analysis ………………………………………………………. 97
Appendix 8: Histogram …………………………………………………………………. 98
Appendix 9: Normal P-P Plot for Checking Linearity …………………………………. 99

xii
LIST OF TABLES
Table 3.1: Determining Sample Size for a given Population…………………………….. 33
Table 4.1: Summary of Survey Response rate…………………………………………… 42
Table 4.2: Profile of the Respondents……………………………………………………. 43
Table 4.3: Descriptive Statistics for Tax Administration Efficiency……………………. 45
Table 4.4: Descriptive Statistics for Autonomy of Board of Internal Revenue…………. 45
Table 4.5: Descriptive Statistics for Information and Communication Technology……. 46
Table 4.6: Descriptive Statistics for Strong Audit Practice………………………………. 47
Table 4.7: Descriptive Statistics for Public Enlightenment………………………………. 47
Table 4.8: Descriptive Statistics for Motivation and Incentives…………………………. 48
Table 4.9: Descriptive Statistics for Perceive Corruption……………………………… 48
Table 4.10: Summary of Factor Analysis………………………………………………… 49
Table 4.11: Reliability Analysis………………………………………………………….. 50
Table 4.12: Correlations Matrix of the variables………………………………………… 51
Table 4.13: Coefficients…………………………………………………………………. 53

xiii
LIST OF ABBREVIATIONS
ABIR: Autonomy of Board Internal Revenue
CITN: Chartered Institute of Taxation of Nigeria
FCT: Federal Capital Territory
HRMC: Her Revenue’s Majesty and Custom
ICT: Information and Communication Technology
IRS: Internal Revenue Services
KMO: Kaiser-Meyer-Olkin
MAI: Motivation and Incentives
NGO: Non-Governmental Organization
NTP: National Tax Policy
OECD: Organization for Economic Co-operation and Development
OLS: Ordinary Least Square
PAYE: Pay As You Earn
PE: Public Enlightenment
PC: Perceive Corruption
SAP: Strong Audit Practice
SBIR: State Board of Internal Revenue
SPSS: Statistical Package for Social Sciences
TAE: Tax Administration Efficiency
VAT: Value Added Tax
WHT: Withholding Tax

1
CHAPTER ONE
INTRODUCTION OF THE STUDY
1.1 Introduction
This chapter provides an overview of the study and a summary of some of the key research
outcomes. The chapter begins with the background of the study, problem statement, research
objectives and research questions, significance and scope of the study. The chapter also
provides the foundation for the next chapter.
1.2 Background of the Study
The primary obligation of a government is to ensure well-being of the citizens through
development of the country. To achieve this, many governments across the globe face
challenges, one of which is revenue generation. According to Thomas (2012), estimated
global tax evasion is over USD3 trillion annually. Her Majesty‟s Revenue and Customs
(2012) report on tax evasion shows that defaulters in the United Kingdom (UK), including
those operating in the „underground‟ economy and those who undertake criminal attacks on
the tax system, denied the public purse an estimated £14 billion in 2010 - 2011. Edgar and
Feige (2009) found that over USD2 trillion has been estimated to be lost from unreported
income in the last decade in the United States (US), mostly by small businesses and
employees, resulting in a tax gap ranging from USD430 to USD475 billion per year. He
further stated that 18 - 19% of total reportable income is not properly reported to the Internal
Revenue Service, and has been an issue of serious concern to the US authorities.

The contents of
the thesis is for
internal user
only
64
References
Abiola, J., & Asiweh, M. (2012). Impact of tax administration on government revenue in a
developing economy – a case study of Nigeria. International Journal of Business and
Social Science, 3(8).
Adeosun, O. (2010). Quality basic education development in Nigeria: Imperative for the use
of ICT, Journal of International Cooperation in Education, 13(2), 199-211.
Afful- Broni, A. (2012). Relationship between motivation and job performance at the
University Mines and Technology, Tarkwa, Ghana: Leadership lessons. Creative
Education, 3(3), 309-314. http://dx.doi.org/10.4236/ce.2012.33049
Akintye, I.R., & Tashie, G.A. (2013). The effect of tax compliance on economic growth and
development in Nigeria, West Africa. British Journal of Arts and Sciences, 11 (II),
222-231.
Alm, J., & Mckee, M. (2006). Audit certainty, audit productivity, and taxpayer compliance.
Working paper 06-043.
Alon, A., & Hageman, A.M. (2013). The impact of corruption on firm tax compliance in
transition economies: whom to trust?. J Business Ethics. 116, 479-494.
Alouis, M., & Gideon, Z. (2013). Systems, processes and challenges of public revenue
collection in Zimbabwe. American International Journal of Contemporary Research,
3(2), 49-60.
Anderson, (2009). What determine the behaviour and performance of health professionals?
Public service motivation, professional norms, and/or economic incentives.
International Review Administrative Sciences, 75, 79-97.
Antomioni, D. (1999). “What motivates middle managers”?. Industrial Management, 41( 6),
27-30.
Anyaduba, J.O., & Modugu, K.P. (2013). Tax audit and tax compliance in Nigeria. Asian
Journal of Research in Business Economics and Management, 3(9), 227-240.

65
Apekhade, I.Y. (2011, June 5). Why Nigeria‟s tax system is weak. The Nation.
Aruwa, S.A. (2008). The administration and problems of value added tax in Nigeria. Finance
and Accounting Research Monitor, 2(2).
Asada, D. (2005). The administration of personal income tax in Nigeria: Some problem areas.
Working paper, University of Jos.
Association of Colleges (2008). Improving administrative efficiency in colleges. A paper
from the Association of colleges.
Awais, M.B., Chee, H.H., & Veera, K.S. (2012). A Guide to Beginners: Data Analysis using
SPSS and AMOS. Pearson Malaysia Sdn Bhd. Malaysia: Pearson.
Badara, M.S. (2012). The effect of tax audit on compliance in Nigeria: (A study of Bauchi
state board of internal revenue). Research Journal of Finance and Accounting, 3(2),
74-79.
Baurer, L.I. (2005). Tax administrations and small and medium enterprises (sme) in
developing countries. World Bank Group July.
Barone, G., & Mocetti, S. (2009). Tax morale and public spending inefficiency.
Blackburn, K., Bose, N., & Haque, M.E. (2006). The incidence and persistence of corruption
in economic development. Journal of Economic Dynamics & Control, 2447–2467.
Blumberg, B., Cooper, D.R., & Schindler, P.S. (2008). Business Research Methods. (2nd
European ed.). Maidenhead Berkshire, London: McGraw-Hill Education.
Brasoveanu, I.V., & Brasoveanu, L.O. (2009). Correlation between corruption and tax
revenues in EU 27.
Bruekner, J.K. (1999). Fiscal decentralization in developing countries: the effects of local
corruption and tax evasion. CEMA Working paper series, 1, 1-18.
Cantens, T., Raballand, G., & Bilangna, S. (2010). Reforming customs by measuring
performance: A Cameroon case study. World Customs Journal, 4(2), 55-74.
Casasnovas, G.L., McDaid, D., & Costa-Font, J. (2009). Decentralization and management
66
autonomy? Evidence from the Catalonian hospital sector in a decentralized Spain.
International Public Management Review, 10 (2), 103-119. Electronic Journal at
http://www.ipmr.net
Cekmecelio, H.G., & Gunse, A. (2011). Promoting creativity among employees of mature
industries: The of autonomy and role stress on creative behaviors and job
performance. Procedia Social and Behavioral Science, 24, 889-895. Available online
at www.sciencedirect.com
Cerqueti, R., & Coppier, R. (2011). Economic growth, corruption and tax evasion. Economic
Modelling, 28, 489-500.
Chan, C.W., Troutman, C.T., & O‟Bryan, D. (2000). An expanded model of taxpayer
compliance: Empirical evidence from United States and Hong Kong. Journal of
International Accounting, Auditing and Taxation, 9(2), 83 –103.
Charlo, G. (2011). The impact of ict and innovation on industrial productivity in Uruguay.
ICT in Latin America: A Micro Data Analysis.
Crandall, W. (2010). Revenue administration: Autonomy in tax administration and the
revenue authority model.
Croxton, R., & Moniz, R. (2009). An analysis of employees motivation within the public
sector.
Decman, M., Stare, J., & Klun, M. (2010). E-government and cost-effectiveness: E-taxation
in Slovenia. Transylvanian Review of Administrative Sciences, 31, 48-57.
Demuzere, S., Verhoest, K., & Bouckaert, G. (2008). Quality mangament in public sector
organizations: The role of manageriual autonomy and organizational culure. K.U.
Leuven – Public Management Institute.
Djawadi, B.M., & Fahr, R. (2013). The impact of tax knowledge and budget spending
influence on tax compliance. Discussion paper no. 7255.
Dobre, O. (2013). Employee motivation and organizational performance. Review of applied
socio-Economic Research, 5(1), 53-60.
Dubin, J.A. (2006). The effect of audit rates on the federal individual income tax, 1987-2004.

67
Dreher, A., & Schneider, F. (2010). Corruption and the shadow economy: An empirical
analysis. Public Choice, 144, 215-238. DOI 10.1007/s11127-009-9513-0.
Ebimobowei, A., & Peter, E.G. (2013). A causality analysis between tax audit and tax
compliance in Nigeria. European Journal of Business and Management, 5 (2), 107-
120.
Edgar, L., & Feige, E.L. (2009). New estimates of overseas U.S. currency holdings, the
underground economy and the "Tax Gap".
Edmead, N., Ngwu, C., Oqua, B.I., & Pichel, F. (2013). Streamlining land administration and
governance in Cross River State, Nigeria.
Erard, B. (1994). “Honesty and evasion in the compliance game”. The RAND Journal of
Economics, 25(1), 1-19.
Eriksen, K., & Fallan, L. (1996). Tax knowledge and attitudes towards taxation: A
report on a quasi-experiment. Journal of Economic Psychology, 17, 387-402.
Evelyn, A., & Luzira, M. (2004). Autonomy of apex hospitals in Uganda: Too little, too slow
health policy and development. 2 (2), 151-160.
Fagbemi, O. T., Uadile, O. M., & Noah, A. O. (2010). The ethics of tax evasion: perpetual
evidence from Nigeria. European Journal of Social Sciences, 17(3), 360-371.
Federal Inland Revenue Service (2013, April 9). Nigeria‟s chaotic tax system. Punch
Editorial Board.
Federal Inland Revenue Service (2009). Performance appraisal in 2008 and work plan for
2009. Abuja Federal Inland Revenue Service.
Fjeldstad, O. (2003). “Fighting fiscal corruption: Lessons from the Tanzania revenue
authority,” Public Administration and Development, 23(2), 165-175.
Garde, M.P. (2004, November 15). A model for tax administration reform. Business focus
bulletin.
Gammelgaard, J., Mcdonald, F., Stephan, A., Selmann, H.T., & Christopher, D.R. (2012).
The impact of increase in subsidiary autonomy and network relationships on performance.

68
International Business Review, 21, 1158-1172.
Gcabo, R., & Robinson, Z. (2007). Tax compliance and behaviour response in South Africa:
An alternative investigation. SAJEMS NS, 10(3), 357-370.
Goerdel, H.T., & Pitts, D.W. (2006). Public management, autonomy, and performance:
Merging political and administrative notions of autonomy. Second conference on
empirical studies of organizations and public management, College station May 5-6,
2006.
Govindaraj, R., & Chawla, M. (1996). Recent experience with hospital autonomy in
developing countries – What can we learn?.
Hansford, A., & Hasseldine, J. (2003). Tax auditing under the self-assessment: Survey
evidence from the United Kingdom. New Zealand Journal of Taxation Law and
Policy, 9, 171-83.
Hassan, A. G. D. (2012). Tax administration in Kano state: problems and prospects.
International Journal of Arts and Commerce, 1 (3).
Hasseldine, J., Hite, P., James, S., & Toumi, M. (2007). Persuasive communications:
tax compliance enforcement strategies for sole proprietors. Contemporary
Accounting Research, 24(1), 171-94.
Heineman, B.W., & Heimann, F. (2006). The long war against corruption. Foreign Affairs,
20(1).
Her Majesty‟s Revenue and Customs (2012). Annual Report and Account 2012- 13 (for the
year ending 31 March, 2013.
http://www.oecd.org/cleangovbiz/toolkit/49360071.pdf
Idisemi, A., & Ann, L. (2011). The benefits of ICT adoption: An empirical study of
Nigerian SMEs. Proceedings of the European Conference on Information
Management, 483.
69
International Telecommunication Union (2012). Sustainable ICT in corporate organizations.
James, B. (2013). Effects of information and communication technology on secretaries‟
performance in contemporary organizations in Bayelsa state, Nigeria. Information and
Knowledge Management, 3 (5), 87-93.
James, A.H., & Gray, C.W. (2007). “Policies and corruption outcomes” in anticorruption in
transition 3. Who is succeeding and why? The World Bank.
James, S., & Edward, A. (2008). Developing tax policy in a complex and changing world.
Economic Analysis & Policy, 38 (1), 35-53.
James, S. (2006). Tax officials‟ attitudes and perceptions, performance indicators and
efficiency of tax collection. Discussion paper in management paper number 06/01.
James, O.A, Ariffin, Z.Z., & Idris, K.M. (2012). Non-compliance opportunities and tax
compliance behaviour in Nigeria: the moderating effect of tax payers financial conditi
on and risk preferences. Journal of modern Accounting and Auditing, 8(4), 445-460.
Jin, M.H., & Lee, M. (2012). The effects of autonomy, experience, and person organization fit
on job satisfaction: the case of public sector. The international journal of social
sciences, 6 (1), 18-44.
Joon, K.K., & Kim, K.S. (2011). Tax administration reform in Korea and its implications.
World Bank and KDI School Conference on Fiscal Policy and Management on 14-18
November2011.
Karimi, S.P., Jafari, S.A., & Rezaei, R.A. (2010). Corruption and tax revenue new evidence
from developing countries. Australian Journal of Basic and Applied Sciences, 4(9),
218-232.
Kawai, N., & Strange, R. (2013). Subsidiary autonomy and performance in Japanese
multinationals in Europe. International Business Review.
Kenneth, T. (2012). IRS finds U.S. tax evasion $385 billion per year, suggesting tax justice
network numbers are right. Middle Class Economist.

70
Kiabel, D. B., & Nwokah, G. N. (2009). Boosting revenue generation by state governments in
Nigeria: The tax consultant option revisited. European Journal of Sciences, 8 (4).
Kleven, H., Knudsen, M.B., Kreiner, C.T., Pedersen, S., & Saez, E. (2010). Unwilling or
unable to cheat? Evidence from a randomized tax audit experiment in Denmark.
Working paper.
Krejcie, R.V., & Morgan, D.W. (1970). Determining sample size for research
activities. Educational and Psychological Measurement, 30, 607-610.
London, J.D. (2013). The promises and perils of hospital autonomy reform by decree in viet
nam, social science and medicine. 232-240.
http://dx.doi.org/10.1016/j.socscimed.2013.07.009
Maboja, W. (2013, October 18). Tax evasion in Nigeria could be costing government billion
of naira. CNBCAfrica.
Machupa, O., Otaigo, E., Koloseni, D., & Shimba, F. (2011). Assessing the factors
influencing information technology investment decisions: A survey of sampled public
sector organizations in Tanzania. ICIEIS, 1(251), 385 -399.
Manasan, R.G. (2003). Tax administration reform: (Semi-) autonomous revenue authority
anyone? Philippine institute for development studies. Discussion paper series no.
2003-05 (revised).
Manzoor, Q. (2012). Impact of employees motivation on organizational effectiveness.
Business Management and Strategy, 3(1). doi:10.5296/bms.v3i1.904
Marsden, D., & Richardson, R. (1992). Motivation and performance related pay in the public
sector: A case study of the Inland Revenue. Centre of economic performance, London
School of Ecomomics, Discussion paper No. 75, May.
Micah, L.C., Ebere, C., & Umobong, A.A. (2012). Tax system in Nigeria – challenges and the
way forward. Research Journal of Finance and Accounting, 3(5), 9-15.
Mikesell, J.L. (2003). International experiences with administration of local taxes:
A review of practices and issues prepared for the world bank thematic group

71
on taxation and tax policy.
Mohamad, A., Mustafa, H., & Asri, M. (2007, July). The effects of knowledge on tax
compliance behaviours among malaysian taxpayers. International Conference
on Business and Information. Tokyo, Japan.
Mustafa, B., & Yilmaz, S. (2006). Keeping an eye on subnational governments: internal
control and audit at local levels. The World Bank.
Muogbo, U.S. (2013). The impact of employee motivation on organizational performance (A
study of some selected firms in Anambra state Nigeria). The International Journal of
Engineering and Science (IJES), 2(7), 70-80.
Ngama, Y. (2013, May 17). 350,000 Companies in Nigeria do not pay taxes, says FG. The
Nigerian Voice.
Nwanna, G., & Richards, D. (2010). The imperative of basic tax education for citizens.
American Journal of Business Education, 3(9), 61-66.
OECD (2012). Tax administration: Detecting corruption. CleanGovBiz.
OECD (2001). Committee of fiscal affairs forum on strategic management, principles of good
tax administration: Centre for tax policy and administration.
OECD (2011). “Efficiency of tax administrations”, in government at a glance 2011, OECD
Publishing. http://dx.doi.org/10.1787/gov_glance-2011-64-en
Ogbonna, G.N. (2011). Burning issues and challenges of the Nigerian tax systems with
analytical emphasis on petroleum profit tax.
Ojochgwu, W.A., & Stephen, A.O. (2012). Factors that affect tax compliance among small
and medium enterprises (SMEs) in north central Nigeria. International Journal of
Business Managent, 7(12), 87-96.
Okaru, I.O. (2011, Feb). Effective and efficient tax collection and administration in Nigeria in
the three tiers of government. Paper presented at Le Meridien hotel, Oyo, Akwa Ibom
state.
Okonjo-Iweala, N. (2013, March 25). Tax emerges as crucial issue in post- 2015 development
talks. The Guardian.
Olatunji, O.C., Taiwo, O.A., & Adewole, J.O. (2009). A review generation in Nigeria local

72
government: A case study of Ekiti state. International Business Management, 3 (3),
54-60.
Olowookere, J. K., & Fasina, H. T. (2013). Taxpayers‟ education: A key strategy in achieving
voluntary compliance in Lagos state, Nigeria. European Journal of Business and
Management, 5 (10), 146-154.
Olsen, D., & Purao, S. (2001). The impact of information and communication technology on
inter-organizational coordination: Guidelines from theory. Information Science, 4 (3),
129 – 138.
Onyeukwu, H. (2010). “Business tax in Nigeria: The controversy of multiple taxation”
corporate governance.
Palil, M.R., & Mustapha, A.F. (2011). Determinants of tax compliance in Asia: A case of
Malaysia. European Journal of social Sciences, 24(1), 7-32.
Pilat, D. (2004). The ICT productivity paradox: Insights from micro data. OECD Economic
Studies, 38(1), 38-65.
Presidential Committee on National Tax Policy (2008). Draft document on the national tax
policy”. Available from: http://www.scribd.com/doc/10063735/National-Tax-Policy-
Draft-Updated.
Rahman, A. (2009). Investment climate in practice: Tackling corruption through tax
administration reform.
Randlane, K. (2012). Tax compliance and tax attitudes: The case of Estonia. Journal of
Management and Change, 29, 89-103.
Rainey, H.G., & Steinbauer, P. (1999). Galloping elepants: Developing elements of a theory
of effective government organizations. Journal of Public Administration Research and
Theory, 9(1), 1-32.
Rasdi, R.M., Ismail, M.,Uli, J., & Noah, S.M. (2009). Towards developing a theoretical
framework for measuring public sector mergers‟ career success. Journal of Europeans
Industrial Training, 33(3), 232-254. DOI 10.1108/03090590910950596
73
Rewane, B. (2013, March 12). Nigeria loses N90billion to tax evasion in four years in auto
industry; Taxation.
Salami, A. (2011). Taxation, revenue allocation and fiscal federalism in Nigeria: Issues,
challenges and policy options. Economic Annals, LVI (189), 27-50.
DOI:10.2298/EKA1189027S
Sanni, A. (2012). Multipilicity of taxes in Nigeria: Issues, problems and solutions.
International Journal of Business and social Sciences, 3(17), 229 -236.
Sekaran, U. (2000). Research Methods for Business; A Skill Building Approach. (3rd Ed).
New York: John Wiley and Sons.
Solomon, O., Hashim, N.H., Mehdi, Z.B.T., & Ajagbe, M.A. (2012). Employee motivation
and organizational performance in multinational companies: A study of Cadbury
Nigeria plc. International Journal of Research in Management & Technology, 2(3),
303-312.
State Revenue Service (2005). State revenue tax administration strategy for the year 2005-
2009.
Taliercio, R. (2004). Designing performance: the semi-autonomous revenue authority model
in Africa and Latin America. World Bank Policy Research Paper.
The Chartered Institute on Taxation of Nigeria (CITN) (2002).
Thomas, K. (2012, Jan 9). IRS finds U.S. tax evasion $385 billion per year, suggesting tax
justice network numbers are right. Middle Class Economist.
Ugwu, J.S. (2013). The association of tax education and tax compliance: A case study of
UUM accounting students. Unpublished master‟s thesis, Universiti Utara Malaysia.
UN (2000). Improving tax administration in Sub-Saharan Africa: The potential of revenue
agencies and electronic service delivery.

74
Upadhyaya, G. (2011). ICT application in service delivery: A case of inland revenue
department, Nepal. A Thesis submitted to the school of postgraduate study. North
South University, Bangladesh.
Verschuere, B. (2007). Measuring policy autonomy of public organizations: Conceptual and
methodological issues. Paper for COBRA, Rotterdam, 29-30 March 2007.
Wei, S.L. (1997). Why corruption is much more taxing than tax? Arbitrariness kills. National
bureau of economic research. Working paper 6255.
Williams, I.T. (2013). Effective publicity and education campaigns to enhance compliance:
design and implementation issues. Dominica.
Wolf, S. (2001). Determinants and impact of ICT use for African SMEs: Implications rural
South Africa. Annual Forum at Misty Hills, Muldersdrift.
Wright, B.E. (2004). The role of work context in work motivation: A public sector application
of goal and social cognitive theories. Journal of Public Administration Research and
Theory, 14(1), 59-78. DOI: 10.1093/jopart/muh004
Zikmund, W.G. (2000). Business Research Methods. (5th Ed). Orlando: The Dryden
Press.

75
APPENDIX 1: QUESTIONNAIRE
A SURVEY ON THE DETERMINANT OF TAX ADMINISTRATION EFFICIENCY:
A STUDY OF BAUCHI STATE INTERNAL REVENUE
Dear respondents,
I am a Masters (International Accounting) student of School of Accountancy, Universiti Utara
Malaysia. I am currently conducting a research on the topic: Determinant of Tax
Administration Efficiency: A study of Bauchi State Internal Revenue. I hereby solicit for your
opinion through the medium of questionnaire.
This questionnaire is purely for academic research purpose. Any information provided will be
strictly treated confidentially and will be used for the purpose which it was meant for. As such
your identity is not required.
Thank you so much in anticipating your cooperation and assistance.
Yours Sincerely,
Shamsudeen Ladan Shagari
+60149078349

76
Please indicate the extent to which you agree or disagree to each of the statement below, use
the scale below to indicate your answer.
1- Strongly disagree (SD) 2- Disagree (D) 3- Not sure (NS) 4- Agree (A) 5- Strongly Agree
(SA)
SD D NS A SA
1. In my view our tax system has an efficient collection
process
1 2 3 4 5
2. Income generated from tax revenue by my organization
has been impressive due to efficient tax administration
1 2 3 4 5
3. My organization has adequate infrastructures for efficient
tax administration
1 2 3 4 5
4. My organization has well-trained staff for efficient tax
administration
1 2 3 4 5
5. In my opinion our tax administrative structure lack
autonomy
1 2 3 4 5
6. Politicians interferes too much with the activities of
Board of Internal Revenue
1 2 3 4 5
7. The Board of Internal Revenue has autonomy in
recruitment and dismissal of staff
1 2 3 4 5
8. The Board of Internal Revenue has autonomy in budget
preparation and implementation
1 2 3 4 5
9. The Board of Internal Revenue takes most of the
decisions itself after consulting the Ministry of Finance
1 2 3 4 5
10. The Board of Internal Revenue has the autonomy to
recruit and dismiss staff
1 2 3 4 5
11. The Board provides me with useful ICT trainings in the
daily working procedures
1 2 3 4 5
12. The Board provides online facility in my desk 1 2 3 4 5
13. The Board regularly maintained our ICT infrastructures
(digital devices, internet facility)
1 2 3 4 5
14. The Board ensure that our organizational website is well
maintained and updated
1 2 3 4 5
15. The board employs strong tax audit to achieved Targeted
Revenue
1 2 3 4 5

77
16. The Board employs strong tax audit to solve the problems
of tax evasion, avoidance and other irregularities
1 2 3 4 5
17. The Board employs strong tax audit to ensure the
submission of accurate and current returns
1 2 3 4 5
18. The Board creates awareness of strong tax audit to makes
the taxpayers render a satisfactory returns
1 2 3 4 5
19. Public enlightenment campaign on utilisation of tax
revenue by Board of Internal Revenue will encourage tax
payment
1 2 3 4 5
20. Issuance of tax payment notice in reasonable time by
Board of Internal Revenue will encourage tax payment
1 2 3 4 5
21. Public enlightenment by Board of Internal Revenue will
make people in the informal sector pay their tax regularly
1 2 3 4 5
22. Public enlightenment campaign by Board of Internal
Revenue on sanctions and penalty for noncompliance will
encourage tax payments
1 2 3 4 5
23. I have been motivated by my organization to put my best
effort in my job done
1 2 3 4 5
24. I have been remunerated for staying beyond the working
hours to finish my daily routine task
1 2 3 4 5
25. Employees in my organization work as hard as employees
in other organization with similar remuneration
1 2 3 4 5
26. I have been motivated by my organization to do extra
work for my job that isn‟t normally expected for me
1 2 3 4 5
27. Time seems to drag while I am on the job 1 2 3 4 5
28. Board of Internal Revenue explicitly disallow tax
deductions for bribes to public officials
1 2 3 4 5
29. Board of Internal Revenue raises awareness among
taxpayers that bribes are not deductible
1 2 3 4 5
30. Board of Internal Revenue Staff are authorised to report
suspicious of corruption by taxpayers to the appropriate
law enforcement authority
1 2 3 4 5
31. Board of Internal Revenue uses tax information sharing
agreements with other States Board of Internal Revenue
to obtain and provide information to determine whether a
1 2 3 4 5

78
deducted payment constitutes a bribe.
DEMOGRAHIC BACKGROUND
Instruction: please tick () in the correct response where appropriate.
1. Age [group]
[ ] 20 – 30
[ ] 31 – 40
[ ] 41 – 50
[ ] 51 – 60
[ ] Above 60 years
2. Gender
[ ] Male
[ ] Female
3. Educational background
[ ] Secondary School Certificate
[ ] Diploma Certificate
[ ] Degree B.sc/Higher National Diploma (HND)
[ ] Master degree/Ph. D
4. Position
[ ] Top Management
[ ] Middle Management
[ ] Supporting Management
5. Marital Status
[ ] Married
[ ] Single
[ ] Divorce
6. Religion
[ ] Islam
[ ] Christian
[ ] Others
THANK YOU FOR YOUR COOPERATION

79
APPEDIX 2: Measurement of Variable
Table 3.2: Measurement of Variable Tax Administration Efficiency
Name of
Variable
Measurement Item Sources
Tax
Administration
Efficiency
Tax administration system in Nigeria is complex Abiola and
Asiweh (2012)
Income tax structure is equitable Abiola and
Asiweh (2012)
Tax system has an inefficient tax collection process Abiola and
Asiweh (2012)
Nigeria tax System is progressive in nature Abiola and
Asiweh (2012)
Table 3.3: Measurement of Variable Autonomy of Tax Authority
Name of
Variable
Measurement Item Sources
Autonomy of
Tax authority
Tax Administrative structure in Nigeria lack Autonomy Abiola and
Asiweh
(2012)
Politicians interferes much with the Nigerian tax system Abiola and
Asiweh
(2012)
Tax authority has autonomy in recruitment and dismissal of
staff
EU (2007)
Tax authority has autonomy in budget preparation and
implementation
EU (2007)
Tax authority takes most of the decisions itself after
consulting the ministry of finance
Verscheure
(2007)

80
Table 3.4: Measurement of Variable Use of ICT
Name of
Variable
Measurement Item Sources
Use of ICT Usefulness of ICT trainings in the daily working
procedures of my organization
Upadhyaya
(2011)
Having online facility in my desk Upadhyaya
(2011)
ICT infrastructures (digital devices, internet facility) are
regularly maintained in my organization
Upadhyaya
(2011)
To what extent, do you agree that the website of your
organization is well maintained and updated
Upadhyaya
(2011)
Table 3.5: Measurement of Variable Strong Audit Practice
Name of
Variable
Measurement Item Sources
Strong Audit
Practice
Tax audit is employed by Relevant Tax Authority (RTA) to
achieved Target Revenue
Badara
(2012)
Tax audit solves the problems of tax evasion, avoidance
and other irregularities
Badara
(2012)
Tax audit ensures the submission of accurate and current
returns
Badara
(2012)
The awareness of tax audit makes the tax payers to render a
satisfactory returns
Badara
(2012)

81
Table 3.6: Measurement of Variable Public Enlightenment
Name of
Variable
Measurement Item Sources
Public
Enlightenment
Public enlightenment on utilisation of tax revenue will
encourage tax payment
Abiola and
Asiweh
(2012)
Tax authority issues tax payment notice in reasonable time Abiola and
Asiweh
(2012)
Public enlightenment make people in the informal sector pay
their tax regularly
Abiola and
Asiweh
(2012)
Tax authority makes people aware about sanctions and
penalty for noncompliance
Badara
(2012)
Table 3.7: Measurement of variable Motivation and Incentives
Name of
Variable
Measurement Item Sources
Staff
remuneration
and motivation
I have been motivated by my organization to put my best
effort my job done
Wright
(2004)
I have been remunerated for staying beyond the working
hours to finish in my daily routine task
Wright
(2004)
Employees in my organization work as hard as employees in
other organization with similar remuneration
Wright
(2004)
I have been motivated by my organization to do extra work
for my job that isn‟t normally expected for me
Wright
(2004)
Time seems to drag while I am on the job Wright
(2004)

82
Table 3.8: Measurement of Variable Perceive Corruption
Name of
Variable
Measurement Item Sources
Perceive
Corruption
Tax systems explicitly disallow tax deductions for bribes to
public officials
OECD
(2012)
Tax administrations raise awareness among taxpayers that
bribes are not deductible
OECD
(2012)
Are tax authorities authorised to report suspicions of
corruption to the appropriate law enforcement authorities
OECD
(2012)
Tax authorities use tax information sharing agreements with
other States to obtain and provide information to determine
whether a deducted payment constitutes a bribe
OECD
(2012)

83
APPENDIX 3: DESCRIPTIVE ANALYSIS
Summary of Descriptive Statistics of Variables
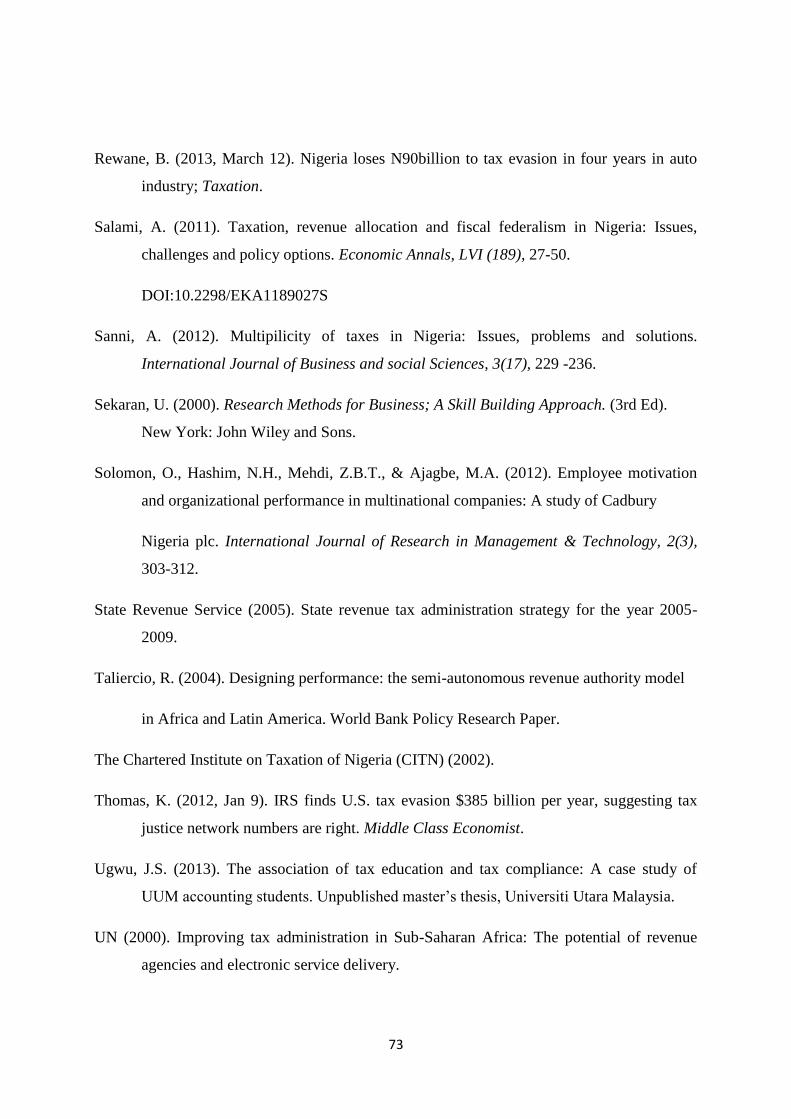
Code Items Min Max Mean SD SA NS SD
TAE1 Tax system has an efficient
collection process
1 5 4.21 0.92 105
(90%)
4
(3%)
8
(7%)
TAE2 Tax revenue by my
organization has been
impressive due to efficient
tax administration
1 5 3.93 0.72 91
(78%)
23
(20%)
3
(2%)
TAE3 Organization has adequate
infrastructures for efficient
tax administration
1 5 3.81 0.84 89
(76%)
15
(13%)
13
(11%)
TAE4 Organization has well-
trained staff for efficient tax
administration
1 5 4.14 0.81 99
(85%)
14
(12%)
4
(3%)
ABIR1 our tax administrative
structure lack autonomy
1 5 2.99 1.18 47
(40%)
21
(18%)
49
(42%)
ABIR3 Board of Internal Revenue
has autonomy in recruitment
and dismissal of staff
2 5 4.01 0.86 85
(73%)
4
(3%)
28
(24%)
ABIR4 Board of Internal Revenue
has autonomy in budget
preparation and
implementation
2 5 3.74 0.76 71
(61%)
4
(3%)
42
(36%)
ABIR6 Board of Internal Revenue
has the autonomy to recruit
and dismiss staff
1 5 3.89 1.02 78
(67%)
23
(21%)
14
(12%)
ICT 1 The Board provides me with
useful ICT trainings in the
daily working procedures
2 5 3.96 0.68 88
(75%)
2
(2%)
27
(23%)
ICT 2 The Board provides online
facility in my desk
1 5 3.90 0.84 82
(70%)
23
(20%)
7
(6%)
ICT 3 The Board regularly
maintained our ICT
infrastructures (digital
2 5 4.12 0.69 37
(32%)
60
(52%)
20
(17%)
84
devices, internet facility)
ICT 4 The Board ensure that our
organizational website is
well maintained and updated
1 5 4.10 0.66 104
(89%)
11
(10%)
2
(1%)
SAP1 The board employs strong
tax audit to achieved
Targeted Revenue
1 5 4.30 0.77 106
(91%)
8
(7%)
3
(3%)
SAP2 The Board employs strong
tax audit to solve the
problems of tax evasion,
avoidance and other
irregularities
2 5 4.24 0.59 41
(35%)
70
(60%)
6
(5%)
SAP3 The Board employs strong
tax audit to ensure the
submission of accurate and
current returns
2 5 4.17 0.55 109
(93%)
7
(6%)
1
(1%)
SAP4 The Board creates awareness
of strong tax audit to makes
the taxpayers render a
satisfactory returns
2 5 4.19 0.65 107
(91%)
7
(6%)
3
(3)
PE 1 Public enlightenment by
Board of Internal Revenue
will make people in the
informal sector pay their tax
regularly
2 5 4.42 0.64 111
(95%)
4
(3%)
2
(2%)
PE 2 Issuance of tax payment
notice in reasonable time by
Board of Internal Revenue
will encourage tax payment
1 5 4.10 0.78 105
(90%)
7
(6%)
5
(4%)
PE 3 Public enlightenment by
Board of Internal Revenue
will make people in the
informal sector pay their tax
regularly
3 5 4.00 0.60 92
(79%)
25
(21%)
0
PE 4 Public enlightenment
campaign by Board of
Internal Revenue on
sanctions and penalty for
noncompliance will
encourage tax payments
2 5 3.87 0.66 87
(74%)
28
(24%)
2
(2%)

85
MAI1 I have been motivated by my
organization to put my best
effort in my job done
1 5 3.77 1.08 80
(68%)
15
(13%)
22
(19%)
MAI2 I have been remunerated for
staying beyond the working
hours to finish my daily
routine task
1 5 3.51 0.95 73
(62%)
20
(17%)
24
(21%)
PC 1 Board of Internal Revenue
explicitly disallow tax
deductions for bribes to
public officials
1 5 3.89 0.78 85
(73%)
28
(24%)
4
(3%)
PC 2 Board of Internal Revenue
raises awareness among
taxpayers that bribes are not
deductible
2 5 3.84 0.78 87
(74%)
21
(18%)
9
(8%)
PC 3 Board of Internal Revenue
Staff are authorised to report
suspicious of corruption by
taxpayers to the appropriate
law enforcement authority
3 5 4.09 0.46 109
(93%)
8
(7%)
0
PC 4 Board of Internal Revenue
uses tax information sharing
agreements with other States
Board of Internal Revenue to
obtain and provide
information to determine
whether a deducted payment
constitutes a bribe.
3 5 3.92 0.52 86
(74%)
31
(26%)
0
86
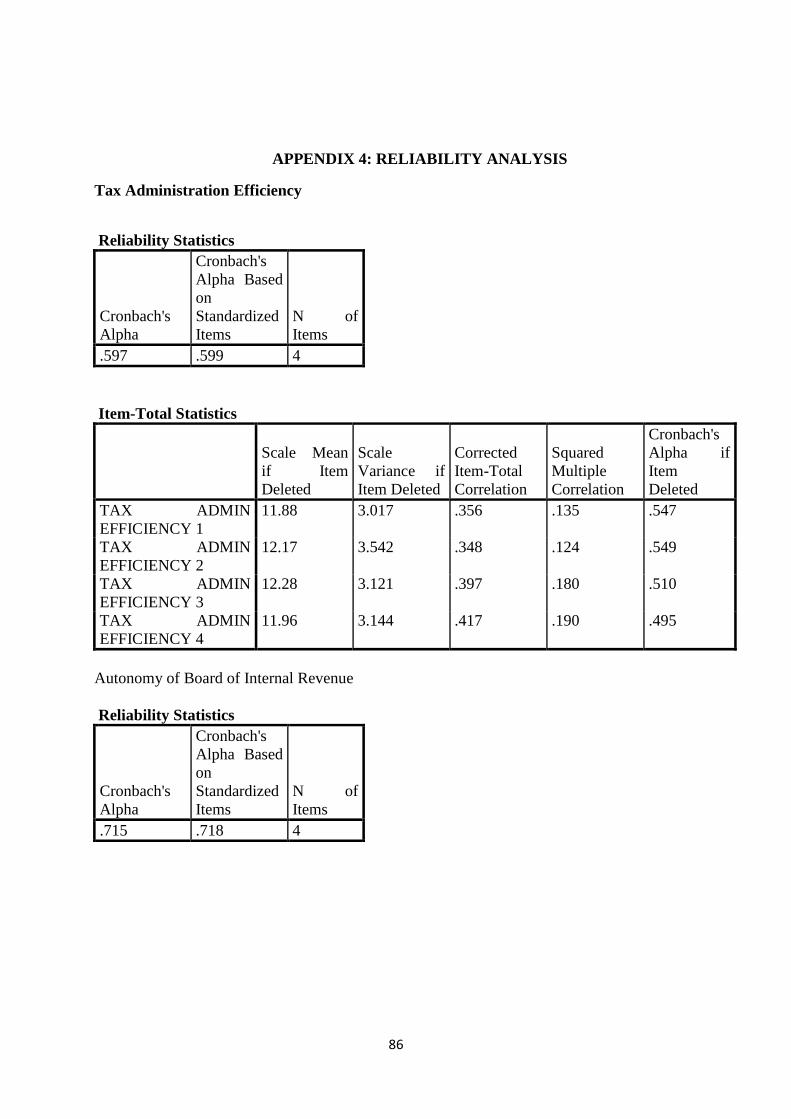
APPENDIX 4: RELIABILITY ANALYSIS
Tax Administration Efficiency
Reliability Statistics
Cronbach's
Alpha
Cronbach's
Alpha Based
on
Standardized
Items
N of
Items
.597 .599 4
Item-Total Statistics
Scale Mean
if Item
Deleted
Scale
Variance if
Item Deleted
Corrected
Item-Total
Correlation
Squared
Multiple
Correlation
Cronbach's
Alpha if
Item
Deleted
TAX ADMIN
EFFICIENCY 1
11.88 3.017 .356 .135 .547
TAX ADMIN
EFFICIENCY 2
12.17 3.542 .348 .124 .549
TAX ADMIN
EFFICIENCY 3
12.28 3.121 .397 .180 .510
TAX ADMIN
EFFICIENCY 4
11.96 3.144 .417 .190 .495
Autonomy of Board of Internal Revenue
Reliability Statistics
Cronbach's
Alpha
Cronbach's
Alpha Based
on
Standardized
Items
N of
Items
.715 .718 4

87
Item-Total Statistics
Scale Mean
if Item
Deleted
Scale
Variance if
Item Deleted
Corrected
Item-Total
Correlation
Squared
Multiple
Correlation
Cronbach's
Alpha if
Item
Deleted
AUTONOMY OF
BOARD OF
INTERNAL
REVENUE 1
11.64 3.884 .611 .384 .584
AUTONOMY OF
BOARD OF
INTERNAL
REVENUE 3
10.61 5.372 .507 .269 .653
AUTONOMY OF
BOARD OF
INTERNAL
REVENUE 4
10.89 5.919 .440 .247 .691
AUTONOMY OF
BOARD OF
INTERNAL
REVENUE 6
10.74 4.872 .491 .292 .661
Information and Communication Technology
Reliability Statistics
Cronbach's
Alpha
Cronbach's
Alpha Based
on
Standardized
Items
N of
Items
.745 .753 4

88
Item-Total Statistics
Scale Mean
if Item
Deleted
Scale
Variance if
Item Deleted
Corrected
Item-Total
Correlation
Squared
Multiple
Correlation
Cronbach's
Alpha if
Item
Deleted
INFORMATION AND
COMMUNICATION
TECHNOLOGY 1
12.12 3.122 .482 .417 .717
INFORMATION AND
COMMUNICATION
TECHNOLOGY 2
12.19 2.688 .491 .443 .726
INFORMATION AND
COMMUNICATION
TECHNOLOGY 3
11.97 2.896 .576 .478 .667
INFORMATION AND
COMMUNICATION
TECHNOLOGY 4
11.98 2.881 .636 .507 .638
Strong Audit Practice
Reliability Statistics
Cronbach's
Alpha
Cronbach's
Alpha Based
on
Standardized
Items
N of
Items
.734 .751 4

89
Item-Total Statistics
Scale Mean
if Item
Deleted
Scale
Variance if
Item Deleted
Corrected
Item-Total
Correlation
Squared
Multiple
Correlation
Cronbach's
Alpha if
Item
Deleted
STRONG AUDIT
PRACTICE 1
12.60 2.185 .423 .209 .755
STRONG AUDIT
PRACTICE 2
12.66 2.346 .593 .353 .640
STRONG AUDIT
PRACTICE 3
12.73 2.422 .601 .409 .642
STRONG AUDIT
PRACTICE 4
12.71 2.276 .538 .381 .667
Public Enlightenment
Reliability Statistics
Cronbach's
Alpha
Cronbach's
Alpha Based
on
Standardized
Items
N of
Items
.632 .629 4
Item-Total Statistics
Scale Mean
if Item
Deleted
Scale
Variance if
Item Deleted
Corrected
Item-Total
Correlation
Squared
Multiple
Correlation
Cronbach's
Alpha if
Item
Deleted
PUBLIC
ENLIGHTENMENT 1
11.96 2.379 .351 .225 .603
PUBLIC
ENLIGHTENMENT 2
12.29 1.813 .497 .308 .494
PUBLIC
ENLIGHTENMENT 3
12.38 2.441 .364 .231 .594
PUBLIC
ENLIGHTENMENT 4
12.51 2.180 .443 .293 .539
90
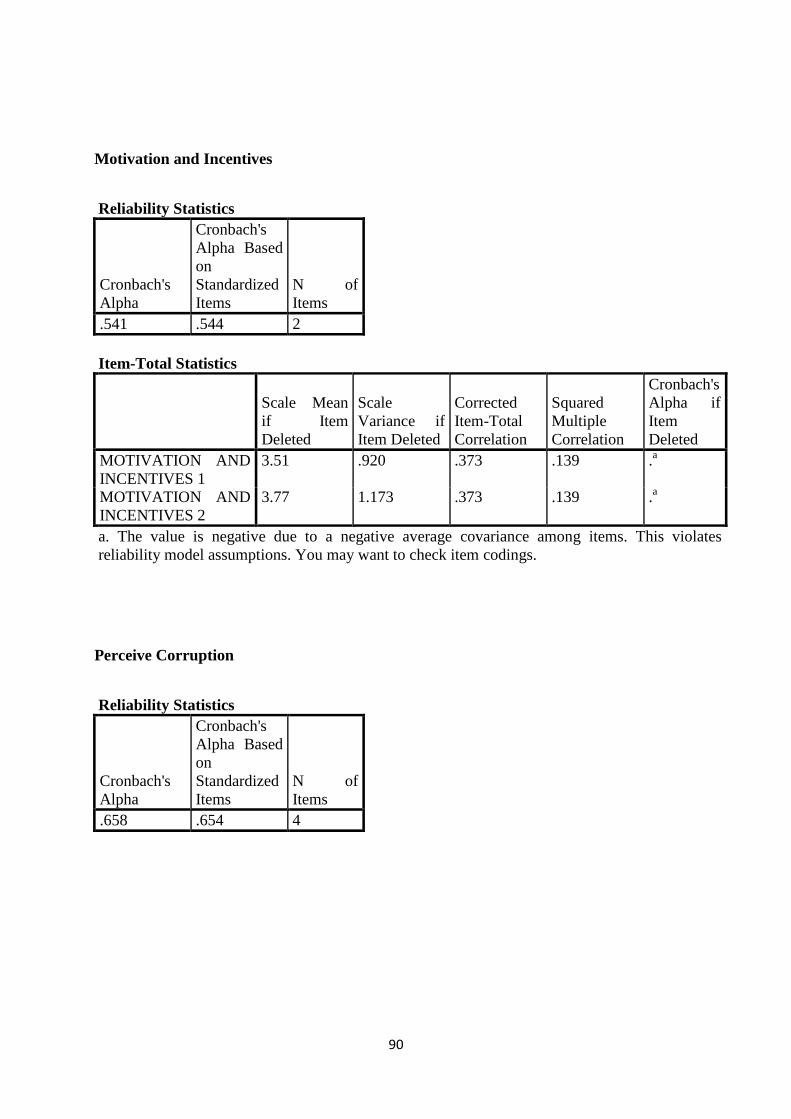
Motivation and Incentives
Reliability Statistics
Cronbach's
Alpha
Cronbach's
Alpha Based
on
Standardized
Items
N of
Items
.541 .544 2
Item-Total Statistics
Scale Mean
if Item
Deleted
Scale
Variance if
Item Deleted
Corrected
Item-Total
Correlation
Squared
Multiple
Correlation
Cronbach's
Alpha if
Item
Deleted
MOTIVATION AND
INCENTIVES 1
3.51 .920 .373 .139 .a
MOTIVATION AND
INCENTIVES 2
3.77 1.173 .373 .139 .a
a. The value is negative due to a negative average covariance among items. This violates
reliability model assumptions. You may want to check item codings.
Perceive Corruption
Reliability Statistics
Cronbach's
Alpha
Cronbach's
Alpha Based
on
Standardized
Items
N of
Items
.658 .654 4

91
Item-Total Statistics
Scale Mean
if Item
Deleted
Scale
Variance if
Item Deleted
Corrected
Item-Total
Correlation
Squared
Multiple
Correlation
Cronbach's
Alpha if
Item
Deleted
PERCEIVE
CORRUPTION 1
11.84 1.691 .536 .380 .518
PERCEIVE
CORRUPTION 2
11.90 1.574 .611 .400 .448
PERCEIVE
CORRUPTION 3
11.65 2.355 .580 .358 .540
PERCEIVE
CORRUPTION 4
11.81 2.906 .126 .035 .750

92
APPENDIX 5: FACTOR LOADING ANALYSIS
KMO and Bartlett's Test
Kaiser-Meyer-Olkin Measure of Sampling
Adequacy.
.634
Bartlett's Test of
Sphericity
Approx. Chi-Square 1529.159
Df 325
Sig. .000
Total Variance Explained
Compone
nt Initial Eigenvalues
Extraction Sums of Squared
Loadings Rotation Sums of Squared Loadings
Total
% of
Varianc
e
Cumulative
% Total
% of
Varianc
e
Cumulative
% Total
% of
Variance Cumulative %
d
i
m
e
n
s
i
o
n
0
1 5.048 19.414 19.414 5.048 19.414 19.414 3.106 11.945 11.945
2 3.220 12.384 31.798 3.220 12.384 31.798 2.693 10.357 22.302
3 2.661 10.235 42.032 2.661 10.235 42.032 2.685 10.327 32.629
4 2.037 7.836 49.868 2.037 7.836 49.868 2.496 9.601 42.230
5 1.781 6.851 56.720 1.781 6.851 56.720 2.334 8.976 51.206
6 1.464 5.631 62.350 1.464 5.631 62.350 2.138 8.222 59.428
7 1.283 4.933 67.283 1.283 4.933 67.283 1.638 6.302 65.730
8 1.231 4.734 72.017 1.231 4.734 72.017 1.635 6.288 72.017
9 .922 3.546 75.563
10 .892 3.430 78.993
11 .804 3.091 82.083
12 .688 2.647 84.730
13 .563 2.167 86.897
14 .529 2.036 88.933
15 .447 1.718 90.651
16 .374 1.437 92.088
17 .323 1.244 93.331
18 .313 1.205 94.536
19 .268 1.032 95.568
20 .226 .867 96.436
21 .219 .842 97.277
22 .183 .705 97.983
23 .152 .585 98.568
24 .138 .529 99.097
25 .122 .471 99.568
26 .112 .432 100.000

93
Total Variance Explained
Compone
nt Initial Eigenvalues
Extraction Sums of Squared
Loadings Rotation Sums of Squared Loadings
Total
% of
Varianc
e
Cumulative
% Total
% of
Varianc
e
Cumulative
% Total
% of
Variance Cumulative %
d
i
m
e
n
s
i
o
n
0
1 5.048 19.414 19.414 5.048 19.414 19.414 3.106 11.945 11.945
2 3.220 12.384 31.798 3.220 12.384 31.798 2.693 10.357 22.302
3 2.661 10.235 42.032 2.661 10.235 42.032 2.685 10.327 32.629
4 2.037 7.836 49.868 2.037 7.836 49.868 2.496 9.601 42.230
5 1.781 6.851 56.720 1.781 6.851 56.720 2.334 8.976 51.206
6 1.464 5.631 62.350 1.464 5.631 62.350 2.138 8.222 59.428
7 1.283 4.933 67.283 1.283 4.933 67.283 1.638 6.302 65.730
8 1.231 4.734 72.017 1.231 4.734 72.017 1.635 6.288 72.017
9 .922 3.546 75.563
10 .892 3.430 78.993
11 .804 3.091 82.083
12 .688 2.647 84.730
13 .563 2.167 86.897
14 .529 2.036 88.933
15 .447 1.718 90.651
16 .374 1.437 92.088
17 .323 1.244 93.331
18 .313 1.205 94.536
19 .268 1.032 95.568
20 .226 .867 96.436
21 .219 .842 97.277
22 .183 .705 97.983
23 .152 .585 98.568
24 .138 .529 99.097
25 .122 .471 99.568
26 .112 .432 100.000
Extraction Method: Principal Component Analysis.

94
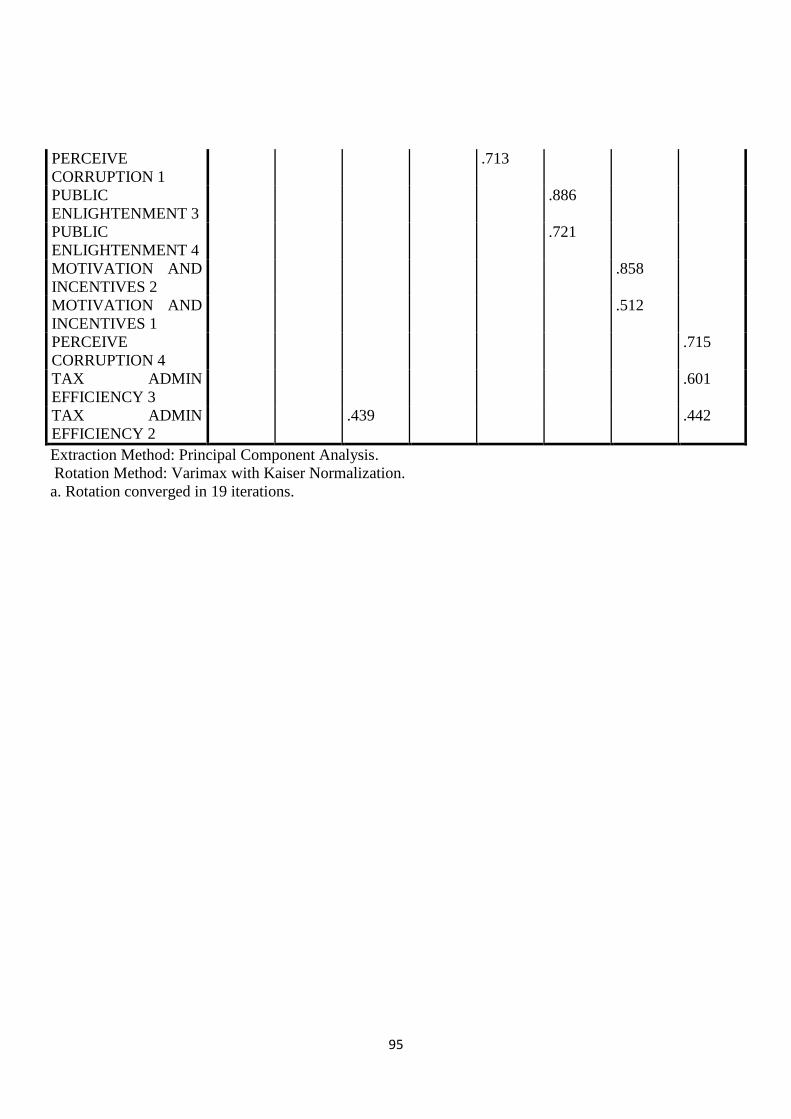
Rotated Component Matrixa
Component
1 2 3 4 5 6 7 8
STRONG AUDIT
PRACTICE 3
.829
STRONG AUDIT
PRACTICE 4
.772
PUBLIC
ENLIGHTENMENT 1
.677
STRONG AUDIT
PRACTICE 2
.640
INFORMATION AND
COMMUNICATION
TECHNOLOGY 1
.533 .434
INFORMATION AND
COMMUNICATION
TECHNOLOGY 3
.532 .478
INFORMATION AND
COMMUNICATION
TECHNOLOGY 4
.803
INFORMATION AND
COMMUNICATION
TECHNOLOGY 2
.792
TAX ADMIN
EFFICIENCY 4
.688
AUTONOMY OF
BOARD OF
INTERNAL
REVENUE 1
.866
AUTONOMY OF
BOARD OF
INTERNAL
REVENUE 3
.677
AUTONOMY OF
BOARD OF
INTERNAL
REVENUE 4
.641
AUTONOMY OF
BOARD OF
INTERNAL
REVENUE 6
.591
PUBLIC
ENLIGHTENMENT 2
.750
STRONG AUDIT
PRACTICE 1
.717
TAX ADMIN
EFFICIENCY 1
.606 .461
PERCEIVE
CORRUPTION 3
.800
PERCEIVE
CORRUPTION 2
.760
95
PERCEIVE
CORRUPTION 1
.713
PUBLIC
ENLIGHTENMENT 3
.886
PUBLIC
ENLIGHTENMENT 4
.721
MOTIVATION AND
INCENTIVES 2
.858
MOTIVATION AND
INCENTIVES 1
.512
PERCEIVE
CORRUPTION 4
.715
TAX ADMIN
EFFICIENCY 3
.601
TAX ADMIN
EFFICIENCY 2
.439 .442
Extraction Method: Principal Component Analysis.
Rotation Method: Varimax with Kaiser Normalization.
a. Rotation converged in 19 iterations.

96
APPENDIX 6: CORRELATION ANALYSIS
Correlations
TAE ABIR ICT SAP PE MAI PC
TA
E
Pearson
Correlation
1 .332**
.329**
.166 .278**
-.164 .228*
Sig. (2-tailed) .000 .000 .074 .002 .077 .013
N 117 117 117 117 117 117 117
ABI
R
Pearson
Correlation
.332**
1 .249**
.131 -.007 -.247**
.175
Sig. (2-tailed) .000 .007 .158 .940 .007 .059
N 117 117 117 117 117 117 117
ICT Pearson
Correlation
.329**
.249**
1 .346**
.098 -.173 .473**
Sig. (2-tailed) .000 .007 .000 .294 .063 .000
N 117 117 117 117 117 117 117
SAP Pearson
Correlation
.166 .131 .346**
1 .233* .068 .437
**
Sig. (2-tailed) .074 .158 .000 .012 .465 .000
N 117 117 117 117 117 117 117
PE Pearson
Correlation
.278**
-.007 .098 .233* 1 .156 .078
Sig. (2-tailed) .002 .940 .294 .012 .094 .403
N 117 117 117 117 117 117 117
MA
I
Pearson
Correlation
-.164 -.247**
-.173 .068 .156 1 -.001
Sig. (2-tailed) .077 .007 .063 .465 .094 .989
N 117 117 117 117 117 117 117
PC Pearson
Correlation
.228* .175 .473
** .437
** .078 -.001 1
Sig. (2-tailed) .013 .059 .000 .000 .403 .989
N 117 117 117 117 117 117 117
**. Correlation is significant at the 0.01 level (2-tailed).
*. Correlation is significant at the 0.05 level (2-tailed).

97
APPENDIX 7: REGRESSION ANALYSIS
Model Summaryb
Model
R R Square
Adjusted R
Square
Std. Error of
the Estimate
d
i
m
e
n
s
i
o
n
0
1 .505a .255 .214 .49667
a. Predictors: (Constant), PC, MAI, PE, ABIR, SAP, ICT
b. Dependent Variable: TAE
ANOVAb
Model Sum of
Squares Df
Mean
Square F Sig.
1 Regression 9.289 6 1.548 6.276 .000a
Residual 27.135 110 .247
Total 36.425 116
a. Predictors: (Constant), PC, MAI, PE, ABIR, SAP, ICT
b. Dependent Variable: TAE
Coefficientsa
Model Unstandardized
Coefficients
Standardized
Coefficients
T Sig. B Std. Error Beta
1 (Constant) 1.155 .637 1.812 .073
ABIR .194 .069 .247 2.829 .006
ICT .195 .101 .190 1.932 .025
SAP -.031 .110 -.027 -.278 .390
PE .334 .103 .278 3.248 .001
MAI -.074 .058 -.111 -1.271 .103
PC .103 .121 .085 .850 .198
a. Dependent Variable: TAE

98
APPENDIX 8: HISTOGRAM
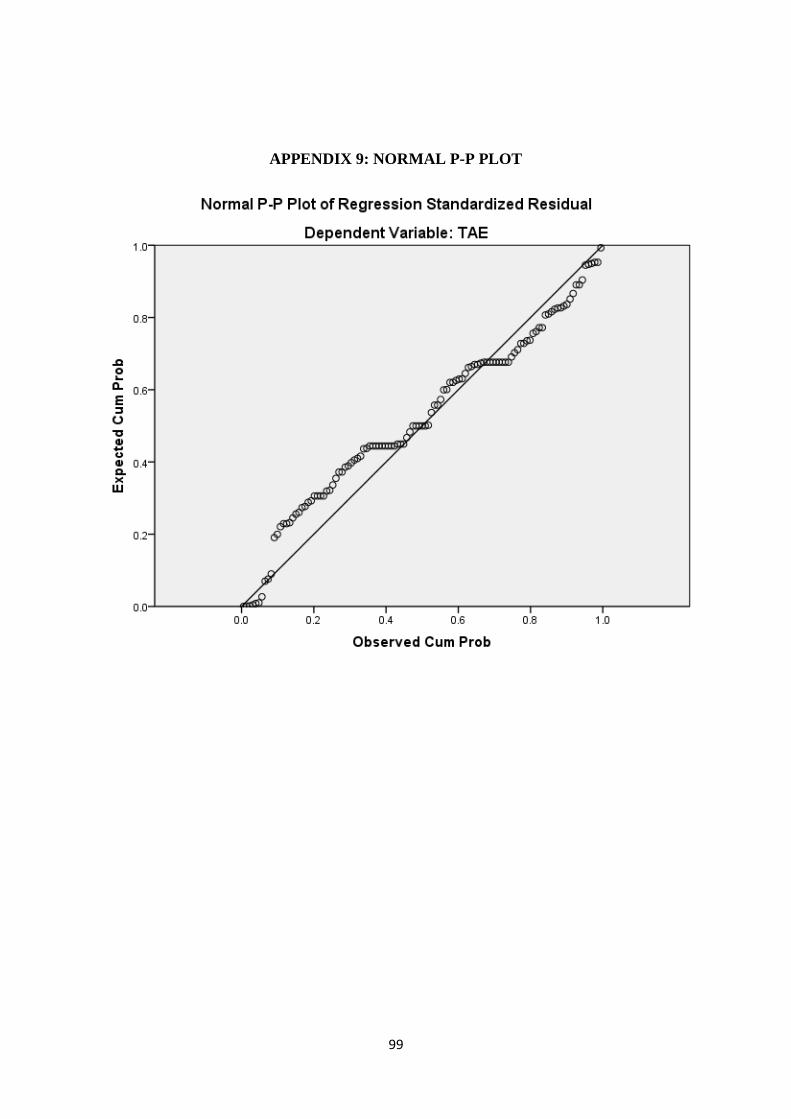
99
APPENDIX 9: NORMAL P-P PLOT