microeconomic and macroeconomic determinants of efficiency
TRANSCRIPT
Microeconomic and Macroeconomic Determinants of Efficiency:
Evidence from Indian Manufacturing Sub-Sectors
Sumit Kumar Majia , Arindam Lahaa, Debasish Sura
aDepartment of Commerce, The University of Burdwan, India
Abstract
In this paper an effort was made to evaluate the level of efficiency of the firms that
belong to the selected manufacturing sub-sectors in India for the period 1999-2000 to 2013-
2014 using Stochastic Frontier Analysis. Subsequently, the microeconomic and
macroeconomic determinants of efficiency were analysed applying Panel Censored Tobit
Regression Model. The study revealed that Electrical Equipment sub-sector was found to be
the most efficient sector followed by the sub-sectors Auto Parts and Equipment,
Pharmaceutical and Biotechnology, Chemicals, Textile, Food products and Steel
respectively. The study also showed that leverage, size of the firm, age of the firm, openness
of the firm (microeconomic) and inflation (macroeconomic) made notable contribution
towards changing the level of efficiency of manufacturing firms during the study period.
However, their contributions were not the same in all sub-sectors under study.
Keywords: Efficiency, Manufacturing Sub-sectors, Stochastic Frontier Analysis
Received:
27 November 2019
Accepted revised version:
13 March 2020
Published:
30 June 2020
Suggested citation: Maji, S. K., Laha, A., & Sur, D. (2020). Microeconomic and
macroeconomic determinants of efficiency: Evidence from Indian manufacturing sub-
sectors. Colombo Business Journal. 11(1), 47-82.
DOI: http://doi.org/10.4038/cbj.v11i1.57
©2020 The Authors. This work is licenced under a Creative Commons Attribution 4.0
International Licence which permits unrestricted use, distribution, and reproduction in any
medium, provided the original work is properly cited.
[email protected]: https://orcid.org/0000-0001-7592-6594
Faculty of
Management & Finance
University of Colombo
Colombo
Business
Journal
International Journal of
Theory & Practice
Vol. 11, No. 01, June, 2020
Colombo Business Journal 11(1), 2020
48
Introduction
The Indian economy, especially the manufacturing sector has gone through
many phases of transformation since independence. With a view to establish a
‘socialistic pattern in the society’, it was believed that large scale public sector
organisations should assume greater responsibility. The aims were to ensure
balanced regional development, fostering economic growth and creation of a large
number of employment opportunities. The attainment of these goals could only be
ensured by having a strong manufacturing sector in the economy. It can never be
denied that the manufacturing sector is quintessential for sustainable economic
growth and higher standard of living in any economy (Felipe et al, 2018; Haraguchi
et al., 2017). This argument is not a new one; it was empirically well established by
Kaldor way back in 1967 where he showed the interconnectedness between the
productivity of the manufacturing sector and economic growth.
In the context of India, only after the implementation of the pro-market
economic policies in late 1980s and early 1990s, a favourable business environment
was created where the industries could grow (Kochhar et al., 2006). It was
empirically established that the reduction of tariffs, withdrawal of industrial
licensing, deregulation, removal of restrictions on imports and exports due to the
economic reform measures promoted efficiency (Kathuria et al., 2012). With the
gradual opening up of the Indian economy since mid-eighties, the opportunity for
growth for manufacturing firms has multiplied on one hand and on the other hand
firms have been facing externalities emanating from the exposure to the industry
specific and macroeconomic factors which were not so powerful prior to the
opening up of the economy as a whole. In a liberalised economic environment, the
competition becomes fierce (Kambhampati & Parikh, 2005). In the wake of such a
highly competitive environment, firms that belong to the Indian manufacturing
sector have to operate efficiently in order to sustain in the long run. Therefore, it is
of utmost importance to understand the diversified factors which are capable of
affecting the level of efficiency of the firms especially in the post-liberalisation
regime.
The various factors which affect a firm normally get classified into three broad
categories such as microeconomic, industry specific and macroeconomic factors
(Sufian, 2009). Irrespective of the policy regime, these three factors have remained
at the core of the efficiency vis-a-vis financial performance of firms that belong to
each and every sector of the economy including manufacturing. But with the

Maji, Laha & Sur
49
opening up of the economy, the industry and macroeconomic factors have become
even more important (Majumdar & Bhattacharjee, 2010). Thus, the formulation of
business strategies in a post-liberalised business environment requires special
consideration of all these three factors together. Afterwards with the passage of time,
Indian industries started growing and such a growth along with reasonably good
returns attracted many other new entrants into the market economy leading to an
extremely high degree of competition. Therefore, in the present age of cut throat
competition, it is inevitable to manage the business with the highest degree of
efficiency to survive in the long run.
The level of competition between firms that belong to the Indian manufacturing
sector is very high as evidenced by the existence of a large number of firms in each
and every manufacturing segment. With the emergence of the liberalisation
measures in India in 1991, such competition has been more intensified1. Effective
utilisation of the available scarce resources is of utmost important for achieving
corporate excellence. Effective usage of the available human capital, technology,
scale and managerial potential has direct impact on the cost effectiveness,
profitability and ultimately on the market value of the firms. Perhaps this is one of
the prime reasons for which many research scholars have delved into the
exploration of the level of efficiency of firms. In a perfectly competitive and
liberalised economy where prices of the factors of production are market
determined, the only way to sustain is to attain the optimum level of efficiency.
Openness of the economy leading to an increased competition ensures that the
resources are put to optimum use (Driffield & Kambhampati, 2003).
The scholars have not restricted their effort in enquiring into the level of
efficiency of firms that belong to different sectors; rather they have also tried to
illuminate the underlying factors responsible for such level of efficiency or
otherwise. In case of manufacturing firms it has been noted that there exists a close
nexus between the size of the firms and the level of efficiency. Large size firms
enjoying economies of scale (Alvarez & Crespi 2003) are expected to be more
efficient than the small size firms (Firth et al., 2015; Halkos & Tzeremes, 2007;
Kalaitzandonakes et al., 1992; Lundvall & Battese, 2000; Pitt & Lee, 1981;
Söderbom & Teal, 2004;). However, recent studies show that if the large size firms
are suffering from debt overhang problems then these firms become less efficient
1As of 31/05/2019 there were 233,412 (20% of the total) registered active manufacturing companies in
India (MCA, 2019) retrieved from http://www.mca.gov.in/Ministry/pdf/MIB_May_01072019.pdf
Colombo Business Journal 11(1), 2020
50
than the small size firms (Hanousek et al., 2015). In addition to that it has been
noted that the efficiency of the small size firms are conditioned upon the age of the
firms, level of technological upgrading, geographical location, government
assistance, innovation capability, Research and Development (R&D) intensity,
experience of the workforce, foreign collaboration, female participation in the
workforce, export orientation, education of the owner, subcontracting possibility,
conglomeration strategy and financial integration (Ahmed & Ahmed, 2013; Alvarez
& Crespi, 2003; Burki & Terrell, 1998; Harvie, 2004; Hall et al., 2009; Hill &
Kalirajan, 1993; Le & Harvie, 2010; Pelham, 2000; Weston & Mansinghka, 1971;J.
C. Yang, 2006; C. H. Yang & Chen, 2009). However in the prelude of India,
Kambhampati and Parikh (2005) suggested that small firms could not exploit
advantages stemmed from the liberalisation measures contrary to the experience in
other countries of the world.
Under the Indian scenario, Bhavani (1991) indicated the existence of a high
level of efficiency in the Indian metal industry during the time period of 1973-1974.
In contrast, Neogi and Ghosh (1994) suggested the decline in the efficiency of the
manufacturing firms and the existence of variability across different manufacturing
industries during 1974-1975 to 1987-1988. Driffield and Kambhampati (2003),
Kumar (2006), Madheswaran et al. (2007) and Pattnayak and Thangavelu (2005)
suggested that the level of efficiency of Indian manufacturing industries improved
in the post-reform era as compared to that of the pre-reform period which was also
supported by the outcome of the study conducted by Mitra (1999). In fact, Total
Factor Productivity Growth has improved during 1985-1986 to 1992-1993 when
compared to the period during 1976-1977. On the contrary, Mukherjee and Ray
(2005) demonstrated, using the state level data on Indian manufacturing, that the
rankings of the different states in terms of the efficiency of the manufacturing sector
did not change dramatically before and after the liberalisation measures undertaken
in 1991. However, these findings were again contradicted by a study carried out by
Kumar (2006) which indicated that the total factor productivity started converging
across different regions after liberalisation. The study conducted by Ferrantino
(1992) in respect of the Indian manufacturing sector revealed that purchase of
technology had failed to bring any improvement in the efficiency of firms rather the
direction of the use of the technology had positive implication on the efficiency. In
a state level analysis Mitra et al. (2002) showed that availability of infrastructure
was one of the prime reasons of the variability of the productivity growth and
technical efficiency amongst the manufacturing industries across different states of
India. Similar findings were observed again by Mitra et al. (2011, 2012) on eight
Maji, Laha & Sur
51
core manufacturing industries for the period between 1994-2008 and suggesting that
the persistence of the lack of information, communication and technology and
infrastructure in India had affected the efficiency of the firms. In a similar vein,
Sharma and Sehgal (2010) observed improvement in the efficiency of the Indian
manufacturing sector during 1994-2006 and identified availability of infrastructure
to be the most significant variable affecting such efficiency. In an effort to
determine the efficiency of the Indian engineering industry, Golder and Kumari
(2003) noted that foreign engineering firms were more efficient than their domestic
counterparts. The study also suggested that the efficiency of the foreign and
domestic engineering firms operating in India would eventually converge. Similarly,
sugar manufacturing companies in India were found to be efficient (Dwivedi &
Ghosh, 2014).
In a very recent study in the context of Indian glass industry Kundi and Sharma
(2016) suggested that more or less all firms were found to be efficient but small size
foreign controlled, experienced firms were found to be comparatively more efficient
than the other firms, which is again contradictory to the findings of the study carried
out by Alvarez and Crespi (2003). Again in a different study Kundi and Sharma
(2016) found the large scale Cement companies especially foreign controlled ones
operating in India to be more efficient when compared to their small and medium
scale counterparts. In the context of Indian textile firms, the study conducted by
Bhandari and Maiti (2007) found that size, age and ownership of firms were the
major factors affecting the efficiency of those firms. Gambhir and Sharma (2015)
also obtained similar findings in case of the textile companies in India and in
addition to that they have also observed that export oriented Indian textile firms
were always better off. The underlying rationale may be that only the efficient firms
engage in foreign trade and in order to become export competitive, they have to run
their organisations more efficiently than other non-exporting firms (Van
Biesebroeck, 2005). In line with this argument, Bigsten et al. (2004) and Van
Biesebroeck (2005) observed that African and Sub-Saharan manufacturing firms
engaged in international exports were relatively more efficient.
In the context of manufacturing companies in the state of Haryana, India,
Sharma and Sehgal (2015) found a positive association between the levels of
productivity and profitability and emphasized on the role of innovation for the
optimum utilisation of resources. Hasan (2002) and Basu and Das (2015) suggested
that in medium and short run, use of technology is the most important determinant
of corporate profitability and efficiency in the Indian organized manufacturing

Colombo Business Journal 11(1), 2020
52
sector. Some of the other important factors identified by different research studies
were size of the firm, age of the firm, ownership structure, number of employees,
profitability, prevalence of competition, liberalisation, exports, labour cost, foreign
ownership, capitalisation, subsidies, management costs, education of the owners,
quality of human capital, , R & D, innovation, existence of crimes and political risk,
infrastructure, product diversification and international diversification, use of
technology, managerial efficiency, remuneration of the top management and
workers, market to book value ratio, financial leverage, early adoption of
technology, governance quality, government grants and assistance, rate of taxes,
foreign investment and training cost of employees (Baek & Neymotin, 2016;
Blomström, 1986; Biener et al., 2016; Castiglione & Infante, 2014; Chapelle &
Plane, 2005; Chuang & Lin, 1999; Diaz-Balteiro et al., 2006; Doaei et al., 2015;
Firth et al., 2015; Forlani, 2012; Giokas et al., 2015; Hanousek et al. ,2015; Ismail
& Sulaiman, 2007; Jain et al., 2015; Kumbhakar et al., 1991; O'Toole and Tarp,
2014; Piesse & Thirtle, 2000; Pitt & Lee, 1981; Thatcher & Oliver, 2001; Weill,
1992; Yu et al., 2012; Zhang et al, 2003; Zheng et al., 1998). Amongst all factors,
ownership (i.e. whether government or private, domestic or foreign firm) dictates
the efficiencies of firms to a great extent (Blomström, 1986; McConaughy et al.,
1998; Vining & Boardman, 1992). Other significant determinants of the efficiency
of manufacturing firms are good corporate governance, (Gill & Biger, 2013)
marketing facilities and infrastructure provided by the government (Cull et al.,
2017).
Efficiency analysis is of great importance to managers of corporate firms in
order to identify weaknesses and strengths associated with their firms that enable
them to adopt appropriate managerial decisions and strategies so as to achieve the
objective of the wealth maximisation and optimum utilisation of the available
resources (Kundi & Sharma, 2016). The efficient firms are expected to possess the
inherent capacity to cope up with the dynamic macroeconomic environment and
enjoy greater sustainability. Review of the existing literature suggests that there is
scant number of studies that have tried to explore the effect of both the
microeconomic and macroeconomic factors simultaneously on the firm level
efficiency of Indian manufacturing firms in a comprehensive manner.
In this backdrop, the present study has made a modest attempt to unearth the
level of efficiency of firms that belong to the various sub-sectors of the Indian
manufacturing industry. In addition to this specific objective, efforts have also been
made to evaluate the microeconomic as well as macroeconomic determinants of
such efficiency.

Maji, Laha & Sur
53
Data Sources and Methodology
Data Sources
For the purpose of analysing the determinants of the firm level efficiency of
Indian manufacturing firms, the firm level data for the period of study from 1999-
2000 to 2013-2014 were collected from the Capitaline Corporate Database
published by Capital Market Publishers Private Ltd. Mumbai, India2. Although the
time period of the study could have been extended to the current period, different
companies that belong to the Indian manufacturing industry had already adopted
Ind-AS and started reporting using the Ind-AS guidelines which were converged
with International Financial Reporting Standards from 2014-2015. Such an
extension of the period of study could have created a non-compatibility issue
between financial information produced as per erstwhile Accounting Standards
issued by the Accounting Standards Board of India and Ind-AS issued by the
Ministry of Corporate Affairs, Government of India. Therefore, it was thought to be
prudent to keep the period of study from 1999-2000 to 2013-2014. The
macroeconomic data relating to exchange rate and inflation for the same period
were taken from the Database on Indian Economy, RBI3.
Table 1: Data Sources and Period of the Variables Used in the Study
Variables Source Period
Raw Material Cost, Employee Cost,
Power and Fuel Cost, Gross block
of Asset, Value of Output,
Leverage, Age, Size, Growth,
Openness
Capitaline Corporate Database
published by Capital Market
Publishers Private Ltd. Mumbai,
India
1999-2000
to
2013-2014 Real Effective Exchange Rate
(REER), Wholesale Price Index
(WPI)
Database on Indian Economy,
Reserve Bank of India (RBI)
Methodology
Selection of Sample Firms
In the present study only the Indian manufacturing sector as per National
Industry Classification, 20084 was concentrated upon. Although the service sector is
growing rapidly, the remarkable contribution of the manufacturing sector to the
2 https://www.capitaline.com 3 https://dbie.rbi.org.in/DBIE/dbie.rbi?site=publications 4 http://mospi.nic.in/sites/default/files/6ec_dirEst/ec6_nic_2008_code.html

Colombo Business Journal 11(1), 2020
54
economic growth and employment generation cannot be undermined (Rajan, 2006)
since manufacturing is considered to be dominant in the industry sector. The other
prominent reason for the selection of the manufacturing industry is that, in the Index
of Industrial Production (IIP) calculation, manufacturing sectors retain the
maximum weight (75.53%) over mining (14.16%) and electricity (10.32%)
(Government of India, 2013). In order to perform the firm level analysis, the list of
the different sectors within the broad Indian manufacturing industry, Bombay Stock
Exchange (BSE) – Manufacturing index5 obtained from the official website of Asia
Index Private Limited6 was used. At first, BSE-Sectors were selected purposively;
Table 2: Sample Companies across Different Sectors in the Indian
Manufacturing Industry
BSE Sector BSE Industry
Group
BSE Industry Sub-
Group
Population
Sizea
Sample
Size
Basic Materials Steel Iron & Steel and
Intermediary
Products
108
(10.95%)
45
(11.17%)
Chemical Commodity and
Specialty Chemical
183
(18.56%)
80
(19.85%)
Consumer
Discretionary
Goods and
Services
Textiles, Apparels
and Accessories
Textile 280
(28.40%)
99
(24.57%)
Auto Components Auto Parts and
Equipment
101
(10.24%)
48
(11.91%)
Health Care Pharmaceuticals and
Biotechnology
Pharmaceuticals and
Biotechnology
165
(16.73%)
68
(16.87%)
Industrials Electrical
Equipment
Heavy and Other
Electrical
Equipment and
products
88
(8.92%)
38
(9.43%)
Fast Moving
Consumer Goods
Food Products Packaged and Other
Food Products
61
(6.19%)
25
(6.20%)
Total 986
(100%)
403
(100%)
Note: aThe population size is based on the list of the listed companies under different Industry Sub-
Group as of 09/02/2016 as downloaded from BSE website.
5 http://www.asiaindex.co.in/indices/equity/sp-bse-india-manufacturing-index# ;
https://us.spindices.com/documents/methodologies/methodology-sp-bse-thematic-indices.pdf 6 Asia Index Pvt. Ltd is a partnership between S&P Dow Jones Indices LLC and Bombay Stock
Exchange Ltd.
Maji, Laha & Sur
55
thereafter BSE-Industry group and sub-group were also chosen purposively from
the Bombay Stock Exchange (BSE) – Manufacturing index7 construction
methodology. Once the industry subgroups were selected, the lists of the firms from
different sub groups were collected from the official website8 of BSE, Mumbai,
India. Finally, random sampling technique was used to select the companies to
avoid any form of selection bias. Proportional sampling method was used in
selecting representative samples by making the selection proportionately from each
of the sub-groups. Inclusion criteria at the firm level were, the availability of the
firm-specific data for the period of 15 years from 1999-2000 to 2013-2014.
However, considering the number of the firms which were finally available as per
the inclusion criteria, the proportion of the sample in each of the industry sub-
groups could not be strictly maintained. Still, the spirit of the proportional sampling
method could be retained while determining the final number of the firms from each
industry sub-groups. A total number of 403 (40.87%) companies were finally
considered for the final analysis. Table 2 shows the selection process of the sample
companies and the sectoral indices for the purpose of the study.
Measurement of Efficiency and its Determinants
Technical efficiency can be measured by applying two distinct approaches:
Data Envelopment Analysis (DEA) as introduced by Charnes et al. (1978) and
Stochastic Frontier Analysis (SFA) as propounded by Aigner et al. (1977). DEA is a
non-parametric approach based on mathematical programming estimation, while
SFA is a parametric approach based on econometric estimation. Both the
approaches have advantages and limitations. One of the major advantages of DEA
is that it does not require any functional form specification of production function
(Hjalmarsson et al., 1996). However, this method suffers from the drawback that it
is deterministic in nature and assumes that deviation of firms from the efficient
frontier are only due to inefficiencies, which is a very restrictive assumption. On the
contrary, under SFA, stochastic noise term is considered which means that the
deviations of firms from the efficient frontier are not only attributed to inefficiencies
but also to stochastic noise (Din et al., 2007). In addition, the method also allows for
the statistical testing of hypotheses relating to the production function and degree of
inefficiency. It is also to be kept in mind a priori specification of the functional form
of production function is required to be made under SFA which can be considered
as a major drawback of this approach. Although two approaches are extensively
7 http://www.asiaindex.co.in/indices/equity/sp-bse-india-manufacturing-index# ;
https://us.spindices.com/documents/methodologies/methodology-sp-bse-thematic-indices.pdf 8 https://www.bseindia.com/corporates/List_Scrips.aspx?expandable=1
Colombo Business Journal 11(1), 2020
56
used in the existing literature, the application of any of these two is surely going to
depend upon various contextual factors (Banker et al., 1993). Din et al. (2007)
suggested that the application of DEA will be more suitable when the production
function follows the neo-classical theory and there is no measurement error whereas
if measurement error is a strong possibility, then SFA will surface itself to be a
better method. Without going into such a methodological debate, many researchers
have applied and compared DEA with SFA (Cullinane et al., 2006; Din et al., 2007;
Hossain et al., 2012; Nazarko & Chodakowska, 2017; Theodoridis & Psychoudakis,
2008).
For the purpose of this study, initially DEA approach was used in a panel data
framework. However, the outcome of the DEA failed to capture the variation in the
efficiency of firms across industries and time periods. Moreover, there was no
difference in the total factor productivity growth over time periods for the various
Indian manufacturing sub-sectors (Maji, 2019). The Malmquist Total Factor
Productivity Growth decomposition clearly showed almost no change in terms of
Malmquist Total Factor Productivity Change, Technological Change, Technical
Efficiency Change, Pure Technical Efficiency Change and the Scale Efficiency
Change. It precisely indicates the failure of the DEA approach to capture the inter-
firm and intra-firm variation in efficiency (Maji, 2019). Such inability of DEA
method to capture any variation of efficiency amongst the firms speaks about the
inherent limitations of the method especially in a panel data framework. However,
the analysis based on SFA performed well in capturing the variation in the
efficiency of firms under manufacturing sub-sectors over the period of study. It
shows that the SFA is more suitable in this case as compared to DEA and it also
confirms that the variation in efficiency in firms were not only due to inefficiencies
but also due to stochastic noise. Therefore, it was thought prudent to proceed with
SFA rather than DEA. Moreover, Hjalmarsson et al. (1996) argues that in a panel
data framework SFA offers better production function specification which conforms
to our empirical findings.
While attaining the objectives of the study, a two-stage approach was
considered. The first stage involves the estimation of a stochastic frontier
production function by Maximum Likelihood Estimation and the predicted values of
firm-level technical efficiency scores. Stochastic frontier production function and
the predicted firm-level technical efficiencies were estimated using the computer
program, Frontier Version 4.1 (Coelli, 1996). In the second stage these predicted
technical efficiency effects were regressed on firm-specific and macroeconomic

Maji, Laha & Sur
57
factors in order to determine factors influencing the efficiency. In the second stage
Panel Censored Tobit regression model was used to illuminate the determinants of
such efficiency. The detailed descriptions of the variables used in the study are
presented in Table 3.
Table 3: Descriptions of Variables
Variables Descriptions
Var
iab
les
use
d i
n t
he
pro
du
ctio
n fu
nct
ion
Inp
uts
Raw Material Cost (RMC) Natural logarithm of Raw Material
Employee Cost (EC) Natural logarithm of Employee Cost
Power and Fuel Cost (PFC) Natural logarithm of Power and Fuel
Cost
Gross block of Asset (GBA) Natural logarithm of Gross block of
Asset
Ou
tpu
t
Value of Output(O) Natural logarithm of Value of Output
Var
iab
les
use
d a
s th
e d
eter
min
ants
of
effi
cien
cy
Fir
m-S
pec
ific
Fac
tors
Leverage Debt/Equity
Age Natural logarithm of (current relevant
year – year of inception)
Size Natural logarithm of total assets of the
firm
Growth
[(Current year Net Sales – Previous
year Net Sales)/ Previous year Net
Sales]*100
Opennessa (Export + Import)/Total Sales
Mac
roec
ono
mic
Fac
tors
Exchange Rate Real Effective Exchange Rate
Inflation Whole Sale Price Index (WPI)b
Notes: aFrom Hitt et al. (1997) bWPI is the better measure of inflation in the industrial performance evaluation context when
compared with the Consumer Price Index (CPI). WPI reflects the level of price at which goods
and services are exchanged between firms within and between different industries (Mishra,
2013).
For the purpose of determining the technical efficiency of the manufacturing
firms, Stochastic Frontier Analysis (Coelli, 1996) was applied in the first stage

Colombo Business Journal 11(1), 2020
58
under the panel data framework. Specific stochastic frontier production function
model which was estimated is:
𝑙𝑛(𝑂𝑖𝑡) = 𝛽0 + 𝛽1 𝑙𝑛(𝐺𝐵𝐴𝑖𝑡) + 𝛽2(𝑅𝑀𝐶𝑖𝑡) + 𝛽3 (𝑃𝐹𝐶𝑖𝑡) + 𝛽4 (𝐸𝐶) + (𝑉𝑖𝑡 − 𝑈𝑖𝑡)
where V represents random error which is associated with random factors outside
the control of the firm, and U represents one sided inefficiency component.
Maximum Likelihood Estimates of the parameters of the model can be obtained
together with the variance parameters expressed as 𝜎2 = 𝜎𝑢2 + 𝜎𝑣
2 and 𝛾 =𝜎𝑢
2
𝜎𝑢2+𝜎𝑣
2.
The parameter 𝛾 has a value between zero and one, such that the value of zero is
associated with traditional response function. The model also estimates the value of
μ which is the inefficiency in the model and η representing the change of
inefficiency of firms over the time.
Technical efficiency of a firm at a given period of time is defined as the ratio of
the observed output to the frontier output which could be produced by a fully
efficient firm, in which the inefficiency effect is zero. Thus, technical efficiency is
defined as
𝐸𝑓𝑓𝑖𝑐𝑖𝑒𝑛𝑐𝑦𝑖 =𝑌𝑖
𝑓(𝑥; 𝛽)=
𝑓(𝑥; 𝛽)𝑒−𝑢𝑖
𝑓(𝑥; 𝛽)= 𝑒−𝑢𝑖
In order to assess the effect of different firm-specific and macroeconomic
factors on the technical efficiency Panel Censored Tobit Regression Model was
applied in the second stage. The motivation for using Panel Censored Tobit
Regression Model is that the value of the dependent variable, efficiency, varies
between 0 and 1, and other models are incompetent to account for the censored and
limiting value of the dependent variable. The econometric specification of the
empirical model used in the study is as follows.
𝐸𝑓𝑓𝑖𝑐𝑖𝑒𝑛𝑐𝑦𝑖𝑡 = 𝜆0 + 𝜆1(𝐿𝑒𝑣𝑒𝑟𝑎𝑔𝑒)𝑖𝑡 + 𝜆2(𝐺𝑟𝑜𝑤𝑡ℎ)𝑖𝑡 + 𝜆3(𝑆𝑖𝑧𝑒)𝑖𝑡 + 𝜆4(𝐴𝑔𝑒)𝑖𝑡
+ 𝜆5(𝑂𝑝𝑒𝑛𝑛𝑒𝑠𝑠)𝑖𝑡 + 𝜆6(𝐸𝑥𝑐ℎ𝑛𝑎𝑔𝑒 𝑅𝑎𝑡𝑒)𝑖𝑡 + 𝜆7(𝐼𝑛𝑓𝑙𝑎𝑡𝑖𝑜𝑛)𝑖𝑡
+ 𝜀𝑖𝑡
where 𝜆𝑖s are the parameters to be estimated, firm and time are denoted by 𝑖 and
𝑡 respectively, 𝑖 = 1,2, … … … … . 𝑁 and time 𝑡 = 1,2, . . . . 𝑇.
Maji, Laha & Sur
59
The expected signs for variables determining the sources of technical efficiency
are summarised in Table 4.
Table 4: Expected Sign of the Determinants in Technical Efficiency Model
Variables Parameter Expected sign
Leverage λ1 +
Growth λ2 +
Size λ3 +
Age λ4 +
Openness λ5 +/-
Exchange Rate λ6 +/-
Inflation λ7 +/-
Expected signs in Table 4 represent the underlying hypotheses (as formulated
from the insights of the existing literature). It is very important to examine whether
the results of the empirical estimation correspond with the expected sign of the
parameter or not, especially in the context of the different sectors of the
manufacturing industry. It is expected that the effects of the different variables on
the firm level technical efficiency are different across sectors due to their inherent
nature.
Results and Discussion
Estimation of Production Function
The coefficients of the estimated production function are presented in Table 5.
The analysis made in Table 5 shows that all the coefficients (β1 to β4) were positive
and also found to be statistically significant at 1% in many sectors in the
manufacturing industry. An exception was also noticed in respect of the sign of the
coefficient of gross block of assets in food product sub-sector. Positive and
statistically significant coefficients associated with the inputs of all the sectors
imply that the firms that belong to different sectors within the manufacturing
industry were able to utilise the available inputs such as raw material, labour, power
and fuel and assets effectively to generate the value of output. Negative value of the
coefficients of gross block of assets for Food product sector signifies that these
inputs were not used efficiently by the firms in this sector.

Colombo Business Journal 11(1), 2020
60
Table 5: Estimation of the Production Functions of Different
Manufacturing Sub-Sectors V
ari
ab
les
Au
to P
art
s a
nd
Eq
uip
men
t
Ch
emic
als
Ele
ctri
cal
Eq
uip
men
t
Fo
od
pro
du
cts
Ph
arm
ace
uti
cal
an
d
Bio
tech
no
logy
Ste
el
Tex
tile
Constant
(β0)
2.17**
(16.77)
0.16**
(3.211)
0.91*
(2.35)
3.35**
(3.48)
1.18**
(7.51)
3.49**
(9.66)
3.23**
(21.26)
GBA
(β1)
0.06**
(5.22)
0.42**
(18.54)
0.01
(1.47)
-0.93**
(-7.67)
0.60**
(19.13)
0.02
(0.41)
0.39**
(29.71)
RMC
(β2)
0.73**
(88.66)
0.34**
(26.89)
0.84**
(26.37)
0.06
(1.61)
0.02*
(2.12)
0.35**
(19.04)
0.22**
(25.42)
PFC
(β3)
0.04**
(4.57)
0.04**
(3.68)
0.00
(0.07)
0.98**
(12.77)
0.02*
(2.06)
0.32**
(12.70)
0.06**
(7.58)
EC
(β4)
0.13**
(14.30)
0.23**
(12.19)
0.09*
(2.26)
1.11**
(8.03)
0.37**
(11.26)
0.38**
(6.98)
0.29**
(21.60)
γ 0.75**
(44.71)
0.31**
(5.07)
0.83**
(27.51)
0.44**
(4.07)
0.84**
(13.03)
0.56**
(12.16)
0.53**
(20.77*)
𝜎2 0.02**
(10.26)
0.52**
(7.97)
2.58**
(6.03)
2.26**
(5.49)
1.40**
(2.47)
1.96**
(8.62)
0.51**
(13.85)
μ 0.25**
(8.42)
0.81**
(5.83)
-2.93**
(-4.57)
1.99**
(3.54)
0.43
(0.75)
2.10**
(5.37)
1.04**
(11.66)
η 0.00
(0.32)
0.01
(1.07)
-0.30**
(-6.74)
-0.02**
(-2.53)
-0.02**
(-6.49)
0.00
(0.10)
0.00
(0.08)
N 720 1200 494 375 1020 675 1485
Note: Values in parentheses indicate t-values, * and ** are significant at p < .05 and p <. 01 levels
respectively.
The variance parameter γ, which lies between zero and one, indicates the ratio
of the variation of firm-specific technical efficiency to the total value of output. The
value of γ reflects the distance to the efficient frontier, and thereby explains the
extent of inefficiency. A higher value of γ also shows that the majority of the error
was due to variation in inefficiency. The analysis made in Table 5 shows that the
range of γ values in different sectors varied between 0.314 and 0.841 and these
values were also found to be statistically significant at 1% level. It implies that the
variation in the error term among the firms was due to the difference in technical

Maji, Laha & Sur
61
efficiency which ranged between 31.4% (Chemicals sector) and 84.1%
(Pharmaceutical and Biotechnology sector). In other words, the variance of the
inefficiency effects was a significant component of the total error term variance and
thus, firms’ deviations from the optimal behaviour were not only due to random
factors.
σ2 represents the variation in efficiency among the firms. The range of estimated
values of σ2 in different sectors fluctuated between 0.0216 and 2.577 and all the
predicted values of σ2 were found to be statistically significant at 1% level. It
symbolises that a significant variation in the efficiency levels amongst the firms that
belong to the different sectors in the manufacturing industry was present during the
period of study.
μ is the measure of inefficiency in the model. Table 5 discloses that all the
values of μ for different sectors were found to be positive and significant except in
the case of Electrical Equipment sub-sector. Such positive and statistically
significant values of μ indicate the existing inefficiency amongst the firms operating
in the different sectors in the manufacturing industry. However, the value of μ in
case of the Electrical Equipment sub-sector was found to be negative and significant.
It implies that the firms that belong to the Electrical Equipment industry were
efficient in production. In fact, Electrical Equipment sub-sector was found to be the
most efficient sub-sector out of all the selected sub-sectors. It can also be verified
from the individual technical efficiency scores of the Electrical Equipment firms
during the period under study.
The estimated value of η represents the change in inefficiency among the firms
operating during the period under study. The values of η for sub-sectors Auto Parts
and Equipment, Chemicals, Steel, and Textile were positive but not found to be
statistically significant. It implies that the increase in the efficiency of these sub-
sectors were not at all noticeable during the study period. The values of η for the
remaining sectors were negative and found to be statistically significant. It indicates
that the inefficiency in the firms that belong to those sectors reduced significantly
during the study period. However, a similar kind of justification for the negative and
significant value of η in the Electrical Equipment sub-sector is not tenable since the
estimated value of μ in this sector was also negative and found to be statistically
significant. Such a negative value of η in the Electrical Equipment sector signifies
that the efficiency of the firms operating in this sector declined significantly during
the period of study. The estimated average technical efficiency score for all the
firms in the initial year under study was found to be 0.98 whereas the same in the

Colombo Business Journal 11(1), 2020
62
ultimate year of the study period was 0.72. This is also consistent with the estimated
average technical efficiency scores in all the Electrical Equipment firms during the
period of study.
Measurement of Efficiency
Table 6 presents the descriptive statistics [Mean, Standard Deviation (S.D.),
Coefficient of Variation (C.V.), Maximum, and Minimum] of efficiency estimates
in the different sub-sectors of the manufacturing industry. The mean efficiency was
the highest in Electrical Equipment sector (0.90) and it was followed by the sub-
sectors Auto Parts and Equipment (0.73), Pharmaceutical and Biotechnology (0.54),
Chemicals (0.44), Textile (0.35), Food products (0.22) and Steel (0.13) respectively.
Table 6: Descriptive Statistics of Efficiency Estimates
Sector Mean Rank S.D. C.V. Max Min
Auto Parts and Equipment 0.73 2 0.14 18.71 0.99 0.01
Chemicals 0.44 4 0.16 35.24 0.94 0.08
Electrical Equipment 0.90 1 0.08 9.18 0.98 0.44
Food products 0.22 6 0.21 95.97 0.76 0.05
Pharmaceutical and Biotechnology 0.54 3 0.18 32.57 0.92 0.13
Steel 0.13 7 0.16 129.22 0.84 0.02
Textile 0.35 5 0.16 434 0.93 0.16
The variation of efficiency was relatively low in the sub-sectors Electrical
Equipment, and Auto Parts and Equipment whereas the same was found to be much
higher in the sub-sectors Steel, Food products, Pharmaceutical and Biotechnology
and Construction and Engineering. It is observed that in the sub-sectors where the
estimated values of efficiency were more than 0.50, (such as Auto Parts and
Equipment, Pharmaceutical and Biotechnology and Electrical Equipment) the
corresponding predicted values of γ in the production function were also found to be
more than 0.50. On the other hand, in the Chemicals, Construction and Engineering,
and Food sub-sectors both observed efficiency scores and predicted γ values were
found to be less than 0.50. It again confirms that the variation in the error term
among the firms was due to the difference in technical efficiency.
Descriptive Statistics of the Firm-specific Factors:
Table 7 presents the descriptive statistics for all the variables in the different
sub-sectors of the manufacturing industry which reflect the underlying distinct
features of the sectors. It is seen that the average value of leverage as indicated by
the Debt/Equity Ratio was the highest in the Steel sub-sector (2.54) whereas it was

Maji, Laha & Sur
63
found to be the least in the Auto Parts and Equipment sub-sector (0.85). It is also
seen that Electrical Equipment, and Pharmaceutical and Biotechnology sub-sectors
maintained relatively low leverage whereas the financial risk associated with other
sub-sectors such as Cement, Chemicals, Textile and Food products were
comparatively higher. The high values of S.D. and C.V. of debt-equity ratio suggest
that there was wide variation among the companies operating within different sub-
sectors in terms of the leverage. Table 5 shows that as far as the growth of the firms
is concerned, the highest average rate of growth was achieved by Steel sub-sector
(56.24%). In the remaining sub-sectors, the rate of growth varied between 15.50%
and 24.24% and no wide difference between the rates of growth of the firms across
these sub-sectors was observed. However, it is to be noted that huge differences in
the rate of growth across the different firms that belong to the Steel sub-sector were
noticed. The ranges of the size and age of the firms across different sub-sectors
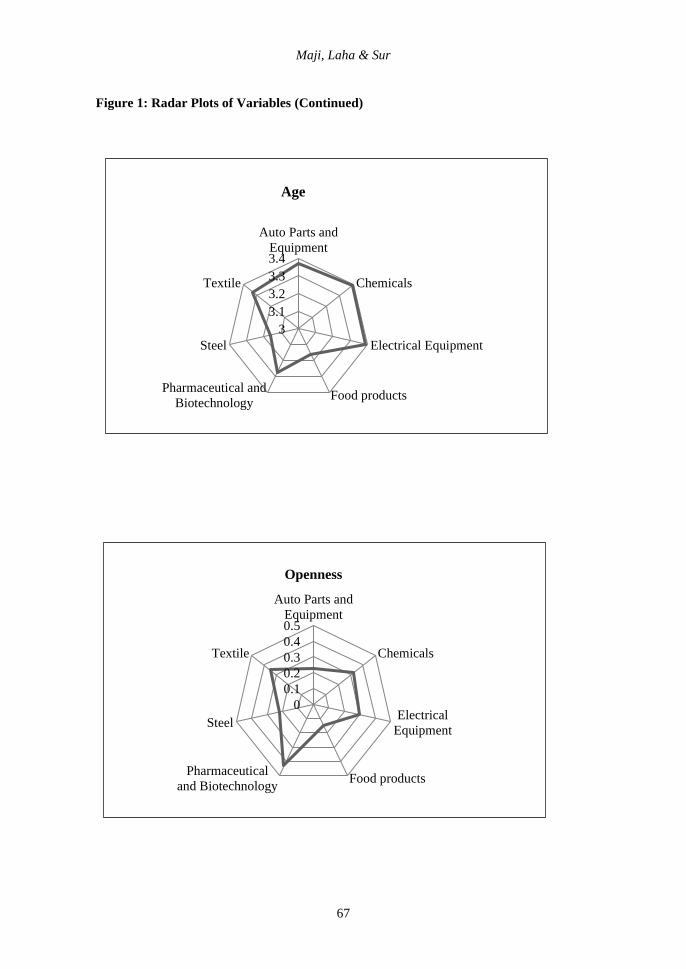
were found to be 4.75 to 6.40 and 3.16 to 3.54 respectively. Moreover, the
variations in respect of both size and age of the firms within and across the different
sub-sectors were observed to be low. The openness of the firms was observed to be
the highest (0.43) in case of the Pharmaceutical and Biotechnology sub-sector and
the lowest (0.15) in the Food products sub-sector. The values of C.V. in respect of
openness of all sub-sectors were found to be considerably higher indicating the
presence of significant variation of openness among the firms operating in the
different industries during the period of study.
Table 7: Descriptive Statistics of the Determinants of the Efficiency
Va
ria
ble
s
Sta
tist
ics
Au
to P
art
s a
nd
Eq
uip
men
t
Ch
emic
als
Ele
ctri
cal
Eq
uip
men
t
Fo
od
pro
du
cts
Ph
arm
ace
uti
cal
an
d
Bio
tech
no
logy
Ste
el
Tex
tile
Leverage Mean 0.85 1.63 1.01 1.26 0.77 2.54 2.17
SD 0.84 2.86 0.91 1.27 0.78 2.68 1.88
CV 98.74 175.81 90.48 100.79 101.44 105.25 86.32
Growth Mean 15.50 20.24 21.17 24.24 21.23 56.24 15.79
SD 6.55 28.37 14.61 40.69 18.56 195.38 24.57
CV 42.25 140.16 69.02 167.91 87.42 347.40 15.61
Size Mean 5.12 4.75 5.61 4.81 5.16 5.97 5.17
SD 1.50 1.46 1.82 1.66 1.77 2.23 1.46
CV 29.25 30.70 32.37 34.54 34.41 37.39 28.32
Age Mean 3.37 3.39 3.39 3.16 3.27 3.16 3.33

Colombo Business Journal 11(1), 2020
64
Va
ria
ble
s
Sta
tist
ics
Au
to P
art
s a
nd
Eq
uip
men
t
Ch
emic
als
Ele
ctri
cal
Eq
uip
men
t
Fo
od
pro
du
cts
Ph
arm
ace
uti
cal
an
d
Bio
tech
no
logy
Ste
el
Tex
tile
SD 0.62 0.44 0.53 0.52 0.50 0.55 0.53
CV 18.44 13.03 166 16.37 15.26 17.51 16.02
Openness Mean 0.23 0.32 0.30 0.15 0.43 0.22 0.35
SD 0.25 0.23 0.31 0.24 0.32 0.21 0.34
CV 106.99 71.80 103.66 168.19 74.58 95.76 96.67
Exchange
Rate
Mean 4.64 4.64 4.64 4.64 4.64 4.64 4.64
SD 0.05 0.05 0.05 0.05 0.05 0.05 0.05
CV 1.09 1.09 1.09 1.09 1.09 1.09 1.09
Inflation Mean 4.80 4.80 4.80 4.80 4.80 4.80 4.80
SD 0.27 0.27 0.27 0.27 0.27 0.27 0.27
CV 60 60 60 60 60 60 60
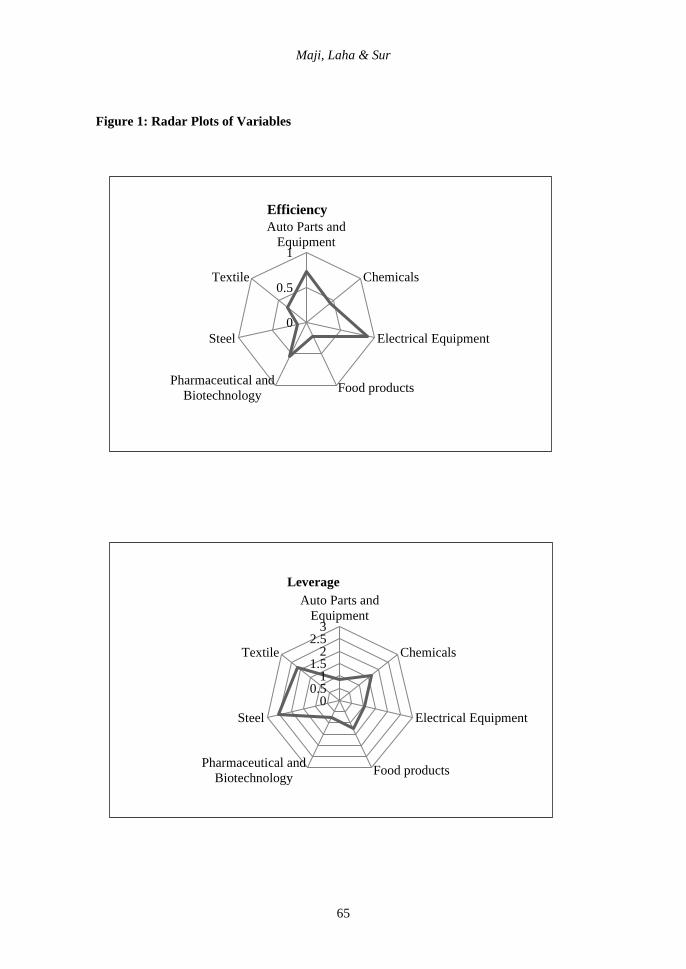
Industry wise variation can be better understood using radar plot in a snapshot
form. In Figure 1 the radar plots of efficiency and different independent
microeconomic variables with reference to the different sub-sectors within the
manufacturing industries are presented. Inter-sub-sector variations in the plot reflect
the underlying distinct features of the sectors.
In terms of the efficiency, Electric Equipment, and Auto Parts and Equipment
were observed to be the two most efficient sub-sectors while Steel sub-sector
registered the least efficiency during the period of study. In respect of efficiency a
notable degree of variation was observed among the different sub-sectors within the
manufacturing industry as indicated by the efficiency radar plot.
The average value of leverage as indicated by the Debt/Equity Ratio was the
highest in the Steel sub-sector (2.54) whereas the same was found to be the lowest
in the Pharmaceutical and Biotechnology sub-sector (0.77). It is also seen that Auto
Parts and Equipment, and Electric Equipment sub-sectors maintained a relatively
low leverage whereas the financial risk associated with other sub-sectors such as
Chemicals, Textile and Food products was observed to be comparatively greater.
Widely dispersed radar plot relating to Debt/Equity Ratio indicates that there was
wide variation among the companies operating in different sub-sectors in terms of
the leverage.
Maji, Laha & Sur
65
Figure 1: Radar Plots of Variables
0
0.5
1
Auto Parts and
Equipment
Chemicals
Electrical Equipment
Food productsPharmaceutical and
Biotechnology
Steel
Textile
Efficiency
00.5
11.5
22.5
3
Auto Parts and
Equipment
Chemicals
Electrical Equipment
Food productsPharmaceutical and
Biotechnology
Steel
Textile
Leverage

Colombo Business Journal 11(1), 2020
66
Figure 1: Radar Plots of Variables (Continued)
0
20
40
60
Auto Parts and
Equipment
Chemicals
Electrical
Equipment
Food productsPharmaceutical and
Biotechnology
Steel
Textile
Growth
0
2
4
6
Auto Parts and
Equipment
Chemicals
Electrical Equipment
Food productsPharmaceutical and
Biotechnology
Steel
Textile
Size
Maji, Laha & Sur
67
Figure 1: Radar Plots of Variables (Continued)
3
3.1
3.2
3.3
3.4
Auto Parts and
Equipment
Chemicals
Electrical Equipment
Food productsPharmaceutical and
Biotechnology
Steel
Textile
Age
0
0.1
0.2
0.3
0.4
0.5
Auto Parts and
Equipment
Chemicals
Electrical
Equipment
Food productsPharmaceutical
and Biotechnology
Steel
Textile
Openness

Colombo Business Journal 11(1), 2020
68
Determinants of Efficiency
The implications of firm specific and macroeconomic variables in determining
the level of technical efficiency in the different manufacturing sectors are presented
in Table 8. As far as the impact of financial leverage on efficiency is concerned, it is
argued that firms relying more on debt are expected to be more efficient because the
managers have to monitor the operating and functional activities cautiously
(Majumdar, 1997). Greater financial burden in the form of fixed interest payment
obligation induces greater discipline among the managers (Grossman & Hart, 1982;
Opler & Titman, 1993) and forces them to act for the benefit of investors (Jensen,
1986). It is observed from the analysis of the determinants of efficiency that the
coefficients associated with the Auto Parts and Equipment, Electrical Equipment
and Food products sub-sectors were negative and found to be statistically significant
which is contrary to the argument of Majumdar (1997). However, the negative
impact of the leverage on the efficiency of the firms is consistent with the ‘Agency
Theory’ which stipulates that the managers are often concerned with attaining the
personal objective as compared to firm objectives (Doaei et al., 2015; Ouattara,
2012). In an alternative way Majumdar (1997) also claimed that Indian firms take
their debt mostly from Public Sector Banks (PSBs) which generally fail to establish
themselves efficient and in many cases, the managers of these banks are not serious
enough about the productivity (greater job security in PSBs adds to that) and this
can give some intuitive explanation to the burgeoning non-performing assets
problem in Indian PSBs. The coefficients of leverage in the remaining sub-sectors
namely Chemicals, Pharmaceutical and Biotechnology, Steel and Textile were not
found to be statistically significant.
It is a widely accepted belief that engagement in the international trade, learning
by exporting and exposure to the foreign markets lead to greater efficiency (Bigstein
et al., 2004; Van Biesebroeck, 2005). Moreover, a relatively open firm enjoys
economies of scale owing to large customer base in different geographies, greater
innovation, enhanced bargaining power in the factor market, exploitation of market
imperfections, profitable use of the intangibles, resource endowment in different
geographies, organisational learning and risk mitigation by the way of geographical
diversification (Hitt et al., 1997; Lu & Beamish, 2004). A firm has to compete hard
in order to become successful in the international market as it has to face foreign
competition. The analysis made in Table 8 shows that relatively open firms that
belong to the Auto Parts and Equipment, Electrical Equipment, Food products,
Pharmaceutical and Biotechnology, and Textile sub-sectors were relatively more
efficient than the firms operating only in the domestic market which is consistent
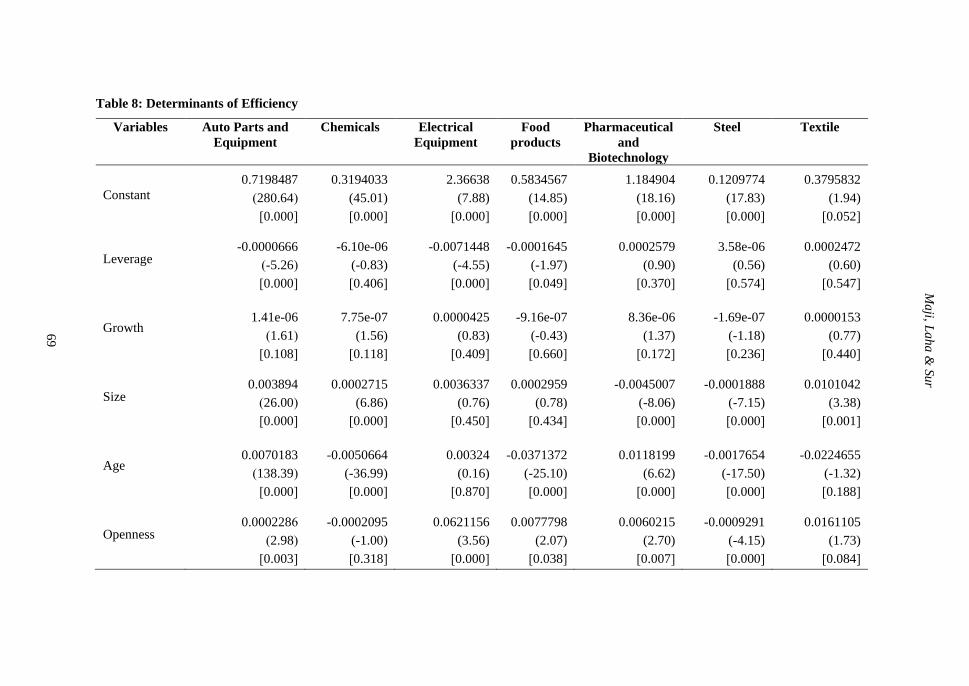
Table 8: Determinants of Efficiency
Variables Auto Parts and
Equipment
Chemicals Electrical
Equipment
Food
products
Pharmaceutical
and
Biotechnology
Steel Textile
Constant
0.7198487
(280.64)
[0.000]
0.3194033
(45.01)
[0.000]
2.36638
(7.88)
[0.000]
0.5834567
(14.85)
[0.000]
1.184904
(18.16)
[0.000]
0.1209774
(17.83)
[0.000]
0.3795832
(1.94)
[0.052]
Leverage -0.0000666
(-5.26)
[0.000]
-6.10e-06
(-0.83)
[0.406]
-0.0071448
(-4.55)
[0.000]
-0.0001645
(-1.97)
[0.049]
0.0002579
(0.90)
[0.370]
3.58e-06
(0.56)
[0.574]
0.0002472
(0.60)
[0.547]
Growth 1.41e-06
(1.61)
[0.108]
7.75e-07
(1.56)
[0.118]
0.0000425
(0.83)
[0.409]
-9.16e-07
(-0.43)
[0.660]
8.36e-06
(1.37)
[0.172]
-1.69e-07
(-1.18)
[0.236]
0.0000153
(0.77)
[0.440]
Size 0.003894
(26.00)
[0.000]
0.0002715
(6.86)
[0.000]
0.0036337
(0.76)
[0.450]
0.0002959
(0.78)
[0.434]
-0.0045007
(-8.06)
[0.000]
-0.0001888
(-7.15)
[0.000]
0.0101042
(3.38)
[0.001]
Age 0.0070183
(138.39)
[0.000]
-0.0050664
(-36.99)
[0.000]
0.00324
(0.16)
[0.870]
-0.0371372
(-25.10)
[0.000]
0.0118199
(6.62)
[0.000]
-0.0017654
(-17.50)
[0.000]
-0.0224655
(-1.32)
[0.188]
Openness 0.0002286
(2.98)
[0.003]
-0.0002095
(-1.00)
[0.318]
0.0621156
(3.56)
[0.000]
0.0077798
(2.07)
[0.038]
0.0060215
(2.70)
[0.007]
-0.0009291
(-4.15)
[0.000]
0.0161105
(1.73)
[0.084]
Ma
ji, La
ha
& S
ur
69

Colombo Business Journal 11(1), 2020
70
Variables Auto Parts and
Equipment
Chemicals Electrical
Equipment
Food
products
Pharmaceutical
and
Biotechnology
Steel Textile
Exchange
Rate
-0.0000918
(-0.14)
[0.887]
-0.0043301
(-2.44)
[0.015]
0.0492045
(0.65)
[0.517]
0.00648
(0.66)
[0.507]
0.0175812
(1.08)
[0.281]
-0.0008687
(-0.51)
[0.609]
-0.0015333
(-0.03)
[0.975]
Inflation -0.003643
(-2.83)
[0.005]
0.0367098
(105.70)
[0.000]
-0.3574884
(-149.0)
[0.000]
-0.0579176
(-27.48)
[0.000]
-0.1513798
(-45.10)
[0.000]
0.003845
(11.53)
[0.000]
-0.0017015
(-0.12)
[0.908]
Wald Chi
square 26318.74
[0.000]
25087.12
[0.000]
1010.29
[0.000]
6104.88
[0.000]
5663.13
[0.000]
562.10
[0.000]
18.11
[0.000]
Log-
likelihood 4156.9403 5355.7576 641.11793 1174.3794 2406.3661 3118.6574 1820.4024
N 720 1194 468 345 995 643 1452
Note: Values in parenthesis and square brackets indicate Z values and p values respectively
70
Co
lom
bo
Bu
siness Jo
urn
al 1
1(1
), 20
20

Maji, Laha & Sur
71
with the arguments of Doaei et al. (2015), Baliyan and Baliyan (2015), Gambir and
Sharma (2015) and Chang and Wang (2007). However, the coefficient associated
with the openness was negative and found to be statistically significant in the Steel
sub-sector9. The coefficient of exchange rate in this sector was also found to be
negative (although insignificant) which to some extent intuitively implies that the
importing firms in this sector were found to be relatively inefficient as compared to
their competitors. It is generally found that in a situation of devaluation of domestic
currency, the import cost and thereby the total cost enhance significantly and that
ultimately exerts notable negative effect on the efficiency of the firms.
It is generally argued that large size firms can have better financial performance
because of their ability of diversification, economies of scale, bargaining power,
easy access to cheaper financial resources and formalisation of procedure (Firth et
al., 2015; Halkos & Tzeremes, 2007; Kalaitzandonakes et al, 1992; Lundvall &
Battese, 2000; Majumdar, 1997; Pitt & Lee, 1981; Söderbom & Teal, 2004). The
analysis made in Table 8 reveals that the effect of firm size on the technical
efficiency was observed to be positive and statistically significant in case of the
firms that belong to the Auto Parts and Equipment, Chemicals, and Textile sub-
sectors. Bhandari and Maiti (2007) in their study also observed positive effect of the
size of the Textile firms on the technical efficiency during 2000-2001. Thus, it can
be concluded that larger firms that belong to these sub-sectors could exploit the
economies of scale along with other associated advantages, which is reflected in
higher efficiency of larger firms’ vis-à-vis smaller firms during the period of study.
However, the coefficients associated with the size of the firms operating in
Pharmaceutical and Biotechnology and Steel sub-sectors, were negative which were
found to be statistically significant. Theoretically, such a situation may arise on
account of market power concentration which generates market power inefficiencies
(X-inefficiency) and therefore, leads to inefficient performance (Leibenstein, 1976).
The idea of X-inefficiency suggests that, economies of scale can be enjoyed by
large firms in an industry provided that there are firms of varying sizes operating in
an industry. However, if in an industry most of the firms are of same size then
benefit of large size decays gradually which leads to inefficiency. In addition to that,
it is also argued that large size firms in the Indian manufacturing sector are very
much satisfied and contained with the prevailing situation and thus there is no
initiative in improving the efficiency or reducing the cost (Majumdar, 1997).
Moreover, size of the firm often determines the potentials of growth of the firm. The
9The average import expenditure of firms belonging to Steel Sector stepped up from Rs. 977.4 million in 1999-
2000 to Rs. 1,307.16 million during 2013-14.

Colombo Business Journal 11(1), 2020
72
coefficient associated with the growth of the firms in the Auto Parts and Equipment
sub-sector was positive and was also found to be statistically significant.
Interestingly, it was also noticed that similar kind of signs persists in case of the
coefficients of the firm size in this sub-sector. The relatively large firms in the Auto
Parts and Equipment sub-sector were adopting growth strategy and thus these two
factors complemented each other in augmenting the level of efficiency. The
coefficients of growth in all other sectors were not found to be statistically
significant.
In accordance with the ‘Learning Curve Effect’ proposition, the experienced
firms are better able to put the available resources to productive use (Harvie, 2004;
Pelham, 2000; Weston & Mansinghka, 1971). In addition to this the formalisation
of the procedure, with increasing age, also contributes positively in the level of
efficiency of the firms. Beaver (1966) also suggests that the probability of failure of
the old firms is generally lower as compared to that of the newer ones. The analysis
made in Table 8 shows that the coefficients of firm age were positive and found to
be statistically significant in the case of firms that belong to the Auto Parts and
Equipment and Pharmaceutical and Biotechnology sub-sectors which are consistent
with this theoretical conviction. However, age of the firm produced negative effect
in case of the Chemicals, Food products and Steel sub-sectors which signifies that
new firms in these sub-sectors outperformed the older ones in ensuring efficiency in
production. The underlying economic logic may be that newer firms enter into the
market with the new technology, innovative ideas, and flexibility in adapting the
dynamic business environment, and thus they are more efficient (Le & Harvie,
2010). In addition, it is also believed that older firms are likely to suffer from inertia
and thus fail to make adjustment with the changing business environment. As a
result, they gradually become inefficient (Marshall, 1920).
It is evident from the result of the study that the exchange rate was an
insignificant determinant of the efficiency of the firms in all other sub-sectors
except Chemicals. The coefficient of the exchange rate in case of the Chemicals
sub-sector was negative and found to be statistically significant which is consistent
with the sign associated with the coefficient of openness of firms in that sub-sector.
It implies that majority of the firms that belong to this sub-sector were dependent on
international trade for importing raw materials and thereby vulnerable to the
devaluation of the exchange rate. The analysis of the data of the Chemicals sub-
sector as a whole reveals that the average import expenditure for this sector has
increased from Rs. 269.01 million in 1999-2000 to Rs. 2,530.3 million in 2013-
2014. RBI statistics suggest that the Real Effective Exchange Rate stepped up from

Maji, Laha & Sur
73
Rs. 99.43 in 1999-2000 to Rs. 104.50 in 2013-2014. Similar kind of observation
was also revealed in the study made by Doaei et al. (2015) where the study
suggested that the exchange rate exerted significant negative impact on the technical
efficiency of the manufacturing firms in Malaysia. Moreover, Hitt et al. (1997)
suggested that the relationship between the international diversification as indicated
by openness and the financial performance is curvilinear in nature i.e. firm
performance improves initially, with international diversification but after some
period of time it will decline with further international diversification.
The study reveals that inflation in the economy had a significant negative
impact on the level of the efficiency of the firms operating in the Auto Parts and
Equipment, electrical equipment, Pharmaceutical and Biotechnology and Textile
sub-sectors. In an inflationary situation, the cost of the production goes up which
makes it difficult to ensure efficiency of the firms. As suggested by De Fina (1991),
the rate of growth of cash flow is lower than that of inflation and the revenue and
cost of the firm will take time to adjust. In simple words, the cost of input increases
on account of inflation but it takes more time to adjust output prices. Thus, it can be
said that the firms that belong to these sectors could not cope up with the cost push
inflationary situation, which may have restricted the firms to ensure optimum level
of efficiency. However, the firms that belong to the Chemicals and Steel sub-sectors
were found to be resilient and more disciplined in absorbing inflationary shock and
thereby performed efficiently even in inflationary situation.
Conclusion
In today’s challenging and intensely competitive environment, firms operating
in different sectors must operate efficiently to survive in the long run. The present
study attempted to shed some light on the technical efficiency of the firms that
belong to the different sectors in the Indian manufacturing industry by using
Stochastic Frontier Analysis. The study revealed that the firms that belong to the
Auto Parts and Equipment, Chemicals, Electrical equipment, Food products,
Pharmaceutical and Biotechnology, Steel and Textile sub-sectors could utilise the
available resources effectively to generate the value of output during the study
period. The study also indicated that there existed inefficiency among the firms
operating under different sub-sectors and, at the same time, variation of efficiency
among the firms that belong to different sub-sectors was present during the study
period.
The present study also made an effort to inquire into the determinants of the
efficiency of the firms in terms of the different firm-specific and macroeconomic

Colombo Business Journal 11(1), 2020
74
factors to identify the distinct underlying characteristics of the different sub-sectors
within the broad manufacturing industry. The study showed that firm-specific
factors did not affect equally the efficiency of the firms that belong to the different
sub-sectors. The efficiency of Auto Parts and Equipment sub-sector was primarily
driven by leverage, age, growth, size, openness and inflation. Similarly, size, age,
rate of exchange and inflation had significant effect on the efficiency of firms in the
Chemicals sub-sector. The efficiency in the Electrical equipment sub-sector was
mainly influenced by leverage, openness and inflation. On the other hand, the
efficiency of the Food product sector was affected by leverage, age, openness and
inflation. Moreover, the firm size and openness established themselves as the
important predictors for firm level technical efficiency in the Pharmaceutical and
Biotechnology, and Steel and Textile sub-sectors respectively. In addition to that,
firm age and inflation were also observed to be the major determinants of efficiency
for the firms that belong to the Steel and, Pharmaceutical and Biotechnology sub-
sectors.
Declaration of Conflict of Interest
The authors declared no potential conflict of interest with respect to the research,
authorship, and publication of this article.
References
Ahmed, M. S., & Ahmed, M. D. (2013). Efficiency variation of manufacturing
firms: A case study of seafood processing firms in Bangladesh. Review of
Economics and Finance, 3(2), 45–56.
Aigner, D., Lovell, C. A. K., & Schmidt, P. (1977). Formulation and estimation of
stochastic frontier production function models. Journal of Econometrics, 6(1),
21–37. https://doi.org/10.1016/0304-4076(77)90052-5
Alvarez, R., & Crespi, G. (2003). Determinants of technical efficiency in small
firms. Small Business Economics, 20(3), 233–244. https://doi.org/10.1023/
A:1022804419183
Baek, H. Y., & Neymotin, F. (2016). International involvement and production
efficiency among startup firms. Global Economic Review, 45(1), 42–62.
https://doi.org/10.1080/1226508X.2015.1084240
Baliyan, S. K., & Baliyan, K. (2015). Determinants of firm-level performance: A
study of Indian manufacturing and service sectors. Indian Journal of Economics
and Development, 11(3), 701–713. https://doi.org/10.5958/2322-0430.2015.
00078.5

Maji, Laha & Sur
75
Banker, R.D., Gadh, V.M., & Gorr, W.L. (1993). A Monte Carlo comparison of two
production frontier estimation methods: Corrected ordinary least squares and
data envelopment analysis. European Journal of Operational Research 67(3),
332–343. https://doi.org/10.1016/0377-2217(93)90289-Y
Basu, D., & Das, D. (2015). Profitability in India’s Organized Manufacturing
Sector: The Role of Technology, Distribution, and Demand (Working Paper, No.
2015-04). University of Massachusetts, Department of Economics, Amherst,
MA.). https://www.econstor.eu/bitstream/10419/145413/1/821606948.pdf
Beaver, W. H. (1966). Financial ratios as predictors of failure. Journal of
Accounting Research, 4, 71-111. https://www.jstor.org/stable/2490171
Bhandari, A. K., & Maiti, P. (2007). Efficiency of Indian manufacturing firms:
Textile industry as a case study. International Journal of Business and
Economics, 6(1), 71–88.
Bhavani, T. A. (1991). Technical efficiency in Indian modern small scale sector: An
application of frontier production function. Indian Economic Review, 26(2),
149–166.
Biener, C., Eling, M., & Wirfs, J. H. (2016). The determinants of efficiency and
productivity in the Swiss insurance industry. European Journal of Operational
Research, 248(2), 703–714. https://doi.org/10.1016/j.ejor.2015.07.055
Bigsten, A., Collier, P., Dercon, S., Fafchamps, M., Gauthier, B., Willem Gunning,
J., Oduro, A., Oostendorp, R., Pattillo, C., Söderbom, M., Teal, F., & Zeufack,
A. (2004). Do African manufacturing firms learn from exporting? Journal of
Development Studies, 40(3), 115–141. https://doi.org/10.1080/0022038042
000213229
Blomström, M. (1986). Foreign investment and productive efficiency: The case of
Mexico. The Journal of Industrial Economics, 35(1), 97–110.
https://www.jstor.org/stable/2098609
Burki, A. A., & Terrell, D. (1998). Measuring production efficiency of small firms
in Pakistan. World Development, 26(1), 155–169. https://doi.org/10.1016/
S0305-750X(97)00122-8
Castiglione, C., & Infante, D. (2014). ICTs and time-span in technical efficiency
gains. A stochastic frontier approach over a panel of Italian manufacturing firms.
Economic Modelling, 41, 55–65. https://doi.org/10.1016/j.econmod.2014.04.
021
Chang, S. C., & Wang, C. F. (2007). The effect of product diversification strategies
on the relationship between international diversification and firm
performance. Journal of World Business, 42(1), 61–79. https://doi.org/10.1016/
j.jwb.2006.11.002

Colombo Business Journal 11(1), 2020
76
Chapelle, K., & Plane, P. (2005). Technical efficiency measurement within the
manufacturing sector in Côte d'Ivoire: A stochastic frontier approach. Journal of
Development Studies, 41(7), 1303–1324. https://doi.org/10.1080/002203805001
70964
Charnes, A., Cooper, W. W., & Rhodes, E. (1978). Measuring the efficiency of
decision making units. European Journal of Operational Research, 2(6), 429–
444. https://doi.org/10.1016/0377-2217(78)90138-8
Chuang, Y. C., & Lin, C. M. (1999). Foreign direct investment, R&D and spillover
efficiency: Evidence from Taiwan's manufacturing firms. The Journal of
Development Studies, 35(4), 117-137. https://doi.org/10.1080/002203899084
22583
Coelli, T. J. (1996). A guide to FRONTIER version 4.1: A computer program for
stochastic frontier production and cost function estimation (CEPA Working
paper number 96/07). http://iranarze.ir/wp-content/uploads/2017/07/7209-
English-IranArze.pdf
Cull, R., Xu, L. C., Yang, X., Zhou, L. A., & Zhu, T. (2017). Market facilitation by
local government and firm efficiency: Evidence from China. Journal of
Corporate Finance, 42, 460-480. https://doi.org/10.1016/j.jcorpfin.2015.06.002
Cullinane, K., Wang, T. F., Song, D. W., & Ji, P. (2006). The technical efficiency of
container ports: Comparing data envelopment analysis and stochastic frontier
analysis. Transportation Research Part A: Policy and Practice, 40(4), 354–374.
https://doi.org/10.1016/j.tra.2005.07.003
De Fina, R. H. (1991, Nov). Does inflation depress the stock market. Business
Review, 3–12. Federal Reserve Bank of Philadelphia.
Diaz-Balteiro, L., Herruzo, A. C., Martinez, M., & Gonzalez-Pachon, J. (2006). An
analysis of productive efficiency and innovation activity using DEA: An
application to Spain's wood-based industry. Forest Policy and Economics, 8(7),
762–773. https://doi.org/10.1016/j.forpol.2005.06.004
Din, M. U., Ghani, E., & Mahmood, T. (2007). Technical efficiency of Pakistan's
manufacturing sector: A stochastic frontier and data envelopment analysis. The
Pakistan Development Review, 46(1), 1–18.
Doaei, M., Anuar, M. A., & Ismail, Z. (2015). Corporate diversification and
efficiency of manufacturing firms listed in Bursa Malaysia. Iranian Journal of
Management Studies, 8(4), 523–543. https://doi.org/10.22059/IJMS.2015.55000
Driffield, N. L., & Kambhampati, U. S. (2003). Trade liberalization and the
efficiency of firms in Indian manufacturing. Review of Development
Economics, 7(3), 419–430. https://doi.org/10.1111/1467-9361.00200
Dwivedi, A. K., & Ghosh, P. (2014). Efficiency measurement of Indian sugar
manufacturing firms: A DEA approach (CREED Working Paper No.
Maji, Laha & Sur
77
CREED/2014/01). http://library.ediindia.ac.in:8181/xmlui/bitstream/ handle/
123456789/1834/Efficiency%20Measurement%20of%20Indian%20Sugar%20
Manufacturing%20Firms%20A%20DEA%20Approach.pdf?sequence=1&isAll
owed=y.
Felipe, J., Mehta, A., & Rhee, C. (2018). Manufacturing matters…but it’s the jobs
that count. Cambridge Journal of Economics, 43(1), 139–168. https://doi.org/
10.1093/cje/bex086
Ferrantino, M. J. (1992). Technology expenditures, factor intensity, and efficiency
in Indian manufacturing. The Review of Economics and Statistics, 74(4), 689–
700. https://www.jstor.org/stable/2109383
Firth, M., Leung, T. Y., Rui, O. M., & Na, C. (2015). Relative pay and its effects on
firm efficiency in a transitional economy. Journal of Economic Behavior &
Organization, 110, 59–77. https://doi.org/10.1016/j.jebo.2014.12.001.
Forlani, E. (2012). Competition in services and efficiency of manufacturing firms:
Does 'Liberalization' Matter? (LICOS Discussion Paper No. 311). http://dx.doi.
org/10.2139/ssrn.2084612
Gambhir, D., & Sharma, S. (2015). Productivity in Indian manufacturing: Evidence
from the textile industry. Journal of Economic and Administrative
Sciences, 31(2), 71–85. https://doi.org/10.1108/JEAS-09-2014-0021
Gill, A. S., & Biger, N. (2013). The impact of corporate governance on working
capital management efficiency of American manufacturing firms. Managerial
Finance, 39(2), 116–132. https://doi.org/10.1108/03074351311293981
Giokas, D., Eriotis, N., & Dokas, I. (2015). Efficiency and productivity of the food
and beverage listed firms in the pre-recession and recessionary periods in
Greece. Applied Economics, 47(19), 1927–1941. https://doi.org/10.1080/0003
6846.2014.1002886
Golder, B., & Kumari, A. (2003). Import liberalisation and productivity growth in
Indian manufacturing in the 1990s. Developing Economies, 41(4), 436–460.
https://doi.org/10.1111/j.1746-1049.2003.tb01010.x
Government of India (2013). Economic survey 2012-13. https://www.indiabudget.
gov.in/budget2013-2014/survey.asp
Grossman, S. J., & Hart, O. D. (1982). Corporate financial structure and
managerial incentives (NBER Working Paper No. R0398). https://ssrn.com/
abstract=578641
Halkos, G. E., & Tzeremes, N. G. (2007). Productivity efficiency and firm size: An
empirical analysis of foreign owned companies. International Business
Review, 16(6), 713–731. https://doi.org/10.1016/j.ibusrev.2007.06.002
Hall, B. H., Lotti, F., & Mairesse, J. (2009). Innovation and productivity in SMEs:
Empirical evidence for Italy. Small Business Economics, 33(1), 13–33.
https://doi.org/10.1007/s11187-009-9184-8
Colombo Business Journal 11(1), 2020
78
Hanousek, J., Kočenda, E., & Shamshur, A. (2015). Corporate efficiency in
Europe. Journal of Corporate Finance, 32, 24–40. https://doi.org/10.1016/
j.jcorpfin.2015.03.003
Haraguchi, N., Cheng, C. F. C., & Smeets, E. (2017). The importance of
manufacturing in economic development: Has this changed? World
Development, 93, 293–315. https://doi.org/10.1016/j.worlddev.2016.12.013
Harvie, C. (2004). East Asian SME capacity building, competitiveness and market
opportunities in a global economy (Department of Economics, University of
Wollongong Working Paper 04-16. http://citeseerx.ist.psu.edu/viewdoc/down
load?doi=10.1.1.666.272&rep=rep1&type=pdf
Hasan, R. (2002). The impact of imported and domestic technologies on the
productivity of firms: Panel data evidence from Indian manufacturing firms.
Journal of Development Economics, 69(1), 23–49. https://doi.org/10.1016/
S0304-3878(02)00051-2
Hill, H., & Kalirajan, K. P. (1993). Small enterprise and firm-level technical
efficiency in the Indonesian garment industry. Applied Economics, 25(9), 1137–
1144. https://doi.org/10.1080/00036849300000174
Hitt, M. A., Hoskisson, R. E., & Kim, H. (1997). International diversification:
Effects on innovation and firm performance in product-diversified firms.
Academy of Management Journal, 40(4), 767–798. https://doi.org/10.5465/
256948
Hjalmarsson, L., Kumbhakar, S. C., & Heshmati, A. (1996). DEA, DFA and SFA:
A comparison. Journal of Productivity Analysis, 7(2-3), 303–327. https://doi.
org/10.1007/BF00157046
Hossain, M. K., Kamil, A. A., Baten, M. A., & Mustafa, A. (2012). Stochastic
frontier approach and data envelopment analysis to total factor productivity and
efficiency measurement of Bangladeshi rice. Plos one, 7(10), 1–9. https://doi.
org/10.1371/journal.pone.0046081
Ismail, R., & Sulaiman, N. (2007). Technical efficiency in Malay manufacturing
firms. International Journal of Business and Society, 8(2), 47–62.
Jain, N. K., Kundu, S. K., & Newburry, W. (2015). Efficiency seeking emerging
market firms: Resources and location choices. Thunderbird International
Business Review, 57(1), 33–50. https://doi.org/10.1002/tie.21670
Jensen, M. C. (1986). Agency costs of free cash flow, corporate finance, and
takeovers. The American Economic Review, 76(2), 323–329.
Kalaitzandonakes, N. G., Wu, S., & Ma, J. C. (1992). The relationship between
technical efficiency and firm size revisited. Canadian Journal of Agricultural
Economics/Revue Canadienne d'agroeconomie, 40(3), 427–442. https://doi.org/
10.1111/j.1744-7976.1992.tb03705.x
Maji, Laha & Sur
79
Kaldor, N. (1967). Strategic factors in economic development. Cornell University.
Kambhampati, U. S., & Parikh, A. (2005). Has Liberalization affected profit
margins in Indian Industry? Bulletin of Economic Research, 57(3), 273-304.
https://doi.org/10.1111/j.0307-3378.2005.00224.x
Kathuria, V., Raj, S. R., & Sen, K. (2012). The effects of economic reforms on
manufacturing dualism: Evidence from India. Journal of Comparative
Economics, 41(4), 1240–1262. https://doi.org/10.1016/j.jce.2012.10.003
Kochhar, K., Kumar, U., Rajan, R., Subramanian, A., & Tokatlidis, I. (2006).
India's pattern of development: What happened, what follows? Journal of
Monetary Economics, 53(5), 981–1019. https://doi.org/10.1016/j.jmoneco.
2006.05.007
Kumar, S. (2006). A decomposition of total productivity growth. International
Journal of Productivity and Performance Management, 55(3-4), 311–331.
https://doi.org/10.1108/17410400610653255
Kumbhakar, S. C., Ghosh, S., & McGuckin, J. T. (1991). A generalized production
frontier approach for estimating determinants of inefficiency in US dairy farms.
Journal of Business & Economic Statistics, 9(3), 279–286. https://www.
jstor.org/stable/1391292
Kundi, M., & Sharma, S. (2016). Efficiency of glass firms in India: An application
of data envelopment analysis. Journal of Advances in Management
Research, 13(1), 59–74. https://doi.org/10.1108/JAMR-03-2015-0019
Le, V., & Harvie, C. (2010). Firm performance in Vietnam: Evidence from
manufacturing small and medium enterprises. (University of Wollongong,
Faculty of Business - Economics Working Paper No. 4-10).
https://ro.uow.edu.au/cgi/viewcontent.cgi?article=1223&context=commwkpape
rs
Leibenstein, H. (1976). Beyond economic man. Harvard University Press.
Lu, J. W., & Beamish, P. W. (2004). International diversification and firm
performance: The S-curve hypothesis. Academy of Management Journal, 47(4),
598–609. https://doi.org/10.5465/20159604
Lundvall, K., & Battese, G. E. (2000). Firm size, age and efficiency: Evidence from
Kenyan manufacturing firms. The Journal of Development Studies, 36(3), 146–
163. https://doi.org/10.1080/00220380008422632
Madheswaran, S., Liao, H., & Rath, B. N. (2007). Productivity growth of Indian
manufacturing sector: Panel estimation of stochastic production frontier and
technical inefficiency. The Journal of Developing Areas, 40(2), 35–50.
https://doi.org/10.1353/jda.2007.0018
Maji, S.K. (2019). Effect of macroeconomic fundamentals on the financial
performance of select companies in Indian manufacturing sector during the

Colombo Business Journal 11(1), 2020
80
post-liberalization era: An empirical quest (Doctoral thesis, The University of
Burdwan, West Bengal. India.).
Majumdar, S. K. (1997). The impact of size and age on firm-level performance:
Some evidence from India. Review of Industrial Organization, 12(2), 231–
241 .https://doi.org/10.1023/A:1007766324749
Majumdar, S. K., & Bhattacharjee, A. (2010). The profitability dynamics of Indian
firms. https://doi.org/10.5465/ambpp.2010.54501095
Marshall, A. (1920). Industry and trade. McMaster University Archive for the
History of Economic Thought. https://socialsciences.mcmaster.ca/~econ/ugcm/
3ll3/marshall/Industry&Trade.pdf
McConaughy, D. L., Walker, M. C., Henderson, G. V., & Mishra, C. S. (1998).
Founding family controlled firms: Efficiency and value. Review of Financial
Economics, 7(1), 1–19. https://doi.org/10.1016/S1058-3300(99)80142-6
Mitra, A. (1999). Total factor productivity growth and technical efficiency in Indian
industries. Economic and Political Weekly, 34(31), M98–M105.
Mitra, A., Sharma, C., & Veganzones, M. A. (2011). Total factor productivity and
technical efficiency of Indian manufacturing: The role of infrastructure and
information & communication technology. https://www.researchgate.net/profile/
Marie_Ange_Veganzones/publication/228433873_Total_Factor_Productivity_a
nd_Technical_Efficiency_of_Indian_Manufacturing_The_Role_of_Infrastructu
re_and_Information_Communication_Technology/links/02bfe50d1fc204595f00
0000.pdf
Mitra, A., Sharma, C., & Véganzonès-Varoudakis, M. A. (2012). Estimating impact
of infrastructure on productivity and efficiency of Indian manufacturing.
Applied Economics Letters, 19(8), 779–783. https://doi.org/10.1080/13504851.
2011.603687
Mitra, A., Varoudakis, A., & Veganzones-Varoudakis, M. A. (2002). Productivity
and technical efficiency in Indian states’ manufacturing: the role of
infrastructure. Economic Development and Cultural Change, 50(2), 395–426.
http://dx.doi.org/10.1086/321916
Mukherjee, K., & Ray, S. C. (2005). Technical efficiency and its dynamics in Indian
manufacturing: An inter-state analysis. Indian Economic Review, 101–125.
Nazarko, J., & Chodakowska, E. (2017). Labour efficiency in construction industry
in Europe based on frontier methods: Data envelopment analysis and stochastic
frontier analysis. Journal of Civil Engineering and Management, 23(6), 787–
795. https://doi.org/10.3846/13923730.2017.1321577
Neogi, C., & Ghosh, B. (1994). Intertemporal efficiency variations in Indian
manufacturing industries. Journal of Productivity Analysis, 5(3), 301–324.
https://doi.org/10.1007/BF01073913

Maji, Laha & Sur
81
Opler, T., & Titman, S. (1993). The determinants of leveraged buyout activity: Free
cash flow vs. financial distress costs. The Journal of Finance, 48(5), 1985–1999.
https://doi.org/10.1111/j.1540-6261.1993.tb05138.x
O'Toole, C. M., & Tarp, F. (2014). Corruption and the efficiency of capital
investment in developing countries. Journal of International Development,
26(5), 567–597. https://doi.org/10.1002/jid.2997
Ouattara, W. (2010). Economic efficiency analysis in Coted’Ivoire. Journal of
Development and Agricultural Economics, 2(9), 316–325. https://doi.org/
10.5923/j.economics.20120201.05
Pattnayak, S. S., & Thangavelu, S. M. (2005). Economic reform and productivity
growth in Indian manufacturing industries: An interaction of technical change
and scale economies. Economic Modelling, 22(4), 601–615. https://doi.org/
10.1016/j.econmod.2004.09.005
Pelham, A. M. (2000). Market orientation and other potential influences on
performance in small and medium-sized manufacturing firms. Journal of Small
Business Management, 38(1), 48–67.
Piesse, J., & Thirtle, C. (2000). A stochastic frontier approach to firm level
efficiency, technological change, and productivity during the early transition in
Hungary. Journal of Comparative Economics, 28(3), 473–501. https://doi.org/
10.1006/jcec.2000.1672
Pitt, M. M., & Lee, L.-F. (1981). The measurement and sources of technical
inefficiency in the Indonesian weaving industry. Journal of Development
Economics, 9(1), 43–64. https://doi.org/10.1016/0304-3878(81)90004-3
Rajan, R. G. (2006). India: The past and its future. Asian Development Review,23(2),
36–52.
Sharma, C., & Sehgal, S. (2010). Impact of infrastructure on output, productivity
and efficiency: Evidence from the Indian manufacturing industry. Indian
Growth and Development Review, 3(2), 100–121. https://doi.org/10.1108/
17538251011084446
Sharma, S. K., & Sehgal, S. (2015). Productivity, innovations and profitability of
manufacturing industries in India: A regional study of Haryana State.
International Journal of Business Excellence, 8(6), 700–723. https://doi.org/
10.1504/IJBEX.2015.072306
Söderbom, M., & Teal, F. (2004). Size and efficiency in African manufacturing
firms: Evidence from firm-level panel data. Journal of Development Economics,
73(1), 369–394. https://doi.org/10.1016/j.jdeveco.2003.02.005
Sufian, F. (2009). Determinants of bank efficiency during unstable macroeconomic
environment: Empirical evidence from Malaysia. Research in International
Business and Finance, 23(1), 54–77. https://doi.org/10.1016/j.ribaf.2008.07.002

Colombo Business Journal 11(1), 2020
82
Thatcher, M. E., & Oliver, J. R. (2001). The impact of technology investments on a
firm’s production efficiency, product quality, and productivity. Journal of
Management Information Systems, 18(2), 17–45. https://doi.org/10.1080/
07421222.2001.11045685
Theodoridis, A. M., & Psychoudakis, A. (2008). Efficiency measurement in Greek
dairy farms: Stochastic frontier vs. data envelopment analysis. International
Journal of Economic Sciences and Applied Research, 1(2), 53–67.
Van Biesebroeck, J. (2005). Exporting raises productivity in sub-Saharan African
manufacturing firms. Journal of International Economics, 67(2), 373–391.
https://doi.org/10.1016/j.jinteco.2004.12.002
Vining, A. R., & Boardman, A. E. (1992). Ownership versus competition:
Efficiency in public enterprise. Public Choice, 73(2), 205–239. https://doi.org/
10.1007/BF00145092
Weill, P. (1992). The relationship between investment in information technology
and firm performance: A study of the valve manufacturing sector. Information
Systems Research, 3(4), 307–333.https://doi.org/10.1287/isre.3.4.307
Weston, J. F., & Mansinghka, S. K. (1971). Tests of the efficiency performance of
conglomerate firms. The Journal of Finance, 26(4), 919–936. https://doi.org/
10.1111/j.1540-6261.1971.tb00928.x
Yang, C.-H., & Chen, K.-H. (2009). Are small firms less efficient? Small Business
Economics, 32(4), 375–395. https://doi.org/10.1007/s11187-007-9082-x
Yang, J.-C. (2006). The efficiency of SMEs in the global market: Measuring the
Korean performance. Journal of Policy Modelling, 28(8), 861–876. https://doi.
org/10.1016/j.jpolmod.2006.07.004
Yu, Y. S., Barros, A., Yeh, M. L., Lu, M. J., & Tsai, C. H. (2012). A study of
estimating the technical efficiency of optoelectronic firms: An application of
data envelopment analysis and tobit analysis. International Journal of Academic
Research in Business and Social Sciences, 2(7), 192–202.
Zheng, J., Liu, X., & Bigsten, A. (1998). Ownership structure and determinants of
technical efficiency: An application of data envelopment analysis to Chinese
enterprises (1986–1990). Journal of Comparative Economics, 26(3), 465–484.
https://doi.org/10.1006/jcec.1998.1540
Zhang, A., Zhang, Y., & Zhao, R. (2003). A study of the R&D efficiency and
productivity of Chinese firms. Journal of Comparative Economics, 31(3), 444-
464. https://doi.org/10.1016/S0147-5967(03)00055-6