determinants of foreign direct investment in transition economies…571280/... · 2012-11-22 ·...
TRANSCRIPT
Determinants of Foreign Direct Investment
in Transition Economies: a case study of
Kazakhstan and Uzbekistan
Khayroollo Sattarov
Spring 2012
Master Thesis, 15 ECTS
Master’s Program in Economics, 120 ECTS

Acknowledgements
I would like to express my sincerest gratitude to my supervisor Jurate Jaraite, for her valuable
comments and guidance throughout my thesis.

i
Abstract
Foreign direct investment (FDI) is one of the main sources of capital inflows and driving
factors of economic growth in many countries. Particularly, developing countries, emerging
economies and countries in transition have come increasingly to see FDI as an important
factor of their economic development. This paper investigates the determinants of FDI in two
Central Asian countries: Kazakhstan and Uzbekistan. The paper uses the data sets from 1996
to 2010 and applies two different econometric methodologies, an ordinary least squares (OLS)
and seemingly unrelated regressions (SUR) methodologies to analyze the factors that
influence FDI inflows in selected countries. The chosen empirical models are based on FDI
theories and previous empirical studies on this subject. Due to availability of data, the paper
mainly focuses on location-specific factors to investigate FDI determinants. The results
indicate that market size, economic stability and reliability are significant factors for FDI
inflows in both, Kazakhstan and Uzbekistan. Additionally to those factors, trade openness
found to be crucial factor for FDI inflows in Uzbekistan.

ii
Table of Contents
1. Introduction………………………………………………………………….1
2. FDI inflows in Central Asia…………………………………………………3
3. Theories of FDI………………………………………………………………5
3.1. Monopolistic Advantage Theory...............................................................…...5
3.2. Product Life-Cycle Theory......................................................................….....6
3.3. Internalization Theory...............................................................................…...6
3.4. Eclectic (OLI Paradigm) Theory...............................................................…...7
4. Empirical Literature Review…..……………………………………………9
5. Empirical Methodology…………....……………………………………….11
5.1. Specification of the Variables and Data Collection.................................…...11
5.2. Empirical Model………………...…...……………………………………....12
5.3. Empirical Limitations...............................................................................…...14
6. Empirical Results…………………………………….……………………..15
7. Summary and Conclusion………………………………………………….20
References……….……….…………………………………………………22
Appendix A.............................................................................................…...26
Appendix B.............................................................................................…...28

1
1. Introduction
It is widely accepted that foreign direct investment (FDI) is one of the main sources of capital
inflow and driving factors of economic growth in many countries. FDI helps to improve trade,
creates employment opportunities, aids in transfer of technology and knowledge in the host
countries. Therefore, developing countries, emerging economies and countries in transition
have come increasingly to see FDI as a key factor of modernization and economic
development (OECD, 2002).
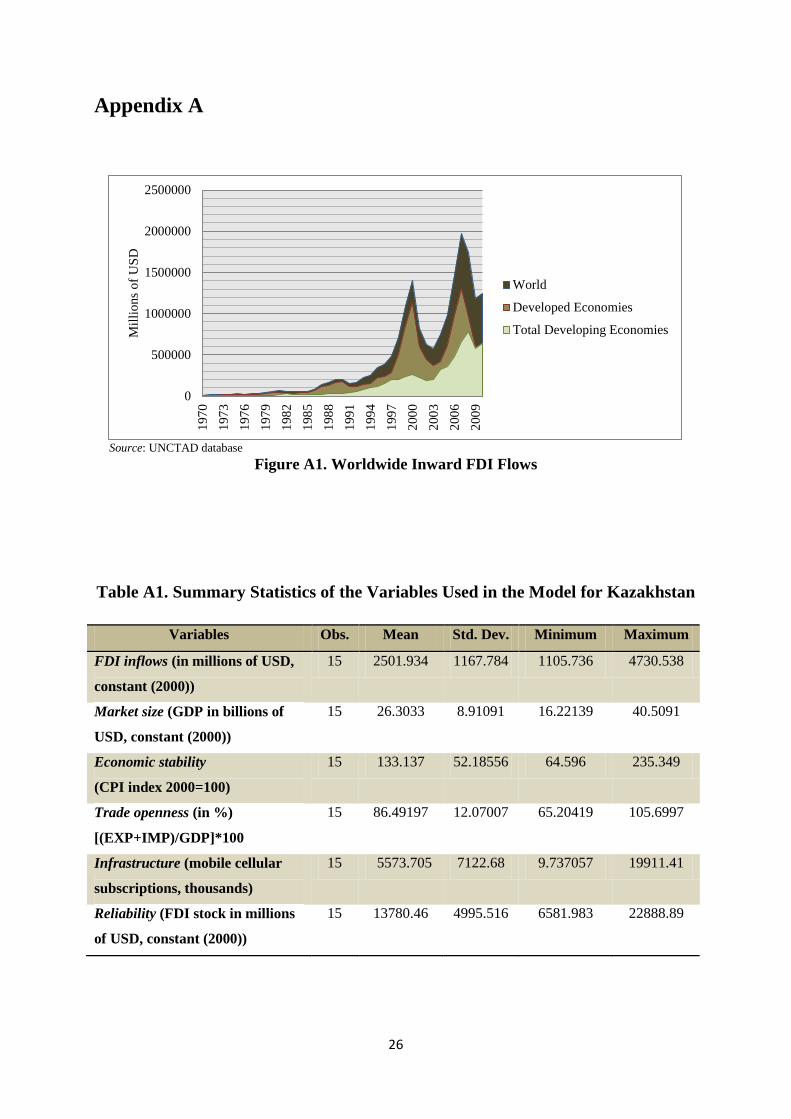
Since the late 1980s, global flows of FDI have been increasing significantly. For many past
decades the main fractions of FDI flows have gone to developed economies. However, during
the recent years the share of FDI flows which has been going to developing and transition
economies has increased (Johnson, 2006). In 2010, developing and transition economies
absorbed more than half of global FDI flows for the first time (UNCTAD, 2011) (see Figure
A1 in the Appendix A).
Multinational enterprises (MNEs) are often concerned to be the primary influencers of the
globalization process. They integrate production processes across national boundaries by
transferring capital and technology (Frawsen, Josefsson, 2004). MNEs expand their activities
to different foreign economies for a number of reasons such as exploitation of economies of
scale, the use of specific advantage or just because their competitors are engaged in similar
activities. On the other hand, different economies are also engaged in a policy competition by
altering their major economic policies such as corporate taxes, labor market conditions,
subsides, tariff boundaries and privatization policies in order to improve their economic
conditions for attracting foreign investment (Demirhan, Masca, 2008). However, attracting
and promoting FDI is a complex process. In general, most developing countries in the world
are competing for similar types of FDI. However, some of these countries, mainly due to the
size of their economies, have more natural advantages or other factors which enable them to
attract more FDI (UN, 2003).
The objective of this study is to investigate the main determinants of FDI inflows in Central
Asia’s two transition economies, namely, Kazakhstan and Uzbekistan (my home country) for
the period of 1996 to 2010. The choice of these countries is mainly based on their location
and economy size, which are briefly discussed in the next section.

2
The reminder of the paper is organized as follows: Section 2 presents a brief discussion of
FDI inflows in Central Asia. Section 3 introduces to the relevant theory. In Section 4, the
review of the relevant empirical literature is provided. Further, Section 5 describes a chosen
empirical methodology. Section 6 presents and discusses the empirical results. The final
Section concludes.

3
2. FDI inflows in Central Asia
Most of the countries of the former Soviet Union including the countries in Central Asia went
through very important reforms in their economic systems after the collapse of the Soviet
Union. These reforms involved some major restructuring of their economies, for which large
amounts of financing were needed (Dhakal, Mixon, Upadhyaya, 2007). Thus, in the 1990s,
FDI attraction sharply increased among the transition countries along with the integration of
these countries with the global economy. As a result, transition countries altered their
economic policies by reducing the barriers to investment and trade (Zeqiri et al., 2011).
The Central Asian countries possess some of the largest energy supplies in the world, which
represent a powerful basis for economic growth. On the other hand, Central Asia has
increasingly become the recipient of FDI from OECD countries, as well as Russia and China
(OECD, 2011), which serves as an additional power for their economic development.
In two decades of independence, the Central Asian countries have seen a massive infusion of
FDI. According to the OSCE (Organization for Security and Cooperation in Europe), FDI
inflows into Central Asia between 2005 and 2009 increased from $3 billion to $19 billion
(Sholk, 2011). However, FDI inflows are very unequally distributed among the Central Asian
countries, as it can be seen in Figure 1.
Source: UNCTAD database
Figure 1. Average annual FDI inflows into five Central Asian countries (1996-2010)
The largest receiver of FDI is Kazakhstan, the largest economy in Central Asia. Kazakhstan is
more than twice as large as the four other Central Asian countries put together. On the other
hand, Uzbekistan is most populous and one of the most rapidly expanding economies in this
region. Uzbekistan is the second largest economy after Kazakhstan in this region. However,
4714.811
106.351 102.182
674.501
269.656
0
500
1000
1500
2000
2500
3000
3500
4000
4500
5000
Kazakhstan Kyrgyzstan Tajikistan Turkmenistan Uzbekistan
Mil
lio
ns
of
US
D
4
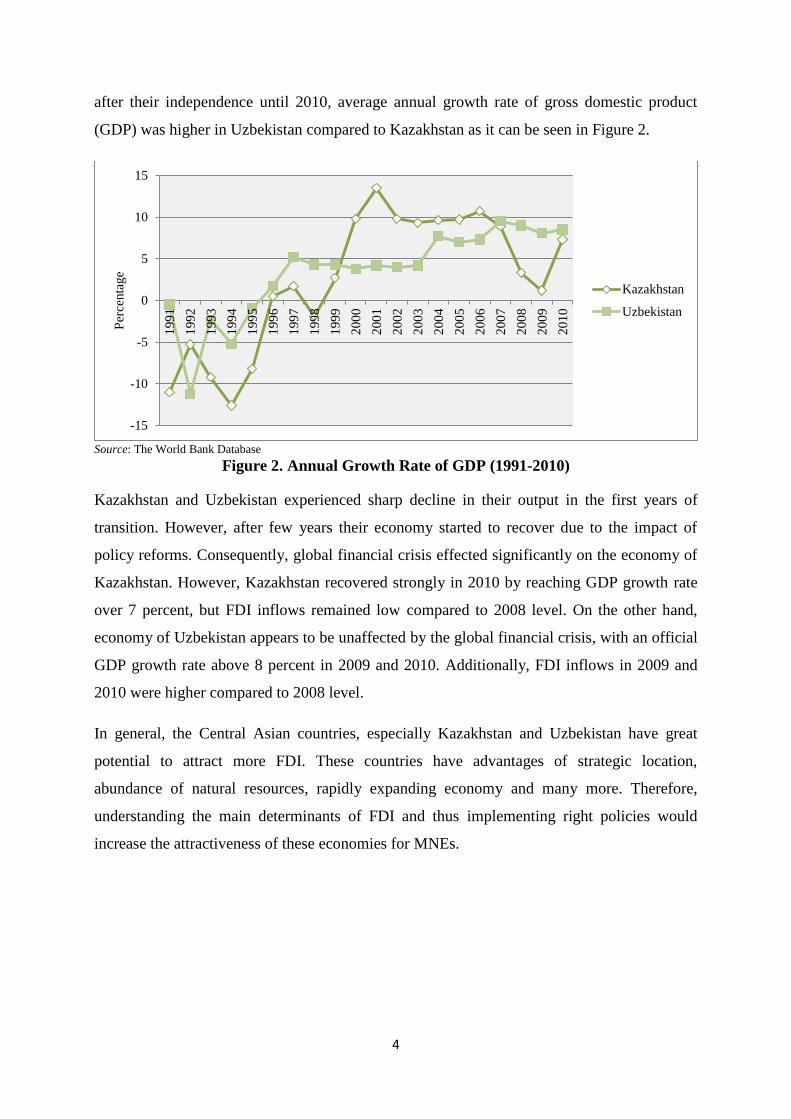
after their independence until 2010, average annual growth rate of gross domestic product
(GDP) was higher in Uzbekistan compared to Kazakhstan as it can be seen in Figure 2.
Source: The World Bank Database
Figure 2. Annual Growth Rate of GDP (1991-2010)
Kazakhstan and Uzbekistan experienced sharp decline in their output in the first years of
transition. However, after few years their economy started to recover due to the impact of
policy reforms. Consequently, global financial crisis effected significantly on the economy of
Kazakhstan. However, Kazakhstan recovered strongly in 2010 by reaching GDP growth rate
over 7 percent, but FDI inflows remained low compared to 2008 level. On the other hand,
economy of Uzbekistan appears to be unaffected by the global financial crisis, with an official
GDP growth rate above 8 percent in 2009 and 2010. Additionally, FDI inflows in 2009 and
2010 were higher compared to 2008 level.
In general, the Central Asian countries, especially Kazakhstan and Uzbekistan have great
potential to attract more FDI. These countries have advantages of strategic location,
abundance of natural resources, rapidly expanding economy and many more. Therefore,
understanding the main determinants of FDI and thus implementing right policies would
increase the attractiveness of these economies for MNEs.
-15
-10
-5
0
5
10
151
99
1
199
2
199
3
199
4
199
5
199
6
199
7
199
8
199
9
200
0
200
1
200
2
200
3
200
4
200
5
200
6
200
7
200
8
200
9
201
0
Per
centa
ge
Kazakhstan
Uzbekistan

5
3. Theories of FDI
This section provides with the discussion of several theories which are commonly accepted to
be the main theories of FDI. The empirical part of my thesis closely relies on some of these
theories.
3.1. Monopolistic Advantage Theory
The monopolistic advantage theory was first introduced by Stephen H. Hymer in 1960. This
theory suggests that the MNEs have monopolistic advantages which enable them to operate
more profitably than locally competing firms. Hymer (1960) found that FDI takes place
because MNEs choose markets or industries in which they possess higher competitive
advantages, such as technological knowledge, which are not available to other operating firms
in a certain country. Firm-specific (also ownership-specific) advantages are also referred as
these competitive advantages (Shenkar, 2007).
According to this theory, superior knowledge and economies of scale are two main factors for
monopolistic advantages. Superior knowledge refers to managerial skills, production
technologies, knowledge of products and industrial organization, which are the driving forces
of creating unique product differentiation for MNEs in a host country. Further, the second
factor for the monopolistic advantage, which is economies of scale, occurs through either
horizontal or vertical FDI. Horizontal FDI occurs when MNEs begin the same production
activities in different countries. On the other hand, MNEs may profit from local advantages in
production costs through vertical investment in which each affiliate produces those parts of
the final product for which local production costs are lower.
By using Hymer’s work as a basis, Kindleberger (1969) also argued that FDI do not occur in
perfectly competitive markets. He claimed that in a world of perfect competition for factors
and goods, FDI cannot exist as in such conditions local firms would have advantage over
foreign firms in the proximity of their operations to their decision making centers. Therefore,
it would be hard to survive for foreign firms under these circumstances. Hence, there must be
some imperfection in markets for factors and goods for FDI to prosper (Barclay, 2000).

6
3.2. Product Life-Cycle Theory
The product life-cycle theory was first developed by Raymond Vernon in 1966, to explain
certain types of FDI made by US MNEs in the manufacturing industry in Western Europe
after the Second World War. Vernon identified three stages in his theory: the new product
stage, the maturing product stage and the product standardization stage.
In the new product stage, production occurs at home country and the prices are inelastic due
to the high demand (Severn, 2007). Thus, companies create new innovative products for
domestic consumption and to serve the foreign markets they export the surplus (Denisia,
2010).
In the maturing product stage, production cost becomes the main factor of production because
of the entrance of new firms into the domestic markets. Hence, overseas investment will
become more beneficial. Thus, to achieve economies of scale and decrease production costs,
firms are induced to invest and produce in other advanced countries (Zhu, 2008).
In the standardization stage, the production becomes completely standardized and firms
compete with prices but not with product differentiation. Therefore, in this stage developing
countries may receive high proportion of FDI and become most competitive destinations for
production due to lower labor costs (Frawsen, Josefsson, 2004).
Since the differences among many countries have been disappearing, and the geographical
reach of most enterprises has been increasing, Vernon (1979) has noted that some of the
starting assumptions of his original theory are clearly in question. Nevertheless, he has argued
that his product life-cycle theory may still be applied to smaller firms, which have not created
yet an international network of foreign manufacturing subsidiaries (Baronchelli, Cassia,
2008).
3.3. Internalization Theory
The theory of internalization was developed by Buckley and Casson in 1976, based on the
pioneering study of Ronald Coase (1937), who developed transaction cost theory of the firm.
Transaction cost theory of Coase (1937) is one of the first theoretically attempts to define a
firm to the market.
Internalization theory explains that the available external market cannot provide efficient
conditions in which a firm can benefit by exploiting its technology or production resources.

7
Hence, the firm tends to produce an internal market through investment in multiple countries
and thus develops the required market to attain its objectives (Shenkar, 2007).
Buckley and Casson (1976) have mentioned that in certain markets such as markets for
knowledge, there is an especially strong incentive to internalize. The authors consider
knowledge as a public good within a company as so it can be utilize at no extra cost in several
corporate divisions. Additionally, it is not difficult to transfer it from country to country
(Assuncao, Forte, Teixeira, 2011).
3.4. Eclectic (OLI Paradigm) Theory
The eclectic theory was introduced by John H. Dunning in 1981. It presents a general
framework for explaining international production. It cover the mainstream theories such as
the factor endowment theory of Heckscher (1919) and Ohlin (1933), the monopolistic
advantage theory of Hymer (1960), the transaction cost theory of Coase (1937), the
internalization theory of Buckley and Casson (1976) and location advantage ideas of
Dunning. The eclectic theory provides broad explanation of MNEs’ motives for FDI and
different internationalization movements, such as location selection, market preference and so
on. Thus, this theory is considered as the representative of classical theories to explain
internationalization activities of MNEs (Zhu, 2008).
The eclectic theory consists of three sets of interdependent variables: ownership-specific
advantages, location-specific advantages and internalization advantages. Therefore, it is also
called OLI paradigm.
Ownership-specific advantages (also firm-specific advantages) refer to intangible assets, such
as technology, information, brand name, managerial skills and so on. These assets are
exclusive possessions and can be transferred within a MNE at low cost.
Location-specific advantages (also country-specific advantages) refer to location-bound
endowments which are offered by host countries to investing companies. They also refer to
market structure, political stability, cultural endowments and several other factors that
increase competitive advantage of a host country (Baibekova, Hoang, 2010). Thus, location-
specific advantages of host countries are very important factors for MNEs’ investment
decisions.

8
Internalization advantages refer to abilities of MNEs to efficiently internalize their ownership
specific advantages to decrease the cost of transaction during the international production
(Zhu, 2008). These characteristics of OLI paradigm offer a framework for assessing
alternative methods in which companies may arrange the exploitation of their main
competencies, given the locational attractions of various regions and countries (Dunning,
2000).
Further, Dunning (1994), distinguishes four types of foreign investments, considering their
various strategic objectives: market-seeking FDI, efficiency-seeking FDI, natural-resource-
seeking FDI and strategic-assets-seeking FDI.
Market-seeking foreign investors focus on servicing the markets of host countries. On the
other hand, efficiency-seeking foreign investors are concentrated on low-cost production
factors, because the production mainly exported to home country of FDI and other target
markets. Further, natural-resource-seeking foreign investments are focused on extracting or
refining natural resources of host countries. And finally, strategic-asset-seeking investments
are focused on acquiring resources and capabilities that an investing company believes will
sustain or advance its core competencies in regional or global markets (Reiljan et al., 2001).
In general, the OLI theory provides a more comprehensive explanation of FDI than other
mainstream theories such as the monopolistic advantage theory, the product life-cycle theory
or the internalization theory. To provide the logic and benefits of international production the
theory combines ownership-specific, location-specific and internalization factors. Despite the
difference of the modern MNE behavior and international business environment from what
they were in several decades ago, the eclectic theory is still able to explain the patterns of FDI
(Shenkar, 2007).
Since OLI paradigm is the most recent and covers all the mainstream theories of FDI, the
empirical part of the paper mainly relies on this theory. Particularly, the location-specific
advantages of this theory are mainly used to choose and arrange the variables for the
empirical analysis (which are particularly discussed in Section 5).

9
4. Empirical Literature Review
There have been numerous empirical studies on determinants of FDI for various countries.
However, in this section, I mainly focus on the empirical studies related to developing and
transition economies.
Campos and Kinoshita (2003) investigated the determinants of FDI inflows into 25 transition
economies by using panel data for the period 1990-1998. Their findings suggest that the main
determinants of FDI in transition are institutions, agglomeration and trade openness. Further,
Johnson (2006) analyzed the FDI determinants in transition economies by separating the
chosen countries into two groups: CEE (Central and Eastern Europe) and CIS
(Commonwealth of Independent States). The CEE group consists with higher GDP per capita
countries compared to the CIS group. Author suggested that FDI flows to the CEE are mainly
driven by a market-seeking motive. And on the other hand, flows of FDI to the CIS
economies are mainly caused by a resource-seeking factor. Moreover, Azizov (2007) studied
the determinant of FDI in transition economies (CIS countries) for the period of 1992 to 2005.
His findings suggest that natural resource, market size and inflation rate are important factors
for FDI inflows.
Akhtar (2000) investigated the determinants of FDI in Pakistan through multivariate
regression analysis. His findings suggest that market size, exchange rates and relative interest
rates are one of the main important factors for FDI inflows in Pakistan. Further, Sahoo (2006)
examined the determinants of FDI in five South Asian countries, namely, India, Pakistan,
Bangladesh, Sri Lanka and Nepal. He used panel co-integration estimation and found that
market size, labor force growth, infrastructure index and trade openness to be the main
determinants of FDI. Further, Singhania and Gupta (2011) examined the determinants of FDI
in India for the period of 1991 to 2008. They used autoregressive integrated moving average
(ARIMA) econometric methodology and found that GDP, inflation rate and FDI policy
changes during years 1995-1997 have had a significant effect on FDI inflows in India.
Asiedu (2006) investigated the determinants of FDI in 22 countries in Sub-Saharan Africa
(SSA) by using panel data for the period of 1984 to 2000. Her findings suggest that natural
resource endowments, large local markets, low inflation and good infrastructure are important
factors for FDI. Moreover, author suggested that political instability and corruption are
detrimental factors for foreign investors. She argued that small countries and countries

10
without abundance of natural resources can attract FDI by improving their institutions and
policy environment.
Cleeve (2008) used cross-sectional time series data on 16 SSA countries. He found that large
market size, good infrastructural development, high skills level and labor costs are significant
determinants of FDI inflows. Author also emphasized that political and macroeconomic
stability, property rights protection and other investment-supporting regulations are important
factors for attracting FDI in SSA countries. Further, Indopu and Talla (2010) studied the
determinants of FDI by using cross-sectional data for 41 African countries for the period
2002-2007. Their findings suggest that market size and natural resources are the main
determinants of FDI in selected countries.
Demirhan and Masca (2008) investigated the determinant of FDI in 38 developing countries
using cross-sectional data for the period 2000-2004. Their findings suggest that GDP per
capita, degree of openness, inflation and tax rates are important factors for FDI inflows.
In summary, previous empirical studies on determinant of FDI focused on developing and
transition economies obtained different results which are tend to depend on studied countries
and time periods. However, the factors, such as natural resources, market size and economic
stability (in terms of inflation) are generally suggested to be one of the main determinants of
FDI inflows in developing and transition economies.
11
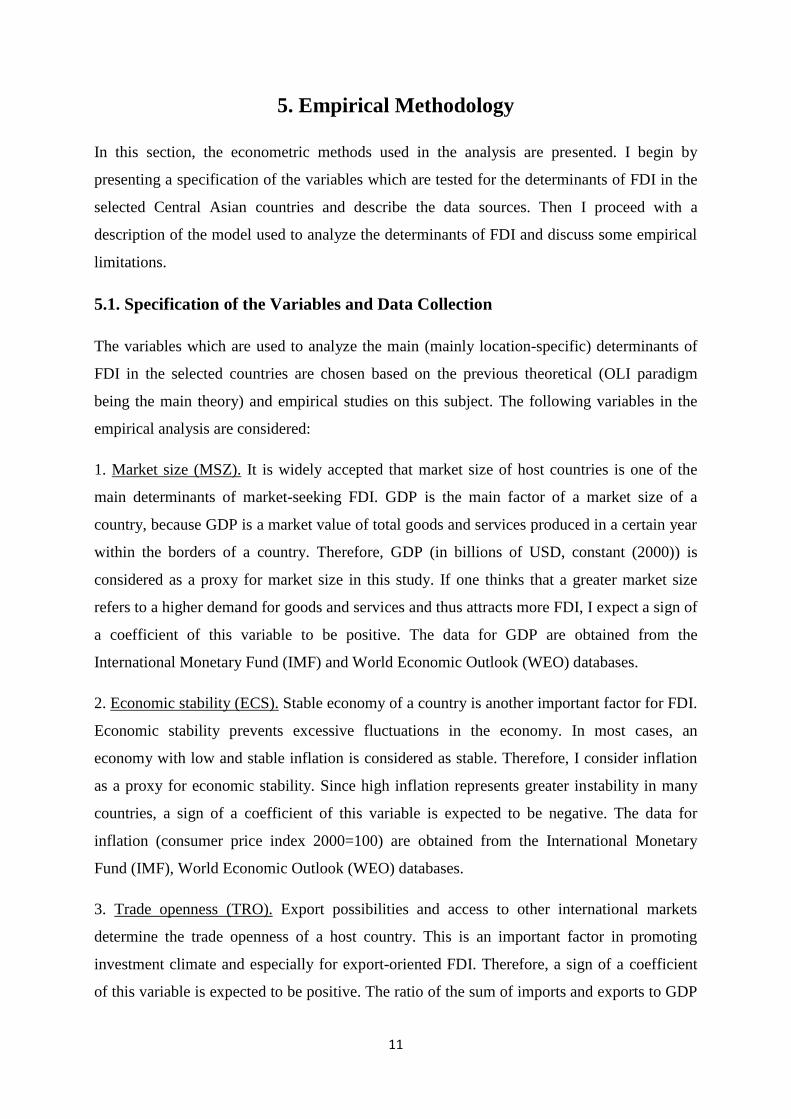
5. Empirical Methodology
In this section, the econometric methods used in the analysis are presented. I begin by
presenting a specification of the variables which are tested for the determinants of FDI in the
selected Central Asian countries and describe the data sources. Then I proceed with a
description of the model used to analyze the determinants of FDI and discuss some empirical
limitations.
5.1. Specification of the Variables and Data Collection
The variables which are used to analyze the main (mainly location-specific) determinants of
FDI in the selected countries are chosen based on the previous theoretical (OLI paradigm
being the main theory) and empirical studies on this subject. The following variables in the
empirical analysis are considered:
1. Market size (MSZ). It is widely accepted that market size of host countries is one of the
main determinants of market-seeking FDI. GDP is the main factor of a market size of a
country, because GDP is a market value of total goods and services produced in a certain year
within the borders of a country. Therefore, GDP (in billions of USD, constant (2000)) is
considered as a proxy for market size in this study. If one thinks that a greater market size
refers to a higher demand for goods and services and thus attracts more FDI, I expect a sign of
a coefficient of this variable to be positive. The data for GDP are obtained from the
International Monetary Fund (IMF) and World Economic Outlook (WEO) databases.
2. Economic stability (ECS). Stable economy of a country is another important factor for FDI.
Economic stability prevents excessive fluctuations in the economy. In most cases, an
economy with low and stable inflation is considered as stable. Therefore, I consider inflation
as a proxy for economic stability. Since high inflation represents greater instability in many
countries, a sign of a coefficient of this variable is expected to be negative. The data for
inflation (consumer price index 2000=100) are obtained from the International Monetary
Fund (IMF), World Economic Outlook (WEO) databases.
3. Trade openness (TRO). Export possibilities and access to other international markets
determine the trade openness of a host country. This is an important factor in promoting
investment climate and especially for export-oriented FDI. Therefore, a sign of a coefficient
of this variable is expected to be positive. The ratio of the sum of imports and exports to GDP

12
([(EXP+IMP)/GDP]*100) is considered as a proxy for trade openness. The data for exports
and imports are obtained from the World Bank Database.
4. Infrastructure (INS). An adequate supply of infrastructure services is an important factor
for productivity and growth. An economy of a region can be operated without major
distortions with a good infrastructure (Frawsen, Josefsson 2004). Therefore, infrastructure of
a country is another important factor for FDI inflows. I expect a positive sign from a
coefficient of this variable. Many previous studies applied fixed lines and mobile phone
subscribers as a proxy for infrastructure (Baibekova, Hoang, 2010; Mhlanga et al., 2010).
However, due to the lack of data for the selected countries, I use mobile cellular subscriptions
as a proxy for infrastructure. The data for this variable are obtained from the World Bank
Database.
5. Reliability (REL). I consider a stock of FDI (in millions of USD, constant (2000)) in a host
country as a proxy for reliability, as already accumulated stocks of FDI reflects investment
environment (please note that the beginning of 1990s, is a starting period of the accumulation
of FDI stock for both, Kazakhstan and Uzbekistan). Potential investors will be positively
affected by the investments that country already received. Hence, a hypothesis will be that a
greater accumulated stock of FDI attracts more foreign investment (Frawsen, Josefsson 2004).
Thus, I expect a sign of a coefficient of this variable to be positive. The data for the stock of
FDI are obtained from the United Nations Conference on Trade and Development
(UNCTAD) Database.
5.2. Empirical Model
I use the following econometric model in the empirical analysis:
FDI = f (MSZ, ECS, TRO, INS, REL) (1)
where, FDI refers to FDI inflows (in millions of USD, constant (2000)); MSZ refers to market
size (GDP in billions of USD, constant (2000)); ECS refers to economic stability (consumer
price index 2000=100); TRO refers to trade openness ([(EXP+IMP)/GDP]*100 in
percentages); INS refers to infrastructure (mobile cellular subscriptions, thousands); REL
refers to reliability (stock of FDI in millions of USD, constant (2000)).
13
A small variance in the data is required to obtain more correct and consistent results from the
regression model. Therefore, the issue of variance needs to be concerned first. To reduce the
variance in the data over the years, some of the variables are taken into natural logarithm
form. Thus, the main model takes the following form:
LFDIit = α0i + α1 LMSZit + α2 ECSit + α3 TROit + α4 LINSit+ α5 LRELit + ԑit (2)
where, L denotes that the variable is taken in the natural logarithm form; i (i = 1, 2) refers to a
country; t denotes a given time period; αk (k = 0, 1,…, 5) are the unknown response
coefficients of variation in the values of the dependent variable for changes in the values of
the independent variables; ԑt refers to error term (the dependent and the independent variables
are discussed above).
I use two different econometric regression methodologies, namely, ordinary least squares
(OLS) and seemingly unrelated regressions (SUR) to find which of the independent variables
are crucial in determining the dependent variable. Then, I will compare the results to choose
the most efficient estimates.
In the first stage, I use OLS to estimate the model (2). However, there are several important
issues, such as autocorrelation, heteroscedasticity, multicollinearity and endogeneity, which
be addressed before estimating the model (2).
Autocorrelation in time series appears if the residuals are found to be correlated with their
own lagged values. Thus, it violates the regression theory standard assumption that
disturbances are not correlated with each other. Therefore, in the case of autocorrelation, one
of the assumptions that makes OLS best linear unbiased estimate (BLUE), does not hold. I use
Durbin-Watson (Durbin and Watson (1950, 1951)) test to check for autocorrelation.
Moreover, if heteroscedasticity is present in the data set, the OLS estimates might be still
unbiased and consistent, however not efficient. Therefore, it is important to analyze for the
presence of heteroscedasticity. I apply the Breusch-Pagan / Cook-Weisberg test to check for
heteroscedasticity (this test was developed independently by Breusch and Pagan (1979) and
Cook and Weisberg (1983)).
Further, multicollinearity of independent variables may lead to less efficient outcomes when
attempting to study how well individual independent variables affect dependent variable.
Therefore, the independent variables should not highly correlate to each other in the model

14
(however, even extreme multicollinearity does not violate OLS assumptions, OLS still can be
unbiased and BLUE). To examine multicollinearity I apply variance inflation factor (VIF)
test.
Further, independent variables must not be correlated with error terms in regression models. If
they are correlated, a problem of endogeneity occurs and OLS estimates will be biased.
Therefore, I use the Durbin-Wu-Hausman Test (after Durbin (1954), Wu (1973) and Hausman
(1978) who proposed similar tests) to examine endogeneity.
Thus, I apply OLS for each selected country separately.
In the second stage, I use SUR (proposed by Zellner, (1962)) to estimate the model (2).
Unlike OLS, it is possible to estimate multiple models simultaneously in SUR. The reason for
using SUR lies in the fact that common factors might be present that influence all the
equations at the same time and cause a correlation between the error terms of equations. For
instance, in the case of this study, MNEs decisions to invest into Kazakhstan and Uzbekistan
might be related. Therefore, by assuming that the error terms of the model (2) for Kazakhstan
are correlated to the error terms of the same model for Uzbekistan, I use SUR methodology to
obtain more efficient estimates. If the error terms are in fact uncorrelated, the results from
SUR should be equivalent to OLS.
5.3. Empirical Limitations
I have to mention some of the limitations of this study. Firstly, since the selected countries
became independent in the beginning of 1990s, I am limited with the data sets from 1996 to
2010 for both, Kazakhstan and Uzbekistan.
Secondly, due to the same reason (i.e. data sets limitation), the paper is limited with the
econometric methodologies. It would not be so efficient with the limited data sets to conduct
other types of time-series analyses such as causality, co-integration and error correction.
Further, as it was noted earlier, the variables for the empirical analysis are selected based on
the previous studies, in which these variables were the most commonly studied factors that
showed significant results. However, due to the lack of data, many important variables are not
included in this study. For instance, abundance of natural resources and corporate tax rates are
among the excluded variables that could be the potential highly significant determinants of
FDI in the selected Central Asian countries.

15
6. Empirical Results
The summary statistics of the variables are reported in the Appendix (see Table A1 and A2 in
the Appendix A). Table 1 presents the results for the autocorrelation test:
Table 1. Durbin-Watson Tests Results
Kazakhstan Uzbekistan
d-statistic (6, 15) = 1.937409 d-statistic (6, 15) = 2.199035
From the results we can see that Durbin-Watson statistic for both, Kazakhstan and Uzbekistan
close to 2, suggesting no autocorrelation in the time series.
Further, by using the Breusch-Pagan / Cook-Weisberg Test, I examine for the presence of
heteroscedasticity in the data set. The results are presented in the following table:
Table 2. Breusch-Pagan / Cook-Weisberg Test Results
Kazakhstan Uzbekistan
chi2(1) = 0.39 chi2(1) = 0.68
Prob > chi2 = 0.5299 Prob > chi2 = 0.4086
The p-value is 0.5299 for Kazakhstan and 0.4086 for Uzbekistan, which are larger than 0.05.
Therefore, the null hypothesis that there is no heteroscedasticity cannot be rejected. Thus, it
can be suggested that heteroscedasticity is not a problem for the model.
I proceed by conducting the VIF test to examine the issue of multicollinearity. The results are
presented in the Appendix (see Table A3 in the Appendix A). The results suggest that
multicollinearity might be a problem for the model (2), since we have quite low values (i.e.
1/VIF values are close to zero) for most of the variables. Therefore I conducted several
additional measures to analyze if multicollinearity indeed a problem for the model (2). For
instance, I added several other variables to the model and estimated it (to see if the signs of
the variables’ coefficients change or not. In general, if the signs of the coefficients change
when the additional variables are added, it might indicate a multicollinearity problem),
however none of the signs of the variables’ coefficients changed for both, Kazakhstan and
Uzbekistan. Therefore, I suggest that multicollinearity does not highly influence for
estimations.
16
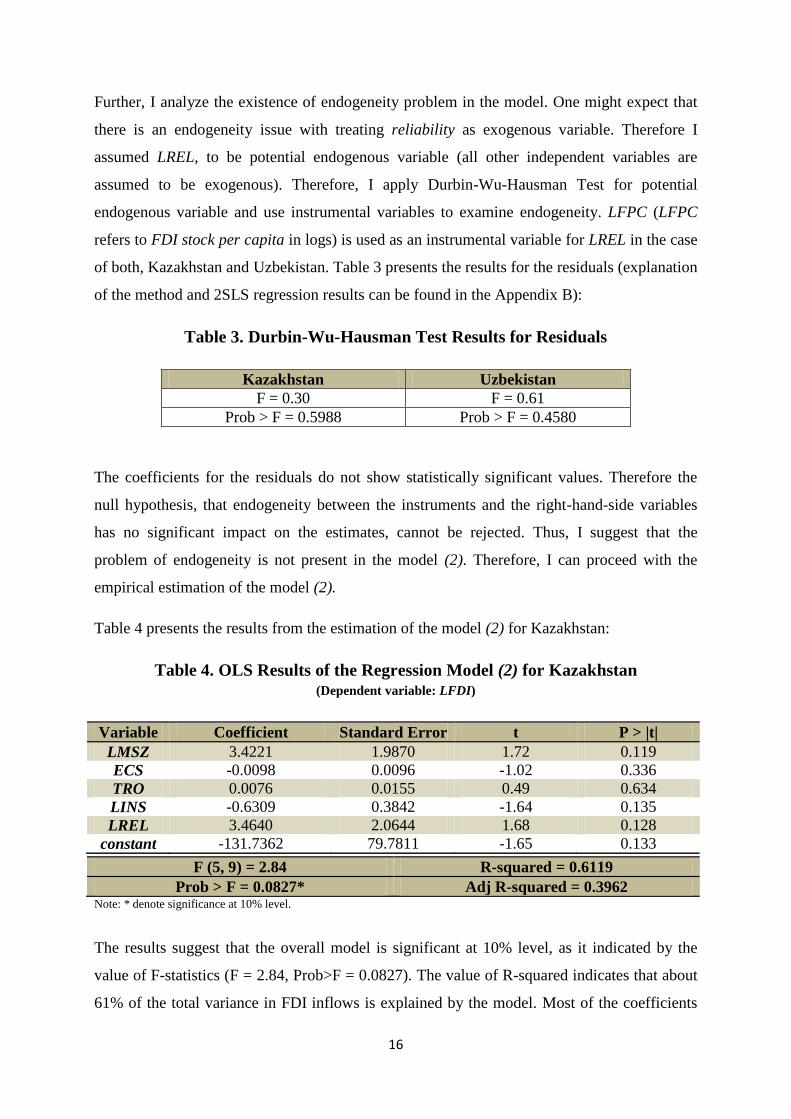
Further, I analyze the existence of endogeneity problem in the model. One might expect that
there is an endogeneity issue with treating reliability as exogenous variable. Therefore I
assumed LREL, to be potential endogenous variable (all other independent variables are
assumed to be exogenous). Therefore, I apply Durbin-Wu-Hausman Test for potential
endogenous variable and use instrumental variables to examine endogeneity. LFPC (LFPC
refers to FDI stock per capita in logs) is used as an instrumental variable for LREL in the case
of both, Kazakhstan and Uzbekistan. Table 3 presents the results for the residuals (explanation
of the method and 2SLS regression results can be found in the Appendix B):
Table 3. Durbin-Wu-Hausman Test Results for Residuals
Kazakhstan Uzbekistan
F = 0.30 F = 0.61
Prob > F = 0.5988 Prob > F = 0.4580
The coefficients for the residuals do not show statistically significant values. Therefore the
null hypothesis, that endogeneity between the instruments and the right-hand-side variables
has no significant impact on the estimates, cannot be rejected. Thus, I suggest that the
problem of endogeneity is not present in the model (2). Therefore, I can proceed with the
empirical estimation of the model (2).
Table 4 presents the results from the estimation of the model (2) for Kazakhstan:
Table 4. OLS Results of the Regression Model (2) for Kazakhstan (Dependent variable: LFDI)
Variable Coefficient Standard Error t P > |t|
LMSZ 3.4221 1.9870 1.72 0.119
ECS -0.0098 0.0096 -1.02 0.336
TRO 0.0076 0.0155 0.49 0.634
LINS -0.6309 0.3842 -1.64 0.135
LREL 3.4640 2.0644 1.68 0.128
constant -131.7362 79.7811 -1.65 0.133
Note: * denote significance at 10% level.
The results suggest that the overall model is significant at 10% level, as it indicated by the
value of F-statistics (F = 2.84, Prob>F = 0.0827). The value of R-squared indicates that about
61% of the total variance in FDI inflows is explained by the model. Most of the coefficients
F (5, 9) = 2.84 R-squared = 0.6119
Prob > F = 0.0827* Adj R-squared = 0.3962

17
of the variables have the expected sign. Particularly, the coefficient of LMSZ shows the
expected positive sign (which is close to 10% significance level), suggesting that market size
of Kazakhstan has some degree of importance for FDI inflows. Further, the coefficient of ECS
shows negative sign, however it is not statistically highly significant, suggesting that
economic stability of the country is not important factor for FDI inflows. As I used inflation
as a proxy for economic stability, it can be concluded that high inflation is not highly
detrimental factor for foreign investors. Further, despite the fact that the coefficient of TRO
shows the expected positive value, it is not statistically significant. Therefore I suggest that
trade openness has a positive effect to some extent but it is not an important factor for FDI
inflows in Kazakhstan. Moreover, the positive sign was expected from the coefficient of LINS,
however it is negative and statistically insignificant. As I used mobile cellular subscriptions
as a proxy for infrastructure, seems like it is not a sufficient variable to represent
infrastructure of a country (many previous studies applied fixed lines and mobile phone
subscribers as a proxy for infrastructure, as I mentioned it in subsection 5.1). Finally, the
coefficient of LREL shows the expected positive sign, however it is not statistically highly
significant. Therefore I may suggest that reliability has a positive effects but it is not one of
the main determinants of FDI inflows in Kazakhstan.
Next, I present the results from the estimation of the model (2) for Uzbekistan:
Table 5. OLS Results of the Regression Model (2) for Uzbekistan (Dependent variable: LFDI)
Variable Coefficient Standard Error t P > |t|
LMSZ 8.3001 5.5182 1.50 0.167
ECS -0.0208 0.0093 -2.23** 0.053
TRO 0.0375 0.0086 4.34*** 0.002
LINS -0.2089 0.3213 -0.65 0.532
LREL 2.5034 0.6338 3.95*** 0.003
constant -223.5517 114.832 -1.95 0.083
Note: *** and ** denote significance at 1% and 5% level respectively.
The results suggest that the overall model is highly significant (F = 21.47, Prob>F = 0.0001)
at 1% level. Most of the estimated coefficients of the variables have the expected signs.
Moreover, the value of R-squared indicates that about 92% of the total variance in FDI
inflows is explained by the model. The coefficient of LMSZ shows positive sign, however not
statistically significant. Therefore I may suggest that market size is not highly important factor
F (5, 9) = 21.47*** R-squared = 0.9226
Prob > F = 0.0001 Adj R-squared = 0.8797

18
for FDI inflows in Uzbekistan. Further, the coefficient of ECS shows statistically significant
negative sign, suggesting that weak economic stability (associated with high inflation) has
significant negative effect on FDI inflows. Moreover, the coefficient of TRO shows
statistically highly significant positive sign, suggesting that trade openness of Uzbekistan is
one of the main determinants of FDI inflows. Again, the positive sign was expected from the
coefficient of LINS, however it is negative, despite the fact that it is not statistically
significant. Thus, it can be repeatedly suggested that mobile cellular subscriptions is not a
sufficient variable to represent infrastructure of a country (as in the case of Kazakhstan).
Finally, the coefficient of LREL shows the statistically significant positive sign. Therefore I
may suggest that reliability is another important factor for FDI inflows in Uzbekistan.
Further, I use SUR methodology to estimate the model (2) simultaneously for both,
Kazakhstan and Uzbekistan. The results are presented in the following table:
Table 6. SUR Results of the Regression Model (2) (Dependent variable: LFDI)
Variable Kazakhstan Uzbekistan
LMSZ Std. Err.
z
P > |z|
3.8233** 1.5261
2.51
0.012
7.2845* 4.2301
1.72
0.085
ECS Std. Err.
z
P > |z|
-0.0127* 0.0074
-1.72
0.085
-0.0212*** 0.0071
-2.97 0.003
TRO Std. Err.
z
P > |z|
0.0044 0.0118
0.37
0.708
0.0372*** 0.0066
5.60
0.000
LINS Std. Err.
z
P > |z|
-0.6576** 0.2938
-2.24
0.025
-0.0945 0.2451
-0.39
0.700
LREL Std. Err.
z
P > |z|
3.7077** 1.5787
2.35
0.019
2.6313*** 0.4872
5.40
0.000
constant Std. Err.
z
P > |z|
-145.981 61.079
-2.39
0.017
-203.6565 88.0228
-2.31
0.021
Note: ***, ** and * denote significance at 1%, 5% and 10% level respectively.
R-squared 0.6043 0.9213
Chi2 25.67*** 184.86***
P 0.0001 0.0000

19
From the results it can be seen that the signs of the coefficients do not differ when compared
to OLS results, however, in current results the variables have higher level of significance.
Particularly, the coefficient of LMSZ shows statistically significant value for both, Kazakhstan
and Uzbekistan, suggesting that market size is important factor for FDI inflows in these
countries. Further, the coefficient of ECS shows statistically significant value for both
Kazakhstan and Uzbekistan, suggesting that economic stability is another important factor for
FDI inflows in these countries. As in OLS results, the coefficient of TRO shows statistically
highly significant value for Uzbekistan, suggesting that trade openness is one of the highly
important factors for FDI inflows in Uzbekistan. On the other hand, in the case of Kazakhstan,
the results suggest that trade openness is not highly important factor for FDI inflows in this
country. Further, since the coefficient of LINS for both, Kazakhstan and Uzbekistan, (as in
OLS) shows negative value, I again suggest that the variable (i.e. mobile cellular
subscriptions) which is used as a proxy for infrastructure is not sufficient variable to
represent infrastructure of a country. Finally, the coefficient of LREL shows statistically
significant positive value for both, Kazakhstan and Uzbekistan, suggesting that reliability is
significant factor for FDI inflows in these countries.
Further, if the standard errors are compared between OLS and SUR results, it can be seen that
all estimates which are obtained from SUR have lower standard errors. Additionally, the
significance of the overall model is higher in SUR results when compared to OLS results.
Thus, SUR methodology seems to be more appropriate than OLS methodology for the current
study, and therefore, SUR results form the basis of economic interpretation.
20
7. Summary and Conclusion
In this paper, the determinants of FDI in two Central Asian countries, namely, Kazakhstan
and Uzbekistan were investigated using the time period of 1996-2010. The main motivation
was to analyze what factors of these transition countries are the most crucial factors in
attracting foreign direct investments. The variables for the empirical analysis were selected
based on the existing theories of FDI and the previous empirical studies, in which the selected
variables were the most commonly studied factors that showed significant results. In this
study, variables such as market size, economic stability, trade openness, infrastructure and
reliability were used to analyze the main determinants of FDI in the selected countries. The
ordinary least squares (OLS) and seemingly unrelated regressions (SUR) regression
methodologies were used to find which of the independent variables were crucial factors in
determining the dependent variable. The obtained results from SUR seemed to be more
efficient when compared to OLS results. Therefore, the results from SUR were chosen as a
basis for economic interpretation. Thus, according to the main results market size, economic
stability and reliability were important factors for FDI inflows in both, Kazakhstan and
Uzbekistan. Moreover, trade openness was highly significant factor for FDI inflows in
Uzbekistan, however, this factor was not significant for FDI inflows in the case of
Kazakhstan. Further, unexpected negative results were obtained for infrastructure in the case
of both, Kazakhstan and Uzbekistan. Therefore, the chosen variable to represent
infrastructure suggested to be insufficient.
Kazakhstan and Uzbekistan have abundance of natural resources. However due to the lack of
data, it was not possible to include the factor of natural resources in this study. I suggest that
this factor would be one of the highly significant determinants of FDI inflows in these
countries.
In general, obtained results are consistent with the major theories of FDI. For instance,
according to OLI paradigm (which is discussed in Section 3), location-specific advantages
(such as market structure, political and economic stability and so on) are important factors for
FDI, as some of them reflected in the results of this study. Moreover, the results are also
consistent with some of the major findings of the previous empirical studies on developing
and transition economies (for instance, see Asiedu (2006), Johnson (2006), Azizov (2007),
Indopu and Talla (2010)).

21
Further, since this study found that economic stability had significantly negative effects on
FDI inflows in both, Kazakhstan and Uzbekistan, one of the policy implications emerging
from the current study concerns this factor. As inflation used as a proxy for economic
stability, it can be suggested that managing and stabilizing inflation would enhance the
attractiveness of these countries to foreign investors and thus would lead to greater inflows of
FDI.
In this study I just focused on two Central Asian countries. Therefore, it was not possible to
conduct a comparative analysis to better understand the patterns of FDI in Central Asia. In the
future, when more data become available, the future research should consider all other Central
Asian countries. This will allow conducting a broad comparison of Central Asian economies
in terms of their success in attracting foreign direct investment.
22
References
Akhtar, H., M., (2000), “The Determinants of Foreign Direct Investment in Pakistan: An
Econometric Analysis”, The Lahore Journal of Economics, Vol.5, No.1, pp. 1-22.
Alaba, O.,O., Olubusoye, E., O., Ojo, S., O., (2010), “Efficiency of Seemingly Unrelated
Regression Estimator over the Ordinary Least Squares” European Journal of Scientific
Research, Vol.39 No.1, pp.153-160.
Asiedu, E., (2006), “Foreign direct investment in Africa: The role of natural resources,
market size, government policy, institutions and political instability”, World Economy, 29 (1),
pp. 63-77.
Assuncao, S., Forte, R., Teixeira, A., C., (2011), “Location Determinants of FDI: A Literature
Review”, Faculdade de Economia, Universidade do Porto, Working Paper N. 433.
Azizov A., (2007), “Determinants of FDI in CIS countries with Transition Economy”, Master
Thesis, Aarhus School of Business.
Baibekova, K., Hoang, T., N., A., (2010), ”Determinant of Foreign Direct Investment in
Ireland”, Bachelor Thesis, Jönköping International Business School.
Barclay, A., L., (2000), “Foreign Direct Investment in Emerging Economies: Corporate
strategy and investment behaviour in the Caribbean”, Routledge Studies in International
Business and the World Economy, ISBN 0-203-77135-4.
Baronchelli, G., Cassia, F., (2008), “Internationalization of the firm: stage approach vs.
global approach”, 8th Global Conference on Business & Economics, ISBN: 978-0-9742114-
5-9.
Biswas, R., (2002), “Determinants of foreign direct investment”, Review of Development
Economics, 6 (3), pp. 492-504.
Botrić, V., Škuflić, L., (2006), “Main determinants of foreign direct investment in the
southeast European countries”, Transition Studies Review, 13 (2), pp. 359-377.
Breusch, T., S., Pagan, A., R., (1979), "A Simple Test for Heteroscedasticity and Random
Coefficient Variation" Econometrica 47, pp. 1287-1294.
Brouthers, L., E., Werner, S., (1996),”The Aggregate Impact of Firms’ FDI Strategies on the
Trade Balances of Host Countries”, Journal of International Business Studies, Vol. 27, No. 2,
pp. 359-373.
Buckley, P., J., Casson, M., C., (1976), “The future of the multinational enterprise”, London:
Macmillan.
Buckley, P., J., Casson, M., C., (2009), “The internalisation theory of the multinational
enterprise: A review of the progress of a research agenda after 30 years”, Journal of
International Business Studies (2009) 40, pp. 1563–1580.
23
Campos F., Kinoshita Y., (2003), “Why Does FDI Go Where it Goes? New Evidence from the
Transition Economies”, IMF Working Paper, WP/03/228.
Cheung, Y-W., Qian, X., (2009), “Empirics of China’s outward direct investment”, Pacific
Economic Review, 14 (3), pp. 312-341.
Cleeve, E., (2008), “How effective are fiscal incentives to attract FDI to Sub-Saharan
Africa?”, The Journal of Developing Areas, 42 (1), pp. 135-153.
Coase, R., H., (1937), “The nature of the firm”, Economica, 4(16), pp. 386–405.
Cook, R., D., Weisberg, S., (1983), "Diagnostics for Heteroscedasticity in Regression"
Biometrika 70, pp. 1-10.
Deichmann, J., I., Eshghi, A., Haughton, D., M., Sayek, S., Teebagy, N., C., (2003), “Foreign
direct investment in the Eurasian transition states”, Eastern European Economics, 41(1), pp.
5-34.
Demirhan, E., Masca, M., (2008), “Determinants of Foreign Direct Investment Flows to
Developing Countries: A Cross-Sectional Analysis”, Prague Economic Papers, 4, 2008.
Denisia, V., (2010), “Foreign Direct Investment Theories: An Overview of the Main FDI
Theories”, European Journal of Interdisciplinary Studies, Issue 3, pp. 53-59.
Dhakal, D., Mixon, F., Upadhyaya, K., (2007), ”Foreign Direct Investment and Transition
Economies: Empirical Evidence from a Panel Data Estimator”, Economic Bulletin, Vol. 6,
No. 33 pp. 1-9.
Dickey, D., A., Fuller, W., A., (1981), “Likelihood Ratio Statistics for Autoregressive Time
Series with a Unit Root”. Econometrica, Vol. 49, pp. 1057-1072.
Dunning, J., H., (1988), “The Eclectic Paradigm of International Production: A restatement
and some possible extensions”, Journal of International Business Studies issue 19 (Spring).
Dunning, J., H., (1994), “Re-evaluating the Benefits of Foreign Direct Investment. -
Transnational Corporations”, Vol. 3, No. 1, pp. 23-51.
Dunning, J., H., (2000), “The eclectic paradigm as an envelope for economic and business
theories of MNE activity”, International Business Review 9 (2000), pp. 163–190.
Durbin, J., (1954), “Errors in variables”, Review of the International Statistical Institute, 22,
pp. 23–32.
Durbin, J.,Watson, G., S., (1950) "Testing for Serial Correlation in Least Squares Regression,
I." Biometrika 37, pp. 409–428.
Durbin, J., Watson, G., S., (1951) "Testing for Serial Correlation in Least Squares
Regression, II." Biometrika 38, pp. 159–179.

24
Frawsen, G., Josefsson, H., (2004), “Foreign Direct Investment and Developing Countries:
How to Attract Trans-National Corporations”, Bachelor Thesis, Lund University.
Freeman, R., (2008), “Labour Productivity Indicators: Comparison of Two OECD Databases
Productivity Differentials & the Balassa-Samuelson Effect”, OECD Statistics Directorate,
Division of Structural Economic Statistics.
Hausman, J., A., (1978), "Specification Tests in Econometrics", Econometrica 46 (6), pp.
1251–127.
Heckscher, E., (1919), "The Effects of Foreign Trade on the Distribution of Income",
Ekonomisk Tidskrift, Vol. 21, pp. 497-512.
Hymer, S., (1976) (1960 dissertation), “The International Operations of Nation Firms: A
Study of Foreign Direct Investment”, Cambridge, MLT Press.
Indopu, K., Talla, T., J., (2010), ”Foreign Investment in Africa: A Look into FDI
Determinants”, Bachelor’s Thesis, Jönköping International Business School.
Johnson, A., (2006), “FDI Inflows to the Transition Economies in Eastern Europe: Magnitude
and Determinants”, CESIS Electronic Working Paper Series, No. 59.
Kindleberger, C., P., (1969), “American Business Abroad”, The International Executive 11,
pp.11–12.
Mhlanga, N., Blalock, G., Christy, R., (2010), “Understanding foreign direct investment in
the southern African development community: an analysis based on project-level data”,
Agricultural Economics, 41 (3-4), pp. 337-347.
Mohamed, S., E., Sidiropoulos, M., G., (2010), “Another look at the determinants of foreign
direct investment in MENA countries: an empirical investigation”, Journal of Economic
Development, 35 (2), pp. 75-95.
OECD (Organization for Economic Co-operation and Development), (2002),”Foreign Direct
Investment for Development: Maximizing Benefits, Minimizing Costs”, OECD.
OECD (Organization for Economic Co-operation and Development), (2011), “The
Competitiveness Potential of Central Asia”, OECD.
Ohlin, B., (1933), “Interregional and International Trade”, Harvard University Press.
Reiljan, J., Reiljan E., Andresson K., (2001), “Attractiveness of Central and Eastern
European Countries for Foreign Direct Investment in the Context of European Integration:
The Case of Estonia”, 41st ERSA Congress, Zagreb.
Sahoo, P., (2006), “Foreign Direct Investment in South Asia: Policy, Trends, Impact and
Determinants”, ADB Institute Discussion Paper No. 56.
25
Severn, Sean-Leigh, (2007), “Do conventional foreign direct investment theories explain why
multinational enterprises conduct foreign direct investment in Thailand?”, Master Thesis.
Schneider F., Frey B., S., (1985), “Economic and political determinants of foreign direct
investment”, World Development, 13 (2), pp. 161-175.
Shenkar, O., (2007), “Foreign Direct Investment Theory and Application”,
http://www.sagepub.com/upm-data/18594_Chapter_3.pdf.
Sholk, D., (2011), “FDI alone cannot expand Central Asian Economic Development”,
Washington DC, Universal Newswire.
Singhania, M., Gupta, A., (2011), “Determinants of foreign direct investment in India",
Journal of International Trade Law and Policy, Vol. 10, Iss: 1, pp. 64 – 82.
UNCTAD (United Nations Conference on Trade and Development), (2011), “Global and
Regional FDI Trends in 2010”, UNCTAD Global Investment Trends Monitor, No. 5.
UN (United Nations), (2003), “Foreign Direct Investment in Central Asian and Caucasian
Economies: Policies and Issues”, United Nations, ISBN: 92-1-120171-3, ISSN: 1020-3516,
ST/ESCAP/2255.
Vernon, R., (1966), “International investment and international trade in the product cycle”,
Quarterly Journal of Economics 80, pp. 190-207.
Vernon, R., (1979), “The product life cycle hypothesis in a new international environment”,
Oxford Bulletin of Economics and Statistics, 41 (4), pp. 255-67.
Vijayakumar, N., Sridharan, P., Rao, K., C., S., (2010), “Determinants of FDI in BRICS
countries: A panel analysis”, International Journal of Business Science and Applied
Management, 5 (3), pp. 1-13.
Wu, D., M., (1973), "Alternative Tests of Independence Between Stochastic Regressors and
Disturbances", Econometrica, 41, pp. 733-750.
Zellner, A., (1962), "An efficient method of estimating seemingly unrelated regression
equations and tests for aggregation bias". Journal of the American Statistical Association 57,
pp. 348–368.
Zeqiri, N., et al., (2011), “The Importance and Impact of Foreign Direct Investments (FDI) in
Transition Economies”, (IJAEBM) International Journal of Advanced and Business
Management, Vol. No. 2, Issues No. 1, 058-072.
Zhu, B., (2008), “Internationalization of Chinese MNEs and Dunning’s Eclectic (OLI)
Paradigm: A Case study of Huawei Technologies Corporation’s Internationalization
Strategy”, Master Thesis, Lund University.
26
Appendix A
Source: UNCTAD database
Figure A1. Worldwide Inward FDI Flows
Table A1. Summary Statistics of the Variables Used in the Model for Kazakhstan
Variables Obs. Mean Std. Dev. Minimum Maximum
FDI inflows (in millions of USD,
constant (2000))
15 2501.934 1167.784 1105.736 4730.538
Market size (GDP in billions of
USD, constant (2000))
15 26.3033 8.91091 16.22139 40.5091
Economic stability
(CPI index 2000=100)
15 133.137 52.18556 64.596 235.349
Trade openness (in %)
[(EXP+IMP)/GDP]*100
15 86.49197 12.07007 65.20419 105.6997
Infrastructure (mobile cellular
subscriptions, thousands)
15 5573.705 7122.68 9.737057 19911.41
Reliability (FDI stock in millions
of USD, constant (2000))
15 13780.46 4995.516 6581.983 22888.89
0
500000
1000000
1500000
2000000
25000001
97
0
197
3
197
6
197
9
198
2
198
5
198
8
199
1
199
4
199
7
200
0
200
3
200
6
200
9
Mil
lio
ns
of
US
D
World
Developed Economies
Total Developing Economies

27
Table A2. Summary Statistics of the Variables Used in the Model for Uzbekistan
Variables Obs. Mean Std. Dev. Minimum Maximum
FDI inflows (in millions of USD,
constant (2000))
15 163.7467 102.9346 40.31412 347.2107
Market size (GDP in billions of
USD, constant (2000))
15 17.18633 4.813519 11.58373 26.89641
Economic stability
(CPI index 2000=100)
15 182.3914 110.0677 28.117 377.615
Trade openness (in %)
[(EXP+IMP)/GDP]*100
15 62.28548 12.75486 36.55481 84.30935
Infrastructure (mobile cellular
subscriptions, thousands)
15 4025.317 6904.712 9.4711 21015.72
Reliability (FDI stock in millions
of USD, constant (2000))
15 749.965 204.7367 514.0492 1219.779
Table A3. Variance Inflation Factor (VIF) Test Results
Variable
1/VIF LMSZ ECS TRO LINS LREL
Kazakhstan 0.018509 0.034179 0.247133 0.007885 0.014306
Uzbekistan 0.002068 0.004273 0.370175 0.006451 0.171913
28
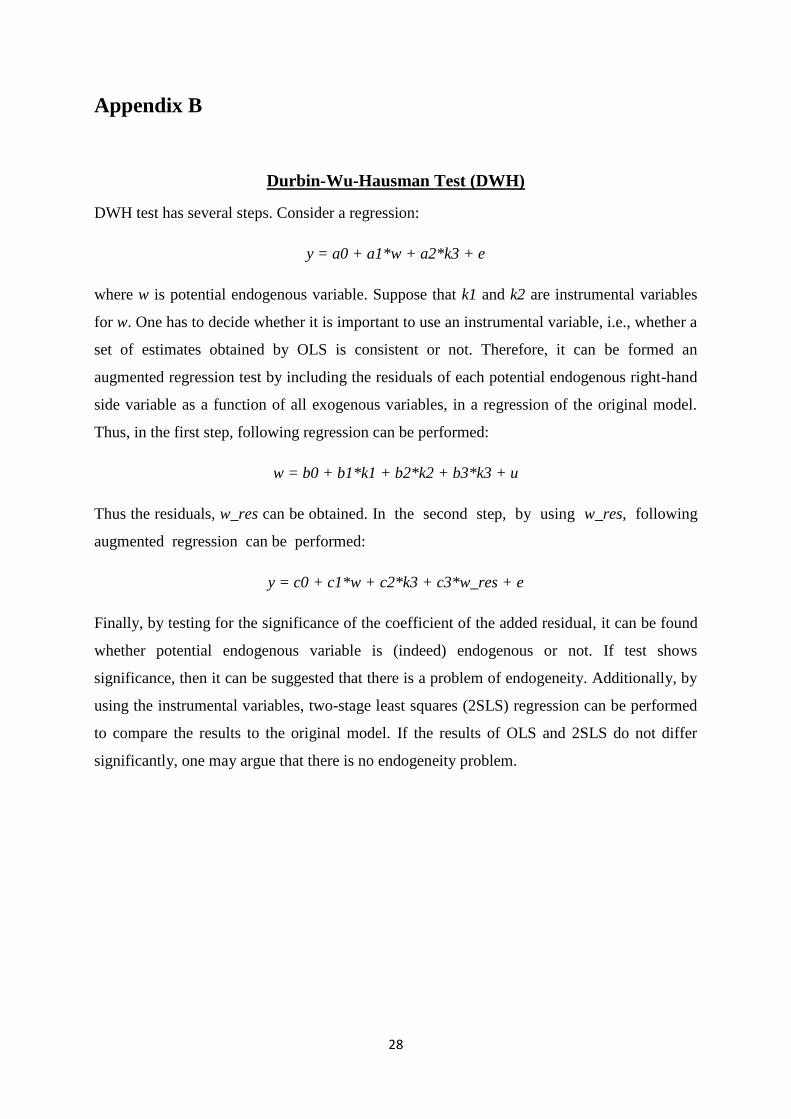
Appendix B
Durbin-Wu-Hausman Test (DWH)
DWH test has several steps. Consider a regression:
y = a0 + a1*w + a2*k3 + e
where w is potential endogenous variable. Suppose that k1 and k2 are instrumental variables
for w. One has to decide whether it is important to use an instrumental variable, i.e., whether a
set of estimates obtained by OLS is consistent or not. Therefore, it can be formed an
augmented regression test by including the residuals of each potential endogenous right-hand
side variable as a function of all exogenous variables, in a regression of the original model.
Thus, in the first step, following regression can be performed:
w = b0 + b1*k1 + b2*k2 + b3*k3 + u
Thus the residuals, w_res can be obtained. In the second step, by using w_res, following
augmented regression can be performed:
y = c0 + c1*w + c2*k3 + c3*w_res + e
Finally, by testing for the significance of the coefficient of the added residual, it can be found
whether potential endogenous variable is (indeed) endogenous or not. If test shows
significance, then it can be suggested that there is a problem of endogeneity. Additionally, by
using the instrumental variables, two-stage least squares (2SLS) regression can be performed
to compare the results to the original model. If the results of OLS and 2SLS do not differ
significantly, one may argue that there is no endogeneity problem.
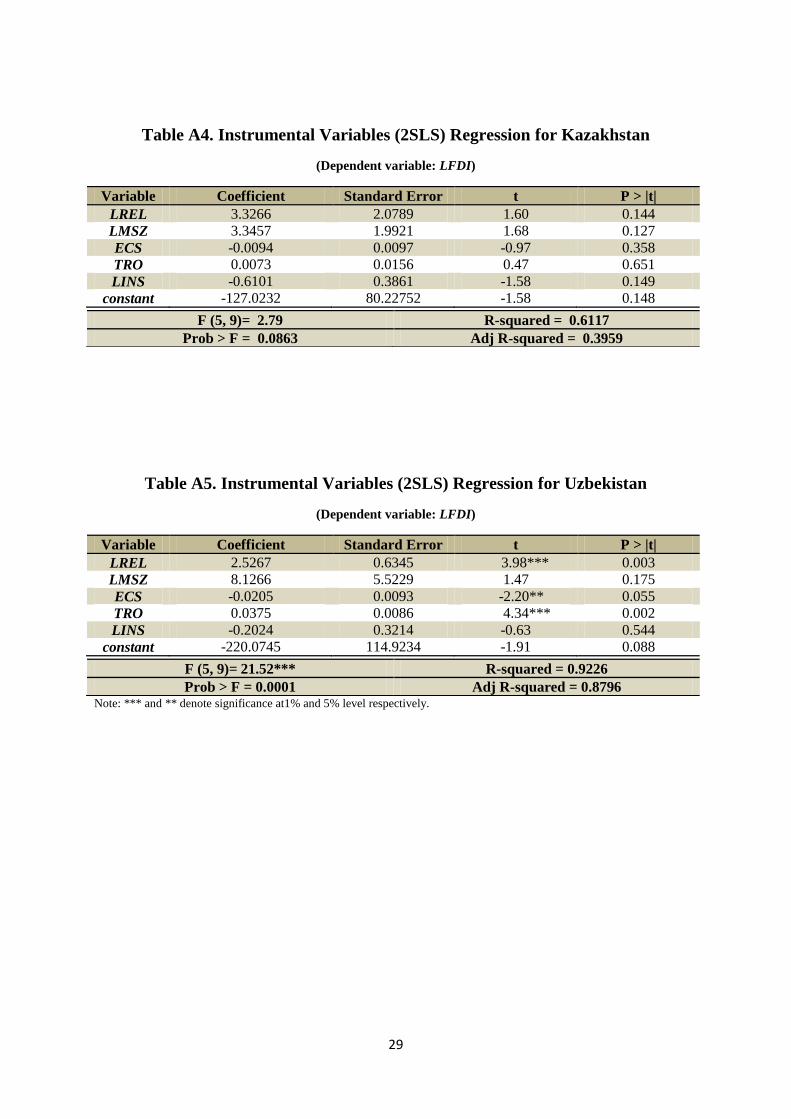
29
Table A4. Instrumental Variables (2SLS) Regression for Kazakhstan
(Dependent variable: LFDI)
Variable Coefficient Standard Error t P > |t|
LREL 3.3266 2.0789 1.60 0.144
LMSZ 3.3457 1.9921 1.68 0.127
ECS -0.0094 0.0097 -0.97 0.358
TRO 0.0073 0.0156 0.47 0.651
LINS -0.6101 0.3861 -1.58 0.149
constant -127.0232 80.22752 -1.58 0.148
Table A5. Instrumental Variables (2SLS) Regression for Uzbekistan
(Dependent variable: LFDI)
Variable Coefficient Standard Error t P > |t|
LREL 2.5267 0.6345 3.98*** 0.003
LMSZ 8.1266 5.5229 1.47 0.175
ECS -0.0205 0.0093 -2.20** 0.055
TRO 0.0375 0.0086 4.34*** 0.002
LINS -0.2024 0.3214 -0.63 0.544
constant -220.0745 114.9234 -1.91 0.088
Note: *** and ** denote significance at1% and 5% level respectively.
F (5, 9)= 2.79 R-squared = 0.6117
Prob > F = 0.0863 Adj R-squared = 0.3959
F (5, 9)= 21.52*** R-squared = 0.9226
Prob > F = 0.0001 Adj R-squared = 0.8796