corruption in transition economies: socialist, ottoman or
TRANSCRIPT

Luca J. Uberti
Corruption in Transition Economies: Socialist, Ottoman or Structural?
Hotel "Grand Villa Argentina"
Dubrovnik
June 3, 2018
Draft version
Please do not quote
THE THIRTEENTH YOUNG ECONOMISTS’ SEMINAR TO THE TWENTY-FOURTH DUBROVNIK ECONOMIC CONFERENCE
Organized by the Croatian National Bank

1
Corruption in Transition Economies: Socialist, Ottoman or Structural?
Luca J. Uberti, University of Oslo, Norway
ABSTRACT
Using data from 64 countries in Eastern Europe and MENA, I study the long-run effects of Ottoman and socialist
rule on the incidence of corruption. To proxy Ottoman legacies, I estimate the length of Ottoman rule across all
Ottoman successor states. Conditioning on income per capita, I find a robust adverse effect of both socialist and
Ottoman legacies on present-day corruption – a finding which reconciles two rival accounts of post-socialist
corruption from the transition literature. The results are robust to controlling for potential confounders and
instrumenting for per-capita income and Ottoman rule. Yet, the explanatory power of long-run historical
determinants of corruption is lower than the contribution of short-run factors. While present-day income alone
explains about half of the total variation in corruption across post-socialist countries, Ottoman and socialist legacies
jointly account for about one third. Although history does matter, the results suggest that most of the corruption
observed today in Eastern Europe, Central Asia and the Balkans may not be inherently ‘Eastern’ or socialist. Rather,
the data are consistent with an interpretation of corruption predominantly as a manifestation of persistent economic
under-development.
KEYWORDS
Corruption, Development, Long-run Persistence, Ottoman Empire, Post-Socialist Transition
JEL CODES
N45, D73, P33
HIGHLIGHTS
Historical legacy effects on corruption in 64 transition and developing economies
Number of years of rule used as a proxy for Ottoman/socialist legacies.
Corruption is subject to long-run persistence.
Historical influences have lower explanatory power than short-run contemporary determinants.
The incidence of corruption is primarily, though not entirely, a function of the level of development.
‘What is more especially Eastern is the corruption of the officialdom’
Seton Watson (1967[1945]: 147)
1. INTRODUCTION
Since the mid-1990s, the policy community has singled out corruption as a critical obstacle to
structural reform and economic development in low- to middle-income economies (Marquette, 2003;
Bukovansky, 2006). A discourse of corruption has also featured prominently in the context of post-
communist transition. In 2011, for instance, the Economist talked of a ‘rising tide of sleaze in ex-
communist Europe’, claiming that ‘corruption has replaced communism as the scourge of Eastern
Europe’ (cited by Holmes, 2013: 1163). Yet, the extent to which corruption is prevalent in post-socialist
economies varies widely (see Figure 1). In 2016, for instance, the likes of Estonia and Slovenia received a
better score on Transparency International’s influential Corruption Perception Index than some West-
European industrialised countries such as France and Spain (respectively). At the other end of the post-
socialist spectrum, Uzbekistan and Ukraine scored worse than Sierra Leone and Malawi. This kind of

2
evidence has spurred talk of a ‘great divide’ pitting the successful ‘transitioners’ of North-Central Europe
against the ‘laggards’ of South-Eastern Europe and the former Soviet Union (Berglof and Bolton, 2002;
Darden and Grzymala-Busse, 2006).
FIGURE 1: Levels of Corruption in 29 Transition Economies: Country Data, Average and
Standard Deviation (2000-07)
Sources: World Bank, Worldwide Governance Indicators, 2017; Notes: the scale runs from -2.5, which denotes no
corruption, to +2.5, which denotes maximum corruption; the average level of corruption (solid black line) is 0.371,
which is above the world average (0.009) over 2000-07. The dashed black lines mark the range of one standard
deviation above the below the mean.
Why are some post-communist countries so much more ‘corrupt’ than others? This paper presents
a systematic empirical test of competing explanations of the ‘great divide’, taking corruption as the
institutional outcome of interest. In particular, the paper considers two prominent explanations of
institutional divergence. One influential account focuses on the legacies of the socialist experience.
Several authors have emphasised the pivotal role of the socialist nomenklatura in either facilitating or
resisting the establishment of market-compatible institutions, which are instrumental in eliminating rents
and reducing corruption (Beck and Laeven, 2006; Treisman, 2002). Other authors, however, contend that
the historical antecedents of the post-WWII socialist regimes override the influence of socialist heritage
(Moller and Skaaning, 2010). In particular, several scholars point to the legacy of Ottoman rule in South-
Eastern Europe and the Balkans as the root cause of the ‘great divide’ (Dimitrova-Grajzl, 2007; Becker et
al., 2016).
-1-.
50
.51
1.5
Con
tro
l of C
orr
uptio
n (
Wo
rld
Ba
nk)
Slo
ven
ia
Esto
nia
Hu
ng
ary
Czech R
epu
blic
Po
land
Slo
vak R
ep
ub
lic
Lith
ua
nia
Latv
ia
Cro
atia
Bu
lgari
a
Ro
ma
nia
Bo
sn
ia
Mon
ten
eg
ro
Maced
on
ia
Geo
rgia
Se
rbia
Arm
en
ia
Ko
so
vo
Mold
ova
Be
laru
s
Alb
ania
Ru
ssia
Ukra
ine
Uzbe
kis
tan
Ka
za
kh
sta
n
Kyrg
yzsta
n
Azerb
aija
n
Ta
jikis
tan
Tu
rkm
en
ista
n

3
Is post-socialist corruption a vestige of the past? If so, is it primarily a manifestation of socialist
or pre-socialist legacies? To answer these two questions, I first investigate the relative influence of
socialist vs. Ottoman legacies on present-day corruption; secondly, I estimate the combined influence of
historical legacies vis-à-vis other contemporaneous determinants of corruption, notably the level of
economic development. Recent theoretical approaches suggest that corruption, clientelism and patronage
may be unsavoury coping strategies that low- to middle-income societies deploy as a response to the
manifold challenges of economic under-development. These challenges include the absence of a large
capitalist sector offering opportunities for gainful employment and material advancement, low fiscal and
redistributive capacity of the state and the inability to finance and implement a universal system of
property rights and contract enforcement (Khan, 2005; Uberti, 2016). These propositions imply that
corruption should ‘wither away’ as per-capita income grows. Still, it is possible that a country’s historical
heritage might be a source of institutional rigidity, imposing a drag on the establishment of the rule of
law, even in the presence of rising incomes.
To explore these questions, I estimate a corruption equation on a sample of 64 countries. To my
best knowledge, this is the first study that investigates the significance of socialist and pre-socialist
legacies (relative to each other and to other contemporaneous determinants of corruption) on the full
population of post-socialist and post-Ottoman countries. The reason why I focus on this particular pre-
socialist Empire is that the legacy of Ottoman rule features most prominently in both formal and informal
explanations of comparative corruption in post-socialist Eastern Europe.1 For instance, citing historian
Peter Sugar (1977), Bideleux and Jeffries note that by the end of Ottoman rule ‘nepotistic Balkan office-
holders and oligarchs had learned the tricks and techniques of political chicanery and corruption only too
well: it was the Ottoman legacy and training that was reflected in their actions’ (2007: 121). In the
Balkans, self-serving behaviour by politicians is often cast as a hang-over of an ‘Oriental’ or socialist
‘despotic’ past that will progressively fade as a result of ‘Europeanisation’ (Sulstarova, 2015; Kajsiu,
2015). The discursive prominence of Ottoman and socialist histories in accounts of post-socialist
corruption is not surprising. After all, Ottoman rule and the socialist experience jointly account for
virtually all the history of South-East Europe and the Balkans in the last 5-600 years.
To measure the long-term influence of historical legacies, I follow Dimitrova-Grajzl (2007) in
constructing indices for the number of years a given country spent under Ottoman control or socialist rule.
A key novelty of this paper is to extend the coverage of this index to encompass all the Ottoman
successor states, including those located in the Middle East and North Africa. I find a robust adverse
effect of both socialist and Ottoman legacies on present-day corruption. Since corruption routines tend to
persist over time, the influence of socialist and Ottoman rule is still visible today after controlling for
levels of economic development and a host of other potential confounders. Holding everything else
constant, a one-standard-deviation increase in the duration of Ottoman/socialist rule is estimated to
increase corruption by 16/23 percent of a standard deviation, respectively.
1 The Ottoman Empire also enjoys a similar reputation outside the narrow bounds of the transition literature.
Acemoglu and Robinson (2012: 56), for instance, claim that ‘it is the institutional legacy of this empire that keeps
the Middle East poor today’.

4
Consistent with the expectation that a legacy of a more recent historical period has a stronger
effect on the present, the estimated effect of socialist rule is larger in magnitude than that of Ottoman rule.
Further, I find that the overall explanatory power of long-run historical determinants (that is, the influence
of Ottoman and socialist legacies combined) is lower relative to the contribution of short-run factors.
While present-day income levels explain some 49 percent of the total variation in corruption amongst
post-socialist countries, Ottoman and socialist legacies account for 12 and 22 percent, respectively. More
starkly, variation in the level of economic development explains as much as 58 percent of corruption
variation in the full sample of post-socialist and post-Ottoman countries, whereas Ottoman and socialist
legacies account for only 10 and 16 percent. Thus, history contributes less than half as much to the scale
of corruption today as the most important contemporaneous factor alone (i.e. income).
Endogeneity, however, may lead to a biased parameter estimate of the income effect (due to
simultaneity) or the effect of Ottoman legacies (due to measurement error). In subsequent analysis, I show
that my baseline results are robust to instrumenting for per-capita income levels and the length of
Ottoman rule. They are also robust to different specifications and estimation techniques, and they hold in
different sub-samples. I conclude by suggesting that most of the corruption observed in Eastern Europe,
Central Asia and the Balkans that may not be inherently ‘Eastern’ or socialist. Rather, the data are
consistent with an interpretation of corruption primarily as an institutional manifestation of economic
under-development.
This paper contributes to the literature on the causes of corruption in the transition economies
(Treisman, 2002). By documenting some of the long-term consequences of Ottoman and socialist rule, the
findings also relate to a broader literature on the enduring effects of historical events (Nunn, 2009). In the
empirical literature on post-socialist countries, the study of historical legacies has remained somewhat
peripheral, although recent contributions have examined the long-term economic, political and
institutional consequences of a number of historical events, including the Holocaust in Western Russia
(Acemoglu et al., 2011), and Russian colonial settlement in Central Asia (Aldashev and Guirkinger,
2017) and the Caucasus (Natkhov, 2015).2
The remainder of this article is organised as follows. The next section briefly reviews the literature on
the causes of corruption. Section 3 presents the empirical specification, describes the data and discusses
estimation issues. Section 4 and 5 discuss the regression results and section 6 concludes.
2. CORRUPTION AND HISTORICAL LEGACIES
2.1 The Causes of Corruption: Theory and Evidence
Since Treisman’s seminal article (2000), a growing empirical literature has used cross-section
data to investigate drivers of corruption at the country level (see Treisman, 2007 for a review). The
potential determinants of corruption examined in the literature fall into three broad categories: economic,
institutional and socio-cultural.
2 The fast-growing literature on Ottoman legacies in Eastern Europe is reviewed in detail below.

5
As noted by Treisman, ‘by far the strongest and most consistent finding […] is that lower
perceived corruption correlates closely with higher economic development’ (2007: 223). Indeed, virtually
all empirical studies include GDP per capita as a regressor. A possible explanation for the strength of this
empirical relationship is offered by theories that seek to explain the persistence of personalised rule and
informal exercises of power in developing countries (Khan, 2005; Uberti, 2016). At low to mid- levels of
per-capita income, the ‘modern’ private sector is typically marginal in the structure of employment.
Consequently, there is no generalised interest across social groups in maintaining the viability of capitalist
enterprise, and politicians are subject to little self-restraint when it comes to using their power to extract
rents from the fledgling private sector (Khan, 2005: 715). Furthermore, the total surplus produced by the
private sector and taxed by the state is typically inadequate to finance a system of universal property
rights protection and contract enforcement (Uberti, 2016: 338). Property rights instability makes some
assets vulnerable to expropriation, and compels asset-holders to purchase informal protection from
politicians, typically by offering bribes or political contributions. To make matters worse, the state also
has low fiscal and hence redistributive capacity. This means that the budget is typically not the main site
of redistributive politics (Khan, 2005: 718). Rather, it is often through informal or corruptive means that
individuals and companies are ‘taxed’ (i.e. asked to pay a bribe) and key resources (public-sector jobs,
industrial subsidies) allocated. For all these reasons, the structural characteristics proxied by a low level
of GDP per capita are likely to be associated with high levels of (perceived) corruption.
Another important determinant of relative corruption, holding income levels constant, is the
quality of institutions. Democratic consolidation, in particular, has featured prominently in the literature.
Though it might increase corruption in the short run, in the long run democracy fosters transparency and
accountability. An increased likelihood of sanctions for malfeasance, in turn, reduces the expected returns
from rent-seeking (Mohtadi and Roe, 2003; Rock, 2009). Measures of democracy tend to have the
predicted effect in cross-country regressions, even after controlling for GDP per capita. Still, the effect is
not always statistically significant and is usually economically small (Treisman, 2000: 433), probably
because many of the beneficial effects of democratization run through economic development.
Culture and other (time-invariant or slow-moving) societal characteristics may affect corruption
independently of income levels and institutional quality. Recent contributions, in particular, argue that
religious tradition shapes individuals’ loyalties towards their in-group (Treisman, 2000: 403). Thus,
religious beliefs may affect individuals’ propensity to subvert impersonal rules for the sake of sectional or
private gain. Other perspectives contend that the influence of religion runs exclusively through the impact
of religious institutions. Timur Kuran (2004) has argued that some aspects of Islamic law, such as the
waqf system of charitable trusts, stimulated corruption due to its inherent inflexibility. Once those
institutions are abolished, religious belief has no influence on the incidence of corruption (Kuran, 2010).
Becker and Woessmann (2009) implicitly suggest another avenue through which religion may affect the
incidence of corruption. They find that the Protestant reformation in Europe raised literacy levels, which
in turn may improve bureaucratic capacity, facilitate the emergence of a civil society and promote the
flow of information. These, in turn, are all factors that may contribute to reducing or containing
corruption. In addition, some authors have emphasised social cleavages such as ethnolinguistic and

6
religious fractionalization (Mauro, 1995; Easterly and Levine, 1997). Corruption may proliferate in more
ethnically or religiously fragmented societies with less social cohesion and lower trust.
More recently, a new body of literature has explored the role of historical factors in driving
present-day corruption. European colonialism, in particular, has been singled out as an important source
of variation in the quality of political and legal institutions in the developing world. Treisman (2000: 402)
and Djankov et al. (2003) show that the former colonies that adopted common-law systems provide more
extensive checks on executive behaviour, which reduce opportunities for corruption. Angeles and
Neanidis (2015) suggest that, regardless of legal origin, permanent European settlement in the colonised
territories created powerful elites that were able to hold onto their privileges up to the present day. When
the power of elites is unconstrained, they argue, opportunities for rent extraction increase and corruption
is likely to be more prevalent. Consistent with this mechanism, they find that (holding constant the level
of development) former settler colonies (e.g. Algeria, Argentina) are significantly more corrupt today
than the formerly colonised regions in which Europeans did not settle in large numbers (e.g. West
Africa).3
2.2 Historical Roots of Post-socialist Corruption
In the context of post-socialist countries, transition scholars have long emphasised the crucial
importance of historical legacies. Two groups of explanation can be distinguished. One group focuses on
the legacies of socialism (Jowitt, 1992; Ledeneva, 1998; Karklins, 2005). In Soviet-type regimes, tight
party control over elite selection favoured the emergence of informal nomenklatura cliques. Initially, the
leadership harnessed these networks to circumvent the red tape and ensure the timely implementation of
economic plans. Progressively, however, the party leadership began to tolerate corruption and abuse of
office as a strategy to reward and accommodate the emerging middle class of party cadres (Karklins,
2005: 82). At the same time, petty informal activities and non-elite (blat-based)4 networks proliferated.
The ‘second economy’ was openly tolerated as it made possible the ‘reallocation by private means of a
significant fraction of […] national income according to private preferences’ (Millar, 1985: 697).
Corruption and informal exchange circumvented the allocative rigidities of central planning and increased
welfare, meanwhile allowing the communist party to keep up the pretence of a functioning socialist
economy.
The transition literature has also stressed the continuity between socialist-era and post-socialist
elites. In the post-Soviet countries (as in most Yugoslav successor states plus Albania), former cadres
were able to convert their political capital into substantial private wealth, re-inventing themselves as the
new propertied class of post-communism (Braguinsky, 2009). Even in the relatively more ‘liberal’ state-
socialist countries of East-Central Europe, a technocratic section of the nomenklatura went on to occupy
most of the managerial positions in the post-communist corporate sector (Eyal et al., 2000). The
persistence of elite power establishes a clear line of continuity between communist and post-communist
3 An important exception is that of the so-called neo-Europes (e.g. US, Australia). It is interesting to speculate
whether the settlement of ethnic Turks in the provinces of the Ottoman Empire might be associated with greater
corruption today. In this paper, I do not explore this possibility. 4 Blat is Russian for ‘favour’.

7
corruption. Also, the economic reforms of transition (e.g. trade and price liberalisation and asset
privatisation) opened up additional opportunities for rent-seeking and profiteering, further consolidating
the corrupt revenue base of the elite (Hellman, 1998; Frydman et al., 1998). ‘Taken together’, Karklins
concludes, ‘the legacy of the communist era and the temptations of transition have created a context of
significant levels of corruption’ (2005: 89).
Of course, the degree to which patronage and informality were entrenched in former socialist
countries varied considerably. Beck and Laeven (2006), for instance, claim that the power networks of the
nomenklatura became more entrenched in countries that experienced socialist rule for longer periods of
time. This might explain why the Soviet successor states, where communism lasted over 20 years longer
than in East-Central Europe, generally have worse property rights institutions and more corruption today.
Indeed, both Treisman (2002) and Beck and Laeven (2006) estimate a negative relation between number
of years of socialist rule and various measures of present-day corruption and institutional quality. One
problem with these accounts, however, is that they cannot easily accommodate the large differences in
corruption levels between countries with socialist regimes of equal duration – e.g. Albania and Slovenia.
A second group of scholars has forcefully resisted explanations of corruption that revolve around
the socialist experience, contending that they suffer from excessive ‘causal proximity’ to the
explanandum (Kitschelt, 2002). In a comparative analysis of socialist regimes, for instance, Kitschelt et
al. (1999) find considerable variation in the prevalence of legal-rational strategies of rule (as opposed to
personal networks of loyalty) and in the balance of power between the communist elite and their
challengers. Since socialism had a similar duration and similar formal institutions (e.g. central planning)
in all the countries they examine, Kitschelt et al. (1999) attribute the observed variation to different
patterns of state formation across the polities that preceded the establishment of socialism.5 Between the
14th century and 1918, most of East-Central Europe was controlled by four states: the Habsburg, Ottoman
and Russian Empires and Prussia.6 Their institutional endowments differed systematically. The Ottoman
Empire, in particular, has been singled out for the poor quality of its bureaucratic, fiscal and legal
institutions. Indeed, by the late 17th century, the authority of the sultan had broken down, giving way to
all manner of corruption in the bureaucratic apparatus and judiciary.
There are at least three aspects of Ottoman institutions that might have encouraged corruption.
First, the centrepiece of the Ottoman state, its fiscal bureaucracy, suffered from insufficient monitoring
and control. Palairet writes that beginning in the 18th century the imperial cavalrymen responsible for tax
collection [sipahi] ‘increasingly treated the imperial tithes as their own perquisites, so in peripheral areas
where central authority was least secure [as in the Balkans], the revenues to the Porte diminished,
weakening its authority’ (1997: 36). Provincial governors now relied on local notables [ayans] to act as
fiscal intermediaries, while ‘treasury holdings in the same provinces were auctioned off as tax-farms by
the central government’ (Inalcik and Quataert, 1994: 661). A new class of rapacious fiscal entrepreneurs
5 Similarly, Darden and Grzymala-Busse (2006) link the continuing dominance of nomenklatura elites in the post-
socialist period to literacy levels in the pre-socialist period. 6 Of course, most of the Prussian and Habsburg territories were part of the Sacred Roman Empire until its
dissolution at the end of the Napoleonic wars. Another important state that ruled over East-Central Europe in the
early modern period was the Polish-Lithuanian Commonwealth.

8
rapidly emerged and illegal levies proliferated. Often in cahoots with the judge of their district, the ayans
enjoyed considerable ‘illegal immunity’ and sometimes amassed considerable influence locally, carving
out for themselves a local fiefdom and turning into ‘quasi-feudal warlords’ (ibid.). In Constantinople,
‘palace favourites were handing out leases and posts as they pleased and taking money for it’ (Inalcik,
1978: 346). ‘The position of a judge [kadi] was often sold to the highest bidder’ (Mendelski and Libman,
2014: 183) and, reportedly, ‘twice as much of a particular kadiship’s revenue came from injustice as from
justice’ (Kuran, 2011: 240). Things did not improve significantly with the constitutional reforms of the
19th century. Rather, ‘all the steps that had been taken towards rationalising elite recruitment and
promotion had been bent to make the bureaucracy into a huge patronage machine run by the sultan’
(Vaughn-Findley, 1996: 168).
Second, property rights were poorly defined and unstable. All arable land was formally owned by
the state [miri] and farmed by smallholder peasants. The risk of arbitrary confiscation was high and local
officials and military strongmen often colluded with local judges in a bid to dispossess the peasantry and
appropriate their land (Inalcik and Quataert, 1994: 660). Third, corporate law did not recognise corporate
entities beyond the notoriously short-lived trading partnerships [mudaraba], thus inhibiting the
development of a legally incorporated private sector (Kuran, 2011). The lack of a vibrant civil society, in
turn, further increased the power and discretion of Ottoman officialdom, increasing the likelihood of rule-
violating behaviour.
When countries broke away from Constantinople, ex-Ottoman soldiers and administrators
typically went on to staff the public administrations of the newly independent states (Özbudun, 1996:
148).7 Thus, the flaws of Ottoman institutions might have carried over to the Empire’s successor states. A
line of continuity in the administration might explain why notionally similar socialist institutions
functioned differently in different countries – e.g. along patron-client lines in post-Ottoman Albania and
in a legal-rational way in post-Habsburg Czechoslovakia (Kitschelt et al., 1999). The persistence of
Ottoman legacies may also explain why the post-Ottoman transition countries (e.g. Albania, Serbia) are
generally more corrupt today than other post-socialist countries with little or no history of Ottoman
domination (e.g. Hungary, Estonia).
2.3 Empirical Studies of Long-run Persistence
More recently, economists have begun to investigate econometrically the effect of historical
legacies in post-socialist transition countries. These studies are closely related to a broader literature
documenting the long-run persistence of institutions and cultural traits (Alesina and Giuliano, 2015), and
the potential for historical shocks to establish persistent equilibria (Nunn, 2009). Relevant studies
investigated the effect of pre-socialist imperial rule on corruption (Dimitrova-Grajzl, 2007; Moller and
Skaaning, 2010, Becker et al., 2014), financial development (Grosjean, 2011), trust (Becker et al., 2014;
Karaja and Rubin, 2017) and the quality of legal and political institutions (Dimitrova-Grajzl, 2007;
7 The continuity of political elites was less smooth in the non-Muslim successor states since non-Muslims were
integrated in the bureaucracy only at the lowest level (Todorova, 1996: 56).

9
Mendelski and Libman, 2014).8 Most studies estimate the effects of Ottoman rule relative to the legacies
of Habsburg rule (Dimitrova-Grajzl, 2007; Mendelski and Libman, 2014) or relative to a mixed reference
category comprising all other empires, including Prussia (Grosjean, 2011). Becker et al. (2014) and
Karaja and Rubin (2017), by contrast, elect to focus on the Habsburg Empire, estimating a positive legacy
effect relative to that of the Ottoman and Russian Empires taken together. In this paper, I favour the
former approach and concentrate on the Ottoman Empire.
To measure the influence of history on present-day outcomes, these studies either employ am
indicator variable for the identity of the imperial power of interest (Becker et al., 2014; Mendelski and
Libman, 2014) or a continuous measure of the number of years of rule (Dimitrova-Grajzl, 2007;
Grosjean, 2007). Consistent with historical accounts, the statistical evidence indicates that the long-term
legacies of Habsburg and Prussian domination are generally more favourable than those of Russian and,
particularly, Ottoman imperial rule.
On the downside, these studies have produced no consensus on the relative importance of
socialist vs. pre-socialist imperial legacies in explaining post-socialist institutional development. As such,
they have not resolved the theoretical controversies that have developed in the transition literature.
Moreover, despite a general consensus that history matters, we still lack specific knowledge about the
relative importance of historical vs. contemporary factors in shaping institutional and economic
outcomes. The failure to answer these questions stems from the limitations of existing contributions.
First, while most studies control for contemporaneous determinants of corruption (e.g. present-day
income levels), none employs the point estimates to investigate the relative explanatory power of
historical vs. contemporary factors. Second, most studies investigate either the effect of socialist legacies
(Treisman, 2002; Beck and Laeven, 2006) or the long-run effects of Ottoman and Habsburg rule
(Grosjean, 2011; Becker et al., 2014). Failure to account for both historical legacies in the same model
might bias the point estimates. It also forecloses a systematic investigation of their relative explanatory
power.
Third, in all existing studies the identification of the socialist legacy effect comes entirely from
variation in the duration of socialist rule between the countries of the former Soviet Union and the East-
Central and South-East European states. While these two groups provide sufficient variation, a better
identification strategy would also exploit the variation between socialist and non-socialist countries. This
is especially important if we assume that a few decades of socialist rule might be sufficient to entrench
the dominance and privilege of a predatory elite, so that the marginal contribution of a few additional
years under the clout of nomenklatura should be relatively small. Similarly, fourth, all existing studies
examine the legacies of Ottoman rule in the Porte’s former European territories. To my best knowledge,
no attempt has been made to estimate the legacy effects of Ottoman domination in the Empire’s Middle
Eastern and North African (MENA) territories. Estimation based on a sample of both Balkan and MENA
countries increases the number of observations and, consequently, the statistical power of the tests.
8 A partially related paper is Iyigun (2008), which examines the impact of Ottoman military activities in Europe on
the incidence of political and religious conflicts in 16th
and 17th
century Europe.

10
Lastly, some recent studies seek to improve causal identification by using sub-national data and
regression discontinuity approaches (Becker et al., 2014; Karaja and Rubin, 2017). These strategies allow
the investigator to hold constant by construction a number of country-level characteristics (legal
institutions, national education policies, etc.) that are difficult to control in cross-country regressions.
What is gained in depth, however, is lost in breadth. While they permit a more precise estimation of
legacy effects in specific contexts (e.g. the so-called ‘cleft’ countries, formerly partitioned between two
Empires), they hardly warrant out-of-sample generalisations. Furthermore, valuable as they are,
regression-discontinuity studies cannot answer a general question: how much of the total variation in
present-day corruption amongst post-socialist countries is due to historical legacies.
Thus, to investigate the determinants of the post-socialist ‘great divide’, I rely on cross-country
data and estimate the impact of different historical legacies conditional upon each other. To add precision
to the estimates of Ottoman legacy and increase variation on my measure of socialist legacy, I assemble a
sample including both the post-socialist countries of Eastern Europe and Central Asia, and all the post-
Ottoman countries located in MENA, very few of which were ever ruled by a Soviet-style socialist
regime. To further increase variation in the sample, I also include a ‘belt’ of adjacent countries that never
experienced either Ottoman or socialist rule.9
2.4 Theoretical Mechanisms of Historical Persistence
Why should the consequences of historical events that took place hundreds of years ago be
observable today? A growing body of literature contends that institutions are subject to persistence
(Roland, 2004; Nunn, 2009: 77-9). In this paper, I define institutions as ‘routinised practices’.10
Insofar as
corruption is ‘institutionalised’, the subversion of institutional norms becomes a routine – that is, a ‘norm’
itself (Uberti, 2016). The general argument is that, if new routines are costly to establish and there are
powerful constituencies that benefit from existing arrangements, institutional change will be incremental,
cumulative and path-dependent.11
Take the case of corruption. For one thing, widespread corruption brings material benefits to
existing rent-seekers, creating powerful incentives for them to push for formal institutions (e.g. a weak
judiciary) that may be compatible with corruption (Acemoglu et al., 2005; Bates, 2014). In addition,
corruption reduces the relative returns to entrepreneurship, inviting new entrants into rent-seeking
(Acemoglu, 1995). Only through a sufficiently large shock to the distribution of political-economic power
can the high transaction costs of institutional change be overcome and a new equilibrium established
(Acemoglu et al., 2005: 392). Exogenous historical events may occasion such a shock. For instance,
socialist and Ottoman rulers may establish formal institutions (e.g. central planning) whose flaws in
9 All countries neighbouring a post-socialist or post-Ottoman country are included (except for Western Europe).
These countries are: Bahrein, Bangladesh, Bhutan, Chad, Djibouti, India, Iran, Mali, Mauritania, Morocco, Nepal,
Niger, Pakistan and Qatar. The results are robust to dropping this ‘belt’ of neighbours from the sample. 10
Unlike ‘rules of the game’, this definition shifts the focus of analysis away from the normative input to institution-
building (e.g. legislative reforms) towards the extent to which rules and norms actually shape and regularise the
behaviour of actors. These regular patterns of behaviour are the institutional outcome of interest. 11
Institutions may also have a tendency to endure because they ‘propound and defend broadly held values’ (Bates,
2014: 61).

11
design or implementation lead to the emergence of a corruption routine (e.g. the allocative inefficiencies
associated with central planning spawned the economy of favours). The resulting corruption can then
persist past the historical termination of their underlying formal institutions (e.g. past the end of socialist
rule) because powerful groups emerge that benefit from corrupt exchange and have a vested interest in its
continuation.
Appendix I provides a simple formal exposition of the dynamics associated with persistence. It
also derives some of the observable implications of these dynamics. An important innovation of my
approach is that it allows for the process of self-perpetuation to wear off with the passage of time.
Although ‘sticky’, corruption routines may be subject to a process of ‘autoregressive decay’. Unless it is
vigilantly enforced and constantly invigorated, a pattern of human behaviour is likely to lose its
momentum and eventually break down. An observable implication of the assumption of institutional
‘decay’ is that the legacy of an historical event that took place further back in the past should be smaller
than the legacy of a more recent, but otherwise identical, historical event.
Of course, different historical shocks (e.g. Ottoman conquest and socialist take-overs) may
impact corruption routines to varying degrees. Furthermore, some routines may have a greater or lesser
tendency to persist than others. The model presented in Appendix I shows that, observed today, the
magnitude of the legacy of an additional year of Ottoman/socialist rule results from three components:
distance in time, magnitude of the ‘impact’ effect of the historical shock, and tendency of the ensuing
routine to persist. The fact that Ottoman rule preceded socialist rule implies that the legacy of Ottoman
rule today should be smaller, other things equal. Still, without prior knowledge of the relative size of the
two ‘impact’ effects, or the relative tendency of socialist or Ottoman corruption to perpetuate itself, it is
not possible to formulate expectations about the relative magnitude of Ottoman and socialist legacies
today. Rather, I let the data speak on this.
3. EMPIRICAL STRATEGY
3.1 Empirical Specification
Empirically, I focus on the following cross-country regression:
𝐼𝑖 = 𝐼0 + �̂�𝑂𝑇𝑇𝑂𝑖 + �̂�𝑆𝑂𝐶𝑖 + 𝝆𝛙𝑖 + 𝜀𝑖 (1)
where 𝐼𝑖 is the level of present-day corruption in country i, measured using the World Bank’s Control of
Corruption index. This index captures ‘perceptions of the extent to which public power is exercised for
private gain, including both petty and grand forms of corruption, as well as ‘capture’ of the state by elites
and private interests’. The estimates give the country's score on the aggregate indicator, in units of a
standard normal distribution, ranging from approximately 2.5 (most corrupt) to -2.5 (least corrupt).
Following You and Khagram (2005), I average the values of the corruption indicator over 2000-07 to
reduce measurement error and contain the influence of random fluctuations. The choice of time period is

12
motivated by two considerations. First, I want to factor out any transitory effect on corruption associated
with the early years of post-socialist transition. To simplify the model, I also elect to shut out by
construction any effect associated with the Global Financial Crisis and the Arab Spring. 𝑂𝑇𝑇𝑂𝑖 and 𝑆𝑂𝐶𝑖
measure the number of years of Ottoman and socialist rule in country i. The main coefficients of interest
are �̂� and �̂�, which measure the corruption effect of one additional year of Ottoman and socialist rule,
respectively. A positive and significant estimated parameter implies that the respective historical event
had an adverse impact on corruption and that this effect persisted through to the present day. By contrast,
a statistically insignificant estimated parameter may result from either the historical event having little or
no impact on corruption or from corruption routines being subject to little or no persistence.
𝛙𝑖 is a vector of country-level determinants of corruption. From the point of view of corruption
theory, the most important covariates here are those measuring structural characteristics of the economy. I
use a measure of GDP per capita at market exchange rates (averaged over 2000-07) to capture the aspects
of a country’s level of development that are relevant for corruption (i.e. size of capitalist sector, the state’s
fiscal capacity, property rights protection). I also include a measure of oil dependence, on the assumption
that countries that are (or have been) more dependent on natural resource exports should have worse
institutions and more corruption today, in line with the ‘resource curse’ literature (Ross, 1999). I also
include a range of time-invariant socio-cultural characteristics, such as the share of Protestant and Muslim
adherents in total population and an index of religious and ethnolinguistic fractionalisation (Alesina et al.,
2003). Lastly, I include the log of average aid inflows as a share of GNI. The effect of aid on corruption is
unclear a priori. While aid programmes may contribute to establishing better institutions, lowering
corruption, the disbursement of aid ‘rents’ may also generate new opportunities for rent-seeking and
corruption (Auty, 2006). A more detailed description of the variables and data sources is provided in
Appendix III. Additional controls that are excluded from the baseline specification due to limited degrees
of freedom are presented in section 5.
3.2 Historical Data
𝑆𝑂𝐶𝑖 is the number of years that country i spent under a Soviet-style communist regime (divided
by 100). The variable, reported in Table 1, is constructed using data from the CIA Factbook. In the group
of 29 post-socialist countries displayed in Figure 1, the mean and standard deviation of 𝑆𝑂𝐶𝑖 are,
respectively, 53.6 and 10.9. In the full sample used in the empirical analysis, the standard deviation
increases from 10.9 to 27.3, allowing for greater variation.
Coding 𝑂𝑇𝑇𝑂𝑖 presents additional challenges, reflecting the vicissitudes of Ottoman conquest
and control. Originating in central Anatolia, the Ottoman Empire had expanded rapidly towards Europe
since the second half of the 14th century. By 1505, the Constantinople ruled over most of South-Eastern
Europe and the Balkans, in addition to Crimea, Southern Ukraine and parts of Southern Russia. In the
course of the 16th century, Ottoman sultans embarked on a large-scale Eastern expansion, bringing most
of the Levant, the Red Sea coast of the Arabian Peninsula and parts of North Africa under their rule. The
territorial reach of the Empire, however, expanded and contracted multiple times. As such, former
Ottoman borders might cut through present-day countries, and different regions of present-day countries

13
might have been subject to Ottoman rule for different lengths of time. While Ottoman suzerainty in the
northern Serbian region of Vojvodina ended in 1716, for instance, a semi-autonomous Principality of
Serbia was not established until 1829 (Brown, 1996). Still, the new state could only claim control over
what is now Central Serbia. The Niš region in the south was not wrenched from Ottoman control until
Serbia gained full independence in the wake of the 1878 Russo-Turkish war (Palairet, 1997: 173). In fact,
the Sandžak of Novi Pazar (a small Muslim-majority region currently shared between Serbia and
Montenegro) was not annexed until the first Balkan War (1912-13).12
As Dimitrova-Grajzl acknowledges, ‘it is difficult to incorporate the process of border changes
with respect to particular parts within states (as opposed to focusing on whole states)’ (2007: 545). Yet,
she attempts to do so for one of the most important cleft countries, namely Romania13
, coding different
durations of rule for the regions of Wallachia, Moldavia and Transylvania, the latter of which was
annexed by the Habsburg Empire as early as 1690, some 190 years before Romania’s independence from
Constantinople.
Replicating this exercise across the other cleft countries (most of which have a history of border
changes which is not nearly as clear-cut as Romania’s) would require making countless assumptions.
Thus, in constructing estimates for the length of Ottoman rule, I elect to proxy the duration of rule by the
number of years that elapsed between the first Ottoman conquest of a substantial portion of the present-
day territory and the time when the Ottomans abandoned the last (substantial) portion of a present-day
country. In constructing the estimates, I take ‘substantial’ to mean (approximately) one quarter of the
present-day territory.14
Whenever possible, I rely on the same historical and cartographic sources used by
Dimitrova-Grajzl (Brown, 1996; O’Brien, 2007). To complement these sources, I also obtain information
on historical borders from the GeaCron Project, a comprehensive online historical atlas.
While admittedly imperfect, this approach has considerable advantages. First, by taking one
quarter of the present-day territory as the threshold of effective rule over a country, I avoid having to
make the many additional (and arbitrary) assumptions necessary to account for sub-national border
movements, given the lack of detailed historical GIS data and the potential conflict between different
historical sources. Second, the 18 cleft countries make up just over 28 percent of the total sample. In the
cleft countries located in MENA, most of the territory that was never conquered by the Ottomans consists
of sparsely populated desert regions (e.g. southern Libya and Algeria; Eastern Jordan and Western Iraq).
Throughout the time periods implied by my estimates the Ottomans controlled the territories where the
overwhelming majority of the present-day (and, ostensibly, the historical) population resides. Since
populations are the carriers of institutional legacies, this particular source of measurement error is
unlikely to significantly bias the parameter estimates in my regressions. In Eastern Europe, the only
important cleft countries are Romania and Serbia. Croatia, Ukraine and Greece, though technically cleft,
12
In my sample, Kosovo is treated as a separate country. Given the relatively small size of the Sandžak region, the
data sources used in the data construction exercise typically take 1829 or 1878 as the end of Ottoman rule in Serbia. 13
And Bosnia. 14
Thus, for instance, since the Sandžak region amounts to a very small portion of present-day Serbia, I consider
1878 (rather than 1913) as the last year of Ottoman rule in Serbia.

14
were for the most part either fully outside the Ottoman sphere of influence (Croatia, Ukraine) or fully
under its grip (Greece) for most of the period running from 1371 to the First World War.15
Even so, treating the cleft countries as if they had been fully under Ottoman control throughout
the period implied by the estimates introduces measurement error. This measurement error is non-
classical (non-random) insofar as it affects the cleft countries systematically more than the ‘non-cleft’
countries. This raises the possibility that the OLS (or WLS) parameters may be subject to (compounded)
attenuation bias (see Nunn, 2008: 169-170 for a formal derivation). To allay this concern, I show that my
results are robust to excluding all (or sub-sets of) the cleft countries from my sample. In addition, I use
the geographical distance from Constantinople to instrument for the length of Ottoman rule. The IV
estimates of the Ottoman legacy are, as expected, larger but qualitatively consistent with the
corresponding WLS.
In my approach to data construction, I also reject Dimitrova-Grajzl’s time-discounting scheme,
which assigns half as much importance to years of Ottoman control prior to 1700. This is supposed to
‘reflect the view of historians […] that the main legacy of the Ottoman Empire came from the latter
period rather than from the initial years when the Ottomans were establishing power in Europe’ (2007:
545). Instead of imposing a (potentially arbitrary) time-discounting scheme, I leave 𝑂𝑇𝑇𝑂𝑖 and 𝑆𝑂𝐶𝑖
undiscounted and I subsequently perform a sensitivity analysis to examine the extent to which the
estimated parameters depend on prior assumptions about the magnitude of historical ‘decay’. The results
are qualitatively robust across a wide range of assumptions. The estimates of the duration of Ottoman and
socialist rule for the countries included in my sample are displayed in Table 1.
3.3 Estimation Issues
In line with the existing empirical literature, I assume that the timing and location of Ottoman
conquest and defeat is exogenous to economic and institutional outcomes. Although the Ottoman state
had a well-developed navy, it never employed its naval capabilities in geographical exploration efforts or
long-distance overseas voyages (Inalcik, 1978). As such, it is unlikely that Ottoman leaders might
deliberately have selected regions with favourable institutional or factor endowments, conquering them
first and giving them up last. In this sense, Ottoman expansionism differed qualitatively from European
colonial ventures, which pitted European powers against each other in a scramble for the best territories
(Feyrer and Sacerdote, 2009). Similarly, the timing of communist and anti-communist revolutions in
Eastern Europe and Central Asia is largely the product of exogenous shocks (Beck and Laeven, 2006:
159). The communist take-overs took place in the wake of the two World Wars. The anti-communist
uprisings of 1989-1990 coincided with the end of the Cold War era. In any case, instrumenting for 𝑂𝑇𝑇𝑂𝑖
(besides accounting for any endogeneity bias resulting from measurement error) allows me to also
address the possibility that the estimates may reflect the impact of omitted determinants. In my baseline
regressions, I also assume that contemporaneous income is exogenous to corruption. Still, the findings are
qualitatively consistent with a 2SLS specification that relaxes the exogeneity assumption by
instrumenting for income
15
The 1821-32 Greek War of Independence led to the liberalization of about half the territory of modern Greece.

15
TABLE 1: Ottoman and Socialist Rule
i 𝑆𝑂𝐶𝑖 Period(s) of Ottoman Rule 𝑂𝑇𝑇𝑂𝑖 i 𝑆𝑂𝐶𝑖 Period(s) of Ottoman Rule 𝑂𝑇𝑇𝑂𝑖
Turkey 0 1350-1923 5.73 Hungary 0.40 1526-1699 1.73
Macedonia 0.46 1371-1913 5.42 Croatia* 0.48 1527-1691 1.64
Greece* 0 1372-1912 5.40 Yemen* 0.20 1518-1636; 1873-1919 1.64
Kosovo 0.47 1390-1912 5.22 Oman* 0 1660-1742 0.82
Montenegro 0.47 1390-1879 4.89 UAE* 0.72 1660-1742 0.82
Serbia* 0.47 1390-1879 4.89 Sudan* 0 1820-1882 0.62
Bulgaria 0.45 1395-1878 4.83 Eritrea* 0.17 1847-1882 0.35
Albania 0.46 1468-1912 4.44 Afghanistan 0.10 0
Romania* 0.42 1476-1878 4.02 Armenia 0.69 0
Israel 0 1518-1918 4.00 Azerbaijan 0.69 0
Jordan 0 1518-1918 4.00 Belarus 0.69 0
Lebanon 0 1518-1918 4.00 Czech Republic 0.41 0
Syria 0 1518-1918 4.00 Estonia 0.51 0
Saudi Arabia* 0 1517-1916 3.99 Ethiopia 0.17 0
Bosnia 0.49 1482-1878 3.96 Kazakhstan 0.55 0
Iraq* 0 1534-1918 3.84 Kyrgyzstan 0.55 0
Libya* 0 1544-1911 3.67 Latvia 0.46 0
Egypt* 0 1517-1882 3.65 Lithuania 0.50 0
Kuwait* 0 1536-1623; 1638-1898 3.47 Poland 0.45 0
Algeria* 0 1516-1830 3.14 Russia 0.74 0
Moldova 0.51 1504-1812 3.08 Slovak Republic 0.41 0
Cyprus 0 1571-1878 3.07 Slovenia 0.46 0
Tunisia* 0 1575-1881 3.06 Tajikistan 0.62 0
Ukraine* 0 1476-1774 2.98 Turkmenistan 0.66 0
Georgia* 0.69 1575-1829 2.54 Uzbekistan 0.67 0 Sources: author's calculations based on data from Brown, 1996; O'Brien, 2007; and the GeaCron Project (http://geacron.com/). The cleft countries are marked with
an asterisk. The research and coding was done jointly with Can Cinar (University of Otago). The computation of 𝑂𝑇𝑇𝑂𝑖 assumes that Ottoman rule began and
ended midway through the reported year. If so, the length can be computed by subtracting the year marking the beginning of rule from the year marking the end.

16
Following Treisman (2000: 416), my baseline estimates of equation (5) use Weighted Least
Squares (WLS) – a strategy which seeks to address the fact that the dependent variable is measured with
error.16
Each observation is weighted by the inverse of the variance of corruption ratings for each
country.17
The WLS estimator places greater emphasis on those observations that are based on more
reliable corruption data, producing more efficient estimates. Still, my substantive results do not depend
critically on the choice of WLS over standard OLS.
4. EMPIRICAL RESULTS
4.1 WLS Estimates
The baseline estimates of eq. (1) are presented in Table 2. Model 1 regresses average corruption
levels during 2000-7 on the historical legacy variables alone. Both 𝑂𝑇𝑇𝑂𝑖 and 𝑆𝑂𝐶𝑖 enter positive, as
expected, but are not statistically significant at conventional levels. The estimated coefficients, however,
do not identify a pure corruption effect if historical legacies also influence contemporary corruption
indirectly through other plausible routes, e.g. by affecting contemporary economic development.18
Regarding 𝑂𝑇𝑇𝑂𝑖, a statistically insignificant estimate may result if the total legacy effect is the mix of
two opposite influences: an adverse direct effect on corruption, and a beneficial indirect effect through
economic development. The latter may result because MENA countries are overrepresented in the
sample, and for these countries, unlike for European countries, the Ottoman legacy may have had a
positive impact on development. If so, omitting GDP from the regression biases the estimate of �̂�
downwards. By contrast, omitting GDP is not expected to substantially bias the estimated effect of
socialism ( �̂�). A more detailed discussion of the economic legacy of Ottoman and socialist rule, and the
consequences of omitting GDP, is presented in Appendix IV. In any case, given the theory and the large
body of evidence on the close relation between corruption and development, a model that assumes
income to have no effect on corruption is likely to be seriously misspecified.
Model 2 includes all the three main variables of interest: 𝑂𝑇𝑇𝑂𝑖 and 𝑆𝑂𝐶𝑖 and GDP per capita.
As expected, conditioning on income significantly increases the magnitude of the estimated effect of
Ottoman rule, whereas the estimated effect of socialism remains unchanged, but gains statistical
significance.19
Column 3 reports a more extensively specified model that controls for other potential
determinants of corruption, based on the discussion in section 2, while models 4 and 5 enter 𝑂𝑇𝑇𝑂𝑖 and
𝑆𝑂𝐶𝑖 individually, as in previous studies of Ottoman (Dimitrova-Grajzl, 2007; Grosjean, 2011) and
socialist legacies (Beck and Laeven, 2005).
Even when 𝑂𝑇𝑇𝑂𝑖 and 𝑆𝑂𝐶𝑖 are entered simultaneously (models 2-3), however, neither �̂� nor �̂�
loses statistical significance. In addition, all models indicate a strong negative association between per-
16
The 2SLS regressions that follow employ analytical weights to the same effect. 17
The variances are obtained by squaring the observations’ standard errors, which are provided by the World Bank,
and averaging over 2000-7. 18
Additionally, Ottoman rule might be expected to have increased ethno-religious fractionalisation. 19
A cross-model Wald test cannot reject the null that the coefficients on 𝑆𝑂𝐶𝑖 are equal to each other (p-value =
0.948). The cross-model equality of the coefficients on 𝑂𝑇𝑇𝑂𝑖 is marginally rejected at the 10% level (p-value =
0.109).
17
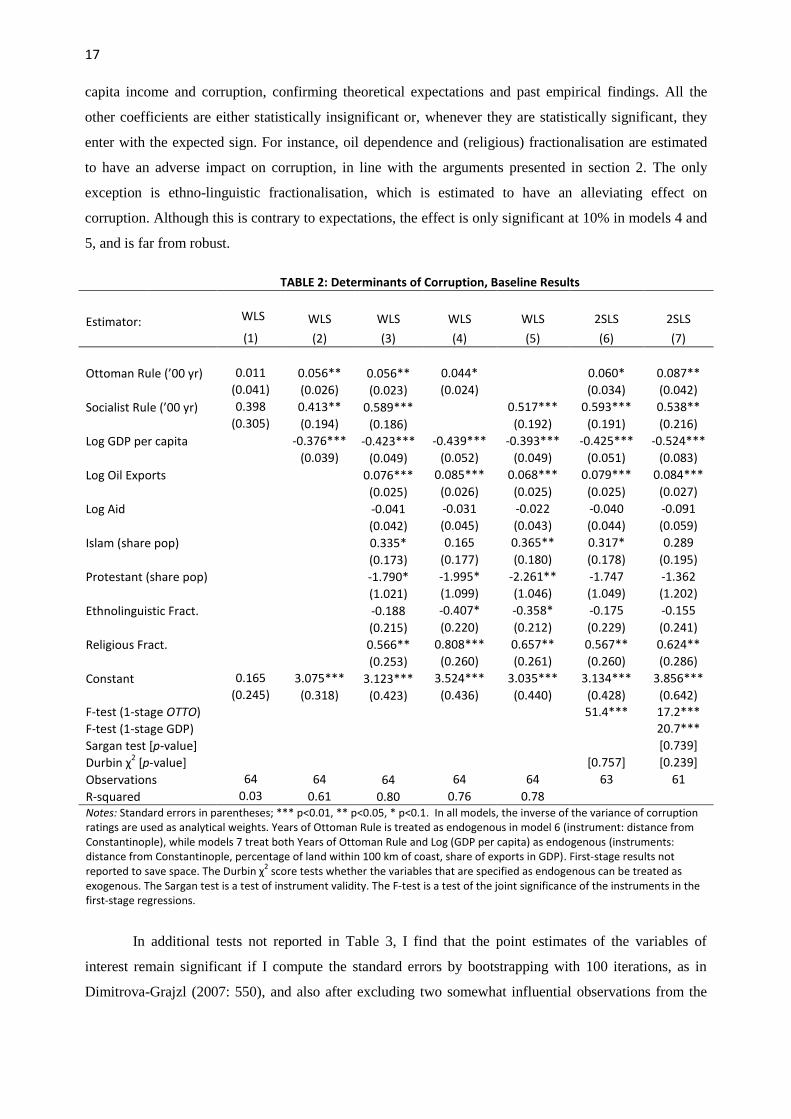
capita income and corruption, confirming theoretical expectations and past empirical findings. All the
other coefficients are either statistically insignificant or, whenever they are statistically significant, they
enter with the expected sign. For instance, oil dependence and (religious) fractionalisation are estimated
to have an adverse impact on corruption, in line with the arguments presented in section 2. The only
exception is ethno-linguistic fractionalisation, which is estimated to have an alleviating effect on
corruption. Although this is contrary to expectations, the effect is only significant at 10% in models 4 and
5, and is far from robust.
TABLE 2: Determinants of Corruption, Baseline Results
Estimator: WLS WLS WLS WLS WLS 2SLS 2SLS
(1) (2) (3) (4) (5) (6) (7)
Ottoman Rule (’00 yr) 0.011 0.056** 0.056** 0.044* 0.060* 0.087**
(0.041) (0.026) (0.023) (0.024) (0.034) (0.042)
Socialist Rule (’00 yr) 0.398 0.413** 0.589*** 0.517*** 0.593*** 0.538**
(0.305) (0.194) (0.186) (0.192) (0.191) (0.216)
Log GDP per capita -0.376*** -0.423*** -0.439*** -0.393*** -0.425*** -0.524***
(0.039) (0.049) (0.052) (0.049) (0.051) (0.083)
Log Oil Exports 0.076*** 0.085*** 0.068*** 0.079*** 0.084***
(0.025) (0.026) (0.025) (0.025) (0.027)
Log Aid -0.041 -0.031 -0.022 -0.040 -0.091
(0.042) (0.045) (0.043) (0.044) (0.059)
Islam (share pop) 0.335* 0.165 0.365** 0.317* 0.289
(0.173) (0.177) (0.180) (0.178) (0.195)
Protestant (share pop) -1.790* -1.995* -2.261** -1.747 -1.362
(1.021) (1.099) (1.046) (1.049) (1.202)
Ethnolinguistic Fract. -0.188 -0.407* -0.358* -0.175 -0.155
(0.215) (0.220) (0.212) (0.229) (0.241)
Religious Fract. 0.566** 0.808*** 0.657** 0.567** 0.624**
(0.253) (0.260) (0.261) (0.260) (0.286)
Constant 0.165 3.075*** 3.123*** 3.524*** 3.035*** 3.134*** 3.856***
(0.245) (0.318) (0.423) (0.436) (0.440) (0.428) (0.642)
F-test (1-stage OTTO) 51.4*** 17.2***
F-test (1-stage GDP) 20.7***
Sargan test [p-value] [0.739]
Durbin χ2 [p-value] [0.757] [0.239]
Observations 64 64 64 64 64 63 61
R-squared 0.03 0.61 0.80 0.76 0.78 Notes: Standard errors in parentheses; *** p<0.01, ** p<0.05, * p<0.1. In all models, the inverse of the variance of corruption ratings are used as analytical weights. Years of Ottoman Rule is treated as endogenous in model 6 (instrument: distance from Constantinople), while models 7 treat both Years of Ottoman Rule and Log (GDP per capita) as endogenous (instruments: distance from Constantinople, percentage of land within 100 km of coast, share of exports in GDP). First-stage results not reported to save space. The Durbin χ
2 score tests whether the variables that are specified as endogenous can be treated as
exogenous. The Sargan test is a test of instrument validity. The F-test is a test of the joint significance of the instruments in the first-stage regressions.
In additional tests not reported in Table 3, I find that the point estimates of the variables of
interest remain significant if I compute the standard errors by bootstrapping with 100 iterations, as in
Dimitrova-Grajzl (2007: 550), and also after excluding two somewhat influential observations from the

18
sample (Chad and Hungary).20
The unweighted OLS estimates of the extensive specification (not
reported) are all within about 13 percent of the WLS estimates reported in column 3.
4.2 IV Regressions
A potential concern with the WLS estimates of the income effect is that they might reflect the
potential effect of corruption on economic growth (Mauro, 1995), or the influence of omitted
confounders. While the former would inflate the OLS estimates, the latter may bias the estimates in either
direction.21
At the same time, the historical duration of Ottoman rule is measured with error, leading to
potential attenuation. To address these concerns, I also run instrumental-variable (2SLS) regressions.22
Model 6 instruments for the length of Ottoman rule using the present-day country’s geographical
distance from Constantinople (see Appendix III for details). The Ottoman Empire was a regional power
whose expansionary ambitions were largely limited to its neighbouring territories (Inalcik, 1978).
Accordingly, the duration of Ottoman rule in a given country is highly negatively correlated with its
distance from Istanbul (coeff. = -0.66).23
The identifying assumption for instrument validity is that
(conditional on the other regressors) the distance from Constantinople has no independent impact on
corruption beyond its effects working through the duration of Ottoman rule.24
I contend that this
assumption is plausible, and a statistically insignificant Sargan test statistic (model 7) is consistent with
this interpretation. Yet, a justified concern might be that geographical remoteness might influence not just
the length of Ottoman rule, but also its quality. Local elites in far-flung provinces may be more difficult
to monitor and control, leading to a higher scale of corruption.25
For this reason, the results should be
interpreted with caution. Bearing this in mind, treating 𝑂𝑇𝑇𝑂𝑖 as endogenous produces estimates of the
effect of Ottoman rule that are only about 7 percent higher than the corresponding WLS coefficients
(model 3), suggesting that measurement error may not be a significant cause of attenuation.
To isolate an exogenous component of economic development, model 7 also instruments for GDP
using the fraction of a country’s land within 100 km from an ice-free coast (as in Angeles and Neanidis,
2015), and the (lagged) share of export revenues in total GDP. Coastal proximity (coeff. = 0.50) and
export orientation (coeff. = 0.42) are highly correlated with income. Coastal proximity influences a
country’s climate, which, in turn, has been argued to affect agricultural productivity and the disease
environment (Mellinger et al., 2000). Export orientation has long been known to promote economic
growth (Balassa, 1978). Conditional on the other second-stage regressors, these two instruments should
20
Influential observations are defined as those that exert more than twice the average leverage. 21 For instance, democratization may both increase per-capita income and reduce corruption, leading to an upward
bias in the OLS estimates. However, if democratisation stimulates economic growth but leads to higher corruption in
the short-run (Mohtadi and Roe, 2003; Rock, 2009), the OLS estimator is biased towards zero. 22
To address the poor finite-sample properties of 2SLS, I employ a variance estimator that makes a degrees-of-
freedom adjustment (Cameron and Trivedi, 2005: 102). 23
Distance alone explains some 44 percent of the total variation in length of rule in the full sample and 58 percent in
a sub-sample of 31Ottoman successor states. 24
Additionally, the instrument is unlikely to be correlated with the (non-classical) measurement error subsumed in
the second-stage error term, as being a cleft country is only weakly related to the distance from Constantinople. 25
Still, the balance of historical evidence supports the view that, in the 18th
century at least, all provinces of the
Empire (including those close to Constantinople, e.g. Anatolia, Thrace and Bulgaria) were run by local notables
turned warlords who collected illegal levies and held back most taxes formally owed to the central government
(Inalcik and Quataert, 1994: 658-77).

19
only be expected to influence corruption through their effect on economic development. Barring an
implausible theory of geo-climatic determinism, coastal proximity should have no direct impact on
corruption (Lewis and Wigen, 1997). While exposure to imports may undermine the rents of domestic
producers, thereby mitigating corruption and rent-seeking (Ades and Di Tella, 1999), there is no reason to
expect export orientation to have an analogous effect.26
In the first-stage (note reported), all the instruments, enter with the expected sign and significance
level, with an F-statistic of joint significance greater than 10. In this specification, the coefficient on
𝑂𝑇𝑇𝑂𝑖 increases quite substantially (55 percent) relative to the corresponding WLS model, but so does
the effect of income (by 24 percent), leaving our substantive conclusions unchanged. The coefficient on
𝑆𝑂𝐶𝑖 is fairly stable throughout. It should be noted, though, that a Durbin χ2 test cannot reject the null that
the specified endogenous regressors may be treated as exogenous. If so, the gain in reliability from using
2SLS may not be worth the associated loss of precision.
4.3 Interpretation of the Results
Taken together, the results reported in Table 2 provide convincing evidence that the incidence of
corruption in transition economies may be influenced both by the recent legacies of socialism and by the
legacies of the more distant past. The statistical and economic significance of �̂� and �̂� imply that the
institutional routines established under Ottoman and socialist rule had an adverse impact on corruption,
and that these routines have persisted over time, leaving a ‘trace’ that is observable in the relative
incidence of corruption across countries today. While it is certainly plausible that ‘developments during
the socialist period […] were affected by the culture [and institutions] formed by the Ottoman/Habsburg
legacies’ (Dimitrova-Grajzl, 2007: 548), our findings suggest that socialist rule left an additional,
independent mark on corruption over and above the effect of pre-socialist legacies. The findings are
consistent with the explanation that socialist rule increased corruption by further promoting elite
entrenchment, though this explanation cannot be tested directly using my data. Overall, the results lend
credence to both the main rival explanations of post-socialist corruption advanced in the transition
literature. The role of socialism and Ottoman history should be seen as complementary elements of an
account of post-socialist corruption.27
The magnitude of the socialist legacy effect, however, is 6-10 times larger than the Ottoman
legacy effect. This result is consistent with the proposition that historically established routines have a
tendency to ‘decay’ over time. Since Ottoman rule preceded socialism, ‘decay’ implies that the legacy
effect today of an additional year of Ottoman rule should be smaller than the effect of one additional year
of socialist rule, all else equal. Still, the relative magnitude of the estimated coefficients may be
26 In the sample, coastal proximity and export orientation are almost exactly orthogonal (coeff = -0.004). Coastal
proximity is also unrelated to import dependence (coeff = -0.028), which might have an alleviating effect on
corruption independently of economic growth (Ades and Di Tella, 1999). In any case, including the share of imports
in GDP as an additional control in the second-stage regression does not significantly alter the 2SLS estimates
(results available upon request). 27
In addition, there is no evidence of an interaction effect between them – that is, there is no evidence that the
Ottoman legacy on corruption was itself exacerbated by socialist rule (the results of the interaction model are
available upon request).

20
reconciled with alternative explanations (see Appendix I). A larger effect associated with the socialist
legacy, for instance, may result from socialism having a more detrimental ‘impact’ shock on corruption
than Ottoman rule. It is not possible to distinguish between these alternative mechanisms using our data.
Regardless of their relative magnitude, the estimated effects indicate that history can be a
‘burden’ for subsequent institutional change. Economic development, I argued, generates new incentives
and opportunities to entrench the rule of law and weed out corruption, as evidenced by richer countries
being less ‘corrupt’. Still, all else equal, countries with more unfavourable historical legacies tend to
remain relatively more ‘corrupt’ even as they develop economically – although, of course, their
‘disadvantage’ might be progressively eliminated if historically inherited routines decay and, eventually,
disappear, leaving more room for other influences to play out.
FIGURE 2: Partial Correlation Plots: Years of Ottoman Rule, Years of Socialist Rule, Log(GDP
per capita)
Afghanistan
Albania
Algeria
Armenia
AzerbaijanBahrain
Bangladesh
Belarus
Bhutan
Bosnia
Bulgaria
Chad
Croatia
Cyprus South
Czech Republic
Djibouti
Egypt
Eritrea
Estonia
EthiopiaGeorgia
Greece
HungaryIndia
Iran
Iraq
Israel/Palestine
Jordan
KazakhstanKosovo
Kuwait
Kyrgyzstan
LatviaLebanon
Libya
Lithuania
Macedonia
Mali
Mauritania
Moldova
Montenegro
Morocco Nepal
Niger
Oman
Pakistan
Poland
Qatar
RomaniaRussia
Saudi Arabia
Serbia
Slovak Republic
Slovenia
Sudan
Syria
Tajikistan
Tunisia
Turkey
Turkmenistan
Ukraine
United Arab EmiratesUzbekistan
Yemen
-1-.
50
.51
e(C
orr
up
tion
| X
)
-3.5 0 3.5e(Years of Ottoman Rule | X)
Post-socialist countries (red line): coeff = 0.049, t-stat = 2.09, R2 = 0.12
Full Sample (blue line): coeff = 0.056, t-stat = 2.61, R2 = 0.10

21
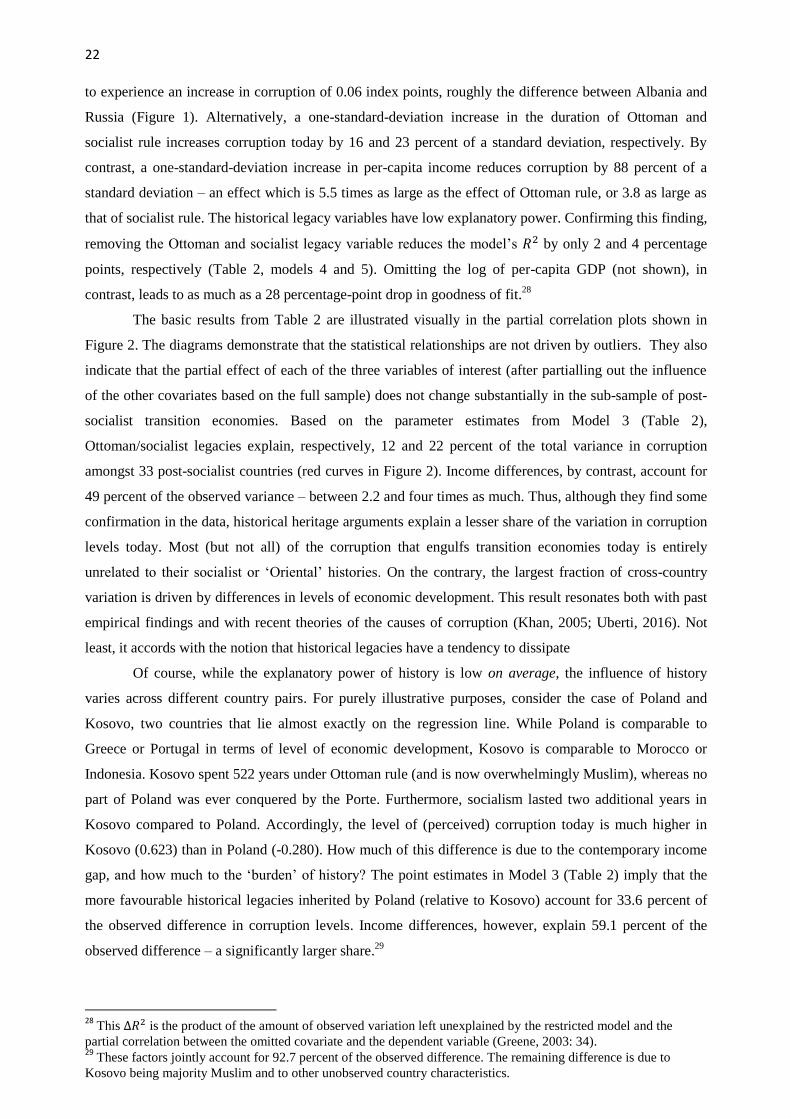
Notes: all plots are based on Model (3) in Table 3. The diagrams plot the residuals obtained from regressing
the outcome (corruption) and the variate of interest (e.g. ln GDP per capita) on all the other covariates (X).
Although statistically significant, the overall contribution of historical legacies to present-day
corruption is, however, not very large. Based on the estimates of model 3 (Table 2), it takes about 100
additional years of Ottoman domination, or 10 additional years of socialist rule, for present-day countries
Afghanistan
Albania
Algeria
Armenia
Azerbaijan
Bahrain
Bangladesh
Belarus
Bhutan
Bosnia
Bulgaria
ChadCroatia
Cyprus South
Czech Republic
Djibouti
Egypt
Eritrea
Estonia
Ethiopia
Georgia
Greece
Hungary
India
Iran
Iraq
Israel/Palestine Jordan
Kazakhstan
Kosovo
Kuwait
Kyrgyzstan
Latvia
Lebanon
Libya
Lithuania
Macedonia
Mali
Mauritania
Moldova
Montenegro
Morocco
NepalNiger
Oman
Pakistan PolandQatar Romania
Russia
Saudi Arabia
Serbia
Slovak Republic
Slovenia
Sudan
Syria
Tajikistan
Tunisia
Turkey
Turkmenistan
Ukraine
United Arab Emirates
Uzbekistan
Yemen
-1-.
50
.51
e(C
orr
up
tion
| X
)
-.5 0 .5e(Years of Socialist Rule | X)
Post-socialist countries (red line): coeff = 0.823, t-stat = 2.97, R2 = 0.22
Full Sample (blue line): coeff = 0.589, t-stat = 3.39, R2 = 0.16;
Afghanistan
Albania
Algeria
Armenia
Azerbaijan
Bahrain
Bangladesh
Belarus
Bhutan
Bosnia
Bulgaria
Chad
Croatia
Cyprus South
Czech Republic
Djibouti
Egypt
Eritrea
Estonia
Ethiopia
Georgia
Greece
Hungary
India
Iran
Iraq
Israel/Palestine
Jordan
Kazakhstan
Kosovo
Kuwait
Kyrgyzstan
Latvia
Lebanon
Libya
Lithuania
MacedoniaMali
Mauritania
Moldova
Montenegro
Morocco
Nepal
Niger
Oman
Pakistan
Poland
Qatar
RomaniaRussia
Saudi Arabia
Serbia
Slovak Republic
Slovenia
Sudan
Syria
Tajikistan
Tunisia
Turkey
TurkmenistanUkraine
United Arab Emirates
UzbekistanYemen
-1-.
50
.51
e(C
orr
up
tion
| X
)
-3.5 0 3.5e(Log (GDP per capita) | X)
Post-socialist countries (red line): coeff = -0.342, t-stat = -5.40, R2 = 0.49
Full Sample (blue line): coeff = -0.423, t-stat = -9.29, R2 = 0.58
22
to experience an increase in corruption of 0.06 index points, roughly the difference between Albania and
Russia (Figure 1). Alternatively, a one-standard-deviation increase in the duration of Ottoman and
socialist rule increases corruption today by 16 and 23 percent of a standard deviation, respectively. By
contrast, a one-standard-deviation increase in per-capita income reduces corruption by 88 percent of a
standard deviation – an effect which is 5.5 times as large as the effect of Ottoman rule, or 3.8 as large as
that of socialist rule. The historical legacy variables have low explanatory power. Confirming this finding,
removing the Ottoman and socialist legacy variable reduces the model’s 𝑅2 by only 2 and 4 percentage
points, respectively (Table 2, models 4 and 5). Omitting the log of per-capita GDP (not shown), in
contrast, leads to as much as a 28 percentage-point drop in goodness of fit.28
The basic results from Table 2 are illustrated visually in the partial correlation plots shown in
Figure 2. The diagrams demonstrate that the statistical relationships are not driven by outliers. They also
indicate that the partial effect of each of the three variables of interest (after partialling out the influence
of the other covariates based on the full sample) does not change substantially in the sub-sample of post-
socialist transition economies. Based on the parameter estimates from Model 3 (Table 2),
Ottoman/socialist legacies explain, respectively, 12 and 22 percent of the total variance in corruption
amongst 33 post-socialist countries (red curves in Figure 2). Income differences, by contrast, account for
49 percent of the observed variance – between 2.2 and four times as much. Thus, although they find some
confirmation in the data, historical heritage arguments explain a lesser share of the variation in corruption
levels today. Most (but not all) of the corruption that engulfs transition economies today is entirely
unrelated to their socialist or ‘Oriental’ histories. On the contrary, the largest fraction of cross-country
variation is driven by differences in levels of economic development. This result resonates both with past
empirical findings and with recent theories of the causes of corruption (Khan, 2005; Uberti, 2016). Not
least, it accords with the notion that historical legacies have a tendency to dissipate
Of course, while the explanatory power of history is low on average, the influence of history
varies across different country pairs. For purely illustrative purposes, consider the case of Poland and
Kosovo, two countries that lie almost exactly on the regression line. While Poland is comparable to
Greece or Portugal in terms of level of economic development, Kosovo is comparable to Morocco or
Indonesia. Kosovo spent 522 years under Ottoman rule (and is now overwhelmingly Muslim), whereas no
part of Poland was ever conquered by the Porte. Furthermore, socialism lasted two additional years in
Kosovo compared to Poland. Accordingly, the level of (perceived) corruption today is much higher in
Kosovo (0.623) than in Poland (-0.280). How much of this difference is due to the contemporary income
gap, and how much to the ‘burden’ of history? The point estimates in Model 3 (Table 2) imply that the
more favourable historical legacies inherited by Poland (relative to Kosovo) account for 33.6 percent of
the observed difference in corruption levels. Income differences, however, explain 59.1 percent of the
observed difference – a significantly larger share.29
28
This ∆𝑅2 is the product of the amount of observed variation left unexplained by the restricted model and the
partial correlation between the omitted covariate and the dependent variable (Greene, 2003: 34). 29
These factors jointly account for 92.7 percent of the observed difference. The remaining difference is due to
Kosovo being majority Muslim and to other unobserved country characteristics.

23
5. ROBUSTNESS ANALYSIS
To further explore the persistence of historical legacies on corruption, I conduct a number of
robustness tests.30
In Table 3, I test the robustness of my conclusions to alternative operationalisations of
the main variables of interest. Model 1 measures corruption using Transparency International’s
Corruption Perception Index instead of the World Bank’s Control of Corruption indicator.31
Model 2 uses
a simple dummy variable to control for socialist legacies instead of my detailed measure of the length of
socialist rule. Model 3 distinguishes between the socialist regimes of East-Central Europe and those of the
Third World and Central Asia (e.g. Tajikistan, Ethiopia). Model 4 uses a weighted measure of the length
of socialist rule that controls for whether a socialist regime tolerated a modicum of individual freedom
and openness to the West (as per Dimitrova-Grajzl, 2007: 549). Finally, Model 5 uses a PPP-adjusted
measure of GDP, instead of GDP at market-exchange rates. All the evidence presented in Table 3
corroborates my previous findings.
TABLE 3: Robustness Analysis - Alternative Measures of Corruption, Socialism and Income
Dependent Variable: TI WGI WGI WGI WGI
Estimator: OLS WLS WLS WLS WLS
(1) (2) (3) (4) (5)
Ottoman Rule (’00 yr) 0.068** 0.050** 0.049** 0.056** 0.048*
(0.027) (0.024) (0.024) (0.023) (0.025)
Socialist Rule (’00 yr) 0.620*** 0.737***
(0.220) (0.206)
Socialist Dummy 0.242**
(0.108)
Socialist Rule (Europe) 0.734***
(0.231)
Socialist Rule (MENA) 0.449*
(0.235)
Socialist Rule (Weighted) 0.277***
(0.098)
Log GDP per capita, FX$ -0.445*** -0.430*** -0.428*** -0.406***
(0.060) (0.051) (0.049) (0.051)
Log GDP per capita, PPP -0.433***
(0.061)
Control Variables & Constant Yes Yes Yes Yes Yes
Observations 63 64 64 64 64
R-squared 0.73 0.78 0.80 0.79 0.75 Notes: standard errors in parentheses; *** p<0.01, ** p<0.05, * p<0.1. TI stands from Transparency International; WGI stands for Worldwide Governance Indicators. FX$ = current dollars at market exchange rates; PPP = purchasing power parity.
Table 4 explores the robustness of my results to the inclusion of additional controls from the
corruption literature. For ease of comparison, column 1 reprints my baseline WLS model (column 3,
Table 2). Models 2 and 3 condition on other (potentially relevant) exogenous historical characteristics,
30
I conduct these tests using WLS, rather than 2SLS, in order to increase efficiency. 31
Because of missing values in this indicator’s standard errors, I fit the model with OLS rather than WLS.

24
namely the identity of the former European coloniser and EU membership.32
Model 4 controls for the
total number of years of civil and intra-state conflict during 1946-2007, while model 5 includes the share
of import expenditure in total GDP (Ades and Di Tella, 1999). In all cases, the results are qualitatively
unchanged. Of particular interests are the regressions reported in column 6 and 7, which condition on
contemporary institutional and policy characteristics. As mentioned earlier, the transition literature has
suggested that successful progress in democratization and marketization might contribute to containing
corruption; reform laggards, in contrast, tend to remain more ‘corrupt’ (Hellman, 1998; Frydman et al.,
1998; Beck and Laeven, 2006). To incorporate these arguments, models 6 and 7 include a lagged average
(1997-2003) of the Freedom House Index and the Heritage Foundation’s Economic Freedom Index.33
TABLE 4: Robustness Analysis – Additional Controls
(1) (2) (3) (4) (5) (6) (7)
Ottoman Rule (’00 yr) 0.056** 0.052** 0.058** 0.052** 0.054** 0.042* 0.027
(0.023) (0.024) (0.025) (0.023) (0.023) (0.025) (0.024)
Socialist Rule (’00 yr) 0.589*** 0.514* 0.590*** 0.663*** 0.809*** 0.535** 0.402**
(0.186) (0.264) (0.188) (0.211) (0.219) (0.200) (0.190)
Log GDP per capita -0.423*** -0.420*** -0.427*** -0.403*** -0.371*** -0.434*** -0.384***
(0.049) (0.050) (0.052) (0.056) (0.055) (0.050) (0.051)
British Colony -0.096
(0.147)
French Colony 0.009
(0.169)
Italian Colony 0.089
(0.302)
EU 0.041
(0.197)
Log years of conflict 0.017
(0.022)
Imports / GDP (lagged) -0.008**
(0.003)
Democracy (lagged) -0.075
(0.047) Economic Freedom (lagged) -0.012**
(0.005)
Controls & Constant Yes Yes Yes Yes Yes Yes Yes
Observations 64 64 64 64 62 61 58
R-squared 0.80 0.80 0.80 0.80 0.82 0.81 0.84
Adjusted R-squared 0.77 0.76 0.76 0.76 0.78 0.78 0.81 Notes: WLS regressions with standard errors in parentheses; *** p<0.01, ** p<0.05, * p<0.1. The parameters of the other regressors are not reported to save space.
Both variables enter with the expected sign. In fact, the estimated coefficient on 𝑂𝑇𝑇𝑂𝑖 decreases
in magnitude (and significance) when democracy and marketisation are controlled for. Speculatively, this
could suggest that part of the negative long-run impact of Ottoman rule on corruption runs through the
32
I do not code Romania and Bulgaria as EU members since they only joined in 2007. Still, their inclusion does not
alter my results. 33
To avoid spurious correlations, I expunge the corruption and property rights components from the original
Economic Freedom Index. The labour component is expunged to increase the number of years in the average.

25
quality of (contemporary) democracy and economic regulation. As the socialist regimes imploded, the
ruins of pre-socialist institutions re-emerged powerfully, influencing the actual operation of the new
institutions of political pluralism and economic freedom (which in turn had an impact on the scale of
corruption). That said, these models should be interpreted with caution. Perception-based measures of
corruption may be highly correlated with other (semi-contemporaneous) institutional characteristics
simply because they reflect the same underlying perceptions of the institutional environment (Treisman,
2007: 222). Although part of this problem is addressed by lagging and using institutional and corruption
variables from different sources, the possibility of spurious correlation cannot be ruled out completely.
TABLE 5: Robustness Analysis – Sub-samples
Full
sample Without
cleft Post-
socialist Post-
Ottoman Without
belt Europe
(1) (2) (3) (4) (5) (6)
Ottoman Rule (’00 yr) 0.075*** 0.073*** 0.068*** 0.142*** 0.083*** 0.089**
(3.60) (3.07) (3.06) (2.83) (3.28) (2.63)
Socialist Rule (’00 yr) 0.613*** 0.612*** 1.060*** 0.307 0.705*** 0.620***
(3.96) (3.47) (3.01) (1.01) (3.42) (2.76)
Log GDP per capita -0.414*** -0.411*** -0.364*** -0.421*** -0.396*** -0.413***
(13.16) (11.44) (8.85) (6.64) (9.93) (9.22)
Log Oil Exports 0.113*** 0.116*** 0.126*** 0.131*** 0.122*** 0.109***
(6.27) (5.23) (4.91) (3.29) (5.82) (4.58)
Europe -0.065
(0.18)
Europe × Ottoman Rule -0.022
(0.44)
Europe × Socialist Rule 0.173
(0.31)
Other control variables No No No No No No
Observations 64 46 33 31 50 64
Adjusted R-squared 0.75 0.77 0.83 0.62 0.76 0.74 Notes: WLS regressions with t-statistics in parentheses; *** p<0.01, ** p<0.05, * p<0.1. The constant is not reported to save space.
In Table 5, I check the extent to which my results hold in a number of sub-samples. Because
restricting the sample reduces the degrees of freedom, I compare the estimates from the restricted samples
to a more parsimonious model with only oil exports as a control (model 1). Model 2 excludes the cleft
countries, which are known to introduce attenuation bias in the estimates of 𝑂𝑇𝑇𝑂𝑖. Model 3 only
includes post-socialist countries, while model 4 only includes Ottoman successor states. The results are
qualitatively unaltered, the only exception being that socialist legacies do not appear to increase
corruption (at conventionally significant levels) in the post-Ottoman sub-sample. Also, socialist legacies
have a significantly larger impact in a sub-sample of post-socialist countries, in which 𝑆𝑂𝐶𝑖 has less
variance (coeff = 1.060, compared to 0.613 in the full sample). This finding suggests that existing studies
(Beck and Laeven, 2006) might be over-stating the influence of socialist legacies. The results are also
practically unchanged after dropping the ‘belt’ of adjacent countries that never experienced either
Ottoman or socialist rule – though, of course, the estimates are slightly less precise (model 5).
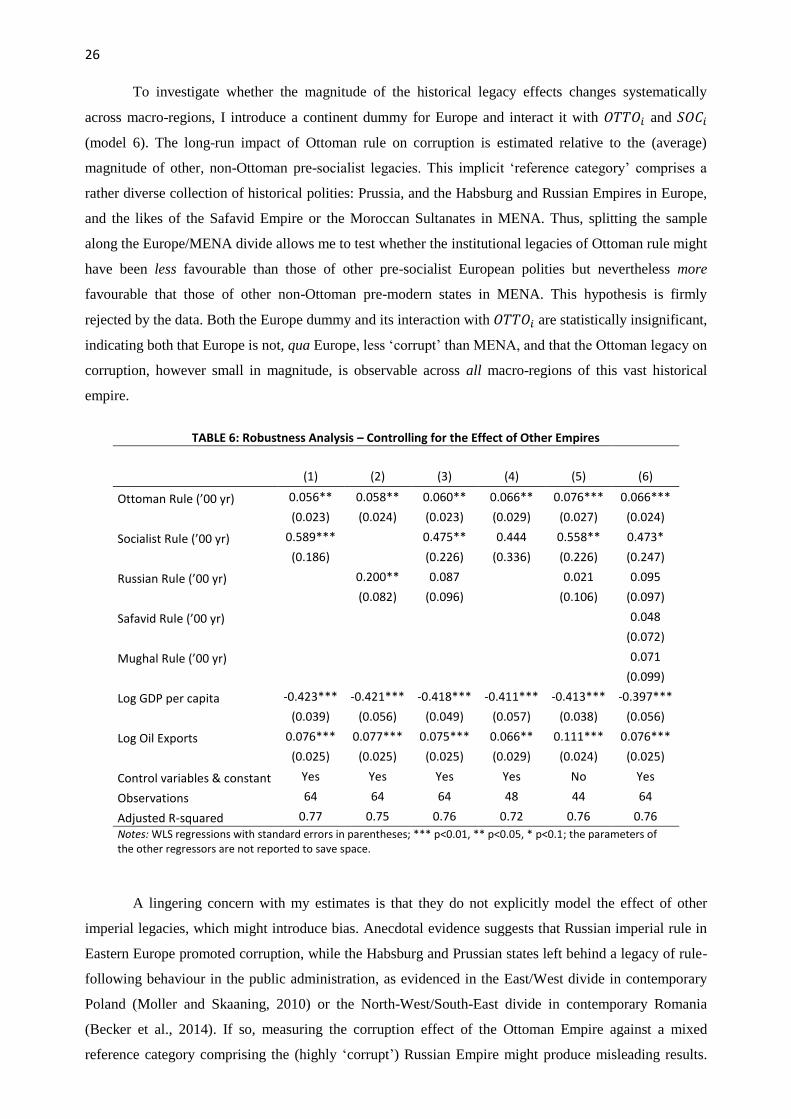
26
To investigate whether the magnitude of the historical legacy effects changes systematically
across macro-regions, I introduce a continent dummy for Europe and interact it with 𝑂𝑇𝑇𝑂𝑖 and 𝑆𝑂𝐶𝑖
(model 6). The long-run impact of Ottoman rule on corruption is estimated relative to the (average)
magnitude of other, non-Ottoman pre-socialist legacies. This implicit ‘reference category’ comprises a
rather diverse collection of historical polities: Prussia, and the Habsburg and Russian Empires in Europe,
and the likes of the Safavid Empire or the Moroccan Sultanates in MENA. Thus, splitting the sample
along the Europe/MENA divide allows me to test whether the institutional legacies of Ottoman rule might
have been less favourable than those of other pre-socialist European polities but nevertheless more
favourable that those of other non-Ottoman pre-modern states in MENA. This hypothesis is firmly
rejected by the data. Both the Europe dummy and its interaction with 𝑂𝑇𝑇𝑂𝑖 are statistically insignificant,
indicating both that Europe is not, qua Europe, less ‘corrupt’ than MENA, and that the Ottoman legacy on
corruption, however small in magnitude, is observable across all macro-regions of this vast historical
empire.
TABLE 6: Robustness Analysis – Controlling for the Effect of Other Empires
(1) (2) (3) (4) (5) (6)
Ottoman Rule (’00 yr) 0.056** 0.058** 0.060** 0.066** 0.076*** 0.066***
(0.023) (0.024) (0.023) (0.029) (0.027) (0.024)
Socialist Rule (’00 yr) 0.589*** 0.475** 0.444 0.558** 0.473*
(0.186) (0.226) (0.336) (0.226) (0.247)
Russian Rule (’00 yr) 0.200** 0.087 0.021 0.095
(0.082) (0.096) (0.106) (0.097)
Safavid Rule (’00 yr) 0.048
(0.072)
Mughal Rule (’00 yr) 0.071
(0.099)
Log GDP per capita -0.423*** -0.421*** -0.418*** -0.411*** -0.413*** -0.397***
(0.039) (0.056) (0.049) (0.057) (0.038) (0.056)
Log Oil Exports 0.076*** 0.077*** 0.075*** 0.066** 0.111*** 0.076***
(0.025) (0.025) (0.025) (0.029) (0.024) (0.025)
Control variables & constant Yes Yes Yes Yes No Yes
Observations 64 64 64 48 44 64
Adjusted R-squared 0.77 0.75 0.76 0.72 0.76 0.76
Notes: WLS regressions with standard errors in parentheses; *** p<0.01, ** p<0.05, * p<0.1; the parameters of the other regressors are not reported to save space.
A lingering concern with my estimates is that they do not explicitly model the effect of other
imperial legacies, which might introduce bias. Anecdotal evidence suggests that Russian imperial rule in
Eastern Europe promoted corruption, while the Habsburg and Prussian states left behind a legacy of rule-
following behaviour in the public administration, as evidenced in the East/West divide in contemporary
Poland (Moller and Skaaning, 2010) or the North-West/South-East divide in contemporary Romania
(Becker et al., 2014). If so, measuring the corruption effect of the Ottoman Empire against a mixed
reference category comprising the (highly ‘corrupt’) Russian Empire might produce misleading results.

27
More worryingly, Russian imperial rule is highly collinear with the incidence of socialist rule, as
countries that were still part of the Russian Empire at the time of the October Revolution (e.g. Ukraine,
Belarus) went communist at the same time as Russia. Thus, my estimate of the corruption effect of
socialism may be spuriously picking up the effect of an earlier historical legacy.
To address these concerns, I construct estimates of the number of years of Russian imperial rule
for my sample countries (see Appendix V). The sources and methodology employed to code this variable
are the same as the ones used to construct 𝑂𝑇𝑇𝑂𝑖. Model 1 in Table 6 reprints my baseline model. As
shown in column 2, the Russian rule variable enters positive and significant in a model that does not
control for the length of socialist rule. Russian rule, however, loses significance when 𝑆𝑂𝐶𝑖 is included
(model 3). As expected, once the effect of Russian domination is factored out, the coefficient on 𝑂𝑇𝑇𝑂𝑖
increases in magnitude (but only by about 7 percent), while the coefficient on 𝑆𝑂𝐶𝑖 decreases by about 19
percent, suggesting that earlier estimates of the effects of socialist rule might also partly reflect the
influence of pre-socialist legacies. Model 4 factors out the impact of Russian imperial legacies by
restricting the sample to countries that were never ruled by the Russian Empire. Reassuringly, the point
estimates are very similar – although, as expected, the standard errors are uniformly larger.
Model 5 excludes the cleft countries (see Appendix V), while model 6 checks for the sensitivity
of the estimates to the choice of reference category on the Eastern flank of the Ottoman borders. The
Safavid and Mughal Empires were two of the most important early-modern empires that ruled parts of the
Middle East and South-Asia during the 16-18th century, often entering into military confrontation with the
Ottoman Empire. Due to their similarities, these three states are sometimes referred to collectively as the
‘gunpowder empires’ (Hodgson, 1977). Controlling for the length of Safavid and Mughal rule (see
Appendix V), however, does not significantly alter my results.
Lastly, I check the sensitivity of my results to incorporating several alternative time-discounting
schemes. As discussed earlier (see also Appendix I), the magnitude of the legacy of an historical event is
a function of: (a) the event’s distance in time; (b) the magnitude of the shock originally imparted by the
event; and (c) the propensity of the ensuing (corruption) routine to persist over time (the time-discount
rate). While (a) can be observed, (b) and (c) are both unobserved, so it is impossible to recover an
estimate of the impact effect and time-discount rate from the regression parameters.
That said, it is instructive to check the sensitivity of the regression results to alternative
assumptions regarding persistence. To do so, I re-estimate my baseline model (model 3, Table 2) using
alternative measures of the duration of Ottoman and socialist rule that discount the contribution of past
years by an exponential factor 𝜂 (see Appendix II for details of how the time-discounted variables are
constructed). The interpretation of 𝜂 is that in any given year only 100 × 𝜂 percent of the corrupt
transactions concluded in the previous year take place again. When 𝜂 = 1, the corruption routines
induced by a given historical shock persist fully into the future. Dimitrova-Grajzl (2007: 545) assumes
(rather plausibly) that the legacy of Ottoman rule halves in size every 301 years (= 2001-1700), which
implies that 𝜂 = exp (ln 0.5 301) =⁄ 0.998.34
Table 7 checks the sensitivity of the estimated parameters
to building 𝑂𝑇𝑇𝑂𝑖 and 𝑆𝑂𝐶𝑖 on different values of 𝜂. Column 1 assumes that 𝜂 = 0. 9̅ ≅ 1 (the results are
34
From 0.5 = 𝜂301, take logs (with base 𝜂), apply the change of base formula, re-arrange and exponentiate.
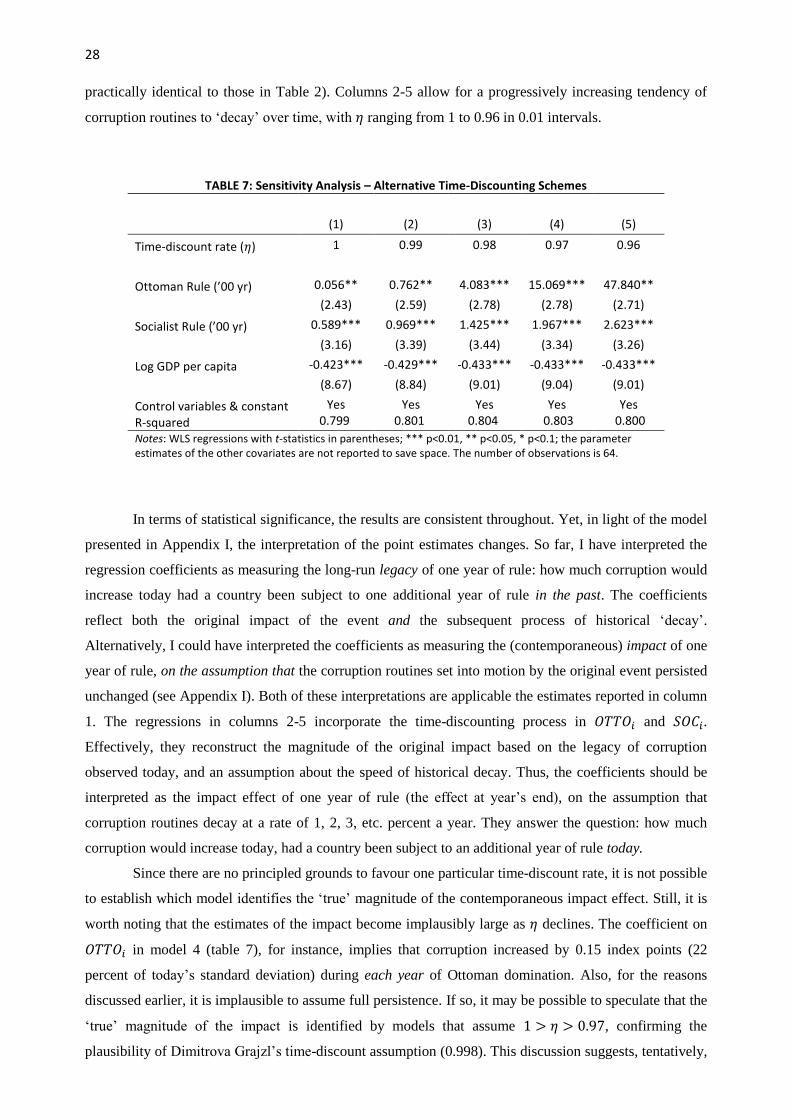
28
practically identical to those in Table 2). Columns 2-5 allow for a progressively increasing tendency of
corruption routines to ‘decay’ over time, with 𝜂 ranging from 1 to 0.96 in 0.01 intervals.
TABLE 7: Sensitivity Analysis – Alternative Time-Discounting Schemes
(1) (2) (3) (4) (5)
Time-discount rate (𝜂) 1 0.99 0.98 0.97 0.96
Ottoman Rule (’00 yr) 0.056** 0.762** 4.083*** 15.069*** 47.840**
(2.43) (2.59) (2.78) (2.78) (2.71)
Socialist Rule (’00 yr) 0.589*** 0.969*** 1.425*** 1.967*** 2.623***
(3.16) (3.39) (3.44) (3.34) (3.26)
Log GDP per capita -0.423*** -0.429*** -0.433*** -0.433*** -0.433***
(8.67) (8.84) (9.01) (9.04) (9.01)
Control variables & constant R-squared
Yes 0.799
Yes 0.801
Yes 0.804
Yes 0.803
Yes 0.800
Notes: WLS regressions with t-statistics in parentheses; *** p<0.01, ** p<0.05, * p<0.1; the parameter estimates of the other covariates are not reported to save space. The number of observations is 64.
In terms of statistical significance, the results are consistent throughout. Yet, in light of the model
presented in Appendix I, the interpretation of the point estimates changes. So far, I have interpreted the
regression coefficients as measuring the long-run legacy of one year of rule: how much corruption would
increase today had a country been subject to one additional year of rule in the past. The coefficients
reflect both the original impact of the event and the subsequent process of historical ‘decay’.
Alternatively, I could have interpreted the coefficients as measuring the (contemporaneous) impact of one
year of rule, on the assumption that the corruption routines set into motion by the original event persisted
unchanged (see Appendix I). Both of these interpretations are applicable the estimates reported in column
1. The regressions in columns 2-5 incorporate the time-discounting process in 𝑂𝑇𝑇𝑂𝑖 and 𝑆𝑂𝐶𝑖.
Effectively, they reconstruct the magnitude of the original impact based on the legacy of corruption
observed today, and an assumption about the speed of historical decay. Thus, the coefficients should be
interpreted as the impact effect of one year of rule (the effect at year’s end), on the assumption that
corruption routines decay at a rate of 1, 2, 3, etc. percent a year. They answer the question: how much
corruption would increase today, had a country been subject to an additional year of rule today.
Since there are no principled grounds to favour one particular time-discount rate, it is not possible
to establish which model identifies the ‘true’ magnitude of the contemporaneous impact effect. Still, it is
worth noting that the estimates of the impact become implausibly large as 𝜂 declines. The coefficient on
𝑂𝑇𝑇𝑂𝑖 in model 4 (table 7), for instance, implies that corruption increased by 0.15 index points (22
percent of today’s standard deviation) during each year of Ottoman domination. Also, for the reasons
discussed earlier, it is implausible to assume full persistence. If so, it may be possible to speculate that the
‘true’ magnitude of the impact is identified by models that assume 1 > 𝜂 > 0.97, confirming the
plausibility of Dimitrova Grajzl’s time-discount assumption (0.998). This discussion suggests, tentatively,

29
that rather than explaining the legacy of imperial/socialist corruption in terms of a large original impact
coupled with fast historical ‘erosion’, it may be more plausible to posit a more modest original shock
coupled with a relatively higher persistence of the fall-out from the shock.
6. CONCLUSION
In institutional economics, there is now a large literature that ‘provides support for the notion that
history can matter [for present-day outcomes] through the evolution and persistence of early institutions’
(Nunn, 2009: 78). The evidence presented in this paper corroborates existing findings in this literature.
Using data from the full population of post-socialist and post-Ottoman polities, I showed that, holding
everything else constant, the countries that experienced socialist or Ottoman rule for a longer period of
time tend to have more corruption today. Although I stop short of offering direct evidence of the
persistence mechanism (or a precise estimate of the rate of persistence), persistence (though less than
‘full’) explains why the adverse effects of Ottoman and socialist rule are still observable in cross-country
data today. In this sense, the debate in the transition literature on the primacy of socialist vs. pre-socialist
legacies on corruption is a moot one. My empirical findings suggest that both socialism and Ottoman rule
had an independent impact on corruption, having facilitated the emergence of corruption routines whose
‘trail’ is still visible today.
Note that the effects of Ottoman and socialist rule identified in this paper represent the ‘direct’
effect of historical events on present-day institutional outcomes, factoring out the influence of
contemporary income levels, amongst others. Of course, Ottoman and socialist rule may also have had a
parallel impact on economic development, which is an important determinant of corruption. Estimating
the total effect of Ottoman and socialist rule on corruption is beyond the scope of this paper. Tentatively,
the evidence presented in Appendix IV suggests that the adverse direct institutional effect might be at
least partially cancelled out by the indirect effect running via economic development. If so, the Ottoman
legacy on corruption would be, on net, zero.
Whether or not Ottoman domination had an independent economic effect, my findings indicate
that the ‘burden’ of history explains but a fraction of the total variation in (perceived) corruption amongst
post-socialist countries. In other words, the magnitude of legacy effects, though statistically significant, is
not economically large. Most cross-country variation in corruption, I find, is due to differences in the
contemporary structural characteristics of a country’s economy, as proxied by income levels and resource
dependence. These results are also robust to controlling for the potential endogeneity of income levels to
corruption.
The results have a number of important theoretical and policy implications. First, they lend
credence to recent theories that see corruption primarily as a manifestation of economic under-
development (Khan, 2005; Uberti, 2014). If income levels are the main drivers of corruption, the best
anti-corruption policies may not be those targeting graft head-on. To some extent, policies that promote
economic growth may also, indirectly, take care of the problem of political corruption. Second, the small
magnitude of historical legacy effects (and the smaller relative size of the legacy effect from an historical

30
event, Ottoman domination, that is further back in time), indicates that historically determined institutions
may not persist entirely unchanged. Rather, they may be subject to a process of slow-moving erosion or
decay. This explanation resonates with accounts that see political institutions as relatively fast-moving, as
compared to cultural norms and values (e.g. adherence to religious beliefs), which tend to change less
frequently, and certainly more slowly, than political institutions (Roland, 2004). It also serves to strike an
optimistic note on the feasibility of implementing anti-corruption policies. While historical legacies
matter, they do not consign countries indefinitely to a state of endemic corruption. Rather, economic and
structural transformation may contribute to reducing corruption even in countries held down by legacies
of predation and warlordism.
Lastly, my account calls for a measure of scepticism about informal explanations of post-socialist
corruption as a legacy of assorted ‘Oriental despotisms’ – including the Ottoman Empire and Soviet-style
socialism. While these regimes did leave an observable ‘trace’ in the institutional endowments of post-
socialist countries, their economic significance as predictors of corruption is dwarfed by economic
structure. Accordingly, accounts of post-socialist transition should resist the essentialising tendency of
certain discourses of ‘Ottoman’ and socialist backwardness (Sulstarova, 2015). To be sure, the legacy of
state socialism and Ottoman domination should be clearly acknowledged. In fact, the results of this study
cast a shadow on historical accounts that either question the impact of Ottoman rule on corruption
(Özbudun, 1996: 135-6) or claim that the Ottoman legacy was quickly overcome and ‘relegated to the
realm of perception’ (Todorova, 1996: 69). The results also cast doubt on the analysis of the Ottoman
political system by early-modern European thinkers, e.g. Machiavelli and Jean Bodin, who ‘praised the
Ottoman military and administrators’ incorruptibility, discipline and obedience’ (Quataert, 2000: 7). The
Ottoman political system did encourage corruption, and this corruption persisted over time. On balance,
however, the corruption observed in post-socialist countries today should be seen primarily (though,
again, not entirely) as a symptom of persistent economic under-development and continuing dependence
on primary commodity exports, rather than a vestige of the past.
Future studies should further elucidate the relative importance of long- and short-run
determinants of corruption across a wider sample of countries. At the same time, more theoretical work
remains to be done to clarify how historical events shape early institutions and how these early routines
are perpetuated and transmitted. The accompanying empirical work should also develop new techniques
to measure institutional persistence and ‘decay’. The social, political and economic diversity that
characterises the post-Ottoman space may offer a fertile ground for further empirical research.
REFERENCES
Acemoglu, D. 1995. Reward Structures and the Allocation of Talent. Europ. Econ. Rev. 39, 17-33
Acemoglu, D., Johnson, S., Robinson, J. 2005. Institutions as a Fundamental Cause of Long-Run Growth,
In: Aghion, P., Durlauf, S. eds. Handbook of Economic Growth. Elsevier, Amsterdam
Acemoglu, D., Hassan, T.A., Robinson, J. A. 2011. Social Structure and Development: A Legacy of the
Holocaust in Russia. Quart. J. Econ. 126, 895-946
Acemoglu, D., Robinson, J. A. 2012. Why Nations Fail: The Origins of Power, Prosperity and Poverty,
Profile Books, London
31
Ades, A., Di Tella, R. 1999. Rents, Competition and Corruption. Am. Econ. Rev. 89 (4), 982-993
Aldashev, G., Guirkinger, C. 2017. Colonization and Changing Social Structure: Evidence from
Kazakhstan. J. Dev. Econ. 127, 413-430
Alesina, A., Giuliano, P. 2015. Culture and Institutions. J. Econ. Lit. 53 (4), 898-944
Alesina, A., Devleschauwer, A., Easterly, W., Kurlat, S., Wacziarg, R. 2003. Fractionalization. J. Econ.
Growth, 8, 155-94
Angeles, L., Neanidis, K. 2015. The Persistent Effect of Colonialism on Corruption. Economica. 82, 319-
49
Auty, R. 2006. Patterns of Rent Extraction and Deployment in Developing Countries: Implications for
Governance, Economic Policy and Performance. UNU-WIDER, Helsinki
Balassa, B. 1978. Exports and Economic Growth: Further Evidence. J. Dev. Econ. 5, 181-90
Bates, R. 2014. The New Institutionalism. In: Sened, I., Galiani, S. eds. Institutions, Property Rights and
Economic Growth: the Legacy of Douglass North, Cambridge University Press, Cambridge
Berglof, E., Bolton, P., 2002. The great divide and beyond: Financial architecture in transition. J. Econ.
Perspect. 16, 77-100
Beck T., Laeven, L. 2005. Institution Building and Growth in Transition Economies, J. Econ. Growth. 11
(2), 157-86
Becker, S. Woessmann, L. 2009. Was Weber Wrong? A Human Capital Theory of Protestant Economic
History. Quart. J. Econ. 124 (2), 531-96
Becker, S., Boeckh, K., Hainz, C., Woessmann, L. 2014. The Empire is Dead, Long Live the Empire!
Long-Run Persistence of Trust and Corruption in the Bureaucracy. Econ. J. 126, 40-74
Bideleux, R., Jeffries, I. 2007. A History of Eastern Europe: Crisis and Change. Routledge, Abingdon
Braguinsky, S. 2009. Postcommunist Oligarchs in Russia: Quantitative Analysis. J. Law Econ. 52, 307-49
Brown, C. ed. 1996. Imperial Legacy: The Ottoman Imprint on the Balkans and the Middle East.
Columbia University Press, New York
Bukowansky, M., 2006. The hollowness of Anti-corruption Discourse. Rev. Intl. Pol Econ. 13 (2), 181-
209
Cameron, C., Trivedi, P. 2005. Microeconometrics: Methods and Applications. Cambridge University
Press, Cambridge
Darden, J., Grzymala-Busse, A. 2006. The Great Divide: Literacy, Nationalism and the Communist
Collapse, World Pol. 59 (1), 83-115
Dimitrova-Grajzl, V. 2007. The Great Divide Revisited: Ottoman and Habsburg Legacies on Transition.
Kyklos. 60 (4), 539-58
Djankov, S., La Porta, R., Lopez-de-Silanes, F., Shleifer, A. 2003. Courts. Quart. J. Econ. 118, 453-517
Easterly, W., Levine, R. 1997. Africa’s Growth Tragedy: Policies and Ethnic Divisions. Quart. J. Econ.
112 (4), 1203-50
Eyal, G., Szelenyi, I., Townsley, E. 2000. Making Capitalism without Capitalists: Class Formation and
Elite Struggles in Post-Communist Central Europe. Verso, London
Feyrer, J., Sacerdote, B. 2009. Colonialism and Modern Income: Islands as Natural Experiments. Rev.
Econ. Stat. 91 (2), 245-62
Frydman, R. Murphy, K., Rapaczynski, A. 1998. Capitalism with a Comrade’s Face: Studies in Post-
Communist Transition. Central European University, Budapest
Greene W.2003. Econometric Analysis. Prentice Hall, Upper Saddle River, NJ
Grosjean, P. 2011. The Institutional Legacy of the Ottoman Empire: Islamic Rule and Financial
Development in South Eastern Europe. J. Comp. Econ. 39, 1-16
Hellman, J. 1998. Winners Take All: The Politics of Partial Reform, World Pols. 50 (2), 203-34
Hodgson, M. 1977. The Venture of Islam. Volume III: The Gunpowder Empires and Modern Times.
University of Chicago Press
Holmes, L. 2013. Postcommunist Transitions and Corruption: Mapping Patterns. Soc. Res. 80 (4), 1163-
87

32
Inalcik, H. 1978. The Ottoman Empire: Conquest, Organization and Economy, Variorum Reprints,
London
Inalcik, H., Quataert, D. 1994. Eds. An Economic and Social History of the Ottoman Empire. Volume
Two 1600-1914. Cambridge University Press, Cambridge
Iyigun, M. 2008. Luther and Suleyman. Quart. J. Econ. 123 (4), 1465-94
Jowitt, K. 1992. New World Disorder: The Leninist Extinction, University of California Press
Kajsiu, B. 2015. A Discourse Analysis of Corruption: Instituting Neoliberalism against Corruption in
Albania, 1998-2005. Routledge, Abingdon
Karaja, E., Rubin, J. 2017. The Cultural Transmission of Trust Norms: Evidence from a Lab in the Field
on a Natural Experiment, unpublished manuscript
Karklins, R. 2005. The System Made me Do it: Corruption in Post-Communist Societies, ME Sharpe,
Armonk, NY
Khan, M. 2005. Markets, States and Democracy: Patron-Client Networks and the Case for Democracy in
Developing Countries. Democrat. 12 (5), 704-24
Kitschelt, H. Accounting for Post-Communist Regime Diversity: What Counts as a Good Cause? In:
Ekiert, G., Hanson, S. eds. Capitalism and Democracy in Central and Eastern Europe: Assessing
the Legacy of Communist Rule. Cambridge University Press, Cambridge
Kitschelt, H., Mansfeldova, Z., Markowski, R., Toka, G. 1999. Post-Communist Party Systems:
Competition, Representation and Inter-Party Cooperation, Cambridge University Press, Cambridge
Kuran, T. 2004. Why the Middle East is Economically Underdeveloped: Historical Mechanisms of
Institutional Stagnation, J. Econ. Perspect. 18 (3), 71-90
Kuran, T. 2010. Economic Underdevelopment in the Middle East: The Historical Roles of Culture,
Institutions and Religion, In: Platteau, J., Peccoud, R. Culture, Institutions and Development: New
Insights into an Old Debate, Routledge
Kuran, T. 2011. The Long Divergence: How Islamic Law Held Back the Middle East. Princeton
University Press, Princeton
Ledeneva, A. 1998. Russia’s Economy of Favours: Blat, Networking and Informal Exchange, Cambridge
University Press, Cambridge
Lewis, M., Wigen, K. 1997. The Myth of Continents. A Critique of Meta-Geography. University of
California Press
Marquette, H. 2003. Corruption, Politics and Development: The Role of the World Bank. Palgrave
Macmillan, Basingstoke
Mauro, P. 1995. Corruption and Growth. Quart. J. Econ. 110 (3), 681-712
Mellinger, A., Sachs, J., Gallup, J. 2000. Climate, Coastal Proximity, and Development. In: Clark, G.,
Feldman, M., Gertler, M. Eds, Oxford Handbook of Economic Geography, Oxford University
Mendelski, M., Libman, A. 2014. Demand for Litigation in the Absence of Traditions of Rule of Law: An
Example of Ottoman and Habsburg Legacies in Romania. Const. Polit. Econ. 25, 177-206
Millar, J. 1985. The Little Deal: Brezhnev’s Contribution to Acquisitive Socialism. Slav. Rev. 44 (4),
694-706
Mohtadi, H., Roe, T. 2003. Democracy, Rent-Seeking, Public Spending and Growth, J. Public Econ. 87,
445-66
Moller J., Skaaning, S. 2010. From Each according to his Need, to Each according to his Ability: A
Comparative Analysis of Post-Communist Corruption, Acta Pol. 45 (3), 320-45
Natkhov, T. 2015. Colonization and Development: The long-Term Effect of Russian Settlement in the
North Caucasus, J. Comp. Econ. 43 (1), 76-97
Nunn, N. 2008. The Long-Term Effects of Africa’s Slave Trades. Quart. J. Econ. 123 (1), 139-76
Nunn, N. 2009. The Importance of History for Economic Development. Annu. Rev. Econ. 1, 65-92
Nunn, N., Puga, D. 2012. Ruggedness: The Blessing of Bad Geography in Africa, Rev. Econ. Stat. 94 (1),
20-36
O’Brien, P. 2007. Philip’s Atlas of World History. Octopus Publishing, London

33
Özbudun, E. 1996. The Ottoman Legacy and the Middle East State Tradition, In: L. C. Brown, ed.
Imperial Legacy
Palairet, M. 1997. The Balkan Economies. c.1800-1914. Cambridge University Press, Cambridge
Parker, P. 1997. National Cultures of the World: A Statistical Reference, Greewood Press, Westwood, CT
Quataert, D. 2000. The Ottoman Empire, 1700-1922. Cambridge University Press, Cambridge
Rock, M. 2009. Corruption and Democracy. J. Dev. Stud. 45 (1), 55-75
Roland, G. 2004. Understanding Institutional Change: Fast-moving and Slow-moving Institutions. Stud.
Comp. Intl. Dev. 38 (4), 109-31
Ross, M. 1999. The Political Economy of the Resource Curse. World Pol. 51 (2), 297-322
Seton-Watson, H. 1967 [1945]. Eastern Europe Between the Wars, 1918-1941. Harper and Row, New
York, NY
StataCorp. 2013. Stata Base Reference Manual: Release 13. College Station, TX: StataCorp LP
Sugar, P. 1977. Southeastern Europe under the Ottoman Rule, 1354-1804. University of Washington
Press, Seattle
Sulstarova, E. 2015 Islam and Orientalism in Contemporary Albania, In: Elbasani, A., Roy, O. eds. The
Revival of Islam in the Balkans: From Identity to Religiosity. Palgrave Macmillan, Basingstoke
Todorova, M. 1996. The Ottoman Legacy in the Balkans, In: L. C. Brown, ed. Imperial Legacy
Treisman, D. 2000. The Causes of Corruption: A Cross-National Study. J. Public Econ. 76 (3), 399-457
Treisman, D. 2002. Post-Communist Corruption, In: Fridrmuc, J., Campos, N. eds. Political Economy of
Transition and Development: Institutions, Politics and Policies, Kluwer
Treisman, D. 2007. What Have we Learnt about the Causes of Corruption from Ten Years of Cross-
National Empirical Research? Annu. Rev. Polit. Sci. 10, 211-44
Uberti, L. J. 2016. Can Institutional Reforms Reduce Corruption? Economic Theory and Patron-Client
Politics in Developing Countries, Dev. and Change. 47 (2), 317-45
Vaughn-Findley, C. 1996. The Ottoman Administrative Legacy and the Modern Middle East, In: L. C.
Brown, ed. Imperial Legacy
You, J., Khagram, S. 2005. A comparative study of inequality and corruption. Am. Soc. Rev. 70, 136–57
APPENDIX I: A Simple Model of Historical Persistence
I model institutional change as a dynamic process in which the dependent variable 𝐼𝑖𝑡
(institutional characteristics in country i in year t) depends on its past realisations:
𝐼𝑖𝑡 = 𝜂𝐼𝑖,𝑡−1 + 𝛼𝑿𝑖𝑡 (𝐴1)
where 𝜂 is the magnitude of the persistence effect. 𝑿𝑖𝑡 is a dummy variable denoting an exogenous
historical event (e.g. Ottoman imperial rule) in country i in year t, so that 𝑿𝑖𝑡 = 1 when the event occurs
and 𝑿𝑖𝑡 = 0 when it does not. 𝛼 measures the impact of the event on the outcome. Substituting a similar
expression for 𝐼𝑖,𝑡−1 into (A1) and iterating over n years, I obtain an expression for the quality of
institutions in country i at the end of the time process. Calling the end-point (or present time) 𝑇, I obtain:
𝐼𝑖𝑇 = 𝐼𝑖0 + 𝛼(𝑿𝑖𝑇 + 𝜂𝑿𝑖,𝑇−1 + ⋯ + 𝜂𝑛𝑿𝑖,𝑇−𝑛) (𝐴2)

34
where 𝐼𝑖0 = 𝜂𝑛𝐼𝑖𝑇−𝑛 is an initial conditions variable that reduces to 0 when 𝑛 → ∞.
35 If 𝜂 = 1, the time
process reduces to a unit root and (A2) becomes:
𝐼𝑖𝑇 = 𝐼𝑖0 + 𝛼 ∑ 𝑿𝑖,𝑇−𝑘
𝑛
𝑘=0
= 𝐼𝑖0 + 𝛼(𝐵𝑖 − 𝐸𝑖) (𝐴3)
(A3) indicates that the total effect of Ottoman domination on present-day institutions in country i is equal
to the product of the impact of one year of rule (𝛼) times the total number of years of rule (i.e. the years
for which 𝑿𝑖,𝑇−𝑛 = 1). Alternatively, this quantity may be expressed as the number of years that elapsed
between the first (𝐵𝑖) and the last (𝐸𝑖) year of Ottoman rule, where 𝐸𝑖 and 𝐵𝑖 are measured relative to the
present time (i.e. Ottoman rule began “𝐵𝑖 years ago” and ended “𝐸𝑖 years ago”) and 𝐸𝑖 < 𝐵𝑖.36
Equation
(A3) corresponds to regression equation (1).
A more plausible assumption, however, is that 0 < 𝜂 < 1, which implies that institutional
routines are subject to a process of ‘autoregressive decay’. If this is the case, then the legacy effect (call it
�̂�) of one year of Ottoman rule is smaller than 𝛼. Also, �̂� approaches zero the more the event recedes
back into the past, for the contribution of years in the more distant past is now discounted by a factor 𝜂𝑛 <
1, which decays exponentially in n. More formally, (A2) can be re-written as:
𝐼𝑖𝑇 = 𝐼𝑖0 + 𝛼 ∑ 𝜂𝑛
𝐵𝑖−1
𝑛=𝐸𝑖
= 𝐼𝑖0 + 𝛼(𝜂𝐸𝑖 + ⋯ + 𝜂𝐵𝑖−1) (𝐴4)
In this equation, the exponential decay process is just a discounted sum of the years of Ottoman rule (i.e.
the years for which 𝑿𝑖,𝑇−𝑛 = 1), from the most recent year (𝑛 = 𝐸𝑖 years prior to the present time 𝑇) to
the most distant one (𝑛 = 𝐵𝑖 years prior to 𝑇).37
Now, if we estimate 𝐼𝑖 = �̂�(𝐵𝑖 − 𝐸𝑖) + 𝜀𝑖, when the ‘true’ relation is 𝐼𝑖 = 𝛼(𝜂𝐸𝑖 + ⋯ + 𝜂𝐵𝑖−1),
then the OLS estimator for �̂� is given by:
plim �̂� = 𝛼Cov(𝐵𝑖 − 𝐸𝑖 , 𝜂𝐸𝑖 + ⋯ + 𝜂𝐵𝑖−1)
Var(𝐵𝑖 − 𝐸𝑖) (𝐴5)
Based on (A5), it is easy to see that plim �̂� approaches 𝛼[Cov(𝐵𝑖 − 𝐸𝑖, 0)/(Var(𝐵𝑖 − 𝐸𝑖)] = 0 as 𝐸𝑖 and
𝐵𝑖 tend to infinity (i.e. the more an historical period recedes back in time). In addition, plim �̂� approaches
zero when 𝜂 → 0 (i.e. the more an historically established routine has a tendency to decay rapidly), and
35
Or to a non-zero constant if we assume that at the beginning of the time process institutional arrangements were
very similar across countries. 36
The second equation in (A3) holds if I assume, as I do in the data construction, that the rule began and ended
midway through the reported year (see Table 1). If so, a simple count of the years of rule (the 𝑿’s) equals the
difference between the last and the first year. 37
Since the rule is assumed to begin and end midway through the first and last reported year, and the time discount
rate is annual (rather than biannual), I drops the first year of rule. The approximation involved is, clearly, extremely
small.

35
when 𝛼 → 0 (i.e. if the historical event had no shock impact on the institutional routine in the first place).
From (A5) it is also easy to see that, if the ‘true’ 𝜂 equals 1, then plim �̂� = 𝛼 and the estimated
coefficient should be interpreted as the impact effect.
APPENDIX II: Time-discounted Estimates of Ottoman and Socialist Rule
Note that the exponential decay process in equation (A4) has the form of a geometric series.
When 𝜂 < 1, this series can be written in closed form:
(𝜂𝐸𝑖 + ⋯ + 𝜂𝐵𝑖−1) =𝜂𝐸𝑖 − 𝜂𝐵𝑖
1 − 𝜂 (𝐴6)
Expression (A6) is used to construct time-discounted measure of the duration of Ottoman and
socialist rule. Since corruption is measured as an average during 2000-7, I assume that the present time
corresponds to 𝑇 = 2003. If 𝜂 = 1, the length of Ottoman rule in, say, Albania (which lasted between
1468 and 1912) equals (𝐵𝑖−𝐸𝑖)
100=
{[2003−1468]−[2003−1912]}
100= 4.44. If 𝜂 = 0.998, then the time-
discounted measure of Ottoman rule for Albania becomes {[0.998(2003−1912)−0.998(2003−1468)]
[1−0.998]} /100 =
2.45. This measure approaches the undiscounted sum if 𝜂 → 1. For instance, if 𝜂 = 0.9999, the
discounted measure is 4.30. Note that, if Ottoman rule had lasted between 1558 and 2002, then the
undiscounted sum would remain the same (4.44), but the discounted measure would increase to 2.94.
Clearly, more recent years of rule contribute more to the time-discounted sum than years in the more
distant past. Since most of this period of rule dates back to several centuries prior to the present time, the
discounted measure (2.94) is still substantially smaller than the undiscounted sum (4.44).

36
APPENDIX III: Variable Description
Variable Code Description Source
Corruption Index corr Perceived levels of corruption in the public sphere (average during 2000-7). Ranges between a theoretical minimum of -2.5 (least corrupt) and a theoretical maximum of 2.5 (most corrupt).
World Bank, Worldwide Governance Indicators, 2017
corr_se2 Standard error of the estimate of
corruption, squared Ibid.
corr_ti Perceived levels of corruption in public
sphere (2000-7). Rescaled over -/+2.5 TI, Corruption Perceptions Index, 2017
Ottoman Rule ottoman See section 3 (in ’00 years) Author's construction
Distance from Constantinople
gcdist_ist Great-circle distance from Istanbul's Ataturk airport to the main airport of the present-day country's capital city (’00 km)
www.greatcirclemapper.net
Russian/Safavid/Mughal Rule
russian; safavid; mughal
Number of years under Russian imperial/Safavid/Mughal rule
Author’s construction
Socialist Rule socialist Number of years under socialist rule Author's construction based on CIA Factbook data
soc_europe equals socialist for European countries, and 0 otherwise
Author's construction
soc_mena equals socialist for MENA countries, and 0
otherwise Author's construction
Socialist Dummy soc_dummy equals 1 if socialist ≠ 0, and 0 otherwise Author's construction
Socialist Rule (Weighted)
soc_wtd Equals (socialist ∙ 2) if country is 'strict' socialist regime and (socialist ∙ 1) otherwise.
Based on Dimitrova-Grajzl, 2007: 549
Ottoman/socialist Rule (discounted)
o1-o975; s1-s975
Time-discounted measure of duration of Ottoman/socialist rule. See Appendix II for details
Author’s construction
Log GDP per capita
Ln_Y GDP per capita in nominal US dollars, average over 2000-7
World Bank, World Development Indicators, 2016
Log GDP per capita, PPP
Ln_Y_PPP GDP per capita in PPP US dollars, average over 2000-7
Ibid.
Log Oil Exports Ln_oil Natural log of oil rent earnings (% GDP),
average 1970-2007 Ibid.
Log Aid Ln_aid Net ODA received (% GNI), average during
2000-07 Ibid.
Islam islam Fraction of total population that is Muslim Parker, 1997
Protestant prot Fraction of total pop. that is Protestant Ibid.
Ethnolinguistic Fract.
f_ethnolang Average of the ethnic and linguistic fractionalization indices
Alesina et al., 2003
Religious Fract. f_relig Index of religious fractionalization Ibid.
European Coloniser
brit equals 1 if former British colony Author's construction
french equals 1 if former French colony Author's construction
italian equals 1 if former Italian colony (Libya,
Eritrea) Author's construction
EU EU equals 1 for Višegrad countries, Baltic states, Greece and Cyprus.
Author's construction

37
Log(years of conflict)
Ln_conflict Number of years of conflict during 1946-2007, weighted by intensity level. Conflicts with more than 1000 battle-related deaths per year are weighted twice as much.
Uppsala Conflict Data Programme, 2016
Land within 100 km of coast
near_coast Percentage of land within 100 km of nearest ice-free coast. For present-day Serbia, near_coast is assumed to equal 0.
Nunn and Puga, 2012
Imports / GDP L_imports Imports of goods and services (% GDP), average 1997-2003
World Bank, World Development Indicators, 2016
Exports / GDP L_exports Exports of goods and services (% GDP),
average 1997-2004 Ibid.
Democracy demo_fhi Average of Political Rights and Civil Liberties indices, 1997-2002
Freedom House, 2017
Economic Freedom
econfred_hv Average of 7 dimensions of economic freedom: business, trade, fiscal, monetary, investment and financial freedom, and freedom from government. Average over 1997-2003.
The Heritage Foundation, 2015
APPENDIX IV: The Economic Effects of Ottoman and Socialist Rule
Omitting income from eq. (1) might severely bias the estimates of the corruption effect if
Ottoman and socialist rule also influence corruption through economic development. The economic effect
of Ottoman and socialist legacies is difficult to establish a priori. On the one hand, Grosjean (2011) finds
a negative (but insignificant) effect of the length of Ottoman rule on income levels in a sample of East-
European regions. On the other, the historical literature has typically cast the Ottoman Empire as a driver
of long-distance trade and pre-industrial accumulation (Inalcik and Quataert, 1994). Thus, it is possible
that Ottoman rule might have left a negative economic legacy on its successor states relative to the more
industrially advanced Empires of East-Central Europe (e.g. Austria-Hungary and Prussia), but a positive
legacy relative to other non-Ottoman societies in MENA. The caliphates of the Arabian Peninsula, for
instance, maintained an essentially nomadic-pastoralist economy until after WWII (Al-Rasheed, 2010).
This hypothesis is consistent with the data (Table AIII.1). On balance, however, the Ottoman
Empire was probably more akin to Prussia and Austria from the point of view of economic structure than
to the nomadic-pastoralist economies of its Eastern neighbours. Accordingly, the overall income effect in
the full sample is positive and significant (column 1, Table AIII.1). If Ottoman rule produced two
countervailing effects on corruption and income levels, the consequence of omitting income from my
corruption regression is to bias the estimated corruption effect downwards.
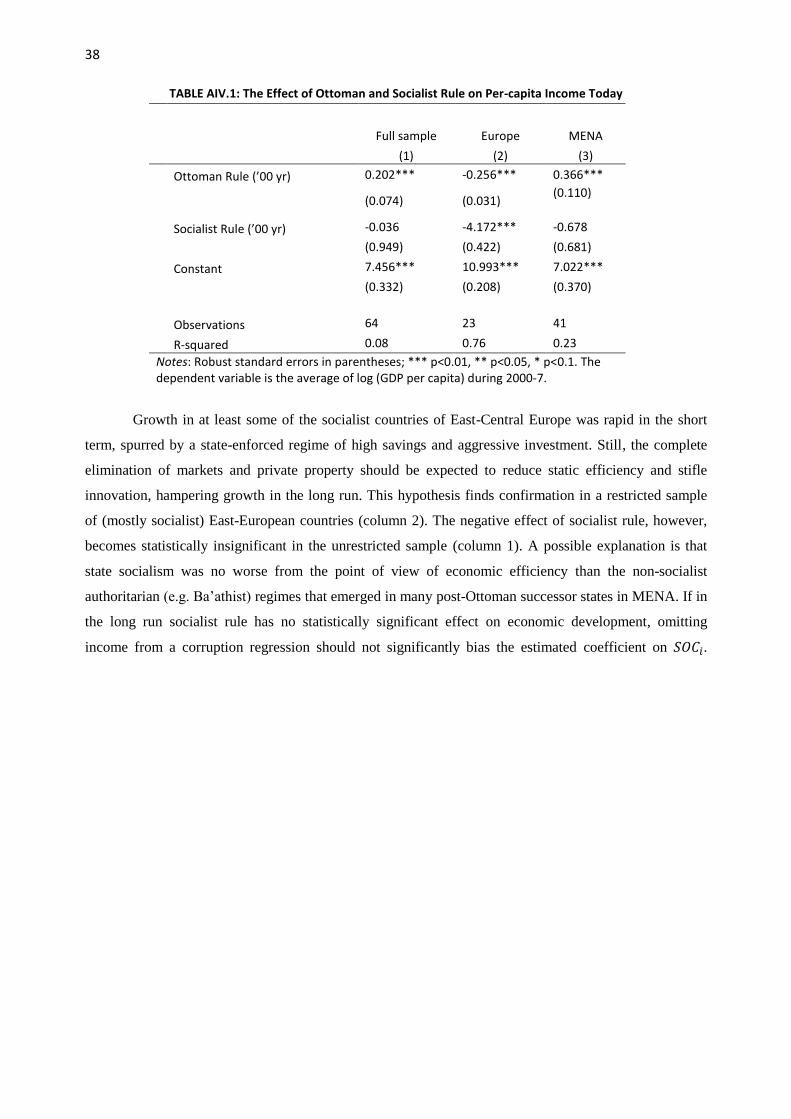
38
TABLE AIV.1: The Effect of Ottoman and Socialist Rule on Per-capita Income Today
Full sample Europe MENA
(1) (2) (3) Ottoman Rule (’00 yr) 0.202*** -0.256*** 0.366***
(0.074) (0.031)
(0.110)
Socialist Rule (’00 yr) -0.036 -4.172*** -0.678
(0.949) (0.422) (0.681)
Constant 7.456*** 10.993*** 7.022***
(0.332) (0.208) (0.370)
Observations 64 23 41
R-squared 0.08 0.76 0.23
Notes: Robust standard errors in parentheses; *** p<0.01, ** p<0.05, * p<0.1. The dependent variable is the average of log (GDP per capita) during 2000-7.
Growth in at least some of the socialist countries of East-Central Europe was rapid in the short
term, spurred by a state-enforced regime of high savings and aggressive investment. Still, the complete
elimination of markets and private property should be expected to reduce static efficiency and stifle
innovation, hampering growth in the long run. This hypothesis finds confirmation in a restricted sample
of (mostly socialist) East-European countries (column 2). The negative effect of socialist rule, however,
becomes statistically insignificant in the unrestricted sample (column 1). A possible explanation is that
state socialism was no worse from the point of view of economic efficiency than the non-socialist
authoritarian (e.g. Ba’athist) regimes that emerged in many post-Ottoman successor states in MENA. If in
the long run socialist rule has no statistically significant effect on economic development, omitting
income from a corruption regression should not significantly bias the estimated coefficient on 𝑆𝑂𝐶𝑖.

39
APPENDIX V: Other Empires
i Period of Rule Value
Panel I: Russian Empire
Russia 1721-1917 1.96
Ukraine* 1721-1917 1.96
Estonia 1722-1917 1.95
Latvia 1722-1916 1.94
Lithuania 1796-1915 1.19
Belarus 1794-1917 1.23
Moldova 1813-1917 1.04
Poland* 1816-1915 0.99
Georgia 1802-1917 1.15
Azerbaijan 1814-1917 1.03
Armenia 1830-1917 0.87
Kazakhstan* 1799-1917 1.18
Uzbekistan 1877-1917 0.4
Tajikistan 1877-1917 0.4
Kyrgyzstan 1877-1917 0.4
Turkmenistan 1886-1917 0.31
Panel II: Safavid Empire
Afghanistan* 1511-1722 2.11
Armenia* 1502-1584; 1612-1722 1.9
Azerbaijan* 1502-1583; 1612-1722 1.91
Georgia* 1502-1579; 1612-1722 1.87
Iran 1502-1736 2.34
Iraq 1510-1536; 1624-1639 0.41
Pakistan* 1510-1536; 1624-1639 1.87
Syria* 1504-1515 0.11
Turkmenistan* 1511-1736 2.25
Panel III: Mughal Empire
Afghanistan* 1526-1739 2.13
Bangladesh 1577-1721 1.44
India* 1527-1803 2.59
Pakistan* 1559-1750 1.91
Sources: author's estimations (with Can Cinar) based on data from the GeaCron Project; Notes: cleft countries are marked with an asterisk