determinants of cultural event tourist motivation
TRANSCRIPT

DETERMINANTS OF CULTURAL EVENT TOURIST
MOTIVATION
by
Pandora Kay M.A (James Cook University of North Queensland), Grad. Dip. (Arts Admin.), (South
Australian Institute of Technology), B.Ed. (Melbourne State College)
A thesis submitted in fulfillment of the requirements for the degree of
Doctor of Philosophy
School of Applied Economics
Faculty of Business and Law
Victoria University
2007

ABSTRACT
This thesis investigates the determinants of tourist motivation to ascertain the new
audience potential of Western and Asian tourists for locally-based, cultural attractions
and events, and the associated effective marketing strategies necessary to attract these
tourism markets. A research model, developed from the literature, conceptualises the
tourist motivational process comprised of four latent constructs - attitudes, motives,
benefits sought and benefits gained - from which the related behavioural outcome of
satisfaction/dissatisfaction Is inferred. It draws upon Alzua et al.'s (1998) procedural
model for segmenting cultural tourist markets and Iso-Ahola's (1989) seeking/avoiding
dichotomy theory for tourist motivation dimensions, empirically testing these for cultural
group differences using exploratory factor analysis to Identify the underlying dimensions
for each of the model constructs that are then tested for model fit with confirmatory factor
analysis. While the hypothesised dimensions primarily Including hedonic, escape, and
seeking dimensions were supported with good measurement properties, the findings for
the constructs differing by cultural group were not as expected. Significant cultural
differences between Western and Asian tourists were not found, but a new finding of this
study was significant differences between English-speaking tourists In their motives for
attending cultural experiences. Market segmentation and marketing strategy
Implications of these findings are then presented.

DECLARATION OF AUTHENTICITY
I, Pandora Kay, declare that the PhD thesis entitled. Determinants of Cultural
Event Tourist Motivation, is no more than 100,000 words In length, exclusive of
tables, figures, appendices, references and footnotes. This thesis contains no
material that has been submitted previously, in whole or in part, for the award of
any other academic degree or diploma. Except where otherwise indicated, this
thesis is my own work.
Signature: I C Date: 30 March 2007

ACKNOWLEDGEMENTS
The author wishes to express sincere appreciation to her supervisors. Professor
Lindsay Turner and Dr Mario J. Miranda from Victoria University, Melbourne who
deserve special recognition for their professional and personal support,
intellectual guidance and time spent on reviewing several drafts of this thesis.
Their valuable comments and suggestions greatly improved the quality of the
thesis.
The Faculty of Business and Law at Victoria University is acknowledged with
sincere appreciation for granting me release from teaching in Semester 1, 2004
and Semester 2, 2006 in order to work on my dissertation. My Head of School,
Professor Brian King, and the Chair of Marketing, Professor Michael Polonsky,
have provided constructive advice and their utmost support throughout the
research project for which I am extremely grateful. To my friend and colleague,
Ms Romana Garma, a sincere thank you for her unstinting advice and assistance
on various aspects of the research.
A special thank you to Mr Jim Monaghan, Managing Director, Queen Victoria
Market for supporting data collection at QVM which was particularly helpful as
QVM Is one of the most popular tourist attractions In Melbourne. A special thank
you also to the team of twelve bi-lingual data collection assistants, without whom
the cross-cultural samples would not have been obtained. To my colleagues at
Victoria University, Dr Michelle Fong, Ms Allison Ringer and Mr Henry Ho, who
assisted with the recruitment interviews for the data collection assistants, their
generous participation in this process was greatly appreciated. To another
colleague, Ms Anna Dusk, who assisted in the earlier stages with data entry and
later stages with technical aspects of the thesis compilation, her competent
approach to both tasks was particularly helpful and much appreciated.
To my partner, John Larkins, and my parents, Margaret and Bernard (now
deceased) Kay, my biggest thank you for their continued personal support, faith
and encouragement throughout the various stages of the research.
m

LIST OF PUBLICATIONS FROM THIS THESIS
A number of publications were produced during the course of this study, which
are subsequently listed.
Journal Article
Kay, P. (2004). Cross-Cultural Research Issues in Developing International Tourist Markets for Cultural Events. Event Management, 8(4), pp. 191-202.
Book Chapter
Kay, P. (2004). Cultural Event Tourism: Modelling Performing Arts Tourism Events and Effective Marketing Strategies. In P. Long and M. Robinson (Eds.), Festivals and Tourism: Marketing, Management and Evaluation, (pp. 15-31). Sunderland, UK: Business Education Publishers Ltd.
Refereed Conference Papers
Kay, P. (2006). Modelling Dimensionality of Cultural Experience Attitudes for International Tourists. In Proceedings of the ACSPRI Social Science Methodology Conference, (pp. 1-21). Sydney: Australian Consortium for Social and Political Research Inc.
Kay, P. (2006). Understanding Tourists' Cultural Experiences: Benefits and Satisfaction at the Queen Victoria Market, Melbourne. In J. Drennan, Proceedings of the ANZMAC 2006 Conference. Brisbane: School of Advertising, Marketing and Public Relations, Queensland University of Technology.
Kay, P. (2006). Tourist Benefits Research: Old and New Issues and Uses In a Cultural Tourism Context. In G.B. O'Mahony & P. Whitelaw (Eds.), Proceedings of the 16th Annual CAUTHE Conference (pp. 809-824). Melbourne: School of Hospitality, Tourism and Marketing, Victoria University.
Kay, P. (2004). Conceptualising the Measurement and Analysis of Authenticity and Cultural Tourist Motivation: An Under-Researched Issue. In R. MacLellan, T. Baum, A. Goldsmith, J. Kokkranlkal, E. Losekoot, S. Miller, A. Morrison, D. Nickson, J.S. Taylor & K. Thompson (Eds.), Tourism State of the Art II (pp. 1-20). Glasgow: The Scottish Hotel School, University of Strathclyde.
Kay, P. (2004). Conceptualising the Role of Hedonism and Authenticity In Attracting International Tourists to Cultural Attractions in the New Tourism Economy. In K. Chon, C.H.C. Hsu & N. Okamoto (Eds.). Asia Pacific Tourism Association Tenth Annual Conference, Globalisation and Tourism Research: East Meets West (pp. 1106-1116). Nagasaki, Japan: Hong Kong Polytechnic University/Rikkyo University.
IV

Kay, P. (2003). Consumer Motivation in a Tourism Context: Continuing the Work of Maslow, Rokeach, Vroom, Decl, Haley and Others. In R. Kennedy (Ed.), Proceedings of ANZMAC 2003 (pp. 600-614). Adelaide: University of South Australia.

TABLE OF CONTENTS
ABSTRACT
DECLARATION OF AUTHENTICITY i
ACKNOWLEDGEMENTS ii
LIST OF PUBLICATIONS FROM THIS THESIS iv
CHAPTER 1.0 INTRODUCTION 1
1.1 Background 1
1.2 Research Objectives 3
1.3 Aims of the Research 4
1.4 Contribution to Knowledge 5
1.5 Significance of the Study 9
CHAPTER 2.0 LITERATURE REVIEW 15
2.1 introduction 15
2.2 Background: The Cultural Attractions' and Events' Perspective 15 2.2.1 Needs of Cultural Attractions and Events In the Twenty-First
Century 15 2.2.2 Arts Marketing and Audience Development 17 2.2.3 Arts Audience Characteristics and Motivations 17 2.2.4 Marketing Cultural Experiences to Tourists 18
2.3 Significance of Cultural Experiences for International and Domestic Tourists in Australia and Gaps in the Data 18 2.3.1 Cultural Tourism and Cultural Event Tourism in Australia:
Significance and Research to Date 18 2.3.2 Cultural Activity Attendance by International Tourists 19 2.3.3 Cultural Activity Attendance by Domestic Tourists 21 2.3.4 Summary of Cultural Activity Participation Data for International
and Domestic Tourists In Australia 22 2.3.5 Cultural Tourist Motivation Data 23 2.3.6 Cultural Tourist Planning Data 24 2.3.7 Limitations of Cultural Tourist Data by Country-of-Residence 24 2.3.8 Summary of Cultural Tourism in Australia Research Findings
and Gaps in the Data 25
2.4 Significance of Cultural Tourism in Melbourne, Victoria .....26
2.5 Cultural Tourism Research and Definitions: 27 2.6 Typology of Tourists and Cultural Experience Tourism 27
VI

2.6.1 Cultural Experience Tourists 30 2.6.2 Cultural Tourism Experiences 31 2.6.3 Cultural Experience Tourism Typology 33 2.6.4 Associated Definitions 33
International Tourist 33 Domestic/National Tourist 34 Interstate Tourist 34 Cultural Experience Tourism 34 Cultural Attractions (Site-Based) 34 Cultural Events 34
2.7 Cultural Tourist Motivation and Market Segmentation Research 35
2.8 Understanding Cultural Experience Tourist Motivation and Behaviour 38
2.9 Motivation Research 39 2.9.1 Motivation and Cultural Tourist Definitions 39 2.9.2 Needs versus Values-Based Motivation Theory 40 2.9.3 Benefits Sought/Pursued and Motivation 41 2.9.4 Tourist Motivation Research 42
2.9.4.1 Needs-based Tourist Motivation 45 2.9.4.2 Values-based Tourist Motivation 46 2.9.4.3 Benefits Sought or Gained-based Tourist Motivation 47 2.9.4.4 Expectancy Theory-based Tourist Motivation 49 2.9.4.5 Tourist Motivation Summary 50
2.9.5 other Approaches to Tourist Motivation 52 2.9.5.1 Push and Pull Factors and Tourist Motivation 53 2.9.5.2 Intrinsic and Extrinsic Motivation with Tourist
Motivation Dimension Implications 54 2.9.5.3 Seeking and Escaping Framework for Tourist
Motivation Dimensions 55 2.9.5.4 Hedonic Emotions and Tourist Motivation 55
2.9.6 other Theories of Consumer Motivation of Possible Relevance to Cultural Experience Tourist Motivation 56
2.9.6.1 Hedonic Consumer Motivation Theory and Hedonic Tourism Motivation Model 56
2.9.6.2 Motivation as a Process 58
2.10 Concepts to be Tested in this Study for Understanding Cultural Experience Tourist Motivation 60
2.10.1 Attitudes 60 2.10.1.1 Attitudes, Values or Needs Consumer Behaviour
Debate 60 2.10.1.2 Defining and Measuring Attitudes 61
2.10.2 Motives 64 2.10.2.1 Defining and Measuring Motives 64 2.10.2.2 Tourism Motives Dimensions 65 2.10.2.3 Festival or Event Motivation Literature 67 2.10.2.4 Cross-Cultural Differences in Tourist Motives 70 2.10.2.5 Defining and Measuring Motives Summary 70 2.10.2.6 Uses of Motives in Marketing 70 2.10.2.7 Motives within the Motivational Process 71
Vll

2.10.3 Benefits 71 2.10.3.1 Tourism Benefits Research and Literature 71 2.10.3.2 Benefits and the Motivational Process 73 2.10.3.3 Defining Benefits 75 2.10.3.4 What to Research Issues: Benefits Research
Approaches, Typologies and Frameworks 77 2.10.3.5 When to Research Issues of Benefits Research 78 2.10.3.6 How to Research Issues: Benefits Research
Methodologies 79 2.10.3.7 Defining and Researching Benefits Summary 80 2.10.3.8 Uses of Benefits In Marketing and a Proposed New
Use In this Study 80
2.10.4 Satisfaction 82 2.10.4.1 Satisfaction and Service Quality Debates and
Definitions 83 2.10.4.2 Motivation, Benefits and Satisfaction 88 2.10.4.3 Uses of Satisfaction In Marketing and Cross-cultural
Data Gaps in Cultural Experience Tourist Satisfaction 89 2.10.4.4 Defining and Researching Satisfaction Summary 90
2.11 Influencing Variables and Profiling Characteristics to be Tested in this Study 90
2.11.1 Culture and Language 90 2.11.1.1 Defining Culture 90 2.11.1.2 Culture and Tourism Marketing Applications 91 2.11.1.3 Cross-Cultural Research Problems 93 2.11.1.4 Cross-Cultural Research of Cultural Experience
Tourist Motivation Summary 94
2.12 Marketing Applications 95 2.12.1 Market Segmentation 95
2.12.1.1 Multiple versus Single Dimension Segmentation Bases 96
2.12.1.2 Activity-Based Segmentation 96 2.12.1.3 Motivation-Based Segmentation 97 2.12.1.4 Benefit Segmentation 98 2.12.1.5 Market Segmentation and Proposed Research
Summary 98 2.12.2 Target Marketing 98
2.13 Summary of Proposed Research 99
CHAPTER 3.0 CONCEPTUAL FRAMEWORK 102
3.1 Research Propositions 102
3.2 Models for Researching Cultural Experience Tourist Motivation.. 104 3.2.1 Model of the Motivational Process for Cultural Experience
Tourists, Key Concept Definitions and Hypotheses 104 3.2.1.1 Definitions of the Model Components 104 3.2.1.2 Constructs of the Model 106 3.2.1.3 Attitude Construct 109
Vlll

3.2.1.4 Motive Construct I l l 3.2.1.5 Benefits and Satisfaction Constructs 113 3.2.1.6 Culture Construct 114
3.2.2 Procedural Model for Segmentation of the Cultural Experience Tourist Market 114
CHAPTER 4.0 RESEARCH METHOD 118
4.1 Introduction 118
4.2 Research Approach 118
4.3 Target Population, Research Site and Sampling Frame 121 4.3.1 Population Units and Elements 121 4.3.2 Research Site 123 4.3.3 Research Design and Sampling Frame 124 4.3.4 Sample Size and Response Rates 125 4.3.5 Non Responses and Removed Questionnaires 130
4.4 Data Collection 132 4.4.1 In-SItu Personally Administered Interview Questionnaire 133 4.4.2 After Visit Self-Complete Questionnaire 134 4.4.3 Timing of Data Collection 134
4.5 Instrument Design 135 4.5.1 In-situ and After-Visit Questionnaire Development 135 4.5.2 Measuring the Attitude Construct of the Cultural Experience
Motivational Process 136 4.5.3 Measuring the Motive Construct of the Cultural Experience
Motivational Process 138 4.5.3.1 Motive Dimensions Consensus and Motive Construct
Measurement Scale 139 4.5.4 Measuring the Benefit and Satisfaction Constructs of the
Cultural Experience Motivational Process 142 4.5.4.1 What to Measure Issues in Benefit Research 142 4.5.4.2 Benefit Dimensions Consensus 146 4.5.4.3 A Conceptual Typology of the Most Commonly Found
Benefit Dimensions 147 4.5.4.4 Benefit Constructs Measurement Scales 148
4.5.5 Measuring Other Characteristics of Relevance to the Cultural Experience Motivational Process 149
4.5.5.1 Soclo-demographic Characteristics Culture and Language 149 4.5.5.2 Travel Group and Trip Characteristics 150
4.5.6 Scales Used In the Survey Instruments 151
4.5.7 Expert: Opinion, Pre-testing and Translation of the Survey Instruments 151
4.6 Data Analysis 152 4.6.1 Descriptive Analysis Approaches 152 4.6.2 Construct Dimensionality Analysis 153
IX

4.6.2.1 Approaches to Construct Dimensionality Analysis 153 4.6.2.2 Rationale for Construct Dimensionality Analysis
Approaches used in this Study 157
4.7 Summary 158
CHAPTER 5.0 DESCRIPTIVE ANALYSIS RESULTS 160
5.1 Introduction 160
5.2 Cleaning Data 160
5.3 Sample Demographic Characteristics 160 5.3.1 Demographic Profile Summary 164
5.4 Trip and Travel Characteristics 165 5.4.1 Trip and Travel Characteristics Summary 176
5.5 Cultural Experience Constructs and Normality of the Data 176 5.5.1 Cultural Experience Attitudes 176 5.5.2 Cultural Experience Motives 179 5.5.3 Cultural Experience Benefits Sought and Gained 181
5.6 Preliminary Data Analysis 186 5.6.1 Missing Data 186 5.6.2 Reliability 187 5.6.3 Mann-Whitney U Test Results 189
5.7 Summary 195
CHAPTER 6.0 FACTOR ANALYSIS RESULTS 198
6.1 Introduction 198
6.2 Statistical Analyses 200
6.3 Preliminary Analysis of the Data 205 6.3.1 Missing Values 206 6.3.2 Minimum Sample Sizes and Elimination of Poor Variables 207
6.4 Dimensionality of Cultural Experience Attitudes 209 6.4.1 Exploratory Factor Analysis of Attitude Dimensionality on the
Calibration Sample 209 6.4.2 Confirmatory Factor Analysis of Attitude Dimensionality on the
Validation Sample 212 6.4.3 Invariance Testing of the Hypothesised Cultural Experience
Attitudes Model for English-speaking Tourists 216 6.4.4 Validation and Invariance Testing of the Hypothesised Cultural
Experience Attitudes Model for the Asian Tourist Sample 217 6.4.5 Dimensionality of Cultural Experience Attitudes Summary
Discussion 220
6.5 Dimensionality of Cultural Experience Motives 221 6.5.1 Exploratory Factor Analysis of Motive Dimensionality on the
Calibration Sample 221

6.5.2 Confirmatory Factor Analysis of Motives Dimensionality on the Validation Sample 224
6.5.3 Invariance Testing of the Hypothesised Cultural Experience Motives Model for English-speaking Tourists 228
6.5.4 Validation and Invariance Testing of the Hypothesised Cultural Experience Motives Model for the Asian Tourist Sample 229
6.5.5 Dimensionality of Cultural Experience Motives Summary Discussion 232
6.6 Dimensionality of Cultural Experience Benefits Sought 233 6.6.1 Exploratory Factor Analysis of Benefits Sought Dimensionality
on the Calibration Sample 233 6.6.2 Confirmatory Factor Analysis of Benefits Sought Dimensionality
on the Validation Sample 236 6.6.3 Invariance Testing of the Hypothesised Cultural Experience
Benefits Sought Model for English-speaking Tourists 241 6.6.4 Validation and Invariance Testing of the Hypothesised Cultural
Experience Benefits Sought Model for the Asian Tourist Sample. 242 6.6.5 Dimensionality of Cultural Experience Benefits Sought
Summary Discussion 245
6.7 Dimensionality of Cultural Experience Benefits Gained 246 6.7.1 Exploratory Factor Analysis of Benefits Gained Dimensionality
on the Calibration Sample 246 6.7.2 Confirmatory Factor Analysis of Benefits Gained Dimensionality
on the Validation Sample 249 6.7.3 Invariance Testing of the Hypothesised Cultural Experience
Benefits Gained Model for English-speaking Tourists 254 6.7.4 Validation and Invariance Testing of the Hypothesised Cultural
Experience Benefits Gained Model for the Asian Tourist Sample. 255 6.7.5 Dimensionality of Cultural Experience Benefits Gained
Summary Discussion 257 6.8 Exploratory Factor Analysis of the Western Tourist Motives
Differences , 258 6.8.1 ERA of Motive Dimensionality for the Domestic Tourist Sample. 258 6.8.2 EFA of Motive Dimensionality for the New Zealand Tourist
Sample 260 6.8.3 EFA of Motive Dimensionality for the North American Tourist
Sample 262 6.8.4 EFA of Motive Dimensionality for the United Kingdom and
Ireland Tourist Sample 264
6.9 Chapter Summary 266
CHAPTER 7.0 CONCLUSION 269
7.1 Introduction 269
7.2 Conclusions from this Study of Cultural Experience Motivation for Tourists and its Dimensionality 271
7.2.1 Breaking Down of the Cultural Divide Between the West and the East 272
7.2.2 The Cultural Experience Motivational Process Construct Dimensions 274
XI

7.2.3 Differences in Western Tourist Cultural Experience
Motives Dimensions 276
7.3 Marketing Implications 278
7.4 Research Limitations 281
7.5 Recommendations for Future Research 282
REFERENCES 285
APPENDICES 305
1 Survey Instruments and Cover Letter - English Version A.I
2 Survey Instruments and Cover Letter - Chinese (Simplified)
Version A.2
3 Survey Instrument - Chinese (Traditional) Version A.3
4 Survey Instruments and Cover Letter - Japanese Version A.4
5 Data Collection Show Cards — English Version A.5
6 Data Collection Show Cards — Chinese (Simplified) Version A.6
7 Data Collection Show Cards — Japanese Version A.7
xu

LIST OF FIGURES
Number Page
2.1 Typology of Tourists and Cultural Experience Tourism 37
2.2 Mannell's Model of the Motivational Process 59
2.3 Linkages Tested in Prior Research for a Structural Model of the Consumer Satisfaction/Dissatisfaction Process 84
3.1 Model of the Motivational Process for Cultural Experience Tourists 105
3.2 Procedural Model for Researching Segmentation of the Cultural Experience Tourist Market, and Developing Effective Marketing Strategies 116
6.1 Scree Plots of EFA Attitudes Construct for English-speaking Tourist Calibration Sample 210
6.2 Hypothesised Model of Cultural Experience Attitudes for CFA Validation Samples of English-speaking Tourists 215
6.3 Hypothesised Model of Cultural Experience Attitudes from CFA Validation Samples of English-speaking Tourists for International Asian Tourists 219
6.4 Scree Plots of EFA Motives Construct for English-speaking Tourist Calibration Sample 222
6.5 Hypothesised Model of Cultural Experience Motives for CFA Validation Samples of English-speaking Tourists 226
6.6 Hypothesised Model of Cultural Experience Motives from CFA Validation Samples of English-speaking Tourists for International Asian Tourists 231
6.7 Scree Plots of EFA Benefits Sought Construct for English-speaking Tourist Calibration Sample 234
6.8 Hypothesised Model of Cultural Experience Benefits Sought for CFA Validation Samples of English-speaking Tourists 239
6.9 Hypothesised Model of Cultural Experience Benefits Sought from CFA Validation Samples of English-speaking Tourists for International Asian Tourists 243
Xlll

6.10 Scree Plots of EFA Benefits Gained Construct for English-speaking Tourist Calibration Sample 247
6.11 Hypothesised Model of Cultural Experience Benefits Gained for CFA Validation Samples of English-speaking Tourists 251
6.12 Hypothesised Model of Cultural Experience Benefits Gained from CFA Validation Samples of English-speaking Tourists for International Asian Tourists 256
6.13 Scree Plots of EFA Motives Construct for English-Speaking Domestic Tourist Sample 258
6.14 Scree Plots of EFA Motives Construct for English-Speaking New Zealand Tourist Sample 261
6.15 Scree Plots of EFA Motives Construct for English-Speaking North American Tourist Sample 263
6.16 Scree Plots of EFA Motives Construct for English-Speaking United Kingdom and Ireland Tourist Sample 265
XIV

LIST OF TABLES
Number Page
2.1 International Tourist Participation in Cultural Activity by Country-of-Origln 19
2.2 International Tourist Participation in Performing Arts by Country-of-Origin 19
2.3 International Tourist Participation in Cultural Activity by Type-of-Cultural Activity in 1995 20
2.4 International Tourist Participation In Cultural Activity by Type-of-Cultural Activity Annual Averages* 1999-2003 20
2.5 International Tourist Participation in Cultural Activity by Type-of-Cultural Activity (other than Australia) 20
2.6 Domestic Overnight Tourist Participation in cultural Activity by Type-of-Cultural Activity Annual Averages* 1999-2003 22
2.7 Key Findings and Limitations of Cultural Tourist Research for International and Domestic Visitors In Australia 22
2.8 A Summary of the Earliest Studies of Tourist Motivation and Reviews of Tourist Motivation Literature 43
2.9 A Summary of Key Studies in the Tourist Motivation Literature 43
2.10 A Summary of Key Consumer Motivation Theories and Studies of Relevance to the Tourist Motivation Studies 44
2.11 Characteristics, Issues, Potential Advantages and Disadvantages of Consumer Motivation Approaches, Measures and Features 50
2.12 Summary of Selected Studies on Tourist Motivation 66
2.13 Summary of Selected Studies on Event or Festival Motivation 68
2.14 Summary of Selected Empirical Studies on Benefits In Travel, Tourism, Leisure and Recreation Literature (Non-Cultural Related) 72
2.15 Summary of Selected Empirical Studies on Benefits in Travel, Tourism, Leisure and Recreation Literature (Cultural Related) 73
X V

2.16 Summary of Linkages Tested in Prior Research of Relevance to Figure 2.3 85
4.1 Minimum Sample Sizes for Various Data Analysis Statistical Techniques 126
4.2 Sample Size Drawn from Each Market in the Final Retained Data Set 127
4.3 Sample Size of After-Visit Survey Respondents and Proportion from the In-SItu Survey Respondents for the Selected Tourist Markets of Interest to this Study 129
4.4 Questionnaires Removed from Sample 132
4.5 Most Commonly Found Motive Dimensions in the Selected Empirical Tourist Motivation Research by Tourism Context (Cultural Tourism versus Other Tourism Contexts) 139
4.6 Most Commonly Found Motive Dimensions in the Selected Empirical Tourist Festival and Event Motivation Research by Tourism Context (Cultural Tourism versus Other Tourism Contexts) 140
4.7 Summary of Empirical Studies of Tourist Benefit Research (Non-Cultural Tourism Related) 144
4.8 Summary of Empirical Studies of Tourist Benefit Research (Cultural Tourism Related) 145
4.9 Most Commonly Found Benefit Dimensions In the Selected Empirical Tourist Benefit Research by Tourism Context (Cultural Tourism versus other Tourism Contexts) 146
5.1 Demographic Profile of the Respondents to the In-Situ Survey (N=961) 161
5.2 Demographic Profile of International and Domestic Tourist Respondents to the In-Situ Survey 161
5.3 Age of Sample Compared to Visitors to Australia and Victoria 162
5.4 Demographic Profile of the Respondents to the After-Visit Survey (N=418) 163
5.5 Demographic Profile of International and Domestic Tourist Respondents to the After-Visit Survey 163
5.6 Melbourne Trip Profile of the Respondents to the In-SItu Survey (N=961) 166
XVI

5.7 Melbourne Trip Profile of the International and Domestic Respondents to the In-Situ Survey 166
5.8 Length of Visit of Sample Compared to Visitors to Australia and Victoria 167
5.9 Purpose of Visit of Sample Compared to Visitors to Australia and Victoria 168
5.10 Accommodation of Sample Compared to Visitors to Australia and Victoria 168
5.11 Melbourne Trip Profile of the Respondents to the After Visit Survey (N=418) 169
5.12 Melbourne Trip Profile of the International and Domestic Respondents to the After-Visit Survey 170
5.13 QVM Visit Profile of the Respondents to the In-Situ Survey (N=961) 171
5.14 QVM Visit Profile of the International and Domestic Respondents to the In-Situ Survey 172
5.15 Travel Party of Sample Compared to Visitors to Australia and Victoria 173
5.16 QVM Visit Profile of the Respondents to the After-Visit Survey (N=418) 174
5.17 QVM Visit Profile of the International and Domestic Respondents to the After Visit Survey 175
5.18 Normality of the Cultural Experience Attitudes Data Set 177
5.19 Cultural Experience Attitudes Scores 178
5.20 Normality of the Cultural Experience Motives Data Set 179
5.21 Cultural Experience Motives Scores 180
5.22 Normality of the Cultural Experience Benefits Sought Data Set 182
5.23 Normality of the Cultural Experience Benefits Gained Data Set 183
5.24 Cultural Experience Benefits Sought and Gained Scores 184
5.25 Reliability Analysis of the Survey Instrument 189
5.26 Mann-Whitney U Test of Significant Differences in Demographic, Travel and Trip Characteristics 190
XVll

5.27 Demographic Profile of After-Visit Survey Respondents Compared with Non-After Visit Survey Respondents 191
5.28 QVM Visit Profile of After-Visit Survey Respondents Compared with Non After-Visit Survey Respondents 191
5.29 Mann-Whitney U Test of Significant Differences In Cultural Experience Attitudes 192
5.30 Mann-Whitney U Test of Significant Differences in Cultural Experience Motives 193
5.31 Mann-Whitney U Test of Significant Differences in Cultural Experience Benefits Sought 194
6.1 KMO Sampling Adequacy Results for Sample Suitability for Factorability 206
6.2 EFA on Calibration Sample: Factor Pattern Coefficients for the Four Factors of Cultural Experience Attitudes Derived from Oblique Rotation 211
6.3 CFA on Validation Sample: Factor Pattern and Structure Coefficients for the Four Factors of Cultural Experience Attitudes 214
6.4 Invariance Testing on Validation Sample: Model Fit for Multi-group Model of Cultural Experience Attitudes for Four English-speaking Tourist Groups 216
6.5 Validation of CFA Cultural Experience Attitudes Model with Asian Tourist Sample: Factor Pattern and Structure Coefficients for the Four Factors 218
6.6 Invariance Testing on Asian International Tourist Sample: Model Fit for Multi-group Model of Cultural Experience Attitudes for Two Asian Tourist Groups 220
6.7 EFA on Calibration Sample: Factor Pattem Coefficients for the Four Factors of Cultural Experience Motives Derived from Oblique Rotation 223
6.8 CFA on Validation Sample: Factor Pattern and Structure Coefficients for the Four Factors of Cultural Experience Motives 227
6.9 Invariance Testing on Validation Sample: Model Fit for Multi-group Model of Cultural Experience Motives for Four English-speaking Tourist Groups 229
6.10 Validation of CFA Cultural Experience Motives Model with Asian Tourist Sample: Factor Pattern and Structure Coefficients for the Four Factors 230
XVlll

6.11 Invariance Testing on Asian International Tourist Sample: Model Fit for Multi-group Model of Cultural Experience Motives for Two Asian Tourist Groups 232
6.12 EFA on Calibration Sample: Factor Pattern Coefficients for the Four Factors of Cultural Experience Benefits Sought Derived from Oblique Rotation 235
6.13 CFA on Validation Sample: Factor Pattern and Structure Coefficients for the Four Factors of Cultural Experience Benefits Sought 238
6.14 Invariance Testing on Validation Sample: Model Fit for Multi-group Model of Cultural Experience Benefits Sought for Four English-speaking Tourist Groups 241
6.15 Validation of CFA Cultural Experience Benefits Sought Model with Asian Tourist Sample: Factor Pattern and Structure Coefficients for the Four Factors 244
6.16 Invariance Testing on Asian International Tourist Sample: Model Fit for Multi-group Model of Cultural Experience Benefits Sought for Two Asian Tourist Groups 245
6.17 EFA on Calibration Sample: Factor Pattern Coefficients for the Three Factors of Cultural Experience Benefits Gained Derived from Oblique Rotation 248
6.18 CFA on Validation Sample: Factor Pattern and Structure Coefficients for the Three Factors of Cultural Experience Benefits Gained 252
6.19 Invariance Testing on Validation Sample: Model Fit for Multi-group Model of Cultural Experience Benefits Gained for Four English-speaking Tourist Groups 254
6.20 Validation of CFA Cultural Experience Benefits Gained Model with Asian Tourist Sample: Factor Pattern and Structure Coefficients for the Two Factors 255
6.21 EFA for the Domestic Tourist Sample: Factor Pattern Coefficients for the Five Factors of Cultural Experience Motives Derived from Oblique Rotation 259
6.22 EFA for the New Zealand Tourist Sample: Factor Pattern Coefficients for the Four Factors of Cultural Experience Motives Derived from Oblique Rotation 262
6.23 EFA for the North American Tourist Sample: Factor Pattern Coefficients for the Four Factors of Cultural Experience Motives Derived from Oblique Rotation 264
XIX

6.24 EFA for the United Kingdom and Ireland Tourist Sample: Factor Pattern Coefficients for the Three Factors of Cultural Experience Motives Derived from Oblique Rotation 266
7.1 Summary of Motivational Process Construct Items, Factors and Invariance Testing 272
7.2 Summary Confirmatory Factor Analysis Dimensions for Western Tourist (English-Speaking) Validation Sample 273
7.3 Summary Confirmatory Factor Analysis Dimensions for Asian Tourist (Chinese- and Japanese-Speaking) Sample 273
7.4 Summary EFA Motive Dimensions for Western Tourist (English-Speaking) Subsamples found to be not invariant in the Motive Construct CFA 276
XX

Chapter 1: Introduction
Chapter 1 introduction
1.1 Background
In Australia and many other Western cultures, there Is a history of financial difficulty for locally-
based cultural attractions and events. This is evidenced by detailed documented inquiries into the
performing arts In Australia and the United States (McCarthy et al., 2001; Nugent, 1999). It is also
recently evidenced by major cultural attractions deciding to reduce their operations to balance their
budget. In Melbourne, Australia, the National Gallery of Victoria (NGV) will be the only state art
gallery that closes one day a week from October 3, 2005 despite extraordinarily high attendances
at the institution's two galleries bringing It Into the worid's top 20 most popular art institutions.
Closing one day a week is consistent practice with some of the world's most prestigious and
popular galleries in Europe and the United States, but contrasts with Britain, where the Blair
Government has made a commitment.that all Institutions would be open free seven days a week
(Vaughan cited In Usher, 2005). These attendances at the NGV are all the more significant
because 75 percent of people come from within Victoria (Usher, 2005). Of the remaining balance,
the next largest market Is domestic tourists from interstate and then international visitors. Unlike
Europe or the US, cultural institutions In Australia generally do not have high numbers of
international visitors. One challenge then Is how to increase tourist visitors to these major cultural
attractions and events, especially international visitors.
other cultural attractions and events need to increase attendances per se. This is a current
problem for many performing arts organisations in Western cultures as they experience declining
audience attendances, engagement and participation according to the experienced arts director,
Vallejo Gantner, the artistic director of New York's Performance Space 122, previously director of
Dublin's curated Fringe Festival and former artistic associate of Melbourne's International Arts
Festival. He argues that, "theatre and performance Is in a deeply troubled state, reflected largely in
a decline of audience attendance, engagement and participation ... across the non and for-profit
sectors ... despite often glowing reviews, ... and significant talents of those involved" (Gantner,
2005, pp.1-2).
Related to the need to Increase attendances at cultural attractions and events are the problems of
increasing competition and changing entertainment trends for some key markets. Direct
competition for audiences Is increasing due to an expanding number of cultural attractions and
events on offer, both locally and elsewhere (e.g., Australia Council for the Arts, 1999; Australian
Bureau of Statistics, 2000; McCarthy et al., 2001; Nugent, 1999), to which highly mobile audiences
are willing to travel. Indirect competition comes from an ever-expanding range of entertainment
options largely associated with new technology and changing entertainment preferences in some
key markets such as the youth mari<et. Even the live contemporary music scene laments declining
audiences as the youth market increasingly prefers in-home entertainment options such as

Chapter 1: Introduction
television and videos, burning their own CDs, internet-based entertainment; computer games and
play stations (Kemp, 2000; Nugent, 1999). More recently, In relation to theatre experiences, it has
been suggested that audiences "will at some point decide on the more attractive option of staying at
home, saving on tickets and cabs, and watching the television that theatre has so assiduously
replicated, while being able to eat their tea at the same time" (Gantner, 2005, p.2). He
recommends that theatre practitioners and artists involved must develop audience attendances by
creating experiences that are stimulating, engaging and interactive and, "speak beyond ... look
past the already converted" (Gantner, 2005, p.3).
Growing tourist markets, namely selected significant Asian and other international markets to
Australia, and selected significant interstate markets, represent a new mari<et for locally-based
cultural attractions and events, but the challenge for these organizations Is how to attract more
tourists to attend. Many destinations, such as Melbourne, Australia, are renowned for their cultural
attractions and events and are positioned and marketed as 'cultural capitals' and 'event capitals',
yet little Is known about tourists' attendance at cultural experiences, especially the more
temporal performing arts-based cultural experiences. Of the cultural tourism related research
and literature to date, most has focused on Identifying cultural tourists per se, "the converted", and
understanding their motivations for attending cultural experiences which has been situational to
specific types of cultural experiences. By undertaking this research at one of Melbourne's major
attractions, the Queen Victoria Market, rather than at cultural attractions per se, the potential of
growing tourist markets for cultural experiences Is a focus of this research that contributes
to exploring an identified gap in tourism literature and research. With Melbourne's reputation
as a cultural and event capital. It is appropriate to undertake research of tourists' cultural experience
motivation at this destination as proposed in this study.
Fundamental to attracting tourists to attend such attractions and events is the consumer
behaviour perspective of understanding what motivates growing selected tourist markets to
attend (or not attend) different types of cultural attractions and events on offer at the
destination. This understanding is of particular relevance to developing and undertaking
appropriate and effective marketing activities such as segmenting the market, identifying target
markets, developing positioning and communication strategies. Consumer motivation research,
however, is a complex area of study whereby experienced researchers in experiential consumption
(Holbrook and Hirschman, 1982), summarise that, "one cannot reduce the explanation of human
behavior to any narrowly circumscribed and simplistic model ... the behavior of people In general
and of consumers in particular is the fascinating and endlessly complex result of a multifaceted
interaction between organism and environment" (p.139).
Just as the study of consumer behaviour has evolved from an eariy emphasis on rational choice
(microeconomics and classical decision theory) to the use of logical flow models of bounded
rationality such as the now ubiquitous information processing model first proposed in 1979
(Bettman, 1979), it is also evolving from its early focus on the utilitarian functions and objective

Chapter 1: Introduction
features of largely tangible products. More recently researchers have called for the inclusion of
experiential consumption phenomena (Hirschman and Holbrook, 1982; Holbrook and Hirschman,
1982) which are more subjective product characteristics that have been neglected and ignored in
earlier consumer behaviour research and yet may be of relevance for all products to some degree
(Levy, 1959), and are particulariy salient to playful leisure and entertainment activities, and the arts.
These phenomena focus on the symbolic, hedonic and aesthetic nature of consumption such as
sensory pleasures, aesthetic enjoyment, emotional responses, and symbolic benefits. Accordingly,
the experiential perspective supports a more energetic Investigation of multi-sensory psycho
physical relationships In consumer behaviour.
Cultural experience tourism encompasses cultural and arts activities undertaken in a leisure and
often pleasure context and so this research of International and other groups of tourists in relation
to these activities will incorporate some psychological affective and cognitive constructs as well as
some behavioural constructs of relevance to the experiential perspective of tourist motivation and
behaviour.
International tourism and International marketing are cross-cultural by nature and International
tourists are important markets for most destinations, yet only a small portion of the vast body of
literature on tourist motivation and behaviour considers cross-cultural differences. The Influence
of culture on leisure travel, and knowledge and understanding of cultural differences, are
themes that have not received enough attention in the travel and tourism literature, despite
culture being one of the strongest Influences on tourists' motives, choices. Intentions and
purchases on a global scale (Reisinger, 2005). By incorporating a culture variable Into this
research of tourists' cultural experience motivation, this research contributes to exploring
another identified gap in tourism literature and research.
1.2 Research Objectives
The main goal of this research Is to develop an understanding of tourists' motivational process to
attend cultural attractions and events and the associated cultural consumption experiences when
holidaying at the major city destination of Melbourne, Australia.
To address the fundamental research question of why tourists, particulariy International visitors and
domestic interstate visitors, might attend cultural attractions and events when on holiday, several
sub-questions need to be researched:
1. what are tourists' motivations towards attending cultural experiences In general and
especially while travelling?
a. what do tourists like in terms of different types of cultural attractions and events,
and cultural consumption experiences?

Chapter 1: Introduction
b. what drives tourists to go to cultural attractions and events while travelling?
c. what benefits do tourists expect from cultural experiences?
d. what benefits do tourists gain or receive from cultural experiences?
2. are there differences in these motivational process elements for attending cultural
experiences while on holiday for different cultural groups of tourists?
3. how these motivational process elements influence decisions to attend cultural attractions
and events, and related behavioural outcomes of satisfaction, likelihood to revisit or
recommend to others?
4. can the reasons why tourists attend cultural experiences (that is, their motivation) be used
to segment the cultural experience tourist mari<et into target market groups and to develop
effective marketing strategies for attracting tourists to cultural attractions and events?
To explore why tourists attend (or do not attend) cultural attractions and events, a conceptual
model of the motivational process for cultural experience tourists is proposed for empirical testing in
this study. It provides a base from which to develop the study's hypotheses and investigate the
selected constructs proposed In the model as being essential to the tourist's motivational process
for cultural experiences. Testing the proposed conceptual model therefore involves measuring the
selected unobserved latent attitudlnal and behavioural constructs Identified as being of proven
relevance to the motivational process, exploring the nature of the underiying dimensions of these
attitudinal and behavioural constructs in the cultural attraction and experience context, and also
Inferring any cause and effect relationships between the constructs. Of particular interest in this
cross-cultural study is whether there are differences in the cultural experience motivational process
for different cultural groups of tourists. Including cultural differences In any of the constructs In the
motivational process, their underiying dimensions, and their interrelationships, and whether these
differences can then be used as possible market segmentation grouping dimensions for cultural
experience tourists.
1.3 Aims of tlie Researcli
The aim of this research Is to extend understanding of cultural experience motivation and behaviour
for selected Asian and other tourist markets, especially understanding of the specific role of
attitudes, motives, benefits sought and benefits gained in the motivational process, and whether
there are cultural differences within these. This understanding is for the purpose of determining the
new audience potential of these markets to Australia for live, locally-based cultural experiences,
and the associated effective mari<eting strategies necessary to attract these tourism markets.
The specific aims are to explore and empirically test:

Chapter 1: Introduction
i) A proposed conceptual model based on the existing research and literature of the
determinant variables in the motivational process for tourists to attend and consume cultural
experiences with the major components to be examined comprising the psychographic
constructs of attitudes, motives, and expected benefits sought, and the related behavioural
construct of benefits gained.
ii) Observed measurements based on the existing research and literature for measuring each
of these determinant variables in the motivational process conceptual model and their
underiying dimensions, all of which are unobserved latent constructs suitable for testing by
developing measurement models and testing the fit of the data to the hypothesised models.
ill) The significant underiying dimensions and structure for each of the delineated attitudinal and
behavioural variables identified in the motivational process conceptual model, and how these
compare with existing research and literature findings of the underiying dimensions of these
variables. Including whether there are cultural differences in these underiying dimensions.
From these empirical tests of the motivational process constructs and their underiying dimensions,
inferences will be drawn about the cause and effect interrelationships between the variables and
underiying dimensions. Further aims in relation to these Inferences are to specifically explore:
iv) The new audience potential in Australia of inbound tourists from selected major markets In
Asia and other international areas, and domestic tourists from selected significant interstate
markets, for cultural experiences based on these cultural experience motivational variables
and underiying dimensions.
v) The motivational process variables and their underiying dimensions for international and
interstate tourists attending cultural experiences, and whether there are cultural differences
within these relationships.
The marketing Implications of these empirical tests and Inferences will also be considered and
further aims in relation to these marketing implications are to specifically explore:
vi) The market segmentation implications of the findings for the cultural experience
motivational process constructs, their underiying dimensions and any cultural group
differences
vll) The implications of all the above for developing effective marketing and public
relations strategies to attract these tourist markets to cultural experiences
1.4 Contribution to Knowledge
Recent enquiries Into the performing arts in Australia as well as the United States, identify audience
development, audience diversification, and arts mari<eting including market segmentation analysis

Chapter 1: Introduction
as priorities for the perfomiing arts (Australia Council for the Arts, 1999; Nugent, 1999; McCarthy et
al., 2001). Stimulating the demand for the arts is an acknowledged need in contrast with the past
half-century concentration on assisting supply of the arts (McCarthy et al., 2001). The increasing
role of the mari<etplace, marketing and mari<eters in the delivery of the arts is also acknowledged
(McCarthy et al., 2001). Future research needs associated with these trends include an improved
understanding of audiences, especially their composition and needs, to enable Improved target
mari eting of performing arts (Australia Council for the Arts, 1999) and better knowledge of how
individual tastes for the arts are fomned and how the benefits of the arts can be identified and
measured so that more diversified and innovative arts marketing approaches can be explored
(McCarthy et al., 2001). As ethnic groups within many major urban centres grow, ethnic preference
for the arts and Increasing arts attendance by ethnic groups are also growing in importance (Kolb,
2002).
The research proposed in this study develops a new analysis In marketing that links the audience
for cultural experiences to the new tourism marketplace. There is no current literature that analyses
and develops a model for the determinants of cultural experience motivation derived to capture the
new tourism markets for cultural experiences. In doing so, this study makes a significant
contribution to knowledge. Specifically, this research advances the understanding of cultural
experience tourist motivations and behaviour, which in turn informs marketing strategies and
activities for attracting tourist markets to locally-based cultural attractions and events, and thereby
Increasing attendances at these cultural experiences from the new tourism markets. The proposed
study Is highly significant for both the marketing and tourism literature in contributing to the gap In
current knowledge concerning the factors that trigger and drive tourist behaviour towards attending
cultural experiences to enable the broad potential of tourism as a new market for local cultural
attractions and events to be defined, and effective marketing segmentation and strategies for
attracting tourists to cultural experiences to be developed.
In addition, it makes a significant contribution to cultural tourism knowledge, chiefly the effective
marketing of local arts and culture to tourist markets. While It focuses on cultural experience
tourism and mari<ets for cultural attractions and events in Melbourne, Australia, the findings will
make a significant contribution to the knowledge of marketing any form of local arts and culture to
tourist mari<ets generally. Particular significance lies in the importance of knowledge to maintain a
diverse range of live, locally-based performing arts in Western culture at a time when government
funding is declining and new markets are needed. Also of particular significance, is the importance
of determining how to attract new tourists to Australia and Melbourne and thereby increase inbound
tourism cultural expenditure at these destinations.
Theoretically and conceptually, the basis of this proposed research will be previous research on
understanding tourist motivation and behaviour for developing multi-dimensional typologies and
segmentation approaches as advocated by several authors In relation to cultural, heritage and
nature tourism for international travellers (Alzua et al., 1998; Lang and O'Leary, 1997). Integrating

Chapter 1: Introduction
attitudinal as well as behavioural characteristics In multi-dimensional segmentation is considered to
overcome a shortcoming of much market segmentation research in a tourism context to date which
has typically derived groups by clustering respondents on the basis of only one dimension i.e.
behaviours or attitudes (Alzua et ai, 1998). If the Asian and other International Inbound tourism
markets as well as selected interstate tourist markets for cultural experiences can be subdivided by
distinguishable attitudinal and behavioural characteristics into differentiated groups in accordance
with the accepted theoretical principle of market segmentation In general (Kotler, 1997) and for
tourism mari<ets specifically (Middleton and Clarke, 2001; Monrison, 2001; Smith, 1989), then this
marketing theory advocates developing unique marketing strategies for each of these groups.
From a consumer behaviour perspective, the study will contribute to the understanding of the
affective, attitudinal and experiential views of cultural consumption in a tourism context, and to the
motivational process associated with this type of consumption. The specific cultural consumption in
a tourism context of Interest to this study Is the consumption of cultural attractions and events by
international tourists and domestic interstate tourists. The specific motivational process variables of
interest In this study are the attitudinal variables of attitudes, motives, and benefits sought in
attending and consuming cultural experiences and the related behavioural outcome of benefits
gained from cultural consumption experiences. The dimensions underiying each of these
motivational process variables are also of interest in this study and include socio-psychologically-
related experiential dimensions as well as tangible attribute-related dimensions. Whether there are
cultural differences in these motivational process variables is of further interest in this study. As
noted eariler In the background to this study, cross-cultural research of tourist consumer behaviour
Is crucial to tourism and marketing as culture is one of the strongest influences on tourists' motives
and other behaviours, but is an under-researched area to date. By researching tourists'
motivational process for different cultural groups of tourists, this research contributes to an identified
gap In tourism consumer behaviour knowledge that in turn further contributes to cultural tourism
and tourism marketing knowledge.
Benefits are incorporated within this study because of the increasing use and proven advantage of
benefit segmentation for dividing travel and tourism markets into their component segments
(Frochot and Morrison, 2000; Loker and Perdue, 1992; Woodside and Jacobs, 1985). Within
segmentation work to date, one crificism has been its main use to merely describe groups of
people, a priori methods, rather than to predict or explain behaviour, a posteriori methods (Morrison
et al., 1994; Smith, 1989). Benefit segmentation is considered one example of an a posteriori
market segmentation method because the composition of segments is unknown in advance of
analysis (Frochot & Morrison, 2000). By Incorporating a posteriori segmentation methods which
explain and possibly predict the behaviour of groups of people, a further aim is to contribute to the
body of knowledge and understanding of explaining market behaviour rather than merely
describing It and thereby to be of use to practitioners as well as academics.

Chapter 1: Introduction
Frochot and Monrison (2000) further attribute the popularity of benefit segmentation in travel and
tourism research to the belief that benefits are related to travellers' motivations, however they also
acknowledge that the exact link between benefits sought and motivation Is still to be tested and
proven, an area to which this research aims to make a contribution. Rather than using either
general benefits sought or benefits gained as the segmentation grouping variable, this study
proposes measuring both, identifying the former as an attitude and the latter as a behaviour. This
will be a unique contribution to the tourist market segmentation area, where traditionally, benefit
segmentation studies have been undertaken extensively but have tended to focus on one type of
benefit or the other. Tourism benefit segmentation studies that measure and group the market by
two types of benefit measures (one attitude-related and the other behaviour-related) are extremely
rare. Where two measures have been used. Interaction between them is seldom considered. One
recent exception is research of cultural tourists In Hong Kong (McKercher and du Cros, 2003)
which identifies five benefit segments based on two dimensions: centrality of cultural tourism
motives in decision to visit, and depth of experience. The former dimension could be considered
attitude-related and the latter, behaviour-related. Many tourist segmentation studies, group on one
variable such as activities undertaken, benefits sought, benefits gained, and use measures of
motivation as group descriptors. This study aims to test whether combinations of the motivational
process related variables of attitude, motives, benefits sought and benefits gained can be used as
the main segmentation grouping variables for cultural group mari<ets of international and other
tourists for cultural attractions and experiences.
By using the gap between expected benefits sought and benefits gained to infer satisfaction and
the disconfirmation of people's expectations (positively or negatively), this approach used In this
study also builds upon the extensive work already undertaken in relation to on benefits (sought and
gained) in the tourism literature but this time applying them as a measure of satisfaction as well as
a possible variable for market segmentation purposes. Hence this study aims to make a
contribution to the measurement of satisfaction and service quality In a tourist context, which builds
upon the benefit (sought and gained) scales, Items and grouping dimensions that have been
developed and tested In previous tourist segmentation research. In so doing it will make a
contribution to measuring tourism benefits (sought and gained) for satisfaction and service quality
purposes as well as for market segmentation purposes.
On a language basis, cultural tourism markets In Australia can be considered in three main groups:
i) international tourists from North-East and South-East Asia who are currently the largest Inbound
markets for tourism (40%) (Bureau of Tourism Research, 2003) and cultural tourism to Australia
(45%) (Foo and Rossetto, 1998), and several of these markets have been experiencing
considerable recent growth; ii) International tourists from English-speaking countries especially, NZ
(16% of total inbound visitors), UK (13%), and North America (9%) (Bureau of Tourism Research,
2003); and iii) local English-speaking non-international tourists. The third group comprises
interstate, intrastate and day visitors who differ by distance travelled but otherwise have been
considered one market with similar cultural tourism interest. Involvement, motivations. Influences,

Chapter 1: Introduction
mari etlng needs and responses. Very little research has been undertaken into selected North-
East and South-East Asian Inbound markets due to language differences presenting research
complexities, with the majority of research on inbound cultural tourism in Australia, undertaken to
date, focusing on English-speaking mari<ets, especially those firom United Kingdom, North America,
and New Zealand. This study therefore proposes in-depth research of several of the main cultural
tourist markets in Australia, including some markets of the most under-researched market of the
three, that is, selected North-East and South-East Asian markets.
Furthermore, recently published academic research of intemational tourist motivations emphasises
conflrmation by previous research of a need for segmentation of tourists by nationalilty and the
importance of establishing specific marketing strategies for each national market (Kim and
Prideaux, 2005). Despite this confimned need, they further acknowledge, "there remains both a
lack of empirical findings ... and a lack of multinational studies that include both Western and Asian
tourists" (p.348). Their research focused on marketing implications arising from a comparative
study of international pleasure tourist motivations and other travel-related characteristics of visitors
to Korea. This study of tourist motivation for culhjral experiences In Melbourne aims to make a
contribution to this gap in the body of knowledge by contributing empirical findings about tourist
motivation that are multinational, include both Western and Asian tourists, as well as considering
the marketing implications arising from this comparative study of tourists' motivational process for
cultural experiences.
1.5 Significance of the Study
Victoria has long been regarded as one of Australia's most cultural states and Melbourne, the
'Cultural Capital of Australia' (Tourism Victoria, 2002). Based on these strengths,
opportunities abound for increasing visitation and economic Impact to Victorian arts, theatre
and cultural heritage product, as well as to position Melbourne as a cultural destination of
international renown.
Mindful of these strengths and opportunities, In recent years the Victorian Government has
worked to ensure that arts and cultural heritage positioning is enhanced through many
Important arts and cultural heritage capital works projects, the development of Victoria's Arts,
Theatre and Cultural Heritage Tourism Plan 2002-2006 (Tourism Victoria, 2002), and State
Government funding and research initiatives for cultural tourism. Through the recent process
of developing this Plan, Tourism Victoria identified gaps in the data and funded market
research to be undertaken of the motivation and behaviour of interstate cultural tourists
(Tourism Victoria, 2004a).
Gaps in the data continue to be detailed information about international tourists' motivation
and behaviour towards cultural experiences except for some limited information at the
national level available from the International Visitor Survey (e.g., Bureau of Tourism

Chapter 1: Introduction
Research, 2003) and about interstate tourists' motivation and behaviour In relation to
specific cultural attractions and events.
While cultural tourism strengths and opportunities abound in Melbourne, there is ongoing
competition from Sydney as revealed in recent national research on destination Brand Health
undertaken annually by Roy Morgan Research Company on behalf of Tourism Victoria since
1996. Recent findings from this survey (cited In Tourism Victoria, 2002) reveal Melbourne's
position as a host city for International sporting and cultural events Is recovering from the stiff
competition of Sydney and the aftermath of the Olympic Games. Nationally, Melbourne
dominates as a destination with a reputation as a great city for theatre. Victoria's perceived
status as a destination for unique history and heritage has remained relatively stable over the
period 1996-2001 at around 10%, while New South Wales Is the current leader for this
attribute at 24% (Tourism Victoria, 2002).
This proposed research into International and domestic interstate tourists and their cultural
experience tourism motivation and behaviour that focuses on Melbourne is therefore much
needed by Melbourne cultural attractions and events in general, as well as by Melbourne
destination marketing organizations.
This proposed study alms to focus in some detail on tourist motivations and other relevant
personal and travel-related characteristics of tourist visitors to Melbourne attending local
attractions and events while on holiday here, specifically exploring their motivation and
behaviour In relation to attending cultural experiences. Tourists will be sampled at the Queen
Victoria Market (QVM). This site has been selected because research identifies markets as
an important attraction for tourist visitors (international and domestic) in Australia, Victoria
and Melbourne. Going to markets Is one of the top 15 activities for international and
domestic overnight visitors to Victoria and Australia and it is among the top three most
popular activities for International overnight visitors in Australia and Victoria (Tourism Victoria,
2004b). Visiting markets was the third most popular activity for International visitors in
Australia with 50 percent of these visitors doing so. International visitors to Victoria were
even more likely than the national trend to visit markets (53%) which was the second most
popular activity after shopping for pleasure (70%) and ahead of going to the beach (49%).
Visiting museums or art galleries and visiting history, heritage buildings, sites or monuments
also ranked in the top 15 for Victoria and nationally with higher percentages of international
visitors in Victoria compared with the national trend, (34% cf 25% and 31% cf 27%
respectively for the two groups of cultural related activities). The higher visitor percentages in
Victoria, reinforce Victoria's previously claimed position as one of Australia's most cultural
states and justification for undertaking this research of tourist cultural experience motivation
and behaviour In Melbourne, Victoria. Participation rates for all three types of activities
however, have potential to be increased if more international tourist visitors could be attracted
to these activities, and this study's contribution to knowledge will enable the relevant industry
10

Chapter 1: Introduction
sectors - such as the cultural attractions and events as well as tourism service providers - to
apply some of the knowledge to practice and thereby increase cultural experiences by
International tourists within Melbourne, as well as being of possible relevance to regional
Victoria, elsewhere in Australia, and even other Western destinations that have similar
cultural attractions and attract similar international tourist markets.
The top 15 activities for domestic overnight visitors to Victoria (Tourism Victoria, 2004b)
include going to markets both nationally (6%) and for Victoria (6%), but these are much lower
percentages than those for international tourists. Only one other cultural activity Is included
in the top 15 for domestic tourists whereby visiting history, heritage buildings, sites or
monuments attracts a similar percentage of visitors for Victoria (5%) and nationally (5%).
Inclusion of visiting markets and one other cultural activity within the top 15 activities for
domestic tourists In Victoria and Australia, uphold Victoria's previously claimed position as
one of Australia's most cultural states and justification for undertaking this research of tourist
cultural experience motivation and behaviour In Melbourne, Victoria. The percentage of
domestic tourists undertaking these activities, however, are considerably lower than the
percentage of International tourists undertaking similar activities. Participation rates for these
two types of activities therefore have even greater potential to be Increased If more domestic
overnight tourist visitors could be attracted to these activities. Hence, the application of this
study's contribution to knowledge could be applied to even greater effect in relation to
domestic overnight visitors and Increasing their participation in cultural experiences within
Melbourne, as well as being of possible relevance to regional Victoria, elsewhere In Australia
with similar domestic tourist markets, and even in other Western destinations that have
similar cultural attractions and attract Australian tourists. These percentages therefore justify
inclusion of domestic tourists in this study and due to the significantly lower participation rates
by domestic tourists compared with International tourists, it could be argued that there Is even
greater need for research of domestic overnight visitor's participation in cultural experiences.
Eight key markets have been selected as the further focus of this research: five international
tourist markets and three domestic interstate tourist markets. A cross-national comparative
study of five key international markets for Melbourne is proposed: tourists from North America
and Canada, United Kingdom and Ireland, New Zealand, and the two Asian markets of
Chinese-speaking tourists and Japanese tourists. These five markets have been selected
because of their Importance and growth potential. Victoria attracted more than 1.3 million
international visitors in 2004 and this is a market share of 27.4 percent of international visitors
to Australia (Tourism Victoria, 2005b). Five of Victoria's six largest International markets
have been selected for this study: New Zealand (NZ), United Kingdom (UK), United States
(USA), China and Japan. Europe Is the other major market not Included In the study.
Asian markets, especially China, are important in terms of their recent growth, current size
and yield, and future potential. China currently ranks as Victoria's fourth highest international
11

Chapter 1: Introduction
market by visitor numbers (94,000) and second highest by yield (Victorian Government,
2005). Tourism growth projections by Tourism Victoria (cited In Victorian Government, 2005)
highlight an increasing importance of international markets with Asia and China performing
particularly strongly. Over the next 10 years, 70 percent of tourism growth will come from
International markets and domestic market growth will shrink from Its recent contribution of 50
to 30 percent. Asia could represent a significant proportion of overall tourism growth
accounting for over 40 percent of international tourist numbers and over 50 percent of yield.
By 2015, China is forecast to be Victoria's largest single country market accounting for 19
percent of both international visitor numbers and yield. In addition, four of Victoria's current
next largest ranking markets are Asian and contribute additional Chinese speaking
international tourists: Malaysia, Singapore, Hong Kong and Taiwan. Victoria's current market
share for each of these Asian markets is about 30 percent and all are forecast to neariy
double in growth over the next 10 years (Tourism Victoria, 2005b). These are strong grounds
for selecting Chinese-speaking international tourists as a focus for this study.
Japanese tourists are another Asian market selected as a focus for this study because they
are currentiy Victoria's sixth largest international tourist market attracting 70,000 visitors in
2004. Although Victoria's market share of Japanese visitors to Australia is only 10 percent
and projected growth rates for the next 10 years are the lowest for the Asian markets, in 2015
Japan Is projected to be Victoria's eighth largest market and the second largest Asian market.
For the domestic tourist market, the key Interstate markets of New South Wales (NSW),
South Australia (SA), and Queensland (Qld) have been selected as a focus in this study
because these are the three largest interstate markets for Victoria and they were also the
markets Involved in Tourism Victoria's quantitative research study examining the motivations
and behaviours of Interstate visitors who attend cultural attractions and events (Tourism
Victoria, 2004a). Interstate visitors to Victoria account for 29 percent of total domestic visitors
and more than 50 percent of these are from NSW (more than 2.6 million in year ending
March 2005) (Tourism Victoria, 2005a). The next largest interstate visitor markets are SA
and Queensland, contributing 16.9% (887,000 visitors) and 15.5 percent (811,000 visitors)
respectively. From the previous discussion of the top 15 activities for all domestic overnight
visitors it was noted that going to markets and visiting history, heritage buildings, sites or
monuments ranked lowly in these activities (6% and 5%, respectively) and were the same
percent for visitors to Victoria compared with the national trend (Tourism Victoria, 2004b).
From the research of Interstate cultural tourists to Victoria (Tourism Victoria, 2004a), It is
evident that the top three activities participated In on a domestic Interstate leisure trip were
visiting a heritage site or building (63%), visiting an art gallery (38%) and visiting a museum
(37%). Interstate cultural tourists visiting Victoria were more likely than the national trend for
total interstate cultural tourists to visit an art gallery (43% cf 38%), a museum (42% cf 37%),
the theatre (19% cf 17%), an arts or cultural festival (14% cf 13%), and the ballet (3% cf 1%).
Other performing arts experiences generally attracted much lower percentages of interstate
12

Chapter 1: Introduction
cultural tourists both to Victoria and nationally. Experiencing aboriginal art, craft or cultural
displays was the highest ranking of these activities and Interstate cultural tourists to Victoria
were less likely to attend than the national trend (26% cf 34%). Attending the opera, or
various types of music programs all attracted less than 10% of Interstate cultural tourist to
Victoria and nationally. These statistics Indicate Victoria's reputation for its theatre and ballet,
but they also Indicate potential to Increase the percentage of attendances to performing arts
experiences in particular by interstate cultural tourists to Victoria as well as interstate tourists
generally. This study aims to make a further significant contribution to this area.
This research focuses on the marketing of cultural experiences to selected international and
interstate tourism markets and Is of particular relevance to developing new audiences for locally-
based cultural attractions and events from the emerging inbound Asian and other selected
International and Interstate tourist markets. To attract audiences from these new and growing
Inbound tourism marketplaces to cultural experiences in Australia would Increase inbound tourism
cultural expenditure, which in turn Increases Australia's foreign exchange and develops the arts as
an export industry. For example, a small percentage increase of the current inbound Asian tourism
market at locally-based performing arts perfomnances could yield large numbers of attendances
and generate substantial additional earned revenue for performing arts organizations based on
average ticket prices. In addition, selected Asian and other International markets are
demonstrating the greatest growth among the various international tourist markets to Australia, and
therefore represent even greater significance to performing arts audiences and potential revenue.
The proposed research is significant for both the tourism and the arts sectors of the Australian
economy. The significance from the perspective of the individual perfomiing arts organization, can
be exemplified by the Melbourne Theatre Company. If it attracted five percent of current Asian
International tourists to Victoria (473,358 visitors), there would be 23,667 new audience members a
year which would result In $1,065,055 additional earned revenue at the average ticket price of $45.
If it attracted five percent of current interstate tourists to Victoria from the key markets of SA, NSW
and Queensland (4.3 million visitors and 82% of total Interstate market to Victoria) - which would be
a similar percent as the number of all domestic visitors to Victoria that visit history and heritage
(Tourism Victoria, 2004b) - there would be 216,650 new audience members a year which would
result in more than $9.7 million additional earned revenue at the average ticket price of $45.
The majority of cultural tourism related research to date has focused on Identifying cultural tourists
per se by focusing on attendees and understanding their motivations for attending cultural
experiences in a situational context at specific cultural experiences. In contrast, this study focuses
on the potential of eight major tourist markets for Melbourne, Australia as new audiences for
various different types of cultural attractions and events. In using a research approach that
explores the motivational process of these different population groups for cultural experiences by
sampling tourists at one of Melbourne's major attractions, the Queen Victoria Market, the study's
findings extend beyond individual locally-based cultural attractions and events at one particular
13

Chapter 1: Introduction
destination and could be of significance to various relevant industiy sectors and service providers
within the arts and tourism.
It could be of relevance to all local cultural attractions and events increasing their local audiences
from different ethnic groups or attracting new local markets of various ethnic backgrounds. In
addition, although there Is a further focus on Melbourne-based cultural attractions and events, the
study is also of relevance to these forms of cultural experiences located elsewhere In Australia or
other developed countries. As Indicated earlier in tiiis chapter, this could be achieved by this
study's contribution to knowledge enabling the relevant industry sectors - such as the cultural
attractions and events as well as tourism service providers - to apply some of the knowledge to
practice and thereby Increase cultural experiences by international tourists within Melbourne, as
well as being of possible further relevance to regional Victoria, elsewhere in Australia, and even
other Western destinations with similar cultural attractions and international tourist markets. It has
also been argued in this chapter that the application of this study's contribution to knowledge could
be applied to even greater effect In relation to domestic overnight interstate visitors and Increasing
their participation In cultural experiences within Melbourne, regional Victoria, elsewhere in Australia
with similar domestic tourist markets, and even In other Western destinations that have cultural
attractions and that atti-act Australian tourists.
14

Chapter 2: Literature Review
Chapter 2 Literature Review
2.1 Introduction
Despite an environment conducive to cultural experience tourism by international and Interstate
tourists, academic research has not sufficientiy addressed the potential of this phenomenon.
Associated with this conducive environment, is the apparent importance of and need for cross-
cultural research to identify and develop some of these tourist markets and to develop appropriate
marketing strategies to attract these tourists to these tourism resources. Relevant existing studies
have been either cross-cultural research of tourism or cultural tourism In general, or cross-cultural
equivalence research of event motivation. Cross-cultural studies of tourists' potential for attending
cultural attractions and events have been limited to date.
This proposed research focuses on cultural experience tourism by international and interstate
tourists in Australia and the role of effective marketing strategies with particular reference to live,
local performing arts, as there is a lack of research on cultural experience tourism in general, and
the perfomiing arts provide a major source of supply for cultural experience tourism. From the
performing arts perspective, arts marketing and audience development are priorities In Australia
acknowledged by the peak arts body (Australia Council for the Arts, 1999). Diversifying audiences
and Increasing attendances are considered to enhance the sustalnablllty and success of the
performing arts sector.
The following literature review defines cultural experience tourism and considers the significance of
attendance by international and interstate tourists from the literature on cultural tourism and cultural
event tourism literature, including identification of types of cultural experiences available for tourist
markets. From the literature, the relevant factors influencing cultural experience tourist motivations,
decision-making and behaviour are then identified, including the role of marketing in attracting
these tourists, especially the application and use of market segmentation, and the role of culture as
a determinant of these tourists' motivation. This literature review guides the development of a
conceptual framework on which the proposed research is based, a summary of which is presented
as a research model at the end of the literature review.
2.2 Background: The Cultural Attractions' and Events' Perspective
2.2.1 Needs of Cutturai Attractions and Events in the Tv\renty-First Century
In the performing arts artform, a recent major report on the performing arts in the United States over
the past thirty years provides recommendations for their future well-being (McCarthy et al., 2001),
thereby Identifying some familiar current challenges for live performances. Financial pressures,
especially for medium-sized organizations, an increasingly competitive leisure market, and the
impact of new technologies, especially recordings and broadcast performances via various media
including the Internet and digital technology, are identified as particular challenges. While the
15

Chapter 2: Literature Review
number of organizations and performing arts infrastructure venues have increased during the
1980s and 90s, their real revenues have declined. Audience growth has occun'ed in the same
period, but has largely resulted from population growth and Increasing education levels, rather than
an increase in the percentage of the population that engages in the arts. Therefore, futijre
attendance levels may weaken. Mid-sized, nonprofit organizations are facing the greatest difficulty
In attracting enough of the public to cover their costs and are most likely to disappear In the future.
Hence the report's most Important recommendation. Is the need to stimulate demand for the arts in
contrast with the concentration over the past half-century on building and strengthening supply of
artists, organizations and productions. Another finding of relevance to this study, Is the
acknowledgement of the increasing role of the marketplace, marketing and marketers in the
delivery of the arts. Associated with this trend, future research needs identified in the report, are the
examination of how individual tastes for the arts are fomied and how the benefits of the arts can be
Identified and measured so that more diversified and innovative approaches to promoting the arts
can be explored.
Some similar findings have been reported in relation to the performing arts In Australia, especially
financial pressures. Increased competition due to an increased number of perfomiing arts
organizations, venues and productions, and the importance of audience development and
marketing (Australia Council for the Arts, 1999; Australian Bureau of Statistics, 2000; Nugent,
1999). Some key areas of growth Include self-entrepreneuring by subsidised venues,
entrepreneuring of international productions (including spectaculars). Increase in number of,
funding for, and attendances at major festivals, and touring activities by the major companies both
within and outside their home State (Nugent, 1999). Most Australian States and Territories hold
regular arts festivals, some on an annual basis (e.g. Melbourne Festival; Perth Festival, Sydney
Festival), others every two years (e.g. Adelaide Festival; Brisbane Festival). The impact of festivals
throughout the 1990s Increased in terms of number Of festivals, audience attendances, government
funding and private sector support (Arts Victoria, 2000; Australian Bureau of Statistics, 2000;
Nugent, 1999).
An enquiry into 31 major performing arts organizations (Nugent, 1999) found the vast majority are
facing high and escalating fixed costs associated with lead times that determine how long in
advance a company's cost structure becomes fixed. Primary cost drivers are labour, public
expectations of production values, advertising rates, and venue hire charges. Production costs
(Including royalties) for a new work or a new production of an existing work In 1997 ranged from
more than $700,000 for major dance and opera performances to an average of $200,000 for major
theatre productions (Nugent, 1999). Competition also exists between artforms and has increased
especially as the size of audiences who crossover between the artforms Increases. Established
theatre, opera and ballet have been most affected by alternative fonns of entertainment that include
new entrants such as festivals, and the rise of large scale commercial musicals, opera and dance
spectaculars, as well as film and CDs (Nugent, 1999).
16

Chapter 2: Literature Review
In comparison with their international peers in the US and the UK, some Austi alian major
perfomiing arts companies generate more of their revenue from box office ticket sales, including
The Australian Ballet, Opera Australia, Melbourne Theatre Company (MTC) and Sydney Theati-e
Company (STC). Consequentiy, in terms of revenue generation, these companies are classified as
a 'box office led' model in contrast with the prevailing models in the US and the UK that are more
'private sector" for the former, and 'government led' for the latter (Nugent, 1999). Therefore,
audience development and the role of marketing In attracting audiences are even more crucial for
major perfomiing arts companies in Australia.
Z2.2 Arts Marketing and Audience Development
Arts marketing and audience development are also priorities in Australia acknowledged by the peak
arts body, the Australia Council as, "developing new audiences, diversifying audiences and
Increasing attendances enhances the sustainability and success of the performing arts sector"
(Australia Council for the Arts, 1999). In relation to arts marketing and audience development, the
Australia Council further acknowledges, "an Important first step is to understand the composition
and needs of particular audiences so that marketers can strategically target promotion of specific
performances".
These research findings emphasising a need for increased perfomiing arts attendances, audience
development and audience diversification, highlight the potential of growing tourist markets as new
markets for the performing arts and the important role of marketing in attracting any market as an
audience. Knowledge of how to attract tourist markets to locally-based, cultural attractions and
events is important from the perspective of the arts organizations as well as from a tourism
perspective. For the arts organisations, attracting tourist markets will contribute to maintaining a
diverse range of local cultural experiences in Western cultures. If Inbound tourists are attracted to
local cultural experiences, this further develops the arts as an export Industry. From a tourism
perspective, attracting tourists to local arts experiences Increases tourists' cultural experiences and
expenditure and may result In new tourists being attracted to a destination. If inbound tourists are
attracted, this in turn increases the destination's foreign exchange earnings. While this research
focuses on arts attractions and events as cultural experiences for tourists, itis also of relevance to
the marketing of other fomis of cultural attractions and events to tourist markets generally.
Similariy, while it largely focuses on tourism at cultural attractions and events in Melbourne,
Australia, it Is of relevance to cultural experience tourism located elsewhere in Australia or otiier
developed countries.
2.2.3 Arts Audience Characteristics and Motivations
From the arts perspective in Australia, some research has been undertaken of performing arts
audiences, their characteristics and factors influencing performing arts motivation and decision
making (Arts Victoria, 1997a, 1997b, 1997c; Australia Council for the Arts, 1999), and of marketing
17

Chapter 2: Literature Review
performing arts (e.g., Australia Council for the Arts, 1999), but none of this research includes tourist
audiences or mari<ets.
Research of perfomiing arts audience profiles Includes audience demographic and psychographic
characteristics, attendance motivations, banriers to increased attendance, and influences on the
decision to attend (Arts Victoria, 1997a,b,c).
2.2.4 Marketing Cutturai Experiences to Tourists
Very little of the above mentioned literature and research focuses specifically on the mari<eting of
cultural tourism or arts tourism (Zeppel and Hall, 1991) or the marketing of cultural experiences to
tourists. Other marketing related examples focus on the marketing of cultural heritage (Thorburn,
1986), marketing of tourist attractions, events or festivals in general (Getz, 1991; Richards, 1994),
event marketing in general (Avrich, 1994; Cunningham and Taylor, 1995; Goldblatt, 1997), event
tourism mari<eting (Getz, 1997), arts or performing arts marketing In general (Australia Council for
the Arts, 1997; Dickman, 1997; Kolb, 2000; Kotier and Schefi , 1997; Rentschler, 1999; Steidl,
1997), but not specifically to tourist markets.
2.3 Significance of Cultural Experiences for Intemational and Domestic
Tourists in Australia and Gaps in the Data
2.3.1 Cultural Tourism and Cultural Event Tourism in Australia: Significance and Research to Date
From the cultural tourist perspective, empirical research to date in Australia has focused on either
International tourists (Foo and Rossetto, 1998; Heaney and Salma, 2004; O'Halloran and Allcock,
2000) or domestic cultural tourists (Cultural Ministers Council Statistics Working Group, 1997;
Tourism Victoria, 2004a). Different methodologies have been used In this research, for example, a
supplementary survey to the International Visitor Survey (IVS) (Foo & Rossetto, 1998) or
supplementary surveys of attendances at selected cultural venues in Australia (Cultural Ministers
Council Statistics Working Group, 1997). None of these studies, develops marketing strategies
other than the segmentation of the cultural tourist market for international and domestic tourists in
Australia, with each study focusing on either International or domestic cultural tourists, respectively.
Other research relevant to cultural tourism in Australia Is published within the international and
national visitors surveys (IVS and NVS) (e.g.. Bureau of Tourism Research, 2001; Bureau of
Tourism Research, 2003) or composite reports of data derived from these surveys and other
sources (Hossain et al., 2005). While the definition of cultural activities used in each of these
studies differs, they do provide characteristics for all tourists, segmentation on several bases such
as by broad purpose of visit (i.e., holiday/leisure; business, visiting friends and relatives), and most
importantly In terms of this proposed research, further Information about cultural activity
participation, but no details on the characteristics of these cultural tourists per se.
18

Chapter 2: Literature Review
2.3.2 Cultural Activity Attendance by International Tourists
In Australia, for example, details of international visitor attendance at cultural events and their
characteristics and motivations are mainly only available for Australia as a whole and are part of
broader studies of cultural tourism in Australia (Foo & Rossetto, 1998; O'Halloran & Alcock, 2000).
Some examples of international tourist participation In cultural activity In Australia (Tables 2.1-2.4),
highlight the significance of this participation with analysis by type of cultural activity and by
participant's country-of-origin.
Research of international visitor participation in cultural activity by country-of-origin Is extremely
limited. For cultural tourism overall in Australia (Table 2.1), approximately 62 percent or 2.1 million
of all international visitors to Australia In 1995 (3.427 million) participated in at least one cultural
activity. The market source of these cultural tourists by country of residence - Asia (46%), Europe
Including the UK (28%), NZ (15%) and North America (10%) - was found to be rather consistent
with the distribution of all inbound visitors for the period except for a higher proportion of visitors
from Europe and North America being likely to visit cultural attractions In Australia than other
groups of visitors. By type of cultural activity (Table 2.3), of the six cultural activity categories
included In the research, two are cultural event related and these ranked third and sixth respectively
for visits to performing arts or concerts (15% of visits) and visits to festivals or fairs (4% of visits).
The Aboriginal sites and cultural displays (15% of visits), could also include attendance at cultural
events. These cultural event rankings are considerably lower than the most popular cultural activity
categories of visiting museums or art galleries (31%), and historic or heritage buildings, sites,
monuments (27%). Foo and Rossetto (1998) concluded that the attendances at festivals and fairs,
in particular, and results from the Cultural Motivations Survey for these cultural events, "point to the
largely untapped potential that inbound tourists present to organisers and merchants of festivals
and fairs" (p.53).
Table 2.1: International tourist participation in cultural activity by country-of-origin
Destination: Australia
Total of all International Tourists
62%
Country-of-Origin
Asia
Japan
19%
Korea
7%
Other-
20%
Europe including
UK
28%
NZ
15%
North
America
10%
Total
100% Source; Foo & Rossetto (1998)
Table 2.2: International tourist participation in performing arts by country-of-origin
Destination:
Australia
Source: O'Halloran & /
Country-of-Origin
Asia
Japan
6% MIcock (2000)
Other Asia
18%
Europe including UK
36%
NZ
13%
North America
20%
19
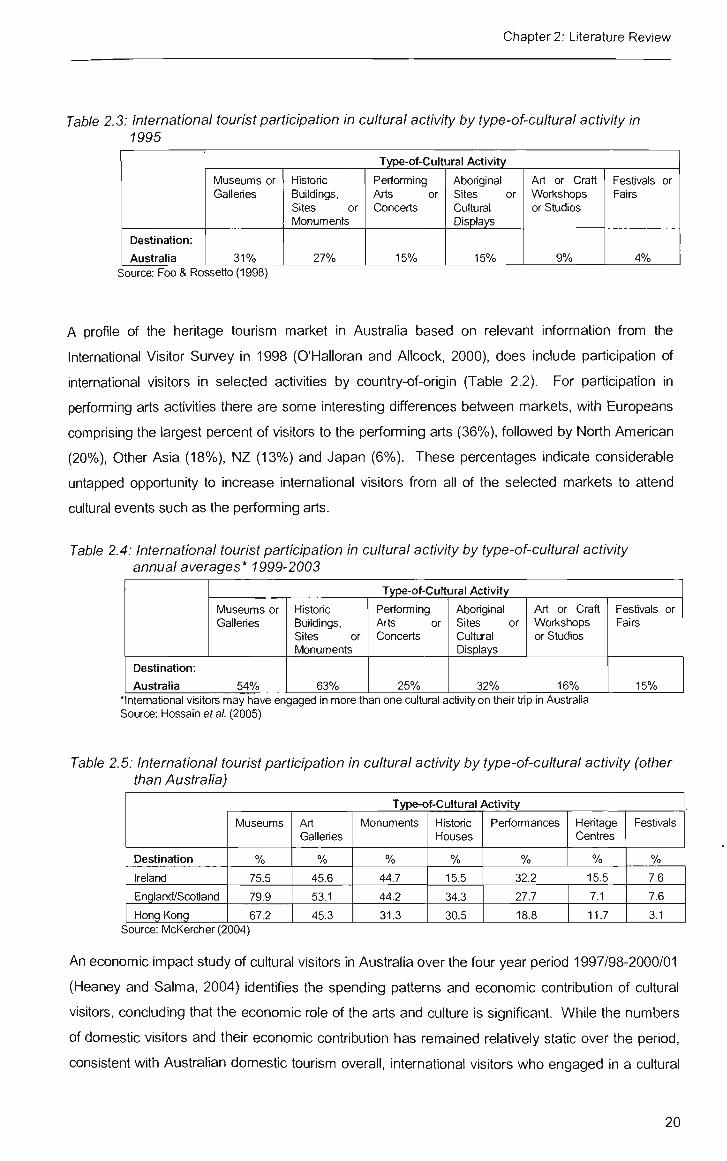
Chapter 2: Literature Review
Table 2.3: International tourist participation in cultural activity by type-of-cultural activity in 1995
Destination:
Australia
Type-of-Cultural Activity
Museums or Galleries
31%
Historic Buildings, Sites or Monuments
27%
Performing Arts or Concerts
15%
Aboriginal Sites or Cultural Displays
15%
Art or Craft Wori<shops or Studios
9%
Festivals or Fairs
4% Source: Foo & Rossetto (1998)
A profile of the heritage tourism market in Austi'alia based on relevant Infonnatlon from the
International Visitor Survey in 1998 (O'Halloran and Allcock, 2000), does Include participation of
International visitors In selected activities by country-of-origin (Table 2.2). For participation in
performing arts activities there are some interesting differences between markets, with Europeans
comprising the largest percent of visitors to the perfomiing arts (36%), followed by North American
(20%), Other Asia (18%), NZ (13%) and Japan (6%). These percentages indicate considerable
untapped opportunity to Increase international visitors from all of the selected markets to attend
cultural events such as the perfomiing arts.
Table 2.4: International tourist participation in cultural activity by type-of-cultural activity annual averages* 1999-2003
Destination:
Australia
Type-of-Cultural Activity
Museums or Galleries
54%
Historic Buildings, Sites or Monuments
63%
Perfomiing Arts or Concerts
25%
Aboriginal Sites or Cultural Displays
32%
Art or Craft Wort<shops or Studios
16%
Festivals or Fairs
15% *lntemational visitors may have engaged in more than one cultural activity on their trip in Australia Source: Hossain etal. (2005)
Table 2.5: International tourist participation in cultural activity by type-of-cultural activity (other than Australia)
Destination
Ireland
England/Scotland
Hong Kong
Type-of-Cultural Activity
Museums
% 75.5
79.9
67.2
Art Galleries
% 45.6
53.1
45.3
Monuments
% 44.7
44,2
31.3
Historic Houses
% 15.5
34.3
30.5
Performances
% 32.2
27.7
18.8
Heritage Centres
% 15.5
7.1
11.7
Festivals
% 7.6
7.6
3.1 Source: McKercher (2004)
An economic impact study of cultural visitors in Australia over the four year period 1997/98-2000/01
(Heaney and Salma, 2004) Identifies the spending patterns and economic contribution of cultural
visitors, concluding that the economic role of the arts and culture is significant. While the numbers
of domestic visitors and their economic contribution has remained relatively static over the period,
consistent with Australian domestic tourism overall, international visitors who engaged in a cultural
20

Chapter 2: Literatijre Review
activity Increased by 16% over the period, and their expenditure levels were consistently higher
than for domestic cultural visitors. Visits to the performing arts and other cultural events are two of
the seven categories of cultural activity Included In the study, but analysis by type of cultural activity
was not undertaken in this study.
More recent data for International tourist participation in cultural activities while in Australia is
available for 1999-2003 by type of cultural activity (Table 2.4), but this research (Hossain et al.,
2005) does not include analysis by country-of-origin. While the annual average of International
tourists who engaged in cultural activities reported in this study is considerably lower than the
earlier study by Foo and Rossetto (1998) (47% cf 62%), the participation by international tourists in
each of the cultural activities are all higher and there are some differences in activity rankings. The
rankings of cultural event related activities however are similar in both studies with attending
performing arts or concerts, and festivals or fairs, ranking of 3 ^ and 6 ^ most popular activities
respectively.
Table 2.5 presents international tourist participation in different types of cultural activity in three
other geographic areas (Ireland, England/Scotland, and Hong Kong) for comparative purposes. It
indicates cultural performances were more popular with Ireland than the other jurisdictions, but
there is scope to increase attendance at performances and festivals, especially compared to
attendances at some other cultural activity types.
Limitations of this research of international tourist participation by type of cultural activity and
country-of-origin are that the analysis of the extent of cultural tourism by country-of-residence
categories Is very broad, especially for Australia's emerging international tourist markets from Asia
which are reported and analysed into only two or three of the categories: Japan, Korea and Other
Asia.
2.3.3 Cutturai Activity Attendance by Domestic Tourists
On average between 1999 and 2003, there were 8 million domestic overnight cultural visitors who
engaged in at least one of the cultural activities during their travel within Australia and this
represented 11.4 per cent of all domestic overnight visitors (Hossain et al., 2005). The number of
domestic overnight cultural visitors Increased from 7.7 million In 2000 to 9.3 million In 2003 and
domestic cultural visitors engaged in a minimum of 1.3 different types of activities on average over
the five years from 1999 to 2003 (Hossain et al., 2005).
As summarised In Table 2.6, the most popular activity was visiting an historical or heritage building
(37%), but attending performing arts or concerts was the third most popular activity (19%).
21

Chapter 2: Literature Review
Table 2.6: Domestic overnight tourist participation in cultural activity by type-of-cultural activity annual averages* 1999-2003
Destination:
Australia
Type-of-Cultural Activity
Museums or Galleries
36%
Historic Buildings, Sites or Monuments
37%
Performing Arts or Concerts
19%
Aboriginal Sites or Cultural Displays
7%
Art or Craft Wori<shops or Studios
15%
Festivals or Fairs
17% 'Visitors may have engaged in more than one cultural activity on their trip in Australia Source: Hossain et al. (2005)
2.3A Summary of Cutturai Activtty Participation Data for Intemational and Domestic Tourists in Australia
Based on the review of cultural tourist participation data for International and domestic tourists in
Australia in the previous two sections, a summary of key findings and limitations has been compiled
(Table 2.7).
Table 2.7: Key findings and limitations of cultural tourist research for international and domestic visitors in Australia
Findings
47% of intemational visitors engage in cultural activities while in Australia on average 1999-2003 whereby intemational cultural visitors account for more than 2 million visits to Australia per year 1999-2003
11% of domestic ovemight visitors were cultural tourists on average 1999-2003 representing on average per year 8 million domestic cultural tourists
Visiting Historic buildings, sites or monuments has become the most popular cultural activity for intemational cultural tourists (63%) and domestic ovemight cultural tourists (37%)
Attending performing arts or concerts has become the 4* most popular cultural activity for intemational cultural tourists (25%) and the 3'* most popular activity for domestic ovemight cultijral tourists (19%)
Attendance by country-of-origin varies for all types of culhjral activities and within one type of cultural activity such as performing arts
Economic role of arts and culture activities by intemational tourists in Australia is significant overall and also because intemational cultural tourists stay more nights in Austi alia than international non-cultural visitors and spend more money per trip
Economic role of arts and culture activities by domestic visitors in Austi-alia is significant overall and also because domestic cultural visitors spend more Uian tiie average domestic ti^aveller and stay longer. Numbers and economic contribution remained relative static over 4 year period (1997/98-2000/01) (consistent with Austi alian domestic tourism overall)
Expenditure levels by intemational cultural tourists are consistentiy higher than
Limitations
Different metiiods used to measure tourists attendance in a cultural activity
Different categories of types of cultural activities used
Country-of-residence analysis is very broad, especially for Austi-alia's emerging market of Asia
In economic impact analysis of spending patterns and economic contiibution by tourists on arts and cultijre activities, analysis by type of activity is not included
State/Territory analysis for intemational tourists by type of cultural activity and countiy-of-origin is not available
Analysis of intemational visitor motivation by countiy-of-origin and type of cultural activity is not available
Only one of these studies includes analysis of motivating factors, planning factors, information sources used and satisfaction
22

Chapter 2: Literature Review
domestic cultural visitors
• Intemational tourists to Aust-alia present untapped potential for cultural events, especially festivals and fairs
• Domestic tourists present untapped potential for all cultural activities, including cultural events
Source: Based on Foo & Rossetto (1998); Heaney & Salma (2004); Hossain et al., (2005); McKercher (2004); O'Halloran & Allcock (2000); Tourism Victoria (2003)
Overall, although tourist attendance at cultural activities Is significant by some measures, the reach
to date of the current and expanding international and domestic tourist markets is relatively small
and represents untapped potential and scope to increase attendance highlighting the importance of
attracting tourists to cultural attractions and events. In order to Increase and even to maintain
cun-ent levels of tourist attendance at cultural attractions In an increasingly competitive
environment, an understanding of tourists' motivation and behaviour in relation to attending is
imperative, yet this type of research has been extremely limited to date.
Existing research of cultural tourism motivation by international and domestic visitors in Australia is
extremely limited as will be considered in the next section.
2.3.5 Cutturai Tourist Motivation Data
Research of cultural tourism In Australia by International visitors (Foo & Rossetto, 1998) includes
some findings of specific relevance to visitor motivation for attending cultural events but these
findings are only available for selected categories of cultural sites of relevance to cultural events
and for all International visitors collectively, not by country-of-residence. It shows all International
visitors to cultural events such as performing arts or concerts and festivals or fairs, were motivated
by the social aspect of the experience, but visitors to performing arts also had to be interested in the
performance while visitors to festivals or fairs sought an Australian experience and often did so on
Impulse. Visits to Aboriginal sites and cultural displays were also sought after by cultural visitors
rather than used to fill in time with the majority of visitors seeking an Australian experience (42%) or
specifically wanting to visit a particular Aboriginal site or display (32%). Analysis of visitor
motivation by country-of-residence In this research (Foo & Rossetto, 1998), is only available for
cultural sites overall and therefore does not shed light on cultural event tourism motivation by
country-of-residence. The main motivation for UK, European and North American tourists was 'to
experience something Australian' (39%, 47% and 30% respectively) followed by 'specifically
wanted to attend or visit' a particular cultural activity (32%, 32%, and 29%). Whereas, for Asian
markets - which are only categorised by Japan and Other Asia - the main motivation was 'part of a
package tour' (57% and 32% respectively) followed by 'to experience something Australian' (23%
and 24%). In comparison the main motivation for NZ tourists was 'specifically wanted to visit' (41 %)
followed by 'interested and wanted to spend time with friends/relatives (16%).
23

Chapter 2: Literature Review
The only quantitative research of domestic cultural tourists' motivation and behaviour in Australia,
was commissioned by Tourism Victoria to examine the motivations and behaviours of interstate
visitors to Melbourne from the key markets of Sydney, Brisbane and Adelaide who engaged In
cultural experiences (Tourism Victoria, 2004a). The aspects of this research of specific relevance
to visitor motivation for attending cultural events are the findings for participation in 14 cultural
activities, nine of which are event related (theatre, arts or cultural festival; jazz or blues music
perfomnance; dance performance; comedy show; country or folk music program; classical music
program; opera; and ballet). The top three cultural activities participated in on a domestic interstate
leisure trip were not cultural events, but interstate cultural tourists visiting Victoria were more likely
than the total interstate domestic cultural market to attend the theatre (19% cf 17%), arts or cultural
festival (14% cf 13%), and the ballet (3% cf 1%). The motivations for attending any of the cultural
activities or events are reported for all interstate cultural tourists collectively, not by individual source
markets of interstate tourists to establish whether there are any state-based differences in
motivation or behaviour, nor by type of cultural activity or event. Experiencing history and heritage
and art and culture were influencing factors for 68 and 58% of Interstate cultural tourists to Victoria
respectively, but these ranked 4th and 6* as Influencing factors. The top three influences were
enjoying food and wine, experiencing nature and the outdoors, and VFR. The five most common
reasons for attending any cultural component of the trip were enjoyment/relaxation (75%), socialise
with friends (37%), experience quality art (37%), learn about other cultures (33%), and celebrate
heritage (31%).
2.3.6 Cutturai Tourist Planning Data
In terms of planning cultural event tourism, Foo and Rossetto (1998) found the majority of inbound
visitors to the performing arts and to Aboriginal sites planned their attendance prior to their visit
(54% and 60% respectively). The researchers speculated that the former is presumably a function
of ticketing procedures whereas the latter Is a reflection of the remote nature of many performances
or restrictions, perceived or otherwise, of access to displays of Aboriginal culture. Different sources
of Information are used for different types of cultural events, with visitors to performing arts or
concerts preferring sources that would contain up-to-date information, visitors to festivals or fairs
using passive sources of information (i.e. Infomriatlon that comes to them Including word-of-mouth
and advertising); and visitors to Aboriginal sites using travel-related sources.
2.3.7 Limitations of Cultural Tourist Data by Country-of-Residence
Limitations of this research to date are that the country-of-residence categories used In cultural
tourism participation analysis for inbound tourists in Australia are very broad, especially for
Australia's emerging international tourist markets from Asia such as China, Taiwan, Korea,
Singapore, Malaysia, and Thailand which are usually reported and analysed into two or three of the
following categories: China, Japan and Other Asia. This level of analysis is still not available for
each State/Territory or by type of cultural activity nor is there published analysis of sources of
24

Chapter 2: Literature Review
information used by inbound cultural visitors by type of cultural activity and country-of-residence.
Another gap in this literature to which this study alms to make a contribution concerns motivation to
attend cultural experiences. Cultural differences presumably exist In motivation as well as
participation and yet this analysis for the different types of International visitors by country-of-
residence Is not available. A better understanding of cultural experience motivation is dependent
on more research in this area.
2.3.8 Summary of Cutturai Tourism in Australia Research Findings and Gaps in the Data
Research of cultural tourism in Australia by International visitors Includes cultural visitor
demographic characteristics and motivations, whether any planning was Involved, and sources of
Information used. This research also segments International cultural tourists as 'specific' or
'general' - a cultural tourist segmentation also used by Richards (1996a; 1996b) in relation to
European tourism and cultural attractions. The research fijrther analyses motivations, planning and
information at specific types of cultural sites Including performing arts or concerts and festivals or
fairs. It is acknowledged that this information Is valuable in the distribution of promotion and
marketing materials (Foo & Rossetto 1998).
In order to develop effective marketing and public relations strategies for cultural experience
tourism, information Is needed concerning the new Asian tourist markets, their interest and
participation In locally-based cultural and performing arts experiences, and the factors and sources
Influencing their behaviour. Existing research of cultural tourism in general (Foo & Rossetto, 1998)
identifies some relevant Information but also highlights a need for additional specific Information.
For example, of all Inbound visitors to Australia who said they visited a cultural attraction In
Australia, Asian markets collectively are Identified as the largest market (45%) compared with
continental Europe (16%), NZ (15%), UK (11%) and USA/Canada (10%). The Asian market is
further segmented into 'Japanese' and 'other Asian' markets with the Japanese market being the
largest single Inbound market that visited a cultural attraction (19%). Information Is also provided
for each of the selected inbound markets Including Japanese, regarding the motivating factors,
levels of interest In cultural attractions, and information sources used. This Information is not
available for any other separate Asian markets nor is It correlated with the type of cultural activity or
activities (e.g., performing arts or museums and galleries) undertaken by inbound visitors. This
latter information Is not analysed at all for each of the inbound markets by country-of-residence or
language groups. This research suggests a need for more detailed information about how
motivation for selected Asian and other international tourist markets based on three language
groups (Japanese, Chinese and English) differs in relation to interest in, attendance at and
experience of specific types of cultural activities and events, especially for marketing segmentation
and strategy purposes.
A further finding from existing research of cultural tourism in Australia (Foo and Rossetto, 1998)
comparing the distribution of Inbound visitors to cultural visitors, found the proportion of visitors from
25

Chapter 2: Literature Review
Asia (including Japan) likely to visit cultural attractions in Australia Is lower than the proportion of
visitors from Europe (including the UK) and North America. This suggests a need to research
Inbound Asian non-attendees to locally-based, cultural experiences as well as those who attend.
2.4 Significance of Cultural Tourism in Melbourne, Victoria
The Melbourne geographic area located within the state of Victoria Is a focus of this study as the
number of tourists to Victoria per annum based on recent published data (Tourism Victoria, 2006b,
2007), total neariy seven million which Is a very substantial market for any Melbourne-based
attraction, and especially when compared with Melbourne's resident population of almost 3.6
million, 2.9 million of whom are 15 years of age or older (Australian Bureau of Statistics, 2006).
These tourist visitors comprise neariy 1.4 million International tourists and more than 5.4 million
interstate. The 1.4 million international visitors to Melbourne is the second highest number of
international visitors to a selected destination in Australia, ranking after Sydney (2.46 million). Of
these inbound international visitors to Victoria and Melbourne, the top six significant market sources
in ranking order are NZ (229,890, 17%), UK (213,129 15%), China (139,575, 10%), USA (133,626
10%), Japan (64,938, 5%) and Singapore (62,943, 5%). This differs sllghtiy from the profile of total
International visitors to Australia which totalled neariy 4.8 million for the year ending December
2004, where the top six significant market sources are the same countries but different ranking
order and percentages: NZ (19.3%), Japan (13.8%), UK (13.1%), US (8.4%), China (5%) and
Singapore (4.5%) (Tourism Australia, 2005). The significant market sources for the Interstate
visitors to Victoria and Melbourne, in ranking order are NSW (more than 2.8 million, 48%), South
Australia (971,000,18%) and Queensland (894,000,17%) (Tourism Victoria, 2007).
Regarding performing arts event supply, Melbourne hosts an annual major arts festival and fringe
arts festival In September/October, a comedy festival midyear, and Is home to several major
performing arts companies including the Melbourne Symphony Orchestra, Orchestra Victoria, and
one of Australia's oldest and largest theatre companies, the Melbourne Theatre Company (MTC)
established In 1953 and employing more than 116 permanent, full-time staff (Nugent, 1999).
Melbourne also has an impressive range and number of major performing arts venues Including the
Victorian Arts Centre Concert Hall (capacity 2,700), State Theatre (2,000), Playhouse (900);
Regent (2,200), Myer Music Bowl (2,000), Her Majesty's (1600), Princess (1,400); Comedy (1,000),
Athenaeum (950), and Forum (800) (Nugent, 1999).
A snapshot picture of cultural tourism in the Melbourne geographic area and Australia as a whole is
difficult to determine from existing research which has used different methodologies (e.g. surveying
a sample of all international tourists versus surveying a sample of visitors to selected cultural
venues), different tourist populations (e.g. international or domestic visitors) and often does not
provide detailed analysis of tourist participation in cultural attractions or events as distinct from
participation In cultural tourism in general. There Is also a lack of detailed analysis for cultijral
26

Chapter 2: Literature Review
tourism in specific geographic areas such as Melbourne. Furthermore, most of the cultural tourism
data is now quite dated.
2.5 Cultural Tourism Research and Definitions
Overall, cultural tourism literature and research has been more conceptual than empirical in nature
(Hall and Zeppel, 1990; Hughes, 1987; 1996; Zeppel and Hall, 1991). Related literature and
research, also largely conceptual or theoretical, focuses specifically on tourism and the arts
(Cohen, 1993; Tighe, 1986), tourism and museums or heritage attractions (Prentice, 1993b), and
culture as a resource for tourism (Hughes, 1987; Wiener, 1980). Conceptual research on cultural
tourist motivation emerged in the mid 1990s (Sllberberg, 1995) and empirical research on cultural
tourist motivations and behaviour has followed (Foo and Rossetto, 1998; McKercher, 2004;
McKercher and du Cros, 2003). Some research focuses specifically on cultural event tourists and
their characteristics, motivations and segmentation (Fonnica and Uysal, 1996,1998; Nicholson and
Pearce, 2000, 2001) and for festivals in particular (Crompton and McKay, 1997; Lee, 2000; Lee et
al., 2004a; Scott, 1996). Regarding cultural tourism In specific geographic areas, there is
considerable case study research of cultural tourism In Europe (Richards, 1996a, 1996b, 2001b), in
the USA (Tighe, 1985), tourism and the arts In Singapore (Henderson, 2001), tourism and heritage
In Thailand (PeleggI, 1996), and cultural tourism in Hong Kong (McKercher et al., 2002). In
Australia, a review of arts and heritage was published (Zeppel and Hall, 1992) and some empirical
research of cultural tourism In Australia was undertaken In the eariy 1990s (Australia Council for the
Arts, 1990; 1991; Brokensha and Guldberg, 1992). More recent research of tourist attendance at
cultural activities in Australia has been considered In the eariler section on the significance of
cultural activities and events for tourists (Section 2.4) and has focused on either international
tourists (Foo and Rossetto, 1998; Heaney and Salma, 2004; O'Halloran and Allcock, 2000) or
domestic tourists (Cultural Ministers Council Statistics Working Group, 1997; Tourism Victoria,
2004a). Other research focuses on an anthropological perspective of the impact of tourism on the
arts and culture (e.g., Cohen, 1993; Hughes, 1989) and Is not of direct relevance to this research.
2.6 Typology of Tourists and Cultural Experience Tourism
Cultural tourism and cultural tourists can take many forms. Consequentiy there are many existing
typologies and these are based on the cultural tourists or the cultural attractions, or both. Despite
debate over the use of typologies which is raised but not expanded upon by McKercher and du
Cros (2003), these authors consider them useful In trying to understand the behaviour of different
groups of travellers.
Culture as product typologies is common within the cultural tourism literature (Foo and Rossetto,
1998; Grant and Paliwoda, 1998; Munsters, 1996; Richards, 1996b; Robinson et al., 1996).
Munsters' (1996) typology further differentiates cultural product as either attractions or events.
27

Chapter 2: Literature Review
More recent cultural and heritage tourist typologies have focused on the level or nature of tourist
experience (McKercher, 2002; McKercher and du Cros, 2003; Timothy, 1997).
Timothy's typology (1997) comprises four levels of heritage tourism attractions - worid, national,
local and personal - based on different depths of experiences by the visitor. Worid heritage
attractions draw large masses of tourists and may invoke feelings of awe, but probably do not
invoke feelings of personal attachment. By conti'ast, national, local and personal sites engender
progressively stronger feelings of personal connectivity and probably facilitate different depths of
experiences by the visitor. Cleariy different types of heritage and cultural tourism experiences exist
(e.g., Timothy 1997), but one limitation identified by Timothy is that In many cases there Is overiap
of these concepts. Timothy further suggests this typology highlights types of heritage tourism that
have not received much academic attention, In particular, personal heritage tourism and local
tourism businesses.
Acknowledging that operational definitions of cultural tourists are deficient in a number of areas,
especially their inability to distinguish between different types of cultural tourists which can further
mislead about the importance of cultural tourism in attracting tourists to an area, McKercher (2002)
calls for a new approach to develop a stronger understanding of the cultural tourism market.
McKercher's typology of cultural tourists (McKercher, 2002; McKercher and du Cros, 2003), Is
based on the interface between two dimensions: 1) the centrality of cultural motives in the decision
to visit a destination, and 11) depth of experience or level of engagement with the attraction or
destination. McKercher uses this typology to segment the cultural tourism market into five
segments: serendipitous, purposeful, incidental, casual, and sightseeing cultural tourists. When the
segments are tested against a variety of variables - variety of trip, demographic, motivational,
preferred activity, awareness, cultural distance and activities participated - significant differences
are noted between the groups (McKercher and du Cros, 2003). Therefore, although the
segmentation process in this instance is predicated on two variables, these variables are reflective
of underiying trip motivation, activity preference and cultural distance factors noted between the
different types of cultural tourist. Some similarity between this cultural tourist typology and the more
generic typologies of tourists (e.g., Cohen, 1979; Plog, 1974), and Cohen's (1972) concept of
strangeness versus familiarity is acknowledged (McKercher and du Cros, 2003).
While these two dimensions of cultural motives centrality and depth of experience have some
limitations which will be discussed later in this literature review, they are of specific interest to this
research because of their links to several concepts of cultural tourist experience that are a
proposed focus in this study, namely, motivation and benefits. McKercher (2002) links the centrality
dimension to the importance of recognising that some people are more highly motivated to
participate in cultural tourism than others and that participation alone may not be sufficient to
document Intent. McKercher's centrality dimension looks at motivation In terms of the extent to
which the desire to engage in cultural tourism activities forms the main reason to visit a destination.
In exploratory research using Hong Kong as the destination case study (McKercher, 2002;
28

Chapter 2: Literature Review
McKercher and du Cros 2003), this dimension of the centrality of cultural tourism in the decision to
visit is measured with a single question and a five-point Likert scale (1 unimportant/did not influence
the decision to visit to 5 the only/main reason we came to Hong Kong).
The depth of experience dimension acknowledges that people have different abilities to engage
with cultural and heritage atti-actions based on an array of factors (McKercher, 2002). McKercher's
discussion of this dimension (2002, p.31-32) refers to research (Mcintosh and Prentice, 1999;
Waller and Lea, 1998) suggesting that authenticity or the perception of the pursuit of authenticity
may influence the depth of experience felt. McKercher ultimately measured the depth of
experience dimension with a single question on the importance of the opportunity to learn
something about Hong Kong's culture. A four-point Likert scaled question measured how Important
the opportunity to learn something about Hong Kong's culture or heritage was in their decision to
visit with possible answers ranging from 'mostly sightseeing/photography' through to the
opportunity 'to develop a deep understanding".
McKercher and du Cros (2003) further claim the five types of cultural tourists identified In the
typology based on their two dimensions of centrality and depth of experience, represent "benefit-
based" segments. This claim highlights the importance of benefits In tourist market segmentation
research which will be discussed later In this literature review In the section on benefit market
segmentation.
McKercher's typology of five types of cultural tourists is tested against a variety of other variables:
participation In cultural tourism activities at some time during their stay in Hong Kong (McKercher,
2002; McKercher & du Cros, 2003), trip, demographic, motivational, preferred activity, awareness,
cultural distance and activity variables (McKercher & du Cros, 2003).
One earlier framework conceptualises cultural tourism as a liberal arts hobby within the framework
of serious leisure theory and categorises cultural tourists into two types: general and specialised
(Stebbins, 1996). Both categories are based on a definition of cultural tourism as, the search for
and participation In new and deep cultural experiences, whether aesthetic, intellectual, emotional,
or psychological (Reisinger, 1994). Stebbins further acknowledges that several cultural forms
routinely draw tourists such as museums, galleries, festivals, architecture, historic ruins, artistic
performances, and heritage sites, and that these forms are in turn expressions or contain
expressions of one or more fine, popular, or folk arts, or one or more local lifestyles - folk, historical,
or modern. Both types of cultural tourists seek rich, participative experiences in some of the cultural
forms mentioned above. The main difference between the two types is that the general cultural
tourist undertakes these experiences In different geographic sites such as countries, cities, and
regions, whereas the specialised cultural tourist focuses on one or a small number of geographic
sites or cultural entitles. The latter might seek a broad cultural understanding of a place or go to
different places In search of exemplars of cultural entitles such as art, history, festival or museums.
29

Chapter 2: Literatijre Review
In contrast with these existing typologies, this proposed research focuses on tourist motivation in
relation to cultural experiences to test whether different types of tourists can be identified. A new
conceptual framework will be developed for testing. It will be presented in Chapter 3 following
furUier discussion of the other relevant dimensions in this literature review. In common with some
of tiiese existing typologies, this proposed research does need to define cultural experience tourism
for its purposes and this will include initially identifying types of tourists and different cultijral forms
and entities and exemplars of these, that are of specific interest to this study.
2.6.1 Cultural Experience Tourists
For the purpose of this study, the typology of tourists and cultural experience tourism (Figure 2.1)
and associated definitions will apply. It primarily categorises tourists, firstiy by type of tourist (I.e.,
Intemational, domestic/national (Interstate and intrastate), then by primary purpose of visit (i.e.,
visiting friends and relatives, holiday/leisure, or business) and then by type of cultural experience
activity they may engage within (e.g., local performing arts). As the focus of the proposed research
is selected tourist markets and their motivation to engage with local cultural experiences,
'International' and 'domestic/national interstate' tourists will be the primary types of visitor of interest,
but the research findings will also be compared with existing relevant research on cultural tourism
and other types of visitors, i.e., other international Inbound tourist markets and domestic /national
Interstate visitors.
The cultural experiences of particular Interest in this study are local, cultural attractions and events
and the motivation of International and Interstate tourists to engage with these. This typology
further considers these cultural attractions and events as a sub-group of cultural experience
tourism. This definition, in turn, is based on an operational/behavioural definition of tourism as the
'activities of persons' (Alzua et al., 1998; United Nations and Worid Tourism Organisation, 1994;
Worid Tourism Organisation, 1985). Defined this way, the definition is made operational through
existing or additional data that can be readily collected, and it relates closely to existing relevant
data of relevance to cultural tourism. In Australia, for example, such literature and data includes the
annual visitor sun/eys (e.g., 2001; 2003; Tourism Australia, 2005) and studies of cultural tourism In
Australia by Inbound and interstate visitors (Foo and Rossetto, 1998; Hossain et al., 2005; 2003;
Tourism Victoria, 2004a). In this study however, the segmentation of the cultural experience tourist
market will ultimately be based on tourists' attitudes and motivation towards these cultural
experiences and aspects of the nature of their experiences at these cultural events, if differences
can be found.
Another cultural tourism research project, the Association for Tourism and Leisure Education
(ATLAS) project, established In 1991 to develop a transnational database, initially focusing on
Europe, began with a technical definition of cultural tourism to facilitate fieldwork research: "All
movement of persons to specific cultural attractions, such as heritage sites, artistic and cultural
30

Chapter 2: Literature Review
manifestations, arts and drama outside their place of residence" (Richards, 1996b, p.24; 2001b,
p.37).
One acknowledged limitation of the above operational/behavioural definitions of cultural tourism
and cultural tourists Is that they can mislead about the Importance of cultural tourism In atti-acting
tourists to an area by Inflating the size of the market based on attendance at a cultural activity
(McKercher, 2004). This is because these definitions are more accurately, definitions of tourists
who attend a cultural activity, than definitions of 'cultural tourists' defined as people who are
motivated to travel for cultural reasons and for whom visits to cultural attractions are the core
reason of visit.
Another limitation of the above operational/behavioural definitions of cultural tourism and cultural
tourists is that they do not include attitudinal and motivational dimensions in addition to the
behavioural dimensions of cultural tourists. The Importance and advantages of Integrating
attitudinal and behavioural characteristics as well as using a multi-dimensional typology and market
segmentation approach in relation to identifying market segments and developing appropriate
marketing strategies to attract and increase these segments has been advocated in relation to
cultural and heritage tourism and international tourists (Alzua et al., 1998). The Integration of
attitudinal and motivational as well behavioural dimensions Is discussed again later in this literature
review in sections on motivations, benefits and market segmentation research and literature.
2.6.2 Cultural Tourism Experiences
The above operational/behavioural definitions of the cultural tourist whereby they are characterised
by type of cultural activity attended, further requires the development of a typology for cultural
activities. The typology needs .to take Into account the various cultural activities Included in the
cultural tourism research to date as well as identifying other cultural resources not Included to date,
but which could function as resources for cultural tourism purposes.
In their research of cultural tourism in Australia, Foo and Rossetto (1998) identified six categories of
activities: three cultural site-based attractions, two other categories that could be considered cultural
event tourism (festivals or fairs; performing arts or concerts), and a third category (Aboriginal sites
and cultural displays) - that could include cultural event tourism.
A decade since the inception of the ATLAS project, Richards (2001a) developed a framework to
accommodate the attractions Included In the ATLAS project demand and supply data. Firstiy, he
overvlewed different typologies of cultural tourism and concluded that they are largely based on
cultural products, rather than based on their organization or consumption by tourists. He further
noted an Increasing tendency to emphasize the role of cultural events (p.23), which Is of particular
relevance to this study on cultural experience tourism where cultural events are a sub-category of
focus.
31

Chapter 2: Literature Review
Richards' (2001a) framework focuses on the differences and similarities of cultural attractions In
terms of forni and function. His starting points are the type of resources that form the cultural basis
of the attraction, and the purpose to which these cultural resources are put. The cultural basis of an
attraction varies from a presentation of the material products of a culture to the active transmission
of elements of the living culture, or culture as a way of life. This definition represents the continuum
of definitions of cultijre, from culture as product to culture as process, with the former tending to be
more traditional cultural attractions largely based on heritage and other cultural products of the past
and the latter, more contemporary types of attractions based on cultural processes. The second
dimension represents the use or purpose to which the cultural resources are put in an attraction
ranging from educational uses to entertainhient purposes with this dimension also reflecting the
authenticity debate about the of the presentation of culture ranging from 'authentic' to 'staged
entertainment'. In this framework, cultural event examples are categorised into all four quadrants of
these tiA/o dimensions. Art exhibitions, for example, are considered to be a more contemporary
form, whose purpose is' more educational than entertainment. Arts festivals are also a more
contemporary form, whose purpose however Is more entertainment than educational. Folklore
festivals, have a mixture of educational and entertainment elements based on historical resources.
Historical pageants are also based on historical resources, but are more entertainment focused.
Performing arts events are not included per se in this typology, but are included within the survey
instrument as one of seven types of cultural attractions, the others being: museum, monument, art
gallery, historic house, festivals, and heritage centre.
Any typology of cultural attractions according to Richards (2001a), cannot be viewed as a fixed
classification but should be understood as a dynamic field within which cultural attractions may
position themselves (p.25) or disappear as distinct categories (p.24). For example, an increasing
shift in the emphasis of cultural production away from the resources of the past, towards more
contemporary cultural forms Is noted (p.25).
A powerful connection betiween attractions and events is noted by Munsters (1996) despite
categorising cultural tourism resources as either attractions or events in a general typology of
cultural tourism resources. He comments that, "various events can be connected with cultural
attractions" and "thanks to their motivating power, these events are an excellent way to revive
heritage and to attract the less culturally minded tourist towards monuments and museums"
(p.114). Munsters' list of events connected with cultural attractions comprises "performances
(theatre, music, dance), demonsti-ations, exhibitions, markets, and (guided) tours". This list Is of
particular interest and relevance to this study as It is the only theoretical acknowledgement of
'markets' as a type of event connected with cultural attractions and yet markets (street, weekend,
art/craft, and produce) frequently function as tourist attractions evidenced by their listings within
most popular activities undertaken by tourists at particular destinations and their inclusion within
brochures and guidebooks Identifying outstanding arts and cultural heritage experiences and
cultural tourism attractions for some destinations. Both of these apply to Melbourne, Victoria where
markets prominentiy feature in the lists of most popular activities undertaken by international visitors
32

Chapter 2: Literature Review
and Interstate tourists at the destination (Tourism Victoria, 2004b) as mentioned earlier In the
discussion of the significance of this study in Chapter 1. Similariy, Victoria's Cultural Guide 2005-
2006 (Cultural Tourism Industry Group, 2005), identifies produce markets as places of Interest for
Melbourne city and the nearby suburb of Prahran. The Prahran market is acknowledged as
Melbourne's oldest product market (p.13), while the Queen Victoria Market Is Identified as a 'place
of interest" within a heritage building and the Melbourne City Precinct (pp.80-81). The combination
of events and built heritage functioning as major crowd-pullers has been acknowledged by
Munsters (1996), especially events in which the built heritage plays the key role such as perfomning
arts concerts in historic buildings.
The emerging Importance of experiences In art and culture that address tourists' interests for
experience has been recently noticed in collaborative marketing practices and partnerships
between tourism and art and cultural organizations In North America, and described as a
"convergence of culture and place" (Carpenter, 2004). These types of tourism opportunities not
only offer visitors opportunities to experience the art and cultural fabric of locales, they are also
designed to bring about communication between visitors and members of the cultural core of the
experience Itself. Several benefits of collaborating and promoting cultural experiences for visitors,
partnering organizations and communities, are proposed. While visitor benefits are a specific focus
of this study discussed later in this literature review In Section 2.12.3, Carpenter (2004) proposes
cultural experiences can be attractive to visitors who are less Interested In site-specific attractions.
2.6.3 Cutturai Experience Tourism Typology
In defining cultural experience tourism for the purposes of this study, several relevant concepts
have been discussed. In particular, definitions for and typologies of cultural tourism, cultural
attractions and events, and cultural tourists. Two main trends emerge from this literature review of
cultural tourism typologies and related Industry practices and tourist activity participation. These are
summarised as 1) an emphasis on visitor experiences at cultural tourism attractions and the nature
of those experiences, and 2) the increasing importance of cultural events and events at cultural
attractions. Several limitations with the proposed operational/behavioural definitions of cultural
tourism and cultural event tourism have been observed. Two further limitations can be identified
from the above discussion of the relevant definitions and typologies. For any typology of cultural
attractions and events, one problem Is that some attractions and events may be multi-fomn and
multi-functional, and, similariy, the tourists experiencing cultural attractions and events may have
different and multiple attitudes and motivations influencing and determining their behaviour.
2.6.4 Associated Definitions
International Tourist: any trip to Melbourne, Australia by a temporary visitor from another country
who spends at least one night but not more than one year for the purposes of business, leisure or
33

Chapter 2: Literatijre Review
visiting friends and relatives (based on Bureau of Tourism Research, 2003; Tourism Research
Australia, 2004).
Domestic/National Tourist any trip to Melbourne, Australia by a person residing in Austi-alia,
In'espective of nationality, travelling over 40 kms from their usual residence. Involving a stay of at
least one night away from home (based on Bureau of Tourism Research, 2001; Tourism Research
Austi-alia, 2004).
Interstate Tourist residents from outside the state of Victoria, visiting Melbourne for at least one
night (based on Bureau of Tourism Research, 2001; Tourism Research Australia, 2004).
Cultural Experience Tourism: Tourists who engage in at least one locally-based, cultural experience
at cultural attractions and events (these tiA/o sub-categories being defined for the purposes of this
study below but which are principally based on operational/behavioural definitions of tourism as
specified activities undertaken by tourists) during their stay. Defined in this way, the definition is
based on an operational/behavioural definition of tourism as the 'activities of persons' (United
Nations and Worid Tourism Organisation, 1994; World Tourism Organisation, 1985; Alzua et al.,
1998) and is made operational through existing or additional data that can be readily collected, and
It relates closely to existing data (e.g.. Bureau of Tourism Research, 2003; Foo and Rossetto
1998). The aim of this proposed research is to determine whether tourists' engagement in cultural
experiences at cultural attractions and events can also be defined and categorised by factors that
may trigger or drive the behaviour (Alzua et al., 1998) such as motivations and benefits pursued,
and whether cultural differences can be Identified as further determinants of these.
Cultural Attractions (Site-Based): are local cultural and arts related experiences available at the
destination that are offered on a recurring basis within a site-based, tangible built or natural facility
and the visitor experience involves encountering objects or other tangible forms of creative
expression or the history of a place. Three sub-categories of cultural attractions have been
Identified, two of which will be a focus of this study: museums and art galleries; and
historic/history/heritage, buildings, sites and monuments. These two categories of cultural
attractions and the tourist activity of visiting them, are commonly found In cultural tourism activity
typologies and research worldwide (Foo and Rossetto, 1998; Richards, 1996a, 1996b; Richards
and Queiros, 2005; Tourism Victoria, 2004a). Within each of these cultural attraction
subcategories, some could be further distinguished as famous or iconic based upon the fame of
the attraction as a cultural place, and whether this is a significant dimension of tourists' attitudes for
attending cultural experiences will also be tested in this study.
Cultural Events: are those locally-based, cultural and arts related events and performances that are
available live at the destination, but are temporary in nature occurring for limited time periods and
are distinct from recorded or broadcast events. Seven sub-categories of cultural and performing
arts activities/events have been identified, six of which will be a focus of this study: festivals that
34
Chapter 2: Literature Review
include live performing arts performances and might be re-enactments of these at site-based
cultural attractions; markets tiiat include street, weekend, art and craft, produce and might be re-
enactments of any of these at site-based cultural attractions; theatre with a further five sub
categories - three of which are venue-based, that is either large scale, small to medium scale or in
a park or garden, the fourth is theatre held predomlnantiy for children such as pantomimes; music
and opera, and the fifth is theatre performances at cultural heritage attractions; music and opera,
dance and ballet, and cultural performances which might be multicultural; ethnic or folk, national,
indigenous or aboriginal, or re-enactments at cultural attractions. The scale of theatre productions
distinguishes between those that are large scale and those that are small to medium scale,
primarily based on the cost of production, number of employees Involved, and size of the venue.
Large scale productions include blockbuster musicals produced by major performing arts
companies or major performing arts venues. The six categorisations of cultural and performing arts
activities/events were derived after viewing numerous categorisations of the performing arts from
numerous perspectives (e.g., cultural tourism, events, event tourism, arts and performing arts), but
are largely based on those for performing arts developed by Arts Victoria (1997a; 1997b; 1997c).
While two of the six sub-categories of the cultural events commonly found in cultural tourism
typologies and research woridwide namely, 'festivals or fairs'; and 'performing arts or concerts' (e.g.
Tourism Victoria, 2004a) are accommodated by this definition of cultural events, the cultural event
typology used In this study has intentionally deconstmcted the 'perfonning arts events' category into
more specific sub-categories by form to gain a better understanding of tourists' engagement in
these experiences. Within each of these cultural event subcategories, some could be further
distinguished as famous or Iconic based upon the fame of the venue, the artists or the production.
Whether this is a significant dimension of tourists' attitudes for attending cultural experiences will
also be tested In this study.
2.7 Cultural Tourist Motivation and Market Segmentation Research
Cultural tourism has been recognised as a separate product category since the late 1970s (Tighe,
1986), but the study of cultural tourism as a tourism activity, and of the cultural tourism market in
particular. Is still In its infancy (McKercher, 2002).
While there is considerable literature on tourism In general, concerning tourism patterns,
characteristics, motivations, decision-making processes and influencing factors and sources, very
little quantitative research focuses on cultural tourists or cultural event tourists and their motivation,
and how this market might best be segmented, either in Australia or elsewhere. Several
Investigators have called for more quantitative Information on cultural tourist attitudinal and
behavioural characteristics such as cultural tourism involvement, pursued motivation benefits and
expectations (e.g., Alzua et al., 1998). Alzua et al. (1998) further argue a need for identifying these
characteristics and patterns so that it can then be assessed whether substantive differences
between groups of cultural tourists can be identified that might influence and improve management,
marketing and planning. Alzua et al. (1998) claim the field of understanding cultural tourist
35

Chapter 2: Literature Review
behaviour has merely begun. Their research is one of few studies of direct relevance to this
proposed research because it is both empirical and conceptual and focuses on multi-dimensional
psychographic and behavioural market segmentation of International cultural tourists.
Pioneering work In this area Includes segmentation of cultural and heritage Intemational visitors to
North America (Prohaska, 1995); a model of different degrees of motivation for cultural tourism
based on North American cultural tourists (Sllberberg, 1995); and several studies applying benefit
segmentation to the cultural tourist market (e.g., Alzua et al., 1998; Frochot, 2004; Tian et al., 1996;
Weaver et al., 2002) with some claiming benefits and motivation are related If not substitutes (Alzua
et al., 1998; Frochot, 2004). This controversial Issue of the relationship between motivation and
benefits is further discussed later In this literature review, especially in section 2.11.4.3 Benefits
Sought or Gained-based Tourist Motivation and section 2.12.3.2 Benefits and the Motivational
Process.
Other cultural tourist market segmentation research has analysed cultural tourists' behaviour and,
based on the assumption that different tourism products appeal to different types of tourists, applied
activities-based segmentation as a means of segmenting the cultural tourism market (Dolnicar,
2002a; McKercher et al., 2002).
36

o • >
£ 2 S 5
0)
a
o
i2 .2
' 3 o
. 1 -
« c o
1 c l b
c
c
o c
.<!> C (1>
O
c CD
42
B >* o
o o
o6'
.2 5 uJ.2 5
2 £< S,
9 o ffl-S
v>
•Is. •^ 9 O CO
2 i o
= « " O Q . f 3f 2
tn _
75 o g
<p c
re m oS
re ^ O •
E 0)
.o
9H>
O te
re -.s
ill
c (D
A f
ocu
s of
this
Stu
dy
o c Q>
• c
X UJ
"'' « S-, 2 O ^ <!} i s
t5 o o
S ^ S £ £ E -a o
8 fe ? S
coS.S a> te 3
9 o ,
B c ( J
i
U)
0> c g
(D 3 0)
o
tn OJ tu 3
E S o p
2 E
2 1 . ^ (0
55 ^
t . U) g
- r Q - 5 x : > ' ! ' o E c L . E > T
Q . : ^
c
c r a g lA
n
"E E tn
III s <j y
. . V 0) to re
re c '
- 1 i S<« C > 0) P <B -
U3
^ E to 3 £ £ a5
•£ -? I 2.£ g. S I
o re to
J2 c o
1
S
2 3 "5 o
o8 ^ •(5 _
.« S m " ") w „, u) re J ^ p ^ t o m * " — 'Dro<DOtnS«> rei5l-£-sE-§E.g"E-=-£re-g ' ^ O ^ r e ^ r o o ^ r e Q ^ r o g r e r n r e
^ r Q--Y D ) , C D , a ) , Q. , Q-
.2 >« ca.g
~ -=. o <-> re a> ? •S';2> s i= ^
CO
08 ? o
(A (A Li VI tn
E C to re o 3 o c r N re 1
< g
& o
no
K ^
1 - U
i i 3
C\l
I .D5 U,

Chapter 2: Literature Review
More recent research focuses on cultural tourism as a motivation for visiting and experiencing a
destination, using Hong Kong as the destination case study (McKercher, 2002; McKercher and du
Cros, 2003). This research develops a cultural tourist typology and segments the cultural tourist
market Into five discrete segments by two dimensions - centrality of cultural motives In the decision
to visit a destination, and depth of experience at the destination.
Similariy in the allied area of cultural heritage tourism, in spite of a surge in demand for heritage
tourism, "little is known about tourists' visitation to "types" of heritage attractions and if their travel
behavior characteristics are related to their patterns of visitation" (Kerstetter et al., 1998, p.91). This
study examined both issues in the context of industrial heritage tourism, and using activities-based
segmentation found four "types" or dimensions of industrial heritage attractions and a relationship
beti/\/een these types of heritage attractions and the travel behaviour of Individuals who visit them.
Eariler research on individuals visiting heritage sites (Masberg and Silverman, 1996), found
differences In the experience outcomes of individuals visiting heritage sites. For some the
experience was "factual and external," while otiiers recalled outcomes such as "personal learning,
social benefits, and aesthetic experiences". These findings show cognisance of the importance of
understanding the cultural visitor experiences and behaviour at different types of cultural attraction,
often for market segmentation purposes.
Other research of relevance to the cultural experience tourism market motivation and segmentation
Is In the festival and event tourism motivation and segmentation research, where either the event or
festival case study has been culturally-related, or several events have been studied which comprise
one or more cultural events. Examples of tourist festival and event motivation research abound
and will be discussed in detail In the later section on defining and measuring motives (section
2.12.2.1).
2.8 Understanding Cultural Experience Tourist Motivation and Behaviour
Many variables important to understanding cultural experience tourist motivation and behaviour and
their implications for marketing, can be identified from the extensive body of literature and research
to date of consumer motivation and behaviour in general, and the more limited application of these
theories to the relevant consumer markets of tourists, cultural tourists and performing arts
audiences. While the remaining sections of this literature review will discuss In detail the variables
and supporting literature of relevance to this study on cultural experience tourist motivation, in
summary these variables comprise three broad groupings of tourist and audience characteristics:
demographic, psychographic and behavioural. Relevant demographic characteristics Include
country-of-residence, age, gender, education, income and occupation demographics; and travel trip
and travel group characteristics and patterns including length of stay. Attitudinal and psychographic
variables found to be of relevance to tourists and other visitors engaging In cultural experiences
Include attitudes, opinions and Interests, values and beliefs, preferences, motives, benefits and
expectations pursued. Behavioural variables include cultural experience attendance patterns and
38

Chapter 2: Literatijre Review
behavioural outcomes of benefits gained, satisfaction, quality evaluation and future intentions. In
addition there are influencing factors on the decision-making processes such as timing of tine
decision to attend, sources of information used, and barriers to attendance.
2.9 Motivation Research
The importance of and reasons for understanding consumer motivations Is widely acknowledged in
the consumer behaviour literature as well as in the allied literature of specific relevance to this
study, namely, motivation and tourists in general, cultural tourists, festival and event audiences, and
performing arts audiences. Crompton and McKay (1997), for example, outiine three reasons for
seeking to understand motives for attendance at festival events which emphasise their
importance for marketing purposes and hence their direct relevance to this research. These
reasons are: 1) identifying needs Is a prerequisite for effectively developing the programs of a
festival and marketing them because people do not buy unless products or services satisfy their
needs; 2) identifying motives Is closely related to satisfaction and a festival manager must better
understand the visitors' needs in order to monitor satisfaction; and 3) identifying motives
facilitates segmentation of target markets and development of effective promotion for segments.
There Is considerable ongoing debate, however, about defining, modelling and measuring
motivation, and the relationship between motivation and behaviour, which will be considered in the
following sections of this literature review.
2.9.1 Motivation and Cultural Tourist Definitions
The importance of the motivations of tourists has been recognised In the ATLAS transnational
cultural tourism research project, with the technical/operational definition of cultural tourism
expanded to include a conceptual dimension of 'intentions': "The movement of persons to cultural
attractions away from their normal place of residence, with the Intention to gather new infomnation
and experiences to satisfy their cultural needs" (Richards, 1996b, p.24; 2001b, p.37). Richards
further argues the use of the word 'intent' Is to differentiate between the 'culturally motivated' visitor,
who makes a conscious, mindful decision to consume culture on holiday, and the 'culturally
Interested' visitor, who may be almost an accidental cultural tourist (after Bywater, 1993 cited in
Richards, 2001b, p.37). While this definition recognises the importance of motivations to cultural
tourism. It has been criticised by various authors as being difficult to convey the complex nature of
such motivations in a definition (e.g., see Richards, 2001b, p.37; Alzua et al., 1998, p.3;
Marciszewska cited in Richards, 2001b, p.217).
In contrast to the ATLAS project's incorporation of 'intentions' which Alzua et al., (1998) claim Is a
complex concept to measure, they recommend Incorporating a scale to differentiate the cultural
motivations of the tourist, based on Silberberg's (1995) conceptualisation of cultural tourism. For
the purposes of their paper, they defined cultural tourism as, 'visits by persons from outside the
host community motivated wholly or In part by an interest in the historical, artistic, scientific or
lifestyle/heritage offerings of a community, region, group or Institution'. Richards (2001b, p.37)
39

Chapter 2: Literature Review
argues it would be hard to find a tourist who Is not Interested at least in part in some aspect of the
culture of the destination they are visiting.
Other authors stress the stijdy of tourist motivation is of most relevance to the category of tourism
described as holiday or pleasure tourism; that is, tourism that is generally non-essential and for
pleasure, and results from the needs of the tourists (Sharpley, 1994).
One problem with these definitions of cultural tourist motivations Is that they do not accommodate
the 'reluctant cultural tourist'. Research of museum goers (Tian et al., 1996), discovered a large
proportion (40% of the potential market) v\/hose decision to attend was constrained by a sense of
obligation to spouse or friends, or by pressure to go somewhere or to do something. These
obligations and pressures potentially defined their museum visit as a chore rather than as a freely
chosen delight.
This study alms to Investigate particular dimensions of motivation for selected groups of
international and interstate tourists who engage in at least one cultural experience while on their
current holiday in Melbourne, Australia to ascertain the role and relationships of these dimensions
In motivation and whether any cultural differences apply. It will therefore not be as restrictive as the
eariler mentioned definitions of cultural tourists which were limited to tourists deemed to be
'culturally motivated' 'wholly or In part' by their interests, intentions or behaviour. Rather than use
attendance intentions or behaviour to classify and categorise cultural tourists by degree of
motivation, this study will classify and categorise cultural experience tourists by their language
group and attendance at one cultural experience (which is both a cultural attraction and a cultural
event) and then will investigate the motivation of these tourists in attending this experience as well
as their motivation towards engaging In other types of cultural experiences while on holiday. This
study will therefore Incorporate the 'reluctant cultural tourist' and will focus on tourists who engage
in cultural experiences and their motivation for doing so, rather than 'culturally motivated tourists'
per se as defined In the above definitions.
In focusing on tourists undertaking one cultural experience and the motivation of these tourists and
the role of hedonism In their motivation, this study will also incorporate the attitudinal, experiential
and Interpretative dimensions of cultural tourism as well as the behavioural approach as has been
recommended by several authors (Alzua etal., 1998; Richards, 2001b).
2.9.2 Needs- Versus Values-Based Motivation Theoiy
At least two opposing theories of motivation are acknowledged in the literature, that is, values-
based and needs-based, as will be discussed below. Also discussed Is the debate that what
have traditionally been considered to be needs might better be conceptualised as values.
Needs-based motivation theory draws on Maslow (1943), Murray (1938), and in a tourism
context, on Dann (1977).
40

Chapter 2: Literatijre Review
Values-based motivation theory draws on Rokeach (1968; 1973) who defines personal values as
an ongoing belief that a particular mode of conduct or goal is personally preferable to its
opposite. Values also relate to preferences and behaviour (Rokeach, 1973).
There is also evidence In the tourism and leisure motivation literature (Galloway, 1998; Madrigal
and Kahle, 1994; Muller, 1991; Pitts and Woodside, 1986; PIzam and Calantone, 1987) as well
as In the psychology literature (Homer and Kahle, 1988) that what have traditionally been
considered to be needs might better be conceptualised as values. In their value-attitude-
behaviour hierarchy, Homer and Kahle (1988) describe a list of nine values: sense of belonging,
excitement, fun and enjoyment in life, warm relationships with others, self-fulfilment, being well
respected, a sense of accomplishment, security, and self-respect. All of these values can be
found as a need in various needs-based accounts of leisure travel motivation and some of them
are also found as benefits in tourism benefit segmentation research as will be discussed In
Chapter 4, Research Method, section 4.2.3 Benefit Construct Dimensions.
In the leisure travel motivation literature, motives conceptualised as values are evident. Pizam
and Calantone (1987) propose using values as determinants of tourist behaviour until a reliable
general measure of psychographics to describe consumer life-styles is available. Pitts and
Woodside (1986) look at personal values and travel decisions. Muller (1991) uses personal
values to define segments In an International tourism market. Madrigal and Kahle (1994) use a
value-system segmentation to predict vacation activity preferences. Galloway (1998),
recommends motives and motivations be conceptualised as values or 'incentive causes of
behaviour' which he categorises as pull factors, rather than needs (which are push factors) (p.
102). Furthermore, values conceptualised as beliefs about external states of affairs, are not like
needs where the only evidence for them is in the behaviour they are supposed to cause
(Galloway, 1998, p.102)
Acknowledging at least two opposing theories of motivation, that Is, values-based and needs-
based, several authors argue a complete account of motives of behaviour requires that the true
needs underiying values must be characterised (Galloway, 1998, 2002; Zuckerman, 1990).
Zuckerman's (1990) research focuses on the psychophysiological basis of a sensation seeking
market segment.
Consumer behaviour literature emphasises that needs and motivations are interrelated (Witt and
Wright, 1992). In particular, the existence of 'needs' generates 'motivations'. Reference to
Maslow's hierarchy of needs (1943) is common In tourism related motivation research as will be
discussed later in this literature review.
2.9.3 Benefits Sought/Pursued and Motivation
From the outset in 1961, benefits sought research was used by a number of America's largest
corporations as a superior approach to market segmentation with the strength being that it relied on
41

Chapter 2: Literature Review
causal factors than descriptive factors and therefore was a good predictor of future consumer
behaviour (Haley, 1961 cited In Haley, 1971). Initially, it was undertaken as experimental research
based on attitudes toward brands within a product category, but by 1971 it is described as
consumer value and perception based (Haley, 1971).
Benefits sought or pursued as a measure of motivation and a segmentation basis, has been
applied to many other mari<ets and studies particulariy from the 1980s onwards, but its greatest
attention and application has been in the fields of travel, tourism, leisure and recreation as will be
discussed in the next section on tourist motivation and the later section on benefits and the
motivational process (2.12.3.2).
2.9.4 Tourist Motivation Research
Tourist motivation studies embody an amalgam of Ideas and approaches, constituting what could
be refen'ed to as a "fuzzy set" of definitions and descriptions (Cohen, 1974, p.528). Cohen's
criticism of definitions, concepts and descriptions, was based on clarifying, 'who is a tourist?',
whereas the conceptual clarification almost thirty years on, continues to relate to clarifying 'why do
people travel?' and 'why do tourists participate in particular activities while travelling for pleasure
purposes?'. In the eariy 1970s, Lundberg first posed this basic question and lamented the paucity
of research on tourist motivation (Lundberg, 1971, 1972). Almost a decade later, Dann (1981)
called for conceptual clarification about tourist motivation and its implications for research. In his
appraisal of tourist motivation literature, explanation for lack of consensus over definition Is
attributed to a multi-disciplinarity of treatment and plurality of theoretical perspective within a given
discipline. There is consensus, however, that a grasp of "motivation" tells us "why" an individual or
group have behaved or are about to perform an action (Dann, 1981, p.202).
More than 30 years later, the tourism, travel, leisure and event tourism literature is replete with
articles explaining why people travel or why tourists participate in particular activities, and to
understand why people do these things, tourist motivations have been studied. A summary of the
earliest studies of tourist motivation and reviews of tourist motivation literature is provided In Table
2.8.
The aim of this section is to Identify the application of consumer motivation to the field of tourist
motivation and review what theoretical approaches and procedures have been used. The relevant
literature examined is from tourist motivation in the first instance, then comparisons are made with
the relevant theories identified from consumer motivation literature.
Through a review of the relevant literature, numerous theoretical approaches to tourist motivation
can be identified. At least three different approaches are Identified In Table 2.8: social
psychological theories (Crompton, 1979; Iso-Ahola, 1982), push and pull theories (Dann, 1981) and
expectancy theories (Witt and Wright, 1992).
42

Chapter 2: Literature Review
Table 2.8: A summary of the earliest studies of tourist motivation and reviews of tourist motivation literature
Author Major tourist motivation issue addressed Research Type
(Lundberg, 1971) Used 18 motivational statements including educational, cultural,
relaxation, pleasure, ethnic, and sociological motives.
Empirical
(Cohen, 1974) Clarification of who is a tourist and inclusion of motivational
typologies based on different tourist roles
Conceptual
(Cohen, 1979) Describes tourism as spanning a "range of motivations" from the sphere Conceptual
of leisure to religion
(Crompton, 1979) Identified 9 motives for pleasure ti"avel: 7 of which are classified as
'social psychological' and two as 'cultural' (novelty and education)
Exploratory/Empirical
(Dann, 1981) Appraisal of tourism motivation literature and research methods,
includes push and pull factors as a basis for tourist motivations.
Conceptual/Review
(Iso-Ahola, 1982) Rejoinder to Dann's (1981) survey of literature on tourism motivation
including a social psychological model of tourism motivation Conceptual
(Witt & Wright, 1992) Review of content tiieories of motivation and expectancy theories of
motivation and Uie application of tine latter to explain tourist motivation
Concephjal/Review
The tourist motivation literature overall, reveals four main approaches (Table 2.9), each of these
being based upon eariler motivation theories from other consumer behaviour literature as
summarised in Table 2.10. At least two, are seemingly opposing theories of motivation: needs-
based - largely based on the work of Maslow (1943); or values-based - largely based on the work
of Rokeach (1968), although some studies refer to both (e.g., Mueller, 1991). Others believe
expectancy theory from work motivation Is an appropriate framework for understanding tourist
motivation (e.g., Witt and Wright 1992). Benefits sought or realised are also often used as
measures for infen-ing motivation in travel motivation research (Frochot and Morrison, 2000; Pearce
and Caltablano, 1983) and sometimes are linked with needs and Maslow's Hierarchy of Needs
theory (e.g., Pearce and Caltablano, 1983).
Table 2.9: A summary of key studies in the tourist motivation literature
Author Major consumer motivation Issue addressed Research Type
Needs-Based
(Pearce & Caltablano, 1983)
Values-Based
(Madrigal, 1995)
Inferred ti^avel motivation from travelers' actual experiences which were
coded in classification of ti-avel motivation based on Maslow's analysis
of needs. Results indicated that positive and negative tourist experiences
highlighted different need stiuctures
Personal values, traveller personality type and leisure travel style
based on LOV and Plog's personality type
(Skidmore and Pyszka, 1987) Segmentation of the US intemational pleasure travel market based on VALS
Empirical
Empirical
Empirical
43

Chapter 2: Literature Review
Benefits Sought or Realised
(Pearce & Caltablano, 1983) Combined Maslow's Hierarchy of Needs (see above) and benefits
realised
Empirical
(Driver, Brown, & Peterson, Identified five generally recognized categories of experiential benefits in Conceptijal
1991b) leisure research: psychological, sociological, psycho-physiological,
economic, and environmental
{Frachot& Momson, 2000) A review of benefit segmentation to tourism research identifying Conceptual/
four types of applications: destination marketing, targeting specific Review
mari<ets, attractions/events/ facilities, and ti^aveller decision making
processes; general characteristics, challenges, issues, advantages and
disadvantages
Expectancy Theory-Based
(Witt & Wright 1992) Apply expectancy theory to a model of holiday preference and choice Conceptual
These four approaches to tourist motivation will be discussed in this section with comparisons of
their use In other marketing literature. Some of their advantages, disadvantages, problems. Issues
and challenges are included in this discussion. Additional approaches that have been used in
tourist motivation research and other approaches of possible relevance to tourist motivation are
then briefly considered. From this review of various approaches, recommendations for future
tourist and consumer motivation research will be made.
Table 2.10: A summary of key consumer motivation theories and studies of relevance to the tourist motivation studies
Author Major consumer motivation issue addressed Research Type
Needs-Based
(Maslow, 1943)
(Murray, 1938)
(McClelland, 1965; 1955)
Values-Based
(Rokeach, 1968,1973)
Hierarchy of needs
Classification of needs
Trio of basic needs/McClelland's tiieory of teamed needs:
needs for power, affiliation and achievement
Rokeach Value Survey (RVS) consisting of 18 personal values
and 18 social values
(Mitchell, 1983) Values and Lifestyles (VALS)
(Kahle and Kennedy, 1989) List of Values (LOV)
Benefits Sought or Realised
(Haley, 1968) Benefits sought by toothpaste martlet, measured by consumer
value systems and consumer perceptions about various brands
in product category of interest
Expectancy Theory-Based
(Vroom, 1964) Expectancy theory in relation to wori< and motivation
(Deci, 1985) Refined and expanded expectancy ttieory in relation to motivation
Conceptijal
Conceptual
Conceptual/
Empirical
Conceptijal/
Empirical
Conceptual/
Empirical
Conceptual/
Empirical
Conceptual/
Empirical
Conceptijal/
Empirical
Conceptual/
Empirical
44

Chapter 2: Literature Review
2.9.4.1 Needs-Based Tourist Motivation
That the concepts of satisfying needs or desires and the equilibrium that results from meeting
needs are fundamental to most theories of motivation, is widely stated in the tourist motivation
literature. The study of motivation has ti-aditionally been concerned with the needs and desires of
the Individual (Sharpley, 1994). A guiding assumption for the study of tourist motivation has
therefore been that, "in order to understand human motivation it is necessary to discover what
needs people have and how they can be fulfilled" (Witt and Wright, 1992, p.34). Shoemaker (1994)
claims there is an implicit assumption in all tourist motivation studies, that the consumer will choose
the destination or type of holiday or vacation that will best satisfy his/her desires or needs. Yuan
and McDonald (1990) restate Crompton's (1979) concept of equilibrium that results when no
discrepancy exists between the preferred behaviour and actual behaviour. Simply stated,
"equilibrium exists to the extent that physical, social, and psychological needs are met. Pleasure
travel is assumed to be goal-directed, aimed at satisfying these unmet needs" (p. 42). This concept
of equilibrium is inherent in most theories of motivation (Yuan and McDonald, 1990).
Maslow's (1943) hierarchical needs theory, although developed In the field of clinical psychology
has become widely Influential as the best-known general theory of motivation and has been applied
to explain motivation In many social disciplines, and areas such as business, marketing and
tourism. Murray's classification of human needs (1938) is an extensive list of physiological and
psychological needs that stimulated research Into specific needs such as the needs for
achievement, affiliation and power (e.g., McClelland, 1955,1965).
Needs-based motivation theories have been criticised in the tourism and other consumer
motivation literature. While they have been acknowledged as useful for drawing attention to the
wide variety of different needs that can motivate human behaviour (e.g., Witt and Wright, 1992),
predicting the effects of motivation on behaviour requires more than an understanding of human
needs, because, "a knowledge of people's needs will not necessarily tell us what they will actually
do to fulfil such needs, or indeed whether they will do anything at all" (p.44).
Specific criticisms of Maslow's hierarchy theory include its acknowledged strength of being
sufficientiy generic to cover most lists of human needs, therefore the concepts are too general
(Schiffman and Kanuk, 1997). Whether needs conform with Maslow's proposed prepotency
hierarchy has been questioned (Mowen and Minor, 1998) and even Maslow questioned the
hierarchy upon which his theory is based (1943). Another hierarchy-related criticism is that it
cannot be tested empirically as there is no way to measure precisely how satisfied one need is
before the next higher need becomes operative (Schiffman and Kanuk, 1997). Furthennore,
Maslow's theory does not take Into account heroic and altruistic behaviour as other theories can do
(Schiffman and Kanuk, 1997), nor Incorporates other Important needs such as dominance,
abasement, play, and aggression (Witt & Wright, 1992) that are included in Murray's classification
(1938).
45

Chapter 2: Literature Review
Despite these criticisms, Maslow's hierarchy Is considered a useful tool for understanding
consumer motivations, developing marketing strategy, appropriate advertising appeals and as the
basis for mari<et segmentation and product positioning because consumer goods often serve to
satisfy each of the need levels (Schiffman and Kanuk, 1997). Maslow's need hierarchy has been
called an 'emotional tiigger' that enables mari<eters to communicate with their target audiences on
a personal, meaningful level that goes beyond product benefits (Schrocer, 1991).
Witt and Wright (1992) conclude that, "the study of needs can at best only provide a partial
explanation of motivated behaviour" (p.44). In particular, the way in which an individual's needs
may be translated into motivated behaviour Is necessary when researching tourist motivation and
other such factors must be taken Into consideration if the explanation of tourist motivation is to be of
use in predicting behaviour (Sharpley, 1994).
2.9.4.2 Values-based Tourist Motivation
Psychologists believe that a person's standard behaviour is influenced by their values (cited In
Pizam and Calantone, 1987). A value is, "a class of beliefs shared by the members of a society, or
sub-society, concerning what Is desirable or 'good' or what ought to be, and what Is undesirable or
'bad'" (Pizam and Calantone, 1987, p.178).
Although abstract in nature, valid and reliable measures for personal values have been developed.
One of the most commonly used of these measures is the Rokeach Value Sun/ey (1968),
consisting of 18 instrumental values (ideal modes of behaviour) and 18 terminal values (ideal end-
states of existence) (Madrigal and Kahle, 1994). Despite the widespread use of the RVS
predominantly in the North American context, two other measures were developed in response to
criticisms of the RVS: the Values and Lifestyles (VALS) (Mitchell, 1983) and the List of Values
(LOV) (Kahle and Kennedy, 1989). The LOV scale is an abbreviated version of Rokeach's
personal value scale but is also based on Feather's (1975) the work on values and Maslow's
(1954) study of motivation and personality (Kahle, 1986).
In a comparative study of VALS and LOV, mixed support Is indicated for both of these measures
(Novak and MacEvoy, 1990). More contemporary literature Indicates that the LOV Is now used
more frequentiy than VALS due to Its superiority In relation to its reliability and validity (Daghfous et
al., 1999) and Its parsimony (Madrigal, 1995; Madrigal and Kahle, 1994). An acknowledged feature
of the VALS typology, is its foundation in social value rather than personal value, which is useful in
developing and implementing advertising messages serving the intrinsic motivations of the target
market (Ekinci and Chen, 2002).
There has been considerable research undertaken in relation to the Impact of personal values on
tourist motivation and consumption behaviour Including travel behaviour (Pizam and Calantone,
1987), travel decisions (Pitts and Woodside, 1986), vacation activity preferences (Madrigal and
Kahle, 1994), and vacation motives (Thrane, 1997).
46

Chapter 2: Literature Review
There Is similarity between values and interests, attitudes, beliefs, and opinions as all are
predispositions to behaviours and members of a tight social group respond to them In a similar
evaluative way (Pizam and Calantone, 1987, p.178). Their differences reside in their degree of
relative Inclusiveness and specificity, with values on the top of the hierarchy, being the most
inclusive and the least specific (Pizam and Calantone, 1987, p.178). Their experimental study
found that travel behaviour Is significantiy associated with a person's genera! values and vacation-
specific values. The latter were measured by their newly developed vacation values scale, with the
experimental study evidence suggesting that It Is a good predicator of travel behaviour (Pizam and
Calantone, 1987, p.180).
Personal values have been used extensively in consumer behaviour literature for market
segmentation purposes (Ekinci and Chen, 2002), as they are "determinants of attitudes and
behaviour and hence provide a stable and Inner-oriented understanding of consumers" (Kamakura
and Novak, 1992, p. 119). They have also been used for tourist mari<et segmentation purposes.
Pitts and Woodside (1986) used personal values based on the RVS to identify travel/leisure
"benefit segments", Skidmore and Pyszka (1987) used VALS to segment the US International
pleasure travel market. Madrigal and Kahle (1994) used LOV value-system segmentation to predict
vacation activity preferences, Ekinci and Chen (2002) used LOV in an attempt to detect segments
in British holldaymakers to Turkey. Value systems such as RVS, VALS and LOV are prefen-ed to
single values for predicting behaviour and identifying segments (Madrigal and Kahle, 1994).
2.9.4.3 Benefits Sought or Gained-Based Tourist Motivation One reason for the great attention and application of benefit segmentation in the fields of tourism,
travel, leisure and recreation. Is Its association with travelers' motivations which have always been
portrayed as a critical variable in the tourist decision making process (e.g., Crompton, 1979;
Lundberg, 1971). That there is a widely held belief of some association between tourists'
motivations and benefits sought, has been acknowledged (Frochot and Morrison, 2000), but the
exact link is still to be tested and proven. Frochot and Morrison (2000) claim Lundberg's (1971)
tourist motivation research is an example based on benefits even though they are not directiy called
'benefits' In the study.
Benefit segmentation has been noted as being better at predicting and explaining behaviour than
other measures which merely describe it, such as personality and lifestyles, volumetric,
demographic, or geographical measures (Loker and Perdue, 1992, p.30, based on Haley, 1968).
In a recent review of its application to tourism research (Frochot and Morrison, 2000), three types of
applications are identified: attribute-based (e.g., using a destination's or tourism services' attributes
or features as the benefits); psychologically-based (e.g., "grouping customers on the basis of the
importance they attach to a combination of sensory, rational and emotional benefits expected from
the product or service" Lewis, 1981, p.43); or a combination of both. Another typology Identifies two
contrasting operationalisations of benefits emerging in the tourism literature (Tian et al., Id96):
47

Chapter 2: Literature Review
before the 1980s, benefits were almost exclusively defined In terms of visitors' ratings of desired
amenities and activities (e.g., Crompton, 1979), since the1980s some researchers conceptualise
the tangible attributes as being merely conduits that have the potential to facilitate desired
experiential and psychological benefit outcomes (e.g., Iso-Ahola, 1982; Pearce and Caltablano,
1983). By 1991, five categories of experiential benefits are generally recognized: psychological,
sociological, psycho-physiological, economic, and environmental (Driver et al., 1991a).
Pearce and Caltabiano's (1983) research emphasises a strong association between ti-avel
motivation, benefits realised, and consumer needs. They noted that previous, "research
concerning travel motivation has frequently assumed that tourists are able and willing to articulate
their travel needs." (p.16). They argue that influences about travel motivation inferred from tourists'
actual experiences may provide fresh insights and their results indicated that positive and negative
tourist experiences were not the inverse of one another but rather highlighted different need
structures.
One issue in tourism benefit segmentation research is the timing of the collection of benefit
statement ratings with some based on benefits sought (I.e., prior to visitor departure) and others on
benefits realised (i.e., after trip is completed or based on past trip). Examples of the former include
Crompton (1979) and Crask (1981) on primary motivation for vacation travel, GItelson and
Kerstetter's (1990) investigation of the relationship between soclo-demographic variables, benefits
sought and subsequent vacation behaviour, and more recently, Jang et al., (2002) In their benefit
segmentation of the Japanese pleasure travel market. Examples of benefits realised research are
Pearce and Caltablano (1983) who Infer travel motivations from actual travel experiences,
Woodside and Jacobs (1985) who study benefits realised by major travel market, and Shoemaker
(1994) who segments the US travel market by benefits realised.
In terms of tourism benefit research areas of interest, while there has been a lot of research about
festival and event motivation, not much to date has been specifically benefit-related nor has benefit
research been greatly applied to specific market segments such as ecotourism, adventure tourism,
or cultural tourism nor to specific nationalities (Frochot and Morrison, 2000). This study alms to
make a contribution to several of these neglected areas of tourism motivation and tourism benefit
research. Its focus on motivation by selected markets of International and interstate tourists to
attend cultural attractions and events will contribute to the understanding of motivation in relation to
these types of experiences for these specific cultural groups and to the possibility of identifying
specific market segments within these markets.
Benefits are a particularly fuzzy area of tourism research with many different variables being used
as measures of benefits and the benefits themselves sometimes being considered a measure of
motivation or motives (e.g., Moscardo et al., 1996). In tourist segmentation studies, benefits are
often one of the variables Included but whether they are used as the differentiating variable or as a
describing characteristic varies. Hence the exact link between tourists' benefits and motivations is
48

Chapter 2: Literature Review
still to be tested and proven and this study alms to make some contribution to this other neglected
area of tourism motivation and tourism benefit research. Further consideration of the association
betiween motivation and benefits from the benefits research literature will be considered in Section
2.13.3 as well as what benefit variables are relevant to cultural experiences and how these benefits
should be used in this study's research of cultural experience tourist motivation.
2.9.4.4 Expectancy Theory-based Tourist Motivation
Predicting the effects of motivation on behaviour also requires an understanding of the processes
whereby needs are transformed into motivated behaviour and, in particular, of the way people's
expectations give motivated behaviour its direction (Witt and Wright, 1992). Needs-based theory of
motivation Is largely based on a content theory of motivation and ignores more recent development
in motivation theory such as work motivation theory, expectancy theory or VIE (valence-
Instrumentallty-expectancy) theory (e.g., Vroom, 1964 and refined and expanded by Deci, 1985).
Vroom (1964) applied expectancy theory to the context of work motivation and put forward ti^/o
equations the first of which has been used to explain or predict occupational preference and job
satisfaction, the second being to explain or predict occupational choice, remaining in a job and
job effort. Expectancy theory, through the concepts of valence (attractiveness), instrumentality
(for achieving other outcomes) and expectancy expresses the idea that motivation is a function of
the attractiveness of the outcome and the expectancy of achieving that outcome.
Witt and Wright (1992) suggest at the theoretical level expectancy theory enables many of the
existing concepts In the study of tourist motivation to be Incorporated within a single theoretical
framework: need theories such as Maslow and Murray; emotional aspects of tourist motivation -
the needs which Instigate the desire to travel In the first place - with the cognitive aspect - the
decision making involved In choosing whether to go on holiday and. If so, where. They further
claim that occupational (or holiday) preference and occupation (or holiday) choice seem to have
the greatest relevance to tourist motivation.
Witt and Wright (1992) propose an expectancy model of holiday preference and choice, which
Incorporates needs, attractiveness (valence) of holiday attributes, relative preference of different
holidays, and the Infiuencing factors of knowledge of holiday destination characteristics; limiting
factors such as cost, others' preferences, expectations, and instrumentality of holidays for
providing attributes. All of these will be further influenced by a variety of sources including
brochures, guide books and other people's experience, and also by the individual's own
experience of previous holidays of the same or a similar type; hence the feedback loops built Into
the model. All of these also result in a theoretical choice of holiday which acknowledges the
Importance of both push and pull factors.
Witt and Wright's expectancy theory of tourist motivation emphasises the relationship between
motivation, preference and choice. It Is fundamentally a needs-based model than a values-
based model of tourist motivation that then looks at attractiveness, instrumentality and
49

Chapter 2: Literature Review
expectations of outcomes as well as the influencing factors of knowledge of tourist product
characteristics and other limiting factors (barriers or constraints). Gnoth (1997) takes an
alternative view to motivation and expectation formation, the operatlonalisation of which he bases
on both the behaviourist notion of drive reduction and the cognitlvist constructs of attitudes and
values.
A limitation of the expectancy theory and model, is that the complexity of expectancy theory
makes It difficult to use the model to predict Individual behaviour (Witt and Wright, 1992), and
difficult to measure because there are so many variables. This complicated method of analysing
motivation, serves to highlight that tourist motivation is, itself, a complex subject (Sharpley, 1994).
2.9.4.5 Tourist Motivation Summary
The foregoing review of key approaches and some associated measures of consumer motivation
research used In the field of tourism has highlighted some of the key characteristics and
advantages that have emerged over more than forty years of use. In addition, this review has
uncovered several Issues, problems and potential disadvantages of the various approaches as
summarised In Table 2.11.
Table 2.11: Characteristics, issues, potential advantages and disadvantages of consumer motivation approaches, measures and features
Consumer Motivation Approach, Measure or Feature
Characteristics and Potential Advantages
Issues and Potential Disadvantages
Needs-Based Motivation Theories Understanding and prediction of buying behaviour
Definition of needs
Measurability
Use for market segmentation
Application to tourism context Links with other motivation theories
Demonstrates a wide variety of needs can motivate human behaviour
Predominately based on Maslow's hierarchy of needs (1943) No general measures of needs have been developed. Easier to measure physiological needs. Used extensively but usually in combination with other method such as benefit segmentation
Many tourism motivation and segmentation studies are needs-based Often combined with benefit segmentation and has been incorporated in Witt & Wright's (1992) expectancy model for tourist motivation
Predicting the effects of motivation on behaviour requires more than an understanding of needs
Difficult to develop general measures of psychographic needs A valid measure of psychographics for the purpose of market segmentation has yet to be developed
Values-Based Motivation Theories Understanding and prediction of buying behaviour
Definition of values
Measurability
Effective predictors of behaviour as central to individual's cognitive structure and therefore more closely related to motivations than demographic or psychographic variables Heavily based on Rokeach's Value Scale (1973)
Although an abstract concept, several
Considered to be a valid measure of tourist behaviour until a valid measure of psychographics is developed
Value systems are considered considered more reliable and effective measures than single values LOV & VALS have been
50

Chapter 2: Literatijre Review
Use for market segmentation Application to tourism context Links with other motivation theories
reliable and valid measures have been developed including RVS; LOV & VALS
Usually used as the primary segmentation criterion Many tourism motivation and segmentation studies are values-based Not specifically included in expectancy theory nor linked with any of the other motivation theories other than some value scales acknowledge Maslow's (1948) needs theory
developed in response to criticisms of RVS and at present, LOV is more frequentiy used than VALS
Expectancy Theory Understanding and prediction of buying behaviour
Definition
Measurability
Use for market segmentation Application to tourism context
Links with other motivation theories
Considered a superior tool for understanding behaviour especially the factors that detennine consumer preferences and choice Developed by Vroom (1964) for understanding work motivation based on people's valences, instrumentalities and expectancies Could be relevant for measuring consumer satisfaction
Not used
Well suited as a conceptual framework for tourist motivation for holiday preference and choice Can include most other relevant concepts especially drives, needs, attitudes, values and preferences
Complexity limits ability to predict individual behaviour in any precise way
Extremely complex with two formulas identified by Vroom (1964) Not suitable for this purpose
Has not been applied empirically in any tourism studies
Benefit Segmentation Understanding and prediction of buying behaviour
Definition of benefits
Measurability of benefits
Use for market segmentation
Application to tourism context
Links with other motivation theories
Considered superior to traditional segmentation techniques such as geographic, demographic, and volume-based because it is based on causal than descriptive factors Original articles used attributes, consumer value systems and brand perceptions.
Many previous studies have been undertaken from which the most commonly used benefit statements can be identified and most are psychologically based. Extensively used for segmentation, predominately using a two-step process of factor analysis followed by cluster analysis
Extensive since 1980s and still being used in 2000s
Often include needs-based benefits
Its superiority over newer techniques such as psychographic and lifestyle segmentation is still to be tested and proven. Often no precise definitions of benefits are provided. Various measures have been used and three possibilities exist: attribute-based, psychologically-based or combination of both. List of benefit statements developed so far is often modified to suit the particular situation.
Either factor or cluster analysis on their own or together have been used and there is no consensus on the one best method or the best technique to use within each method Some use benefits sought, others benefits realised, some benefits are needs-based, many use travel-related psychographic questions
Source: Adapted from Frochot and Morrison's (2000) review of benefit segmentation
51

Chapter 2: Literature Review
Two main marketing applications and purposes of consumer and tourist motivation theories and
research have been identified in this literature review to date, i) understanding why consumers
behave as they actually do, seek or intend to, in order to predict future buying behaviour, and 11) as
bases for market segmentation of tourist markets which is primarily undertaken for the further
purpose of enabling the development of more efficient and effective tourism marketing especially
communication, promotional strategies, advertising campaigns and product positioning.
While there Is clarity about what consumer motivation is, this being an understanding of why people
behave as they do, and consensus about its continuing significance in the consumer decision
making process and relevance to marketing practices, to date there is no single .standard or
consensus about the best way to understand or measure consumer or tourist motivation. Rather,
several widely used approaches and procedures have emerged, but some 'fuzzlness' between
them is still In evidence.
The implications for future research of consumer motivation in a tourism context, are that for the
time being, all four approaches are of continuing relevance and there Is a considerable body of
knowledge to underpin the proposed use of any one or combination. In particular, human needs,
values, benefits and expectations have been considered useful for understanding consumer
motivations, developing marketing strategy, appropriate advertising appeals and as the basis for
market segmentation and product positioning. Some argue that motivation is a purely
psychological concept, not a sociological one (Iso-Ahola, 1982). Others argue that in the case of
tourism, motivation often results from societal values, norms and pressures that are Internalised
and become psychological needs. Specific needs can be grouped together under general
headings such as escape, or avoidance motivations which Sharpley (1994) argues are,
"undoubtedly, rooted In society" (p.102). Overall tourism demand, however, results from the needs
and motivations of Individual tourists who, together, comprise the market for tourism and so a
micro, social action perspective is therefore of greater value to the study of tourist motivation (Dann,
1981; Sharpley, 1994).
In addition to these four main approaches to consumer and tourist motivation, other motivation
approaches of particular relevance to cultural experience tourist motivation, and related concepts
and factors, have also been identified as will be discussed in the next section.
2.9.5 Other Approaches to Tourist Motivation
These other approaches, concepts and factors Identified in the literature as relevant to tourist
motivation include push and pull factors referred to in the previous discussion (e.g., Witt and
Wright); and intrinsic and extrinsic factors (Holbrook, 1986). Several other motivation approaches
and factors are discussed because of their relevance to tourist motivation In general and in
particular to the consumption of experiential products and services such as cultural experiences
which Is the tourist motivation context of specific Interest to this study. These cultural experience-
related motivation approaches and factors are emotions (e.g., Gnoth, 1997); the consumer
52

Chapter 2: Literature Review
motivation theory of motivation for hedonic experiences (Mowen and Minor, 1998), and the hedonic
tourism motivation model (Goossens, 2000). As will be seen in the following sections discussing
each of these, many of these motivation-related approaches and factors are inten^elated suggesting
that motivation might be better considered as a process of interrelated multi-dimensional constiTJcts
than a single construct.
2.9.5.1 Push and Pull Factors and Tourist Motivation The push-pull framework is considered by some as a useful approach for examining the
motivations underiying tourist and visitation behaviour (Crompton, 1979; Dann, 1981; Kim et al.,
2003). Traditionally, push motives have come from the tourists themselves and have been socio-
psychological motives used for explaining the desire to go on a vacation, while pull motives have
been aroused by the destination and have been used to explain the choice of destination.
Crompton (1979) identified nine motives for travel: seven of which were socio-psychological or
push motives and two cultural pull motives being novelty and education. In this framework, push
factors refer to the specific forces that influence a person's decision to take a vacation, while pull
factors refer to the forces that influence the person's decision of which specific destination should
be selected (cited In Kim et al., 2003, p.170). This theory emphasises two stages in a decision to
travel, push factors occur first and are those that make you want to travel, pull factors affect where
you travel, given the Initial desire to travel.
Consideration of push and pull factors to enable a full understanding of tourists' motivation to travel
Is supported by various authors. Motives enable an understanding of the propensity of travel,
(Andersen et al., 2000), but this is only a partial explanation of why tourists visit a particular
destination or atti-action. Pull factors relating to the destination or attraction also need to be
considered to fully understand this process, (Andersen et al., 2000). Similarly 'reasons for visit' are
sometimes used as a method of operationalising measurement of motivation or motives (e.g., Tian
et al., 1996). While 'reasons for visit' usually Include some internal psychological motives, they also
often include some pull factors relating to the specific destination or attraction.
Goossens (2000) describes push and pull factors of tourist behaviour as, "two sides of the same
motivational coin" (p. 302). He further posits that the psychological concept, emotion, connects
both sides; with consumers, and In particular tourists, pushed by their (emotional) needs and pulled
by the (emotional) benefits of leisure services and destinations. Consequentiy, he claims that
emotional and experiential needs are relevant In pleasure-seeking and choice behaviour. This
theory emphasises a directional relationship between needs, benefits and motivation, with needs
functioning as a pushing motivation and benefits functioning as a pulling motivation.
Some argue that the motivation to travel can only relate to push factors (e.g., Witt and Wright,
1992), others see push factors in terms of needs (e.g., Pearce, 1982).
53

Chapter 2: Literature Review
2.9.5.2 Intrinsic and Extrinsic Motivation with Tourist Motivation Implications
Motivation to engage in activities can further be because of their intrinsic value (i.e., for their own
sake rather than as a means to an end) or for their extrinsic value (I.e., as a means to an end)
(Holbrook, 1986).
This motivation distinction could be of relevance to aesthetic and performing arts cultural
consumption with the criteria for successful consumption being analogous to the appreciation of a
work of "art' (versus a "craft") being as a thing In itself, without regard to Its functional utility (Becker,
1978). Similarly In the experiential view of consumption (Hirschman and Holbrook, 1982), the
consequences of consumption or the output variables are the enjoyment that the product offers and
the resulting feeling of pleasure that It evokes (Klinger, 1971). The criteria for successful
consumption are essentially aesthetic In nature and hinge on an appreciation of the product for Its
own sake, apart from any utilitarian function that It may or may not perform (McGregor, 1974).
Conceptually, Holbrook and Hirschman (1982) further suggest that the relative salience of
evaluative criteria in the experiential view of consumption depends in part on the Individual's
personality and their response to eariler steps of task definition, type of Involvement, search activity
in the information processing model. For example, where the consumption task is defined as the
pursuit of hedonic response, aesthetic criteria associated with play mentality would be likely to
apply. They further note that consumer researchers have devoted little attention to the underiying
determinants of fun and playful activities even though it appears that consumers spend many of
their waking hours engaged in events that can be explained on no other grounds. They call for a
better understanding of such standards as a vital link In the further development of the experiential
view.
Holbrook studied the role of certain personality variables and gender In affect toward clothing
design features. Including a person's tendency to engage in a variety of activities for Intrinsic or
extrinsic reasons (1986). A major finding was that in general, intrinsic/extrinsic motivation appeared
to have a significant but weak influence on affect.
Another common approach to Intrinsic and extrinsic motivation, is that the former results from
Influences Internal to the individual such as their needs, desires and other such psychological
motives, whereas the latter results from influences external to the individual such as a wide variety
of different forces and pressures emanating from an individual's social and cultural environment
which may, to a lesser or greater extent. Influence their internal motivations (e.g., Sharpley, 1994).
Therefore, while it has been argued that motivation Is a purely psychological concept, and not a
sociological one (e.g., Iso-Ahola, 1982), many authors acknowledge that individual motivation is
influenced by the external environment (e.g., Sharpley, 1994). Sharpley recommends a micro,
social action perspective be adopted in the study of tourist motivation as overall tourism demand
results from the motivation of individual tourists who together comprise the market for tourism
(1994).
54

Chapter 2: Literature Review
Another approach to motive stiucture, acknowledges that they can be physiological as well as
psychological, and even sociological. Many propose that tourism is primarily a social psychological
experience (Mannell and Iso-Ahola, 1987). What matters are the individual's cognitions and
feelings about the experience being undertaken (Dunn Ross and Iso-Ahola, 1991). Motivation for
hedonic experiences are considered to have some physiological dimensions and some
psychological dimensions (Mowen & Minor, 1998). Sociologically, motives always occur within a
given environment, and it is this environment as well as the individual's values and attitudes that
shape and form the specific response to a need (after Gnoth, 1999).
This study acknowledges the intrinsic and extrinsic approach to motivation and the implications of
the underlying dimensions of motivation being comprised of some that are psychologically-based,
others that are physiologically-based, sociologically-based, and combinations of all three.
Consequentiy, this study will test these different types of dimensions for cultural experience tourist
motivation.
2.9.5.3 Seeking and Escaping Framework for Tourist Motivation Dimensions Another general theory of tourist motivation is the dichotomous seeking/escaping framework
developed by Mannell and Iso-Ahola (1987). Further tested by Uysal et al.(1993) in an event
motivation context, in this framework two dimensions operate simultaneously to bring about tourist
behaviour: the desire for change from one's dally routine (escape), and the desire to obtain intrinsic
personal rewards and interpersonal rewards through travelling into a contrasting environment
(seeking). Krippendorf (1987) shares a similar view of motives having two main dimensions:
motives to escape; and motives to where the journey leads, that is going towards something or
somebody; adding that the former can be considered negative motives, and the latter, positive
motives associated with experiencing something (Krippendorf, 1987).
The seeking/escaping framework can also be considered as related to the push/pull motivational
theory (Uysal et al., 1993). It Is considered particulariy relevant for testing in this study and will be
further discussed later in this chapter and in the conceptual framework for this study presented in
Chapter 3.
2.9.5.4 Hedonic Emotions and Tourist Motivation Emotions are an intrinsic, experiential feeling that is an important influence on tourist motivation.
That the motivation concept Is complex from both a cognitive and an emotional viewpoint, has been
stressed by Gnoth (1997). Cognitions refer to mental representations such as knowledge or
beliefs. Emotions on the other hand, encompass drives, feelings, and instincts. Gnoth (1997)
argued, for instance, that emotions are particularly important In holiday tourism, since it is a
pleasure-seeking activity. Goossens (2000) recommends a tourism motivation model therefore
should acknowledge and operationallse emotional infiuences In Its formation processes.
Krippendorf (1987) conceptually identifies another type of tourism motives: 'egoistic motives'. He
proposes that these can predominate, especially since the seventies when there has been a
55
Chapter 2: Literature Review
marked shift towards active holidays and having fun, enjoying oneself, experiencing happiness,
having a good time, and play have become more important as have other more active motives.
This motive category as described by Krippendorf,,. could be strongly associated with hedonism,
hedonic emotions, and refen^ed to as hedonic motives, although such dimensions of motives have
rarely been described this way in the tourism or event motivation literature to date.
Relating to the discussion in the previous section of push and pull factors and their relationship with
motivation and emotions, one way of acknowledging and operationalising emotional influences on
tourism motivation is to incorporate research of emotional needs that are pushing tourist
motivations as well as emotional benefits that are pulling tourists to be motivated towards particular
tourism activities, services and destinations (Goossens, 2000). Goossens (2000) further
recommends hedonic responses are another form of emotional Influences that are fundamental to
tourist motivation as evidenced by entitling his conceptual model for tourist motivation, the hedonic
tourism motivation model. This model will be further discussed in Section 2.9.6.
2.9.6 Other Theories of Consumer Motivation of Possible Relevance to Cultural
Experience Tourist Motivation
Another trend in consumer research over the past 20 years has been moving away from
developing broad theories of motivation such as Maslow's Hierarchy of Needs (1943) and
McClelland's social needs (1955, 1965) toward creating more restricted midrange theories that
explain narrower facets of human behaviour (Mowen & Minor, 1998). They identify six midrange
theories of motivation that are supported by research and so are considered to have higher validity
than others. These motivation theories are categorised as midrange at different points on a
continuum ranging from more physiologically based theories to more cognitively based theories.
One of these, motivation for hedonic experiences (e.g., Hirschman and Holbrook, 1982; Holbrook
and Hirschman, 1982), could be considered particulariy relevant to cultural experience tourist
motivation because cultural attractions and events are examples of products that are intrinsically
more emotionally Involving than packaged goods (Mowen and Minor, 1998), and therefore
attendance could be motivated by desires to experience emotion. In Mowen and Minor's (1998)
continuum, affective-based motivation for hedonic experiences theory Is considered to be
midrange, being part physiologically-based and part cognitlvely-based.
One purpose of this study will be to investigate the role of this underiying hedonic emotion
dimension within the cultural experience tourist motivational process and examine whether it varies
for different cultures.
2.9.6.1 Hedonic Consumer Motivation Theory and the Hedonic Tourism Motivation Model
In particular, hedonic consumption research has focused on desires to experience emotion and
leisure activities and both of these desires could be directiy tourism-related. With hedonic
relevance coming from the product's symbolic value and the emotion it is anticipated to elicit in the
56

Chapter 2: Literature Review
consumer (Mowen and Minor, 1998), hedonic consumption research has focused on products that
are Intrinsically more emotionally involving than packaged goods, examples being movies, rock
concerts, theatre, dance, pornography, and sporting events. Many of these products are cultural
experience-related and could also be tourism-related which are two contexts of specific interest to
this research. Cultural offerings satisfy consumer wants in the hedonic or aesthetic realm
(Holbrook and Hirschman, 1982). Many cultural offerings are forms of entertainment that primarily
serve consumer desire for stimuli that result In appealing visual and auditory experiences (Holbrook
and Schlndler, 1994). This contrasts with more simple utilitarian and functional products that satisfy
more well-defined utilitarian needs (Holbrook and Schlndler, 1994). Holbrook and Schindleris
(1994) proposition that many cultural offerings are forms of entertainment serving consumer desire
for stimuli that result in particular experiences, raises the question of whether entertainment is a
separate dimension of tourist's motivation to attend cultural offerings or a sub-dimension of hedonic
experiences which in turn are sub-dimensions of other underiying constructs of tourist motivation?
This study adopts the latter approach as will be discussed in the next section 2.9.6.2 on
conceptualising tourist motivation as a process comprising multi-dimensional constructs which
could have underiying hedonic dimensions.
The relevance of hedonic consumption and allied concepts to cultural tourism can also be noted
from the cultural tourism literature. Cultural tourism Is similar to other forms of tourism in that
tourists satisfy their personal needs by consuming enjoyable experiences (Urry, 1990). Urry (1990)
further claims however that, "making sense of 'fun, pleasure and entertainment' has proved a
difficult task for social scientists" and hence, "there is relatively little substance to the sociology of
tourism" (p. 7). Others claim many tourism experiences, especially many cultural tourism
experiences, have their basis in entertainment (McKercher and du Cros, 2002, p.28). In this
phenomenon, only a small number of tourists really seek a deep learning experience when they
travel, the rest are travelling for pleasure or escapist reasons and wish to participate In activities that
will provide a sense of enjoyment (McKercher and du Cros, 2002, p.29-30).
Hedonic consumption Is based on emotional feelings and experiences in using products, and
therefore, to what extent and in what ways these apply in tourists' motivation for and consumption
of cultural experiences are research questions for consideration in this study.
Hirschman and Holbrook (1982) stated that, "hedonic consumption refers to consumers'
multisensory Images, fantasies, and emotional arousal in using products." They termed this
configuration of effects as, "hedonic response" (p.93). Goossens (2000) agrees that such
experiential responses occur during tourism consumption, but adds in his conceptual model of
Hedonic Tourism Motivation, that they also occur in the motivation process. He conceptualises
hedonic responses occur in the tourist motivation process when tourists are involved with
marketing stimuli as part of the Information gathering and processing stage and such responses
also reflect the reaction of the individual when the push and pull factors Interact with each other.
Emotions and mental imagery are identified as variables reflecting the consumer's hedonic
57

Chapter 2: Literature Review
responses. He acknowledges that this is an experiential view of consumer research (after
Holbrook and Hirschman 1982).
Goossens' conceptual model of Hedonic Tourism Motivation (2000) is particulariy relevant to this
study because it conceptualises tourist motivation as a complex process comprising numerous
unobservable variables and constructs that are influenced by other factors, operationalised by other
variables, and in turn produce outputs through a process of complex inten-elationships. The main
constmcts In Goossen's model are push factors such as consumer needs, motives and drives; pull
factors of marketing stimuli; involvement; information processing; the hedonic responses of mental
imagery and emotions about leisure products and touristic attractions; and motivation which is
operationalised as behavioural intentions towards tourism attractions as in Fishbein and Ajzen's
(1975) theory of reasoned action. Goossen's model does not incorporate an "attitude" construct
per se as in Fishbein and Ajzen's theory, because Goossen's argues an attitude construct does not
fit in Holbrook and Hirschman's (1982) "experiential" view of consumer research. Nevertheless, he
acknowledges that the attitude concept Is very functional In research on Information processing and
marketing stimuli, especially in relation to advertising (e.g., Derbaix, 1995; Moore and Harris, 1996;
Oiney et al., 1991), and a more structural and attitudinal approach can be taken to image concept
(e.g., Walmsley and Young, 1998).
Despite Goossens' (2000) recommendation that conceptual models for hedonic tourist motivation
not include attitudes, recent research in relation to a range of products and brands, links hedonic
consumption to consumer attitudes claiming that consumers develop hedonic attitudes as well as
utilitarian attitudes towards products and brands (Voss et al., 2003). The view that attitudes are
complex and multidimensional (BagozzI and Burnkrant, 1979; Eagly and Chaiken, 1993) has
directed marketers to integrate an experiential view of consumption with more traditional-functional
approaches (Mano and Oliver, 1993). Voss et al., (2003) adopt a two dimensional
conceptualisation of consumer attitudes based on Batra and Ahtola (1990). The first dimension is a
hedonic dimension resulting from sensations derived from the experience of using products, and
the second is a utilitarian dimension derived from the functions performed by products (p. 310).
Similariy, BagozzI and Burnkrant (1979) suggest a two-component view of attitude that contains the
components of cognition and affect. Attitudes as a multi-dimensional construct of direct interest to
this study of cultural experience tourist motivation will be discussed briefly In the next section
2.9.6.2 on the motivational process and then in detail as one of the main constructs in this study's
proposed motivational process for understanding the cultural experience tourist motivation (Section
2.10.1).
2.9.6.2 Motivation as a Process
As this literature review of motivation has shown, there is no universally agreed theoretical
approach to understanding motivation, consequentiy there Is no agreed theoretical approach to
understanding tourist motivation (Fodness, 1994).
58

Chapter 2: Literature Review
There is general consensus that motivations are dynamic and multivariate or complex in the
tourism literature (e.g., Holden and Sparrowhawk, 2002) and In the leisure literature (e.g., Mannell,
1999). Pearce (1988) suggests that motivations for participating in tourism are dynamic, changing
with age, life-cycle stages and the influence of other people.
Strong arguments have emerged throughout this review of tourist motivation literature for a
theoretical approach to understanding cultural experience tourist motivation to be based on a broad
conceptual approach to motivation as a process of several multi-dimensional constructs rather than
a single construct. The broad conceptual approach to motivation adopted in this study has been
adapted from the leisure literature where Mannell (1999) identifies a general model of motivation
that has been used to explain a wide range of leisure behaviour and motivation-based satisfaction
Including participation in tourism and leisure travel (Fodness, 1994). Basically this model (Figure
2.2) suggests that people possess a multitude of needs, motives, desires, or expectations. First the
emergence of a need creates a state of disequilibrium within people which they will try to reduce;
hence, the energetic component of motivation. Second the presence of such needs is generally
associated with a belief or expectation that certain actions will lead to the reduction of this
disequilibrium; hence, the goal-orientation or direction component of motivation. Theoretically, the
motivational process Is assumed to be a chain of events, whereby on the basis of some
combination of this desire to reduce the internal state of disequilibrium, and the belief that certain
actions can serve this purpose, people act or behave In a manner that they believe will lead to the
desired goal or satisfaction. If the behaviour or participation in an activity results in the fulfillment,
the experience of satisfaction provides positive feedback that the behaviour or activity is
appropriate. If the behaviour does not result In satisfaction, this negative feedback may result In
people modifying or stopping their behaviour or activity. The assumption is that the recreationist is
goal-directed, is knowledgeable, thinks rationally, and selects leisure activities that are suitable to
fulfill expected and desired outcomes or goals.
Figure 2.2: Mannell's model of the motivational process
N e e d s / P r e f e r e n c e s / M 0 l ive s /D e s i res /
E xp e c ta t i o n s
T
B e h a vio r /Act i v i ty G 0 a Is /S a tis fa c t ion s /
P s y c h o l o g i c a l B e n e f i t s
F e e d b a c k
Source: Based on Mannell (1999)
The numerous concepts of relevance to consumer motivation from this preceding literature review
include: needs (e.g., Maslow, 1943); values (e.g., Rokeach, 1968), benefits sought or gained for
inferring motivation (e.g., Frochot & Morrison, 2000); expectancy theory (e.g., Deci, 1985; Witt and
Wright, 1992; Vroom, 1964), preferences (e.g., Witt and Wright, 1992), motives, values,
perceptions, attitudes and expectations (e.g., Gnoth, 1997), emotional needs, emotional benefits,
59

Chapter 2: Literature Review
hedonic responses and behavioural intentions (e.g., Goossens, 2000), hedonic experiences
(Mowen and Minor, 1998), needs, motives, desires or expectations, goals, satisfactions or
psychological benefits (Mannell, 1999).
The next sections of this literature review, further review the relevant literatijre for each of these
constructs of primary relevance to the cultural experience motivational process, that is, attitudes,
motives, benefits sought, benefits gained, and satisfaction.
2.10 Concepts to be Tested in this Study for Understanding Cultural Experience Tourist Motivation
2.10.1 Attitudes
2.10.1.1 Attitudes, Values or Needs Consumer Behaviour Debate There is an ongoing debate about what is the best measure or variable for predicting and
explaining consumer and tourist behaviour. This debate was Introduced in Section 2.9.2 where two
opposing theories of motivation theory were acknowledged: needs-based or values-based. That
both of these approaches have been used extensively in relation to tourist motivation research and
literature was considered In sections 2.9.4.1 and 2.9.4.2 respectively. Criticisms of needs-based
motivation theories In the tourist and other consumer motivation literature were raised In this
previous discussion (Section 2.9.4.1). Criticisms of values-based motivation and market
segmentation research were also found (Section 2.9.4.2), largely evidenced by the multiplicity of
values scales commonly used. That needs might better be conceptualised as values was a further
issue acknowledged in the needs versus values motivation theory debate (Section 2.9.1). That
values have been used in the leisure travel motivation literature to conceptualise motives was also
previously acknowledged in this eariler debate section as well as the argument that a complete
account of motives of behaviour requires that the needs underiying values must be characterised
(Section 2.9.1).
An association between values and attitudes was previously raised In the discussion of values-
based tourist motivation (Section 2.9.4.2) where similarity between values and other predispositions
such as interests, attitudes, beliefs and opinions was acknowledged and values were described by
some authors as determinants of attitudes (Kamakura and Novak, 1992).
In the consumer behaviour literature, there is ongoing debate about whether values or attitudes are
the best measure or variable for predicting and explaining consumer behaviour. Fishbein and
Ajzen (1975) provided a general review of theory and research in the area of attitudes and
attempted to integrate the diverse literature in the area into a theoretical framework. Their resulting,
theory of Reasoned Action, deals with the relations among beliefs, attitudes, Intentions, and
behaviour and can be used to predict, explain, and Influence human behaviour in applied settings
(Ajzen and Fishbein, 1980; Fishbein and Ajzen, 1975). The attitudinal component of this theory
refers to the person's attitude toward performing a behaviour. Their literature review acknowledges
60

Chapter 2: Literature Review
conceptualisation of attitudes being dominated by the late 1950s in the framework of the age-old
trilogy of cognition, affect and conation, but from their point of view an attitude toward any concept
is simply, "a person's general feeling of favorableness or unfavorableness for that concept" (Ajzen
and Fishbein, 1980, p.19). Other things being equal, they state, "the more favourable a person's
attitude is toward a behavior, the more he should intend to perfomn that behavior" (p.56) and vice
versa re unfavourable attitudes. This theory of Reasoned Action was further refined by Ajzen
(1985) Into the theory of Planned Behaviour which postulates three conceptually independent
determinants or predictors of intentions: attitudes, subjective norms and perceived behavioural
control. Attitijdes are important factors in both theories.
In the 1970s and more recently, some claims have been made that values are better predictors of
behaviour than needs or attitudes, because theoretical considerations suggest that values are more
central than attitudes as determinants of behaviour (Chan and Rossiter, 2003; Rokeach, 1973).
Several values scales have been established since the late 1960s - for example, Rokeach Value
Scale (1968), VALS (Mitchell, 1983), and LOV (Kahle and Kennedy, 1989) - however, Chan and
Rossiter (2003) claim empirical research fails to establish a strong link between values and
consumer behaviour, particulariy in cross-cultural contexts, which they suggest Is due to unresolved
measurement Issues concerning cross-cultural values.
Later in the motivation-based segmentation discussion (Section 2.12.1.3), Alzua et al. (1998) call
for multi-dimensional segmentation that integrates attitudinal as well as behavioural characteristics
as the former may trigger or drive behaviour. They list benefits sought at a destination as an
example of an attitudinal characteristic of relevance to segmentation of tourists.
To assess a person's attitude toward a behaviour, Ajzen and Fishbein (1980) recommend using
any of the standard scaling procedures that have been developed since the 1940s and 1950s such
as the Thurstone and Likert scales, Guttman scale, and the semantic differential scale by Osgood
and his associates. They acknowledge other Investigators have often attempted to include the
reasons for, and consequences of, a person's evaluation within their definitions and measures of
attitude. Consequently these researchers have assessed perceptions, beliefs, motivations, and
intentions. Ajzen and Fishbein (1980) do not deny the importance of such factors, but prefer to
treat them as separate concepts that can be related to attitudes rather than treating them as part of
the attitude.
Further discussion of attitudes, especially definition and measurement issues will be continued in
Section 2.10.1.2 of this literature review.
2.10.1.2 Defining and Measuring Attitudes
One of the originators of modern attitude measurement theory, L.L. Thurstone (1931) defined
attitude as, "the affect for or against a psychological object". However, as eariy as 1931, Thurstone
made It clear that although a person's attitude toward an object should be related to the pattern of
their behaviour with respect to the object, there is no necessary relation between attitude and any
61

Chapter 2: Literature Review
given behaviour. Two people may have, "the same degree or intensity of affect favourable toward
a psychological object and ... their attitudes would be described In this sense as Identical but that
they arrived at their similar attitudes by entirely different routes" has implications for their behaviour
which may take quite different forms" (p. 263). A year later, R. Likert (1932) developed a simpler
scaling procedure for measuring attitudes which was widely adopted and is still used today. It
results in a single score that represents the degree to which a person Is favourable or unfavourable
with respect to the attitude object Similar to the Thurstone scaling attitude measurement method,
a given attitude score on a Likert summated ratings method, can reflect different patterns of beliefs.
Intentions, or actions (Ajzen and Fishbein, 1980). The social psychologist Allport (1935 cited in
Middleton and Clarke, 2001), defined attitudes as, "a mental state of readiness, organized through
experience, exerting a directive influence upon the Individual's response to all objects and
situations with which it is related" (p.79).
These early definitions of attitudes and associated measurement methods emphasise several
qualities that are upheld today despite the term attitude being defined in numerous ways over the
past sixty years. The use of attitudes to refer to the affective or feelings responses that Individuals
have for or against an object, is still agreed with by most consumer behaviour investigators today,
and is the characteristic that distinguishes attitudes from habits, traits, drives or motives as will be
discussed below. Also the distinction between attitudes and the concepts of beliefs, intentions, and
actions or behaviour is upheld by Fishbein and Ajzen (1975) in their theory of Reasoned Action
which is based on these four separate but inter-related constructs. Of the age-old three component
view of attitudes being comprised of affect, cognition and conation or behaviour (Rosenberg et al.,
1960 cited in Ajzen and Fishbein, 1980, p. 19), Fishbein and Ajzen (1975) resen/e the term
"attitude" for affect, "belief for cognition, and "intention" for conation. They make a further
distinction between behavioural intentions and actual behaviour.
From a consumer behaviour viewpoint, attitudes have been defined as, "a predisposition, created
by learning and experience, to respond In a consistent way toward an object, such as a product"
(Moutinho, 1987, p.19). Fishbein and Ajzen (1975) Identify a similar definition with which most
investigators would probably agree, "a learned predisposition to respond In a consistently
favourable or unfavourable evaluation of a given object" (p. 6). The use of attitudes to refer to the
affective or feelings responses that consumers have toward an object or a general evaluation of an
object. Is what distinguishes attitudes from habits, traits, drives or motives (Fishbein and Ajzen,
1975).
Attitudes differ from values and beliefs, with both of the latter underiying or acting as antecedents to
the former. That beliefs underiie attitudes as well as Intentions and behaviours. Is acknowledged
by Fishbein and Ajzen (1975): "the totality of a person's beliefs serves as the informational base
that ultimately determines his attitudes, intentions, and behaviours" (p. 14). Beliefs and attitudes are
also viewed as separate constructs by many authors (Ajzen and Fishbein, 1980). Although the
multi-component view of attitudes defines them in terms of three separate components - cognitions
62

Chapter 2: Literature Review
(beliefs), affect (feelings), and conation (behavioural intentions) - this conceputalisation fails to
distinguish these concepts such that each has its own set of determinants (Mowen and Minor,
1998). Some evidence indicates that beliefs and feelings reside in completely different
physiological systems with beliefs residing in a cognitive system influenced by cognitive-learning
principles, while feelings and affect residing in the autonomic nervous system, which Is affected
more by classical-conditioning principles (Ostrom, 1969; Scott, 1968; Zajonc and Markus, 1982).
Values have been described by some authors as determinants of attitudes (Kamakura and Novak,
1992). Others claim they form the link between obsen/able behaviour and Its underiying abstract
values (Gnoth, 1999). Also in comparison with values, attitudes, have been described as more
articulated and directed to specific objects (Moutinho, 1987).
In terms of the relation between attitude and behaviour, most definitions of attitude regard
readiness for response as their essential feature (Ajzen and Fishbein, 1980), which was
emphasised by Allport (1935). Furthermore, attitudes provoke behaviour that is favourable or
unfavourable toward the attitude object (Ajzen and Fishbein, 1980), as emphasised in eariy
definitions.
Lastiy, attitudes are linked with satisfaction because satisfaction is itself an output attitude that is the
product of complex relationships between other constructs as will be discussed in the later
definition of satisfaction (Section 2.10.4.1).
In a tourism context, attitudes are, "predispositions or feelings toward a vacation destination or
service, based on multiple perceived product attributes (Moutinho, 1987, p.19). Attitudes towards
tourism are subsets of a wider view and broad consensus on the desired quality of life and how to
achieve it (Middleton and Clarke, 2001). As well as being formed by beliefs, these authors suggest
attitudes are also generally formed of the Ideas, fears and aspirations that people hold about their
lives. Hence another consumer behaviour measure of attitudes is Incorporated within the Values,
Attitudes and Lifestyles Survey (VALS) (Mitchell, 1983).
A person's interest in the arts and their past experience in attending cultural and performing arts
activities (at home and on holidays) could be a relevant dimension of their attitudes about attending
cultural experiences and behavioural outcomes. In relation to period theme pari< consumption
experience, for example, visitors require cultural capital sufficient to interpret what they are viewing
(1998). This cultural capital might often be gained organically and stimulated as memories by the
presentation of the parks. Cultural capital also enables a more critical engagement between the
visitor and the cultural experience that goes beyond fun or empathy with the period, and might
involve emotional attachment and exploration of nostalgia. This emphases the complexity of the
period park consumption experience for some visitors whereby cultural capital (cognitive
knowledge) Is required to interpret the experience and cultural capital might also be gained through
the consumption experience.
63

Chapter 2: Literature Review
Individual attitudes and tourism choices operate within broader socio-culbjral attitudes that
represent commonly held beliefs and notions with which many people are brought up as children.
These vary according to different national cultures, are fostered by the popular media, and are
influenced by effective promotion and marketing (Middleton and Clarke, 2001). Therefore, cultural
language group differences may apply to this attitude construct and underiying dimensions such as
cultural and arts enthusiasm.
All of these definitions, link attitudes to object or product attributes. Multi-attribute models from
general consumer behaviour theory exist and build on the work of Rosenberg (1968) and Fishbein
(1970). They assert that liking an object is a function of the perceptions about the object and the
importance of product attributes to a particular Individual. A multi-attribute object (e.g., a cultural
experience) Is viewed as a bundle of attributes leading to costs and benefits of differential
desirability to individuals or segments of the mari<et. Overall, affect is posited to reflect the net
resolution of an individual's cognitions (beliefs) as to the degree to which given objects possess
certain attributes weighted by the salience (importance) of each attribute to the Individual
(Moutinho, 1987).
For the purpose of this study, attitudes will be defined as, "internal predispositions to respond with
affective or feelings responses towards or against attending cultural experiences In everyday
lifestyle as well as on holiday, created by the Individual's beliefs, values, needs, knowledge,
learning, and experience, and broader socio-cultural attitudes about different types of cultural
experiences".
2.10.2 Motives
2.10.2.1 Defining and Measuring Motives In the previous section, attitudes were distinguished from motives, with the former being the
affective or feelings responses that consumers have toward an object or a general evaluation of an
object (Fishbein and Ajzen, 1975). This section discusses the distinguishing characteristics of
motives.
One of the earliest discussions about the role of motives concerns their relationship with motivation
and behaviour: "when treating motivations as distinct from motives, we acknowledge ... that each
motive can trigger a variety of behaviours as much as each behaviour can be triggered by a variety
of motives (Murray, 1938).
More recent definitions describe motives as, a lasting disposition or state of arousal, an internal
drive or "push factor" that reduce a state of tension or the prevalent drive by triggering or driving
behaviour. A motive is an, "Internal factor that arouses, directs and integrates a person's
behaviour" (Murray, 1964). Decrop (cited in Pizam and Mansfeld, 1999), extends this definition at
each end; a motive is, "a state of tension within the individual that arouses, directs, and maintains
behavior toward a goal" (p. 130). Foxall and Goldsmith (cited in Pizam and Mansfeld, 1999),
64

Chapter 2: Literature Review
expand upon the relationship between motives and behaviour goals, whereby, "each motive has a
different content In terms of goals of behavior. Motives and personal characteristics determine a
person's disposition that leads to behavior" (p. 130).
Decisions to attend cultural attractions and events, for example, are therefore directed actions tiiat
are triggered by various antecedents and determinants. For example, a desire to meet a need
could trigger and direct actions. According to Foxall and Goldsmith (cited in Pizam and Mansfeld,
1999), "a need is the materialization (on the consumer plane) of a motive (on the psychological
plane)" (p. 107). This example highlights that motives and needs are not Interchangeable terms
even though they are often used accordingly. Values, beliefs and attitudes could also underiie
motives as well as external communications and other stimuli (Internal and external). Mazanec
(1994) agrees that motives are, "conceived as a state of arousal", however he argues that they
have no distinct directional effect towards a particular means of satisfaction and If questions contain
an evaluation of some attribute of a real or ideal tourist product, then they are attitude rather than
motive items (Mazanec, 1994).
The previous definitions highlight a strong relationship between motives, arousal and drives, the
latter of which Is also emphasised in the leisure motivation research literature. Arguments for
studying leisure motivation Include, a need to recognise, "the forces that drive it, springing from the
behavior patterns of people who engage In it..." (National Academy of Science 1969, p. 1 cited In
Beard and Ragheb, 1983). If different people responded the same way to stimuli, there would be
no need for bringing in the concept of motivation. However, individuals are driven to engage In
leisure activities for different reasons (Beard and Ragheb, 1983).
In a tourism context, a motive is a, "lasting disposition, an Internal drive or 'push factor' that causes
the tourist to search for signs In objects, situations, and events that contain the promise of reducing
the prevalent drive" (Gnoth, 1997, pp. 290-291). Defined this way, motives could be considered
one of several push factors In push/pull motivational theory which some consider a useful approach
for examining motivations underlying tourist and visitation behaviour (Crompton, 1979; Dann, 1977;
Kim et al., 2003).
2.10.2.2 Tourism Motive Dimensions There is a vast amount of literature on travel and tourism motivation as seen in the eariler Section
2.9 on motivation research. This section on literature of relevance to the motivational process
component of motives, reviews some key studies on tourist motivation or motives especially some
selected studies of cross-cultural interest (Table 2.12) and the growing body of literature on festival
event tourist motivation, motives and characteristics (Table 2.13), to identify trends and issues of
relevance to this proposed study's treatment of a tourist motive construct.
From recent tourism motivation research (Table 2.12), various trends have been identified. Motives
are multl-dilmensional and various tourism motivation structures comprised of several underiying
motive dimensions have been proposed since the first psychological research of tourism In the
65

Chapter 2: Literature Review
eariy sixties. In the late seventies, Crompton's (1979) motivations for pleasure vacation comprised
six main dimensions: novelty, socialisation/kinship, prestige, relaxation, education/knowledge, and
self-development. Fodness' (1994) framework of five main dimensions of tourist motivation,
resembles those of the functional theorists of motivation: social adjustment, value expression,
knowledge, and the utilitarian domains of punishment minimisation and reward maximisation
(Fodness, 1994). Various other dimensions of motives In a tourism context have been found, for
example, adventure (Yuan and McDonald, 1990); escape from routine (Dunn Ross and Iso-Ahola,
1991), Independence (Andersen et al., 2000); sense of separation (Dunn Ross and Iso-Ahola,
1991; Fodness, 1994).
Table 2.12: Summary of selected studies on tourist motivation
Author Major Issue addressed Type of Study/ Tourism Population Product Sampled Analysed
(Andersen et al.. Examines motives to visit Scotland and undertake cultural
2000) tourism, and segments by these motives
Empirical/Japanese General Holiday
tourists
(Cha et al., 1995) Motivations of Japanese travellers who travel abroad,
and segmentation by travel motivation identifying 3 groups
Empirical/ Overseas Pleasure Travel
Japanese tourists
(Crompton, Identified 9 motives: 7 of which were classified as 'social
1979) psychological' and 2 as 'cultural'Cnovelty and education)
Empirical General
Pleasure Travel
(Fodness, 1994) Functional theorist taxonomy approach to leisure travel
motivation dimensions and segmentation by travel motivation
Empirical/Recent Leisure Travel
leisure
travellers
(Hanqin and Lam, 1999)
Importance of push and pull factors in travel motivations for
Chinese outbound visitors
Empirical/
Outbound Chinese
tourists
Hong Kong destination
(Kim & Lee, Directiy measures tourist motivation and two characteristics of Empirical/
2000) cultural identity (individualism & collectivism) to examine tiie Anglo-American
role of tiie latter in the foimer & Japanese tourists
Leisure Travel
(Mcintosh etal., 1994)
(Moutinho 1987)
(Pearce &
Caltablano, 1983)
(Dunn Ross & Iso-
Ahola, 1991)
Identifies four basic travel motivators, realising that engaging in Conceptual
general travel is, in itself, learned behaviour
Identifies five basic classes of motivators for general travel
which are distinguished from specific ti^avel motivators
Inferred ti'avel motivation from ticivelers' achjal experiences
which were coded into a ti-avel career ladder classification
of ticivel motivation based on Maslow's analysis of needs.
Results indicated tiiat positive and negative tourist
Experiences highlighted different need stiuctures
Motives and satisfaction of sightseeing tourists.
Conceptual
Conceptijal
Empirical/
Qualitative
Travel & Tourism
Research Associat
ion members & Uni
students
Empirical/tour
groups;
convention;
General travel
General Travel
General
Holidays
Sightseeing
tour,
Washington,
66

Chapter 2: Literature Review
non-affinity DC, USA
(Yuan & McDonald, Motives'push factors'and'pull factors'for Japanese and other Empirical/ Overseas Travel
1990) t-avellers (French, West German & UK). Japanese, UK,
French, Germans
2.10.2.3 Festival or Event Motivation Literature
Despite the increasing popularity of festivals and events and the importance of understanding
attendees' motives and motivations, little research had been conducted on the motivations of
festival attendance in the eariy 1990s (Getz, 1993). Since then at least 11 empirical studies on
festival or event motivation have been undertaken and are summarised in Table 2.13. Several of
these feature or include cultural events and there is a diverse geographical and cultural ethnic
group spread: five in the United States (Backman et al., 1995; Crompton and McKay, 1997; Mohr
et al., 1993; Scott, 1996; Uysal et al., 1993), one in Jordan to a festival celebrating Arab culture
(Schneider and Backman, 1996), two in Italy of which one was an international arts festival and
the other a jazz festival (1996; 1998), two in South Korea at Worid Cultural Expos (Lee, 2000;
Lee et al., 2004a), the first of which examined motivation differences between Caucasian and
Asian visitors and the second focused on motivation differences between domestic and foreign
visitors, and one in Australia examining motivations to attend short-term visual art exhibitions
(Axelsen and Arcodia, 2004).
In a festival or event context (Table 2.13), many similar dimensions have been delineated (Lee et
al., 2004a). Other dimensions common to festivals or events, have also been Identified: for
example, excitement/thrills (Backman et al., 1995; Scott, 1996; Uysal and JurowskI, 1993),
entertainment (Formica and Uysal, 1996; 1998), and cultural exploration (Crompton and McKay,
1997; Lee, 2000). A more detailed evaluation of the main underiying dimensions of tourist motives
Identified In empirical research of tourism and festival or event motivation to date will be considered
in Chapter 4 Research Method, section 4.5.3.
Compared with tourist motivation studies In general, there is considerable consistency across
these studies In the dimensions of festival and event motivation and the number and type of
items used to measure these dimensions. While further details of the dimensions used and
found in these studies will be discussed in Chapter 4 research methodology, section 4.5.3, six
studies use 23 or 24 items; and two use 32 items. All bar one use factor analysis and identify a
similar number of factor dimensions (between 5-7).
From the emerging body of literature of festival event motivation (Table 2.13), significant differences
have been found between motivation factors:
• At different types of festivals (e.g., Scott, 1996)
67

Chapter 2: Literature Review
By different types of events satisfying the same need to different degrees
(Crompton & McKay, 1997)
By first-time and repeat visitors (Mohr et al., 1993)
By some demographic variables (Backman et al., 1995; Formica and Uysal, 1998)
By characteristics of travel group (Formica and Mun-mann, 1996)
By residents and non-residents (Formica and Uysal, 1996; 1998) with residents
being more motivated by the 'socialisation' factor, and non-residents more driven
by the 'entertainment' factor (Formica and Uysal, 1998)
By cultural group whereby two Asian groups (Koreans and Japanese) were found
to be significantiy different from two Western groups (Americans and Europeans)
based on the mean values of motivation which indicated that Western tourists
were more likely to have strong motivation than Asian tourists at the Worid Culture
Expo, South Korea (Lee, 2000)
By domestic and foreign visitors with differentiation in sources of information used
suggesting differentiation of promotional strategies (Lee et al., 2004a).
Table 2.13: Summary of selected studies on event or festival motivation
Author Major Issue addressed Type of Study/ Population Sampled
Tourism Product Analysed
/\xelsen &
/Vrcodia (2004)
Examines motivations for attending tiie Asia-Pacific Triennial Art Empirical/ Visual Art
Exhibition to uncover factors ttiat motivate audiences to attend visitors to Exhibition,
short-term visual art exhibitions exhibition, Brisbane,
& the gallery Australia
Backman et al.,
(1995)
Dimensions of event motivation, analysing variations of
delineated factors and activities by demographics
Empirical/Pleasure Pleasure Travel
Travel Mari<et,
USA
Crompton & Festival motives based on tiie escape-seeking dichotomy and Empirical/ Fiesta, Texas,
McKay, (1997) push-pull factors. Examines difference in motives by types of Fiesta visitors USA
festival events
Formica & Uysal Dimensions of event motivations by comparing region to out-of- Empirical/ Umbria Jazz
(1996) region visitors in terms of factors, demographics and event Festival visitors Festival, Italy
characteristics
Formica &
Mumnan(1996);
Formica & Uysal
(1998)
Lee, (2000)
Principal event motivations, tiien segmentation using cluster Empirical/
analysis based on motivation and profiled the segments Festival visitors
Major driving motivation factors, and differences between Empirical/
Spoleto Cultural
Festival, Italy
Worid Cultijral
68

Chapter 2: Literature Review
cultural groups Caucasian & Asian Expo, Soutii
visitors Korea
Lee et al., (2004a) Principal event motivations, tiien segmentation using cluster Empirical/ Worid Cultural
analysis based on motivation. Examines importance of motivat- Domestic & Expo, Soutii
ion clusters and visitor types as influencing factors of overall Foreign visitors Korea
satisfaction
Mohr et al.,
(1993)
Scott, (1996)
Schneider &
Backman (1996)
Dimensions of event motivation, examining variations of demo- Empirical/4 visitor Balloon Festival
graphics, delineated factors and satisfaction by visitor types types Sth Carolina,
based on previous attendance USA
Differences among motivations to attend 3 festivals, including Empirical/
Differences between first-time and repeat visitors
Cross-cultural equivalence of motivation scale
Uysal et al., (1993) Dimensions of event motivation
Empirical/
Festival visitors
Empirical/
Festival visitors
Empirical/
Festival visitors
3 Festivals,
Ohio, USA
Jerash Festival
(Arab culture).
Jordon
Com Festival,
SUi Carolina,
USA
The authors of the most recent of these studies (Lee et al., 2004a), acknowledge that a motivation
scale is commonly used by festival studies and further acknovi ledge the consistency in factor
stmctures extracted from their study and eariier event motivation studies. They conclude from the
latter finding that this, "adds credence to the notion that the range and groupings of event motives
are somewhat universal" (p.65). Their initial set of 34 motivation items was generated from a
review of festival research pertaining to visitor motivation and considered to be the most
appropriate for measuring visitors' motivations for attending the Worid Culture Expo. They
performed a cluster analysis on the six factor dimensions to further advance knowledge of core
motives. Four cluster segments were identified based on visitor type (domestic or foreign) and
satisfaction (festival satisfaction is examined for each cluster and each visitor type based on the
motivational Item scale ratings). For future research of festival and event motivation, they
recommend the aggregated foreign visitor group in their study should be disaggregated into
countries for measurement scale validation before generalizations can be made. They also
recommend that future research explore the relationship between festival motivation and attitude
and behavioural Intentions using a structural equation model.
The two studies of Italian cultural event motivation also included cluster analysis as well as
factor analysis on the commonly used 23 motivation Items (Formica and Uysal, 1996; 1998).
They conclude that further studies In festival motivation and segmentation analysis should
Incorporate other components, such as expectations and preferences, because visitors'
motivation represent only one significant component of travel behaviour (Formica & Uysal,
1998).
69

Chapter 2: Literature Review
2.10.2.4 Cross-Cultural Differences in Tourist Motives
The majority of recent research of tourist motivation focuses on Individualism and rationalism,
which results in underestimation of the influence of groups, norms, culture, and emotion or impulse
on tourist behaviour (Kim and Lee, 2000). Some authors suggest cultural differences In motives
between Western individualist cultures and Asian collectivlst cultures such as Japan (Andersen et
al., 2000). This study of Japanese independent travellers to Scotiand, included a utility motive
domain with items relating to the Importance of travel for career advancement purposes. A minority
segment of non-trivial size was found to exist, as well as members of all segments holding such
intentions, although in some instances, not strongly prioritised. Although this was not a cross-
cultural study that compared motives across different cultural groups, it strongly suggests that
cultural differences may exist. One cross-cultural study of cultural differences In tourist motivation
between two cultural groups, Anglo-American and Japanese tourists (Kim and Lee, 2000), found
five dimensions of cultural attitudes that reflect individualism and collectivism within each culture.
Three of these were individualism dimensions: self-reliance, emotional detachment, and separation
from in-groups; and two were collectivism dimensions: family Integrity and social interdependence.
Among these dimensions, Anglo-Americans showed more preference for separation from in-
groups and emotional detachment than Japanese tourists did. The Japanese tourists expressed
more preference for interdependence and family integrity. Some cultural group differences were
also noted in relation to five travel motivations with significant differences found for prestige/status,
family togetherness, and novelty, but insignificant differences for knowledge and escape. Overall
the cultural group differences were not bigger than would be expected, leading the authors to
propose individualist and collectivlst orientations may coexist within Japanese and American
culture, and In particular, the young Japanese appear to be moving towards a more Individualistic
society.
One other cross-cultural study of motivational determinates of International pleasure travel (Yuan
and McDonald, 1990), examined "push" and "pull" factors for tourists from four countries: Japan,
France, West Germany, and the United Kingdom. They found that individuals from each of the four
countries travel for the same push factors; however, pull factors and the levels of importance
attached to them, appeared to differ among the countries.
2.10.2.5 Defining and Measuring Motives Summary
For the purpose of this study, motives will be defined as, "internal predispositions that arouse,
direct and drive a person's desire to attend cultural experiences while on holiday, that are created
by attitudes and other stimuli, and are based on a main desire for reaching the goal, or obtaining
the reward of, hedonic consumption experiences that involve the experiencing of emotion while
engaging In active leisure tourism activities".
2.10.2.6 Uses of Motives in Marketing There are many marketing applications for motives. They have been used for segmentation
purposes (Andersen et al., 2000), which requires tourism promoters to use their resources in ways
70

Chapter 2: Literature Review
with which these segments may Identify. At the minimum, the promotion of destinations or
attractions needs to be differentiated according to the underiying motive domain differences of
different segments (Andersen et al., 2000). They also have implications for consumer satisfaction
as will be discussed in Section 2.10.4 on the motivational process construct of satisfaction.
2.10.2.7 Motives within the Motivational Process The examples of the various antecedents and determinants underiying motives highlight the
relationship between motives and various other constructs such as needs, values, beliefs, attitudes,
and other such stimuli. Motives are only one of multiple variables that explain behaviour, but they
are the starting point that launch the decision process (Crompton and McKay, 1997). In turn,
motives can be considered antecedents to expectations, "motives can be seen as providing
travellers with expectations for activities" (Moscardo et al., 1996). Motives also have a relationship
with satisfaction whereby they occur before the experience, and satisfaction after it (Iso-Ahola,
1999), but motives can infiuence satisfaction with the experience as will be discussed in the later
section 2.10.4 on satisfaction.
This study Is further interested in the Implications of these motive dimensions for other components
of the motivational process for tourists attending cultural experiences, that is, benefits sought, and
related behavioural outcomes, especially benefits gained and satisfaction. The next section of this
literature review considers the motivational process construct of benefits (sought and realised).
2.10.3 Benefits
2.10.3.1 Tourism Benefits Research and Literature There have been many applications of empirical benefit research in tourism over the past twenty
years and Tables 2.14 and 2.15 present details of fifteen key studies. Table 2.14 summaries 10
key studies in the general tourism area, eight focusing on benefits sought and two on benefits
realised or gained. Table 2.15 summarises five empirical studies identified to date of relevance to
cultural tourism, four focusing on benefits sought and one on benefits gained in cultural and
heritage settings.
For the type of tourist product analysed, the majority of studies In Table 2.14 focus on vacation
travel choice or specific destinations Including three nature travel market-related studies one each
in the US, UK and Australian outbound travellers (Frochot, 2005; Lang and O'Leary, 1997; McCool
and Reilly, 1993). Of the five cultural-related studies (Table 2.15): one study (Alzua et al., 1998)
focuses on culture and heritage travel, and the other four are heritage and museum attraction-site
related (Frochot, 2004; Prentice et al., 1998; Tian et al., 1996; Weaver et al., 2002).
Different markets are represented in the populations sampled with several studies In Table 2.14
sampling the United States or North American market (McCool and Reilly, 1993; Shoemaker,
1994), the Australian travellers (Moscardo et al., 1996), the nature travel market (Lang and O'Leary,
1997), and the Japanese leisure market (Heung et al., 2001; Hsieh et al., 1997; Jang et al., 2002).
71

Chapter 2: Literature Review
Only one study is cross-cultural (Woodside and Jacobs, 1985) examining North American and
Japanese markets.
TaWe 2.14: Summary of selected empirical studies on benefits in travel, tourism, leisure and recreation literature (non-cultural related)
Author Major issue addressed Type of Study/ Tourism Population Product Sampled Analysed
Benefits Expected/Sought/Pursued
Heung et al.. Examined the relative importance of vacation motives. Derived Japanese leisure
(2001) 5 vacation factors including 'benefits sought. Travellers Hong Kong des
tination
Hsieh et a/., (1997) Examines fravel decision pattem of Japanese pleasure fravel Japanese leisure
Mari<et using a multi-stage segmentation based on Travellers
'benefits sought, travel philosophy and travel product preferences
Vacation Choice
Jang et al., (2002) Benefit-sought segmentation of Japanese outbound fravel mari<et Japanese pleasure USA destination
and selection of optimum target mari<et based on profitability b'avellers
and risk
Lang & O'Leary, Multi-segmentation of nature fravellers based on tiieir motivation, Ausfralian fravel Outtraund
(1997) (benefits pursued), activity participation, destination attribute mari<et vacations
preferences and travel philosophy
Loker & Perdue, Vacation benefits sought segmentation on and identification Non-resident Travel in North
(1992) of optimum target mari<et tourist mari<et Carolina, USA
McCool & Reilly, Benefit segmentation using expected benefits from a pari< visit State Part< 3 state pari<s,
(1993) and relationship with Msitor preferences for setting attributes Visitors USA
and expenditure patterns
Moscardo ef a/.. Benefit sought segmentation (motivation) and relationships with Ausfralian Outbound
(1996) activity preference and vacation destination choice ti^vellers vacations
Frochot (2005) Benefit segmentation and relationship witii activity preferences Ovemight visitors 2 rural areas,
Benefits Gained/Realised
Shoemaker, Examines past fravel experience destination attributes to infer
(1994) benefits realised and tiien uses tiiese for benefit segmentation
and comparisons with ideal destination planning concems
at local accommodation
us Population
Scotiand
Domestic
Vacations
Woodside & Multi-dimensional segmentation based on benefits and
Jacobs, (1985) experiences realised from fravelling to the same
vacation destination differ for 3 different national samples
Canadians, Hawaii
mainland Americans,
Japanese
The five cultural tourism-related studies (Table 2.15) comprise two studies sampling the US market
(Tian et al., 1996; Weaver et al., 2002) and three in the UK: one outbound (Alzua et al., 1998) and
two domestic (Frochot, 2004; Prentice et al., 1998).
72

Chapter 2: Literature Review
Table 2.15: Summary of selected empirical studies on benefits in travel, tourism, leisure and recreation literature (cultural related)
Author Major Issue addressed Type of Study/ Population Sampled
Tourism Product Analysed
Benefits Expected/Sought/Pursued
Pizua et al.. Multi-dimensional segmentation using benefits sought and
(1998) activities to understand vacation motives
Frochot (2004) Benefit segmentation (motivation) and influence on quality
evaluation
Tian et al., Examines benefits museum goers seek from tiieir visit
(1996) segmentation based on tiiese benefits and consfraints
and relationship of segments witii selected independent
variables, and identification of potential target martlets
Weaver ef al.. Examines underiying mart<et segments Uiat exist based on
(2002) benefits sought visiting heritage sites
UK outix)und
Historic Property
visitors
Museum
visitors
Culture and
heritage
Historic
houses.UK
Museums,
Texas, USA
US Travellers
Benefits Gained/Realised
Prentice et al.. Multi-dimensional segmentation using experiences and benefits Pari< visitors
(1998) gained by visitors and relationship of segments witii motivational
and socio-demographic attibutes
Heritage sites,
USA
Heritage Site,
UK
In terms of major research objectives, neariy all studies (13 of the 15) use benefits for market
segmentation purposes or as one dimension of multi-dimensional segmentation emphasising a
dominant application of benefit research for market segmentation purposes, as will be discussed
further in the section 2.10.3.3 on defining and categorising benefits. Many of these studies,
however, also claim an association between benefits, motivation, and motives as will be reported in
the next section.
2.10.3.2 Benefits and the Motivational Process
Earlier in tiie review of consumer and tourist motivation literature, an association between benefits
sought or benefits gained and motivation was Identified with benefits being considered one of four
major approaches to tourist motivation research (Section 2.9.4.3). This was due to a widely held
belief of some association between tourist's motivations and benefits (sought or gained) although
the exact link Is still to be tested and proven (Frochot and Morrison, 2000), and travellers'
motivations, in turn, have always been portrayed as a critical variable in the tourist decision-making
process (e.g., Crompton, 1979; Lundberg, 1971).
From the tourist benefit research perspective summarised in Tables 2.14 and 2.15, six of the
studies Include motivation or motives In their major research objectives (Alzua et al., 1998; Frochot,
2004; Heung et al., 2001; Lang and O'Leary, 1997; Moscardo et al., 1996; Prentice et al., 1998).
Most of these, however, use benefits sought or gained as a method for operationalising the
measurement of motivations or motives. Frochot (2004) states, "in order to evaluate the
motivational profile of visitors, benefit segmentation was applied" (p.227). Alzua et al., (1998)
73

Chapter 2: Literature Review
further claim, "from an international perspective, relatively little Is known of cultural and heritage
tourists' characteristics, benefits pursued In travel activities or expectations" (p.3) and then define
benefits sought as an attitude "which may Influence travellers" In their choice of activity participation
and frequency (p.6). Different benefit segments attached different degrees of Importance to
different behavioural activity participation, and the authors claim this supports Silberberg's (1995)
assertion that there are different degrees of consumer motivation for cultural tourism. Similariy,
Moscardo et al's., (1996) understanding of vacation destination choice through travel motivation
and activity preference is achieved by segmenting respondents on travel benefits and describing
the resulting dimensions as motives and needs. Lang and O'Leary (1997) utilise the
interrelationships between benefit pursued, activity participation and destination preference as a
segmentation base which they claim proves their proposed motivation/participation/preference
tourist visit type is a theoretically and statistically feasible approach to understand and classify
travellers (p.174).
One of the studies (Heung et al., 2001) examines the importance of vacation motives for Japanese
leisure travellers to Hong Kong and categorises one of the five derived vacation factors as 'benefits
sought'.
Another study uniquely examines heritage site visitors' experiences and benefits gained at a single
UK heritage site and claims that the core product of tourism Is the beneficial experiences gained
(Prentice et al., 1998). This study further identifies motivations for visiting as a separate construct
and examines the influences of these motivations and other selected soclo-demographic attributes
on the constructs of experiences and benefits gained which are used as the basis to cluster visitors
in terms of the similarities of their experiences and benefits. Five distinct clusters are found and the
authors conclude that the combination of experiences and benefits gained has been shown to be
provide a good basis for effective market segmentation. Although the study found limited use of
most soclo-demographic characteristics In understanding experiences, several motivational
characteristics were found to be significant In terms of the five clusters.
The more recent of these studies (Frochot, 2004; 2005) categorise benefit segmentation as being
based on psychographic criteria, and a particularly powerful technique for understanding consumer
markets in tourism settings, although Its performance comparative to other psychographic
techniques (such as values) is yet to be demonstrated. As seen In this literature review and fijrther
discussed in section 2.10.3.8, benefits are frequentiy used as the grouping variable or one of
several variables in multi-dimensional market segmentation. Some consider them a superior
alternative to more common socio-demographic or activity segmentations (GItelson and Kerstetter,
1990; Prentice et al., 1998). Another advantage of benefits gained, in particular. Is that they focus
on the ultimate product of tourism - the outputs or outcomes actually gained by the experience of
undertaking activities in settings to gain experiences that are regarded as beneficial (these benefits
may Include negative as well as positive ones). In leisure and outdoor recreation research this
hierarchical process linking activities, settings, experience and benefits in a sequence is refen-ed to
74

Chapter 2: Literature Review
as the 'benefit chain of causality approach (Driver et al., 1987). (For further discussion of the
benefit chain of causality see section 2.10.3.3 on defining and categorising benefits).
That benefits sought are integral to the motivational process and underiie behaviour, has been
noted In the event tourism literature. Event motivational studies must address not merely the
reasons given for being at an event, but also the underiying benefits sought with 'behaviour' In this
context referring to more than superficial activities at events, by also referring to the meanings
attached to those actions (Getz and Cheyne In Ryan, 2002).
It is widely acknowledged throughout the tourism, leisure and recreation literature that such benefits
may vary by activities undertaken (e.g.. Haggard and Williams, 1991). Hence there is much
diversity in dimension Items used in research of benefits gained with variation according to the
activities, the setting, and the broad type of experience undertaken which may be leisure,
recreation or tourism purposes. Furthermore, benefits sought and gained are multi-dimensional
themselves and some studies In the leisure area have focused on "mood benefits" as feelings
(1990; 1991; Hull and Harvey, 1989); others on learning benefits (Roggenbuck et al., 1991).
Because benefits gained in particular may vary by activities undertaken as noted in the previous
paragraph, the context in which this study proposes examining benefits sought and gained Is In
relation to one specific cultural attraction setting and experience that is popular with international
and interstate tourists, that Is, the Queen Victoria Market in Melbourne, Australia. No tourism
studies to date have focused on both of these benefit dimensions. Therefore a set of measurement
Items will be developed for this proposed study from an overview of the relevant literature and
some exploratory primary research (see Chapter 4 Research Method, section 4.5.4).
That there is a relationship between benefits and motivation has been raised throughout the
tourism motivation and benefit research literature, but often with some confusion. Depending on
how benefits are defined and categorised they could be considered separate constructs to motives
but relevant to the motivational process. Discussion of tourist benefit definitions follows in the next
section (2.10.3.3). Benefits sought may best be defined as largely psychologically-based
expectations and benefits gained as a largely psychologically-based behavioural outcome. So
defined, they are separate consti ucts to attitudes, motives, and satisfaction, but more research Is
needed to measure and test these constructs and their underiying dimensions.
2.10.3.3 Defining Benefits
From a marketing perspective, an eariy rationale for benefit segmentation (Haley, 1968) was, "the
benefits which people are seeking in consuming a given product are the basic reasons for the
existence of true market segments" (p.198). In his pioneering work, Haley (1968) never proposed a
precise definition of benefits which has led to some mixed interpretations since the late 1960s with
the application of his benefit segmentation technique to various products. Initially the benefits
identified were mainly utilitarian (e.g, Haley, 1968) such as attribute-based benefits or in a tourism
75

Chapter 2: Literature Review
context, specific features of the destination or service. Since the 1980s, others associate benefits
with, "sensory, rational and emotional benefits" which are referred to as psychologically-based
benefits (Lewis, 1981). In several consumer product studies, hedonic attitudes have been
contrasted with utilitarian attitudes (Spangenberg et al., 1997; Voss et al., 2003). In significant work
on hedonic benefits (Hirschman and Holbrook, 1982; Holbrook and Hirschman, 1982), hedonic
benefits are considered more relevant to cultural and experiential products than utilitarian benefits.
By the 1990s, a conceptual shift within the operatlonalisation of benefits has been noted, away from
activities and amenities and toward experiential and psychological outcomes (Tian et al., 1996).
A precise definition of what Is being measured in tourism benefit research Is an ongoing problem
with many studies not specifically defining benefits. While there has been considerable use of
benefit research, largely for market segmentation purposes, in the context of tourism and allied
areas of recreation, leisure and travel, there Is no consensus among researchers on definitions of
benefits, a typology of benefit categories, nor is there an Identified set of commonly used
dimensions or benefit statements. Furthermore It could be said that there is some confusion and
mix of interpretations In the tourism benefit literature between benefits and other consumer
motivation and behaviour constructs such as attitudes, motives, expectations, and satisfaction.
Although some studies theoretically distinguish between some of these constructs and refer to
relationships between them, few studies have conceptualised or tested these relationships.
Definitions of benefits are prevalent In the leisure literature (e.g.. Driver et al., 1991a; Jackson and
Burton, 1999) where benefits usually refer to "gain" (Driver et al., 1991b) which in turn refers to, "a
change that is viewed to be advantageous - an Improvement In condition, or a gain to an individual,
a group, to society, or to another entity" (p. 4). Ajzen (In Driver et al., 1991a, p.412), adds, that such
a gain can be defined only in relation to a goal, a standard, or a criterion, whether set by the
individual or some larger unit. Once the goal has been cleariy specified, the benefit of an activity
can be operationalized by assessing the extent to which the goal has been attained, as well as the
value of the goal to the social unit. He further acknov\/ledges that any given leisure activity can, and
often does, have more than one beneficial outcome, each of which should be assessed with
reference to a clearly defined goal.
Despite the lack of consensus in the tourism benefit literature and even considerable confusion and
mix of interpretations, there has been extensive use of tourist benefit research for more than 20
years and so there Is a large body of relevant literature from tourism benefit research as well as
from allied areas such as marketing and leisure which allows major uses, and associated issues,
and any trends, standards or consensus to be identified.
In reviewing the extensive literature on tourist benefit research, this author proposes three
conceptual issues for consideration prior to undertaking benefits research: (I) what to research, (ii)
when to research, and (Hi) how the research should be undertaken (Kay, 2006a). Each of these
areas is elaborated in the next three sections.
76

Chapter 2: Literature Review
2.10.3.4 What to Research Issues: Benefits Research Approaches, Typologies and Frameworks
Typologies of benefit categories are also of relevance to the issue of what benefits to research and
defining benefits for the purpose of one's research. Several typologies of relevance to tourism
benefits been identified from the literature. Frochot and Morrison (2000) note the lack of consensus
among researchers on benefits in their review of benefit segmentation and its applications to travel
and tourism research. They propose that three possibilities exist: attribute-based (with the nature of
benefits often reflecting the attributes or features of the destination or service), psychologically-
based (with these benefits often associated with travellers' motivations or emotional expectations),
or a combination of both. They further note a tendency for psychologically-based benefits to be
used in travel and tourism research studies and other authors have also noted a conceptual shift
within the operatlonalisation of benefits away from activities and amenities and toward experiential
and psychological outcomes, especially since the 1990s (Tian et al., 1996). This research of
cultural experience tourist benefits within the motivational process proposes focusing on both
psychologically-based and attribute-based benefits to test the relevance of Frochot and Morrison's
(2000) benefit typology in a cultural experience tourist context. To avoid the limitation of an overiy
site specific study, the proposed attribute-based dimensions will be generic to all types of cultural
experiences.
Another relevant typology for experiential benefits derives from the allied area of leisure research
and identifies five major general categories from an overview of specific types and general
categories of benefits that have been attributed to leisure by research: psychological, psycho
physiological, economic, sociological (social and cultural), and environmental (Driver and Bruns,
1999). The first two categories are personal benefit-related with psychological benefits including
the further sub-categories of better mental health and health maintenance, personal development
and growth, and personal appreciation and satisfaction; and psycho-physiological benefits deriving
from participation In activities. Economic benefit has been defined as, "the monetary worth of the
improvements as measured by the prices that people are willing to pay for goods, services, and
conditions that comprise the improvements" (Driver et al., 1991a, p.6). This typology of leisure
benefits is considered relevant and useful to tourism benefit research as leisure is a closely allied
area to tourism especially when the latter Is undertaken for pleasure. A major strength of this
typology Is that It acknowledges a range of benefits that can accrue frohi leisure activities some of
which are directly personal benefits and largely psychologically-related but might also involve
physiological benefit, while others Involve a larger external entity such as the external physical or
economic environment or another social entity such as a group or society.
Driver and Bruns (1999) identify three types of benefits of leisure to operationallse their benefits
approach to leisure: 1) an improved condition (e.g., a gain) of an individual, a group of Individuals or
another entity such as the physical environment, 2) the prevention of a worse condition through
maintenance of a desired condition (e.g., prevention of adverse impacts of tourism, including harm
to the physical environment), and 3) the realisation of a specific satisfying psychological
77

Chapter 2: Literature Review
experience, which accme only to individuals and are also called satisfying psychological outcomes.
A further theory of relevance to this typology is the two basic measures of the consequences of
leisure: measures of beneficial changes in behaviour and Introspective measures (direct and
Indirect) (Driver et al., 1991b). Measures based on behavioural (performance) change Include
Improvements In people, while the direct Introspective measures focus on benefits as Improved
conditions, and the indirect introspective measures focus on a constmct from which inferences can
be made about probably beneficial consequences.
2.10.3.5 When to Research Issues of Benefits Research
One further categorisation of benefits found in tourism benefit research is based on the timing of the
collection of benefit statements with some based on benefits sought or pursued (I.e., prior to the
consumption experience) and others on benefits gained or realised (i.e., after the consumption
experience or based on past experiences). This timing difference results in two separate
constructs of benefits that will be defined for the purpose of this study in a later section following
consideration of the relevant issues from the literature. In summary, however, benefits sought are
particularly relevant to visitor's motives and expectations within the motivational process to attend
experiences, while benefits gained or realised are of particular relevance to visitor's behavioural
outcomes from experience consumption, especially satisfaction. Of the 15 key studies reviewed in
Tables 2.14 and 2.15, the majority measure benefits sought including four of the five cultural
tourism-related benefit studies and only three measure benefits gained or realised. No studies
measure both.
That benefits can also be based on different times of the consumer experience has been
acknowledged. Driver, Tinsley and Manfredo (Driver et al., 1991c) acknowledge the chain of
benefit causality with psychological benefits defined as intervening variables In the chain of benefit
causality that go from antecedent condition through motivation and participation to the realization of
end-state benefits. They warn against looking only at end-state benefits as, "much will be left out,
and our understanding will be severely impaired" (p.284). Benefits sought could be categorised as
psychological benefits occurring eariy in the chain of benefit causality prior to participation, while
benefits gained are occurring after participation and are the realisation of end-state-benefits.
One definition of expectations in the tourism motivation and expectation literature Is based on their
characteristics which are identified as: a temporally, fonA/ard-directed, Intentional charged; dynamic,
contain emotions, cognitions and Intentions and refer specifically to outcomes or future events; and
contain an emotional charge expressing the Intensity of the drive with which behaviour, in reaction
to the drive, is executed (1997; 1999). Based on these characteristics, Gnoth (1999) defines
expectations as, "forward-directed, tentative attitudes containing a more or less definite element of
knowledge about an object" (p.255).
Expectations are heavily referred to In customer satisfaction and service quality research. Four
types of expectations are frequentiy cited: forecast, normative, ideal and minimum tolerable (Oliver,
78

Chapter 2: Literature Review
1997). Forecast or expected or predictive expectations refer to a prediction of what the consumer
believes will occur in the next service encounter (Boulding et al., 1993; Oliver, 1997). Normative
refer to what the consumer would expect, which in turn, is related to what is feasible and realistic for
the service firm to deliver (Oliver, 1997; Teas, 1993; 1994). Ideal, wished for, deserved or desired
expectations refer to a standard that represents the highest level of performance attainable by a
premier service provider in the category which consumer should expect (Oliver, 1997; Boulding et
al. 1993; Teas 1993, 1994). Minimum tolerable or adequate expectations refer to the minimum
baseline performance by a provider In the category (Oliver, 1997; Parasuraman et al., 1991).
2.10.3.6 How to Research Issues: Benefits Research Methodologies
Methodological issues abound in tourist benefit research and benefit segmentation research
generally. A recent review of research in hospitality and tourism journals noted the predominance
of market segmentation research and within this research found the predominant approach was the
combinational use of factor analysis for data reduction, cluster analysis for classification, analysis of
variance and discriminant analysis for cross-method validations of the classification results,
descriptive profiling of each cluster (Oh et al., 2004). While a dominance in approach to tourism
benefit segmentation has been noted, numerous other differences have been noted by Frochot and
Morrison (2000). These include some researchers using either factor or cluster analysis on their
own, with no consensus on one best method; different factor and cluster analysis techniques have
been used and, associated with this, there Is difficulty determining the best techniques for factor
and cluster analysis, and the optimum cluster solution. Other Issues with methodological
approaches and techniques for measuring benefits for segmentation and other purposes have
been noted for marketing generally (Hoek et al., 1993) and in tourism contexts (Dolnicar, 2002b,
2002c; Frochot and Morrison, 2000).
In the existing tourist benefits research there is little consensus regarding the scales used to
measure tourist benefits, with only one study of heritage site visitors in the US (Weaver et al., 2002)
using an existing scale of Recreation Preference Scale (Driver et al., 1991a). Five most common
benefit statements in tourism benefit segmentation studies have been identified as: 1. to get away
from everyday life/routine, 2. to be with friends, 3. to do something with the family, 4. to relax, and 5.
to develop my knowledge and.abllitles (Frochot and Morrison, 2000).
There is more consensus regarding the data analysis method used which is predominantly a two-
step process of factor analysis followed by cluster analysis. This methodological approach was
used by seven of the ten non-cultural-related benefit studies In Table 2.14 and two of the five
cultural-related studies in Table 2.15. Only four of the 15 studies did not include factor analysis.
However a variety of factor and cluster techniques are used with the resulting solutions ranging
from 4-19 factors and 2-6 cluster. When scale types are reported, Likert scales of importance or
agreement are commonly used, in six and three studies, respectively. As previously reported, the
majority of the studies measure benefits sought than benefits gained and no studies examine both.
79
Chapter 2: Literature Review
Four studies use multi-dimensional segmentation (Alzua et al., 1998; Hsieh et al., 1997; Lang and
O'Leary, 1997; Woodside and Jacobs, 1985) whereby segmentation Is based on benefits and other
variables namely, travel philosophy (2 studies), activity participation (2 studies), travel product
preferences, destination attributes, and experiences realised. Several of the studies further use
analysis of variance and discriminant analysis for cross-method validations of the classification
results, and to test relationships between or influences of benefit segments and other variables,
namely, activities or activity preferences (2 studies), setting attribute preferences. Ideal destination
planning concerns, consti-aints, quality evaluation, and expenditure patterns. This demonstrates
wide variation in the other variables studied in addition to benefits.
2.10.3.7 Defining and Researching Benefits Summary
For the purposes of this study. Benefits Sought are defined as, "a normative expectation, that is a
fonward-dlrected, Intentional charged, tentative attitude toward a particular consumption goal that
contains some knowledge about the cultural experience and the psycho-socio-physiologlcal benefit
to be gained by having the experience and Is driven by motives for attending the experience".
In contrast. Benefits Gained are defined for the purposes of this study as, "an Improved psycho-
socio-physlological outcome resulting from the cultural consumption experience, the perfomnance
of tangible and intangible attributes experienced, and the consequences of visitor's behaviours
during the consumption experience."
Normative expectations are being used In this study as one aim is to measure the quality of the
visitors' experience (e.g., benefits gained and satisfaction) rather than their perceptions of the
supplier's quality of performance (i.e., product quality),. This distinction between satisfaction and
product quality Is further discussed in section 2.10.4 of the satisfaction construct considerations.
The type of expectation being measured has implications for the wording of the survey questions
relating to the benefits sought and the benefits gained constructs which will be further discussed in
Chapter 4 Research Method, section 4.5.4 on measuring benefits.
So defined, this study Is firstiy treating benefits as separate constructs to motives that are relevant
to the motivational process and further treating benefits sought and benefits gained as two separate
constructs based on the timing of when the benefits are measured. Benefits sought are largely
psychologically-based expectations and benefits gained are largely psychologically-based
behavioural outcomes, and both of these constructs are soundly accommodated within Mannell's
motivational process model (1999) that was reviewed eariler in this chapter (section 2.9.6.2),
2.10.3.8 Uses of Benefits in Marketing
The most common marketing application of both benefits sought and benefits gained is for market
segmentation purposes. It was one of the earliest uses of benefit variables in the late 1960s and
this dominant use continues today. Benefit segmentation Is considered a superior approach to
market segmentation. An eariy rationale for benefit segmentation (Haley, 1968) was, "the benefits
80

Chapter 2: Literature Review
which people are seeking in consuming a given product are the basic reasons for the existence of
tme market segments" (p.198). A strength of benefit segmentation Identified from its application to
various consumer products and brands since 1961 is that It relied on causal factors than descriptive
factors and therefore was a good predictor of future consumer behaviour (Haley 1961 cited In
Haley, 1971).
Proposed uses of benefit variables in this study's research of tourist's cultural experiences follow on
from the \m6e\y accepted acknowledgment that benefits are relevant to understanding and
predicting buying behaviour and have Implications for mari<eting (e.g., Frochot and Morrison, 2000;
Kotler et al., 2006) which In turn follow on from Haley's first work on benefit segmentation and
consumer product attributes in 1968. One of the earliest tourist benefit segmentation studies
reviewed In this study (Woodside and Jacobs, 1985) used benefits realised segmentation to
differentiate groups of visitors of various nationalities In Hawaii and Implied that the advertising
strategy for each nationality should be differentiated and suggested that the results should also be
useful in Improving destination tourism facilities. Kotier et al., (2006) also emphasise two marketing
implications of benefit segmentation and knowing the benefits sought by customers: "First,
managers can develop products with features that provide the benefits their customers are seeking.
Second, managers communicate more effectively with their customers If they know what benefits
they seek' (p. 274). Cross-tabulating benefits sought segments with various behavioural
Information has the further advantage of providing a complete profile of the segments for tourist
vacation styles in this instance (Dolnicar and Leish, 2003).
While benefit segmentation has been applied to many other markets and studies particulariy from
the 1980s onwards, its greatest attention and application has been in the fields of travel, tourism,
leisure and recreation. Suggested reasons for this interest In benefit segmentation by these
sectors include a widely held belief of some association between tourists' motivations and benefits
sought, although the exact link is still to be tested and proven (Frochot and Morrison, 2000), and
travellers' motivations, in turn, have always been portrayed as a critical variable In the tourist
decision-making process (e.g., Crompton, 1979; Lundberg, 1971). A recent review of research in
hospitality and tourism journals (Oh et al., 2004) noted that market segmentation research
continues to take more space than any other single research topic In hospitality and tourism
journals, however, limitations of tourism segmentation research are also noted in this review and by
several others (Dolnicar, 2002b; 2002c; Frochot and Morrison, 2000).
Benefits-based tourism segmentation in particular, has been noted for its advantages as stated
above as well as some issues and limitations (Frochot, 2005; Frochot and Morrison, 2000). Most of
the Issues and limitations relate to how benefit dimensions are measured and analysed. What
benefit dimensions will be measured In this study will be based on a review of the existing empirical
research to consider the extent to which standards or consensus may exist in approaches to using
and measuring tourist benefit dimensions and particulariy to identify a set of commonly found
benefit dimensions (see Chapter 4 Research Method, section 4.5.4).
81
Chapter 2: Literature Review
Conceptually, both benefits sought and gained are key dimensions of relevance to anotiier
consumer behavioural outcome, that is, satisfaction which is also of relevance to consumer's future
motivation and participation. A new use of both benefits sought and benefits gained measures is
proposed In this study as a research method of benefit. Benefits will be used as a measure of
satisfaction for experiential products such as cultural experiences, using any difference between
benefits sought and benefits gained as a variation on the expectancy disconfinnatlon theory (Oliver,
1980a), thereby identifying any gaps which reduce satisfaction for all service encounters as
conceptually identified in the gap analysis model (Parasuraman et al., 1985). Benefits sought from
the cultural experience will be used as a measure of consumer's expectations about the cultural
experience, and benefits gained as an experience evaluation because they have been formed on
prior experiences. Consumer expectations and performance evaluations are particularly relevant to
consumer satisfaction as will be discussed further in section 2.10.4.
2.10.4 Satisfaction
Satisfaction as a behavioural outcome of relevance to the motivational process was introduced In
Section 2.9.6.2 based on Mannell's (1999) conceptualisation of motivation as a process.
Conceptualisations and measurement of satisfaction can range from a single item direct measure
to multi-faceted, complex processes comprising several Interrelated components. When the
product is a complex experiential service as it is for many tourism experiences, but particulariy for
cultural experience tourism which Is the focus of this study, conceptualising and measuring tourist
satisfaction raises various issues and problems that will be considered In this section.
Definitions, conceptualisation and measurement approaches for consumer and tourist satisfaction
abound because satisfaction research in these contexts has been extensive over the past twenty
years. In the first section of this review, different definitions and conceptualisations of satisfaction
will be considered especially the confusion and relationships between the constructs of satisfaction
and service quality. That some authors consider satisfaction an outcome (e.g., Oliver, 1981 cited in
Yi, 1990) and a complex process (e.g., Churchill and Suprenant 1982; Yau, 1994) will also be
considered. Measurement approaches tend to be either direct or inferred, and an inferred method
Is applied in this study. Satisfaction is viewed as an unobserved construct that is dynamic, complex
and multi-faceted. Numerous theories about the relationships between satisfaction and other
constmcts of particular Interest to this study especially motivation will then be considered in the next
section (2.10.4.1) including the literature on tourism research to date which combines motivation
and satisfaction. In the satisfaction construct section (2.10.4.3), the marketing applications of
satisfaction will be considered including gaps In the data such as the emerging need for cross-
cultural or cross-national research of satisfaction to which this study aims to make a contribution. A
new use for benefits in operationalising the measurement of satisfaction proposed In this study in
the previous section, will be outiined further In this section.
82

Chapter 2: Literature Review
2.10.4.1 Satisfaction and Service Quality Debates and Definitions
The conceptualisation, definition and measurement of satisfaction and service quality in a services
context such as tourism consumption is the object of an unresolved debate. Some of the ongoing
questions and dilemmas raised recentiy (Frochot, 2004) are the diverging definitions and
interchangeable use of the terms 'satisfaction' and 'service quality, whether satisfaction in tourism
consumption should be evaluated upon the achievement of psychological/emotional needs or on its
utilitarian/quality components, what constitutes the prime sources of satisfaction, and how these
concepts should be best measured with two main options being direct measures or infen-ed
approaches such as the expectancy disconfirmation paradigm. Adding to the confusion, the fonns
of the expectancy disconfirmation paradigm have been equally used in various research projects to
measure satisfaction when defined as an attitude of an emotional nature, and quality, when
measured on tangible criteria (2004). Even if using the Inferred or discrepancy approaches to
evaluate and measure consumer or tourist satisfaction, further Issues arise (1994). These Include
the ambiguity of the terms 'consumer satisfaction' and 'consumer dissatisfaction' and whether
consumer satisfaction and dissatisfaction are on the same continuum, what components or
variables should be included in a structural model of consumer satisfaction/dissatisfaction and
whether disconfirmation should be a separate construct that has independent additive effects on
satisfaction as claimed by Oliver (1979), how to best measure each of these components in the
model, what constitutes the independent and dependant variables, and what Interrelationships or
causality exist between components in the model. Other authors have compared alternative direct
and discrepancy approaches for measuring quality of performance at a festival and considered
their predictive or diagnostic potential as well as the relationship between perceptions of supplier's
quality of performance and satisfaction (Childress and Crompton, 1997).
While there are many different theories and models for consumer satisfaction, it is most often
associated with the work of Hunt (1977; 1991) and Oliver (1976; 1979; 1980a; 1994; 1997), and
with the notion of the expectancy disconfirmation paradigm which stipulates that the level of
consumers' satisfaction will depend on a product matching (or not) prior expectations. This
approach is an accepted method for measuring satisfaction dating back to the recreation
satisfaction literature where satisfaction Is defined as, "a function of the degree of congruency
between aspirations and the perceived reality of experiences" (Bultena and Klessig, 1969, p. 349).
Similariy defined, customer satisfaction is, "the consumer's response to the evaluation of the
perceived discrepancy between prior experiences (or some other norm of perfonnance) and the
actual performance of the product as perceived after its consumption" (Tse and Wilton, 1988, p.
204). Yau (1994) categorises the discrepancy disconfirmation paradigm as one of several
psychological Interpretations of the satisfaction process that Is gaining acceptance and has been
applied extensively by consumer psychologists and marketing researchers to explain product
evaluation, and to assess satisfaction in the consumer decision-making context. Oliver (1980b;
1981) suggests that a consumer's expectation serves as a standard against which the perfonnance
83

Chapter 2: Literature Review
of the product is judged. Disconfirmation serves as a principal force causing 'positive or negative
deviation' from the level, the net effect of which is satisfaction/dissatisfaction.
The complexity of consumer satisfaction and its detemnlnants, conceptualised as a process
Incorporating the discrepancy disconfirmation paradigm and comprising numerous components
and influencing factors can be seen In Figure 2.3.
Figure 2.3: Linkages tested in prior research for a structural model of the consumer satisfaction/dissatisfaction process
Source: Based on Churchill & Suorenant nQ82): Yau (19941
Abbreviations in the Model:
VI: Cultural Values
CI: Consumption Usage Situations
C2: Consumption Experiences
C3: Affective Experiences
N1
N2
N3
N4
N5
Product Expectations
Perceived Perfoimance
Disconfimiation
Consumer Satisfaction/dissatisfaction
Behavioural Intentions
Arrows in tiie Model:
• Previously explored relationships with empirical and/or theoretical support (see NB)
Previously explored relationships with strong empirical and/or theoretical support (see NB)
NB: Even though the relationships between these variables have been shown to be limited or strong empirically, the causality between some of the variables (especially the relationships between N1 and N3) is still in question because of conflicting findings between various research.
^,„~,.^^„.^...,,^ Constructs and relationships of particular interest to this proposed study of cultural experience ^^~i..k__i:I-5 tourist motivation
84
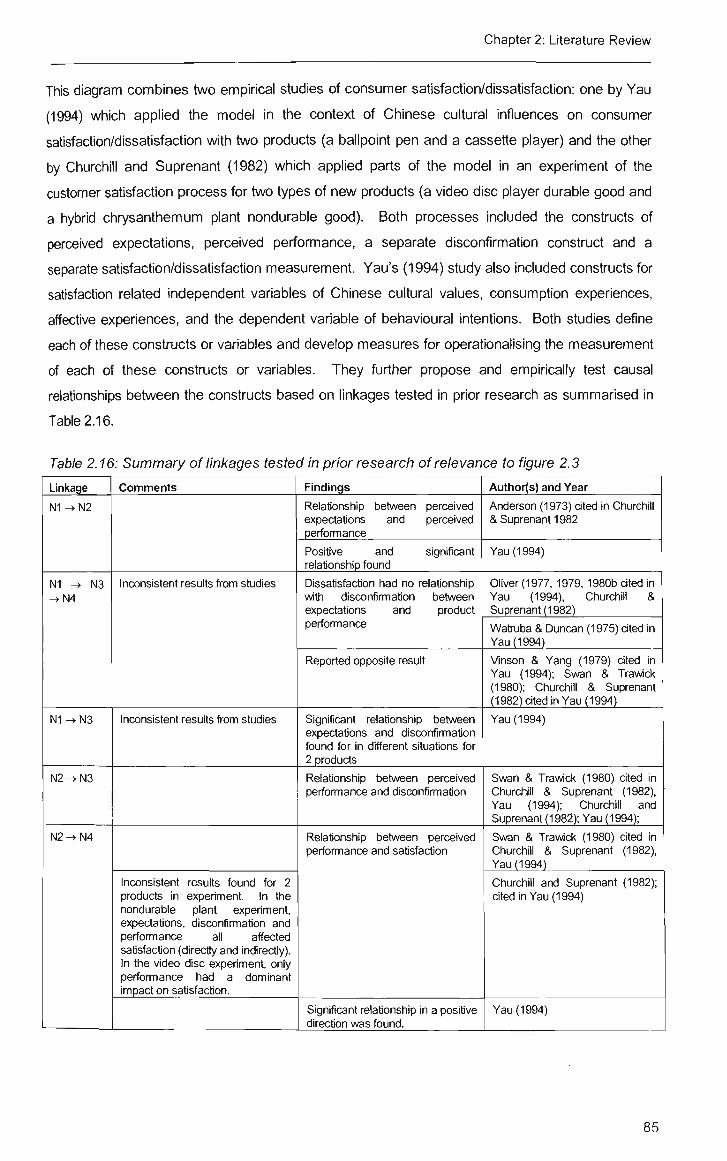
Chapter 2: Literature Review
This diagram combines two empirical studies of consumer satisfaction/dissatisfaction: one by Yau
(1994) which applied the model In the context of Chinese cultural influences on consumer
satisfaction/dissatisfaction with two products (a ballpoint pen and a cassette player) and the other
by Churchill and Suprenant (1982) which applied parts of the model in an experiment of the
customer satisfaction process for two types of new products (a video disc player durable good and
a hybrid chrysanthemum plant nondurable good). Both processes Included the consti-ucts of
perceived expectations, perceived perfonnance, a separate disconfirmation construct and a
separate satisfaction/dissatisfaction measurement. Yau's (1994) study also included constructs for
satisfaction related independent variables of Chinese cultural values, consumption experiences,
affective experiences, and the dependent variable of behavioural intentions. Both studies define
each of these constructs or variables and develop measures for operationalising the measurement
of each of these constructs or variables. They further propose and empirically test causal
relationships between the constructs based on linkages tested In prior research as summarised in
Table 2.16.
Table 2.16: Summary of linkages tested in prior research of relevance to figure 2.3
Linkage
N1->N2
N1 -> N3 ^ N 4
N1-+N3
N2-»N3
N2->N4
Comments
Inconsistent results from studies
inconsistent results from studies
Inconsistent results found for 2 products in experiment In tiie nondurable plant experiment, expectations, disconfimiation and performance all affected satisfaction (directiy and indirectly). In tiie video disc experiment, only performance had a dominant impact on satisfaction.
Findings
Relationship between perceived expectations and perceived perfoimance
Positive and significant relationship found
Dissatisfaction had no relationship with disconfimnation between expectations and product performance
Reported opposite result
Significant relationship between expectations and disconfimiation found for in different situations for 2 products
Relationship between perceived perfomiance and disconfirmation
Relationship between perceived performance and satisfaction
Significant relationship in a positive direction vras found.
Author(s) and Year
Anderson (1973) cited in Churchill & Suprenant 1982
Yau (1994)
Oliver (1977,1979,1980b cited in Yau (1994), Churchill & Suprenant (1982)
Watruba & Duncan (1975) cited in Yau (1994)
Vinson & Yang (1979) cited in Yau (1994); Swan & Trawick (1980); Churchill & Suprenant (1982) cited in Yau (1994)
Yau (1994)
Swan & Trawick (1980) cited in Churchill & Suprenant (1982), Yau (1994); Churchill and Suprenant (1982); Yau (1994);
Swan & Trawick (1980) cited in Churchill & Suprenant (1982), Yau (1994)
Churchill and Suprenant (1982); cited in Yau (1994)
Yau (1994)
85

Chapter 2: Literature Review
N4 -^ N5 1
N1->N4
N3-^N4
V1-^N1
V1->N4
Showed empirically that satisfaction is significantiy related to botii tiie consumers' postexposure and to tiieir preexposure intentions
Suggest tiiat Chinese consumers tend to become satisfied Uirough a ttieory of cognitive dissonance whereby tiiey tend to reduce tiieir expectations witii the product after purchase in order to be more satisfied.
Relationship between satisfaction and behavioural intentions
Consumer satisfaction was positively related to behavioural intentions
/\rgued dissatisfaction caused by expectations
Highly significant relationship between expectations and satisfaction was found.
Relationship between disconfimiation and satisfaction
Relationship between cultural values and product expectations.
Found to be significantiy related in positive direction
Relationship between cultural values and satisfaction/ dissatisfaction was found.
Oliver (1980b) cited in Yau (1994)
Yau (1994)
Oliver (1977, 1979, 1980b) cited in Yau (1994), Churchill & Suprenant (1982)
Wati iba & Duncan (1975) cited in Yau (1994)
Churchill & Suprenant (1982); Yau (1994)
Olson & Dover (1976) cited in Churchill & Suprenant (1982)
Yau (1994)
Yau (1994)
The constructs and relationships In Figure 2.3 of particular Interest to this study of cultural
experience tourist motivation are highlighted and include the core components of expectations,
perfonnance perceptions after consumption experience, satisfaction/dissatisfaction, and the
influence of a culture construct on the process.
A concept closely related to, "but not equivalent to satisfaction" (Cronin and Taylor, 1992) Is service
quality. Childress and Crompton (1997) apply the expectancy disconfirmation paradigm developed
by Oliver (1980a) to quality of performance rather than satisfaction per se, and claim It more tightiy
defines and specifies this notion that visitor's evaluations of their expectations serve as reference
points for their perceptions of quality of performance. It holds that perceptions of a supplier's
perfonnance are related to a visitor's initial expectations of It. Thus, its quality can be confirmed
(performed as expected), negatively disconfirmed (performed worse than expected) or positively
disconfirmed (performed better than expected). They Identify and empirically compare seven
different quallty-of-performance measures (direct and Indirect) and conclude that the direct quality
measures were the most problematic while one of the most desirable alternatives was the indirect
differential measure, the perceptions-minus-expectations gap format of the expectancy
disconfirmation paradigm. Its major strengths were its relative ease of administration and Its yield
of useful diagnostic insights. However, It has low predictive and discriminative validity and some
instability among the factor domains.
The relationship between perceptions of supplier's quality of performance, and satisfaction, defined
and empirically measured as two separate constructs, was also considered by Childress and
86

Chapter 2: Literature Review
Crompton in a festival experience context (1997). While discrepancy and direct scale alternatives
were used to measure the quality of performance with the former found to be superior as discussed
in the previous paragraph, they also measured festival consumer satisfaction as a dependent
variable using a four-item aggregated scale developed by Crosby and Stephens (1987 cited in
Childress and Crompton, 1997). A single Item to measure a second dependent variable of value
for money was also Included. Empirical findings identified that the constructs of quality of
performance and satisfaction are different but related. They suggested from this research that
visitor satisfaction was operationalising the quality of the visitors' experience, as distinct from the
quality of performance measures which were operationalising visitor's perceptions of the supplier's
quality of performance.
Also In relation to service quality, a powerful tool for measuring service quality In any context,
SERVQUAL, was Introduced In the late 1980s (Parasuraman et al., 1988). The SERVQUAL
insti"ument is an inferred method of service quality defined, "as the discrepancy between
customers' expectations and perceptions" (Parasuraman et al., 1994b). It measures consumers'
expectations based on their experiences as a customer of a nominated service category of the
ideal attributes that any company within this nominated service Industry would possess to deliver
excellent quality of service and compares this with the consumer's evaluation of the extent to which
a specific company within the nominated sen/ice industry perfomned on these attributes (Zelthaml
et al., 1990). As a perceptions-minus-expectations gap fonnat approach to measuring service
quality, it operatlonalises measurement of Gap 5 In Parasuraman and colleagues' (Parasuraman et
al., 1985) eariier conceptual gap analysis model of service quality. SERVQUAL has been used
extensively in various service areas including cultural attraction and event experiences of art
exhibitions (Higgs et al., 2005; Kerstetter et al., 2001) and historic house visitation (Frochot, 2004;
Frochot and Hughes, 2000).
Criticisms of studies of the SERVQUAL type include limiting their approach to an evaluation of the
tangible or utilitarian dimensions of the service experience. This model could be considered a
shortcoming for the evaluation of satisfaction or service quality In some specific products and
services (leisure and art services for Instance) that Involve strong emotional and experiential
dimensions as Identified In the experiential theories of consumption (Hirschman and Holbrook,
1982; Holbrook and Hirschman, 1982). This criticism is particulariy pertinent to tourism
consumption such as cultural experience tourism where emotional and experiential dimensions
could be a significant part of the tourist motivation and consumption. SERVQUAL has been
criticised for being based on a satisfaction paradigm rather than an attitude model. By specifically
instructing respondents to think about excellent companies, it uses a measure of expectations that
aligns more closely with ideal expectations (Higgs et al., 2005) which can produce high standard
levels of responses with very llttie variation and this limits diagnostic analysis. Respondents are
normally surveyed once only In the post-experience phase and are required to recall pre-
experience expectations which relies on the accuracy of the respondent's memory and there Is the
87

Chapter 2: Literature Review
added problem that expectations are dynamic (Boulding et al., 1993) and shaped by the actual
visitation experience.
2.10.4.2 Motivation, Benefits and Satisfaction
From the previous review of consumer satisfaction approaches and literature, expectations fonn
the frame of reference for satisfaction judgements (Oliver, 1997) and perceived performance
evaluation is directiy relevant to psychological interpretations of consumer satisfaction, especially
the discrepancy expectations-minus-perceptions approaches of service quality and the expectancy
disconfimiation paradigm of consumer satisfaction.
Frochot (2004) identifies two trends in tourism quality and satisfaction research: one focusing on
social and psychological factors and the other on largely utilitarian product attributes.
The achievement of needs and motivations as prime sources of satisfaction has dominated some
leisure research (Beard and Ragheb, 1980; Lounsbury and Hoopes, 1985) and tourism research
(Otto and Ritchie, 1996). These views corroborated Crompton's (1979) findings on vacation
motivation and satisfaction which suggested relationships between values, benefits and satisfaction
in tourist motivation, and asserted psychological and social factors as prime sources of vacation
satisfaction rather than destination attributes:
The values, benefits and satisfactions derived from the vacation were neither related to, or not derived from a particular destination's attributes. Rather satisfactions were related to social and psychological factors unique to the particular individual or group involved (cited in Frochot, 2004, p.224).
Conversely, other tourism studies have focused largely on more functional and utilitarian
dimensions by Identifying ranges of attributes upon which quality, satisfaction and pull theories of
motivation are evaluated. Tailoring the SERVQUAL instrument for the study of tourism services
and destinations are some examples of this approach and include cultural attraction and event
experiences of art exhibitions (Higgs et al., 2005; Kerstetter et al., 2001), and historic house
visitation (Frochot and Hughes, 2000).
These dual approaches to the notion of satisfaction and quality in tourism consumption have been
questioned by other researchers and the necessity of combining both utilitarian and experiential
dimensions in satisfaction evaluation of tourism consumption has been long recognised in the
literature (e.g., Childress and Crompton, 1997; Moutinho, 1987). Operationallsation remains a
complex Issue.
Frochot's (2004) recent study of visitor's quality evaluation of historic houses' service provision,
sought to operationallse combining both utilitarian and experiential dimensions by measuring the
former with HISTOQUAL - a perception only variation of SERVQUAL, and the latter through
benefits sought, with data for both obtained through exit surveys at three historic properties in Great
Britain. Benefit segmentation was applied to evaluate the motivational profile of the visitors and
88

Chapter 2: Literature Review
then discriminant analysis was conducted with the dependent variable of cluster membership and
the independent variables of service quality ratings and the importance weights allocated to these.
The benefits sought scale used in this study was developed from interviews with previous visitors,
thereby limiting its suitability to be applied in other tourist service context settings, however the
study was considered by Frochot (2004) to support linking benefits to quality evaluations as
pertinent for tourism products of an experiential nature.
While there are many studies of consumer satisfaction or service quality in a tourism context as
mentioned above, and an emerging number of studies on service quality, satisfaction and
behavioural Intentions (e.g.. Baker and Crompton, 2000; Howat et al., 2002; Lee et al., 2004b;
Thrane, 2002), a very small number of other tourism studies look at motivation and satisfaction as
separate but related constmcts. Examples of the latter include a study of sightseeing tourists'
motivation and satisfaction In Washington, United States (Dunn Ross and Iso-Ahola, 1991), an
investigation of festival motivation and event satisfaction by visitor type including repeat visitors to a
hot air balloon festival in North Carolina, United States (Mohr et al., 1993), a study of the motives,
behaviours and satisfactions of backpackers in the Northern Territory of Australia (Mohsin and
Ryan, 2003), and an examination of the effects of motivation and satisfaction on destination loyalty
in Northern Cyprus (Yoon and Uysal, 2005). While all four studies are of some relevance to this
proposed study of cultural experience tourist motivation, these studies use different definitions and
measures of both motivation and satisfaction. Yoon and Uysal's (2005) study is of additional
relevance to this proposed study because it examines the causal relationships between the
constructs of motivation and satisfaction, but In relation to destination loyalty, which Is not relevant
to this proposed study.
The link between consumer satisfaction and motivation has been discussed eariier in section
2.9.6.2 outiining motivation as a process comprised of components In a sequence of causal
relationships that include behavioural outcomes such as satisfaction. The motivational process
components Identified In this study as critical to understanding cultural experience tourism are the
psychologically-related constructs of culture, attitudes, motives, and benefits sought, and the
selected behavioural outcomes of benefits gained and satisfaction.
2.10.4.3 Uses of Satisfaction in Marketing and Cross-Cultural Data Gaps in Cultural Experience Tourist Satisfaction
In the consumer satisfaction research and literature, present theories were mostly developed and
tested in the United States, hence an inherent need has been identified (Yau, 1994, pp. 59-60) for
cross-cultural or cross-national research. Furthermore, one of the main purposes of this cross-
cultural consumer satisfaction research is to search for differences in consumer behaviour which
can better serve as reminders for differential marketing strategies or policies (Yau, 1994, pp. 59-
60). In the tourism context, there Is also a need for cross-cultural research of tourist satisfaction
and motivation. One recent study segmented festival motivation by nationality and satisfaction in
recognition of the importance of festival market segmentation as a valuable marketing tool for
89

Chapter 2: Literature Review
promotion and understanding segment characteristics based on motivations (Lee et al., 2004a).
The study analysed festival market segmentation between domestic and foreign visitor groups
where foreign visitors were aggregated and called for future research to validate the measurement
scales In disaggregated countries, before generalisations can be made.
2.10.4.4 Defining and Researching Satisfaction Summary
Satisfaction/Dissatisfaction is defined as, "a judgement, attitude or psychological state arising
from consumer's disconfimnation of expectations and unexpected events. It Is a function of the
degree of congruency or disparity/disconfirmation between visitor's perceptions of the quality of
their experience and of the supplier's performance .(regarding both quality and non-quality
dimensions) and visitor's evaluations of their normative expectations which serve as reference
points for their perceptions of quality of performance". Hence if people's expectations exceed their
perceptions of how a service performed, then the negative disconfirmation (performed worse than
expected), if their expectations are confirmed (performed as expected), and if their perceptions
exceed their expectations then their expectations are positively disconfirmed (performed better than
expected).
In contrast with satisfaction/dissatisfaction. Service Quality Is defined as, "visitor's perceptions of
the quality of a supplier's performance. It Is a function of the degree of congruency or
disparity/disconfirmation between visitor's perceptions of quality of supplier's performance and
visitor's evaluation of their ideal expectations which serve as reference points for their perceptions
of quality of performance". If people's expectations exceed their perceptions of how a service
perfonned, then the negative disconfirmation (performed worse than expected) will lead to a
perception of low quality.
2.11 influencing Variabies and Profiiing Cliaracteristics to be Tested in tliis
Study
2.11.2 Culture and Language
2.11.1.1 Defining Culture
Culture Is a multi-variate concept with many definitions and no consensus definition that can be
widely accepted (Reisinger and Turner, 2003, p.32). There are also many dimensions or elements
on which cultures differ, and many different theories or framewori<s for these cultural elements and
dimensions (Hall, 1977, reprinted 1989; Herskovits, 1952; Hofstede, 1980; Sculpin, 1999). Each
dominant culture consists of several subcultures based on race, ethnicity, geographic region, socio
economic characteristics (Reisinger and Turner, 2003). Race refers to a genetic or biological
similarity among people (Lustig and Koester, 1993 cited in Reisinger and Turner, 2003). Ethnicity
refers to a wide variety of groups of people who share a language, history and religions and Identify
themselves with a common national or cultural system (Lustig & Koester, 1993 cited in Reisinger
and Turner, 2003). Ethnic variety can be found in all countries (Samovar et al., 1998 cited in
Reisinger and Turner, 2003).
90
Chapter 2: Literature Review
From an international mari eting perspective, language is one of five key elements of culture
Identified by anthropologists to be evaluated in order to understand a culture (Cateora and Graham,
2002). Hence language differences are being used to initially identify the units of population to be
sampled because this is one fundamental cultural element by which cultural experience tourists can
be divided Into sub-groups and statistically significant language differences for the cultijral
experience tourist motivational process constructs, if found, are crucial to marketing strategies,
especially communication and promotion, and also to consumers' marketing needs and responses.
Using language spoken at home to define culture, aligns It with an eariy definition of culture by
Linton (1945) in the book. The Cultural Background of Personality. Linton's definition of culture
emphasises that culture is learned behaviour, dynamic, transmissive and Its characteristics are
shared by members of a given society, all of which directiy apply to the key cultural element of
language spoken by the members of a particular society. Linton defines culture as:
the configuration of learned behaviour and results of behaviour whose component elements are shared and transmitted by the members of a particular society (1945, p.32).
For the purpose of this study culture is defined as, "the configuration of learned behaviour and
results of behaviour whose component elements are shared and transmitted by the members of a
particular society and in this study will be operationalised by the cultural element of language
spoken at home."
2.11.1.2 Culture and Tourism Marketing Applications Cultural differences are especially relevant to the tourism Industry as It Is increasingly experiencing
globalisation and associated with this, considerable attention to the relevance of cultural diversity,
cultural characteristics representing an attractive element of the tourism product itself, and tourism
as a service industry where people from different cultures can meet (Pizam, 1999). Unfortunately,
the role of cultural differences in determining tourist behaviour has not been paid much attention in
tourism research (Pizam, 1999).
The acknowledged importance of consumer behaviour and marketing to tourism is highlighted
above. This combined with the fact that tourism has become an international phenomenon of
global consequence (Dimanche, 1994), with International tourism - the movement across
International boundaries - increasing dramatically over the last two decades (Jamrozy and Uysal,
1994), suggests that within the tourism literature there should already be a large number of cross-
cultural research and international research, particulariy in consumer behaviour and marketing.
However, there is a relative scarcity of cross-cultural studies reported in the tourism literature as
noted by Dimanche (1994) and specifically In relation to travel behaviour. Plog (1990, p.43) noted
a little earlier that, "cross-cultural research, particularly related to travel behavior, is quite rare." In
the tourist motivation literature, despite extensive research on tourist motivation, event tourism
motivation, cultural tourism motivation and event motivation, as outiined In the previous sections of
this literature review, the literature still suffers from a lack of empirical studies that Investigate
91

Chapter 2: Literature Review
whether tourist motives differ between culture groups. Festival and event motivation studies have
been undertaken at the community and rural level, but little research on cultural festivals has been
conducted or published at the international level (Formica and Uysal, 1998).
Since the late 1990s, a number of studies have been Identified from the English language tourist
motivation literature that incorporate a cross-cultural dimension and these are briefiy discussed
below.
The gap in tourist motivation differing by nationality and destinations led to one of the first studies to
compare tourist motivations across various destinations and various nationalities (Kozak, 2002).
The objectives of this research were twofold, firstiy whether there were any differences between the
motivations of those who are from different countries travelling to the same destinations and
secondly, between the motivations of those who are travelling from the same countries to two
different destinations. The first research objective is of most interest to this research. The analysis
was based on intrinsic desires of the individual traveller ('push' factors) and the external destination
factors ('puir factors) Influencing the motivations of British and German tourists visiting Malljorca
and Turkey in the summer season. This research showed that motivations differ from one person
(or group) to another as well as from one destination to another.
One study that contributes to addressing the gap In festival event motivation is Lee's (2000)
research which compared event motivation between Caucasian and Asian visitors at a cultural
event in an Asian setting based on analysis of visitors from four countries/regions - Japan, Korea,
America and Europe - and by three language groups - Japanese, Korean, and English for all other
foreign visitors. Thirty-two motivation Items were factor analysed, resulting in seven underiying
dimensions and the results showed significant differences In motivations among visitors from the
four countries/regions. While no significant differences were found between Koreans and
Japanese (Asian) or between Americans and Europeans (Caucasian), significant differences were
found between Caucasians and Asians. Moreover, Caucasian visitors tended to have higher
motivations than Asian visitors. Some motivation factors received similar ratings by all groups, that
is, high ratings on the motivation factors of cultural exploration and event attractions and low ratings
on the factor of family togetherness.
Whether equivalent factor structures apply In a culture outside of North America has been
questioned by several authors (Lee, 2000; Schneider and Backman, 1996). Schneider and
Backman (1996) examined the applicability of the factor stmcture of motivation scales commonly
used by festival studies to an Arabic arts and culture festival. A similar factor structure appeared
indicating that festival motivation scale developed in North America Is readily transferable to an
Arabic cultural festival, and suggesting that festival motivation scales are applicable regardless of
cultural boundaries. Lee's (2000) study comparing event motivation between Caucasian and Asian
visitors in an Asian setting identified seven underiying motivation dimensions, all of which were also
reported by other previous studies even though they were slightiy different In order and
92

Chapter 2: Literature Review
components of motivational factors. These findings imply that motivation items and scales
measured in North America and Europe could be also applicable to Asian countries.
From the travel motivation literature, Loker-Murphy (1996) studied the motives of backpackers in
Australia by adapting Pearce's (Moscardo and Pearce, 1986; Pearce, 1988; Pearce and
Caltablano, 1983) Travel Career Ladder which in turn is largely needs-based and recognises tiiat
while tourists overtime will ascend the ladder, the same tourist may vary their ti-avel career level
depending on the travel situation. Furthermore, motives at each level may be internally (self) or
externally (other) directed. Loker-Murphy (1996) then applied this empirical research of backpacker
motives to segmentation purposes. Nationality was the most pronounced difference across these
segments, but segments also differed in terms of activity preferences as well as expenditure
patterns, accommodation and destinations visited. Although results for most of the nationality
groups were small and should be taken with caution, differences in backpacker travel motives were
found for Europeans, North Americans, Asian/other respondents, Australians and New Zealanders.
Moscardo et al., (1996) in their research to understand destination choice by travel motivation or
benefits sought, activity experiences and preferences, and the role of these in vacation destination
decisions, focused on Australian outbound travellers. They speculated that if expanded to include
International travellers from other countries, it might be expected that this research would Indicate
that although similarities exist, each country will have a unique set of benefit/activity clusters.
2.11.1.3 Cross-cultural Research Problems
Conducting cross-cultural research Is prone to many environmental and methodological problems
that can Impede it being undertaken or limit its use (Dimanche, 1994). Many specific problems are
identified by Dimanche (1994). Cultural and language differences and their effects are obvious
problems. Other environmental factors Include a misunderstanding of the value and benefits of
cross-cultural research; ethnocentrism of researchers; and lack of the associated needed
resources such as money, multi-lingual researchers, or cross-cultural co-operation with research
colleagues. Methodological issues when undertaking cross-cultural research are many and include
language translations and cultural equivalence, experiential and cultural equivalence, and
measurement equivalence. Further problems noted by Dimanche (1994) are the relative scarcity of
cross-cultural studies reported in the tourism literature, and of the published studies, most of those
using translated instruments tend to lack sufficient inforniation concerning the validity and reliability
of the question items in the various cultures, therefore making the results suspect.
Another frequentiy encountered problem especially relevant to cross-cultural tourism research of
international markets, is access to research population samples, in terms of sufficient numbers, and
where and when the population samples are accessed, for example, at home; at the destination;
on-site at cultural attractions/events or at non-cultural attractions/events; at the destination
departure point; before and after the cultural event experience, and so on.
93

Chapter 2: Literature Review
2,11.1.4 Cross-cultural Research and Cultural Experience Tourist Motivation Summary
It is widely acknowledged in the services and tourism literature, that consumers' expectations,
perceptions, and behaviour are Influenced by cultural factors, and marketers who want their
services adopted across cultures must understand these differences (e.g., Zelthaml and BItner,
2000).
The existing studies of cross-cultural tourist and event motivation considered in section 2.13.1.2
reveal mixed findings of relevance to this study. Regarding the great cultijral divide widely found
between Western and Asian cultural groups In many consumer behaviour studies (e.g., Schutte
and Ciariante, 1998) and in tourism service contexts (Reisinger and Turner, 1998a, 1998b, 2002a,
2002b; Turner et al., 2001), for tourist motivation such differences were found in one study (Lee,
2000), but no statistically significant differences were found in another study (Schneider and
Backman, 1996). Differences In tourist motivation between Western cultural groups have been
found between British and German tourists In one study (Kozak, 2002), but not between Americans
and Europeans In another study (Lee, 2000). Within Asian cultures, insignificant differences were
found for festival event motivations between Koreans and Japanese cultural groups (Lee, 2000).
Travel motivations of backpackers In Australia found small differences between five nationality
groups: Europeans, North Americans, Asian/other respondents, Australians and New Zealanders
(Loker-Murphy, 1996).
One limitation of the proposed research of international tourist's cultural orientation and differences
as represented by language spoken at home. Is that it will not cover all cultural dimensions
recommended in cross-cultural studies for more grounded inferences (such as power distance,
collectivism/individualism, masculinity/femininity, and so on). Cultural distance is one dimension of
cultural orientation that refers to the extent to which the culture of the originating region differs from
that of the host region (Mcintosh et al., 1994). Studies of cultural tourism In Hong Kong have found
cultural distance influences participation in international cultural tourism (McKercher and Chow,
2001; McKercher and du Cros, 2003). The concept of cultural distance as represented by country-
of-origin, may be relevant to explaining findings in this proposed study. There is a need for tourism
academic research and literature that analyses cultural differences and determines their Impact on
tourist behaviour. Such research and literature would be cross-cultural by nature. It could be
based on differences across nations for the purpose of determining whether similar patterns exist
among consumers and decision makers In different countries, as defined by Pizam (1999, p.407).
Other authors have criticised the practice of using nationality as a sole discriminating variable for
explaining the differences found In the behaviour of tourists (e.g., Dann, 1993). In reviewing cross-
cultural tourism marketing research, Dimanche (1994) uses the term "cross-cultural" because it Is
broader and "reflects more possible differences in consumer behavior than 'cross-national'" (van
Raalj, 1978, p. 693 cited in Dimanche, 1994).
94

Chapter 2: Literature Review
Of the cross-cultural research in a tourism context that has been undertaken, various or multiple
purposes could apply. Dimanche (1994) identifies three purposes: one of which is tourism and
culture-related, and the other two are tourism, culture and mari<eting-related. A primary purpose
would be to test a touristic phenomenon or constmct In various cultural environments, therefore
providing different conditions needed to test that phenomenon or construct and gain a better
understanding of the construct or phenomenon in question. Another Important purpose Is to test
tourist behaviour and marketing theories In International settings, In order to learn whether the
theories can be generalisable or whether they are culture-specific. While Dimanche acknowledges
that in tourism contexts, behaviour and vacation patterns are often culture-specific, better
recognition and understanding of differences between cultures through research appears to be
important. The third purpose of cross-cultural research is also marketing-oriented and aims to
explore other cultures, learn about them, and to test cultural differences in tourism marketing
contexts (e.g., investigate tourists' behavioural and attitudinal differences in several international
markets In order to better target and satisfy them). The cross-cultural purpose of this proposed
study would strongly fit with the third of these stated purposes.
2.12 IVIarketing Applications
It Is clear from the literature review that attitudes, motives, benefits (sought and realised) and
satisfaction need to be considered in this study. In section 2.10.3.8 on use of benefits in marketing,
it was acknowledged that one of the most common application of benefits research in a tourism
context has been for market segmentation purposes.
The marketing purposes of market segmentation and the related concept of target marketing are
discussed below as well as some of the associated debates, limitations and criticisms Identified in
the literature to date. One of the more recent developments is the use of multiple segmentation
bases rather than a single base, an area to which this study alms to make a significant conti ibutlon
as further discussed below.
2.12.1 Market Segmentation
If a tourism market can be subdivided by distinguishable characteristics into differentiated groups In
accordance with the accepted theoretical principle of market segmentation In general (Kotier, 2000)
and for tourism markets specifically (e.g., Kotier et al., 2006; Middleton and Clarke, 2001; Morrison,
2001), then this marketing theory advocates developing unique marketing strategies for each of
these groups.
The benefits of market segmentation for marketing purposes has been discussed throughout this
literature review but especially In sections 2.9.4.3 on benefits and tourism motivation and 2.10.3.8
on uses of benefits in marketing and a proposed new use In this study.
95

Chapter 2: Literature Review
While the strategic importance of market segmentation among academics and practitioners is
widespread, Mon-ison et al., (1994) acknowledge a lack of consensus on how to divide travel
markets into their component segments, that is, how many and which variables to use to divide the
mari<et and which exact procedure to follow In the segmentation. The fomner Is discussed below,
while the latter will be discussed in Chapter 4 Research Method.
2.12.1.1 Multiple versus Single Dimension Segmentation Bases A review of the travel and tourism market segmentation literature, reveals that many eariy studies
typically derived groups by clustering respondents on the basis of only one dimension with some of
the most popular segmentation dimensions being participant demographics, activity participation,
motivation or benefits sought/pursued, product or destination preference (Jamrozy and Uysal,
1994; Woodside and Jacobs, 1985).
Later tourism marketing studies from the mid 1990s onwards (e.g., Alzua et al., 1998), identify this
use of only one segmentation base as a major shortcoming of tourism market segmentation and
recommend combining both attitudinal and behavioural dimensions for superior market
segmentation. Others advocate that travel behaviour is multi-dimensional and therefore a multiple
segmentation approach should be employed In order to define sub-markets (e.g., Lang and
O'Leary, 1997).
The use of activity participation, motivation and benefits for market segmentation purposes and the
relevance of each of these to this proposed study, are discussed in the following sections.
2.12.1.2 Activity-Based Segmentation
One group of tourism market segmentation studies uses activities-based dimensions to segment
the market (e.g., Hsieh et al., 1992; Lang et al., 1993; Morrison et al., 1994; Sung et al., 2000).
Specific studies using activities-based dimensions for segmenting the cultural tourism market and
Industrial heritage tourism market have been undertaken by several authors (e.g., Dolnicar, 2002a;
Kerstetter et al., 1998; McKercher et al., 2002) and in these studies, segments are identified by
analysing tourist behaviour at a destination. This type of study Is destination-specific and the three
destinations respectively were: the 500-mile Industrial heritage route in Pennsylvania, United
States; Vienna; and Hong Kong.
At least two of tiiese studies found that the cultural tourism is not a homogeneous group of tourists
but rather a market comprised sub-segments that are activity-based. In one study (Dolnicar,
2002a), sub-segments were based on participation at eight cultural tourism activities and in the
other (McKercher et al., 2002), on participation or not, at 40 destination-specific cultural attractions
in Hong Kong combined with general travel motives and other Items. McKercher ef al., (2002),
further suggest relationships between activities participated, benefits sought and preferences for
certain activities. McKercher et al., (2002) acknowledge and support the debatable suggestion that
activities-based segmentation is a form of benefit segmentation that assumes a destination's
attributes equate with the benefits sought by tourists. These benefits. In turn are expressed by
96

Chapter 2: Literature Review
preferences for certain activities that can be clustered around an Identifiable theme, one
assumption of activities-based segmentation being that different types of cultural tourists show
preferences for different types of cultural experiences. By analysing the patterns of visitation to
cultural attractions, it is possible to identify specific mari<et segments based on the benefits sought
by participation. This technique can then be further used to Identify unique or distinguishing
features of each segment which can be used to develop more effective marketing and product
development strategies.
2.12.1.3 Motivation-Based Segmentation A review of relevant literature, especially studies involving both empirical and conceptual research
but which focus largely on the allied areas of tourism, leisure and recreation rather than cultural
tourism or cultural event tourism per se, identifies concepts pertinent for attracting tourist markets.
These commonly identified concepts are an understanding of who Is being atti-acted, together with
why and how they are attracted, for this in turn determines their ultimate behaviour (e.g., Alzua et
al., 1998; Frochot and Morrison, 2000; Lang and O'Leary, 1997; Mon-ison et al., 1994; Nicholson
and Pearce, 2001; Sung et al., 2000).
It Is therefore not surprising that the motivation concept is a central element of many tourism market
segmentation empirical studies (e.g., Crompton, 1979; Kozak, 2002; Loker-Murphy, 1996;
Moscardo et al., 1996). Some of these studies, use needs-based motivations and others use
values-based motivations to segment the market, as highlighted In the earlier motivation section of
this literature review (2.9.2; 2.9.4.1 and 2.9.4.2). Others use benefits sought or pursued to segment
the tourism market as highlighted in the eariier motivation (2.9.4.3) and benefit sections (2.10.3) of
this literature review and It has already been established in the motivation section of this literature
review (2.9.4.3) that benefits are often used as a measure of motives in tourist motivation research.
Motivation-based market segmentation has typically been undertaken by reference to person-
based determinants of behaviour with the most populariy appealed to being socio-demographic
variables, but increasing use of psychographic variables, sometimes referred to as 'push factors'.
Galloway (2002) argues there is strong evidence from a variety of tourism studies (cf., Pitts and
Woodside, 1986; Pizam and Calantone, 1987; Plog, 1990) that market analysis in terms of
psychological variables (psychographic analysis) is useful. At least two studies of cultural tourism
participation in particular (Kerstetter et al., 1998; Prentice et al., 1998) suggest that motivation and
psychographic factors are more useful tools to define cultural tourists than simple demographics.
The importance and advantages of integrating attitudinal as well as behavioural characteristics In
multi-dimensional segmentation according to Alzua et al., (1998), are that the former may trigger or
drive the behaviour as exemplified by attitudes such as benefits sought at a destination by travellers
which may influence travellers to choose within a preferred set of alternative activities, or to
participate more often or widely. Examples of attitudinal characteristics of relevance to tourist
mart<et segmentation include motivations or motives, values, needs, attitudes, philosophies.
97

Chapter 2: Literature Review
benefits sought or pursued, expectations, and preferences. Also barriers, constraints, perceived
risks or fears might play an Important role In the decision-making process by ultimately preventing
any attendance or participation.
2.12.1.4 Benefit Segmentation
As noted earlier In the benefits sought or reallsed-based tourist motivation discussion (2.9.4.3),
some authors (e.g., Loker and Perdue, 1992) believe that benefits are superior to other measures
that merely describe it such as personality and lifestyles, volumetric, demographic, or geographical
measures. An advantage of benefit segmentation Is that it functions as an a posteriori
segmentation method which predicts or explains behaviour because the composition of segments
is unknown in advance of analysis and this method Is superior to many other tourism segmentation
methods that merely describe groups of people, known as a priori methods (Frochot and Morrison,
2000).
On the other hand, some limitations and criticisms of this approach to market segmentation have
been noted. These types of data-driven segmentation approaches where the segmentation is
driven by data post hoc, have been criticised (Dolnicar, 2002b, 2004) especially for prohibiting
theoretical predications and testing of the segmentation outcomes, combined with a highly
subjective decision on the number of clusters, thereby producing chance outcomes (Oh et al.,
2004). No commonly used 'benefits sought' or 'benefits gained' empirical scales exist In tourism or
any other product or sen/Ice category, largely because they are product attribute and setting
dependent. For any new service context, Frochot (2004) recentiy acknowledged the benefits items
and segmentation clusters will have to be developed and specified, a procedure which would lead
to a heavy research process. Furthermore, the benefit items and clusters found in any study might
not be replicable to other settings (Frochot, 2004).
The popularity of benefit segmentation in travel and tourism research Is attributed to the widely
acknowledged belief that benefits are related to travellers' motivations, however the exact link is still
to be tested and proven (Frochot and Morrison, 2000) has also been acknowledged earlier in this
literature review (2.9.4.3).
2.12.1.5 Market Segmentation and Proposed Research Summary
As seen In the previous discussion, many different and sometimes, multiple, variables have been
used to segment tourist and cultural tourist markets with some frequently used variables being
motivation-related, benefit-related or activities-related. Sometimes one or more of these are used
as the grouping variable(s), with some of these or other variables as the group profile descriptors.
2.12.2 Target Marketing
In addition to market segmentation, efficient and effective target marketing theory in general (Kotier,
1997) and for tourism markets specifically (e.g., Kotier et al., 2006; Middleton and Clarke, 2001;
Morrison, 2001) advocates identifying the market segments that are more or less responsive to
98

Chapter 2: Literature Review
marketing efforts directed at them, In order to target those that are most responsive and bring their
potential to fmition (e.g., Tian et al., 1996).
Acknowledging that preference sets and destination attributes can be matched to psychographic
profiles of tourists, Kozak (2002) recommends that depending upon the empirical findings,
destination management could either promote attributes that best match tourist motivations or
concentrate on a different market where tourist motivation and destination resources match each
other.
2.13 Summary of Proposed Research
Understanding why tourists participate in particular activities while travelling for pleasure purposes
and using this infonnation for effective market segmentation purposes is the focus of this study
which is both multi-disciplinary and cross-cultural. Today, there Is no single approach to
understanding motivation or undertaking market segmentation as identified in this literature review.
In the review of tourist motivation literature (section 2.9.4), a lack of consensus over definition and
tiieoretical approaches for understanding tourist motivation was identified. Dann (1981) attributes
this to a multi-disciplinarity of ti^eatment and plurality of theoretical perspective within a given
discipline. Motivation draws on the disciplines of psychology, sociology, consumer behaviour, and
has been applied to various tourism contexts, markets and sub-markets such as cultural tourism,
festival and event tourism, for selected International or domestic tourist markets. In the discipline of
psychology there Is no universally agreed theoretical approach to understanding motivation
(Atkinson et al., 1983; Davidoff, 1994; Gross, 1992). Ditto consumer behaviour approaches to
motivation (e.g., Mowen and Minor, 1998). Consequently, there is no agreed theoretical approach
to understanding and measuring tourist motivation (Fodness, 1994). There is general consensus
that motivations are multi-variate and dynamic (e.g., Holden and Sparrowhawk, 2002). From the
review of tourist motivation and allied consumer motivation literature (section 2.9.4), It was decided
In this study to conceptually view motivation as a multi-construct process rather than a single
construct.
Tourism Is a, "complex mixture of entertainment, education, self discovery and sheer fun" and
therefore it Is particularly difficult for a mathematical model to capture all aspects of service quality
and customer satisfaction (Ryan, 1999). Hence the challenge for this research is to develop a
multidimensional conceptual model for empirical testing, which captures the important aspects of
the cultural experience tourist motivational process and examines the inter-relationships between
them, and their significance for market segmentation purposes. The key constructs proposed in
this study are the psychographic dimensions of attitudes, motives and benefits sought, and the
related behavioural outcomes of benefits realised and satisfaction.
In this proposed research to understand why tourists participate in cultural experiences, in addition
to studying the tourists' motivation for engaging in cultural experiences per se, their specific
99

Chapter 2: Literature Review
experience of one popular cultural attraction, Queen Victoria Market, will be studied In detail.
Motivational constmcts for tourists' cultural experiences per se include tourists' attitudes and
enthusiasm towards engaging in different types of cultural experiences in general, and their motives
for engaging in cultural experiences when on holidays will be measured. As benefits (sought and
realised) vary with types of activities and experiences, they will be empirically measured in relation
to one specific cultural heritage site and event experience at the popular international tourist
attraction of the Queen Victoria Market in Melbourne, Austi-alia.
Each of these key constmcts within the motivational process are also multi-dimensional as
identified in the eariier discussion and literature review for each of these concepts to be examined
in this study (sections 2.10.1; 2.10.2; 2.10.3; and 2.10.4). Hence, within each of the key constmcts
of attitudes, motives and benefits, underiying dimensions will be examined and the findings of this
research compared with findings from the existing research and literature on these construct
dimensions particulariy within a tourism and cultural tourism context (and to be discussed in
Chapter 4, Research Method). Hedonic-related dimensions within each of these motivational
process consti-ucts of attitudes, motives and benefits are a further proposed focus of this research,
because as discussed earlier in this literature review, relationships between emotions - specifically
hedonic feelings - and consumer behaviour were raised as early as 1930s by Murray (1938).
Hedonic consumption research increased in the 1980s focusing on products that are intrinsically
more emotionally involving than packaged goods, such as movies, rock concerts, theatre, dance,
pornography, and sporting events (e.g., Hirschman and Holbrook, 1982; Holbrook and Hirschman,
1982) and resulted in the Identification of hedonic consumer motivation theory (Mowen and Minor,
1998) and hedonic tourism motivation theory (Goossens, 2000). As previously discussed in
section 2.9.5.4, emotions are an important influence on tourist motivation, and hedonic
consumption and allied concepts are particulariy relevant to cultural experience tourism which could
comprise such products, activities and consumption (sections 2.9.6.1). Within the motives and
benefits constmcts, further dimensions to be incorporated for testing comprise seeking and
escaping dimensions as commonly found research approaches and dimensions of relevance to
tourism motivation (e.g., Crompton, 1979; Iso-Ahola, 1989; Mannell and Iso-Ahola, 1987) and
attribute-based dimensions because of their relevance to attitudes, motives and benefit constructs
In general and In a tourism or cultural context (e.g., Frochot, 2004; Haley, 1968; Wells and Tigert,
1971).
Furthermore, drawing on the theoretical framework of service quality and customer satisfaction
from the services marketing area (e.g., Parasuraman et al., 1985; Parasuraman et al., 1988;
Parasuraman et al., 1994b), and Its application to tourist satisfaction (e.g., Ryan, 1999), and to
tourist market segmentation (e.g., Diaz-Martin et al., 2000), this research further proposes a new
marketing use for benefits constmcts of sought and realised. Comparing benefits sought and
benefits gained measurements will be used to identify any gap between benefit expectations and
consumption experience benefits realised perceptions as a measure of tourist satisfaction or
dissatisfaction.
100

Chapter 2: Literature Review
This study will further investigate and empirically test whether it is possible to segment the cultural
experience tourist market using some or all of the motivational process constructs. Strong links
between consumer motivation and mari<et segmentation were identified In the review of tourist
motivation literature (section 2.9.4) and the market segmentation literature (section 2.12), but
similar to tiie plurality In tourist motivation theoretical approaches, no single "best" variable for
segmenting a market exists, nor can the same set of variables be used In every situation
(McKercher et al., 2002; Sung et al., 2000). Questioning the reliability of market segmentation
techniques, DIbb and Stern (1995) recommend caution must be used when Identifying segments to
ensure that spurious or unreliable segmentation techniques are not applied that produce segments
v\/here no valid causal link with behaviour Is evident. From the review of tourism segmentation
literature (section 2.12) it was seen that many tourist segmentation studies, group on one variable
such as activities undertaken, motivation or motives, benefits sought, or benefits realised, and
others use measures of motivation as segment group descriptors. In this study. It is proposed to
use a multi-dimensional segmentation approach integrating attitudinal as v /ell as behavioural
characteristics as advocated by Alzua et al., (1998) In their research of cultural and heritage tourism
niches for international travellers, to overcome a shortcoming of much market segmentation
research in a tourism context to date which has typically derived groups by clustering respondents
on the basis of only one dimension, that is, behaviours or attitudes.
A cross-cultural dimension will be considered in terms of understanding cultural experience tourist
motivation and the consumer profile characteristics that most effectively describe the market
segments. Cultural differences have been identified as having an impact on customer experiences
and evaluations of complex tourism services (e.g., Mattila, 1999; McKercher and Chow, 2001) and
are especially relevant to the tourism industry and to understanding tourist motivation and
behaviour as discussed in section 2.11.1 of this literature review. For example. In the context of
luxury hotels, hedonic dimensions of consumption experience were more important for Western
consumers than for their Asian counterparts (Mattila, 1999). In this study, culture will be primarily
operationalised by language spoken at home and country-of-residence.
A variety of researchers have noted that tourists' motivations are multiple (Crompton, 1979; Mayo
and Jarvis, 1981) and people might have different reasons to take either domestic or International
vacations (Kozak, 2002). Furthermore a motivation Is a dynamic concept and therefore may vary
from one person to another, from one market segment to another, from one destination to another
as well as from one decision-making process to the next (Kozak, 2002; Witt and Wright, 1992). In
addition to cultural experience tourists having different attitudes and motivations infiuencing and
determining their behaviour, it Is acknowledged in this study that some may have multiple
Influences for engaging in cultural experience tourism.
The next chapter outlines the conceptual framework for this study of cultural experience tourist
motivation, developed from this literature review and states specific research propositions and
hypotheses to be empirically measured and tested In this study.
101

Chapter 3: Conceptual Framewori<
Chapter 3 Conceptual Framework
The aim of this chapter is to develop a conceptual framewori< and models for researching the
tourist's motivational process for engaging In cultural experiences while holidaying In Melbourne,
Australia. This will be based on the previous literature review of research Issues and theories of
relevance to researching the tourist's motivational process and will address the research aims and
questions identified In Chapter 1.
3.1 Research Propositions
The research aims and related questions identified in Chapter 1 can now be expanded as follows:
1 what are tourists' pre-existing motivations towards attending different types of cultural
attractions and events in general and especially while travelling?:
1.1 what do tourists like attending in terms of different types of cultural attractions and
events? (What are their attitudes about different cultural activities and events?)
1.2 what drives tourists to go to cultural attractions and events while travelling?
(What are their driving motives?)
1.3 how do these pre-existing motivations, influence decisions to attend cultural
attractions and events? (What are the relationships between these attitudes and
motives?)
2 how do these pre-existing motivations towards cultural experiences Influence motivations for
attending one specific cultural experience in Melbourne that is successful in attracting
international and domestic interstate tourists:
2.1 what do tourist consumers expect from the experience? (What benefits are
sought from the experience?)
2.2 after the experience, what did the tourist consumers receive from the experience
and how satisfied were these tourist consumers with the cultural experience?
(What benefits did they get from the experience? By comparing these benefits
sought with the benefits gained, how satisfied were these tourist consumers
with the cultural experience?)
2.3 how do these expectations and consumption experience outcomes infiuence
motivation to attend cultural attractions and events and what pre-existing
motivations influenced these expectations and behavioural outcomes? (What are
the relationships between the expectations, behavioural outcomes and the pre-
102

Chapter 3: Conceptual Framework
existing attitudes and motives? Do pre-existing motivating factors attitudes,
motives and benefits sought Influence behavioural outcomes?)
3 who are these tourists attending cultural experiences while on holiday? (Are there cultural
language group differences In the cultural experience motivational process?)
4 can the reasons why tourists attend cultural experiences (that is, their motivation) be used to
segment the cultural experience tourist market into target maricet groups and to develop
effective marketing strategies for attracting tourists to cultural attractions and events? (Can the
motivational process components function as grouping variables to segment the cultural
experience tourist market? Can hedonic and other sub-dimensions of these motivational
process components be used as grouping variables to segment the cultural experience
tourist market? What are the statistically significant Influencing Independent variables for
cultural experience market segments: culture language spoken at home, travel group or trip
characteristics, or other socio-economic characteristics?
To operationallse the above research questions and address the literature review discussion and
findings, the following research propositions have been developed:
Proposition 1: More research of cultural experience tourist motivational process Is needed to gain a
better understanding of why tourists attend (or do not attend) cultural experiences, and the related
research questions of how their motivation infiuences their decision to attend, and what they are
Interested in attending. For selected significant international and domestic interstate tourist markets
In Melbourne, Australia identifying who are cultural experience tourists.
Proposition 2: Conceptually, the motivational process components for cultural experience tourists
comprise the pre-existing motivational constructs prior to the consumption experience of attitudes,
motives, and benefits sought, and the selected behavioural outcomes after the consumption
experience of benefits gained from the experience and satisfaction with the cultural experience.
More research of these motivational process constructs is needed to gain a better understanding of
the underlying dimensions for each of these constructs and the relationships between these
constmcts. Cultural differences will Influence these constructs, their underiying dimensions, and
the relationships between constmcts.
Proposition 3: A new use of benefits sought and gained is proposed In this research as a
method for determining satisfaction/dissatisfaction with the cultural experience.
Proposition 4: Other significant independent variables influence the motivational process and
those to be tested In this study include travel group, trip, and demographic characteristics such as
composition of the travelling party; length of stay; information sources used; repeat or first time
visitor (to Melbourne, Australia and the Queen Victoria Market). In particular, cultural differences
103

Chapter 3: Conceptual Framewort<
are considered an important Influencing variable to be tested for differences in relation to the
motivational process components and their underiying dimensions.
Proposition 5: The cultural experience tourist motivational process components and influencing
variables could be useful dimensions in a multi-dimensional segmentation of cultural experience
tourist markets, if differences can be found.
Proposition 6: Marketing strategies should be developed for each target market segment of the
cultural experience tourist market. (Proposition 6 is an outcome of the research).
3.2 IVIodels for Researching Cultural Experience Tourist Motivation
Understanding and modelling cultural experience tourist motivation and related behavioural
outcomes In order to develop effective marketing strategies is a complex area of tourism research,
with many ongoing debates and gaps In conceptual knowledge and empirical data as highlighted In
the previous literature review.
Two models (Figures 3.1 and 3.2) outiining the conceptual framework for the research have been
developed. They amalgamate those concepts Identified In the literature review as being of primary
relevance to understanding cultural experience tourist's motivational process in order to market
cultural and performing arts experiences to tourist markets, and they build on the related Typology
of Tourists and Cultural Experience Tourism (Figure 2.1), previously outiined.
3.2.1 Model of the Motivational Process to be Tested for Cultural Experience Tourists, Key Concept Definitions and Hypotheses
Figure 3.1 is a model of the key constructs as explained in the literature review.
3.2.1.1 Definitions of the Model Components
Culture is proposed as an Infiuencing variable on each of the measured constmcts. Each of these
constructs and variables has been discussed In the literature review where they were defined as
follows for tiie purpose of this study:
104

Chapter 3: Conceptual Framework
Figure 3.1 Model of the motivational process for cultural experience tourists
I attribute-based \ ^ dimension 1 J
N.B. P-S-P stands for psycho-socio-physiologically based; Source: Based on findings from the literature review
Culture will be defined as, "the configuration of learned behaviour and results of behaviour whose
component elements are shared and transmitted by the members of a particular society and in this
study will be operationalised by the cultural element of language spoken at home."
Attitudes will be defined as, "internal predispositions to respond with affective feelings towards or
against attending cultural experiences in everyday lifestyle as well as on holiday, created by beliefs,
values, needs, knowledge, learning, and experience, and broader socio-cultural attitudes about
different types of cultural experiences".
Motives will be defined as, "internal predispositions that arouse, direct and drive a person's desire
to attend cultural experiences while on holiday, that are created by attitudes and other stimuli, and
are based on a main desire for reaching the goal, or obtaining the reward of, hedonic consumption
experiences that involve the experiencing of emotion while engaging In leisure tourism activities".
Benefits Sought or Pursued and Benefits Gained or Realised are two separate constructs of
relevance to cultural experience tourist motivation and satisfaction. Benefits Sought are defined
as, "a normative expectation, that Is a fonvard-dlrected, intentional charged, tentative attitude
towards a particular consumption goal that contains some knowledge about the cultural experience
105
Chapter 3: Conceptual Framework
and the psycho-socio-physiological benefits to be gained by having the experience, and Is driven
by motives for attending the experience". Benefits Realised are defined as, "an improved psycho-
socio-physiological outcome resulting from the cultural consumption experience, the performance
of tangible and intangible attributes experienced, and the consequences of visitor's behaviours
during the consumption experience".
Satisfaction/Dissatisfaction is, "a judgement, attitude or psychological state arising from
consumer's disconfirmation of expectations and unexpected events. It Is a function of the degree of
congmency or disparity/disconfirmation between visitor's perceptions of the quality of their
experience and of the supplier's performance (regarding both quality and non-quality dimensions)
and visitor's evaluations of their normative expectations which serve as reference points for their
perceptions of quality of performance". Hence if people's expectations exceed their perceptions of
how a service perfonned, then the negative disconfirmation (performed worse than expected); if
their expectations are confimned (performed as expected), and if their perceptions exceed their
expectations then their expectations are positively disconfinned (performed better than expected).
3.2.1.2 Constructs of the Model
In the review of motivation literature and research, it was seen that understanding consumer
motivation is a very complex area, with many different concepts and measures of motivation used.
At least four approaches for understanding consumer motivation were Identified in the literature
review of consumer motivation In general and for tourist motivation in particular: needs-based (after
Maslow, 1943; Murray, 1938); values-based (after Rokeach, 1968; 1973); benefits-based (after
Haley, 1968); and expectancy theory-based (after Deci, 1985; Vroom, 1964). Many ongoing
debates were also identified such as the needs- versus values-based motivation theory (section
2.9.2), which was expanded to the attitudes, values or needs consumer behaviour debate (section
2.10.1.1), and then In the motivation related area of satisfaction, the satisfaction and service quality
debates and definitions (section 2.10.4.1). For the constructs identified within these various
debates, there are further ongoing debates about how they should be defined as discussed In the
literature review and how they should be measured as introduced In the literature review and to be
further discussed In Chapter 4, Research Method. Within the market segmentation area, there are
also ongoing debates about what variables should be used as the grouping variables, particulariy
the multiple versus single dimension segmentation approaches as discussed in the literature
review, section 2.12.1.1.
From the discussion of these debates about approaches to consumer motivation and mari<et
segmentation In Chapter 2, it was decided to adopt a process approach to motivation based on
Mannell's (1999) multi-constmct model from the leisure research literature which Included psycho-
socio-physiological constructs as well as related behavioural outcomes. The final constructs and
their relationships to be included in this study's proposed motivational process model for cultural
experience tourist motivation (Figure 3.1), were further based on the outcomes from the discussion
of the various construct debates, and a structural model of the motivation-related behavioural
106

Chapter 3: Conceptual Framework
outcome of the consumer satisfaction/dissatisfaction process (Figure 2.3) which in turn was based
on linkages tested in prior research (Table 2.16), especially tine findings by Churchill and Suprenant
(1982) on the determinants of customer satisfaction, and Yau's (1994) work on customer
satisfaction and cultural values In China. The proposed motivational process model in this research
was also developed following consideration of other models and theories of relevance to consumer
motivation and behaviour, especially Ajzen and Fishbein's theory of reasoned action (Ajzen and
Fishbein, 1980; Fishbein and Ajzen, 1975), Ajzen's later theory of planned behaviour (Ajzen, 1985)
discussed in section 2.10.1.2 on attitudes, and from the tourist literature, Goossen's (2000) hedonic
tourist motivation model (section 2.9.6.1).
The proposed model to be tested in this study (Figure 3.1) is primarily Interested in understanding
the cultural experience tourist motivational process and to do so by focusing on the motivational
process and selected related behavioural outcomes from attending and consuming cultural
attractions and events. This proposed model comprises the five centi'al constmcts of attitudes,
motives, benefits sought, and the behavioural outcomes of: benefits gained, and
satisfaction/dissatisfaction. The focus of this study commences with the attitude construct, although
it is acknovidedged that attitudes, in turn, are formed and shaped by antecedents such as beliefs,
values, needs, learning and experience. As there is abundant evidence In the literature endorsing
attitudes as constructs In their own right that can be defined and measured, and further
endorsement of attitudes concerning arts enthusiasm (Wells and Tigert, 1971) which it is argued In
this study are of particular relevance to understanding cultural experience motivation, antecedents
of attitudes are considered beyond the scope of this study and are not included In the conceptual
model.
In the market segmentation area, the proposed procedural model for researching segmentation of
the cultural experience tourist market (Figure 3.2) to be adopted in this study will be presented In
the next section (3.2.2), but is largely based on the work of Alzua et al., (1998) as discussed in
section 2.12.1 of the literature review. This study's procedural model incorporates Alzua et al.'s
(1998) recommendation for superior segmentation of markets to use multiple grouping variables In
stages, including both attitudinal and behavioural-related variables.
Comparisons between the proposed model and each of these models upon which it Is based, will
be briefiy discussed below by each of the major constructs in the model, and then for the
procedural model for researching market segmentation In the next section (3.2.2).
This cultural experience tourist motivation process model proposed In Figure 3.1, agrees with
Goossens' (2000) recommendations that a tourist motivation model should acknowledge and
operationallse emotional influences In its formation processes. From the discussion in the previous
literature review section of push and pull factors and their relationship with motivation and
emotions, one way of acknowledging and operationalising emotional Influences on tourism
motivation is to incorporate research of affective attitudes, and emotional needs, drives or motives
107

Chapter 3: Conceptual Framewori<
that are pushing tourist motivations as well as emotional benefits that are pulling tourists to be
motivated towards particular tourism activities, services and destinations (Goossens, 2000). It
diverges from Goossens' (2000) conceptual argument of the hedonic tourist motivation process in
three main ways. Firstiy by including attitudes rather than needs, values or beliefs. Secondly, by
Including motives and thirdly, by not including behavioural intentions.
Acknowledging tiie ongoing debate about whether attitudes, needs or values are the best measure
or variable for predicting and explaining consumer and tourist behaviour, this study will be using
attitudes as one of several constructs of relevance to the cultural experience tourist motivational
process. The constmcts of needs, values or beliefs, will not be Included. Including attitudes as a
separate constmct fully concurs with the long established view that attitudes are an important factor
In predicting behaviour (Ajzen and Fishbein, 1980; Fishbein and Ajzen, 1975), and even more
importantiy for the purposes of this study, that attitudes are an important factor in the motivational
factors that impact on a behaviour (Ajzen, 1991). As this proposed research is cross-cultural,
criticism of values failing to strongly link with consumer behaviour in a cross-cultural context (Chan
and Rossiter, 2003), further favoured incorporating an attitude construct. In full agreement with
Alzua et al. (1998) that attitudinal characteristics may trigger or drive behaviour, this study is
including an attitude construct as noted above. Their example of benefits sought by tourists being
an example of an attitudinal characteristic of relevance to segmentation of tourists Is further
supported in this study's inclusion of benefits as another construct within the motivational process
being tested in this study. In contrast with Alzua et al's study and conceptual model (1998), in this
study, benefits sought are treated as a separate psychographic construct to attitudes within the
tourist motivational process that can be more expectations-based or behavioural outcome-based
and can be related to the other constructs of attributes, motives, and satisfaction.
There are some other similarities and several differences between the motivational process model
for cultural experience tourists proposed in this study and Ajzen and Fishbein's (1980) theory of
reasoned action. In common, they both include the variable, attitudes, and agree that beliefs
underiie attitudes. They are also both interested in the relationship between attitudes and
behaviour but Ajzen and Fishbein (1980) are focusing on predicting behaviour by measuring
attitudes toward behaviour, and choice intentions with their model comprising the four constructs of
beliefs, attitudes, intentions, and behaviour. In their theory, a correspondence is acknowledged
betiA/een attitude toward behaviour and between attitude and intention, by which they mean, "a
person's judgment that performing the behavior is good or bad, that he is In favor of or against
performing the behavior" (p.56). In contrast with this proposed study's definition of attitudes
emphasising the affective or feelings responses, Ajzen and Fishbein (1980) consider the crucial
aspect of attitudes Is evaluation and suggest that attitudes be viewed as overall evaluations.
Reasons for, and the consequences of, a person's attitude evaluation, such as feelings, beliefs,
motivations, perceptions and Intentions, are important factors which they prefer to treat as separate
concepts that can be related to attitudes (Ajzen and Fishbein, 1980).
108

Chapter 3: Conceptual Framework
In contrast with many models of consumer satisfaction/dissatisfaction (e.g., Churchill and
Suprenant, 1982; Yau, 1994) and tourist satisfaction (e.g.. Baker and Crompton, 2000; Howat et
al., 2002; Lee et al., 2004b) as previously discussed In section 2.10.4.3 of the literature review on
the satisfaction constmct, the proposed model of the motivational process for cultijral experience
tourists to be tested in this study does not include an intentions constiTJct per se, nor does it directiy
measure consumer satisfaction/dissatisfaction, the consumption experience, or disconfirmation.
Rather it proposes a new application of the benefits sought and benefits gained constructs to Infer
satisfaction/dissatisfaction.
3.2.1.3 Attitude Construct
Goossens argues that the hedonic tourist motivation process should not Include attitudes and that
motivation should be operationalised as behavioural intentions as in attitude theory (Fishbein and
Ajzen, 1975), rather than as motives. The "attitude" constmct Is not Incorporated In Goossen's
model of the hedonic tourist motivation process because he considers it does not fit In the
"experiential" view of consumer research (Holbrook and Hirschman, 1982), although he
acknowledges that an attitude concept Is very functional in research on information processing and
marketing stimuli (Holbrook and Batra, 1987). This argument implies that attitudes are more
cognitive than affective, whereas they can incorporate both components and therefore can be
relevant to both, depending on how they are defined as was discussed In the literature review
section on attitudes. Attitudes are included in this study's proposed model for reasons outiined
below and their definition in this study emphasises affective feelings which cleariy fits with the
experiential view of consumption (Hirschman and Holbrook, 1982; Holbrook and Hirschman, 1982).
In the proposed conceptual model for cultural experience tourist motivational process to be tested
in this study, attitudes towards attending and consuming cultural experiences are included rather
than needs which are very difficult to measure or values and beliefs which may be considered to
underiie attitudes. The advantage of attitudes are that they emphasise the consumer's affective
response, feelings or emotions towards an object or the experiential aspects of consumer
behaviour which is an under-researched area as much of the existing research of consumer
behaviour has tended to focus on how consumers react to the functional, utilitarian products of
products and services. This uni-component view of attitudes refers to the affective or feelings
responses that consumers have toward an object or a general evaluation of an object. It is the
basis of eariy attitude measurement scales (Likert, 1932; Thurstone, 1931), experienced a
resurgence in the 1970s (Ajzen and Fishbein, 1980), and Is still common among consumer
behaviour researchers today. It is considered to be in contrast with the multi-component view
which conceptualises attitudes in the age-old trilogy of cognition, affect, and conation (Cartwrlght,
1949; Katz and Stotiand, 1959; Smith, 1947). Other authors though, acknowledge the Thurstone
and Likert scales are considered to infer a person's attitude by relying on beliefs or Intentions (i.e.,
cognition or conation) which Implies that these standard scaling procedures already take Into
account cognitions, conations, or both (Ajzen and Fishbein, 1980, p.21).
109

Chapter 3: Conceptual Framework
By the late 1950s, the multi-component view of attitude was adopted almost universally, yet low
empirical relations have been found between measures of attitude and overt behaviour fi^om the
late 1950s onwards (Ajzen and Fishbein, 1980). Some researchers attributed this to the "otiner
variables" approach whereby attitude is only one of a number of factors that influence behaviour
and other variables must be taken into account, but a systematic way is lacking for deciding which
of the many "other variables" might be relevant for a given behaviour. More Importantiy, the
addition of other variables does little to advance the understanding of the attitude-behaviour relation
Itself (Schuman and Johnson, 1976). This led other authors to develop a different Interpretation of
the other variables approach whereby the relation between attitude and behaviour is moderated by
other variables (Fazio and Zanna, 1978; Regan and Fazio, 1977). Ajzen and Fishbein present an
alternative view of the attitude construct in their theory of reasoned action (Ajzen and Fishbein,
1980; Fishbein and Ajzen, 1975). They restrict the term "attitude" to a person's evaluation of any
psychological object and draw a clear distinction between beliefs, attitudes, intentions, and
behaviours. They suggest that appropriate measures of attitudes are strongly related to action, and
that any behavioural criterion can be predicted from attitude - be it a single action or a pattern of
behaviour - provided that the measure of attitude corresponds to the measure of behaviour. The
significance of moderating variables and their place in the theory of reasoned action relates to the
stability of the Intentions dimension.
Furthermore, the uni-component view of attitudes emphasising the affective or feelings responses
that consumers have toward an object could also be termed the 'hedonic perspective', which is
considered especially relevant to hedonic-related consumption experiences such as cultural
experiences (Hirschman and Holbrook, 1982; Holbrook and Hirschman, 1982).
Within this uni-component view of attitudes. It is further proposed in the literature review (section
2.10.1.2) that cultural enthusiasm is an underlying dimension of attitudes that conceptualises
interest in and liking for different types of cultural experiences and is based on their past experience
of arts and cultural experience consumption (at home and on holidays) which In turn creates
cultural knowledge and cultural capital. It is hypothesised in this study that multl sub-dimensions
based on cultural and arts enthusiasm for engaging in different types of cultural experiences
underlie the attitude construct. Furthermore, particular types of socio-psychological outcomes are
associated with cultural experience consumption as seen In the literature review of relevance to the
cultural experience leisure motivation, consumption and outcomes (e.g., tourist motivation
approaches sections 2.9.5.1 on push/pull factors and 2.9.5.2 on intrinsic and extrinsic motivation;
and sections 2.10 on defining and measuring motives, benefits sought and benefits gained),
therefore another hypothesised underiying dlmenslon(s) of cultural experience attitudes Is a liking
for particular types of socio-psychological outcomes that are associated with cultural experience
consumption.
In summary, from the preceding discussion, several general statements about the attitudes
construct in this study can be proposed. Attitudes are a uni-component construct combining
110

Chapter 3: Conceptual Framework
cognition, affect and conation, but emphasising the affective or feelings responses. However,
within this uni-component structure there are underiying multi-sub-dimensions based on
enthusiasm for engaging in different types of cultural experiences and associated with this
consumption, for particular types of socio-psychological outcomes associated with cultijral
experience consumption. Cultural differences are expected In the underiying dimensions of
attitudes for attending cultural experiences, especially for Western English-speaking tourists
compared with Asian tourists (Chinese- or Japanese-speaking). As cultures differ by language
spoken at home, further cultural differences are expected between the Chinese-speaking and
Japanese-speaking Asian tourists. Attitudes about cultural enthusiasm for different types of cultural
experiences can be expected to have an influencing relationship with motives for attending cultural
experiences while on holiday, whereby the more strongly consumers like attending cultural
experiences in general, and experiencing the outcomes associated with cultural experience
consumption, the more strongly motivated they will be to attend cultural experiences while on
holiday. Similariy, attitudes can be expected to have an influencing relationship with benefits
sought from cultural experience consumption.
From these general statements, the hypothesis for the attitudes construct to be tested in this study
Is:
H1 The underlying dimensions for the attitudes construct will primarily include cultural
experiences and socio-psychological outcomes.
3.2.1.4 Motive Construct In the proposed motivational process model to be tested in this study, motives are included instead
of behavioural intentions which is another diversion from both Goossens' (2000) hedonic tourist
motivation process, and Fishbein and Ajzen's attitude theory (Ajzen and Fishbein, 1980; Fishbein
and Ajzen, 1975).
The literature review Identified that broad or general theories of motivation developed by Murray
(1938) and Maslow (1943; 1954) have led some authors to posit that motivation is a generic
concept. It also Identified a trend In consumer research over the past 20 years away from
developing broad theories of motivation, toward creating more restricted midrange theories that
explain narrower facets of human behaviour (Mowen and Minor, 1998). These midrange theories
of motivation acknowledge that motives can be either more physiologically-based or more
psychologically or cognitively oriented, with some midrange theories tending to focusing on one
orientation more than the other and other midrange theories such as motivation for hedonic
experiences, incorporating both orientations (Mowen and Minor, 1998).
Ajzen and Fishbein (1980) include behavioural intentions in their theory of reasoned action, rather
than motives or some other measure of motivation, because their theory is based on predicting
behaviour, and in their view. Intention Is the immediate determinant of behaviour, and when an
appropriate measure of intention is obtained it will provide the most accurate prediction of
111

Chapter 3: Conceptual Framework
behaviour. They further suggest that all behaviour involves a choice that can be measured as
choice Intentions. These bases of their theory of reasoned action, align it with predicting behaviour
theory and possibly, choice modelling theory than motivational process theory, the latter being of
primary Interest to this study.
Recent research revising the theory of reasoned action (TF?A) by FItzmaurice (2005), posits
Incorporation of consumers' motivations to encapsulate affective variables in predicting behaviour
and to broaden the cognitive approach of Ajzen and Fishbein's model. Of the three variables
included to reflect motivations, one of these Is hedonic involvement which further emphasises the
relevance of hedonic dimensions of motivation for consumer behaviour in general with the context
of the revision research being aerobic activities. The other constructs tested in this revision were
the TRA constructs of attitude (as a cognitive evaluation and not an affective measure and with a
hypothesised path only to intention), subjective norm and intention. An additional affective
construct of eagerness encapsulating emotional commitment towards a behaviour was
incorporated as a mediating variable linking motivation variables to Intentions (behaviour). These
revisions endorse the relevance of motivation and affective evaluations to understanding and
predicting behaviour, and the relevance of hedonic dimensions to consumer motivation.
In summary, from the preceding discussion, several general statements can be proposed about the
motives construct within the motivational process model for cultural experience tourists. It Is based
on the midrange theories of tourism motivation and therefore includes some psychological and
some physiological hedonic dimensions, largely because of their applicability to consumer
behaviour in general as noted In the TRA revisions, and particulariy to cultural consumption as
discussed in section 2.9 of the literature review.
That motives are a multi-dimensional construct was established in the literature review (section
2.10.2.5), including psycho-socio-physlologically-based and attribute-based sub-dimensions and
within the sub-dimensions some are seeking-related, while others are escape-related. Cultural
differences are expected in the underiying dimensions of motives for attending cultural experiences,
especially for Western English-speaking tourists compared with Asian tourists (Chinese- or
Japanese-speaking). As cultures differ by language spoken at home, further cultural differences
are expected between the Chinese-speaking and Japanese-speaking Asian tourists.
That attitudes have an Influencing relationship on motives was acknowledged in the previous
section's generalised statements about the attitudes construct within the cultural experience
motivational process model. It is further proposed that motives drive tourists to attend cultural
experiences In general and while on holiday and also have an influencing relationship with the
expectations of benefits sought from attending a specific cultural experience, whereby the more
strongly tourists are motivated to attend cultural experiences In general while on holiday, the higher
the expected benefits sought from the specific cultural experience. These Infiuencing relationships
will not be directly tested In this study.
112

Chapter 3: Conceptual Framework
From these general statements, the hypothesis for the motives constmct to be tested in this study
Is:
H2 The underlying dimensions for the motives construct will primarily include hedonic,
seeking and escaping related dimensions.
3.2.1.5 Benefits and Satisfaction Constructs
The proposed model for cultural experience tourist motivational process to be tested in this study,
also Includes the constmcts of expected benefits sought and gained because of their relevance to
tourism motivation and also to the additional related behavioural outcome of visitor
satisfaction/dissatisfaction with the cultural experience. Benefits sought, as defined in this study,
are equated with visitor's normative expectations about the psycho-socio-physiological benefits to
be gained by having the cultural experience, and benefits gained, are visitor's perceptions of their
Improved psycho-socio-physiological outcomes resulting from the cultural consumption experience.
In summary, several general statements can be proposed about the benefits sought and benefits
gained constructs within the motivational process model for cultural experience tourists. That
benefits sought and benefits gained are multi-dimensional constmcts was established in the
literature review (section 2.10.3.7) with commonly found dimensions including psycho-socio-
physlologlcally-based and attribute-based sub-dimensions. Within the sub-dimensions, it is further
proposed that the underlying dimensions will be primarily escape-related, seeking-related, and
hedonic-related similar to the motives constmct propositions. Cultural differences are expected in
the underiying dimensions of benefits sought and benefits gained for attending cultural
experiences, especially for Western English-speaking tourists compared with Asian tourists
(Chinese- or Japanese-speaking). As cultures differ by language spoken at home, further cultural
differences are expected between the Chinese-speaking and Japanese-speaking Asian tourists.
That attitudes and motives have an Influencing relationship on benefits sought was acknowledged
in the previous section's generalised statements about the attitudes and motives constructs within
the cultural experience motivational process model, but these relationships will not be directiy
tested in this study. That benefits sought have an influencing relationship on benefits gained is also
proposed In the motivational process conceptual model. Similarly, benefits sought would have an
Influencing relationship on the consumption experience per se, and In turn the consumption
experience would have an Influencing relationship on the benefits gained as acknowledged In the
literature review (2.10.4.1). All of these relationships will not be directly tested in this study.
From these general statements, the hypothesis for the benefits sought and benefits gained
constmcts to be tested in this study is:
H3 The underlying dimensions for the benefits sought and benefits gained constructs
will primarily include hedonic, seeking and escaping related dimensions.
113

Chapter 3: Conceptual Framework
Visitor satisfaction/dissatisfaction with the cultural experience is another behavioural outcome
variable of interest to this study as depicted In the motivational process conceptijal model.
Because satisfaction/dissatisfaction has been defined in this study as arising from disconfinnatlon
of expectations and unexpected events, an Indirect method for measuring satisfaction will be used
whereby satisfaction/dissatisfaction will be inferred from the congmency or disparity between
benefits sought (expectations of psycho-soclo-physlologically-based benefits) and benefits gained
(perceptions of Improved psycho-soclo-physlologlcally-based outcomes).
3.2.1.6 Culture Construct
In section 2.11.1.1 of the literature review, culture as measured by language spoken at home is
identified as an Independent Influencing variable on consumer motivation and related behavioural
outcomes. It is therefore proposed that cultural language group differences will apply to the
motivational process constmcts and their underiying dimensions, and It is proposed to test these
relationships in this study.
H4 The cultural experience motivational process constructs of attitudes, motives,
benefits sought and benefits gained will differ by culture.
Three specific cultural-related research hypotheses to be tested in this study are:
H4a: There is significant difference between Western and Asian tourists for each of the
four cultural experience motivational process constructs of attitudes, motives,
benefits sought, and benefits gained.
H4b: For Western tourists and each of the four cultural experience motivational process
constructs of attitudes, motives, benefits sought and benefits gained, there is not
a significant difference between the different cultural groups of English-speaking
tourists: domestic interstate tourists in Australia, and international tourists from
New Zealand, North America, and United Kingdom and Ireland.
H4c: For Asian tourists and each of the four cultural experience motivational process
constructs of attitudes, motives, benefits sought and benefits gained, there is a
significant difference between the different cultural groups of international tourists
from Asia, namely, Chinese-speaking, and Japanese-speaking.
3.2.2 Procedural Model for Segmentation of the Cultural Experience Tourist
Market
This study on understanding cultural experience tourist motivation Is also Interested in doing so for
the purpose of segmenting the cultural experience tourist market. As outiined in the procedural
model for researching segmentation of the cultural experience tourist market and developing
effective marketing strategies (Figure 3.2), an understanding of who, why and how is needed and
this involves an understanding of the complex determinants and influencing factors of cultural
114

Chapter 3: Conceptual Framework
experience tourist motivation as this Is what triggers and drives actual behaviour. Differentiating
mari<et segments by attitudinal as well as behavioural variables is recommended (Alzua et al.,
1998) and this study proposes including both types of variables.
This study proposes interpreting the findings of the motivational process constmcts, their underiying
dimensions and cultural group differences being tested in this study (Hypotheses 1-4) and Identified
In Figure 3.1, as multi-stage segmentation grouping variables, by examining which of these
variables function as segment differentiation characteristics and show significant differences
between segments (Figure 3.2).
If there are distinguishable sub-groups within any of these variables, marketing theory recommends
that unique marketing strategies can then be developed for each target market segment.
Determining the target markets Is an additional step in the process, once the segmentation has
been performed. Then marketing strategies can be developed for each of the Identified and
selected target markets.
No hypotheses for these steps in this stage of the procedural model can be developed
because the findings in this stage are an outcome of the previous research.
Therefore a modified version of the three-step model originally developed by Morrison et al. (1994)
for segmenting travel markets and adapted by Alzua et al. (1998) for segmenting cultural and
heritage tourism for UK outbound international ti'avellers, is of relevance to developing effective
marketing strategies to attract tourists to cultural experiences at cultural attractions and events
(Figure 3.2). This procedural model uses various individual segmentation bases or criteria in three
sequential roles to divide the travel market into its principal subdivisions, to differentiate travellers,
and then to describe travellers within segments. By using the motivational process constructs In
Figure 3.1 In step two of the procedural model (Figure 3.2), this proposed conceptual framework
Integrates both attitudinal and behavioural characteristics as part of the segmentation methodology
as recommended by Alzua et al. (1998). While Alzua et al. (1998) used the attitudinal characteristic
of benefits sought and the behavioural characteristic of activities at the destination including
culture/heritage-related activities to differentiate the UK outbound travellers into culture/heritage
market segments, this study proposes testing the motivational process constmcts (attitudes,
motives, benefits sought and gained) and the Independent variable of cultural language group
(English-speaking, Chinese-speaking and Japanese-speaking) as segmentation grouping variables
for the cultural experience tourist market. The findings from the second and third stage of the
market segmentation procedural model will be compared with previous research of cultural tourists
and cultural tourist motivation Identified in the literature review.
115
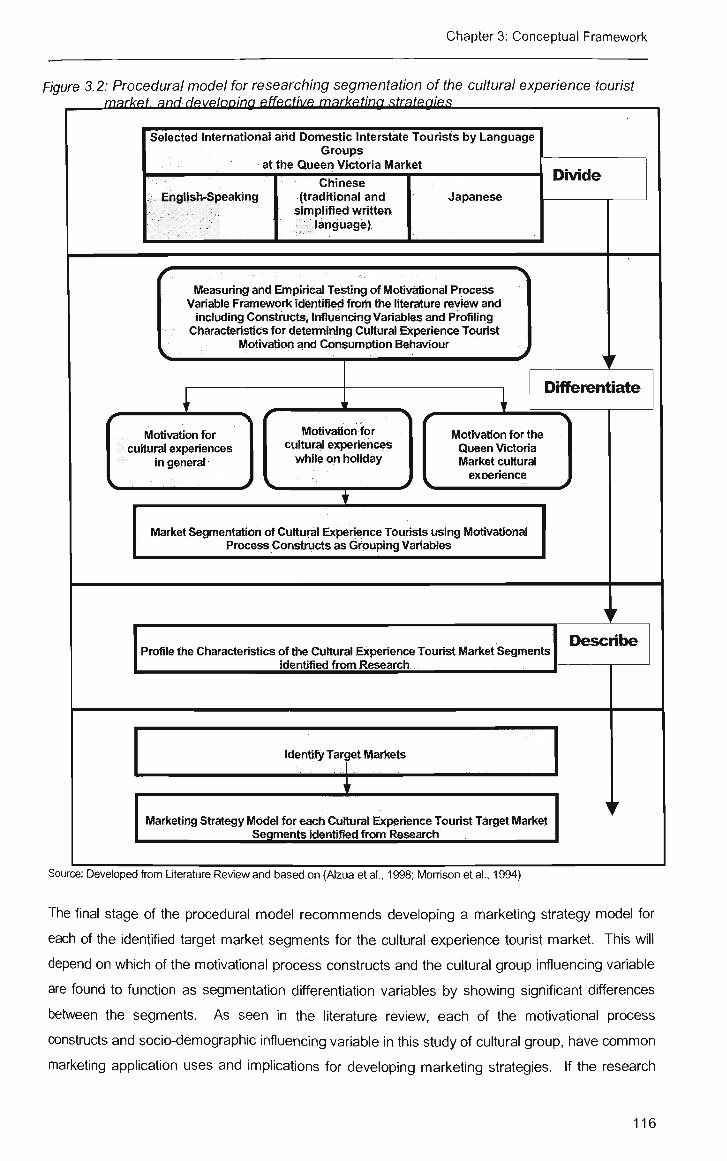
Chapter 3: Conceptual Framewori<
Figure 3.2: Procedural model for researching segmentation of the cultural experience tourist markat and Hf^vfilnninq affRCfivR marketing Rtmtt^gifi^
Selected Intemational and Domestic Interstate Tourists by Language Groups
at the Queen Victoria Market
English-Speaking Chinese
(traditional and simplified written
language)
Japanese
Divide
Measuring and Empirical Testing of Motivational Process Variable Framework identified from the literature review arxi
including Constructs, Influencing Variables and Profiling Characteristics for determining Cultural Experience Tourist
Motivation and Consumption Behaviour
Motivation for cultural experiences
in general
Motivation for cultural experiences
while on holiday
Differentiate
Motivation for the Queen Victoria Market cultural exoerience
Market Segmentation of CuKural Experience Tourists using Motivational Process Constructs as Grouping Variables
Profile the Characteristics of the Cultural Experience Tourist Market Segments identified from Research
Describe
Identify Target Markets
Marketing Strategy Model for each Cultural Experience Tourist Target Market Segments identified from Research
Source: Developed from Uferature Review and based on (Alzua et al., 1998; Morrison et al., 1994)
The final stage of the procedural model recommends developing a marketing strategy model for
each of the Identified target market segments for the cultural experience tourist mari<et. This will
depend on which of the motivational process constructs and the cultural group Infiuencing variable
are found to function as segmentation differentiation variables by showing significant differences
between the segments. As seen in the literature review, each of the motivational process
constmcts and socio-demographic Influencing variable In this study of cultural group, have common
marketing application uses and implications for developing marketing strategies. If the research
116

Chapter 3: Conceptual Framework
findings support the eariier stated hypotheses, then It can be concluded that different cultures
require different marketing and promotion strategies to encourage attendance at cultural
experiences.
117

Chapter 4: Research Method
Chapter 4 Research Method
4.1 Introduction
In the previous chapter, research models and conceptual frameworks were discussed and the
research hypotheses for this study were presented. The purpose of this chapter is to describe the
research methods that will be used for the study and the following discussion Includes a definition of
the target population, background to the research site, an overview of the sampling frame and
procedures; and details of the data collection instruments, scaling techniques and data analysis
methods. It also considers Issues associated with measuring the consumer motivational process
constructs and Infiuencing variables of interest to this study, and specific research method and
measurement issues associated with undertaking cross-cultural research.
4.2 Research Approach
Consumer motivation and behaviour research has tended to take two distinct general approaches.
One of these approaches Is the case study approach whereby the consumer's motivational
processes are researched in relation to a particular experience, with the consumers usually sampled
in-situ at the experience, either pre-, post- or during their consumption of the experience. The other
main approach researches consumers' perceived or expected motivations towards broad categories
of experiences or one or more specific experiences, all of which may be real or hypothetical, with the
consumers usually sampled off-site either at home, on-street (e.g.. Prentice et al., 1997) or on arrival
or departure from the destination. Both approaches have been widely used, especially in relation to
tourist consumers. Strengths and limitations apply to each approach as will be discussed below
which is why both approaches were closely considered as methods for this research.
The approach used in this research Is a combination of both methods. It is essentially a case study
approach applied as a rigorous method of research (Yin, 2003) with selected tourist populations
sampled in-situ at one particular cultural experience and some of the motivational process constructs
relating specifically to their consumption experience of the cultural site. Furthermore, the research is
being conducted at one cultural experience site In Melbourne, Australia and therefore it is largely a
case study of the cultural experience motivational process for tourists to Melbourne. These tourists'
motivational process for travelling to Melbourne In the first place may have been motivated to greater
or lesser degree by the cultural experiences available in Melbourne but such pull factors of the
destination are not a focus of this research per se. Rather, as previously acknowledged In Chapter 2,
Melbourne is renowned for its cultural attractions and events which was one of the justifications for
undertaking the research at this destination. Where this research approach extends beyond a strict
case study approach, is that some of the research questions for other elements of the cultural
experience motivational process, such as attitudes and motives for attending cultural experiences.
118

Chapter 4: Research Method
refer to broad, generic types of cultural experiences, including the in-situ cultural experience. This
combination approach is considered the best way to undertake research of tourist's motivational
process towards attending a variety of cultural experiences while on holiday as well as to gain an
Indepth understanding of their motivational process in relation to one specific cultural experience. The
conceptual model of the tourist's cultural experience motivational process presented in this study Is
based on several constmcts and one of the purposes of this research Is to explore the relationships
between the constiucts. One's motivational process for experiencing one specific experience could
be influenced by one's attitudes towards cultural experiences generally and to various types as well
as towards the specific cultural experience in question.
The case study approach is appropriate when the research being conducted focuses on
contemporary phenomenon within some real-life context especially when the boundaries between the
phenomenon and context are not cleariy evident, when the investigator requires little or no control
over behavioural events, and where the fonn of the research question is how or why (Yin, 2003).
These variables are very relevant to this study of tourist's motivational processes towards attending
cultural experiences and the research questions that have been posed for study In this research.
Other benefits of the case study approach are that It provides the researcher with a depth of
Information that cannot be gained from other methodological approaches (Yin, 2003). As this study
involves the testing of a new conceptual model for cultural experience tourist's motivational
processes, a research approach that will provide depth of Information is considered a priority for this
study. Another benefit of the case study approach is that the research Is based on consumer's
consumption of one particular experience that they have in common, whereby the focus of the
research is how their consumption of that experience may differ. A commonly identified limitation of
the case study approach is that generalisation of the results Is tentative (e.g. Zikmund, 2000),
however the research findings from case study research aim to expand and generalise theoretical
propositions rather than generalising results to populations or universes (Yin, 2003).
The other main research approach In relation to consumer motivation and behaviour frequentiy
focuses on sampling consumers at locations where sufficient numbers of them can be found such as
at airport lounges, shopping mall Intercepts or in their homes and asking them about their motivation
and behaviour towards experiences that typically have occun-ed or are likely to occur at another time
and place. This approach is loglstically appealing In situations where it may be difficult to identify
sufficient numbers of the populations being sampled. There appeared to be advantages and
disadvantages, especially loglstically. In predominantly adopting this approach in this study that
focuses on eight selected populations of International and domestic Interstate tourists and their
motivational process towards multiple types of cultural experiences. Airport lounges are an attractive
site for intercepting eligible tourists and so this research approach was considered an appropriate one
to use in this study. Investigations into implementing this research method, revealed access to
international airports lounges has become more difficult in recent years due to increased airport
119

Chapter 4: Research Method
security and some airports have further restricted all on-site marketing research to exclusive
agreements with professional marketing research companies. A further limitation of this proposed
research was that some of the motivational process constmcts involved the research to be
undertaken before and after the consumption of the cultural experience which would have required
Inten/iewing tourists In departure lounges at their destination of origin or in the an-ival hall at
Melbourne international airport and then again as they were departing the destination in the airport
departure lounges. Discussions were undertaken with a professional market research company that
has contracts with many international airports worldwide including Melbourne, but the expense
associated with undertaking research at airports now favours syndicated research with the partners
sharing the costs of gaining access and undertaking the research, and this presented additional
obstacles of needing syndicated research partners interested in undertaking research projects at the
same airports and within similar timeframes. A further limitation of this study using airport lounges as
the sampling site. Is that it biases the research towards tourists that travel by air transport. While this
Is not an Issue for International tourists to Australia as the majority arrive by air transport, it would be a
limitation for the domestic interstate tourists many of whom travel by car, bus or train as well as by air.
One other disadvantage of the non-case study method approach In this area of consumer
motivational research Is that consumers' cultural experiences or lack of them would be varied, and
responses to questions about the nature of those experiences would depend on each respondent's
experiences.
One other research method approach would be a variation on the case method whereby the selected
tourist populations are sampled at multiple cultural attractions. This method would have been
attractive If the research focus was to compare tourists' motivational process towards attending a
small number of attractions either of a similar type or different cultural experiences. Although this
method has been frequently used such as one of three research methods in recent research of
Chinese tourists' experiences at tourism attractions in Victoria, Australia (Weiler and Yu, 2004; Yu
and Weiler, 2006), obtaining permission from the cultural attractions' management to undertake
research of their tourist visitors can be difficult. Furthennore, for many cultural attractions in Australia,
Identifying sufficient numbers of the selected tourist populations of interest to this study would be
extremely difficult.
In light of the above discussion, the best overall research approach was considered to be obtaining
permission to conduct the research at one tourist attraction site that fulfilled several criteria. In
particular It needed to attract sufficiently large numbers of tourist visitors from the selected research
populations of Interest to this study, and to be suitable for functioning as a case study approach of
cultural experience whereby some of the constmcts of relevance to consumer's motivational
processes towards cultural experiences would be researched In relation to their experience of the site.
Permission to conduct the research on-site at the Queen Victoria Market (QVM) enabled these
various criteria to be met as discussed further in section 4.3.2 on the research site.
120

Chapter 4: Research Method
Multiple research strategies are further proposed in this study where in addition to the case stijdy
research method, a stmctured survey method is proposed. Survey research allows primary data to
be gathered and assembled specifically for the research project at hand (Zikmund, 2000). Similar to
the case study approach, the survey approach is appropriate when the research being conducted
focuses on contemporary phenomenon within some real-life context especially when the boundaries
between the phenomenon and context are not clearly evident, and when the Investigator requires little
or no control over behavioural events (Yin, 2003). Sun/eys have the additional advantage that they
can be designed to have multiple objectives. They are suitable for gathering descriptive information
of relevance to describing a particular activity and learning the reasons for It (Zikmund, 2000), and
they are also appropriate where the form of the research question is who, what, where, how many or
how much (Yin, 2003). Although mostiy descriptive, surveys can be designed to provide causal
explanations or to explore ideas (Zikmund, 2000). As all of these variables are very relevant to this
study of tourist's motivational processes towards attending cultural experiences and the research
questions that have been posed for study in this research, a combined-metiiods research design will
be used.
In this study, the use of a survey method together with a combination generic and case study
approach method will enable the testing of a new conceptual model for tourist's cultural experience
motivational processes. As the conceptual model of the tourist's cultural experience motivational
process presented In this study is based on several constmcts, one of the main purposes of this
research Is to develop a survey Instrument for measuring the constructs and testing the underiying
dimensions of each constiuct. This combined methods approach will enable generic and In-depth
Information to be gathered about each of the constructs that can then be tested for underiying
dimensionality and structural relationships.
The research design for this study also Incorporates multiple research strategies by partially being
exploratory, descriptive, and confirmatory, and also being more explanatory and diagnostic than
predictive. In light of how little research has been undertaken to date In this topic, especially with a
cross-cultural focuK as discussed In Chapter 2 Literature Review, exploratory, descriptive and
confirmatory research is appropriate to gain insights into cultural differences between different tourist
markets' Interest in and motivation for cultural experiences. Identification of the variables which are
relevant to the motivational process for cultural experiences and which may affect cultural group
differences, and an understanding of relations between these variables are further appropriate alms
to which this largely exploratory, descriptive and confinnatory research design Is well suited.
4.3 Target Population, Research Site and Sampling Frame
4.3.1 Population Units and Elements
121

Chapter 4: Research Method
From the total population of international and domestic interstate tourists to Melbourne, eight
population units have been selected for sampling with the sampling element being individual tourists
within each of tiiese groups. For the purpose of this study, tourists were defined as a temporary
visitor to Melbourne staying at least one night and not more than 12 months
The eight population units comprised five groups of international tourist populations based on
language spoken at home and countiy or region-based place-of-residence as the dimensions of
culture to be tested, and three domestic tourist populations based on state-based place-of-residence.
Three language groups based on language spoken at home were Identified for sampling: Japanese,
Chinese (in Mandarin spoken form and simplified written form) and English-speaking International and
national interstate tourists. In turn, these three language groups also comprised distinct geographic
tourist mari<ets based on the tourist's place-of-residence from which eight stratified groups have been
selected as a focus of this study: the five international tourist markets of New Zealand, North
America/Canada, UK and Ireland, Asia (Chinese speaking), and Asia (Japanese speaking), and three
domestic interstate tourist markets of New South Wales, Queensland and South Australia.
These International tourist markets have been selected for their current size and ranking or their
recent growth as inbound markets to Austi-alia and Melbourne, Victoria as discussed In Chapter 1,
Section 1.5. The two selected Asian language groups for international tourists (Japanese and
Chinese speaking) are further based on six Asian markets of particular significance to tourism in
Australia and also in Melbourne, Victoria: Japan, Singapore, Hong Kong and Malaysia for their
current size and ranking as inbound markets, and Mainland China and Taiwan for their recent growth
as discussed in Chapter 1, Section 1.5.
International tourists from the UK and Ireland, and to a lesser extent international tourists from NZ
might be considered culturally similar to Australian resident populations, especially as many
Australians are of Anglo-Celtic background with six percent of all Australians born in the United
Kingdom (Australian Bureau of Statistics, 2005a). However, differences in attendance at cultural
venues and events by Australian residents' aged 18 years and over by birthplace have been found
((Australian Bureau of Statistics, 2003, 2005a). This research found a higher percentage of residents
born overseas In the main English-speaking countries attend museums, art galleries and all forms of
performing arts. This category of residents Is defined as the main countries from which Australia
receives, or has received, significant numbers of overseas settlers who are likely to speak English.
These countries are the United Kingdom and Ireland, New Zealand, Canada, the United States of
America and South Africa (Australian Bureau of Statistics, 2003). Twenty two percent of all Australian
residents were born overseas (Australian Bureau of Statistics, 2005a), with the top four overseas
birthplace groups being the United Kingdom (6% of all Australian residents), followed by New Zealand
(2%), and Italy and Vietnam (1% each). These findings suggest sufllcient cultural differences
between Australian resident populations born in Australia and those originating from the UK, Ireland
and NZ to test in this research whether there are cultural differences between tourists from these
122

Chapter 4: Research Method
population units in their interest In, and motives for, attending cultural attractions and events while
holidaying in Melbourne, Australia. The research of Australian resident attendance at cultural venues,
further found Australians born overseas in countries other than the main English-speaking ones, are
less likely to attend than residents born In Australia (Australian Bureau of Statistics, 2003). These
findings suggest further cultural differences in attendances at museums, art galleries and all fonns of
performing arts by place of birth particularly wan-anting research of tourists from countries other than
the main English-speaking ones who may be less likely to attend cultural attractions and events than
Interstate domestic tourists.
The national Interstate markets have been selected for their significance as the three largest interstate
markets for Victoria and because existing quantitative research of the motivations and behaviours of
those interstate visitors who attend cultural attractions and events (Tourism Victoria, 2004a), Indicates
potential to increase the attendances by these visitors at most cultural attractions, especially the
performing arts events (also discussed in Chapter 1, Section 1.5).
4.3.2 Research Site
The selected tourist market population samples will be taken on-site at the Queen Victoria Market
(QVM) because as evidenced in Chapter 1, section 1.5, markets are an important attraction for tourist
visitors in Australia and Melbourne, Victoria, where they prominentiy feature in lists of most popular
activities undertaken by tourists at the destination. The QVM is a large public site, free of entry
charge and has numerous entry and exit points. It is located in Melbourne's CBD and so is
particulariy centrally located and easily accessible to tourists on foot and by public transport.
Melbourne, Australia Is the geographic area of focus in this study for the numerous reasons
discussed in Chapter 2, Section 2.5, but particulariy because it Is renowned as a 'cultural capital of
Australia', hosting major annual arts festivals and Is home to many major cultural and perfonning arts
companies, venues and facilities. In addition, it attracts a substantial number of International and
Interstate visitors of neariy 6 million per annum (Tourism Victoria, 2006b, 2007) which represents a
sizable potential market for cultural attractions and events especially when compared with
Melbourne's resident population of 3.6 million, more than 2.5 million of whom are 15 years of age or
older (Australian Bureau of Statistics, 2005c), and regional resident population for the State of Victoria
of 5.0 million (Australian Bureau of Statistics, 2005b).
Surveying eligible tourists at QVM has the additional advantage of enabling data to be collected from
both frequent cultural experience attendees and Infrequent attendees within the eight population units
of three language groups. Interviewing Infrequent or non-attendees as well as attendees provides
Information about why people do not attend and the potential for attracting new segments (Getz,
1997; Nicholson and Pearce, 2000, 2001).
123

Chapter 4: Research Method
4.3.3 Research Design and Sampling Frame
While the selection of the eight cultural language- and place-of-residence-based groups was not
based on convenience or availability but on the statistical data for major tourist markets for Melboume
as outiined above, identifying eligible tourist respondents aged 18 years of age or older from each of
the eight cultural groups was achieved by purposeful convenience sampling. A further quota
sampling method was applied to get a specified minimum number of respondents from each of the
eight groups rather than achieving sample proportionality to the total population. This was to enable
multivariate statistical analysis of the data as will be discussed in the next section on sample size
(Section 4.3.4).
Purposeful convenience sampling and quota sampling have both advantages and disadvantages. A
significant disadvantage of purposeful convenience sampling Is that It is a non-probability sampling
method and so representativeness cannot be assumed (Page and Meyer, 2000). Therefore this
research is confined to exploratory research of the topic with these populations rather than being
probability-based random sampling which is representative of the populations and so the findings can
be exti-apolated to the whole population. The further assumption of probability samples is that sample
elements are selected from a sampling frame that consists of all the members of the research
population (Page and Meyer, 2000). Quota sampling also does not allow for randomisation but
should incorporate statification whereby respondents are selected by the interviewer rather than by
chance (Page and Meyer, 2000). Interviewer bias is common In quota and convenience sampling
(Page and Meyer, 2000) and to reduce this, an attempt was also made to choose respondents from a
wide variety of soclo-demographic backgrounds in terms of age and gender to ensure the samples'
representativeness of the central tendency of their cultures. The gender of the 13 data collectors was
also a consideration to further reduce this bias with three males employed as data collector assistants
in addition to their bl-llngual language skills. Furthermore, there are research situations where non-
probability samples are the only methods that are feasible, often because most sample frames are
not complete (Page and Meyer, 2000). Tourist visitors to Melbourne and to the QVM In particular are
such situations whereby the sampling frame is not complete. The size of the total population and
each strata population unit Is unknown for visitors overall and for tourist market visitors. Furthermore,
It varies over time and the population standard deviation is unknown and possibly differs by strata.
The quota and convenience sampling used In this research was purposeful as several screening
questions were involved to identify eligible respondents, that Is, respondents who were not just
available and willing to undertake the sur/ey but qualified as tourists and were from the eight
population strata groups. Respondent's experience at the Queen Victoria Market cultural heritage
attraction was also a prerequisite for all eight population groups as several sections of the survey
Involved some of the motivational process components being measured In relation to this one
common cultural experience. To further reduce sampling bias, non-qualifying international and
interstate tourist respondents and non-responses by eligible tourists were recorded so that these
124

Chapter 4: Research Method
could be considered in the data analysis. Intercepted and screened respondents were offered a lapel
sticker so that they were not approached multiple times for interviewing.
As each survey Interview typically took 10 minutes or more to complete, one also had to be realistic
about maximising the likely response of eligible tourists. To achieve the population unit quotas, QVM
visitors were largely intercepted while sitting down In some of the many resting or eating areas at the
QVM. This further required the use of a purposeful convenience sampling method than a more
representative, random probability sampling method.
Completed surveys by sampled respondents from the eight population units are then to be analysed
to test the extent to which there are cultural differences in international tourists' motivation and
behaviour towards attending and consuming locally-based cultural attractions and events, and
whether distinguishable market segments for cultural experience tourism can be Identified.
Cultural differences based on language spoken at home and place-of-residence differences are being
used to Identify the units of population to be sampled because cultural differences are essential for
marketing purposes as outiined in Chapter 2, section 2.13.1. As discussed in this previous section,
cultural differences Infiuence tourist motivation and behaviour, cultural experience tourists can be
segmented by language differences and these differences are crucial to marketing strategies,
especially communication and promotion, and also to consumers' marketing needs and responses.
From an international marketing perspective, language is one of five key elements of culture Identified
by anthropologists, to be evaluated in order to understand a culture (Cateora and Graham, 2002).
Previous data from other relevant studies of international and national tourism In Australia (e.g.,
Australian Bureau of Statistics, 2001; Bureau of Tourism Research, 2001, 2003; Tourism Australia,
2005; Tourism Research Australia, 2004) will be used as comparative data for basic demographic,
travel and cultural experience tourism sti-ucture, and to establish the representativeness of the sample
across the total population.
4.3.4 Sample Size and Response Rates
Because the size of the total population and each strata population unit at the Queen Victoria Market,
Is unknown and varies over time and the population standard deviation is unknown and possibly
differs by strata, a baseline sample size for each strata cannot be determined by formula.
A sample size large enough to allow for the sophisticated multivariate data analysis methods Is
required and discussed In this section, with further detail for each of the proposed multivariate data
analysis methods discussed in Section 4.6. A range of methods of analysis will be used to test the
hypotheses and assist in providing responses to the research questions posed. This range includes
factor analysis of each of the motivational process constructs to examine whether it Is possible to
reduce the data by identifying underlying dimensions and differences between the constructs and
125

Chapter 4: Research Metiiod
their dimensions. Confinnatory factor analysis in stmctural equation modelling (SEM) will then be
performed to test the factorial validity of the consti"ucts.
The sample size plays an important role in the estimation and interpretation of the results. In SEM, for
example, several factors affect sample size requirements, including the complexity of the model being
analysed, and the type of estimation algorithm used in the analysis (Kline, 2005). In SEM using
AMOS as proposed in this study, the estimation of parameters is based on the maximum likelihood
(MLE) method by default even though there has been considerable debate In recent years of treating
inten/al scaled variables such as Likert-type scales as if they were of a continuous ratio scale (Byrne,
2001). Byrne (2001) further supports using MLE and treating all data as of a continuous scale
referring to various research supporting two valuable points: I) MLE is less problematic when the
covarlance rather than the correlation matrix Is analysed, and ii) given normally distributed categorical
variables, continuous methods can be used with little worry when a variable has four or more
categories. While the Likert-type scales used In this research are discussed in section 4.5.6, they are
based on six categories.
As probability sampling was not used, the optimal sample size according to the standard error
formula, could not be applied. Therefore, when setting the target quota sample size for each of the
eight cultural population units, some general sample size guidelines of relevance to the proposed
data analysis methods were taken into account (see Table 4.1).
Table 4.1: Minimum sample sizes for various data analysis statistical techniques
STATISTICAL ANALYSIS
Factor Analysis
Maximum Likelihood Estimation (MLE)
Structural Equation Modelling (SEM)
Gonfimiatory Factor Analysis in SEM
MINIMUM SAMPLE SIZE
100
5 (or more acceptable 10) observations for each variable being analysed
100
400-500 (max.) or MLE becomes "too sensitive" making goodness-of-fit measures poor
100-150 for simpler models
100 subjects for "medium" sample size (up to a range of 200)
100-150 cases
REFERENCE
Hair ef a/., 2006
Hair ef a/., 2006
Hair ef a/., 2006
Kline, 2005
Kline, 2005
In addition to these sample size general guidelines, Sudman (1983) indicates that sample sizes for
regional attitude research commonly range from 400 to 1,000 with 700 being the optimum. These
sample sizes do assume that optimal stratified sampling procedures are being used, but this
assumption does not apply with this research as probability sampling was not used.
Therefore the target quota sample size was at least 100 completed In situ questionnaires for each of
the eight cultural population units of International and national Interstate tourists, with a total sample of
at least 800 completed questionnaires.
126

Chapter 4: Research Method
The data collection process for the in-situ survey resulted in 1,038 surveys by individual respondents
from which 961 usable surveys were retained. The analysis of the 77 removed surveys Is discussed
in the next section, but the sample size drawn from each mari<et In the final retained sample Is shown
In Table 4.2 as well as the total arrivals during the data collection period for each of the eight tourist
markets of interest to this study.
The size of the sample used in this study (Table 4.2) satisfies most of the minimum sample size
guidelines summarised in Table 4.1 for the statistical analysis techniques to be used in this stijdy.
Table 4.2: Sample size drawn from each market in the final retained data set
Market
International tourists
Japan
New Zealand
North America (incl. USA, Canada and Alaska)
UK (incl. Scotland, England, Wales) and Ireland
China
Hong Kong
Malaysia
Singapore
Taiwan
Other NE or SE Asian mari<ets
Total Chinese speaking Asian intemational tourists
Australian interstate domestic tourists
New South Wales
Queensland
South Australia
where State-of-residence missing
TOTAL
Total Arrivals
To Australia Jan-Mar 2006
175,900
194,100
154,300
214,000
84,000
37,300
32,800
48,400
25,700
136,000
N/A
To Melbourne Jan-Dec 2006
2,585,000
894,000
971,000
Not Applicable
Not Applicable
Sample surveyed at QVM
Size %
119
140
124
141
N/A
122
12.4
14.5
12.9
14.7
N/A
12.7
153
93
68
1
961
15.9
9.7
7.1
0.1
100.0
(Tourism Research Australia, 2006b; Tourism Victoria, 2007)
Each of the main international tourist samples has a sample size of more than 100. For the three
domestic Interstate tourist samples, two of the population units achieve, or are very close to, the 100
minimum sample size guideline (NSW, n = 153; Qld, n = 93), but the minimum quota was not
achieved for the third domestic interstate tourist population unit (SA, n = 68). These results for the
NSW market are not surprising as this market primarily drives the total domestic visitors to Victoria
and comprises 48% of all Interstate visitors in 2006 (Tourism Victoria, 2007). The SA market result is
surprising considering that the SA market comprises 18% of all interstate visitors compared with the
Queensland market which comprises only 17% (Tourism Victoria, 2007), yet the minimum quota was
almost achieved for the latter during the data collection period. While the SA market sample is not
sufficient for separate analysis, the three domestic Interstate tourist populations combine to a sample
(n = 315) that can be used as a population unit to compare with International tourist samples from
127

Chapter 4: Research Method
English-speaking markets (405 combined sample) and Chinese- or Japanese-speaking Asian
markets (241 combined sample).
As to the factor analysis requirement, for the in-situ questionnaire there are 961 usable cases for the
eight population units in the combined sample with 92 factorial variables, this translates into
approximately 10.4 observations per variable which exceeds the five cases per variable minimum
sample guideline (Hair et al., 2006). However, a cross-validation procedure Is being used as
discussed in section 4.6 whereby the total English-speaking tourist sample (N=720) is randomly split
Into two samples with exploratory factor analysis undertaken on the calibration sample and the
resultant factorial validity then tested on the validation sample using confinnatory factor analysis In
structural equation modelling. The random splitting of the In-situ sample using SPSS (version 12.0)
resulted In a calibration sample of 362 cases for the exploratory factor analysis which translates into
more than 11 obsen/ations for each construct's variables which also exceeds the minimum sample
guideline of five observations per variable (Hair et al., 2006). The validation sample of 358 cases will
be used for confinnatory factor analysis In SEM and this sample also exceeds the recommended
sample size guideline minimum of 100 subjects (Kline, 2005). For the final measurement models for
each construct, cultural group differences will then be tested using Invariance testing in SEM which
further requires each population subsample to fulfill the recommended sample size guideline
minimum of 100 subjects. It will be possible to undertake this analysis for the six international tourist
populations of interest to this study as their sample sizes are 119 cases or more (Table 4.2) but as
only two of the three domestic tourist subsamples achieve the sample size minimum, a combined
domestic tourist subsample (N=315) will be used In the Invariance testing analysis.
The population who completed the first stage in-situ interview questionnaire constituted the population
for the after-visit questionnaire. The overall response rate of 44% is much higher than has been
reported for many mail-back surveys where the response rate is typically less than 15% for randomly
selected respondents, without any pre- or post-mailing contact (Malhotra et al., 1996). Several design
features recommended for maximising response rates in mail surveys (Crompton and Tian-Cole,
2001) were incorporated in this study: (1) prepaid return envelopes were Included; and (2) a cover
letter which was on University letterhead and included a confidentiality statement. In addition,
because the self-complete mail after-visit survey was the second stage for respondents who had
completed the in-situ personally administered survey, these respondents already had some interest in
or commitment to the study and some relationship with the in-situ survey interviewer may have
developed which may have strengthened their willingness to respond to the mail-back second stage
survey. Aiding this relationship, a small pewter 'Aussie icon' token of appreciation was offered to
respondents on completion of the in-situ survey. This non-monetary reward was generally well
received with nearly all respondents accepting the offer of selecting one of the five 'Aussie icon'
designs.
128

Chapter 4: Research Method
Response rates are known to increase with the use of incentives and rewards (Yu & Cooper, 1983
cited in Malhoti-a et al., 1996), and a direct incentive for the return of the after-visit mall survey was
further used in this study. Respondents of the in-situ survey were verbally advised on Its completion
and when handed the after-visit survey, of an Incentive for the latter's return: this being a chance in
the draw for an IPod Nano player. Therefore incentive bias may have been a source of response
bias, but this was not tested for In this study.
The data collection result of 44% for the after-visit survey comprises 418 respondents in total and the
sample size drawn from each market Is shown In Table 4.3.
Table 4.3: Sample size of after-visit survey respondents and proportion from the in-situ survey respondents for the selected tourist markets of interest to this study
In-Situ Sample Surveyed at QVM
After-visit Survey Respondents
Size
After-Visit as a percentage of In-Situ Sample
% Intemational tourists
Japan
New Zealand
North American (ind. USA, Canada and Alaska)
UK (incl. Scotland, England, Wales) and Ireland
China
Hong Kong
Malaysia
Singapore
Taiwan
Other NE or SE /\sian markets
Total Chinese speaking Asian intemational tourists
119
140
124
141
N/A
N/A
N/A
N/A
N/A
N/A
122
36
72
53
62
57
30.3
51.4
42.7
44.0
46.7
Australian interstate domestic tourists
New South Wales
Queensland
South Australia
where State-of-residence missing
TOTAL
153
93
68
1
961
71
34
33
0
418
46.4
36.6
48.5
0
43.5
Six of the eight population units of interest to this study also attained either 42% or above. The two
populations where the sample size drawn from the market is lower than 42% are International
Japanese tourists (30.3%) and Interstate domestic tourists from Queensland (36.6%). Both of these
are well above the previously Identified typical mail survey response rates of 15%. While the
Japanese tourist response rate (30.3%) is the lowest rate, the response rate by Chinese-speaking
Asian international tourists (46.7%) was one of those above 42%, suggesting that race effects are
variable. The highest response rates were by New Zealanders (51.4%), followed by South
Australians (48.5%).
129

Chapter 4: Research Method
The significance of these after-visit survey response rates (Table 4.3) has implications for some of the
statistical analysis techniques to be used In this study when the minimum sample size guidelines
summarised In Table 4.1 are considered. As to the factor analysis requirement, for the after-visit
questionnaire there are 418 usable cases for the eight combined population units with 32 variables for
the benefits gained construct, this translates into 13.0 observations variable which exceeds the five
obsen/ations per variable minimum sample guideline (Hair et al., 2006). However, a cross-validation
procedure Is being used as discussed In section 4.6 whereby the total English-speaking after-visit
tourist sample (N = 325) is randomly split into two samples with exploratory factor analysis
undertaken on the calibration sample and the resultant factorial validity then tested on the validation
sample using confirmatory factor analysis in SEM. The random splitting of the after-visit sample using
SPSS (version 12.0) resulted in a calibration sample of 169 cases for the exploratory factor analysis
which translates into more than 5.3 observations per benefits gained variable which meets the
minimum sample guideline of five obsen/ations per variable (Hair et al., 2006). The validation sample
of 156 cases will be used for confirmatory factor analysis and this sample also fulfills the
recommended sample size guideline minimum of 100 subjects (Kline, 2005). For Invariance testing
of cultural group differences in the benefits gained construct measurement model, none of the after-
visit samples for all eight populations of Interest to this study (Table 4.3). fulfill the recommended
minimum sample size for confirmatory factor analysis in SEM. Hence for the invariance testing of the
benefits gained measurement model, the eight selected population units will be consolidated Into
three combined samples: one sample combining the three Australian domestic interstate tourist
samples (138 combined sample), another combining the International tourist samples from the
English-speaking markets (187 combined sample), and Chinese- or Japanese-speaking International
tourists from Asian markets (93 combined sample). These combined samples either achieve, or are
close to achieving, the minimum sample size of 100 cases and enable invariance testing.for the
English-speaking tourist mari<ets (international tourists compared to domestic tourists). Further
invariance testing within the Asian tourist sample for cultural group differences between the
Japanese-speaking and Chinese-speaking tourists will not be possible due to sample size limitations.
4.3.5 Non Responses and Removed Questionnaires
Non-response bias is considered less important for this type of study where the focus is on exploring
the nature of a phenomenon rather than being concerned with the distribution of the phenomenon in a
population (Crompton and Tian-Cole, 2001). Research of factor structures of motivations for tourism
often use convenience samples as sample representativeness Is a secondary concern to the
theoretical merits of the hypothesized relationships and researchers seek to examine theoretical
propositions about variables or relationships between them (Crompton and Tian-Cole, 2001).
Nevertheless, some comments about non-responses have been included to provide some support
that non-response bias was not an important issue for this study.
130

Chapter 4: Research Method
Non-responses to the in-situ survey were largely due to ineligibility identified at the screening question
stage. Non-response records were only kept for the Intercepted tourist visitors, and these varied by
data collector, largely due to the languages In which they were fluent relative to the selected language
group quotas. For example, the greatest number of non-responses to the in-situ survey was
experienced by the one mono-lingual English-speaking data collector, especially In the later stages of
data collection when eligible survey respondent quotas were reduced to only International tourists
from North America, and Chinese- or Japanese-speaking tourists from Asia. Of the twelve other data
collectors, all were bi-lingual in English and either Chinese or Japanese and one of the twelve was tri
lingual In English, Japanese and Chinese (Mandarin). When eligible tourist visitors were intercepted
onsite, the response rate was generally high and this Is possibly attributable to the high visibility and
strong Identification of the project as a University one with all data collectors wearing Victoria
University on-brand t-shlrts which was particulariy visible on weekend shifts when there were seven
data collectors onsite at a time.
Details of the 77 questionnaires removed from the sample are provided in Table 4.4 and they
comprised 7.4% of the total In-situ survey sample collected (1,038) which on removal resulted in the
final sample data set (961 cases). Surveys were removed for three main reasons: i) insufficient
sample size for the population unit (58%); ii) badly incomplete surveys (35%); and ill) Insufficient
response variation in survey (6.4%).
The first reason produced the largest proportion of removed surveys (58%) and was associated with
the Identification of eligible respondents from the selected tourist population units of interest to this
study which were based on combinations of origin (interstate or International) and language most
spoken at home (Chinese-speaking, Japanese-speaking, or English-speaking). Three additional
groups emerged in the data collection sampling process: Chinese- or Japanese-speaking
International tourists from English-speaking mari<ets (6 cases), Chinese- or Japanese-speaking
interstate tourists (3 cases) and English-speaking Asian international tourists (36 cases). The first two
groups were not easily detected until preliminary descriptive analysis was undertaken after the data
collection period. The latter group was evident during data collection but deemed eligible for sampling
because Australia has considerable numbers of international tourists from Asian countries where
English Is the language most spoken at home by some members of those populations such as
Singapore, Malaysia and Hong Kong and it was unknown how many of these tourists would be
Intercepted during the data collection period and whether the sample would be large enough for data
analysis as a separate population unit. As this sample only totalled 36 cases and so was
subsequently removed from the data set, future research of Asian international tourists should
carefully consider whether these population unit members are deemed eligible or ineligible for
sampling.
131

Chapter 4: Research Method
Table 4.4: Questionnaires removed from sample Market/Language Most Spoken at Home Insufficient
Sample Size for Population Unit
Number %
Incomplete Survey
Number %
Insufficient Response Variation in Survey
Number % Intemational tourists
Japan
New Zealand
North American (ind. USA, Canada and Alaska)
UK (incl. Scotland, England, Wales) and Ireland
1
5
1
g
3.7
18.5
3.7
33.4
1
1
20.0
20.0
Chinese speaking intemational tourists
China
Hong Kong
Malaysia
Singapore
Taiwan
NE or SE Asian mari<ets (country not specified)
Other NE or SE Asian markets
Other markets than Asia
Chinese- or Japanese-speaking intemational tourists from English-speaking martlets
English-speaking Asian international tourists
6
36
13.3
80.0
1
1
1
3.7
3.7
3.7
1
1
20.0
20.0
Australian interstate domestic tourists
New South Wales
Queensland
South Australia
where State-of-residence missing
Chinese-speaking or Japanese-speaking based on language most spoken at home
TOTAL
3
45
6.7
100.0
2
2
3
1
27
7.4
7.4
11.1
3.7
100.0
1
5
20.0
100.0
The second largest proportion of removed surveys (35%) were 27 incomplete surveys identified
through missing value analysis. All of these cases had at least 30 or more missing values from the 92
Items comprising the three motivational process consti ucts measured in the in-situ survey and were
deemed too Incomplete to include in the sample. All major mari<ets or sampling population units had
one or two cases removed, excepting the UK and Ireland (9 cases) and New Zealand (5 cases) which
were the two largest international tourist samples. As one-third of the UK and Ireland removed cases
were conducted by the same interviewer, interviewer error rather than a cultural trait Is suggested.
The third reason of removed surveys because of insufficient variation in responses, applied to only
five cases (6.4% of the removed cases) and there was never more than one of these in any one
martlet or sampling population unit.
4.4 Data Collection
A two-staged data collection process is being used as this research method Is considered essential to
measuring constructs within the motivational process (as defined for the purposes of this study in
132

Chapter 4: Research Method
Chapter 2, section 2.9.6.2). In this definition some of the constructs exist before the experience and
motivate the decision to attend such as attitudes about attending specific activities and events and
motives for attending, and expected benefits from attending, whereas others can only be measured
after the behaviour or activity such as the motivational-related behavioural outcomes ft^om the
consumption experience of benefits gained from the experience or satisfaction with the experience.
There is further debate about how to best measure some of the constructs of interest to tills stijdy.
Including when and how these measurements should be undertaken, as will be further discussed in
later sections of this chapter on measurement issues for each of the constructs. These issues also
have implications for whether a one- or two-staged data collection process is used. In particular, the
disconfinnatlon approach for measuring satisfaction (Churchill and Suprenant, 1982; Oliver, 1980a) or
sen/ice quality (Gronroos, 1990) Is an expectation-performance analysis model that advocates
expectations be measured prior to the experience, and performance outcomes be measured after the
experience. In this study, a new use of benefits sought or expected before the experience, and
benefits gained after the experience, is proposed as an inferred measure of satisfaction by comparing
differences, if any, between cultural experience tourists' benefits expected or sought and those
gained. This proposed approach to measuring satisfaction Is a variation on expectation-performance
disconfirmation approaches and similar to the importance-performance analysis model to attitudes,
attributes and satisfaction which has been widely applied in general marketing literature and also in
travel, tourism and leisure research (O'Leary and Deegan, 2005; Oh, 2001; Ryan and Mo, 2001; e.g.,
Vaske et al., 1996; Yuksel and Yuksel, 2001). While this study will be utilising a two-staged data
collection process, it is Interesting to note that some Importance-perfomnance analysis model
applications in tourism research have adopted a two-staged data collection process (O'Leary and
Deegan, 2005), while others adopt a one-stage data collection process (Ryan and Mo, 2001) with the
importance and evaluation scales paired together for each questionnaire item following a pattem
proposed by Parasuraman et al. (1994a; 1994b). The latter approach Is instead of asking
respondents to rate importance first and then the evaluation, in either a one- or two-staged data
collection process.
44.1 In-Situ Personally Administered Interview Questionnaire
Stage one involved a personally administered, interview questionnaire in-situ at the Queen Victoria
Market (QVM) where a purposeful convenience sampling approach was used at multiple data
collection points In high traffic areas throughout QVM, with the data collector intercepting and
screening visitors passing the collection point to establish If they qualified as one of the eight
population units. To avoid multiple Intercepting of approached tourists (eligible or Ineligible), yellow
stickers were offered to these tourists and this system functioned well.
The In-situ questionnaire was administered to the eight population units by personal interview. A
team of 12 bi-lingual research assistants was recruited from the 22 applicants who responded to a job
133

Chapter 4: Research Method
specification for bi-lingual data collector research assistants advertised through Victoria University's
employment service and RMIT University's Chinese and Japanese Interpreting and translation
courses. All of the research assistants were bi-lingual In at least two of the three languages of interest
to this study (English, Japanese and Chinese Mandarin form) and administered the personal
inten/lews using a translated intercept sheet of screening questions and Interview checklist
questionnaire. The only mono-lingual data collector was the English-speaking author of this study.
The strengths of the personal Interview method conducted by a well-trained Interviewer are the ability
to handle complex questions, collect large amounts of data, more complete questionnaires, and
higher participation rates (Zikmund, 2000).
Training of the data collector assistants was undertaken in December 2005 in accordance with
intemational data collection guidelines (International Chamber of Commerce/European Society for
Opinion and Marketing Research, 1995). Data collection commenced Thursday December 28, 2005
for 29 market trading days until Saturday 18** February, 2006. The team of 13 data collectors worked
one three hour shift on each of these days with the number of data collectors on-site at any one shift
ranging from three to seven data collectors on Saturdays and Sundays. The author of this study
functioned as the team leader, participating in all 29 data collection shifts and was personally
responsible for collecting 140 of the 1,038 completed in-situ surveys (13.5%). Most data collectors
worked two shifts per week for the seven weeks and a schedule was developed to ensure there was
always at least one bi-lingual data collector fluent In Chinese and one in Japanese. An exception was
the female, tri-llngual data collector research assistant who worked 23 of the 29 shifts due to her
language and data collection skills resulting in the successful collection of 155 In-situ surveys (15%).
Three of the data collectors were males, and usually there was at least one male data collector per
shift to reduce respondent gender bias.
4A2 After-Visit Self-Complete Questionnaire
The population who completed the first stage in-situ Interview questionnaire constituted the population
for the second stage, shorter after-visit questionnaire distributed to respondents at the conclusion of
the In-situ questionnaire. The overall response rate of 44% for the after-visit survey and the sample
size drawn from each market has been previously discussed with details outiined in Table 4.3.
4A3 Timing of Data Collection
The primary data collection period of December 2005 to March 2006 was peak tourism season for
many of the selected international Inbound and interstate markets. The January to March 2006
quarter was the peak period for international tourists from Japan, Taiwan, China and North America,
and the second largest peak for tourists from New Zealand, United Kingdom, Hong Kong, Singapore
and Malaysia (Tourism Research Australia, 2006a, 2006b). For domestic tourist visitation to Victoria,
the peak quarter was December 2005 to February 2006 with the peak month being January 2006
134

Chapter 4: Research Method
(Tourism Victoria, 2005c). Interviewing was conducted over a seven week period on all five mari<et
trading days each week and at various times per day to ensure a broad mix of tourist visitors.
4.5 Instrument Design
While pre-validated survey items and scales from previous relevant research would have been the
prefenred basis of the survey instiuments to be used in this study, as identified In the literature review,
there is little consensus about how to measure each of the motivational process constmcts of Interest
to this study. This study proposes that the motivational process constiTJcts of attitudes, motives,
benefits sought and benefits gained by tourists are relevant to developing tourist markets for cultural
experiences. It also proposes new uses for benefit variable dimensions in this research of tourists'
cultural experiences with any difference between benefits sought and gained used as a measure of
satisfaction. Furthennore, very little of the existing research has applied one or more of these
constructs In a cultural experience context from the tourist's perspective, with a further focus on cross-
cultural differences and no existing research applies all of the constructs in one study. Therefore, new
survey Instruments had to be designed for this study, but each section within the resultant two-stage
survey Instruments as outiined in the next section was based on extensive review of the existing
research of relevance to measuring each of the constructs, that Is then discussed In the sections
thereafter.
The basic procedure for item development is well known (cf., Nunnally and Bernstein, 1994) and was
applied in this study for each construct whereby core dimensions are firstiy identified through the
literature and a pool of items is then identified from previous studies that can be expected to represent
those dimensions. Although basic, this procedure is seldom simple to perform as was experienced In
this study where for each constmct there Is a lack consensus in the literature about how they should
be defined and measured, despite an extensive body of previous studies In relation to each construct.
Multi-dimensionality of all constructs and some items, as well as some inter-relationships between the
constructs, all creates considerable challenges to uniquely identify constructs, dimensions, and items
to represent those dimensions as will be discussed In each of the following sections on measuring the
selected motivational process constructs of interest to this study.
4.5.1 In-Situ and After-Visit Questionnaire Development
The in-situ personal interviews employed an Inten/iew checklist questionnaire comprising five main
sections: one for each of the three selected motivational process constructs of attitudes about
attending cultural experiences (survey 02 statements about what cultural experiences respondents
like going to), motives for attending (survey 03 statements about why you go to cultural attractions
and events while travelling), and expected benefits sought from the cultural experience (survey 04
statements about what respondent's expect from their visit to the Queen Victoria Market); a section
on selected demographics about the respondent (survey intercept questions); and a fifth section on
135

Chapter 4: Research Method
selected travel and ti-ip profile characteristics for the respondent this trip to Melbourne (survey 05
questions). The after-visit questionnaire is designed to be self-completed and comprised only one
section on benefits gained from the cultural experience (survey Part 2 statements about what tiie
respondent gained or received from their visit to the Queen Victoria Market). See Appendix 1 for the
English language version of the survey Instmments and cover letter and Appendices 2, 3 and 4 for
the translated versions.
4.5.2 Measuring ttie Attitude Construct of the Cultural Experience Motivational Process
In the literature review sections on defining and measuring attitudes and motives (sections 2.10.1.2
and 2.10.2.5) It was established that attitudes can be distinguished from motives although both are
internal predispositions. While the fomner can be defined as the affective or feelings responses that
consumers have toward an object or a general evaluation of an object (Fishbein and Ajzen, 1975),
the latter can be summarized as an internal factor that arouses, directs and integrates a person's
behaviour (Iso-Ahola, 1980). Attitudes have been further categorized as hedonic or utilitarian
(Spangenberg et al., 1997; Voss et al., 2003). In this study it is proposed to incorporate hedonic
attitudes as well as utilitarian ones because of the former's relevance to the consumption of aesthetic
products (Hirschman and Holbrook, 1982; Holbrook and Hirschman, 1982), although hedonic
components of attitude tend to be situational (Halvena and Holbrook, 1986). Utilitarian attitudes have
been conceptualised as simplifying decision making in relation to measuring tourist motivation
(Fodness, 1994).
Several approaches to researching attitudes can be found in the tourism literature. One approach
includes attitudes within the various applications of Mitchell's (1983) combined Values, Attitudes and
Lifestyles scale (VALS), which has been used largely for tourist market segmentation purposes (e.g.,
Shih, 1986). Other tourism research evaluates leisure travel attitudes by measuring motivations,
perceptions, preferences and future travel intentions (e.g., Lee and TIdeswell, 2005) which Is a
variation on the established method of attitude measurement based upon the theory of reasoned
action (Fishbein, 1967, 1970; Fishbein and Ajzen, 1975) and the later theory of planned behaviour
(Ajzen, 1985). Others incorporate an importance-evaluation mode of attitude measurement to assess
various forms of tourist perceptions and behaviour such as perceptions of destinations, which again
• has been often applied for tourist market segmentation purposes (e.g., Ryan and Mo, 2001). Other
approaches focus on the residents' perspective and measuring their attitudes toward tourism and
tourism development (Lankford and Howard, 1994). Within cultural tourism research, rather than
attitudes per se, the emphasis has been on tourists' motivations, benefits, satisfaction, activities or
other behaviour (e.g., Foo and Rossetto, 1998; McKercher and du Cros, 2003; McKercher et al.,
2002; Richards and Queiros, 2005; Tourism Victoria, 2004a). The lack of research on attitudes is a
gap In the literature to be explored In this research.
136

Chapter 4: Research Method
This study proposes developing a multi-Item attitudinal scale for measuring tourists' cultural
experience attitudes. As numerous approaches, scales, paradigms and Indexes have been used for
measuring dimensions of tourist and other consumer attitudes, it was decided to base this scale on
two main types of items: an expansion of the arts enthusiast scale (Wells and Tigert, 1971), and Items
measuring tourists' attitudes towards selected motives for and benefits (sought and gained) from
attending cultural experiences. The fomner measure a person's interest In the arts and were
Incorporated within the combined Activities, Interests and Opinions scale (AlO), yet another approach
to measuring attitudes from a classic study of consumer psychographics (Wells and Tigert, 1971).
The cultural experience attitude constmct in this study. Is measured by 29 question items rated on a
six-point Likert type scale of agreement ranging from 1 for "Totally Disagree" to 6 for "Totally Agree".
In the absence of a suitable, validated item set, a multi-item attitudinal scale was compiled with two-
thirds (items 2.1-2.16, 2.23-2.25) based on an adapted and expanded fomn of the arts enthusiast
scale (Wells and Tigert, 1971); and another eight (Items 2.18-2.22, 2.26-2.28) measuring attitudes
towards commonly found motives and benefits (sought and gained) selected from numerous previous
studies of tourists at cultural and non-cultural experiences (Kay, 2003, 2006a) and as discussed in
later sections of this chapter (section 4.53 on measuring motives and section 4.54 for benefits). The
other two attitude items pertain to respondent characteristics of potential relevance to their liking for
cultural experiences: one focuses on respondent's occupation and the extent to which they like going
to cultural experiences because they are related to their work (item 2.17), and the other focuses on
respondent's liking for the travel trip characteristic of partaking In cultural experiences on package
tours (Item 2.29).
The original arts enthusiast scale (Wells and Tigert, 1971) comprised three items: I enjoy going
through an art gallery; I enjoy going to concerts; and I like ballet. Lumpkin (1985) used a sllghtiy
modified three items: I enjoy going to concerts; I like ballet and opera; and I like to browse in
museums. In adapting and expanding the arts enthusiast scale for this study of cultural experience
tourist motivation, all of the item statements were standardized to use the same Introductory wording
of "I like going to" and the range of three or four arts activities was considerably expanded to a list of
nineteen different cultural experiences based on the typology of cultural experiences of interest to this
study as defined in literature review sections 2.7.2-2.7.4, summarized in Figure 2.1, and also based
on numerous studies of cultural experiences visited by domestic and International tourists as well as
local residents.
As discussed in the attitude construct literature review (section 2.10.1.2), all of these attitude
definitions and scales link attitudes to object or product attributes with many objects being multi-
attribute. In discussing consumer behaviour in tourism, Moutinho (1987) posits overall affect towards
an object refiects the net resolution of an individual's cognitions (beliefs) as to the degree to which
given objects possess certain attributes. He further posits that overall affect assessment by
Individuals Is weighted by the salience (importance) of each attribute to the individual. Multi-attribute
137

Chapter 4: Research Method
objects are linked to benefits which In turn have differential desirability to individuals or segments of
the mari<et (Moutinho, 1987). In light of this discussion, the attitude items used in this stijdy also
include a set of items that measure the extent of liking for or desirability of some of the potential key
dimensions and Items within the other motivational process constmcts of interest to this study, that is,
motive and benefits constmcts (in-situ survey 02 attitude-related items 2.18-2.22,2.26-2.28).
45.3 Measuring the Motive Constmct of the Cultural Experience Motivational Process
The changing perspectives in tourism motivation studies since eariy writers in the field (e.g., Crandell,
1980; Crompton, 1979; Lundberg, 1971) have been thoughtfully reviewed by several authors (e.g.,
Han'lll and Potts, 2002) with widespread agreement that tourist motivation is an incredibly complex
area of research In which no all-embracing theory of tourist motivation has been developed which has
been adapted and legitimized by researchers in other contexts. Previous discussion in the literature
review section 2.9.4 of this study, for example, identified at least four main conceptual approaches to
tourist motivation that have been applied to the empirical measurement of tourist motivation: needs-
based, values-based, benefits-based, and expectancy theory-based. Other authors argue that
tourists' needs and motives change over time and should be viewed in their social (macro) context
(Jamal and Lee, 2003; Sharpley, 1994). That travel motives need to be seen in a cross-cultural
perspective has been emphasized by other authors (Kim, 1998; Kim and Lee, 2000).
In the literature review sections on defining and measuring the four motivational process constmcts of
primary Interest to this study (sections 2.10.1 on attitudes, 2.10.2 on motives and 2.10.3 on benefits
sought and gained), it is argued that motives are separate distinguishable internal dispositions that
arouse, direct and integrate a person's behaviour (Murray, 1964). Needs, values or attitudes, are
widely recognized as antecedents of motives, and the latter are being investigated in this study for
reasons previously outlined in section 2.10.1.1. It Is further acknowledged that motives are a multi
dimensional construct and various tourism motivation structures for the underiying dimensions have
been proposed since the first psychological research of tourism in the eariy sixties.
Several broad structures of relevance to this study have already been discussed in the literature
review sections 2.9 on motivation research approaches and 2.10.2.1 on defining and measuring
motives. Furthermore, several of these theories cross-reference each other as will be highlighted in
the following summary. Theories of particular relevance to this study discussed there include push
and pull factors and tourist motivation (e.g., Crompton, 1979), the hedonic consumer motivation
theory (Hirschman and Holbrook, 1982; Holbrook and Hirschman, 1982) and the hedonic tourism
motivation model (Goossens, 2000), the escaping/seeking framework (Mannell and Iso-Ahola, 1987),
and whether motives are physiological, psychological or sociological. While some authors propose
that tourism is primarily a social psychological experience (Iso-Ahola, 1982; Mannell and Iso-Ahola,
1987), motivation for hedonic experiences are considered to have some physiological dimensions
and some psychological dimensions (Mowen and Minor, 1998). Others argue the relevance of the
138

Chapter 4: Research Method
environment in which motives occur which shapes, forms and Influences the individual's specific
response (Gnoth, 1999; Sharpley, 1994). Traditionally, push motives have been psycho-sociological
motives used for explaining tourism desire, while pull motives are aroused by the destination and
have been used to explain the choice of destination (e.g., Crompton, 1979). Of the nine motive
dimensions Identified by Crompton (1979), seven were considered socio-psychological or push
motives and two were considered cultural pull motives (novelty and education). Goossens (2000)
describes push and pull factors of tourist behaviour as, "two sides of the same motivational coin"
(p.302) and further posits that the psychological concept, emotion, connects both sides with needs
functioning as a pushing motivation and benefits as a pulling motivation.
4.5.3.1 Motive Dimensions Consensus and Motive Construct Measurement Scale
In the absence of a pre-validated, generic scale for measuring motives for attending cultural
attractions and events, the most commonly found dimensions from selected empirical studies
representative of the considerable body of tourist motivation research In various contexts are
identified In a general context and in relation to cultural attractions (Table 4.5), and in a festivals and
events context, (non-cultural and cultural-related) (Table 4.6), to develop an appropriate scale for use
in this study.
Some lack of consensus can be seen In the number of different dimensions identified for the various
contexts including 19 different dimensions overall In a festival event context, 14 for cultural-related
festivals and events, 18 different tourism motivation dimensions overall, 11 for cultural-related
attractions. The large list of alternative terms for the dimension names noted under each table,
highlights further diversity and a general lack of consensus. Further categorization of the motive
dimensions within each table, emphasizes a predominance of psycho-socio-physiologically-based
dimensions, however, some attribute-based dimensions apply within each context.
Table 4.5: Most commonly found motive dimensions in the selected empirical tourist motivation research by tourism context (cultural tourism versus other tourism contexts)
AUTH0R{S)
Psycho-Socio-F Bequeathing to Children Connecting
_w[th Heritage Curiosity/Disc-
_overy
Most Commonly Found Motive Dime
Tourism-Related Motivation (Non-Cultural
oT (J)
c
'5. E
O
6 _« c ro
CO c
IT ^ 1= ( < = 1
di
^
1994
c "O
(Fo
CO
'
- ^
5"
0
McD
c ro C '-^ ra 0 3 en
> 2
X
w at
c •—• ra IZ
#(000
CM
CD
a CD
Q>
-e
(An
'hysiologically-based
tn
199
' to
nj
(Ch
nsions
_ i
< 0 1-CD 3 OT
0
0
0
Cultural Attraction-Related
of
rco
< tn
Cfl .—.
(D 2
04)
r, 20
tc
y
2
06)
0 CM
m
•flu
to t _
(Po
_ i
< 1-0 1-CQ
to
_ l
< 1-0 1-
X
X
X
1
1
1
1
1
1
139

Chapter 4: Research Method
r Education/ Knowledge Emotional Involvement Entertainment (10) Escape Leisure (11) Novelty (1) Relaxation (7) Reward Maximisation Self-Development/ Self-Exploration (5) Socia (Interaction)l: meeting new and different people (8) Social (Kinship) (2) Social (Recognition)
• (3) Work Career Development Enhancement of Human Relations
x
x x
x
x
x
x
x
x
X X
X
X
X
X
X
X
' • • ' / '
r ,<>
WS^'^ i X
• "•V/A-' '".' '•".
X / X , . X ' . X"
'
X
X '.•.x-;-
X
''^K^-.t-, P<yt/y • x .
* r
" / . i .
X
•''."
X
X
: ' : X
- X
a:x
5
0
0
1 0 5 7 1
2
4
4
5
1
1
X
X
X
X
X
X
X
X
X
3
1
1
1 1 1 0 0
0
0
1
0
0
0
8
1
1
2 1 6 8 1
2
4
5
5
1
1
Attribute-based Heritage/ Culture Knowledge (9) Physical Sports Shopping for Souvenirs
X
X
X X
X
X
2
3
1
X 1
0
0
3
3
1
#Studies of Japanese Tourists; ## Study of Mainland Chinese Tourists 1. Novelty: Alternative terms used included Exploration/Discovery/Something New/Excitement/Variety/Unique Identify/Adventure/ 2. Social (Kinship): Alternative terms used included (socialisation/bonding/affiliation) 3. Social (Recognition): Alternative terms used included Prestige/Show & Teil/BraggingA/alue Expression/ 4. Nature Appreciation: Alternative temis used included Environment aspects of destination 5. Self-Development/Self-Exploration: Alternative terms used included Regression (Crompton, 1979)/ Ego-enhancement (Fodness, 1994) 6. Physical Sports: Alternative terms used included Health and Recreation/ 7. Relaxation: Alternative terms used included Punishment Minimisation (Fodness, 1994)/ 8. Social Interaction: Alternative terms used included Social Adjustment (Fodness, 1994)/ 9. Heritage/ Culture Knowledge: Altemative terms used included Enjoyment of Art Exhibitions & Reviews (Axelsen and Arcodia, 2004) 10. Entertainment: Altemative terms used included Leisure Pursuit (Poria et al., 2006) 11. Leisure: items included entertainment and relaxation (McKercher, 2004)
Table 4.6: Most commonly found motive dimensions in the selected empirical tourist festival and event motivation research by tourism context (cultural tourism versus other tourism contexts)
AUTHOR(S)
Most Commonly Tourism-Related Festivals and
Events (Non-Cultural)
^
(Uys
al e
tal.,
199
C
(Moh
r et
a!.,
199
3
(Bac
kman
et a
l.,
1995
)
(Sco
tt, 1
996)
(Sch
neid
er a
nd
Bac
kman
, 19
96)
(Cro
mpt
on a
nd
McK
ay,
1997
)
SUB
TO
TAL
Found Motive Dimensions Cultural-Related Festly^tj?,ahd Events
.- , . -' ^^.'fl^i:'•.:'•'•' '•
(For
mic
a an
d U
ysal
, 19
96)
(For
mic
a an
d U
ysal
, 19
98)
-
(Lee
, 20
00)
.••-'^{-^^j*.
(Lee
et a
i., 2
004a
'/'• •
(Ray
boul
d et
a!.,
19
99)
CD
(van
Zyl
and
Bot
h 20
04)
SU
B T
OT
AL
TOTA
L
140

Chapter 4: Research Method
Psycho-Socio-Physiologically-based Curiosity
' Education/ Knovirtedge Entertainment Escape Excitement/ Thrills Gregariousness
(4) Novelty (1) Relaxation Social (Interaction): meeting new and different people Social (Kinship) (2) Social (Recognition) (3)
X X
X
X
X
X X
X
X
X
X
X
X
X
X
X X
X
X
X X
X
X
X
X
X
X
X
1 0
0 5 5
1
3 1 6
6
0
X
X
X
X
X ','
X
X
X
X
X
X
X
X
X
X
X
X
X
X
X
X
X
X
X
X
X
0 1
2 4 2
0
6 0 4
6
1
1 1
2 9 7
1
9 1 1 0
1 2 1
Attribute-based Entertainment Festival Attributes Food and Beverages Heritage/ Culture (6) Information and Marketing Nature Appreciation (5) Transport
X
X
X
0 1
0
1
0
1
0
X
X
X
X
X
X
X
X
X
X
1 3
1
3
1
0
1
1 4
1
4
1
1
1 1. Novelty: Alternative terms used included Exploration/Discovery/Something New/Excitement/Variety/Unique Identify/Curiosity/Regression/Authenticity and Uniqueness 2. Social (Kinship): Alternative terms used included Socialisation/Bonding/Affiliation/Family Togetherness, 3. Social (Recognition): Altemative terms used included Prestige/Show & Tell/ Self-Esteem 4. Gregariousness:: Altemative terms used included Recover Equilibrium 5. Nature Appreciation: Alternative terms used included Environment aspects of destination 6. Heritage/Culture: Altemative terms used included Cultural Exploration
Only one motive dimension is frequently found for cultural attraction motives: education/knovvledge (3
studies). A further six dimensions are frequently found for cultural-related festivals and events: social
kinship (6 studies), novelty (6 studies), escape (4 studies), social interaction (4 studies), and two
attribute-based dimensions of festival attributes (3 studies) and heritage/culture related festival or
event attributes (3 studies).
Although none of the tourist motivation studies (cultural or non cultural) tests cross-cultural differences
as proposed in this study, two of the tourist motivation studies focus on Japanese tourist motives
(Andersen et al., 2000; Cha et al., 1995) and one on Chinese tourist motives (Zhang and Heung,
2001) as seen in Table 4.5. These studies indicate some similarity between the motives found for
Japanese and Chinese tourists and the motives for tourists attending cultural attractions and events
that are being tested in this study. Both Japanese tourist studies found motive dimensions for
education/knowledge, novelty and relaxation and a further three social-related dimensions were found
in either study: social interaction, social kinship, and social recognition. The Chinese tourist study
also found motive dimensions for education/knowledge, novelty, relaxation, and social recognition.
141

Chapter 4: Research Method
Based on these findings, the resultant scale in the in-situ survey instrument included a section of 31
items relating to the motives for attending cultural attractions and events construct within the
motivational process, (see Appendix 1 for the English language version, section Question 3). Only
two items are solely attribute-based: to buy goods and souvenirs (item 3.30) and to buy food and
drinks to consume at the cultural experience (item 3.31). Of the other 29 psycho-socio-
physiologically-based items, six are part attribute-based emphasizing famous cultural experiences
(being a famous cultural place, featuring famous performers/entertainers, or famous shows) (items
3.22-3.24), or cultural experiences as being safe, good value for money and a high quality experience
(3.27-3.29). The other 23 psycho-socio-physiologically-based items measure a range of commonly
found motive dimensions of relevance to cultural experiences including hedonic-related
entertainment, relaxation, physical and emotional involvement, and other related motive dimensions
such as escape, novelty, social kinship, social interaction with others, social recognition, teaming
about local culture, history and the performing arts.
To minimise response set bias, interviewers are instructed to randomise the order in which the items
within the question scale set are asked.
4.5.4 Measuring the Benefit and Satisfaction Constmcts of the Cultural Experience Motivational Process
The aim of this section is to review the existing empirical research to analyse the benefit research
dimensions, especially what has been measured, when it has been measured and how it has been
analysed and measured. A specific objective is to consider the extent to which standards or
consensus may exist in approaches to using and measuring tourist benefit dimensions and
particulariy to identify a set of commonly found benefit dimensions.
The subsequent analysis of tourist benefit research dimensions in existing empirical studies further
distinguishes between non-cultural-related research (Table 4.7) and cultural tourism-related research
(Table 4.8) as the latter is of particular interest to this study. In the allied area of festival and event
tourist motivation and segmentation, no studies have been identified that refer to benefits as a
motivation or segmentation dimension, although some of the motivation statements could be
categorised as statements of benefits (e.g., Formica and Uysal, 1998).
For the benefits most commonly found in tourist benefit research and of relevance to attracting
tourists to cultural experiences, they will be categorised in relation to a relevant theoretical typology
identified from the literature to develop a conceptual typology for application in this study.
4.5.4.1 What to Measure Issues in Benefit Research
As previously discussed in the literature review of benefits research (section 2.10.3), the timing of the
collection of benefit statement ratings can be based on benefits sought or pursued (i.e., prior to the
consumption experience) and others on benefits gained or realised (i.e., after the consumption
142

Chapter 4: Research Method
experience or based on past experiences). This timing difference results in two separate benefit
constructs that are being tested in this study's cultural experience tourist motivational process model
and have been defined for the purpose of this study as follows: benefits sought are a nonnative
expectation, that is a forward-directed, intentional charged, tentative attitude towards a particular
consumption goal that contains some knowledge about the cultural experience and the psychological-
socio-physiological benefit to be gained by having the experience, and is driven by motives for
attending the experience. In contrast, benefits gained are defined as, an improved psycho-socio-
physiological outcome resulting from the cultural consumption experience, the performance of
tangible and intangible attributes experienced, and the consequences of visitor's behaviours during
the consumption experience. In summary, benefits sought are particulariy relevant to visitor's
motivation and expectations within the decision-making process to attend experiences, while benefits
gained are of particular relevance to visitor's behavioural outcomes from experience consumption,
especially satisfaction.
There have been many applications of benefit segmentation in tourism research over the past 20
years as seen in Tables 4.7 and 4.8.
143

•a
0 0
II
w 2
ro c o (0 . _
SI
c c ° o
I
D) 3 o
CO
i2 0) c a> ID
• D C ro
CO CB
_ Oi O 1 -
TJ
o fe d-D.
TJ ^ ^
ra o>
c 0) ro r J d - O
0)
o8 £
1.1 I I S'-g-S £ CO v> £ ro o.
oes
iS O JI "5 E b £0 S o ^ E -.g -.g « £ m 2 nJ £
ro X
CO
ro
ro
_ T3
CM CO
, ^ . p J 3 <U 0} ^ S E Q. t i >r CD 6 X ro Q . V) ro CD CL
O CD c E' .S S ra ra —
|s|li« S 0) E r E -g
> n u) 2 o E
o ?i ^
1 ^ 03
C o
• i 'ro oJ • i E IS"
£ 5 § ' |
- > o E UJ o u) - i >
T3 c ro
l l TO ro
Q . o
si
c o ro
0}
1 E 1 IS'"El m UJ ro : 5
ii
c o
g)EE IS'iS
o) ro-g o > . 2 (/> . C Q.
Q .
E S c ? -i s oj CD :c ro
. . _ . . _ . . £ I— d c o ( O j a x i i s Q.i3 Q.
£ g>
i_ ro tS o v ffi
ro o) .Q E Q : O
o .9
o5
ro S i_ ® S
U < T
3 Q. O a.
CO = 3
£ fo o o ) , . E
• p ^ E
§.-8 8 O 5 ro
in
ro Q .
OJ
ro CO <
CO CO =3
CO
ro
^1 S ro H O
'= §i . n> O -X3
CD = ?^ Q C QJ O -.53
^ ra 3 o O §
ra
c o
"ro
13 -a
c
: 5 ^
_ -o £ t3 S .i2 3 §. 3 o 2 o c c I- a. <
r ro m i/j
<
¥ ro Q.
I" CD
(I>
> s
B % ens
c (1>
• o 'in CD
DU 2
CD
!" _
^ 2
CD
is?
c 2 9- <" (D
C
. 2 x 1 IS »
o ro Q . ( / )
O L a. < o
ro c .g
CD
E,
CO U)
9 " 9- c 6 R
CD
- - •_J CD
O c
- • c
^ E C <D O S CL O )
U) c ra ^ CD <
E Q ^ CO
Q. TS ro
ro ^ •i g £ u>
<: p 1n .J. w o 9 3 £ e Q. ^ tJ O b
z o
ra
9 °-c i i .
T3 CD
• c o a. (D
o Q .
£ z
1 o Q .
o z
-x" -SG ro ^
I ^ O ro
I -^ Q. < E 1 -
co _ 1 O
X -iS ro ^ E
D o o8
•5 8 ^ « < < E .ra m -g-Q ro O ro s 3 ro ^ D CL > > O ro < (0
U)
d = z o
CD
c ro
§ o 9 o.
4t
0)
ro o
(3 . i 'F S g 2 Si D. X ^ "o ro < m
O o8
^ in <r « - ^ Q ra 3 E^ O ro<
O ) _ o. ra "5
IE ns (D
, . r cn -> o U) (I) o r •c-a) o X 0)
• n r ro D ) t_
— (1)
> ro rt
r
n in r' o in ro a>
o
« in
B tn o Q . h 8 ro
XJ ID m
F
e ID
(I) O X CD
TJ C ro in
% r (D
n
in CD
J3 ro •c ro > TJ OJ
ro CD t (D C
. 1
o in ID in OJ c: in
' C Q .
E 8 12 o o •S OJ c >S< c ^ TJ
>. X I 10 c o 10 c CD
E • D OJ c >< • c 0)
T3 C 3 ID
JZ
CD
O cu. X OJ o
T l a> in 3 CO 10
>. ro c < c CD c o CL
E o O OJ Q. O c •c 0.
< o D-10 in
>. ra c < c ro c E ' C o in Q
< Q CD O c ro ro > •s in S2 >> ro c < < > O z <
^ ^ T—

Chapter 4: Research Method
Table 4.8: Summary of empirical studies of tourist benefit research (cultural tourism-related)
AUTHOR(S)
Major Research Objectives
Tourispfi Product Analysed
Population Sampled
Number of Items
Number of Dimensions
Numer of Clusters
Scale Type
Statistical Methodology
Benefits Sought
(Alzua etal., 1998)
Multi-dimensional segmentation using Benefits Sought and Activities to understand Vacation motives
Culture and heritage tourism
UK Outbound
20
Not Applicable
5
Not Reported (importance)
2 Stage Hierarchical & K-means duster analyses; ANOVA
(Frochot, 2004)
Benefit segmentation (motivation) and influence on quality evaluation
3 Historic Houses, UK
Historic Property Visitors
15
Not Applicable
4
5-point Likert (importance)
K-means cluster analysis
(Tian etal., 1996)
Benefit segmentation and relationship with selected independent variables; potential target martcets by cross-tab of benefit and constraint (dusters. (Benefits measured were a mix of motives, interests and benefits)
Museums Texas, USA
Museum visitors
18
6
20 cell matrix based on 4 benefit clusters and 5 constraint clusters
7-point Lil<ert (agreement)
Factor analysis; PCA (Oblique); K-means cluster analysis; Chi-square tests on independent variables and clusters
(Weaver etal., 2002)
Benefit segmentation
Heritage sites, USA
US travellers
15a
3
2
5-point Likert (importance)
Factor analysis using PCA (Varimax); Hierarchical and K-means cluster analyses; stepwise DA; Cross-tabulation analysis and Chi-square tests
a: based on Recreation Experience Preference Scale (Driver et al., 1991 a)
ANOVA: Analysis of Variance; DA: Discriminant Analysis; PCA: Principle Component Analysis used to explore the underiying dimensions by identifying factors comprising sets of interrelated variables
Tables 4.7 and 4.8 present details of 13 key studies: nine non-cultural-related key studies in the
tourism area (Table 4.5) and four cultural tourism empirical studies (Table 4.6). In terms of major
research objectives, all studies use benefits for market segmentation purposes or as one
dimension of multi-dimensional segmentation. Many of these studies however, also test
relationships between or influences of benefit segments and other variables.
Of the 13 studies reviewed in this section, the majority measure benefits sought including the four
cultural tourism-related benefit studies, only two measure benefits gained, and no studies measure
both.
In terms of what tourist benefits are measured in these studies, there is wide variation in the
number of benefit variables for both items measured (12-42) and dimensions found through factor
analysis (3-19), highlighting that there is not a commonly agreed scale for measuring tourist
benefits and many item sets include items that are site or location specific. As noted previously in
the literature review (Chapter 2, section 2.10.3), only one study of heritage site visitors in the US
(Weaver et al., 2002) uses an existing scale of Recreation Preference Scale (Driver et al., 1991a).
145

Chapter 4: Research Method
4.5.4.2 Benefit Dimensions Consensus
There has been considerable use of tourist benefit segmentation that allows the most commonly
found benefit dimensions to be identified. In the absence of a validated and agreed benefit scale,
identifying the most commonly found dimensions or individual items of relevance to these
dimensions can inform future tourist benefit research and guide the development of an appropriate
list of items for future cultural tourist benefit research. A summary of the most commonly found
benefit dimensions (or individual items of relevance to these dimensions) in the selected empirical
studies of tourist benefit research is presented in Table 4.9.
Table 4.9: Most commonly found benefit dimensions in the selected empirical tourist benefit research by tourism context (cultural tourism versus other tourism contexts)
Most Commonly Found Bene
AUTHOR(S)
Escape
Education/ Knowledge Entertainment Novelty (1) Social (Kinship) (2) Social (Recognition) (3) Social: meeting new and different people Safety
Self-Development/ Self-Esteem Relaxation Risk & daring/ Adventure Value Nature Appreciation (4) Heritage/ Culture Physical Sports
tn
ot, 2
00
(Fro
ch
x
x
x
X x
X
x
x
1997
) et
al.,
(Hsi
eh
x
X
X
X
X
Benefits Sought
002)
ro
(Jan
q
X
X
X
X
X
X
X
X
h-a> CD
Lear
y,
O T3 C ffi
(Lan
g
X
X
X X X
X
X
X
X
X
CM C:J O) T—
erdu
e,
andP
(L
oker
X
X
X X
X
X
CO OJ OJ
Rei
lly,
olan
d
o O o
X
X
X
, CO cn
al.,
19
(Mos
card
o et
X
X
X
X
X
X
X
X
X
OTA
L S
UB
T
7
5
3 2 5
4
1
1
1
5 2
1 4
4
4
Fit Dimensions Benefits Sought*
1998
) et
al..
(A
lzua
X
X
X X X
X
X
X
X X
T f o o CM
(Fro
ch
X
X
X
X
X
1
996)
ra
(Tia
n e
X
X
X X X
X
X
X
., 20
02
ere
ta
(Wea
v
X
X
X
X
OTA
L S
UB
T
3
4
2 2 4
2
1
1
1
3 0
1 2
1
0
Benefits
1994
) T
iake
r,
(She
er
X
X X
X X
Sained
cobs
,
ro
and
side
(W
ood
1985
)
X X
X
OTA
L S
UB
T
0
1
0 1 1
0
0
0
0
1 1
2 1
0
0
TOTA
l
1 0 1 0 5 5 1 0 6
2
2
2
9 3
4 7
5
4
1. Novelty: Alternative terms used included Exploration/Discovery/Something New/Excitement/Variety/Unique Identify 2. Social (Kinship): Alternative terms used included (socialisation/bonding/affiliation) 3. Social (Recognition): Alternative tenns used included Prestige/Show & Tell 4. Nature Appreciation: Alternative temis used included Environment aspects of destination •Cultural and heritage tourism-related research
Fifteen benefit dimensions of importance are most commonly found in these tourism studies.
Overall, the most commonly found benefits are identified in 10 studies and these are the benefit
dimensions of escape, education/knowledge and social (kinship). These were followed by
146

Chapter 4: Research Method
relaxation (9 studies), nature appreciation (7 studies), and social (recognition) (6 studies). Three
other benefit dimensions are identified in five studies: entertainment, novelty and heritage/culture
and two other benefit dimensions in four of the studies: value, and physical sports. Four remaining
benefit dimensions are found in three or two studies: risk & daring/adventure, social: meeting new
and different people; safety; and self-development/self-esteem. Seven of the fifteen dimensions
are identified in both benefits gained and benefits sought studies: education/knowledge; novelty;
social (kinship) relaxation; risk & daring/adventure; value and nature appreciation.
In the cultural tourist-related studies, 13 of the 15 benefit dimensions are also identified. Of the
eleven dimensions found in four or more of these 13 tourist benefit studies, all of these are also
found in one or more of the four studies of cultural tourist benefits. The four most commonly found
benefit dimensions in the cultural-related studies are similar to those found in the 13 studies overall:
education/knowledge, social (kinship), escape and relaxation. The first two of these dimensions
are found in all four cultural studies. Only the benefit dimensions of physical sports and risk &
daring/adventure are not found in any of the cultural tourist studies. Interestingly, nature
appreciation is a benefit dimension in two of the cultural related studies as well as five of the studies
overall. For cultural-related studies, the inclusion of a nature appreciation dimension would depend
on the definition of cultural attractions. Ten of the dimensions are identified in the cultural and
heritage tourist study of outbound UK tourists (Alzua et al., 1998) and eight in the study of visitors to
museums in Texas (Tian et al., 1996). Six of these benefit dimensions are found in both studies:
escape, education/knowledge, entertainment, novelty, social (kinship), and relaxation.
Furthermore, these six dimensions, include the four most commonly found dimensions in all of the
cultural-related studies as well as for the 13 studies overall. In addition, social (recognition) is
another benefit dimension found in two of the four cultural-related studies. These findings strongly
suggest that future research of cultural tourist benefits should include items for testing and
measuring many of these previously identified dimensions.
4.5.4.3 A Conceptual Typology of the Most Commonly Found Benefit Dimensions
To identify the underlying conceptual basis for the most commonly found benefit dimensions
identified in this study, each dimension is categorised in relation to benefit typologies and
conceptual trends identified from the literature and presented earlier in the discussioTi of what to
measure issues in benefits research (section 4.5.4.1). The following conceptual typology and
benefit dimension categorisations are proposed: psychological: education/knowledge; psycho
physiological: novelty; escape; entertainment; relaxation; heritage/culture, and nature appreciation;
socio-psychological: social (recognition); sociological, social (kinship); and economic: value.
When applied to cultural-and heritage-related tourism (shaded section. Table 4.7), this proposed
categorisation emphasises the importance of psychologically-based or part psychologically-based
dimensions in cultural tourism benefit research, especially the psycho-physiological-based
dimensions, many of which are hedonic pleasure-oriented or fantasy related. The importance of
socio-psychologically-based dimensions and sociologically-based dimensions in cultural tourism-
147

Chapter 4: Research Method
related benefit research is also emphasized. These categorizations endorse two eariier identified
research trends: i) the conceptual shift within the operatlonalisation of benefits identified by Tian,
Crompton, and Witt (1996) away from activities and amenities toward experiential and
psychological outcomes, and ii) agreement that hedonic benefits are considered more relevant to
cultural and experiential products than utilitarian benefits as claimed by Holbrook and Hirschman
(1982).
4.5.4.4 Benefit Constructs Measurement Scales
One limitation of identifying benefit dimension consensus and developing a typology of benefit
dimensions for application and testing in this study, is the familiar methodological problem and
dilemma that how something is measured (and statistically analysed) can determine the findings
and, preceding this, what is measured (and how it is defined) can determine how it is measured
(and statistically analysed) and this too can determine the findings. Hence the importance of
defining and conceptualizing these motivational process constructs and their underiying dimensions
prior to determining how to measure and test the constructs, their structure and any inter
relationships.
Based on the previous overview of tourism benefit research literature (Chapter 2, section 2.10.3)
and commonly identified underiying dimensions for these constructs (Chapter 4, sections 4.5.4.2
and 4.5.4.3), there is strong support from an extensive body of existing research that benefits make
a significant contribution to understanding and predicting of tourists' motivation and behaviour, that
is fundamental for marketing purposes. Both benefits sought and gained by tourists make a
contribution to this understanding. A better understanding of tourists' motivation and behaviour is
essential to maintain and increase tourist engagement with cultural attractions and events, and
therefore the following scales have been developed for measuring the benefits sought and benefits
gained constructs within the cultural experience tourist motivational process.
The resultant scale in the in-situ survey instrument included a section of 32 items relating to the
benefits sought construct within the motivational process and the after-visit survey comprised one
section of the same 32 items worded as perceived benefits gained from the cultural experience
(see Appendix 1 for the English language version). Seventeen of these items (in-situ survey Q4
items 4.1-4.17 and after-visit survey Part 2 items 01-17) relate to the commonly found
psychologically-based benefits dimensions for cultural tourists from existing research as discussed
earlier in this chapter in section 4.5.4.2 and, in turn, these items encompass the commonly found
benefits dimension within the conceptual typology categories of psychologically-based; psycho
physiological, socio-psychological and sociological items as discussed in section 4.5.4.3.
Psychologically-based items include education/knowledge; psycho-physiologically-based items of
relaxation; escape; entertainment, and involvement; socio-psychologically-based item of social
(recognition); and sociologically-based items of social (kinship); and social interaction.
148

Chapter 4: Research Method
The other fifteen of these 32 benefit-related items (in-situ survey Q4 items 4.18-4.32 and after visit
survey Part 2 items 18-32) measure attribute-based benefit dimensions relating to features of
activities, events, facilities and services that could apply to all cultural experiences but further ask
respondents to consider how these relate to the specific setting of the QVM. Two of these items
relate to commonly found benefits dimensions fi'om the existing literature of tourists in cultural and
other tourism contexts previously discussed in this chapter (section 4.5.4.2): safety and value. In
this survey, the latter item further relates to value for money and the economic value dimension
within the conceptual typology of commonly found benefits dimensions discussed in section
4.5.4.3.
The other 13 attribute-based items largely relate to specific service qualities of activities, facilities
and events, and in this respect most closely relate to Levels 1 and 2 of the Manning-Haas fourfold
hierarchy of demand suggested by Prentice (1993a) based on Manning (1986) from the work of
Haas, Driver and Brown (Haas et al., 1980) and applied by Prentice (1993a) to motivations of the
heritage consumer in the leisure market. In this hierarchy. Level 1 concerns activities and Level 2
concerns settings, including environment, social, and management settings, and the consumer's
expectations of these settings for the particular activities being pursued. Level 3 concerns
motivational experiences and Level 4 is the psychological and societal benefits gained from the
activity. While Level 4 of this hierarchy could be applied to benefits constmct items 1 to 17 of this
study's motivational process, Level 1 will also be of relevance to the cultural activity attitude
construct, and Level 3 will be of closest equivalence to the motives construct.
To minimise response set bias, interviewers are instructed to randomise the order in which the
items within the benefits sought construct question scale sets are asked. The benefits gained
questions are administered by self-complete survey, so response set bias has not been minimized
for this construct.
4.5.5 Measuring Other Characteristics of Relevance to the Cultural Experience Motivational Process
4.5.5.1 Socio-demographic Characteristics
The majority of empirical studies of tourist and event motivation include some socio-demographic
characteristics, although how these characteristics are used in this research has varied. The sole
use of demographic characteristics to describe different types of tourists is widely acknowledged as
at best a cmde and unreliable tool. Galloway (2002) acknowledges that motivation-based market
segmentation has typically been undertaken by reference to push factors, the most populariy
appealed to being socio-demographic variables. That the segmentation of martlets in terms of both
psychological as well as socio-demographic variables potenfially enables a better discrimination
between market members than does analysis in terms of only the latter, and this has been widely
agreed by a number of tourism researchers, is further acknowledged by Galloway (2002).
149

Chapter 4: Research Method
Since the 1990s, socio-demographic characteristics are more frequently used as profiling
descriptors or explanatory variables of tourist market segments that have been differentiated by
attitudinal or behavioural-based measurements. In research of cultural tourism outbound UK
international traveller segment niches, both behavioural (activities undertaken at a destination) and
attitudinal dimensions (benefits sought at a destination) were used as segmentation criteria within a
two-stage integrated cluster analysis, with analysis of variance (ANOVA) used to validate the
clusters by studying the relationships between the cluster factors and the explanatory variables,
that include socio-demographic and trip characterisfics (Alzua et al., 1998). The socio-
demographic characteristics researched by Alzua et al. (1998) were marital status, income,
occupation, age, formal education and second language proficiency. Gender was not included as
a characteristic in this study, but is commonly included in most other tourism and motivation
empirical studies.
Several demographic characteristics have been selected to be included in this study because of
their relevance to the primary research focus of cultural experience motivational process constructs,
and whether tourist market cultural group differences exist within these constructs. The measures
of culture used in this study - country or region-of-residence, and language most spoken at home -
are two essential socio-demographic measures. Nationality is not included per se because it has
been criticised as a sole discriminating variable for explaining the differences found in tourist
behaviour and cross-cultural tourism marketing research as discussed eariier in the literature
review (Chapter 2, section 2.11) with some authors preferring cross-cultural differences because
they are broader and reflect more possible differences found in tourist behaviour (e.g., Dann, 1993;
Dimanche, 1994).
Age, and gender are two other characteristics selected for inclusion in this study, largely so that any
response bias by gender and age can be identified.
4.5.5.2 Travel Group and Trip Characteristics
The majority of empirical studies of tourist motivation include some travel group and trip
characteristics that are usually used as profiling descriptors or explanatory variables of the market
segments. The trip characteristics used by Alzua et al. (1998) in research of cultural tourism
outbound UK international traveller segment niches were travel frequency, main purpose of trip,
expenditure of all the people in your travel budget, mean values of amounts spent on travel trip
components, type of accommodation, and number of nights away from home.
The trip and travel group characteristics deemed of particular relevance to this study and so
included in the in-situ questionnaire and screening questions (Appendix 1 for the English language
version, screening intercept questions and in-situ survey Q5 items 5.1-5.8.16) are: length of stay in
Melbourne (as this further screened tourists visitors from non-tourist visitors), main purpose of this
trip to Melbourne, type of accommodation used in Melbourne this trip, main form of transport used
to get to the QVM, repeat or first time visitor to Melbourne, Australia, and to the QVM, how the visit
150

Chapter 4: Research Method
to QVM was arranged, travel group composition this visit to QVM, and information sources used to
hear about QVM. These travel group characteristics are included because previous research has
found that how tourists experience events affects motivation (Formica and Murrmann, 1996)
including travel group membership. In research of travel motivations of overseas Gemnan visitors
(Jamrozy and Uysal, 1994) group membership as well as social motivations were found to be more
significant explanations for leisure behaviour than psychological needs. The repeat or first time
visitor characteristics are included because previous event motivation research has found first time
and repeat visitors have different motivations (Scott, 1996).
4.5.6 Scales Used in the Survey Instruments
Six-point Likert-type scales of agreement are used to facilitate quick interviews and to avoid the
potential problem of respondents taking the neutral or midpoint response, which in effect expresses
a "no opinion", "not sure' or "neither agree nor disagree" option (Netemeyer et al., 2003) and these
options can occur when interviewing in collectivlst Asian cultures (Chen et al., 1995). Likert-type
scales have been used to measure attitudes since developed by R. Likert (1932), and they are still
widely used today, largely because they produce the desirable measurement scale property of
sufficient variance in the overall scale for a given sample (Netemeyer et al., 2003). A six-point
scale should produce sufficient variance.
An agreement-rating approach rather than an importance-rating approach is adopted in this study,
as both are widely used in tourism motivation and benefit research (e.g.. Table 4.7 and 4.8
summarising benefits study methodology supports wide use of both agreement and importance-
rating scales).
Multi-item measures for each of the four motivational process constructs are adopted in this study
rather than single item measures because they are better measures for marketing constructs
(Churchill, 1979; Peter, 1979).
4.5.7 Expert Opinion, Pre-testing and Translation of the Survey Instruments
In addition to Victoria University Faculty of Business and Law ethics committee approval for the
survey instruments and associated materials, nine experts were approached for their opinion.
Several of these experts were selected because of their experience in tourism research projects,
and others because of their expertise in mari<eting research instrument design, data collection
methods, and data analysis statistical procedures, including a co-author of a text on applied
research design for business and management. Their opinions were valuable and resulted in
important changes to the wording of particular question items within the main constructs of interest
to this study, and particularly useful structural changes to the survey instruments whereby personal
demographics were separated from the in-situ questionnaire into an interviewer's intercept report
sheet, and the introduction of an identification process to match in-situ surveys with after-visit
151

Chapter 4: Research Method
sun/eys so that respondents would not be required to repeat their demographic, trip and travel
group characteristics.
The survey was then pre-tested with a convenience sample of post-graduate students of Victoria
University that included domestic Australian residents, English speaking international students fi'om
Asia and the United States, as well as Chinese speaking international students from several Asian
countries. Preliminary analysis of the items within the main constructs and the trip and travel group
characteristics indicate no problems with the wording, phrasing and sequencing of these questions.
Modifications were required to the personal demographic questions in the intercept report sheet to
enable it to function as an effective instrument for screening eligible respondents from the eight
selected population units.
Following the modifications to the survey instruments arising from the expert opinions and the pre
testing of the survey, the final survey instruments were professionally translated into Japanese and
Chinese (simplified written fomn) with the after-visit survey also translated in Chinese (traditional
vifl'itten form) to assist self-completion by Chinese speaking tourists from Hong Kong. All translated
survey instruments were then back-translated by the tri-lingual data collector research assistant,
and some minor amendments were undertaken to the final translated survey instruments, to
maximise translation equivalence in all the languages of interest to this study.
4.6 Data Analysis
4.6.1 Descriptive Analysis Approaches
The data is examined in a variety of ways. Firstly, each of the 153 items from the combined in-situ
and after-visit surveys are checked for data-entry errors and missing data prior to further analysis.
Descriptive statistics of the population sample's profile for selected demographics, travel and trip
characteristics is then undertaken by examining frequencies and percentages in SPSS (version
12.0) for the sample as a whole who completed the in-situ survey and the subsample of those
respondents who completed the after-visit survey. For both of these samples, two further
subsamples (international and domestic tourists) are considered so that the representativeness of
the samples collected in this study by purposeful convenience sampling compared with the wider
population of international and domestic tourists to Australia and the state of Victoria, can be
assessed on selected criteria for which information exists.
Whether the after-visit survey respondents are sufficiently representative of the in-situ survey
respondents in order for the larger sample to be used to measure the three motivational process
constructs of attitudes, motives, and benefits sought, and the smaller subsample to be used for the
fourth motivational process construct of benefits gained, is then tested by two sample proportions
tests for the various demographic, travel and trip characteristics. The Mann-Whitney U test in
SPSS (version 12.0) is selected for these statistical tests of the difference in location of central
152

Chapter 4: Research Method
tendency on selected variables because it is a powerful non-parametric equivalent of the
parametric t test, and is best suited instead of the two-independent-samples t test for means where
the rigid parametric assumptions about the distribution of the variable are invalid. This test does not
require assumptions about the shape of the underiying distribution (e.g., does not assume normality
of distribution) or does it require that the variable be measured on an interval scale; an ordinal scale
is sufficient (Norusis, 1990). Significance levels for the Mann-Whitney U test can be determined
regardless of the shape of the population distribution as they are based on ranks (Norusis, 1990).
In the Mann-Whitney U test as described by Malhotra et al., (1996), the two samples are combined
and the cases are ranked in order of increasing size. The test statistic, U, is computed as the
number of items a score from sample or group one precedes a score from group two. If the
samples are from the same population, the distribution of scores from the two groups in the rank list
should be random. An extreme value of U would indicate a non-random pattern pointing to the
inequality of the two groups. For samples larger than 30, rather than reporting the exact
significance level for U, it is transformed into a normally distributed z statistic that can be connected
for ties within ranks. For the nominal variables with dichotomous scales, a chi-square test for
interdependence or relatedness will also be undertaken to further analyse the relationship between
the two variables. This tests for significant difference in proportions obtained from the two
independent samples by using the cross-tabulation procedure to conduct a chi-square test
(Malhotra etal., 1996).
For the 124 items measuring the four motivational process constmcts of attitudes, motives, benefits
sought and benefits gained on a Likert-type, interval scale, further descriptive statistics associated
with frequency distribution are then undertaken to assess the normality of data. Several most
commonly used statistics associated with frequencies are used in this study: the mean value as a
measure of location, standard deviation as a measure of variability, skewness and kurtosis as
measures of shape (Malhotra et al., 1996); as well as identification of outlier observations which
can have a mari<ed effect on any type of empirical analysis (Hair et al., 2006). These descriptive
statistics are provided for the total respondents in Chapter Five and tables summarizing the ranking
of the measurement items by mean scores of agreement with the statements measuring each
motivational process constmct are also included within Chapter 5 for the total respondents. This
enables the most strongly agreed and disagreed items for each of the four constructs to be
identified and discussed.
4.6.2 Construct Dimensionality Analysis
4.6.2.1 Approaches to Construct Dimensionality Analysis
Several approaches have been used for developing and validating scales to measure latent
constructs which are constmcts that cannot be measured directly or so precisely as to eliminate
uncertainty and so are represented or measured by one or more indicafing variables (Hair et al.,
2006). All four constructs of interest to this study - cultural experience attitudes, motives, benefits
sought and benefits gained - are latent constructs which previously referred to research, earlier in
153
Chapter 4: Research Method
this chapter and the literature review, strongly indicates are comprised of further underiying
dimensions or latent constmcts.
The two most commonly used statistical methods to date for reducing sets of variables into smaller
sets of new, composite dimensions or variates (factors) with minimum loss of information are factor
analysis (FA) and principal component analysis (PCA). As the basic difference between these two
methods is how the variance is partitioned (Hair et al., 2006), the selection of one method over the
other should be based on two criteria: (1) the objectives of the factor analysis, and (2) the amount of
prior knowledge about the variance in the variables. Hair et al., (2006) further recommend that
PCA be used when the objective is to summarise most of the original information (variance) in a
minimum number of factors for prediction purposes, and FA be used primarily to identify underiying
factors or dimensions that reflect what the variables share in common. Gorsuch (1990) argues that
common factor analysis is the general case of which component analysis is the special case
because it limits the broader model of FA by an addifional assumption that the variables are
reproduced without error. Therefore, component analysis is a possibility where variables are truly
measured without error. He attributes the widespread use of PCA with Varimax rotation to its easy
programmability in the 1950s and 1960s when there were problems compufing common factor
analysis which no longer exist, its continuation as the default factor analysis method on computer
programs designed during an eariier era, and to its recommendation in Nunnaliys (1967) textbooks
first published back at the time of the first and second generation computers. Gorsuch (1990)
recommends common factor analysis should be routinely applied as the standard analysis
because, "it recognizes we have en-or in our variables, gives unbiased instead of inflated loadings,
and is more elegant as a part of the standard model used in univariate and multivariate analysis" (p.
39).
Both PCA and FA methods predate causal modelling and its use in marketing which has had a
slow but steady growth since its inception in the late 1970s and its great impact in the sister
disciplines of the social sciences (BagozzI, 1982). By 1982, causal modelling had been recognised
as a general approach for integrating the theory-constmction phase of research with the empirical
and hypothesis-testing stages with three uses: (1) a measurement tool to develop scales and
indices and to assess reliability, (2) a procedure for examining the many forms of construct validity,
or (3) a methodology for testing hypotheses, making predicfions, or evaluating cause and effect
(BagozzI, 1982). Since 1982, causal modelling has confinued to be applied to marketing research
and more recently to tourism research, with several different approaches evolving to its use in all of
these disciplines over these past 25 years. Confirmatory factor analysis (CFA) within stmctural
equation modelling (SEM) has emerged as a particulariy useful tool for developing and testing
measurement models of construct dimensions and examining the extent of interrelationships and
covariation (or lack thereof) among the latent constructs (Schreiber et al., 2006). In their seminal
article published in Psychological Bulletin, Anderson and Gerbing (1988) recommend an
application of CFA that has been extensively cited in the social sciences and marketing research
and will be applied in this study. They advocate separate estimation (and respecification) of the
154

Chapter 4: Research Method
measurement model as a theory testing and development approach using SEM that is
complementary to a predicfive application. For the theory testing and development approach they
further recommend the full-information estimation approach using Maximum Likelihood in
conjunction with the common factor model. Relafive strengths of this approach cited by Anderson
and Gerbing (1988) include providing the most efficient parameter estimates that best explain the
observed covariances and an overall test of model fit. These strengths are due to the full
information approach of the common factor model,
where observed measures are assumed to have random error variance and measure-specific variance components (referred to together as uniqueness in the factor analytic literature, e.g., Harman, 1976) that are not of theoretical interest. This unwanted part of the observed measures is excluded from the definition of the latent constructs and is modeled separately. Consistent with this, the covariances among the latent constructs are adjusted to reflect the attenuation in the observed covariances due to these unwanted variance components. Because of this assumption, the amount of variance explained in the set of observed measures is not of primary concern, (p. 412).
Another strength of using maximum likelihood in conjunction with common factor analysis in an
exploratory factor analysis preceding a confirmatory factor analysis in contemporary structural
equation modelling statistical program such as AMOS, is that the maximum likelihood extraction
method is consistent with maximum likelihood estimation algorithm that has dominated SEM and is
used in AMOS.
Shortcomings of the full-infomnafion estimation approach noted by Anderson and Gerbing (1988)
include inherent indeterminancy in the estimation of factor scores because of the underiying
assumption of random emor and measure specificity. In theory testing applications this is not a
concern but in predictive applications this is likely to result in some loss of predictive accuracy.
Other considerations when undertaking factor analysis, are the distinction between exploratory and
confirmatory factor analysis and variations in the application of exploratory and confirmatory
approaches. Anderson and Gerbing (1988) note that the distinction between exploratory and
confirmatory factor analysis is not so clear cut. They propose that it be thought of as an ordered
progression starting with an exploratory factor analysis in which there is no prior specification of the
number of factors. Using a maximum likelihood (ML) exploratory program is then the next step in
the progression as a hypothesized number of underiying factors can be specified and the goodness
of fit of the resulting solution can be tested. Testing a measurement model in a confirmatory
program is a form of restrictive analysis that has historically been referred to as confirmatory
analysis. The measurement model needs to be specified a priori, although the parameter values
themselves are freely estimated except for those parameters that have been restricted a priori,
typically to zero.
An overview of the application of exploratory and confirmatory factor analysis in tourism research
reveals variations in approach and changing trends over the years. Exploratory factor analysis has
155

Chapter 4: Research Method
been widely used to reduce sets of items into a smaller number of underlying dimensions with the
dominant statistical analysis method being Principal Component Analysis (PCA) extraction method
in combination with VARIMAX orthogonal rotation method to achieve simple structure. This
dominant method is evidenced eariier in this Chapter in Tables 4.7 and 4.8 summarising selected
empirical studies of tourist benefit research (non-cultural and cultural^related) published between
1998 and 2005. All of these studies, however, use PCA to reduce the set of variables that are then
used in further multivariate analysis techniques such as cluster analysis, ANOVA (Analysis of
Variance), Discriminant Analysis and Chi-square tests on independent variables and clusters. It
should be noted that none of these studies are using EFA as the first stage of analysis preceding
CFA as proposed in this study.
Although PCA with VARIMAX rotation is the dominant method in these selected published tourism
benefit studies, various other EFA statisfical methods have been used in other published tourism
and cultural event services marketing research. For example. Principal Axis Factoring (PCA) with
VARIMAX rotation was used to research the importance and dimensionality of senior motorcoach
traveller choice attributes (Hsu, 2001), whereas research of the underiying dimensions of
customers' evaluation of musical performances used Maximum Likelihood extraction and OBLIMIN
oblique rotation (due to an anticipated correlation between the factors) (Minor et al., 2004).
A core problem of using exploratory factor analysis to identify construct dimensions is that factors
lacking logical internal consistency can be rendered due to the exploitation of chance variance
(Eastgate et al., 2006). Confirmatory measurement models are recommended to overcome this
problem as they allow a model of latent and observed variables to be specified and tested. A good
fit of the model supports the hypothesized relationships, but does not rule out other possible
relationships that were not specified and tested.
Recent articles appearing in major tourism research journals suggest an increasing number of
researchers favour going directly to CFA to confirm an a priori specified number of dimensions
without undertaking EFA. Measures derived from the literature, expert panels or modified
established scales are refined in confirmatory techniques (e.g., Eastgate et al., 2006; McGehee et
al., 2007). Similar trends of steadily increasing use of CFA while the use of EFA is declining have
also been noted in the organisational research literature (Huriey et al., 1997). This approach would
be preferred where measurement models have a well-developed underlying theory of hypothesized
patterns of loadings (Huriey et al., 1997). The absence of pre-validated, generic scales for
measuring cultural experience motivational process constructs and well-developed underlying
theory of pattern loadings, cautions against using this approach in this study.
Another disadvantage of the future application of existing motive scales and replication of these
studies in CFA is where the resultant subscales for some dimensions comprise only two-items
following the removal of multi-dimensional items and respecification of the model (e.g., Eastgate et
al., 2006). Two-item variables are problemafic in CFA and good pracfice dictates a minimum of
156

Chapter 4: Research Method
three items per factor, preferably four (Hair et al., 2006). Heywood cases in SEM are likely to result
where the three indicator mie is not observed (Nasser and Wisenbaker, 2003), and these cases are
where the factor solution produces a logically impossible result of an en-or variance estimate of less
the 0 (a negative en-or variance) which implies by inference that more than 100 percent of the
variance in an item is explained (Hair et al., 2006).
Others argue that EFA may be appropriate for scale development (Huriey et al., 1997) and a study
by Gerbing and Hamilton (1996) using Monte Cario methods found that EFA can contribute to
model specification when used prior to cross-validation using CFA. Hence it could be argued, that
until prevalidated subscales with at least three or four items per constmct dimension have been
developed, it is preferable to use an expanded subscale of items derived from the literature and
expert panel, undertake EFA to identify underiying dimensions and then CFA to establish
confidence in the measurement model by specifying the posited relations of the observed variables
to the underiying constructs and testing the fit of the actual data to the specified model.
Advantages of EFA for scale development are that it shows the actual magnitudes of cross-
loadings which are not shown in CFA (Huriey et al., 1997), whereas CFA is better than EFA in
allowing the measurement models to be tested and compared for invariance with multiple groups
(Hurley etal., 1997).
The application of CFA in tourism research has been increasing in recent years particulariy and is
even more evident in recent tourism conference proceedings (e.g., Dai et al., 2006; Eastgate et al.,
2006; Hwang and Lim, 2006). Specific application of CFA to tourism motivation-related scales,
measurement models and dimensions is extremely limited to date in published articles within major
tourism research journals. One recent exception is CFA research of Iso-Ahola's motivation theory
(Dunn Ross and Iso-Ahola, 1991; Iso-Ahola, 1980; 1982; 1983; 1989) in a tourism context
(Snepenger et al., 2006). Prior to Snepenger et al.'s study (2006), they identify the predominate
approaches for identifying motives (general and specific) for tourism as including personal
interviews, descriptive studies using surveys, and exploratory factor analytic investigations.
4.6.2.2 Rationale for the Construct Dimensionality Analysis Approaches Used in this Study
As this study aims to develop and test scales for cultural experience motivation latent constructs
and to also test for cross-cultural group invariance, the Gerbing and Hamilton method (1996), using
EFA prior to cross-validation with CFA will be the preferred method to be used in this study. This
approach applies mulfiple-group structural equation modelling frequently used in cross-cultural
psychology and social sciences research (e.g., Byrne and Campbell, 1999), to the allied context of
cross-cultural research of tourist motivation in relation to cultural experiences. EFA is used prior to
cross-validation with CFA because of the previously acknowledged absence of prevalidated,
generic scales for each of the four cultural experience motivational process constmcts with at least
three or four items per construct dimension as dictated by good practice in CFA (Hair et al., 2006).
A two-step process of EFA followed by CFA capitalises on the advantages of EFA for scale
development in showing the actual magnitudes of cross-loadings which are not shown in CFA
157

Chapter 4; Research Method
(Huriey et al., 1997), and the advantage of CFA allowing the measurement models to be tested and
compared for invariance with multiple groups (Huriey et al., 1997).
Within the EFA, the Maximum Likelihood (ML) full-infomnation esfimation method will be used to
extract the factors because of its previously acknowledged addifional strength of being consistent
with the maximum likelihood algorithm that has dominated SEM and is used in AMOS and the
suitability of ML for theory testing applications proposed in this study rather than predictive
applications where there is some loss of accuracy. An oblique factor rotation (OBLIMIN) rather
than orthogonal factor rotafion will be used because the same general principles of orthogonal
rotations pertain to oblique rotations, but the latter is more flexible because the factor axes need not
be orthogonal and the theorefically important underiying dimensions are not assumed to be
uncon-elated with each other (Hair et al., 2006). Oblique rotation methods are also advised when
the goal of EFA is scale development that looks for the degree to which multiple scales/dimensions
con-elate (Netemeyer et al., 2003) as proposed in this study.
The CFA will be undertaken in AMOS version 5.0, and within the CFA both pattern and stmcture
coefficients will be interpreted because of the benefits of using stmcture coefficients in SEM CFA
studies in which factors are correlated (Thompson, 1997).
4.7 Summary
This chapter defines the target populafion, overviews background to the research site, the sampling
frame and procedures and details the data collecfion instruments, scaling techniques and data
analysis methods. Specific research method and measurement issues associated with undertaking
cross-cultural research are also considered.
The absence of prevalidated, generic scales for measuring each of the four motivational process
constmcts of interest to this study in a cultural experience context is acknowledged. Consequently,
multi-item measurement scales for the cultural experience motivational process constmcts of
attitudes, motives, benefits sought and benefits gained are developed in this chapter from the
literature relating to measuring each of the constructs and any consensus regarding the common
dimensions found in previous research for each of the constmcts. Six-point Likert-type scales of
agreement are the preferred scaling technique for each of the four mofivational process constmcts
question sets because of their suitability for measuring attitudes, particulariy in a cross-cultural
research, and their desirable property of producing sufficient variance in the overall scale for each
of the samples.
Prior to on-site primary data collecfion, these scales and proposed data analysis methods are
further checked by expert opinion and pretested on a cross-cultural convenience sample. The
proposed data analysis methods include preliminary data analysis to check for data-entry en-ors
and missing data. Descriptive stafistics of the population sample's profile for selected
158

Chapter 4: Research Method
demographics, travel and trip characteristics is then proposed to assess the representafiveness of
the samples collected in this study by purposeful convenience sampling compared with the wider
populafion of intemational and domestic tourists to Australia and the state of Victoria. Two sample
proportions tests are then proposed to test whether the after-visit survey respondents are
sufficiently representative of the in-situ survey respondents in order for the larger sample to be used
to measure the three motivational process constructs of attitudes, mofives, and benefits sought,
and the smaller subsample to be used for the fourth motivational process constmct of benefits
gained.
The various approaches to constmct dimensionality analysis are considered and the preferred data
analysis methods to be used in this study are a two-step method using EFA prior to undertaking
cross-validation with CFA and invariance testing of the CFA measurement model for cultural group
invariance. This approach is best suited to the testing of scales for measuring cultural experience
motivational process latent constmcts and also to test for cross-cultural group invariance. It applies
multiple-group structural equation modelling frequently used in cross-cultural psychology and social
sciences research to the allied context of cross-cultural research of tourist motivation in relation to
cultural experiences.
159

Chapter 5: Descriptive Analysis Results
Chapter 5 Descriptive Analysis Results
5.1 Introduction
In Chapters Two and Three, the conceptual frameworks underpinning the thesis were discussed.
A model was developed based on this information and research questions and hypotheses
emerging from the model were proposed. The research methodology used for this study was then
described in Chapter Four. The next three chapters detail and discuss the results of the data
analysis undertaken for this study. Chapter Five focuses on the descriptive analyses of the data
and the subsequent examination of the data and Chapter Six focuses on testing the hypotineses
that were developed and presented in Chapter Three of this thesis. In this chapter the data for the
respondents in the sample of this study is firstiy analysed to investigate the profile characteristics of
the sample as a whole and then as two subgroups - international and domestic tourists - so that
the representativeness of the sample compared with the wider population of international and
domestic tourists to Australia and the state of Victoria can be assessed on selected criteria for
which information exists. A similar approach is then applied to the analysis of the trip and travel
characteristics. In the third section, the measurement items for the four motivational process
constructs are analysed for normality, central tendency and spread, and ranking by mean scores.
Two sample proportions tests for significant differences between those respondents who
completed the after-visit survey and those who did not are undertaken to establish whether the
large in-situ survey sample can be used for the three motivational process constructs of attitudes,
motives and benefits sought and the smaller after-visit survey sample can be used for the fourth
motivational process construct of benefits gained. The chapter concludes with preliminary data
analysis of scale reliability and missing values to ascertain the suitability of the data for subsequent
factor analyses in Chapter Six.
5.2 Cleaning Data
Descriptive frequencies on each of the 153 variables in the combined in-situ and after-visit surveys
is firstly undertaken to identify any data entry errors and missing values prior to any further analysis.
5.3 Sample Demographic Characteristics
Purposeful convenience sampling and some quota sampling is used in this research to identify
eligible respondents and to endeavour to obtain sufficientiy sized samples of the eight selected
tourist population groups of interest to this study. A sample of 961 completed in-situ surveys was
obtained from respondents sampled from the combined eight population groups as previously
discussed in Chapter Four, section 4.3.4. As shown in Table 5.1, female respondents are a higher
percentage of the sample (approximately 55%) compared to male respondents (approximately
160

Chapter 5: Descriptive Analysis Results
45%). Almost 44% of respondents are 45-64 years of age, but 45% are 18-44 years. A further
10.5% are 65 years or over.
Table 5.1: Demographic profile of the respondents to the in-situ survey (N = 961)
Variable Characteristic
Gender
Female
Male
Missing
Age
18-24
25-34
35-44
45-54
55-64
65-74
75+
Missing
Language Most Spoken at Home
English
Chinese (Mandarin)
Chinese (Cantonese)
Chinese (Dialect)
Japanese
Missing
Frequency
524
430
7
123
170
140
207
214
•91
10
6
720
75
37
10
119
0
Percentage
54.5
44.7
0.7
12.8
17.7
14.6
21.5
22.3
9.5
1.0
0.6
74.9
7.8
3.9
1.0
12.4
0.0
Table 5.2: Demographic profile of international and domestic tourist respondents to the in-situ survey
Variable Intemational Tourists (N=646)
Frequency Percentage
Domestic Tourists (N= 315) j
Frequency Percentage Gender
Female
Male
Missing
342
298
6
52.9
46.1
0.9
182
132
1
57.8
41.9
0.3 Age
18-24
25-34
35-44
45-54
55-64
65-74
75+
Missing
101
142
89
104
134
65
9
2
15.6
22.0
13.8
16.1
20.7
10.1
1.4
0.3
22
28
51
103
80
26
1
4
7.0
8.9
16.2
32.7
25.4
8.3
0.3
1.3
Language Most Spoken at Home
English
Chinese (Mandarin)
Chinese (Cantonese)
Chinese (Dialect)
Japanese
Missing
405
75
37
10
119
0
62.7
11.6
5.7
1.5
18.4
0.0
315
0
0
0
0
0
100.0
0.0
0.0
0.0
0.0
0.0
161

Chapter 5: Descriptive Analysis Results
To make comparisons between the sample and its representativeness of tourists to Australia and
Melbourne, the sample has been further analysed into two subgroups: domestic tourists and
international tourists as shown in Table 5.2.
Although infomnation about the gender of tourists to Australia and Melbourne is not available, the
gender balance of the two sample subgroups (domestic and international tourists, respectively) is
similar to that of the whole group with female respondents a slightiy higher percentage of the
sample (approximately 58% cf 53%) compared to male respondents (42% cf 46%). Age groups
show some differences between the two subgroups (Table 5.2) and the whole group (Table 5.1).
While the marginal majority for the whole group is 18-44 years of age (45%), this age group is the
majority for the international tourists (51%), but just under a third of the domestic tourists (32%).
The majority age group for the domestic tourists is 45-64 years of age (58%), with the single largest
age group being 45-54 years (32%). In summary, respondents' ages span from 18 years to over
75 years for the whole group and the two subgroups, but the majority of domestic tourists are older
than the majority of international tourists.
Compared with the age of tourists to Australia and Victoria which are similar percentages for each
age group (Table 5.3), the majority of the total sample are older. The international tourist sample is
similar for 18-24 years and 45-64 years but has less 25-44 year olds (36% cf 42%) and more 65
years or over (12% cf 7%). The majority of the domestic tourist sample in the 45-64 years is much
greater (58% cf 33%), but all other age groups are less.
Table 5.3: Age of sample compared to visitors to Australia and Victoria
Age Group
18-24 years
25-44 years
45-64 years
65 years or over
Total
Sample
13%
32%
44%
11%
Sample Subgroups
International
Tourists
16%
36%
37%
12%
Domestic Tourists
7%
25%
58%
9%
Age Group
(if different from sample)
15-24 years
Intemational Visitors*
Victoria
17%
42%
34%
7%
Australia
16%
43%
34%
7%
Domestic Visitors*
Victoria
17%
38%
33%
12%
Australia
17%
39%
33%
11%
*Tourism Victoria (2005c); Note: Percentages may not add to 100% due to rounding or missing values
The language most spoken at home variable shown in Tables 5.1 and 5.2 is used as an indicator of
culture in this study and based on the purposeful convenience and quota sampling method used in
data collection, the resulting three language groups reflect the eight selected tourist populations of
interest to this study: English-speaking tourists (domestic from NSW, Qld, SA, and international
from NZ, UK, US); and Chinese- or Japanese-speaking international tourists from Asia. Of the
Chinese-speaking respondents, the majority spoke Mandarin (approximately 61 %), almost a third
spoke Cantonese (30%) and a small proportion spoke other Chinese dialects (8%). Some tourists
are sampled from these three language groups who resided in other regions or countries such as
English-speaking international tourists from Asia, but these respondents have been removed from
the sample as they did not attain the minimum sample size for separate analysis, which was
162

Chapter 5: Descriptive Analysis Results
previously discussed in Chapter Four, section 4.3.5. Table 5.2 confirms that in the final sample, all
domestic tourists are English-speaking and the proportions of the international tourists who are
Chinese-speaking or Japanese-speaking are similar.
The demographic profile of the respondents who completed the after-visit survey are shown in
Tables 5.4 and 5.5 and these respondents are a further subgroup of the in-situ survey respondents
shown in Tables 5.1 to 5.3.
Table 5.4: Demographic profile of the respondents to the after-visit survey (N = 418)
Variable Characteristic
Gender Female
Male
Missing
Age 18-24
25-34
35-44
45-54
55-64
65-74
75+
Missing
Language Most Spoken at Home
English
Chinese (Mandarin)
Chinese (Cantonese)
Chinese (Dialect) Japanese
Missing
Frequency
247
167
4
33
66
57
107
106
42
6
1
325
33
16
8
36
0
Percentage
59.1
39.9
1.0
7.9
15.8
13.6
25.6
25.4
10.0
1.4
0.2
77.8 7.9
3.8
1.9 8.6
0.0
Table 5.5: Demographic profile of international and domestic tourist respondents to the after-visit survey
Variable Intemational Tourists (N=280)
Frequency Percentage
Domestic Tourists (N=138)
Frequency Percentage
Gender
Female
Male
Missing
166
111
3
59.3
39.6
1.1
81
56
1
58.7
40.6
0.7
Age
18-24
25-34
35-44
45-54
55-64
65-74
75+
Missing
26
58
35
56
67
32
6
0
9.3
20.7
12.5
20.0
23.9
11.4
2.1
0.0
7
8
22
51
39
10
0
1
5.1
5.8
15.9
37.0
28.3
7.2
0.0
0.7
Language Most Spoken at Home |
163

Chapter 5: Descriptive Analysis Results
English
Chinese (Mandarin)
Chinese (Cantonese)
Chinese (Dialect)
Japanese
Missing
187
33
16
8
36
0
66.8
11.8
5.7
2.9
12.9
0.0
138
0
0
0
0
0
100.0
0.0
0.0
0.0
0.0
0.0
Gender balance for this sample and its two subgroups (domestic and international tourists), is
similar to that of the whole group and its two subgroups with more female respondents compared to
male respondents for all groups. The female respondents in the after-visit survey sample are a
slightiy higher percentage than for the in-situ survey sample (approximately 59% cf 55%) and the
con'esponding percentage of male respondents is slightiy lower (approximately 40% cf 45%). The
age of the majority of the after-visit subgroup are similar to the whole group for respondents 45-64
years of age (51% cf 45%), 18-44 years (37% cf 44%), and 65 years and over (11% for both
groups). Also similar to the whole group, the intemational and domestic tourist subgroups for the
after-visit sample differ from the whole sample and in a similar trend, whereby a greater proportion
of the international respondents are in the younger 18-44 years category (42% cf 51%) and a much
greater proportion of the domestic tourists are in the 45-64 years category (65% cf 58%).
In relation to language most spoken at home, the Chinese-speaking international tourists show
similar subgroup proportions to the whole group (13% for both groups) and the form of Chinese
language spoken is of similar proportion with the majority speaking Mandarin (58% cf 60%), almost
a third speaking Cantonese (28% cf 30%) and a small proportion speaking other Chinese dialects
(14% cf 8%). Table 5.5 confimas that in the final after-visit sample, all domestic tourists are English-
speaking, but the proportion of international Japanese-speaking respondents is less than the
Chinese-speaking respondents (9% cf 13%) and much less for the whole subgroup sample (Table
5.4) compared with the Japanese-speaking proportion of the in-situ survey (9% cf 12%).
5.3.1 Demographic Profile Summary
The gender balance of the samples is quite representative with a marginally higher proportion of
females to males for the total sample (55% cf 45%) with similar proportions for the domestic tourist
subsample (58% cf 42%) and the international tourist subsample (53% cf 46%). For the after-visit
survey, the proportion of females to males was slightiy higher (60% cf 40%), with the same
proportions for the domestic and international tourist subsamples.
Age groups show some difference between the total sample, the two subsamples of domestic and
international tourists, and in comparison with all tourists to Australia and Victoria. While
respondents' ages range from 18 years to over 75 years for all samples and subsamples, the
majority of domestic tourists are older than the majority of international tourists and the domestic
tourist sample aged 45-64 years is much greater than for all domestic tourists to Australian and
Victoria (58% cf 33%). Similariy, the international tourist sample is also marginally older compared
164
Chapter 5: Descriptive Analysis Results
with all international tourists to Australia and Victoria with marginally more 45-64 years (37% cf
34%) and even more 65 years or over (12% cf 7%). The after-visit sample has a greater proportion
aged 45 years or over than the total sample (62% cf 54%) with even greater proportions for the
domestic tourists (73.5%) than the international tourists (58%). These age group proportions
suggest some caution should be applied when infen-ing the study results to the younger age groups
of 18-34 years, especially for domestic tourists. This difference is even more pronounced for the
after-visit sample, which measures the benefits gained construct, with only 24% being 18-34 years,
compared with 31% for the total sample, while domestic tourists in this age group comprise only
11%. The low proportions of domestic tourists 18-34 years, further suggests that the QVM is less
popular for the younger adult members of this tourist group.
The cultural profile of the samples based on language spoken at home, shows 100% English-
speaking samples for all of the Western markets. The proportions of Chinese- and Japanese-
speaking international tourists are similar for the total sample (13% and 12%, respectively), but
considerably less Japanese-speaking tourists completed the after-visit survey representing only 9%
of the total after-visit sample. As discussed in Chapter Six, the sample sizes for the various cultural
groups within the after-visit survey restrict cultural group analysis of the benefits gained construct
measured in the after-visit survey, to three combined samples: two English-speaking Western
tourist groups (domestic tourists and international tourists) and one group of Chinese- and
Japanese-speaking Asian tourists.
5.4 Trip and Travel Characteristics
The characteristics of respondents visiting Melbourne are shown for the whole sample (Table 5.6)
and then for the international and domestic tourist subgroups (Table 5.7). Just over half of the
whole sample had visited Melbourne previously, but by subgroup, more domestic tourists are
repeat visitors (87%) than the international tourists (36%). More than 62% of all respondents are
visiting Melbourne on holiday, while another 17% or more are visiting friends and relatives. Almost
10% of all the respondents chose the 'other' category for this question (16% for the domestic tourist
subgroup), and further analysis of some additional comments written on the surveys for this
question, revealed many of these were visiting Melbourne to attend the Australian Open Tennis
tournament that was on at the time. The length of visit for more than two thirds of the whole sample
is 1-7 nights, and even more of the domestic tourists are staying for this length of time (82%). A
greater proportion of the international tourists are staying longer, 8 or more nights (40%).
More than half of all respondents are staying in hotels (3 star or more) or serviced apartments,
although a further 20% are staying in the home of friends or relatives. Neariy 10% of the whole
sample are staying in backpacker/youth hostels, but analysis by subgroup shows this was a
popular accommodation for international tourists (13%) compared with domestic tourists (2%).
165

Chapter 5: Descriptive Analysis Results
Table 5.6: Melbourne trip profile of the respondents
Variable Characteristic
Nights stayed in Melboume this trip
1-3 nights
4-7 nights
8-14 nights
15 or more nights
Missing
Main purpose of trip to Melboume
Holiday
Visiting friends/relatives
Convention/conference
Business
Employment
Education
Other
Missing
Previous visit to Melboume
Yes
No
Missing
Accommodation in Melboume this trip
Home of friends/relatives
Hotel (4 or 5 star)
Hotel (3 star)
Hotel (2 star or less)
Motel
Bed & breakfast/guest house Backpacker/youth hostel
Serviced Apartment
Rented house/apartment/unit/flat
Own property (e.g. holiday house) Other
Missing
• fo the in-situ survey (N = 961)
Frequency Percentage
265
375
161
156
4
614
174
9
33
9 34
87
1
504
456
1
193
236
155 17
35
14
94
104
45
3
63
2
27.6
39.0
16.8
16.2
0.4
63.9
18.1
0.9
3.4
0.9
3.5
9.1
0.1
52.4
47.5
0.1
20.1
24.6
16.1
1.8
3.6
1.5
9.8
10.8
4.7
0.3
6.6
0.2
Table 5.7: Melbourne trip profile of the international and domestic respondents to the in-situ survey
Variable
Nights stayed in Melboume this tri
1-3 nights
4-7 nights
8-14 nights
15 or more nights
Missing
International Tourists (N=646)
Frequency Percentage
Domestic Tourists (N= 315)
Frequency Percentage
}
148
232
122
141
3
22.9
35.9
18.9
21.8
0.5
117
143
39
15
1
37.1
45.4
12.4
4.8
0.3
Main purpose of trip to Melboume
Holiday
Visiting friends/relatives
Convention/conference
418
120
6
64.7
18.6
0.9
196
54
3
62.2
17.1
1.0
166

Chapter 5: Descriptive Analysis Results
Business
Employment
Education
Other
Missing
25
8
32
36
1
3.9
1.2
5.0
5.6
0.2
8
1
2
51
0
2.5
0.3
0.6
16.2
0.0
Previous visit to Melboume
Yes
No
Missing
230
415
1
35.6
64.2
0.2
274
41
0
87.0
13.0
0.0
Accommodation in Melboume this trip
Home of friends/relatives
Hotel (4 or 5 star)
Hotel (3 star)
Hotel (2 star or less)
Motel
Bed & breakfast/guest house
Backpacker/youth hostel
Serviced Apartment
Rented house/apartment/unit/flat
Own property (e.g. holiday house)
Other
Missing
128
143
108
12
12
13
88
54
35
3
48
2
19.8
22.1
16.7
1.9
1.9
2.0
13.6
8.4
5.4
0.5
7.4
0.3
65
93
47
5
23
1
6
50
10
0
15
0
20.6
29.5
14.9
1.6
7.3
0.3
1.9
15.9
3.2
0.0
4.8
0.0
Some comparison of the sample with all visitors to Australia and Victoria on selected trip
characteristics is shown in Tables 5.8, 5.9 and 5.10.
Length of visit information is only available for domestic visitors (Table 5.8), but a greater proportion
of the domestic tourist subsample is staying longer with almost two-thirds staying 4 or more nights
compared with all domestic visitors to Victoria and Australia where more than two-thirds stay only 1-
3 nights.
Table 5.8: Length of visit of sample compared to visitors to Australia and Victoria
Age Group
1-3 nights
4-7 nights
8-14 nights
15 or more nights
Total
Sample
28%
39%
17%
16%
Sample Subgroups
Intemational
Tourists
23%
36%
19%
22%
Domestic Tourists
37%
45%
12% -
5%
Age Group (if different from sample)
Intemational Visitors*
Victoria
N/A
N/A
N/A
N/A
Australia
N/A
N/A
N/A
N/A
Domestic Visitors*
Victoria
76%
19%
4%
1%
Australia
68%
21%
8%
3%
*Tourism Victoria (2065c); Note: Percentages may not add to 100% due to rounding or missing values; N/A: not available
By purpose of visit (Table 5.9), more of the sample are on holiday, less are on business, and a
similar proportion are visiting friends and relatives, excepting the domestic tourist subsample where
the proportion visiting friends and relatives (17%) is much less than for all domestic visitors to
Victoria (36%) and Australia (36%).
167

Chapter 5: Descriptive Analysis Results
Table 5.9: Purpose of visit of sample compared to visitors to Australia and Victoria
Purpose of Visit
Holiday
VFR
Convenfon/conf erence
Business
Employment
Education
Other
Total
Sample
64%
18%
1%
3%
1%
4%
9%
Sample Subgroups
Intemational
Tourists
65%
19%
1%
4%
1%
5%
5%
Domestic Tourists
62%
17%
1%
2%
1%
1%
16%
Purpose of Visit (if different from sample) Holiday or Leisure
Not included
Intemational Visitors*
Victoria
51%
21%
-
18%
1%
7%
2%
Australia
54%
21%
-
15%
1%
5%
3%
Domestic Visitors*
Victoria
45%
36%
-
16% --
4%
Australia
43%
36%
-
19% --
5% "Tourism Victoria (2005c); Note: Percentages may not add to 100% due to rounding or missing values
Table 5.10: Accommodation of sample compared to visitors to Australia and Victoria
Accommodation
Home of friends/relalives
Hotel (4 or 5 star)
Hotel (3 star)
Hotel (2 star or less)
Motel
B&B/guest house
Backpacker/yout h hostel
Serviced Apartment
Rented house/apartment /unit/
flat
Own property (e.g. holiday house)
Other
Total
Sample
-
20%
25%
16%
2%
4%
1%
10%
11%
4%
1%
-
-
_
-
-
6%
Sample Subgroups
International
Tourists
-
20%
22%
17%
2%
2%
2%
14%
8%
5%
1%
-
-
_
-
-
7%
Domestic Tourists
-
20%
29%
15%
2%
7%
1%
2%
16%
3%
1%
-
-
_
-
_
5%
Accommodation (if different from sample) Hotel, resort, motel or motor inn
Caravan park or commercial camping qrciund
Caravan or camping near road or on private property
Caravan
Educational Institutjon
Homestay
Intemational Visitors*
Victoria
16%
30%
--
-
-
-
5%
-
34%
18%
1%
7%
2%
4%
6%
4%
Australia
17%
29%
--
-
-
-
9%
-
27%
15%
1%
5%
3%
3%
6%
4%
Domestic Visitors*
Victoria
25%
44%
--
-
-
2%
-
-
6%
6%
-
4%
.
-
_
3%
Australia
26%
42%
--
-
-
1%
-
-
9%
4%
-
5%-
-
-
-
4% 'Tourism Victoria (2005c); Note: Percentages may not add to 100% due to rounding or missing values
For accommodation (Table 5.10), considerably more of the sample are staying in hotels and motels
with the international tourist subsample totalling 43%, and 51% if serviced apartments are included,
whereas only 16% of all international visitors to Victoria and Australia stay in such accommodation.
While 25% of all domestic visitors to Victoria and Australia stay in such accommodation, the
domestic tourist subsample totals 53% and 69% respectively, if serviced apartments are included.
168

Chapter 5: Descriptive Analysis Results
The accommodation categories where the proportion of the sample is considerably less than for all
visitors, are those of the home of friends or relatives, and rented house/apartment/unit/flat. For the
international tourist subsample, the proportion staying in backpacker/youth hostel (14%) is
considerably more than for all international visitors to Victoria (5%) and Australia (9%).
The trip characteristics of the respondents who completed the after-visit survey are shown in
Tables 5.11 and 5.12 and these respondents are a further subgroup of the in-situ survey
respondent characteristics shown previously in Tables 5.6 to 5.7.
Table 5.11: Melbourne trip profile of the respondents to the after-visit survey (N = 418)
Variable Characteristic
Nights stayed in Melboume this trip
1-3 nights
4-7 nights
8-14 nights
15 or more nights
Missing
Main purpose of trip to Melbourne
Holiday
Visiting friends/relatives
Convention/conference
Business
Employment
Education Other
Missing
Previous visit to Melboume
Yes
No
Missing
Accommodation in Melbourne this trip
Home of friends/relatives
Hotel (4 or 5 star)
Hotel (3 star)
Hotel (2 star or less)
Motel
Bed & breakfast/guest house
Backpacker/youth hostel
Serviced Apartment
Rented house/apartment/unit/flat Own property (e.g. holiday house)
Other
Missing
Frequency
113 169
79
56 1
280
76
3 12
3 8
36 0
229
189
0
81
113
70
5
16
7
40
45
16
1
24
0
Percentage
27.0
40.4
18.9
13.4
0.2
67.0
18.2 0.7
2.9 0.7
1.9 8.6
0.0
54.8 45.2
0.0
19.4
27.0
16.7
1.2
3.8 1.7
9.6
10.8
3.8
0.2
5.7
0.0
169

Chapter 5: Descriptive Analysis Results
TaWe 5.12: Melbourne trip profile of the international and domestic respondents to the after visit survey
Variable
Nights stayed in Melboume this tri
1-3 nights
4-7 nights
8-14 nights
15 or more nights
IVIissing
Intemational Tourists (N=280)
Frequency Percentage
Domestic Tourists (N= 138)
Frequency Percentage
1
65
99
62
53
1
23.2
35.4
22.1
18.9
0.4
48
70
17
3
0
34.8
50.7
12.3
2.2
0.0
Main purpose of trip to Melbourne
Holiday
Visiting friends/relatives
Convention/conference
Business
Employment
Education
Ottier
Missing
189
56
2
8
2
8
15
0
67.5
20.0
0.7
2.9
0.7
2.9
5.4
0.0
91
20
1
4
1
0
21
0
65.9
14.5
0.7
2.9
0.7
0.0
15.2
0.0
Previous visit to Melboume
Yes
No
Missing
109
171
0
38.9
61.1
0.0
120
18
0
87.0
13.0
0.0
Accommodation in Melbourne this trip
Home of friends/relatives
Hotel (4 or 5 star)
Hotel (3 star)
Hotel (2 star or less)
Motel
Bed & breakfast/guest house
Backpacker/youth hostel
Serviced Apartment
Rented house/apartinent/unit/flat
Own property (e.g. holiday house)
Ottier
Missing
60
67
47
3
5
7
38
20
13
1
19
0
21.4
23.9
16.8
1.1
1.8
2.5
13.6
7.1
4.6
0.4
6.8
0.0
21
46
23
2
11
0
2
25
3
0
5
0
15.2
33.3
16.7
1.4
8.0
0.0-
1.4
18.1
2.2
0.0
3.6
0.0
Comparison of the after-visit subsample (N=418) with the whole sample (N=961), shows similarities
for each of the trip characteristics. Similar proportions have previously visited Melbourne (55% cf
52%). The main purpose of visit is holiday (67% cf 64%) followed by visiting friends and relatives
(18% cf 18%), and similar proportions chose the 'other' category (8.6% cf 9.1%) which was largely
due to domestic visitors in both samples (15.2% cf 16.2%), many of whom were visiting Melbourne
for the Australian Open Tennis tournament. Approximately two-thirds of each sample stayed 1-7
nights (68% cf 67%) and the majority of each sample stayed in hotels (3 star or above) and
serviced apartments (55% cf 52%), followed by the home of friends or relatives (19% cf 20%).
The characteristics of respondents visiting QVM are shown for the whole sample in Table 5.13 and
then for the international and domestic tourist subgroups (Table 5.14).
170

Chapter 5: Descriptive Analysis Results
Table 5.13: QVM visit profile of the respondents to the in-situ survey (N = 961)
Variable Characteristic Frequency Percentage
QVM visit arrangements Independentiy
Organised tour group
Other
Missing
Travel group Alone
As a couple
As a group of parents and children
Witti other relatives
With friends
Witti family and friends
With a tour group
Witii business colleagues
Sporting/community group
Other
Missing
Previous visit to QVM
Yes
No
Missing
Main form of transport to QVM this trip
Bicycle
Bus
Car
Taxi
Train
Tram
Walked
Ottier
Missing
Information sources used by visitors to QVM*
Friends/relatives
Travel agent
Intemet
Television
Magazine
Newspaper
Radio
Brochure
Travel guide book
Airiine
Accommodation provider
Visitor information centte Tour operator
Been there before
Walked past
Ottier
Missing
867
39
54
1
136
340
84
70
199
93
19
6
2
8
4
455
505
1
11
49
99
33
72
347
346
3
1
466*
38
26
14
30
12
4
100
176
6
33
33
28
254
30
38
1
90.2
41
5.6
0.1
142
35.4
8.7
7.3
20.7
9.7
2.0
0.6
0.2
0.8
0.4
47.3
52.5
0.1
1.1
5.1
10.3
3.4
7.5
36.1
36.0
0.3
0.1
48.5*
4.0
2.7
1.5
3.1
1.2
0.4
10.4
18.3
0.6
3.4
3.4
2.9
26.4
3.1
4.0
0.1
'Multiple responses could be given so sums to more tiian Frequency of N=961 and Percentage of 100%
171

Chapter 5: Descriptive Analysis Results
Table 5.14: QVM visit profile of the international and domestic respondents to the in-situ survey
Variable Intemational Tourists (N=646)
Frequency Percentage
Domestic Tourists (N= 315)
Frequency Percentage
QVM visit arrangements
Independently
Organised tour group
Ottier
Missing
577
26
42
1
89.3
4.0
6.5
0.2
290
13
12
0
92.1
4.1
3.8
0.0
Travel group
Alone
As a couple
As a group of parents and children
With otiier relatives
Witti friends
Witti family and friends
Witii a tour group
Witii business colleagues
Sporting/community group
Ottier
Missing
109
223
44
41
139
64
14
3
0
5
4
16.9
34.5
6.8
6.3
21.5
9.9
2.2
0.5
0.0
0.8
0.6
27
117
40
29
60
29
5
3
2
3
0
8.6
37.1
12.7
9.2
19.0
9.2
1.6
1.0
0.6
1.0
0.0
Previous visit to QVM
Yes
No
Missing
238
407
1
36.8
63.0
0.2
217
98
0
68.9
31.1
0.0
Main form of transport to QVM this trip
Bicycle
Bus
Car
Taxi
Train
Tram
Walked
Otiier
Missing
9
32
63
19
52
220
250
0
1
1.4
5.0
9.8
2.9
8.0
34.1
38.7
0.0
0.2
2
17
36
14
20
127
96
3
0
0.6
5.4
11.4
4.4
6.3
40.3
30.5
1.0
0.0
Information sources used by visitors to QVM*
Friends/relatives
Travel agent
Intemet
Television
Magazine
Newspaper
Radio
Brochure
Travel guide book
Airiine
Accommodation provider
Visitor inforniation centi e
Tour operator
Been tiiere before
Walked past
Other
Missing
308
34
17
2
22
5
3
65
157
5
26
21
22
108
20
26
1
47.7
5.3
2.6
0.3
3.4
0.8
0.5
10.1
24.3
0.8
4.0
3.3
3.4
16.7
3.1
4.0
0.2
158
4
9
12
8
7
1
35
19
1
7
12
6
146
10
12
0
50.2
1.3
2.9
3.8
2.5
2.2
0.3
11.1
6.0
0.3
2.2
3.8
1.9
46,3
3.2
3.8
0.0
'Multiple responses could be given so sums to more ttian Frequency of N=961 and Percentage of 100%
172

Chapter 5: Descriptive Analysis Results
Two fonms of transport are the main one used to get to the QVM by the total sample respondents,
tram (36%) and walking (36%). However, more domestic tourists travel by trahri (40%) and more
international tourists walk (39%).
For information sources used by the visitor in association with their QVM visit, multiple responses
are encouraged with four main sources found for the total sample: friends/relatives (49%), been
there before (26%), travel guide book (18%) and brochure (10%). Similar infonnation sources are
used by the international and domestic tourist subgroup for friends/relatives and brochures but
more international tourists used a travel guide book (24%), and many more domestic tourists knew
about the QVM by having been there before (46%). Analysis of the travel group for respondents
visiting QVM reveals three main types of groups for the total sample there: as a couple (35%), with
friends (21%), and alone (14%). While a similar proportion of international and domestic tourist
subsamples are visiting as a couple (35% and 37% respectively), considerably fewer domestic
tourists are visiting alone (9%) and more are visiting as a family group of parents and children
(13%).
Of these selected trip characteristics, the only information available to compare the sample with all
visitors to Australia and Victoria is shown in Table 5.15. Here it can be seen that tourists visiting the
QVM are considerably less likely to be alone or visiting with business colleagues, and more likely to
be visiting as a couple, than tourists travelling in Australia and Victoria.
Table 5.15
Travel Party
Alone
As a couple
As a group of parents and children
With other relatives
With friends
With family and friends
With a tour group
With business colleagues
Sportng/commu nit/ qrouo
Other
• Travel party of sample compared to visitors to Australia and Victoria
Total
Sample
14%
35%
9%
7%
21%
10%
2%
1%
1%
1%
Sample Subgroups
Intemational
Tourists
17%
35%
7%
6%
22%
10%
2%
1%
0%
1%
Domestic Tourists
9%
37%
13%
9%
19%
9%
2%
1%
1%
1%
Travel Party (if different from sample)
Adult couple
Family group
Friends &/or relatives
International Visitors*
Victoria
50%
26%
8%
-
-
10%
„
7%
-
-
Australia
47%
28%
11%
-
_
10%
_
5%
-
-
Domestic Visitors*
Victoria
24%
30%
18%
-
_
22%
_
4%
-
2%
Australia
26%
28%
20%
-
-
21%
-
4%
-
1% 'Tourism Victoria (2005c); Note: Percentages may not add to 100% due to rounding or missing values
The QVM visit characteristics of the respondents who completed the after-visit survey are shown in
Tables 5.16 and 5.17 and these respondents are a further subgroup of the in-situ survey
respondents' QVM visit characteristics shown previously in Tables 5.13 to 5.14.
173

Chapter 5: Descriptive Analysis Results
e 5.16: QVM visit profile of the respondents to the after-visit survey (N = 418)
Variable Characteristic
QVM visit arrangements Independentty
Organised tour group
Ottier
Missing
Travel group Alone
As a couple
As a group of parents and children
Witti ottier relatives
Witii friends
Witti family and friends
Witti a tour group
Witti business colleagues
Sporting/community group
Ottier
Missing
Previous visit to QVM
Yes
No
Missing
Main form of transport to QVM this trip
Bicycle
Bus
Car
Taxi
Train
Tram
Walked
Ottier
Missing
Infonnation sources used by visitors to QVM*
Friends/relatives
Travel agent
Intemet
Television
Magazine
Newspaper
Radio
Brochure
Travel guide book
Airiine
Accommodation provider
Visitor information centre
Tour operator
Been there before
Walked past
Ottier
Missing
Frequency
386
15
17
0
76
160
31
24
76
43 5
1
0
2
0
203
215
0
4
22
39 11
33
146
163
0 0
182*
16
12
6 14
5
1
51
88
1
17
19
14
131
14
16
0
Percentage
92.3
3.6
4.1
0.0
18.2
38.3
7.4
5.7
18.2
10.3
1.2
0.2
0.0
0.5
0.0
48.6
51.4
0.0
1.0
5.3
9.3
2.6
7.9
34.9
39.0
0.0
0.0
43.5*
3.8
2.9
1.4
3.3
1.2
0.2
12.2
21.1
0.2
4.1
4.5
3.3
31.3
3.3
3.8
0.0
'Multiple responses could be given so sums to more ttian Frequency of N=418 and Percentage of 100%
174

Chapter 5: Descriptive Analysis Results
Table 5.17: QVM visit profile of the international and domestic respondents to the after-visit survey
Variable Intemational Tourists (N=280)
Frequency Percentage
Domestic Tourists (N= 138)
Frequency Percentage
QVM visit arrangements
Independentiy
Organised tour group
Ottier
Missing
260
7
13
0
92.9
2.5
4.7
0.0
126
8
4
0
91.3
5.8
2.9
0.0
Travel group
Alone
As a couple
As a group of parents and children
Witti ottier relatives
Witti friends
Witii family and friends
Witii a tour group
Witti business colleagues
Sporting/community group
Ottier
Missing
57
108
14
20
47
32
2
0
0
0
0
20.4
38.6
5.0
7.1
16.8
11.4
0.7
0.0
0.0
0.0
0.0
19
52
17
4
29
11
3
1
0
2
0
13.8
37.7
12.3
2.9
21.0
8.0
2.2
0.7
0.0
1.4
0.0
Previous visit to QVM
Yes
No
Missing
106
174
0
37.9
62.1
0.0
97
41
0
70.3
29.7
0.0
Main form of transport to QVM this trip
Bicycle
Bus
Car
Taxi
Train
Tram
Walked
Ottier
Missing
3
15
30
5
25
93
108
0
0
1.1
5.7
10.7
1.8
8.9
33.2
38.6
0.0
0.0
1
6
9
6
8
53
55
0
0
0.7
4.3
6.5
4.3
5.8
38.4
39.9
0.0
0.0
Information sources used by visitors to QVM*
Friends/relatives
Travel agent
Intemet
Television
Magazine
Newspaper
Radio
Brochure
Travel guide book
Airiine
Accommodation provider
Visitor information centt-e
Tour operator
Been there before
Walked past
Ottier
Missing
123
14
9
2
9
3
1
34
79
1
13
12
10
61
10
9
0
43.9
5.0
3.2
0.7
3.2
1.1
0.4
12.1
28.2
0.4
46
4.3
3.6
21.8
3.6
3.2
0.0
59
2
3
4
5
2
0
17
9
0
4
7
4
70
4
7
0
42.8
1.4
2.2
2.9
3.6
1.4
0.0
12.3
6.5
0.0
2.9
5.1
2.9
50.7
2.9
51
0.0
'Multiple responses could be given so sums to more tiian Frequency of N=418 and Percentage of 100%
175

Chapter 5: Descriptive Analysis Results
Comparison of the after-visit subsample (N=418) with the whole sample (N=961), shows similarities
for all of the characteristics including visiting independentiy rather than in a tour group, high
proportions of domestic tourists having previously visited, information sources used to hear about
the QVM, and the main form of transportation to the QVM. Slight differences were found in the
travel group on the QVM visit with more after-visit survey respondents visiting QVM alone (18% cf
14%) or as a couple (38% cf 35%), especially for the international tourist subgroup.
5A1 Trip and Travel Characteristics Summary
One characteristic of particular interest is the travel arrangements of tourists visiting QVM because
these evidence that more than 90% of all respondents are visiting independentiy and only 4% are
visiting as part of a tour group. This low percentage on tour groups applies equally to international
tourists (4%) and domestic tourists (4%). This conti'asts the sample of this study with many existing
studies of Asian tourists to Australia and their motivation and behaviour where the sample largely
has comprised visitors on tour groups (for example, for Chinese tourists, Weiler and Yu, 2004; Yu
and Weiler, 2006).
Another characteristic of note is the high proportion of repeat visitors to both the destination of
Melbourne and to the QVM attraction. More than half of the whole sample are repeat visitors to
Melboume (52%) and by subgroup, considerably more domestic tourists are repeat visitors (87%)
than international tourists (36%). Similar proportions of the whole sample are found for repeat
visitors to QVM (47%), and by subgroup, again considerably more domestic tourists are repeat
visitors (70%) than international tourists (37%). These high proportions of repeat visitors suggest
high levels of satisfaction for domestic and international tourists with the destination of Melbourne
and QVM as an attraction at the destination.
5.5 Cultural Experience Constmcts and Normality of the Data
Initial analysis of the 124 measurement items for the four constructs comprising the cultural
experience motivational process research model proposed in this study is undertaken to check the
normality of the data. All items are measured on a six-point Likert-type scale of agreement and all
are positively worded. The measurement items for each of the four constmcts are presented in
separate tables: attitudes (Tables 5.18, 5.19); motives (Tables 5.20, 5.21); benefits sought (Table
5.22); benefits gained (Table 5.23); and a combined table for benefits sought and gained scores
(Table 5.24). Qne table for each construct shows the central tendency and spread of these
measures as well as missing values and outiiers for the items. The other tables rank the
measurement items for each construct by mean scores of agreement with the statements.
5.5.1 Cultural Experience Attitudes
For the cultural experience attitudes construct, 29 measurement items are used in the
questionnaire and Table 5.18 shows that 27 items have some missing values with the greatest
number 3.5% for the item: I like going to Australian aboriginal cultural performances and
176
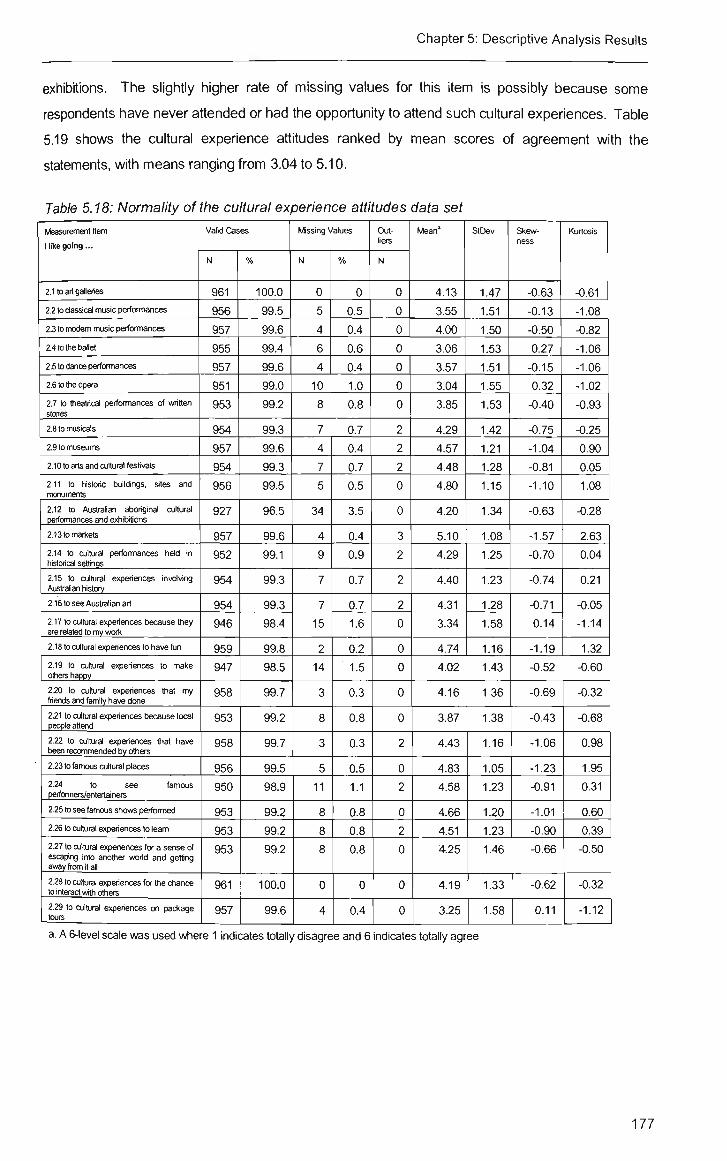
Chapter 5: Descriptive Analysis Results
exhibitions. The slightiy higher rate of missing values for this item is possibly because some
respondents have never attended or had the opportunity to attend such cultural experiences. Table
5.19 shows the cultijral experience attitudes ranked by mean scores of agreement with the
statements, with means ranging from 3.04 to 5.10.
Table 5.18: Normality of the cultural experience attitudes data set
Measurement Item
Hike going.. .
2.1 to art galleries
2.2 to classical music performances
23 to modem music performances
2.4 to the ballet
2.5 ID danc» performances
2.6 to the opera
2.7 to ttieatrical performances of written stories
2.8 to musicals
2.9 to museums
2.10 to arts and cultural festivals
2.11 to historic Ijuildings, sites and monuments
2.12 to Australian aboriginal cultural performances and exhibitions
2.13tomarl(ets
2.14 to cultural performances held in historical setHnqs
2.15 to cultural experiences involving Australian history
2.16 to see Australian art
2.17 to cultural experiences because they are related to mv wortc
2.18 to cultural experiences to have fun
2.19 to cultural experiences to make others happy
2.20 to cultural experiences that my friends and family have done
2.21 to cultural experiences because local people attend
2.22 to cultural experiences that have been recommended by others
2.23 to famous cultural places
2.24 to see famous performers/entertainers
2.25 to see famous shows perfomned
2.26 to cultural experiences to learn
2.27 to cultural experiences for a sense of escaping into another worid and getting away from it all
2.28 to cultural experiences for the chance to interact with others
2.29 to cultural experiences on package tours
Valid Cases
N
961
956
957
955
957
951
953
954
957
954
956
927
957
952
954
954
946
959
947
958
953
958
956
950
953
953
953
961
957
%
100.0
99.5
99.6
99.4
99.6
99.0
99.2
99.3
99.6
99.3
99.5
96.5
99.6
99.1
99.3
99.3
98.4
99.8
98.5
99.7
99.2
99.7
99.5
98.9
99.2
99.2
99.2
100.0
99.6
Missing Values
N
0
5
4
6
4
10
8
7
4
7
5
34
4
9
7
7
15
2
14
3
8
3
5
11
8
8
8
0
4
%
0
0.5
0.4
0.6
0.4
1.0
0.8
0.7
0.4
0.7
0.5
3.5
0.4
0.9
0.7
0.7
1.6
0.2
1.5
0.3
0.8
0.3
0.5
1.1
0.8
0.8
0.8
0
0.4
Outliers
N
0
0
0
0
0
0
0
2
2
2
0
0
3
2
2
2
0
0
0
0
0
2
0
2
0
2
0
0
0
Mean'
413
3.55
4.00
3.06
3.57
3.04
3.85
4.29
4.57
4.48
4.80
4.20
5.10
4.29
4.40
431
3.34
4.74
4.02
416
3.87
443
4.83
458
4.66
4.51
425
4.19
3.25
StOev
1.47
1.51
1.50
1.53
1.51
1.55
1.53
1.42
1.21
1.28
1.15
1.34
1.08
1.25
1.23
1.28
1.58
1.16
1.43
1.36
1.38
1.16
1.05
1.23
1.20
1.23
1.46
1.33
1.58
Skewness
-0.63
-0.13
-0.50
0.27
-0.15
0.32
-0.40
-0.75
-1.04
-0.81
-1.10
-0.63
-1.57
-0.70
-0.74
-0.71
0.14
-1.19
-0.52
-0.69
-0.43
-1.06
-1.23
-0.91
-1.01
-0.90
-0.66
-0.62
0.11
Kurtosis
-0.61
-1.08
-0.82
-1.06
-1.06
-1.02
-0.93
-0.25
0.90
0.05
1.08
-0.28
2.63
0.04
0.21
-0.05
-1.14
1.32
-0.60
-0.32
-0.68
0.98
1.95
0.31
0.60
0.39
-0.50
-0.32
-1.12
a. A 6-level scale was used wfiere 1 indicates totally disagree and 6 indicates totally agree
177

Chapter 5: Descriptive Analysis Results
Table 5.19: Cultural experience attitudes scores
Attitudes Measurement Item
2.13 to markets
2.23 to famous cultural places
2.11 to historic buildings, sites and monuments
2.18 to cultural experiences to have fun
2.24 to see famous performers/entertainers
2.25 to see famous shows perfonned
2.9 to museums
2.26 to cultural experiences to team
2.10 to arts and cultural festivals
2.22 to cultural experiences that have been recommended by others
2.15 to cultural experiences involving Australian history
2.16 to see Australian art
2.8 to musicals
2.14 to cultural performances held in historical settings
2.27 to cultural experiences for a sense of escaping into another worid and getting away from it all
2.12 to Australian Aboriginal cultural perfomnances and exhibitions
2.28 to cultural experiences for the chance to interact with others
2.20 to cultural experiences that my friends and family have done
2.1 to art galleries
2.19 to cultural experiences to make others happy
2.3 to modem music performances
2.21 to cultural experiences because local people attend
2.7 to theatrical perfomfiances of written stories
2.5 to dance perfomiances
2.2 to classical music perfomfiances
2.17 to cultural experiences because they are related to my wori<
2.29 to cultural experiences on package tours
2.4 to the ballet
2.6 to the opera
Attitudes sample
N
957
956
956
959
950
953
957
953
954
958
954
954
954
952
953
927
961
958
961
947
957
953
953 957
956
946
957
955
951
Mean^
5.10
483
4.80
4.74
4.58
4.66
457
4.51
4.48
4.43
4.40
4.31
4.29
4.29
4.25
4.20
419
416
4.13
4.02
4.00
3.87
3.85
3.57
3.55
3.34
3.25
3.06
3.04
a. A 6-level scale was used where 1 indicates totally disagree and 6 indicates totally agree
Attitudes towards different types of cultural experiences from Table 5.19 shows the most strongly
liked cultural experiences are markets, famous cultural places, followed by historic buildings, sites
and monuments. Famous performers and shows are also liked as well as museums, and arts and
cultural festivals. Cultural experiences specific to Australia such as Australian history, Australian
art, and Australian aboriginal cultural performances and exhibitions are more middle ranked (11 ,
12' and 16* , respectively). Lower middle ranking cultural experiences are musicals, art galleries
and modern music performances. Marginally-liked cultural experiences are the theatre, dance and
classic music performances, with the mean for each of these just above the 3.5 neutral point
midway between slightly disagree and slightiy agree. Least liked-cultural experiences are the ballet
and opera, with means only marginally above slightiy disagree.
Two attitudes towards psycho-socio-physiologically-based outcomes from going to cultural
experiences have high ranking means: having fun (ranks 4th) and to learn (ranks 8*). This
suggests respondents like going to cultural experiences for hedonic-related outcomes as well as
educational outcomes. Going to cultural experiences that have been recommended by others also
178

Chapter 5: Descriptive Analysis Results
ranks highly (lO"") and this shows the importance of favourable word-of-mouth in influencing
people's attendance at cultural experiences. Liking cultural experiences for escape-related
outcomes is middle ranked (15*), and marginally above social interaction-related outcomes (17** ).
All of these outcomes are above the 3.5 neutral point.
The standard deviations for the cultural-experience attitudes items (Table 5.18), range between
1.05 and 1.58. When considered together with item rankings (Table 5.19), the lowest divergence in
responses is for the top ranking cultural experiences of going to markets, and to famous cultural
places. The range of responses is greatest for the third and fourth last ranking items: going to
cultural experiences because they are related to my work, and going to cultural experiences on
package tours.
5.5.2 CuKural Experience Motives
For the cultural experience motives construct, 31 measurement items are used in the questionnaire
and Table 5.20 shows that 30 items have some missing values with the greatest number 2.3% for
the item: I go to cultural attractions and events while travelling to do something related to my work.
The slightiy higher rate of missing values for this item is possibly because some respondents are
retired from work or do not work and so considered the question not applicable to them.
Table 5.20: Normality of the cultural experience motives data set Measurement Item
1 go to cultural attractions and events wliile travelling...
3.1 to have fun
3.2 to be entertained by others
3.3 to relax physically
3.4 to relax mentally
3.5 to have thrills and excitement
3.6 to get emotionally involved
3.7 to do something 1 want to do
3.8 to do something with my family and friends
3.9 to do something by myself
3.10 to meet locals
3.11 to learn about local culture
3.12 to learn about local history
3.13 to learn about Icxal perfomning arts
3.14 to do something related to my wortc
3.15 to enjoy something unique to the destination
3.16 to have a change from my daily routine
3.17 to forget about demands of daily life
318 to escape into another worid
3.19 to satisfy my curiosity
3.20 to tell my friends and relatives about it
3.21 to enhance my scxJal position
322 to see farrxxis cultural places
3.23 to hear famous performers/entertainers
Valid Cases
N
961
954
959
958
954
954
952
954
949
956
957
959
953
939
953
953
953
957
955
954
951
955
957
%
100.0
99.3
99.8
99.7
99.3
99.3
99.1
99.3
98.8
99.5
99.6
99.8
99.2
97.7
99.2
99.2
99.2
99.6
99.4
99.3
99.0
99.4
99.6
Missing Values
N
0
7
2
3
7
7
9
7
12
5
4
2
8
22
8
8
8
4
6
7
10
6
4
%
0.0
0.7
0.2
0.3
0.7
0.7
0.9
0.7
1.2
0.5
0.4
0.2
0.8
2.3
0.8
0.8
0.8
0.4
0.6
0.7
1.0
0.6
0.4
Outliers
N
3
2
2
0
2
0
3
0
0
1
0
2
0
0
3
0
0
0
0
0
0
0
2
Mean"
5.13
4.57
4.61
4.78
4.36
3.98
5.03
4.81
4.07
4.27
4.69
4.68
421
3.15
5.01
4.80
4.49
4.23
4.86
411
2.61
4.82
4.42
StDev
0.97
1.20
1.18
1.13
1.26
1.35
1.04
1.15
1.47
1.35
1.19
1.17
1.28
1.58
1.07
1.22
1.42
1.52
1.12
1.45
1.43
1.12
1.22
Skew
ness
-1.70
-1.02
-1.01
-1.20
-0.75
-0.45
-1.50
-1.34
-0.53
-0.67
-1.13
-1.07
-0.64
0.26
-1.60
-1.30
-0.86
-0.64
-1.25
-0.53
0.68
-1.27
-0.73
Kurtosis
3.88
0.69
0.77
1.45
0.07
-0.52
2.79
1.88
-0.73
-0.32
1.21
0.97
-o:ii -1.09
3.11
1.54
-0.14
-0.65
1.66
-0.63
-0.49
1.74
0.03
179

Chapter 5: Descriptive Analysis Results
3.24 to see famous shows performed
3.25 to gain the respect of others
326 to demonstrate my ability to travel
3.27 to go somewhere safe
328 to get vaiue-for money
3.29 to have a high quality experience
3.30 to buy goods and souvenirs
3.31 to buy food and drinks to consume at the cultural experience
955
956
951
957
957
951
955
957
99.4
99.5
99.0
99.6
99.6
99.0
99.4
99.6
6
5
10
4
4
10
6
4
0.6
0.5
1.0
0.4
0.4
1.0
0.6
0.4
2
0
0
0
2
0
0
0
4.42
2.65
3.11
3.83
434
4.83
3.53
401
1.25
1.49
1.61
1.59
1.44
1.08
1.54
1.53
-0.77
0.68
0.26
-0.33
-0.85
-1.26
-0.16
-0.54
0.10
-0.57
-1.20
-1.03
-0.12
1.95
-1.06
-0.74
A 6-level scale was used where 1 indicates totally disagree and 6 indicates totally agree
Table 5.21: Cultural experience motives scores
Motives Measurement Item Motives sample
3.1 to have fun
3.7 to do something I want to do
3.15 to enjoy something unique to the destination
3.19 to satisfy my cxiriosity
3.29 to have a high quality experience
3.22 to see famous cultural places
3.8 to do something with my family and friends
3.16 to have a change from my daily routine
3.4 to relax mentally
3.11 to leam about local culture
3.12 to leam about local history
3.3 to relax physically
3.2 to be entertained by others
3.17 to forget about demands of daily life
3.23 to hear famous perfoimers/entertainers
3.24 to see famous shows performed
3.5 to have thrills and excitement
3.28 to get value for money
3.10 to meet locals
3.18 to escape into another worid
3.13 to leam about local performing arts
3.20 to tell my friends and relatives about it
3.9 to do something by myself
3.31 to buy food and drinks to consume at the cultural experience
3.6 to get emotionally involved
3.27 to go somewhere safe
3.30 to buy goods and souvenirs
3.14 to do something related to my wori<
3.26 to demonstrate my ability to travel
3.25 to gain the respect of others
3.21 to enhance my social position
a. A 6-level scale was used where 1 indicates totally disagree and 6 indicates totally agree
Table 5.21 shows the cultural experience motives ranked by mean scores of agreement with the
statements, with means ranging from 2.61 to 5.13. This is a wider range compared to the range of
means scores for the cultural experience attitudes items of 3.04 to 5.10, particularly for the lowest
mean with 2.61 being between strongly disagree and slightiy disagree, while 3.04 is between
slightiy disagree and slightiy agree. Six of the top nine most agreed motives for going to cultural
attractions and events while travelling are generally psycho-socio-physiologically-based: having fun,
N
961
952
953
955
951
955
954
953
958
957
959
959
954
953
957
955
954
957
956
957
953
954
949
957
954
957
955
939
951
956
951
Mean^
5.13
5.03
5.01
4.86
4.83
4.82
4.81
4.80
4.78
4.69
4.68
4.61
4.57
4.49
4.42
4.42
4.36
4.34
4.27
4.23
4.21
4.11
4.07
4.01
3.98
3.83
3.53
3.15
3.11
2.65
2.61
180

Chapter 5: Descriptive Analysis Results
doing something I want to do, satisfying curiosity, social kinship with family and friends, from
change from daily routine, and relaxing mentally. These include the hedonic-related motive of
having fun which ranks as the top motive based on mean score, and also ranked highly as a liked
attitude about going to cultural experiences in general (4" ). They also include the escape-related
motive of a change from daily routine, although other escape-related motives are lower ranking (but
well above the 3.5 neutral point): to forget about daily life (14* ), and to escape into another worid
(20* ).
The other three of the top nine most agreed motives are also part attribute-based as they refer to a
specific aspect of the cultural experience, namely, enjoying something unique to the destination,
having a high quality experience, and seeing famous cultural places. The latter also ranked second
in attitudes as a most liked cultural experience. Seeing famous perfonners and shows ranks lower
as motives for going to cultural attractions and events while travelling, than as liked cultural
experiences (15* and 16" cf 5^ and 6** ). To get emotionally involved and go somewhere safe are
also low ranking psycho-socio-physiologically-based motives, but their mean scores are above the
neutral point of 3.5 for neither agree or disagree. Low ranking atb ibute-based motives are
consuming refreshments at the cultural experience, and shopping for goods and souvenirs, but
their mean scores are also marginally above the neutral point. Learning by attending cultural
experiences has marginally dropped from an eighth ranked liking about cultural experiences to a
middle ranking motive for going while travelling with learning about local culture and history (10**
and 11*, respectively), while learning about local performing arts ranks much lower (21^), but with a
mean of 4.21 is still an agreed item between slightiy agree and strongly agree. Four items have a
mean score below the neutral point of 3.5. The three lowest ranking motives are all related to
social recognition which is a psycho-sociologically-based motive that in this study has not been
positively associated as a motive for going to cultural experiences while travelling. The fourth item
is going to cultural experiences to do something related to one's work which in this study has not
been positively associated as a motive for going to cultural experiences while travelling. It was also
one of the four attitudes towards cultural experiences in general that was marginally below the
neutral point.
The standard deviations for the cultural experience motives items (Table 5.20), range between 0.97
and 1.61, which is similar to the range for the cultural experience attitudes of between 1.05 and
1.58 (Table 5.18). When considered together with item ranking (Table 5.21), the lowest divergence
in responses is for the top ranking motive for attending cultural attractions and events while
travelling: to have fun. The range of responses is greatest for the third last ranking motive: to
demonstrate my ability to travel.
5.5.3 Cultural Experience Benefits Sought and Gained
For the cultural experience benefits sought and gained constructs, 32 measurement items are used
in the questionnaire with the benefits sought items reworded as benefits gained as seen in Table
5.24. Therefore these two sets of items will be discussed together, although the data set sizes
181

Chapter 5: Descriptive Analysis Results
differ as benefits sought items are measured for the whole sample (961 cases) and benefits gained
items are measured as a subset of the full sample (418 cases).
Table 5.22: Normality of the benefits sought data set
Measurement Item
From my visit to Queen Victoria Market,! expect...
4.1 to be emoSonally involved
4.2 to be physically involved
4.3 to have fun
4.4 to be entertained
4.5 to relax physically
4.6 to relax mentally
4.7 to experience thrills and excitement
4.8 to gain knowledge
45 to forget about wortc and responsibilit'es
4.10 to escape into another worid
4.11 to interact with staff
4.12 to interact with other visitors
4.13 to have a good lime with my companions
4.14 to go lo gain the respect of others
4.15 to see a famous place
4.16 to enhance my social position
4.17 a feeling of accomplishment
4,18 the actlMlies and events to be safe
4.19 to be well informed of the different fadlities and services available
4.20 to receive high quality service
4.21 the activities and events to be delivered at promised times
4.22 written information to be in my language
4.23 signs to tie in my language
4.24 signs to be dear and helpful
4.25 the facilities provided to be dean
4.26 the fadlities provided to be comfortable
4.27 fadnSes for children to be provided
4.28 fadlilies for disabled visitors to be provided
4.29 good value tor money
4.30 a range of goods and souvenirs will be available for purchase
4.31 a range of food and drinks will be available for purchase and consumpBon at the maricet
4.32 a range of food and drinks will be available to purchase and take away from the marf<et
Valid Cases
N
959
957
959
955
959
958
958
959
955
959
957
958
954
957
958
957
960
952
958
960
947
955
953
955
956
959
906
936
956
960
960
960
%
99.8
99.6
99.8
99.4
99.8
99.7
99.7
99.8
99.8
99.8
99.6
99.7
99.3
99.6
99.7
99.6
99.9
99.1
99.7
99.9
98.5
99.4
99.2
99.4
99.5
99.8
94.3
97.4
99.5
99.9
99.9
99.9
liflssing Values
H
2
4
2
6
2
3
3
2
2
2
4
3
7
4
3
4
1
9
3
1
14
6
8
6
5
2
55
25
5
1
1
1
0/ /o
0.2
0.4
0.2
0.6
0.2
0.3
0.3
0.2
0.2
0.2
0.4
0.3
0.7
0.4
0.3
0.4
0.1
0.9
0.3
0.1
1.5
0.6
0.8
0.6
0.5
0.2
5.7
2.6
0.5
0.1
0.1
0.1
Outliers
N
0
0
0
0
0
0
0
0
0
0
0
0
0
0
0
0
0
0
2
2
0
0
0
0
0
0
0
0
3
0
3
3
Mean'
3.26
3.57
4.81
416
4.05
419
3.64
4.00
3.98
3.69
3.55
3.56
481
2.64
416
2.27
3.11
4.25
4.21
4.32
4.08
4.24
4.23
4.74
4.93
4.83
4.23
4.65
5.01
4.79
5.10
5.09
StDev
1.44
1.40
1.12
1.33
1.37
1.33
1.44
1.35
1.57
1.58
1.41
1.37
1.24
1.49
1.45
1.30
1.54
1.41
1.31
1.30
1.40
1.54
1.56
1.22
1.08
1.07
1.48
1.35
0.97
1.12
0.89
0.97
Skew
ness
0.16
-0.14
-1.32
-0.63
-0.54
-0.67
-0.16
-0.48
-0.38
-0.20
-0.17
-0.16
-1.39
0.71
-0.75
1.00
0.21
-0.77
-0.79
-0.74
-0.56
-0.72
-0.70
-1.25
-1.18
-1.03
-0.70
-1.11
-1.47
-1.17
-1.23
-1.44
Kurtosis
-1.02
-0.97
1.95
-0.34
-0.54
-0.23
-0.92
-0.58
-0.99
-1.13
-0.95
-0.81
1.76
-0.56
-0.37
0.25
-1.13
-0.23
0.09
0.00
-0.47
-0.55
-0.60
1.43
1.50
1.24
-0.40
0.70
3.27
1.50
2.42
2.99
A 6-level scale was used where 1 indicates totally disagree and 6 indicates totally agree
The standard deviations for the benefits sought items (Table 5.22), range between 0.89 and 1.58,
and for the benefits gained items (Table 5.23), from 0.81 to 1.42. When considered together with
item ranking (Table 5.24), the lowest divergence in responses for both types of benefits occurs for
refreshments-related top ranking benefits. The greatest range of responses is for different benefits
sought and gained items: escaping into another worid (24^ ranking item for benefits sought); vi itten
182

Chapter 5: Descriptive Analysis Results
inforniation being available in my language, and getting a feeling of accomplishment (10*" and 29*
ranking items, respectively, for benefits gained).
Table 5.23: Normality of the benefits gained data set
Measurement Item
From my visit to Queen Victoria Mailiet,...
011 was emotionally involved
021 was physically involved
031 had fun
041 was entertained
051 relaxed physically
061 relaxed mentally
071 experienced thrills and exdtement
081 gained knowledge
091 forgot about woric and responsibilities
101 escaped into another worid
111 interacted with staff
121 interacted with other visitors
131 had a good time with my companions
141 gained the respect of others
151 saw a famous place
161 enhanced my sodal position
171 got a feeling of accomplishment
18 the activities and events were safe
19 1 was well informed of the different fadlilies and services available
201 received high quality service
21 the activities and events were delivered at promised times
22 written information was availat>le in my language
23 signs were in my language
24 signs were dear and helpful
25 the fadlities were dean
26 the fadlities were comfortable
27 fadlities for children were provided
28 fadlit'es for disabled visitors were provided
291 received good value for money
30 a suitable range of goods and souvenirs were available for purchase
31 a suitable range of food and drinks v»sre available for purchase and consumption at the maricet
32 a suitable range of food and drinks will be available to purchase and take away from the martcet
Valid Cases
N
413
412
417
418
416
416
413
416
415
415
416
417
407
401
417
412
415
412
415
414
381
409
413
414
413
408
355
349
413
415
416
417
%
98.8
98.6
99.8
100.0
99.5
99.5
98.8
99.5
99.3
99.3
99.5
99.8
97.4
95.9
99.8
98.6
99.3
98.6
99.3
98.8
91.2
97.9
98.8
99.0
98.8
97.6
84.9
83.5
98.8
99.3
99.5
99.8
Missing Values
N
5
6
1
0
2
2
5
2
3
3
2
1
11
17
1
6
3
6
3
4
37
9
5
4
5
10
63
69
5
3
2
1
%
1.2
1.4
0.2
0.0
0.5
0.5
1.2
0.5
0.7
0.7
0.5
0.2
2.6
41
0.2
1.4
0.7
1.4
0.7
1.0
8.9
2.2
1.2
1.0
1.2
2.4
15.1
16.5
1.2
0.7
0.5
0.2
Out
-liers
N
0
0
2
2
2
2
0
0
2
0
0
0
0
0
2
0
0
2
0
2
2
0
0
0
2
2
0
0
1
2
2
2
Mean'
3.49
3.98
4.86
451
4.23
4.33
3.37
3.91
4.44
3.92
3.97
3.43
4.73
2.87
4.37
2.20
3.43
4.88
4.12
4.36
4.19
4.62
471
4.83
4.43
4.41
4.00
4.06
4.76
5.00
5.17
5.21
StDev
1.34
1.30
0.92
1.05
1.19
1.12
1.29
1.24
1.32
1.39
1.34
1.27
1.26
1.36
1.26
1.11
1.42
0.92
1.18
1.05
1.14
1.42
1.41
1.05
1.05
0.96
1.23
1.16
0.83
0.88
0.83
0.80
Skew
ness
-0.21
-0.49
-0.98
-0.83
-0.67
-0.74
-0.03
-0.42
-0.88
-0.35
-0.56
-0.21
-1.36
0.29
-0.78
0.76
-0.17
-1.25
-0.53
-0.67
-0.73
-1.06
-1.23
-1.13
-0.60
-0.48
-0.42
-0.43
-0.71
-0.74
-0.95
-0.98
Kurtosis
-0.91
-0.51
1.64
0.59
-0.02
0.21
-0.71
-0.40
0.18
-0.70
-0.40
-0.77
1.62
-0.89
0.13
-0.05
-0.97
2.84
0.05
0.67
0.56
0.22
0.64
1.57
0.21
0.20
-0.23
-0.03
0.88
0.39
1.08
1.02
A 6-level scale was used where 1 indicates totally disagree and 6 indicates totally agree
183

Chapter 5: Descriptive Analysis Results
Table 5.24: Cultural experience benefits sought and gained scores
Benefits Sought Measurement Item
4.31 a range of food and drinks will be available for purchase and consumption at the mari<et
4.32 a range of food and drinks will be available to purchase and take avray from the martlet
4.29 good value for money
4.25 the facilities provided to be dean
4.26 the facilities provided to be comfortable
4.3 to have fun
4.13 to have a good time with my companions
4.30 a range of goods and souvenirs will be available for purchase
4.24 signs to be clear and helpful
4.28 facilities for disabled visitors to be provided
4.20 to receive high quality service
4.18 the activities and events to be safe
4.22 written information to be in my language
4.23 signs to be in my language
4.27 fadlities for children to be provided
4.19 to be well infomied of the different facilities and services available
4.6 to relax mentally
4.15 to see a famous place
4.4 to be entertained
4.21 the activities and events to be delivered at promised times
4.5 to relax physically
4.8 to gain knowledge
4.9 to forget about wori< and responsibilities
4.10 to escape into another vrorid
4.7 to experience thrills and exdtement
4.2 to be physically involved
4.12 to interact with other visitors
4.11 to interact vwth staff
4.1 to be emotionally involved
4.17 a feeling of accomplishment
4.14 to go to gain the respect of others
4.16 to enhance my social position
Benefits Gained Measurement Kern
31 a suiteble range of food and drinks were available for purchase and consumption at the martcet
32 a suitable range of food and drinks will be available to purchase and fake away from the martlet
291 received good value for money
25 the fadlities were dean
26 the fadlilies were comfortable
031 had fun
13 1 had a good time with my companions
30 a suiteble range of goods and souvenirs were available for purchase
24 signs were dear and helpful
28 fadlities for disabled visitors were provided
201 received high quality service
18 the activities and events were safe
22 written information was available in my language
23 signs were in my language
27 fadlities for children were provided
19 1 was well informed of the different fadlities and services available
061 relaxed mentally
151 saw a famous place
041 was entertained
21 the activities and events were delivered at promised times
051 relaxed physically
081 gained knowledge
09 1 forgot about wort< and responsibilities
101 escaped into another worid
07 1 experienced thrills and excitement
02 1 was physically involved
12 1 interaded witii other visitors
11 1 interaded witii steff
01 1 was emotionally involved
171 got a feeling of accomplishment
141 gained the respect of otiiers
161 enhanced my sodal position
Benefits Sought sample
N
960
960
956
956
959
959
954
960
955
936
960
952
955
953
906
958
958
958
955
947
959
959
955
959
958
957
958
957
959
960
957
957
Mean^
5.10
5.09
5.01
4.93
4.83
481
481
479
4.74
4.65
4.32
4.25
4.24
4.23
4.23
4.21
419
416
416
4.08
4.05
4.00
3.98
3.69
3.64
3.57
3.56
3.55
3.26
3.11
2.64
2.27
Benefits Gained sample
N
415
416
412
412
407
416
406
414
413
348
413
411
408
412
354
414
415
416
417
380
415
415
414
414
412
411
416
415
412
414
400
411
Mean^
5.17
5.21
4.76
4.43
4.41
4.86
4.72
5.00
4.83
4.05
4.35
4.88
4.63
4.71
4.00
4.12
4.33
4.37
4.51
419
4.23
3.91
4.44
3.92
3.37
3.98
3.43
3.97
3.49
3.42
2.87
2.20
a. A 6-level scale was used where 1 indicates totally disagree and 6 indicates totally agree
Table 5.22 shows that all 32 benefits sought items have some missing values, although the
percentage of missing values is only more than 1.0% for three items with the greatest number 5.7%
for the item: expecting facilities for children to be provided. This is possibly due to the many tourists
visiting alone or as a couple (49.6%) as previously seen in the travel group characteristics (Table
184

Chapter 5: Descriptive Analysis Results
5.13) and so considered the question not applicable to them. The benefits gained items shown in
Table 5.23 have a higher percentage of missing values for more items with the greatest number for
the Items: facilities for disabled visitors were provided (17%); facilities for children were provided
(15%); the activities and events were delivered at promised times (9%); and gaining the respect of
otiiers (4%). All are possibly due to respondents considering them not applicable, but the first three
might also have been considered not applicable because these respondents did not observe these
attribute-based benefits during their experience.
Table 5.24 shows the cultural experience benefits ranked by mean scores of agreement with the
statements for the benefits sought items, with means ranging from 2.27 to 5.10. The mean scores
for the benefits gained items have an even wider range from 2.20 to 5.17. These ranges are similar
to the highest means for the attitudes and motives constiuct items (5.10 and 5.13, respectively), but
show a wider spread for the lowest means than for the other two constiuct items (3.04 and 2.61,
respectively).
Only two of the top sixteen benefits sought from the QVM experience are psycho-socio-
physiologically-based and these items are: having fun, and a good time with companions, (ranking
6** and 7*, respectively). The hedonic-related benefit of having fun also ranks highly as a benefit
gained from the experience (5** ) as well as being the top ranked motive for going to cultural
experiences while travelling, and the fourth ranked most liked attitude about going to cultural
experiences in general. Having a good time with companions ranks eighth as a benefit gained, and
the related motive of going to cultural experiences while travelling to do something with family and
friends was ranked slightly higher (7* ). All the other high ranking benefits sought are part atti ibute-
based as they refer to a specific aspect of the experience with the top most agreed benefits sought
being refreshments to consume onsite (1^), refreshments to take away (2™*), good value for money
(3' ), clean and comfortable facilities (4* and 5** ), shopping for goods and souvenirs (8*), clear and
helpful signs (9* ), disabled facilities (10** ) and high quality service (11*). For the benefits gained
from the experience, the two highest ranking items are refreshments consumed and taken away
(2" and 1^, respectively), but this is followed by shopping for goods and souvenirs, safe activities,
having fun, signage, good value for money, and having a good time with companions. Consuming
refreshments, and shopping for goods and souvenirs at the cultural experience ranked lowly as
motives for attending cultural experiences while travelling. Gaining knowledge from the QVM
experience does not rank highly as a benefit sought (22™*) or as a benefit gained (26*) and these
are lower rankings than liking to learn by attending cultural experiences (8*) and learning about
local culture and history as motives for attending cultural experiences while travelling (10* and 11*'
respectively). These differences suggest that the QVM experience differs from other types of
cultural experiences which will be further discussed in later chapters of this study. Items with mean
scores below the 3.5 midway neutral point, number four for benefits sought and six for benefits
gained. All are psycho-socio-physiologically-based and the four in common to both benefits, relate
to emotional involvement, and social recognition from the experience. These findings for social
recognition-related benefits are similar to the social recognition-related motives which were also
185

Chapter 5: Descriptive Analysis Results
below the 3.5 neuti al point, and so reinforces one finding in this study tiiat social recognition is not
positively associated with the motivational process for cultural experiences. Escape-related items
have mixed rankings as benefits although all have means above the 3.5 neuti al point. Escape into
another worid ranks similariy for both benefits sought and benefits gained (24* and 25*
respectively), however forgetting about work and responsibilities ranks more stirongly as a benefit
gained (12*) than as a benefit sought (23"*).
5.6 Preliminary Data Analysis
5.6.1 Missing Data
The existence of missing responses where the values of a variable are unknown may be due to
respondents providing ambiguous answers or their answers not being properiy recorded (Malhotra
et al., 1996). As the question scales used in this study did not include the option to answer 'don't
know/unsure' or 'not applicable' these types of missing values did not apply. The existence of
missing data in attitudes, motivation and benefits research is not surprising as every respondent
may not be able to provide responses to all the variables put to them. For example, with
consumption experience-related benefits variables, some respondents may not have encountered
that particular element of the consumption experience. This type of missing data is termed 'not
applicable' (Hair et al., 1995, p. 45), and needs to be considered when analysing the data with
remedies for missing data being applied to reduce potential hidden biases of the results, and also to
reduce the practical impact of missing data on the sample size available for analysis.
With large sets of scale items for each of the four motivational process constructs of interest to this
study, missing values occumed for the majority of the 124 variables measuring the combined
motivational process constructs (29 variables for attitudes; 31 for motives; and 32 for benefits
sought in the in-situ survey and 32 for benefits gained in the after-visit survey). While the detail of
these and other missing values was outlined in the previous section on normality of data, some
imputation for missing values was undertaken to identify badly completed surveys for removal as
discussed in section 4.3.5 of the previous chapter and to enable preliminary descriptive analysis of
the sample drawn from each martlet in the final retained data set in section 4.3.4. The final retained
data set with imputation for missing values will be used in the reliability analysis of the construct
scale sets discussed in next section of this chapter and the subsequent factor analyses in Chapter
Six.
Listwise deletion would mean that all cases having a missing value for any of the variables in the
data would be excluded from all computations which would reduce the sample size considerably in
this study because of the large number of 153 variables measured in the survey overall. The
excluded cases would result in a considerable loss of information. Pairwise deletion would mean
that only cases having missing values on variables tagged for a particular computation would be
excluded from the analysis but this would still reduce the sample size considerably, especially in the
analysis of the motivational process constructs which are measured by relatively large sets of scale
186
Chapter 5: Descriptive Analysis Results
items. Pairwise deletion also has at least four major problems when used in SEM (Byrne, 2001)
and is not generally recommended for use in SEM unless the number of missing observations is
small (Kline, 2005).
Of the imputation for missing value methods, mean substitution is simple but also has many
statistical problems especially relevant to SEM. It tends to distort the underiying disti ibution of data,
reducing variability and making distribution more peaked at the mean (Vriens & Melton, 2002 cited
in Kline, 2005) and therefore Kline (2005) recommends using other imputation methods that take
better advantage of the sti-ucture in the data. Other authors caution against mean imputation in
SEM which is based on variance and covariance because mean imputation reduces variance of
the variable and correlation between the variable in question and other variables in tiie model
(Brown, 1994 cited in Byme, 2001).
Model-based imputation methods for missing values analysis are considered more sophisticated
than any of the previously discussed methods and Kline (2005) recommends the expectation-
maximization (EM) method because it is based on the EM algorithm which is related to the
maximum likelihood method which is the most widely used estimation algorithm in SEM.
Incomplete data in terms of both the amount and pattern of missing values can bias conclusions
drawn from an empirical study and so must be addressed regardless of their missingness (Byrne,
2001). The EM imputation method was implemented in SPSS version 12.0 to create a new data
file for the consti-uct measurement scales with no missing values for use in the factor analyses and
SEM. Littie's MCAR test was significant (p=.000; Chi-square=16566.66; df=15442), indicating the
missing values were not missing completely at random but this treatment of missing data is
considered acceptable as the extent of missing values prior to EM imputation was not more than
5.7% for any item as reported in the previous section on the normality of the data. Treatinent of
missing responses poses problems, particulariy if the proportion of missing responses is more than
10% (Malhotra etal., 1996).
5.6.2 Reliability
Reliability refers to the extent to which a scale produces consistent results if repeated
measurements are made on the characteristics and is assessed by determining the proportion of
systematic variation in a scale (Malhotra et al., 1996). A summated scale is being used in this
study to measure four of the motivational process constnjcts, whereby several items are summed
to fomn a total score and each item is deemed to measure some aspect of the constmct measured
by the entire scale. Approaches for assessing reliability in a summated scale include internal
consistency methods for determining the association between scores. If the association is high, the
scale yields consistent results and is therefore reliable (Malhotra et al., 1996). Two methods
commonly used for measuring internal consistency are the split-half reliability and the coefficient
alpha or Cronbach alpha (Malhotra et al., 1996).
187
Chapter 5: Descriptive Analysis Results
Split-half reliability is the simplest measure of internal consistency with the set of items constituting
a scale are divided into two halves, the resulting half scores are con^elated and if there are high
congelations between the halves this indicates high internal consistency. How the scale items are
split is a problem with this approach as this influences the results. Common approaches for
splitting the items are halves based on odd- and even-numbered items or randomly. To overcome
this problem, a popular approach is the use of Cronbach alpha or the coefficient alpha which is the
average of all possible split-half coefficients resulting from different ways of splitting the scale items
(Churchill, 1979; Malhotra et al., 1996).
Coefficient alpha or Cronbach alpha is considered absolutely "the first measure one calculates to
assess the quality of the instalment (Churchill, 1979; Nunnally, 1967). A low coefficient alpha
indicates the sample of items perfonns pooriy in capturing tiie construct that motivated the
measure.
When constructs are multi-dimensional, as proposed for four of the motivational process constructs
being investigated in this study, the coefficient alpha would be calculated for each dimension
(Churchill, 1979). Multi-dimensional constmcts use scales that include several sets of items
designed to measure different aspects, dimensions or components of the construct. In this
situation, Malhotra et al. (1996) advises against measuring internal consistency across dimensions
of a construct as these dimensions are somewhat independent and so this would be inappropriate.
Rather internal consistency reliability can be computed for each dimension using Cronbach alpha
as Zeitiin and Westwood (1986) report for measuring emotional response to advertising using multi
dimensional scales. Therefore in this study, it is proposed to measure the internal consistency
reliability for each of the construct dimensions found in the exploratory factor analysis which will be
reported in Chapter Six of this thesis.
Using Cronbach alpha to measure internal consistency across all items constituting each constmct
is problematic also because the coefficient value which varies from 0 to 1, with a value of 0.6 or less
generally indicating unsatisfactory internal consistency reliability, tends to increase with an increase
in the number of scale items whereby the coefficient alpha may be artificially, and inappropriately,
inflated by including several redundant scale items (Malhoti-a et al., 1996). Each of the four
motivational process constructs being measured in this study constitutes relatively large sets of
scale items across multi-dimensions. Therefore a high and possibly inflated Cronbach alpha based
on all items in each construct would be expected and was found as reported in Table 5.25 where
the coefficient alphas for each cultural experience constmct was 0.92 or above using SPSS for
Windows Version 12.0 statistical program. Similarly, the split-half reliability alphas for the two parts
of each construct are based on relatively large sets of scale items for each constmct with the two
parts comprised of the first and second half of each scale set respectively. These coefficient alphas
for both halves of each constmct's scale set indicate high and possibly inflated coefficient alpha
with all parts being well above 0.6 and the lowest coefficient being 0.87 for both parts of the attitude
constmct.
188

Chapter 5: Descriptive Analysis Results
Table 5.25: Reliability analysis of the survey instrument Construct
Attitudes
Motives
Benefits Sought
Benefits Gained
Number
of Cases
961
961
961
417
Number
of Items
29
31
32
32
Coefficient Alpha
.917
.919
.935
.919
Split-half Reliability
Parti
.874
.876
.905
.879
Part 2
.878
.877
.914
.888
5.6.3 Mann-Whitney U Test Results
To establish whether the large sample who completed the in-situ survey can be used to measure
the three cultural experience motivational process constructs of attitudes, motives, and benefits
sought, and the smaller sample of the after-visit survey respondents can be used for the fourth
motivational process construct of benefits gained, two sample proportions tests are undertaken.
The two samples to be used in these tests are the after-visit survey respondent sample compared
to the in-situ survey respondents who did not complete the after-visit survey to establish the extent
to which these two independent groups come from the same population.
As discussed in the data analysis approaches used to undertake descriptive analysis in this study
(Chapter 4, section 4.6.1), the Mann-Whitney U test in SPSS Version 12.0 is selected for these
statistical tests of the difference in location of central tendency on selected variables because it is a
powerful non-parametric equivalent of the parametric t test. For the dichotomous scale data
(questions 5.1, 5.5, 5.8.1 - 5.8.16), a cross-tab procedure in a 2 x 2 contingency table using SPSS
Version 12.0 was also undertaken to conduct a chi-square test for a significant difference in
proportions obtained from two independent samples (Malhotra et al., 1996). As the Pearson chi-
square value for the asymptotic significance (2-sided) was the same value as the Mann-Whitney U
test (2-tailed probability) reported in Table 5.26, the results of the chi-square test are not reported
separately.
The most significant differences (at p<0.001) between respondents who completed the after-visit
sun/ey and those who did not are noted in only two of the 29 respondent characteristics: age and
travel group to QVM this trip (see Table 5.26). Further detail of these characteristics with significant
differences can be seen in Table 5.27 for age and Table 5.28 for ti-avel group. In terms of age, a
greater percent of the after-visit respondents are 45-64 years of age compared with those who did
not complete the after-visit survey (51 % cf 38%) and the reverse applies to the younger age groups
with less of the after-visit group aged 18-44 years (37% cf 51%). Both groups have a similar
percent of respondents 65 years and over (12% cf 10%). Some caution should apply to the
interpretation of results relating to younger adult visitors, especially for the benefits gained construct
but this caution had already been noted in the demographic profile summary of the samples
(section 5.3.1). By travel group, more of the after-visit respondents are visiting as a couple
compared with those who did not complete the after-visit survey (38% cf 33%) and more are also
visiting alone (18% cf 11%), while less are visiting with friends (18% cf 23%), or with a tour group
189

Chapter 5: Descriptive Analysis Results
(1% cf 8%). The latter is interesting to note and forewarns that any findings relating to those on tour
groups need to be interpreted with particular caution, although this applied anyway given the small
sample size of respondents who were visiting as part of an organised tour compared with those
visiting independentiy. Table 5.28 confinns that the vast majority of respondents in the group that
answered the after-visit survey and those who did not, were visiting independentiy (92% cf 89%),
and only a small percent were visiting as part of an organised tour group (4% for both groups).
Table 5.26: Mann-Whitney U test of significant differences in demographic, travel and trip characteristics
Demographic, Travel and Trip Characteristics
1.1 Region a country lived
1.2 Australian state or territory lived, if permanent resident
1.3 language most spoken at tiome
1.4 Length of nigtits stayed in tvlellmume ttiis trip
1.5 Age
1.6 Gender
5.1 Meltx3ume previous visit
5.2 Purpose of trip to Melboume
5.3 Accommodation in Melboume
5.4 Main form of transport used to get to QVM
5.5 QVl^ previous visit
5.6 Travel arrangements to QVM ttiis trip
5.7 Travel group this QVM visit
5.8.1 Heard about QVM from friends/relatives
5.8.2 Heard about QVM from travel agent
5.8.3 Heard about QVM from intemet
5.8.4 Heard about QVM from television
5.8.5 Heard about QVM from magazine
5.8.6 Heard about QVM from newspaper
5.8.7 Heard about QVM from radio
5.8.8 Heard about QVM from brochure
5.8.9 Heard about QVM from travel guide book
5.8.10 Heard about QVM from airline
5.8.11 Heard about QVM from accommodation provider
5.8.12 Heard about QVM from visitor infiormation centre
5.8.13 Heard about QVM from tour operator
5.8.14 Heard about QVM as been there before
5.8.15 Heard about QVM from walking passed
5.8.16 Heard about QVM from other source
Completed After Visit
N
418
138
418
417
417
414
418
418
418
418
418
418
418
418
418
418
418
418
418
.418
418
418
418
418
418
418
418
418
418
Did not complete
After Visit
N
543
176
543
540
538
540
542
542
541
542
542
542
539
542
542
542
542
542
542
542
542
542
542
542
542
542
542
542
542
Ztest
-0.839
-0.288
-2.063
-0.481
-4.185
-2.572
-1.244
-1.899
-0.925
-1.371
-0.637
-1.900
-3.633
-2.721
-0.182
-0.272
-0.052
-0.351
-0.132
-0.749
-1.588
-1.911
-1.331
-0.940
-1.654
-0.699
-3.009
-0.351
0.182
2-tailed probability
0.401
0.774
0.039*
0.630
0.000***
0.010*
0.213
0.058
0.355
0.170
0.524
0.057
0.000***
0.007*
0.855
0.785
0.959
0.726
0.895
0.454
0.112
0.056
0.183
0.347
0.098
0.484
0.003**
0.726
0.855
*p<0.05 **p<0.01 ***p<0.001
190

Chapter 5: Descriptive Analysis Results
Table 5.27: Demographic profile of after-visit sun/ey respondents compared with nno after-visit survey respondents
Variable Completed After Visit {N=418)
Frequency Percentage
Did Not Complete (N=543)
Frequency Percentage
Gender
Female
Male
Missing
247
167
4
59.66
40.34
0.96
277
263
3
51.30
48.70
0.55
Age
18-24
25-34
35-44
45-54
55-64
65-74
75+
Missing
Language Most Spoken at i
English
Chinese (Mandarin)
Chinese (Cantonese)
Chinese (Dialect)
Japanese
Missing
33
66
57
107
106
42
6
1
lome
325
33
16
8
36
0
7.91
15.79
13.64
25.60
25.36
10.05
1.44
0.24
77.75
7.89
3.83
1.91
8.61
0.0
90
104
83
100
108
49
4
5
16.57
19.15
15.29
18.42
19.89
9.02
0.74
0.92
395
42
21
2
83
0
72.74
7.74
3.87
0.37
15.29
0.0
Table 5.28: QVM visit profile of after-visit survey respondents compared with non after-visit survey respondents
Variable Completed After Visit (N=418)
Frequency Percentage
Did Not Complete (N= 543)
Frequency Percentage
QVM visit arrangements
Independently
Organised tour group
Other
Missing
386
15
17
0
92.34
3.59
4.07
0.0
481
24
37
1
88.75
4.43
6.83
0.18
Travel group
Alone
As a couple
As a group of parents and children
With other relatives
With friends
With family and friends
With a tour group
With business colleagues
Sporting/community group
Other
Missing
76
160
31
24
76
43
5
1
0
2
0
18.18
38.23
7.42
5.74
18.18
10.29
1.20
0.24
0.0
0.48
0.0
60
180
53
46
123
50
14
5
2
6
4
11.13
33.40
9.83
8.53
22.82
9.28
7.55
0.93
0.37
1.11
0.74
191

Chapter 5: Descriptive Analysis Results
Table 5.29: Mann-Whitney U test of significant differences in cultural experience attitudes
Cultural Experience Attitudes Measurement Item
Hike going...
2.1 to art galleries
2.2 to classical music performances
23 to modem music performances
2.4 to the ballet
25 to dance performances
2,6 to the opera
2.7 to theatrical performances of written stories
2.8 to musicals
2,9 to museums
2.10 to arts and cultural festivals
2.11 to historic buildings, sites and monuments
212 to Australian aboriginal cultural perfomnances and exhibitions
2,13tomai1<ets
2.14 to cultural performances held in historical settings
2.15 to cultural experiences involving Australian history
2.16 to see Australian art
2.17 to cultural experiences because they are related to my wbric
2.18 to cultural experiences to have fun
2,19 to cultural experiences to make others happy
2,20 to cultural e)?)eriences that my friends and family have done
2,21 to cultural experiences because local people attend
2.22 to cultural experiences that have been recommended by others
2,23 to famous cultural places
2,24 to see famous performers/entertainers
2.25 to see famous shows performed
226 to cultural experiences to leam
2,27 to cultural experiences for a sense of escaping into another worid and qeWnq away from it all
2,28 to cultural experiences for the chance to interact with others
2.29 to cultural experiences on package tours
Completed After-Visit
N
418
416
417
414
416
414
415
417
418
416
417
402
415
413
414
413
410
418
412
416
415
416
415
411
414
415
416
418
417
Did not complete
After-Visit
N
543
540
540
541
541
537
538
537
539
538
539
525
542
539
540
541
536
541
535
542
538
542
541
539
539
538
537
543
540
Ztest
-3.665
-2.638
-1.323
-1.378
-0.442
-2.104
-2.760
-1.976
-3.452
-2.170
-1.435
-0.091
-1.807
-3.463
-3.144
-2.451
-0.916
-2.385
-0.165
-2.471
-1.443
-2.096
-3.689
-0.721
-0.383
-2.258
-1.742
-0.479
-0.811
2-tailed probability
0.000***
0.008**
0.186
0.168
0.658
0.035*
0.006**
0.048*
o.oor* 0.030*
0.151
0.927
0.071
0.001**
0.002**
0.014*
0.360
0.01 r
0.869
0.013*
0.149
0.036*
0.000***
0.471
0.702
0.024*
0.082
0.632
0.417
*p<0.05 "p<0.01 ***p<0.001
The most significant differences (at p<0.001) between respondents who completed the after-visit
survey and those who did not are noted in only two of the 29 cultural experience attitudes for the
items: I like going to classical music performances; and I like going to famous cultural places (see
Table 5.29).
The most significant differences (at p<0.001) between respondents who completed the after-visit
sun/ey and those who did not are noted in only three of the 31 cultural experience motives for why
respondents go to cultural attractions and events while travelling and these are the items: to learn
about local culture; to enjoy something unique to the destination; and to have a change from daily
routine (see Table 5.30).
192

Chapter 5: Descriptive Analysis Results
Table 5.30: Mann-Whitney U test of significant differences in cultural experience motives
Cultural Experience Motives Measurement Item
1 go to cultural attractions arxl events while travelling...
3.1 to have fun
3,2 to be entertained by others
3,3 to relax physically
3,4 to relax mentally
35 to have thrills and excitement
3.6 to get emotionally involved
3.7 to do something 1 vwant to do
3,8 to do something with my family and friends
3,9 to do something by myself
310 to meet locals
3.11 to leam about local culture
3,12 to leam about local history
313 to leam about local performing arts
3.14 to do something related to my vroric
3.15 to enjoy something unique to the destination
3,16 to have a change from my daily routine
3.17 to forget about demands of daily life
3.18 to escape into another worid
3.19 lo satisfy my curiosity
3.20 to tell my friends and relatives about it
3.21 to enhance my sodal posifon
3,22 to see famous cultural places
3.23 to hear femous performers/entertainers
3,24 to see famous shows performed
3,25 to gain the respect of others
3.26 to demonstrate my ability to travel
327 to go somewhere safe
328 to get value for money
3.29 to have a high quality experience
3.30 to buy goods and souvenirs
3.31 to buy food and drinks to consume at the cultural experience
Completed After-Visit
N
418
413
417
415
415
413
416
415
415
414
417
417
415
410
416
416
415
418
415
416
415
417
417
417
416
414
418
417
415
415
417
Did not complete
After-Visit
N
543
541
542
543
539
541
536
539
534
542
540
542
538
529
537
538
538
539
540
538
536
538
538
538
540
537
539
540
536
540
540
Ztest
-0.281
-2.476
-0.050
-0.341
-2.928
-1.510
-2.676
-0.153
-2.141
-2.390
-3.599
-3.425
-1.713
-0.739
-4.313
-3.666
-2.428
-1.162
-3.389
-1.196
-2.135
-1.977
-1.068
-0.891
-1.275
-0.201
-2.735
-2.560
-2.802
-1.168
-1.178
2-tailed probability
0.775
0.013*
0.960
0.733
0.003**
0.131
0.007**
0.878
0.032*
0.017*
0.000***
0.001**
0.087
0.460
0.000***
0.000***
0.015*
0.245
0.001**
0.232
0.033*
0.048*
0.285
0.373
0.202
0.841
0.006**
0.010*
0.005**
0.243
0.239
*p<0.05 "p<0.01 ***p<0.001
There are no significant differences (at p<0.001) for any of the 32 cultural experience benefits
sought items between respondents who completed the after-visit survey and those who did not
(see Table 5.31).
193

Chapter 5: Descriptive Analysis Results
TaWe 5.31- Mann-Whitney U test of significant differences in cultural experience benefits sought
Cultural Experience Benefits Sought Measurement Item
From my visit to Queen Victoria Market, 1 expect...
4.1 to be emotionally involved
42 to be physically involved
4.3 to have fun
4.4 to be entertained
4.5 to relax physically
iS to relax mentally
4.7 to experience thrills and excitement
4.8 to gain knowledge
4.9 to forget about woric and responsibilities
4,10 to escape into another worid
4.11 to interact with staff
4.12 to interact with other visitors
4.13 to have a gcxxl time with my companions
4,14 to go to gain the respect of others
4.15 to see a famous place
4.16 to enhance my sodal position
4.17 a feeling of accomplishment
4.18 the activities and events to be safe
4,19 to be well informed of the different fadlities and serwces available
4.20 to receive high quality service
421 the activities and events to be delivered at promised Unties
422 written information to be in my language
4,23 signs to be in my language
4,24 signs to be dear and helpful
4,25 the fedlities provided to be dean
426 the fadllfes provided to be comfortable
4.27 fadlilies for children to be provided
4.28 fadlities for disabled visitors to be provided
4.29 good value for money
4,30 a range of goods and souvenirs will be available for purchase
4,31 a range of food anddrinkswillbe available for purchase and consumpfon at the martcet
4,32 a range of food and drinks will be available to purchase and take avuay from the martcet
Completed After-Visit
N
417
417
417
417
418
417
417
418
415
418
418
418
415
417
417
416
418
416
416
418
414
415
413
416
416
418
393
408
416
417
418
418
Did not complete
After-Visit
N
542
540
542
538
541
541
541
541
540
541
539
540
539
540
541
541
541
536
542
542
533
540
540
539
540
541
513
528
540
543
542
542
Ztest
-1.539
-0.374
-0.117
-0.275
-1.697
-0.857
-2.362
-0.521
-0.728
-0.514
-0.008
0.495
-0.928
-1.699
-0.232
-1.688
-0.318
-1.073
-1.355
-2.541
-1.102
-1.963
-1.724
-1.753
-1.940
-1.122
-0.567
-2.127
-0.131
-0.518
-0.962
-2.136
2-tailed probability
0.124
0.705
0.907
0.783
0.090
0.392
0.018*
0.603
0.466
0.607
0.994
0.621
0.353
0.089
0.817
0.092
0.751
0.283
0.175
0.011*
0.270
0.050
0.085
0.080
0.052
0.262
0.571
0.033*
0.896
0.605
0.336
0.033*
*p<o.o5 **p<aof ***p<o.ooi
The Mann-Whitney U test results overall, show few significant differences (at p<0.001) for those
who completed the after-visit survey compared with those who did not. Significant differences are
found for only seven of the 121 variables measured in the in-situ survey of this study: the two
demographic, travel and trip characteristics of age and travel group; two of the 29 cultural
experience attitudes, and three of the 31 motives. Furthermore, there are no significant differences
(at p<0.001) between the two groups for the 32 benefits sought items. These statistical test results
support using the larger sample of the in-situ survey respondents (n=961) for the three motivational
constructs of attitudes, motives and benefits sought, and the smaller sample of the after-visit survey
respondents (n=418) for the fourth motivational construct of benefits gained in the further statistical
194

Chapter 5: Descriptive Analysis Results
analysis of the next chapter where the hypotheses that were developed and presented in Chapter
Three of this thesis will be tested.
5.7 Summary
In this chapter, the data for the respondents in the sample for this study was analysed to describe
the characteristics of the sample and initial analysis of their responses to measurement items for
the 153 variables in the combined in-situ and after-visit surveys. The sample's demographic, travel
and trip characteristics were profiled for the group as a whole and then as two subgroups -
intemational and domestic tourists. Representativeness of the sample was compared vAth the
wider population of international and domestic tourist to Australia and the state of Victoria on
selected criteria for which infomnation exists.
The gender balance of the samples is quite representative although the proportion of females to
males is a marginally higher for both the total in-situ sample and the after-visit samples, but with
similar proportions for the domestic tourist subsamples and the international tourist subsamples.
Age groups show some difference between the total sample, the two subsamples of domestic and
international tourists, and in comparison with all tourists to Australia and Victoria. In summary, the
majority of domestic tourists are older than the majority of international tourists and the domestic
tourist sample aged 45-64 years is much greater than for all domestic tourists to Australian and
Victoria (58% cf 33%). The after-visit sample has a greater proportion aged 45 years or over than
the total sample (62% cf 54%) with even greater proportions for the domestic tourists (73.5%) than
the international tourists (58%). These age group proportions suggest some caution should be
applied when inferring the study results to the younger age groups of 18-34 years, especially for
domestic tourists. This difference is even more pronounced for the after-visit sample, which
measures the benefits gained construct, with only 24% being 18-34 years, compared with 31% for
the total sample, while domestic tourists in this age group comprise only 11%. The low proportions
of domestic tourists 18-34 years, further suggest that the QVM is less popular for the younger adult
members of this tourist group.
The cultural profile of the samples based on language spoken at home, shows 100% English-
speaking samples for all of the Western markets and similar proportions of Chinese- and
Japanese-speaking international tourists for the total sample (13% and 12%, respectively). Two
sample proportions tests for significant differences between those respondents who completed the
after-visit survey and those who did not, found few significant differences between the two samples
supporting the use of the in-situ survey sample (N=961) for the cultural experience attitude, motives
and benefits sought constructs and the after-visit survey sample (N=418) for the cultural experience
benefits gained construct. The one exceptional difference was the low response rate to the after-
visit survey from Japanese-speaking tourists which, combined with the minimum sample size
requirements for factor analysis and structural equation modeling discussed in Chapter Four,
195

Chapter 5: Descriptive Analysis Results
restiicts benefits gained analysis to three combined subsamples of the total eight population units:
English-speaking intemational tourists (N=187), Chinese- or Japanese-speaking international
tourists from Asia (N=93), and English-speaking domestic tourists (N=138).
In terms of the travel and trip profile of the samples, two characteristics were of particular interest.
The very high proportion of tourists visiting QVM independentiy (more than 90% of all respondents)
and the very low proportjon visiting as part of a tour group only (4%), the latter applying equally to
international tourists (4%) and domestic tourists (4%), were noted. This contrasts the sample of
this study with many existing studies of Asian tourists to Australia and their motivation and
behaviour where the sample largely has comprised visitors on tour groups (e.g., for Chinese
tourists, Weiler and Yu, 2004; Yu and Weiler, 2006). The other characteristic of note was the high
proportion of repeat visitors to both the destination of Melbourne and to the QVM attraction with
more than half of the whole sample repeat visitors to Melbourne (52%) and by subgroup,
considerably more domestic tourists were repeat visitors (87%) than international tourists (36%).
Similar proportions of the whole sample were found for repeat visitors to QVM (47%), and by
subgroup, again considerably more domestic tourists were repeat visitors (70%) than international
tourists (37%). These high proportions of repeat visitors suggest high levels of satisfaction for
domestic and international tourists with the destination of Melbourne and QVM as an attraction at
the destination. In later analysis chapters, this study will conti ibute a better understanding of visitor
satisfaction with QVM, when satisfaction is interned by comparison of the benefits sought and the
benefits gained constructs which will give more detailed knowledge of the specific benefits with
which tourists are satisfied or dissatisfied.
Analysis of mean scores for all 124 items measuring the combined motivational process constructs
demonstrated the majority of items were found to be positively associated with the cultural
experience motivational process. On a 6-point scale where 1 indicates totally disagree and 6
indicates totally agree, mean scores ranged for attitudes items (3.04 to 5.10), motives items (2.61 to
5.13), benefits sought items (2.27 to 5.10), and for the benefits gained items (2.20 to 5.17). All 124
items measuring the combined motivational process constmcts also demonstrated good spread of
responses with standard deviations ranging for attitudes items (1.05 to 1.58), motives items (0.97 to
1.61), benefits sought items (0.89 to 1.58), and for the benefits gained items (0.81 to 1.42).
Further analysis of mean scores by ranking the measurement items within each of the four
motivational process constructs indicated the position of individual items in relation to cultural
experiences. Attitudes towards different types of cultural experiences showed the most strongly
liked cultural experiences are markets, famous cultural places, followed by historic buildings, sites
and monuments, while the least liked-cultural experiences are the ballet and opera, with means
only marginally above slightly disagree. Attitudes towards psycho-socio-physiologically-based
outcomes from going to cultural experiences were above the 3.5 neutral point with the two highest
ranking means being: having fun (ranks 4th) and to learn (ranks 8* ), suggesting respondents like
going to cultural experiences for hedonic-related outcomes as well as educational outcomes.
196

Chapter 5: Descriptive Analysis Results
Going to cultural experiences that have been recommended by others also ranked highly (10* )
showing the importance of favourable word-of-mouth in influencing people's attendance at cultural
experiences. Liking cultural experiences for escape-related outcomes is middle ranked (15* ), and
marginally above social interaction-related outcomes (17*).
Six of the top nine most agreed motives for going to cultural attractions and events while travelling
were psycho-socio-physiologically-based and included the top ranking hedonic-related motive of
having fun. They also include the escape-related motive of a change from daily routine, although
other escape-related motives are lower ranking (but well above the 3.5 neutral point): to forget
about daily life (14* ), and to escape into another worid (20*). The three lowest ranking motives are
all marginally below the 3.5 neuti al mean score and are all related to social recognition which is a
psycho-sociologically-based motive that in this study has not been positively associated as a
motive for going to cultural experiences while ti^avelling. The other three of the top nine most
agreed motives are also part attribute-based as they refer to a specific aspect of the cultural
experience, namely, enjoying something unique to the destination, having a high quality
experience, and seeing famous cultural places.
Only two of the top sixteen benefits sought from the QVM experience are psycho-socio-
physiologically-based and these items are: having fun, and a good time with companions, (ranking
6* and 7*, respectively). The hedonic-related benefit of having fun also ranks highly as a benefit
gained from the experience (5*) and having a good time with companions ranks eighth as a benefit
gained. All the other high ranking benefits sought are part attribute-based as they refer to a specific
aspect of the experience. Items with mean scores below the 3.5 midway neutral point, number four
for benefits sought and six for benefits gained. All are psycho-socio-physiologically-based and the
four in common to both benefits, relate to emotional involvement, and social recognition from the
experience. These findings for social recognition-related benefits reinforce the eariier finding for
motives that social recognition is not positively associated with the motivational process for cultural
experiences. Escape-related items have mixed rankings as benefits although all have means
above the 3.5 neutral point. Escape into another worid ranks similariy for both benefits sought and
benefits gained (24* and 25* respectively), however forgetting about work and responsibilities
ranks more strongly as a benefit gained (12*) than as a benefit sought (23' ).
Preliminary analysis of the data for normality, central tendency and spread, scale reliability, missing
values and their treatment, found the data suitable for subsequent factor analyses in Chapter Six.
197

Chapter 6: Factor Analysis Results
Chapter 6 Factor Analysis Results
6.1 Introduction
In the previous chapter, descriptive data analysis was presented that determined the characteristics
of the sample and subsamples, and the normality of the data. The purpose of this chapter is to test
research hypotheses outlined in Chapter Three with an emphasis on determining the underiying
dimensions of the four cultural experience motivational process constmcts and developing
measurement models of their confinmed structure. Cross-cultural research of tourists' cultural
experience attitudes and motivations is lacking to date despite the cross-cultural nature of
international tourism (Reisinger, 2005). Therefore a further focus is testing for cultural differences in
the factorial dimensions and stmcture.
For each of the four motivational process constmcts of attitudes, motives, benefits sought and
benefits gained towards attending cultural experiences, measurement models are developed using
a cross-validation method applied to a combined sample of English-speaking Western tourists
visiting Melbourne, Australia. This involves determining the underiying dimensionality structure of
cultural experience motivational process constmcts by randomly splitting the sample into a
calibration sample for exploratory factor analysis (EFA) and then undertaking confirmatory factor
analysis (CFA) on a validation sample to cross-validate the proposed dimensionality in each
measurement model. Cross-cultural validation for each measurement model is also examined for
some of Australia's major tourist markets for factor configural and metric invariance, firstiy by
invariance testing of the English-speaking Western tourist sample measurement models for the four
different cultural group subsamples of interest to this study: English-speaking domestic tourists in
Australia from the nearby states (NSW, SA, and Qld); English-speaking international tourists from
North America, New Zealand, and United Kingdom and Ireland. These measurement models
derived from English-speaking Western tourists are then cross-culturally validated for Asian tourists
represented by a sample of Chinese- or Japanese-speaking tourists from Asia. Firstly, the
underiying dimensionality and factorial configurance of the models is tested for the combined Asian
sample and then each of the Asian subsamples is tested for cultural group difference in metric
invariance.
The subsample selected for developing the measurement models is the English-speaking Western
tourists. This study is testing the global hypothesis as argued by Schutte and Ciariante (1998)
drawing on the work of Hofstede (1984), Trompenaars (1993) and others, that Asian consumer
behaviour is distinctively different from Western consumer behaviour and therefore these cultural
differences are pervasive enough to call for different marketing strategies. There are similarities
within Asia such as the importance of family, group orientation and the issue of face, that
differentiate them from the rest of the worid, particulariy the West and so justify the use of the terms
Asian culture' and 'Asian consumer behaviour'. Just as these similarities in no way deny the
198

Chapter 6: Factor Analysis Results
existence of culhjral heterogeneity in the region, they do imply that the differences within Asia are
less significant than the differences from the world outside Asia (Schutte and Ciariante, 1998).
Similariy, using the combined sample of English-speaking tourists to develop and confinn the
measurement models, is not denying the existence of cultural heterogeneity within the four martlets
of North America, New Zealand, United Kingdom and Ireland, and domestic tourists in Austi-alia;
however it is using language as one of the main sources of culture, rather than nationality which is
one source of culture, but often not the main one. Cultures do not correspond to nation-states, but
to linguistic, ethnic, religious or even organisational entities (Usunier and Lee, 2005). English-
speaking respondents from these four geographic mari<ets comprise a sample representative of
Western culture for developing the cultural experience motivational process measurement models.
The hypothesis that Asian consumer behaviour is distinctively different from Western consumer
behaviour is then tested by cross-validating the measurement models developed on the Western
culture sample, with the Asian culture sample comprised of Chinese- and Japanese-speaking
tourists from Asia.
The measurement models are not developed with the Asian culture samples for cross-validation on
the Western culture samples, because of the presence of multiple languages and dialects in Asian
culture as evidenced within the Asian tourist sample which comprises two Asian languages
(Chinese and Japanese) and several dialects within the Chinese-speaking sample which are
represented in this study by Mandarin (62%), Cantonese (30%) and other Chinese dialects (8%).
Two further hypotheses to be tested in this study are whether there are significant differences: (i)
within the Asian tourists for the two subsamples of Chinese-speaking tourists from Asia and
Japanese tourists; and (ii) within the English-speaking Western tourists for the four subsamples of
domestic interstate tourists in Australia, and international tourists from New Zealand, North
America, and United Kingdom and Ireland.
All of these Western and Asian cultural groups are major tourist markets for Melbourne and
Australia as well as for many other destinations. A further rationale for developing and confinning
the measurement models for the English-speaking Western tourists and then cross-validating it
with Asian tourists (Chinese- or Japanese-speaking) is that the majority of published tourist
motivation research and theory has involved English-speaking tourists, particulariy tourists in or
from North America and the UK, as previously discussed in Chapter Four analysis of existing
research for measuring each of the motivational process constructs of interest to this study.
Schutte and Ciariante (1998) confirm that Western cultures form the basis for most of the existing
body of consumer behaviour literature and theory. Within the literature deemed accurate and
relevant to the topic of consumer behaviour in Asia, the literature was found to be far richer on
Chinese and Japanese consumer behaviour than for other Asian consumers (Schutte and
Ciariante, 1998), further justifying cross-validating the models on an Asian sample of Chinese- or
Japanese-speaking tourists from North East or South East Asia.
199

Chapter 6: Factor Analysis Results
Cross-national validation studies of consumer behaviour theory are needed and recommended by
Lee and Green (1991) who note a tendency for consumer researchers to implicitiy or explicitiy
assume that models of consumer behaviour developed on American consumers are universally
applicable without testing the underiying model assumptions or the model linkages. Their cross-
cultural research examined the applicability of the Fishbein behavioural intentions model (Ajzen and
Fishbein, 1980; Fishbein, 1967) in Korea and the United States. Theory suggested tiiat this model
which is well supported on American consumers where individualist culture is dominant, would not
be as powerful in understanding, or predicting behavioural intentions in an Eastern culture
characterised by a strong group-orientation. Nonetheless the study revealed that the unmodified
Fishbein model does predict behavioural intention even in the context of Confucian culture,
although not as accurately as for American consumers. However, the way in which the model
works was found to be different because of the greater weight of the different dimensions in
detemnining the behavioural intentions of Korean consumers (Lee and Green, 1991).
The research hypotheses addressed in this chapter relate specifically to Hypothesis Four of this
thesis that the cultural experience motivational process constmcts will differ by culture with three
specific cultural group hypotheses: for differences between Western and Asian tourists, within
Asian cultural groups between Chinese-speaking and Japanese-speaking tourists, but no
significant differences between Western tourist cultural groups (as stated in Chapter 3 Conceptual
Framework).
6.2 Statistical Analyses
A two-stage process in the exploration and validation of the factorial structure of the questionnaire
items will be used in this study as recommended by Anderson and Gerbing (1988), including the
recommended cross-validation procedure (Hair et al., 2006) of randomly dividing the participants
into two samples (1:2 ratio) before analysis by using the random sample selection procedure in
SPSS version 12.0. The size of the English-speaking Western tourist subsample for the in-situ
sun/ey (N = 720) is highly suitable for developing and confinning the construct measurement
models for three of the four cultural experience motivational process constmcts of attitudes, motives
and benefits sought using a two-stage statistical analysis process and a cross-validation procedure
with a randomly split sample. This provides a calibration sample (N = 362) for estimating and fine-
tuning the factor model in the exploratory factor analysis and a validation sample (N = 358) for
testing the stability of the final model (Hsu, 2001). For the benefits gained construct measured by
the after visit survey, the 43% response rate produced an English-speaking Western tourist
subsample (N = 325) that is also suitable for developing and confirming the measurement model
for this construct using a two-stage statistical analysis process and cross-validation procedure with
a randomly split sample of a calibration sample (N = 169) and a validation sample (N =156).
In the first stage of analysis, exploratory factor analysis (EFA) to determine the underiying
measurement model is undertaken for each motivational process construct using maximum
200

Chapters: Factor Analysis Results
likelihood extraction with oblique rotation on the measurement items for each construct until a
satisfactory model of the factorial stmcture of the questionnaire items is detemnined. With reference
to minimum sample size, the size of the calibration samples (N = 362 for attitudes, motives and
benefits sought constructs; N = 169 for the benefits gained constmct) used in the EFA allows the
full questionnaire item sets for each constmct (29 attitude items; 31 motive items; 32 benefits
sought and gained items) to be used with a case per variable ratio of at least five for each variable
which is above the general mIe of a minimum of three (Cattell, 1978 cited in Mundfrom et al., 2005)
and fulfils or exceeds the recommended five cases (Hair et al., 2006). As the primary objective is to
identify the latent dimensions of the cultural experience constructs represented in the original
variables and because the scales being used to measure each of the constructs are unvalidated
and so there is little knowledge about the amount of unique error variance, maximum likelihood
extraction based on shared variance is deemed an appropriate factor analysis method to use.
Because correlation between the construct dimensions is expected, the use of the oblique rotation
metiiod, OBLIMIN in SPSS version 12.0, is justified (Hair et al., 2006).
Dimensions are initially extracted in the EFA based on eigenvalues greater than one, but the scree
plot of the eigenvalues is then inspected to identify the factor solution where there is a major
departure from linearity and specify this number of factors, where it differs from eigenvalues greater
than one. Satisfactory factorial stmcture is achieved by removing items needed to respecify the
factor model, and then a new factor solution is derived after the removal of each item because
maximum likelihood extraction is based on shared variance. Evaluation of variables for possible
deletion because they are not adequately accounted for by the solution is based on several criteria.
Any variable(s) lacking at least one significant factor loading or cross-loading with moderate size
loadings on several factors, all of which are significant, are removed (Hair et al., 2006). Factor
loadings of +.30 to +.40 are minimally acceptable, +.50 or greater are considered practically
significant and loadings exceeding +.70 considered indicative of well defined stmcture and are the
goal of any factor analysis (Hair et al., 2006). Items are removed if the communality value is below
the .20 threshold indicating that the variable shares a low amount of variance with all the other
variables. While Hair et al. (2006) recommend variables should generally have communalities of
greater than .50 to be retained in the analysis, a .20 threshold is adopted in this study as several
authors acknowledge low communality patterns commence at .20 (Costello and Osborne, 2005;
Mundfrom et al., 2005). Further discriminant validity of the factorial structure is based on inspection
of the pattern and stmcture matrices. While the factor pattern matrix has loadings that represent
the unique contribution of each variable to the factor (and is used to identify significant factor
loadings and any cross-loadings as discussed above), the factor structure matrix has simple
correlations between variables and factors with these loadings containing both the unique variance
between variables and factors and the correlation among factors (Hair et al., 2006). Inspection of
the structure matrix is undertaken to ensure the factors represent distinguishable constructs, that is,
the factor item with the lowest stmcture coefficient is a higher value than the stmcture coefficients
for all the items within the other factors. The internal reliability of each dimension is then calculated
201
Chapter 6: Factor Analysis Results
using Cronbach alpha coefficients, the most commonly used measure to assess the consistency of
the entire scale and the generally agreed upon lower limit Cronbach alpha value is .70, although it
may decrease to .60 in exploratory research (Hair et al., 2006). Each separate item witiiin each
dimension is also considered with further items eliminated if required so that all items retained have
corrected item-to-total con-elations (the congelation of the item to the summated scale score) greater
than 0.5 as generally recommended (Hair et al., 2006). Dimensions are retained if they have two or
more significantiy loading items. The model derived from the EFA is subsequentiy evaluated using
confinnatory factor analysis (CFA) from the second stage of analysis.
In the second stage of analysis, a series of CFA analyses are undertaken v\/ith the participants'
responses. Initially, one-factor congeneric models for each of the constmcts is undertaken to test
for internal validity, and then the factorial validity of the hypothesised model derived fi'om the EFA is
tested for discriminant validity (Anderson and Gerbing, 1988). In these models, the variances of the
latent variables are set to unity in order to identify the models and maximum-likelihood estimation
procedures on the covariance stmctures are conducted in AMOS version 5.0 program. In
evaluating the factorial validity of the full measurement stmcture, both pattern and structure
coefficients are considered. Multiple criteria are employed to assess the goodness-of-fit of the
models, although index cutoff values for distinguishing acceptable and unacceptable model fit will
be adjusted based on model characteristics in accordance with guidelines for using fit indices in
different situations as outlined by Hair et al. (2006). Statistical fit of the models is determined by the
chi-square (x^) and how it quantifies the differences between the observed and estimated
covariance matrices. A small -^ value (and a corresponding large p-value) that indicates no
statistically significant difference between the matrices is the desired measure of model fit (Hair et
al., 2006). Absolute fit of the models is also determined by the goodness-of-fit index (GFI), the
adjusted goodness-of-fit index (AGFI), the standardised root mean-square residual (SRMR), and
the root mean-square error of approximation (RMSEA). Further descriptive fit of the models is
determined by using the incremental fit measures of the Tucker-Lewis Index (TLI), and the
comparative fit index (CFI). Parsimonious fit is determined by the normed chi-square ratio of -^ to
degrees of freedom (of/). The desired tinreshold for the GFI, AGFI, TLI and CFI is .90 as noted by
Hair et al, (2006) for being the commonly cited guideline, although it is further noted that the .90
threshold has no statistical basis for either the GFI or AGFI. For the RMSEA which expresses the
lack of fit due to reliability and model specification or misspecification, it has been suggested that
values <.05 constitute good fit, values in the .05 to .08 range acceptable fit, values in the .08 to .10
range marginal fit, and values > .10 poor fit (Browne and Cudeck, 1992). The SRMR is the
average of differences between the sample correlations and the estimated population correlations.
It has a range from 0 to 1 and values of .08 or less are desired (Hu and Bentier, 1999).
Where model respecification is required in the CFAs to improve data fit to the model, items for
possible elimination are identified using multiple strategies and eliminated one at a time. For pairs
of items with high con-elations greater than 1.0 in the sample covariance matrix indicating some
202

Chapter 6: Factor Analysis Results
item redundancy or multicollinearity, and /-values greater than +2.0 in the standardised residuals
covariance matrix indicating that the model is not explaining the association between these pairs of
variables, the items with the lower model weight parameter loading are removed. The significance
of parameter estimates is checked for possible removal of stixictural paths with high non-significant
weights. Modification indices are also checked for values greater than 4.0 to identify parameters to
be estimated in the revised model to significantiy reduce the chi-square and improve model fit.
The central interest to this study is whether there are cultural differences in the final measurement
models for the four cultural experience motivational process constructs (attitudes, motives, benefits
sought and benefits gained) between the Western and Asian tourist samples (Hypothesis One). A
further interest is whether there are cultural differences in the cultural experience motivational
process constructs and their measurement for each of the six cultural group subsamples within the
Western and Asian tourist samples (Hypotheses Two and Three). CFA is a highly suitable
statistical method for testing these hypotheses as CFA has been defined as, "a decision mIe to
accept or reject one or more hypotheses about a population factor sti^jcture based on sample data"
(Huriey et al., 1997). A further advantage of CFA is that it allows the invariance of measurement
models and how they compare to be tested with multiple groups (Hurley et al., 1997).
Following the development of the measurement models for each of the motivational process
constructs derived from the English-speaking Western tourist validation sample, each
measurement model is then tested for cultural difference in a series of nested models using the
multi-sample analysis feature within the SEM statistical analysis computer software program,
AMOS version 5.0. The first model tested is whether the latent factor stixicture underiying the set of
items derived from the English-speaking Western tourist validation sample is the same in the
subsamples of English-speaking Western tourists. If the latent factor structure is the same across
samples, then invariance testing of factor loadings is undertaken to test whether the samples are
calibrating the items in a similar fashion (Huriey et al., 1997). For the English-speaking Western
tourist samples, it is hypothesised that they will be using identical frames of reference and the
factorial configural structure and factor loadings will be invariant (Hypothesis 2). Because theory
supports differences between Western and Asian cultures, the measurement model derived from
the English-speaking Western tourist validation sample for each latent constmct is then cross-
validated with the Asian tourist data sample (N = 241) and it is hypothesised that factorial configural
structure will be different for the Asian and Western data samples (Hypothesis 1). The resultant
measurement model for each motivational process constmct and the Asian tourist sample is then
further tested for latent factor structure and invariance of factor loadings with the Chinese-speaking
and the Japanese-speaking subsamples where it is hypothesised that because of the language
differences, the subsamples will not be invariant (Hypothesis 3).
The sample sizes are adequate for each motivational process constmct measurement model
derived from the English-speaking Western tourist sample to be tested for Eastern culture cross-
validation with an Asian tourist data sample (N = 241) as the latter exceeds the recommended
203

Chapter 6: Factor Analysis Results
minimum threshold of 100 to 150 cases for SEM. Sample sizes are also adequate for invariance
testing of all four motivational process constmcts with the six country- or region-of-residence
subsamples, except for tiie benefits gained constmct and the two Asian subsamples. Counti7- or
region-of-residence subsamples are adequate for invariance testing of each measurement model
for the three constructs measured in the in-situ survey (attitudes, motives and benefits sought),
providing the number of variables in the final measurement models for each constmct is reduced to
25 or less as expected: English-speaking tourists from North America (N=124), New Zealand
(N=140), United Kingdom and Ireland (N=141), and domestic interstate in Australia (N=315);
Japanese international tourists (N=119); and Chinese-speaking tourists from Asia (N=122). For the
benefits gained constmct measured in the after visit sun/ey, the measurement model derived from
the English-speaking Western tourist sample is then cross-culturally validated with a combined
Asian sample of Chinese- and Japanese-speaking tourists from Asia (N=93). This sample size is
adequate for cross-cultural validation of the final measurement model for this constmct providing
the number of variables in the CFA is reduced to 19 or less as expected. Invariance testing of the
cross-cultural differences within the Asian sample for the two different cultural group subsamples
cannot be undertaken as the sample sizes of each separate subsample are significantiy below the
recommended minimum threshold of 100 to 150 cases for SEM.
An examination of 'measurement invariance' enables to determine whether the items and the
underlying constructs mean the same thing to members of different groups (Cheung and Rensvold,
2002). The central concern is whether or not components of the measurement model are invariant
(i.e., equivalent) across particular groups (Byrne, 2001). The general process of determining non-
equivalence of measurement parameters across groups is by conducting a series of increasingly
restrictive tests (Byrne, 2001). In this invariance testing, the x^ difference test(Ax^) is used as the
index of difference in fit between the baseline model and successively constrained models as
recommended by Anderson and Gerbing (1988). A nonsignificant value of x indicates failure to
reject the null hypothesis that the hypothesized covariance matrix is identical to the observed
covariance matrix, which is usually accepted as evidence of adequate fit (Cheung and Rensvold,
2002). In particular, factorial invariance of each constmct measurement model for different cultural
groups of tourists is tested at the constmct level for metric invariance of factor loadings (i.e., that all
factor loading parameters are equal across all groups). The latter indicates whether the strengths
of the relations between specific scale items and the underiying consti-ucts are invariant or differ
(Cheung and Rensvold, 2002) and are considered an important prerequisite for meaningful cross-
group comparison (Bollen, 1989).
Two separate groups of analyses are conducted within this invariance testing of each
measurement model for different cultural groups: factorial structure for configural invariance, and
metric invariance of factor loadings. Firstly, the measurement model for each cultural experience
motivational process constmct (attitudes, motives, benefits sought and gained) is tested for
configural invariance by assessing whether the simple stmcture of factor loadings is obtained for
204

Chapter 6: Factor Analysis Results
each of the cultural groups (Steenkamp and Baumgartner, 1998). For each measurement model,
the data fit is tested for each cultural group sample separately to establish stmctural similarity and
to create a baseline model where the parameter matrices of the models for each cultural group are
not constrained to be equal to each other except for the referent parameter associated with each
constmct, which is set equal to unity across groups to identify the model. Given that the j^ and its
degrees of freedom are additive, the sum of the y^ values derived from the model-fitting process for
each group separately, reflects the extent to which the underiying stmcture fits the data across
groups when no cross-group constraints are imposed (Byrne, 2001). The y^ and its associated
degrees of freedom for the baseline model should be very close to the sum of the individual models
as found in this analysis for each of the cultural experience motivational process constmcts and
each of the different cultural groups of tourists. The fit of the unconstrained baseline model with no
restrictions on model parameters is then compared with a constrained model in which all factor
loadings are constrained to be equal across groups.
If factor configural invariance is not found then evidence exists that the samples are using different
conceptual frameworks of reference when interpreting and responding to the items, and so, the
samples cannot be directly compared. At this point the less restrictive EFA procedures may be
employed to determine where the 'breakdowns' occurred, particulariy if the expectation was the
samples would interpret the items using identical frames of reference (Huriey et al., 1997). If the
factor metric invariance is not found and the model results in a dramatic loss in fit, then an
exploratory approach may be employed to uncover which item or items result in the greatest
differences (Huriey et al., 1997).
6.3 Preliminary Analysis of the Data
Prior to analysis, the calibration and validation data samples are checked for normality of data
distribution, outliers and screened for missing values. For scores that are normally distributed,
skewness and kurtosis values will equal zero, although values ranging from -1.50 to +1.50 may be
considered to approximate a normal distribution (Muthen and Kaplan, 1985 cited in Byrne and
Campbell, 1999). As previously discussed in Chapter Five, most items for each construct
approximated normality. Outiiers per item in the calibration and validation samples are checked,
but no obsen/ations are extreme on a sufficient number of variables to be considered
unrepresentative of the population.
The data is assessed for sampling adequacy using the Kaiser-Meyer-Olkin (KMO) test on the
calibration and validation samples and each of the cultural group subsamples for the four
subscales: cultural experience attitudes, motives, benefits sought and benefits gained (see Table
6.1).
As values above 0.50 indicate appropriateness of applying factor analysis with values of 0.70 or
above considered 'middling' and 0.80 or above regarded as 'meritorious' (Hair et al., 2006), in
205

Chapter 6: Factor Analysis Results
interpreting these values, all subscale data samples and subsamples are adequate for analysis.
Benefits gained constmct values are not given for the five international tourist cultural group
subsamples as the sample sizes were too small for separate analysis and so invariance testing of
this constmct used a combined English-speaking Western international tourist sample which was
tested against the domestic tourist sample in the English-speaking measurement model. For
cross-cultural validation of the benefits gained measurement model with the Asian tourist sample,
separate invariance testing between the Chinese-speaking and Japanese-speaking subsamples
cannot be undertaken due to insufficient sample size.
Table 6.1 KMO sampling adequacy results for sample suitability for factorabilty
Sample
EFA Calibration
English-speaking Western tourists in-situ survey
English-speaking Western tourists after visit survey
CFA Validation
English-speaking Westem tourists in-situ survey
English-speaking Westem tourists after visit survey
Validation of CFA Measurement Models
Asian tourists in-situ survey
Asian tourists after visit survey
Invariance Testing
English-speaking domestic Interstate tourists
in-situ survey
after visit survey
English-speaking Westem Intemational tourists
after visit sun/ey
New Zealand tourists
North American tourists
UK & Ireland tourists
Chinese-speaking tourists from Asia
Japanese-speaking tourists from Asia
N =
362
169
358
156
241
93
315
138
187
140
124
141
122
119
Attitudes
29 items
.92
.87
.89
.90
.86
.80
.79
.82
.84
Motives
31 items
.90
.88
.87
.90
.84
.79
.83
.79
.79
Benefits Sought
32 Items
.91
.89
.88
.89
.83
.83
.86
.82
.80
28 items^
.90
.88
.87
.88
.85
.83
.86
.82
.80
Benefits Gained
32 items
.82
.82
.74
.85
.82
28 items'
.85
.82
.73
.85
.84
a: without items 14,21,27 & 28 due to number of missing responses
Another method indicating the appropriateness of factor analysis is a statistically significant Bartlett
test of sphericity which indicates that the con-elation matrix has significant correlations among at
least some of the variables (Hair et al., 2006). This test is statistically significant samples and
subsamples of the four cultural experience motivational process constmcts, further indicating
appropriateness of the data sets for factor analysis.
6.3.1. Missing Values
In this factor analysis for each of the motivational process constructs, missing values are replaced a
model-based imputation method such as the expectation-maximization (EM) method
recommended by Kline (2005) because it is based on the EM algorithm which is related to the
maximum likelihood method and this is the most widely used estimation algorithm in SEM. As the
206

Chapter 6: Factor Analysis Results
dimensions found in the exploratory factor analysis (EFA) are to be used in SEM confinnatory
factor analyses (CFA), this is the preferred treatment of missing values.
This method is preferred to other commonly used methods such as substitution of means or with
tiie scale median of 3.5 that could be considered to represent neither agreement nor disagreement
with the statement or that the statement was not applicable to the respondent, both of which reduce
tiie variance of variables involved. Treating missing values as listwise deletions in SPSS was not
used because of the practical impact of this treatment of missing data that would reduce tiie sample
size available for analysis. Treating missing values as pairwise deletions in SPSS was also not
used in the EFA because of the practical impact in reducing the sample size and additionally this
treatment of missing data has major problems when used in SEM (Byrne, 2001) and is not
generally recommended for use unless the number of missing observations is small (Kline, 2005).
As the dimensions derived from the EFA are to be used in SEM CFA in the next stage of analysis,
these issues are relevant considerations to the missing data treatment in this study.
Incomplete data and the treatment of missing responses can pose problems, particulariy if the
proportion of missing responses is more than 10% (Malhotra et al., 1996). As reported in the
Chapter Five descriptive analysis section on the normality of the data for each of the motivational
process constmcts, the largest number of missing values for any individual variable within each
constmct for all respondents to the in-situ survey (N = 961) is 5.7% which is well below the 10%
problem threshold but was found for the benefits sought item 4.27: / expect facilities for children to
be provided. Three individual variables within the benefits gained constmct for all respondents to
the after visit survey (N = 418) are closer to or greater than the 10% problem threshold: 16.5% for
item 6.28 facilities for disabled visitors were provided; 15.1 % for item 6.27 facilities for children were
provided; and 8.9% for item 6.21 the activities and events were delivered at promised times. These
items are eliminated as poor variables from the scale sets prior to factor analysis as discussed in
the next section.
6.3.2 Minimum Sample Sizes and Elimination of Poor Variables
General rules regarding minimum sample sizes for particular types of data analysis need to be
considered. While it is commonly agreed that the highest cases-per-variable ratio should be
obtained to minimise the chances of "overfitting" the data by deriving factors that are sample
specific with little generalisability (Hair et al., 2006), practical data collection considerations such as
the cost of obtaining such sample sizes present limitations that make it difficult to achieve ideal
sample sizes. Preferably the sample size should be 100 or larger, and all the samples and
subsamples used in this study largely fulfil or exceed this criterion as discussed eariier in this
chapter in section 6.2 on the statistical analysis methods to be used and the associated sample
sizes. The only exception to this minimum sample size of 100 applies to the benefits gained
construct measured by the after visit survey where the Asian tourist validation sample (N = 93) is
just under this threshold. A further general rule for sample sizes and factor or multivariate analysis,
207

Chapter 6: Factor Analysis Results
relates to the ratio between the number of cases or sample elements for every variable that is to be
analysed and this was also discussed in section 6.2 of this chapter where it was noted that the
sample sizes of the calibration and validation samples for English-speaking Western tourists (to be
used in the EFA and CFA) allow the full questionnaire item sets for each consti-uct to be used with
a case per variable ratio of at least five for each variable, which fulfils or exceeds the recommended
minimum of 5 cases (Hair et al., 2006). The Asian tourist sample for the benefits gained constmct
is not a limitation here, because tiiis sample will be for used for validation of the constmct
measurement model derived from the EFA and CFA perfonned on the English-speaking Western
tourist sample, and expected to comprise considerably less items than the initial 32 item set.
Preliminary variable analysis is also recommended in Likert-type scales as used to measure each
of the motivational process constructs in this study, to identify any "poor" items that should be
eliminated. In such scales, several items may be included to fomn an index with each statement
assumed to represent an aspect of a common attitudinal domain (Zikmund, 2000). Item analysis
should be performed to ensure that final items evoke a wide response and discriminate among
those with positive and negative attitudes. Items that are poor because they lack clarity or elicit
mixed response patterns should be eliminated (Zikmund, 2000). Variable analysis was undertaken
by checking the descriptive analysis tables presented in Chapter Five (section 5.5) showing the
normality of data for each of the items representing aspects of the four constructs. Values for the
means, standard deviation, and proportion of missing values were checked to elicit item clarity and
response patterns. As Likert type scale of agreement was used, items with low mean values will
not be automatically eliminated.
For the attitude construct, none of the 29 items warrants elimination based on these statistical
measures. Two items (2.2 and 2.5) have mean values close to the scale median of 3.5, but the
standard deviation value of 1.51 for both items is towards the upper range for the attitude construct
items that is between 1.08 and 1.58. Items (2.11 and 2.13) with low standard deviation have
means well above the median for the scale. Item (2.12) has the largest number of missing
responses in this scale set (3.5%), but that is well below the previously discussed 10% threshold.
For the motive constmct, none of the 31 items warrants elimination. One item (3.30) has a mean
value close to the scale median of 3.5, but the standard deviation value of 1.54 is towards the upper
range for the motive construct items that is between .97 and 1.61. Items (3.1 and 3.7) with low
standard deviation have mean values well above the median for the scale. Item 3.14 has the
largest number of missing responses for any item in this scale set (2.3%), but this is well below the
previously discussed 10% threshold.
For the benefits sought and gained constmcts, none of the 32 items common to both constmcts
warrants elimination due to lack of variability. Two different items have a mean value close to the
scale median of 3.5 in the benefits sought scale (4.11) and in the benefits gained scale (.01), but
the standard deviation values (1.41 and 1.34 respectively), are towards the upper range for both
208

Chapter 6: Factor Analysis Results
benefit constmcts which is .89 to 1.58 for benefits sought, and .80 to 1.42 for benefits gained. The
items in each scale with low standard deviation (item 4.31 and 4.32, respectively), have mean
values well above Uie median for the scale. Four items wan-ant elimination based on the number of
missing responses that is closer to or greater than the 10% problem threshold. Three of these
were previously identified in section 6.3.1 because of their large number of missing responses
within the benefits gained construct for all respondents to the after visit survey (N = 418): 16.5% for
Item 6.28 facilities for disabled visitors were provided; 15.1 % for item 6.27 facilities for children were
provided; and 8.9% for item 6.21 the activities and events were delivered at promised times.
Further justification for the elimination of these items was the even larger proportions of missing
responses found in the English-speaking Western tourist calibration (N = 169) and validation (N =
156) samples: item 28 (23.1% cf 17.3%), item 27 (21.3% cf 16%) and item 21 (13.6% cf 9%). Item
14 gained the respect of others, also wan-ants elimination as it has the next highest proportion of
missing responses in the calibration sample (6.5%) and a very high proportion for the North
American subsample (13.2%). The low ranking of these items by mean value also supports their
elimination: item 27 ranks 10th for benefits sought and-20** for benefits gained; item 28 ranks 15*
for benefits sought and 21^ for benefits gained; item 21 ranks 31^ for benefits sought and 21^ for
benefits gained; and item 14 ranks 31^ for benefits sought and 21^ for benefits gained; and item 14
ranks lO^or benefits sought and 19** for benefits gained. Items eliminated from the benefits gained
scale are also eliminated from the benefits sought scale as these scales have items in common
with only minor wording changes.
6.4 Dimensionality of Cultural Experience Attitudes
6A1 Exploratory Factor Analysis of Attitude Dimensionality on the Calibration Sample
The EFA is conducted on the 29 items of the cultural experience attitude scale using the calibration
sample (N = 362) and undertaken in SPSS version 12.0 with the maximum likelihood extraction
method and an oblique rotation method (OBLIMIN). Initially seven factors are exti-acted for cultural
experience attitudes based on eigenvalues greater than 1.0, but four factors are specified based on
the scree plot (see Figure 6.1a) and are retained in the final model with satisfactory factorial
stmcture based on both eigenvalues greater than 1.0 and the scree plot (see Figure-6.1 b).
209

Chapter 6: Factor Analysis Results
Figure 6.1 Scree plots of EFA attitudes construct for English-speaking tourist calibration sample
6.1a 6.1b
Scree Plot Scree Plot
I I I 1,1111^1,1,^1 1,1,1 I
Factor Number
I I I I I I I I I I I I I I I I I I I I I 1 2 3 4 5 6 7 6 9 10 11 12 13 14 IS 16 17 18 19 20 21 22
Factor Number
Table 6.2 displays the pattern coefficients and the factor intercorrelations for the final solution based
on 23 items. Satisfactory factorial structure is achieved by removing seven items to respecify the
factor model and a new factor solution is derived after the removal of each item because maximum
likelihood extraction is based on shared variance. Various criteria for identifying and evaluating
variables for possible deletion are used as previously discussed in section 6.2 outiining the EFA
statistical analysis methods used in this study. Two items (2.13 and 2.29) are removed for
communality values below the 0.2 threshold indicating that the variable shares a low amount of
variance with all the other variables. Four further items (2.1, 2.3, 2.17, and 2.27) are removed to
improve discriminant validity of the factorial stmcture based on inspection of the pattern and
structure matrices. The internal reliability of each dimension is then calculated using Cronbach
alpha coefficients and while the coefficients for all of four factors are .81 or above which is above
the commonly used threshold value of .70 for acceptable reliability (Hair et al., 2006), one further
item (2.8) is eliminated so that all items retained have corrected item-to-total correlations greater
than 0.5 as generally recommended (Hair et al., 2006). Because the factors are con-elated, the
sums of squared loadings cannot be added to obtain a total variance, but the four-factor solution
accounted for 55 percent of the total variance allowing for the extraction sums of squared loadings.
Several of the factor intercorrelations are .30 or greater, which justifies using the maximum
likelihood extraction method with an oblique rotation.
210

Chapter 6: Factor Analysis Results
Table 6.2 EFA on calibration sample: Factor pattern coefficients for the four factors of cultural experience attitudes derived from oblique rotation
Questionnaire item
Hike going...
2.15
2.14
2.16
2.12
2.11
2.26
2.9
2.10
2.23
2.18
2.25
2.24
2.4
2.5
2.6
2.2
2.7
2.21
2.20
2.19
2.22
2.28
Factors
1
.78
.74
.71
.69
.68
.66
.64
.57
.55
.44
.02
.01
-.05
.07
.04
.21
.06
-.00
-.02
-.04
.29
.33
II
-.02
-.09
-.01
.20
-.08
-.08
.03
.01
-.28
-.06
-.97
-.71
.02
-.04
.03
.06
-.20
.07
-.04
-.03
-.13
-.04
III
.04
.02
.11
.02
-.07
.03
.00
.18
-.04
.04
.02
.08
.84
.71
.68
.56
.48
.12
-.00
-.01
-.02
-.00
IV
-.05
-.08
-.01
.04
.00
.12
.07
-.02
.18
.32
-.03
.10
.01
.07
-.02
-.00
-.01
.82
.81
.65
.51
.41
to cultural experiences Involving Australian history
to cultural performances held in historical settings
to see Australian art
to Australian atx)riginal cultural perfomnances and exhibitions
to historic buildings, sites and monuments
to cultural experiences to leam
to museums
to arts and cultural festivals
to famous cultural places
to cultural experiences to have fun
to see famous shows perfonned
to see famous perfonners/entertainers
to the ballet
to dance perfomfiances
to the opera
to classical music perfomnances
to theatrical perfomnances of written stories
to cultural experiences because local people attend
to cultural experiences that my friends and family have done
to cultural experiences to make others happy
to cultural experiences that have been recommended by others
to cultural experiences for the chance to Interact with others
Reliability Alpha .91 .85 .81 .84
Factor intercon^elations
Factor I: Art, history and culture Interaction
Factor II: Famous culture
Factor III: Traditional performing arts
Factor IV: Positive word-of-mouth cultural experiences
-.30
.50
.55
30.57
7.13
-.24
-.40
12.82
3.11
.30
6.88
4.38
4.71
5.21
Percentage of explained variance
Eigenvalue after rotation
Note: Coefficients exceeding an arbitiaiy cut-off loading of .40 are shown in bold type. N = 362
Extraction Method: Maximum Likelihood; Rotation Metinod: Oblimin with Kaiser Nomnalization; Rotation converged in 7 Iterations
Inspection of the pattern coefficients and factor intercorrelations for the final solution displayed in
Table 6.2, shows four interpretable cultural experience attitude factors that are consistent with
some theoretical formulations. Factors two and three are based entirely of items consisting of
different types of cultural experiences that were developed by expanding and adapting the arts
enthusiast scale: factor two comprises two items consistent with liking famous cultural experiences
and factor three comprises five items consistent with liking traditional perfonning arts. The first
factor comprises 10 items consistent with liking art, culture and history interaction: eight concern a
liking for different types of cultural experiences, including those involving Australian art, history and
culture; and two concern a liking for attending these types of cultural experiences to learn and have
fun. The fourth factor comprises five items consistent with liking cultural experiences that have
positive word-of-mouth either as recommended cultural experiences, ones that friends and family
have done or because local people attend. Of the eight commonly sought psychological motive or
211

Chapter 6: Factor Analysis Results
benefit items, respondents did not express an association for one item: a liking for going to cultural
experiences for a sense of escaping into another world and getting away from it all.
6AJ2 Confirmatoiy Factor Analysis of Attitude Dimensionality on the Validation Sample
One-factor congeneric models using maximum likelihood CFAs are initially evaluated for the four
hypothesised cultural experience attitude latent constmcts of liking art, cultijre and history
interaction; famous culture, traditional performing arts, and positive word-of-mouth cultural
experiences derived from the EFA. Multiple criteria for assessing goodness-of-fit of the models are
applied and multiple strategies for identifying possible model respecification are used to improve
the model fit if required, as previously discussed in section 6.2 outiining the CFA statistical analysis
methods used in this study.
The one-factor model for the constmct of liking art, history and culture interaction, initially reveals
poor fit of the data to the model statistically, x (35, N= 358) = 260.49, p = .000, and practically with
RMSEA = .13 (.12; .15), TLI = .79, CFI = .84, GFI = .87, AGFI = .80 and SRMR = .07. Good fit of
the data for the construct is achieved after removing four items relating to different types of cultural
experiences: item 2.15 to cultural experiences involving Australian history because it is highly
correlated with two other items indicating considerable overlap in measurement between these
items; item 2.9 to museums as the item with the lower model weight loading within a pair of
variables with f-value greater than +2.0 in the standardised residuals covariance matrix indicating
the model was not explaining the association between these variables; and items 2.23 to famous
cultural places and 2.12 to Australian Aboriginal cultural performances and exhibitions based on
modification indices error term correlation recommendations. The resultant fit of the English-
speaking tourist data to the model is excellent statistically,x^ (9, N= 358) = 16.10, p = .065, and
practically with RMSEA = .05 (.00; .08), TLI = .98, CFI = .99, GFI = .99, AGFI = .97 and SRMR =
.03.
The two-item liking famous culture construct is evaluated as a two-factor model with the liking art
and history interaction latent construct. Although the two-factor model is statistically significant, x
(19, N= 358) = 32.36, p= .028, this data is an excellent fit to the model for the other fit indices,
RMSEA = .04 (.01; .07), TLI = .98, CFI = .98, GFI = .98, AGFI = .96, and SRMR = .03. The liking
for traditional perfomning arts construct is also evaluated as a two-factor model with the liking art
and history interaction latent constmct after the initial five-item constmct is reduced to a three-item
construct following the removal of item 2.5 to dance performances based on high correlations witii
other traditional performing arts items and a f-value greater than +2.0 in the standardised residuals
covariance matrix indicating the model was not explaining the association between these variables;
and the removal of item 2.6 to the opera based on modification indices error tenri correlation
recommendations. Although the two-factor model is statistically significant, x (26, N= 358) = 52.80,
212

Chapter 6: Factor Analysis Results
p = .001, this data is an excellent fit to the model for the other fit indices, RMSEA = .05 (.03; .08),
TLI = .95, CFI = .97, GFI = .97, AGFI = .95, and SRMR = .04.
Acceptable fit of the data for the constmct of liking positive word-of-mouth cultural experiences is
achieved after removing the item 2.19 to cultural experiences to make others happy based on
modification indices error tenn correlation recommendations and this item having the lowest
standardised estimate model weight loading. The resultant fit is acceptable both statistically x^ (2,
N= 358) = .363, p = .834, and practically with RMSEA = .00 (.00; .06), TLI = 1.01, CFI = 1.00, GFI =
.99, AGFI = .99 and SRMR = .006.
Scree plots for all four constructs demonsti-ate that they are unidimensional and the resultant
Cronbach alpha internal consistency reliabilities for the factors comprising six-, two-, three-, and
four-items respectively are .79, .84, .69, and .79, all of which are above the commonly used
threshold value of .70 for acceptable reliability (Hair et al., 2006).
A four-factor independent cluster measurement model comprising latent variables for liking art and
history interaction; famous culture, traditional perfonning arts, positive word-of-mouth, is specified
so that items load uniquely on their respective latent constmcts as hypothesized from the CFAs.
The correlations between the four constructs in the full measurement model are freely estimated
except for the referent parameter loading weight associated with each constmct that is set to unity
to identify the model.
The initial data fit to the model is not acceptable as the model is statistically significant: x (84, N=
358) = 258.78, p= .000, and practically, several of the fit indices are less than the recommended .90
threshold measure, GFI = .92, AGFI = .88, TLI = .88, CFI = .90, although the RMSEA = .08 (.07;
.09), and the SRMR = .06 are acceptable. The model is respecified with two items (2.18 and 2.26)
eliminated one at a time from the art and history construct based on f-values greater than +2.0 in
the standardised residuals covariance matrix. The resultant data fit to the model is still statistically
significant, x (59, N= 358) = 142.09, p = .000, but the fit is excellent for the other fit indices, GFI =
.94, AGFI = .91, TLI = .92, CFI = .94, RMSEA = .06 (.05; .08), and the SRMR = .05. The model is
also more parsimonious with a normed chi-square ratio of 2.4.
The factor patterns and stmcture coefficients for the estimated parameters are presented in Table
6.3. All factor pattern coefficients on the respective four factors are statistically significant and
range from a low of .56 to a high of .94. Inspection of the structure coefficients shows discriminant
validity with a clear distinction between the items comprising the four cultural experience attitude
factors. Intercon-elations between the latent variables are positive and significant (see Figure 6.2).
The factor, liking art and history, has correlation of .59, .69 and .35 respectively with the factors,
liking positive word-of-mouth cultural experiences, traditional performing arts and famous culture.
The liking positive word-of-mouth cultural experiences factor has correlation of .48 and .36
213

Chapter 6: Factor Analysis Results
respectively with the factors, liking traditional perfonning arts and famous culture. The correlation
between these latter two factors is .33.
Table 6.3 CFA on validation sample: Factor pattern and structure coefficients for the four factors of cultural experience attitudes
Questionnaire Item
1 like going...
2.14 to cultural perfomnances held in historical settings
2.16 to see Australian art
2.11 to historic buildings, sites and monuments
2.10 to arts and cultural festivals
2.21 to cultural experiences because local people
Factors
Art history
P
.72
.66
.57
.70 0
and
S
.72
.66
.57
.70
.43
Positive word-of-mouth
P S
0
0=
0
0
.72
.43
.39
.34
.41
.72
Traditional performing arts
P
0"
0
0
0"
0"
s .50
.46
.39
.48
.34
Famous culture
P S
0=
0=
0=
0'
0=
.26
.24
.20
.25
.26
0"
0
0'
0"
0=
.46
.44
.46
.27
.34
0=
0
0
0
0
.32
.30
.32
.28
.34
.66
.63
.67
0^
0
.66
.63
.67
.25
.31
0" 0=
0
.77
.94
.22
.21
.22
.77
.94
attend 2.20 to cultural experiences that my friends and 0° .42 .70 .70 0" .34 0 .25
family have done
2.22 to cultural experiences that have been 0 .42 .71 .71 0^ .34 0 .26 recommended by others
2.28 to cultural experiences for the chance to 0^ .33 .56 .56 0" .27 0^ .20 interact with others
2.4 To the ballet
2.2 to classical music performances
2.7 to ttieatiical performances of written stories
2.25 to see famous shows performed
2.24 to see famous performers/entertainers Note: P = pattem coefficient; S = stiucture coefficient; N = 358. Factor con-elations were free to be estimated. All pattem coefficients are statistically different from zero.
a. Parameters fixed at reported levels to identify the model
Four dimensions for cultural experience attitudes were derived from the EFA (i.e., liking art, culture
and history interaction; famous culture; traditional performing arts; and positive word-of-mouth
cultural experiences). Results of the CFAs validate a similar structure of four dimensions for the
final hypothesized measurement model for cultural experience attitudes except for the liking art,
culture and history interaction latent constmct that required model respecification involving the
removal of the interaction related items of to learn and to have fun and therefore an associated
name change to liking art and history.
The resultant four dimensions in the full measurement model are also consistent with some
theoretical formulations. Three dimensions are consistent with liking for different types of cultural
experiences (art and history; traditional performing arts; and famous culture) and the other
dimension comprises several commonly found socio-psychologically-based items consistent with a
liking for positive word-of-mouth cultural experiences.
214

Chapter 6: Factor Analysis Results
Figure 6.2 Hypothesised model of cultural experience attitudes for CFA validation sample of English-speaking tourists
.52
in historical settings
.44
Australian art
.32
ustoric sites & monuments
.48
arts and cultural festivals
because local people attend
friends and family have done
recommended by others
to interact with others
.43
ballet
:3a classical music
T45
theatre
.59
famous shows -Kgg) .89
famous artists K<S3)
Theoretical formulations for the importance of word-of-mouth communications and referrals for
marketing purposes, especially for intangible service experiences such as tourism and cultural
experiences, are widely found in the marketing literature (e.g., Kotier, 1997), the services marketing
215

Chapters: Factor Analysis Results
literature (e.g., Haywood, 1989), the tourism marketing literature (e.g., Kotier et al., 2006) and the
arts marketing literature (e.g., Kotier and Scheff, 1997). Recent focus group research of
convenience sampled visitors to art museums in the United States (Geissler et al., 2006) further
highlights the importance of word-of-mouth communications in the initial decision to visit a particular
art museum with many people relying on friends and family members to provide information and
opinions about these types of cultural experiences.
All four cultural experience attitude dimensions have implications for market segmentation and
mari eting strategies as demonsti-ated by the liking for going to positive word-of-mouth cultural
experiences. The other three attitude dimensions highlight particular types of cultural experiences
liked by tourists that should be featured in marketing campaigns. The liking for famous culture
dimension has an additional marketing implication as it emphasizes tiie importance of branding via
brand names, brand image and unique featijres. This was also highlighted in the recent focus
group research of convenience sampled visitors to art museums in the United States (Geissler et
al., 2006) that found an art museum's name and image were very important considerations when
deciding whether to visit. Participants also felt that it was appropriate to "market" an art museum as
a brand in order to distinguish one art museum from another, to establish a brand name and to tell
people what you offer and how it is unique (Geissler et al., 2006).
6A3 Invariance Testing of the Hypothesised CuKural Experience Attitudes Model for English-speaking tourists
To test hypothesis two that there is not a significant difference between different cultural groups of
English-speaking tourists for the cultural experience attitude construct, invariance testing of the
cultural experience attitudes model derived from the English-speaking tourist validation sample is
undertaken. Results of the four-factor measurement model for cultural experience attitudes (Figure
6.2) assessed separately for each group of English-speaking tourists, establish stmctural similarity
and excellent fit of the data to the model on most fit indices for each group (see lines 1 to 4, Table
6.4).
Table 6.4 Invariance testing on validation sample: Model fit for multi-group model of cultural experience attitudes for four English-speaking tourist groups
Model X df p-value GFI AGFI TLI CFI RMSEA 90% SRMR confidence interval of RMSEA
Domestic (Austialia)
New Zealand
North America
UK and Ireland
Baseline
Metiic Invariance:
equal factor loadings
139.57
79.08
94.40
84.67
397.88
419.97
59
59
59
59
236
263
.000
.042
.002
.016
.000
.000
.94
.92
.90
.91
.92
.92
.91
.88
.85
.87
.88
.89
.93
.96
.91
.93
.93
.94
.95
.97
.93
.95
.95
.95
.07
.05
.07
.06
.03
.03
.05, .08
.01,.08
.04 .10
.03, .08
.03, .04
.02. .03
.05
.06
.06
.07
.07
.07
Note: Domestic (Aush^lia) (N= 315); New Zealanders (N = 140); North Americans (N = 124); tourists from UK and Ireland {N = 141)
216

Chapter 6: Factor Analysis Results
Altiiough the hypothesised model is statistically significant for all groups, all other indices show
practical fit is excellent except for the AGFI that is below the .90 tiireshold for all groups. For the
multi-group baseline model, the key indexes are the x statistic, and the CFI and RMSEA values
(Byme, 2001). As seen in Table 6.4 (line 5), the x^ value of 397.88, with 236 degrees of freedom,
provides the baseline value against which all subsequent tests for invariance are compared. The
CFI and RMSEA values of .95 and .03 respectively, indicate that the hypothesised measurement
model of cultural experience attitudes has excellent fit for the baseline model.
Having established excellent fit of the baseline model, testing for invariance of factorial metric
measurement across the four groups is undertaken on the consti ained model. Chi-square
difference test are used to establish the difference in fit between the baseline model and the
consti-ained model. As seen in Table 6.4 (lines 5 and 6), comparison of the y^ difference between
these two models and their associated degrees of freedom yields a x difference value of 22.09
with 27 degrees of freedom, which is not statistically significant at the .05 probability level. This
indicates that the equality constraints hold across the four groups for factor loadings and no further
tests of factor loadings are needed to pinpoint the location of any non-invariance. In other words,
the parameter loadings are equivalent (invariant) across the four English-speaking tourist groups.
6A4 Validation and Invariance Testing of the Hypothesised Cultural Experience Attitudes Measurement Model for the Asian Tourist Sample
To test hypothesis one that there is significant difference between Western and Asian tourists for
the cultural experience attitude construct, the hypothesised four-factor independent cluster
measurement model for cultural experience attitudes derived from the English-speaking tourist
validation sample is tested for the Asian tourist sample (N = 241). The model is specified so that
items load uniquely on their respective latent constmcts of liking art and history; famous culture,
ti-aditional perfonning arts, and positive word-of-mouth cultural experiences. The correlations
between the four constructs in the model are freely estimated except for the referent parameter
loading weight associated with each construct that is set to unity to identify the model.
Although significant difference between Western and Asian tourists is hypothesised, the initial data
fit to the model is acceptable. The model is statistically significant: x (59, A/= 241) = 123.37, p=
.000, but the data is an acceptable fit to the model for the other fit indices, GFI = .93, AGFI = .89,
TLI = .92, CFI = .94, RMSEA = .07 (.05; .08), and the SRMR = .05.
The factor patterns and structure coefficients for the estimated parameters are presented in Table
6.5. All factor pattern coefficients on the respective four factors are statistically significant and
range from a low of .56 to a high of .90. Inspection of the structure coefficients shows discriminant
validity with a clear distinction between the items comprising the four cultural experience attitude
factors. Intercon-elations between the latent variables are positive and significant (see Figure 6.3 at
end of chapter). The factor, liking art and history, has correlation of .50, .64 and .40 respectively
with the factors, liking positive word-of-mouth cultural experiences, traditional performing arts and
217

Chapter 6: Factor Analysis Results
famous culture. The liking positive word-of-mouth cultijral experiences factor has correlation of .47
and .62 respectively with the factors, liking traditional perfonning arts and famous culhjre. The
correlation between these latter two factors is .35.
Table 6.5 Validation of CFA cultural experience attitudes model with Asian tourist sample: Factor pattern and structure coefficients for the four factors
Questionnaire Item
I like going...
Factors
Art and Positive history word-of-
mouth
Traditional perfonning arts
Famous culture
2.14 to culhjral perfomnances held in historical settings
2.16 to see Australian art
2.11 to historic buildings, sites and monuments
2.10 to arts and cultural festivals
2.21 to cultural experiences because local people attend
2.20 to cultural experiences tiiat my friends and family have done
2.22 to cultural experiences tinat have been recommended by others
2.28 to cultural experiences for the chance to Interact with others
2.4 To the ballet
2.2 to classical music perfomnances
2.7 to ttieabical perfomnances of written stories
2.25 to see famous shows perfonned
2.24 to see famous performers/entertainers
.75 .75 .38 .48 0" .30
.71
.56
.73
0=
0
0"
0=
0=
0
0
0'
0
.71
.56
.73
.35
.35
.34
.30
.43
.47
.45
.36
.32
0
0
0"
.70
.69
.68
.61
0"
0
0"
0=
0"
.36
.28
.37
.70
.69
.68
.61
.32
.35
.33
.56
.50
0
0
0"
0
0
0
0
.67
.73
.70
0=
0"
.46
.36
.47
.33
.33
.32
.29
.67
.73
.70
.31
.28
0
0"
0"
0"
0"
0'
0''
0
0=
0'
.90
.81
.29
.22
.29
.43
.43
.42
.38
.23
.26
.24
.90
.81
Note: P = pattem coefficient; S = sbxicture coefficient; N = 358. Factor correlations were free to be estimated. All pattem coefficients are statistically different firom zero.
a. Parameters fixed at reported levels to identify tine model
Scree plots for each of the four constructs demonstrate that they are unidimensional and the
resultant Cronbach alpha internal consistency reliabilities for the four-item factors of liking art and
history, and positive word-of-mouth cultural experiences, the three-item traditional performing arts
factor, and the two-item famous culture factor are respectively .79, .86, .74, and 84, all of which are
above the .70 threshold.
218

Chapter 6: Factor Analysis Results
Figure 6.3 Hypothesised model of cultural experience attitudes from CFA validation sample of English-speaking tourists for international Asian tourists
.56
in historical settings
.51 Australian art
.31 ilstoric sites & monuments
.54
arts and cultural festivals r^-
.48
because local people attend
.48
friends and family have done
.47
recommended by others
.37
to interact vifith others
.45
ballet -:S4
classical music 74&
^
< - ^
theatre - • ^ @ )
.80
famous shows •-<©) .65
famous artists k<S3)
To test hypothesis three that there is significant difference between Chinese-speaking and
Japanese-speaking Asian tourists for the cultural experience attitude construct, invariance testing of
the cultural experience attitudes model for Asian tourists is undertaken. Results of the four-factor
219

Chapter 6: Factor Analysis Results
measurement model for cultural experience attitudes (Figure 6.3) assessed separately for each
group of Asian tourists, establish stmctijral similarity and an acceptable fit of the data to tiie model
on most fit indices for each group (see lines 1 and 2, Table 6.6). Although the hypothesised model
is statistically significant for both groups, other indices show practical fit is acceptable. For the
multi-group baseline model, the key indexes are the x^ statistic, and the CFI and RMSEA values
(Byrne, 2001). As seen in Table 6.6 (line 3), the y^ value of 195.90, with 118 degrees of freedom,
provides the baseline value against which all subsequent tests for invariance are compared. The
CFI and RMSEA values of .93 and .05 respectively, indicate that the hypothesised measurement
model of cultural experience attitudes has acceptable fit for the baseline model.
Table 6.6 Invariance testing on Asian international tourist sample: Model fit for multi-group model of cultural experience attitudes for two Asian tourist groups
Model
Chinese-speaking
Japanese-speaking
Baseline
Metric invariance:
equal factor loadings
X"
85.85
110.04
195.90
203.85
df
59
59
118
127
p-value
.013
.000
.000
.000
GFI
.90
.88
.89
.89
AGFI
.85
.82
.83
.84
TLI
.92
.90
.91
.92
CFI
.94
.92
.93
.93
RMSEA
.06
.09
.05
.05
90% confidence interval of RMSEA
.03, .09
.06, .11
.04, .07
.04, .06
SRMR
.06
.07
.07
.07
Note: Chinese-speaking Asian intemational tourists (N= 122); Japanese-speaking Asian intemational tourists (N= 119)
Having established excellent fit of the baseline model, testing for invariance of factorial metric
measurement across the two groups is undertaken on the constrained model. Chi-square
difference test are used to establish the difference in fit between the baseline model and the
constrained model. As seen in Table 6.6 (lines 3 and 4), comparison of the y^ difference between
these two models and their associated degrees of freedom yields a x difference value of 7.95 with
9 degrees of freedom, which is not statistically significant at the .05 probability level. This indicates
tiiat the equality constraints hold across the two groups for factor loadings and no further tests of
factor loadings are needed to pinpoint the location of any noninvariance. In other words, the
parameter loadings are equivalent (invariant) across the two Asian tourist groups.
6 A 5 Dimensionality of Cultural Experience Attitudes Summary Discussion
It was hypothesised that there are significant differences between Western and Asian tourists for
the dimensionality of the cultural experience attitudes construct. It was further hypothesised that
the dimensionality would not be significantiy different for different cultural groups of English-
speaking tourists, but would be significantiy different for different language cultural groups of Asian
tourists. There was no evidence to support the significant differences between Westem and Asian
tourists for cultural experience attitudes dimensionality. The Asian sample validated the four-factor
measurement model derived from the Western tourist sample.
The resultant four dimensions in the cultural experience attitudes model are liking art and history,
positive word-of-mouth cultural experiences, traditional performing arts and famous culture. These
220
Chapters: Factor Analysis Results
dimensions are consistent witii some theoretical fonnulations as discussed in section 6.4.2 where
their marketing implications are also raised. A summation of the four attitude dimensions found in
this study is that three are consistent with a liking of different types of cultural experiences (art and
history; traditional performing arts; and famous culture) and the other dimension comprises several
commonly found socio-psychologically-based items consistent with a liking for positive word-of-
mouth cultural experiences.
Evidence from the invariance testing of different cultural groups within the-Western tourists and the
Asian tourists, supports equivalence of the factor configural structure and metric invariance of the
factor loadings indicating that the cultural groups are calibrating the items in a similar fashion, for
different cultural groups of both Western and Asian tourists. This was hypothesised for the English-
speaking Western tourists but does not confirm the hypothesised finding for the Asian tourists that
there are significant differences between dimensionality of the cultural experience attitude construct
for Chinese-speaking and Japanese-speaking Asian tourists.,
6.5 Dimensionality of Cultural Experience Motives
6.5.1 Exploratory Factor Analysis of Motive Dimensionality on tiie Calibration Sample
The EFA is conducted on the 31 items of the cultural experience motive scale using the calibration
sample (N = 362) and undertaken in SPSS version 12.0 with the maximum likelihood extraction
method and an oblique rotation method (OBLIMIN). Initially six factors are extracted for cultural
experience motives based on eigenvalues greater than 1.0, but five factors are specified based on
the scree plot (see Figure 6.4a) that are further reduced to a final model of four factors based on
both eigenvalues greater than 1.0 and the scree plot (see Figure 6.4b) with satisfactory factorial
stmcture.
221

Chapters: Factor Analysis Results
Figure 6.4 Scree plots of EFA motives construct for English-speaking tourist calibration sample
6.4a 6.4b
Scree Plot Scree Plot
I I I I I I I I I I I I I I . . I O C . ) A - U I ( 3 > . . J 0 0 < O - . ~ . - . - . - . - . ^ - .
I I I I I I I I L I I I
s s B a K » s « s a s 2 Factor Number
T — I — I — I — I — I — I — 1 — I — I — I — 1 — I — I — I — I — I — r 1 2 3 4 5 6 7 8 9 10 11 12 13 14 15 16 17 18 19 20 21 22 23
Factor Number
Table 6.7 displays the pattern coefficients and the factor intercon-elations for the final solution based
on 19 items. Satisfactory factorial structure is achieved by removing 12 items to respecify the factor
model and a new factor solution is derived after the removal of each item because maximum
likelihood extraction is based on shared variance. Various criteria for identifying and evaluating
variables for possible deletion are used as previously discussed in section 6.2 outiining the EFA
statistical analysis methods used in this study. One item (3.14) is removed for communality values
below the 0.2 threshold indicating that the variable shares a low amount of variance with all the
other variables. Four items (3.6, 3.9, 3.8, and 3.10) are removed to improve discriminant validity of
the factorial structure based on inspection of the pattern and structure matrices. Two factors are
specified based on the scree plot and the internal reliability of each dimension is then calculated
using Cronbach alpha coefficients. While the coefficients for all two factors are above the
commonly used threshold value of .70 for acceptable reliability (Hair et al., 2006), one further item
(3.24) is eliminated so that all items retained have corrected item-to-total correlations greater than
0.5 as generally recommended (Hair et al., 2006). One item (3.23) is then removed for low
communality value below 0.2 and a further five items (3.25, 3.18, 3.5, 3.22, and 3.1) are removed to
improve discriminant validity of the factorial structure based on inspection of the pattern and
stmcture matrices. Three factors are specified based on the scree plot after the removal of items
3.24, 3.23, and 3.25 and then four factors are specified (see Figure 6.4) after the removal of items
3.5, 3.22 and 3.1. The internal reliability of each dimension is then calculated using Cronbach
alpha coefficients and the coefficients for all four factors are .83 or above which is above the
commonly used threshold value of .70 for acceptable reliability (Hair et al., 2006). Because the
factors are correlated, the sums of squared loadings cannot be added to obtain a total variance, but
the four-factor solution accounts for 57% of the total variance allowing for the extraction sums of
squared loadings. Several of the factor intercorrelations are .30 or greater, which justifies using the
maximum likelihood extraction method with an oblique rotation.
222

Chapter 6: Factor Analysis Results
Table 6.7 EFA on calibration sample: Factor pattern coefficients for the four factors of cultural experience motives derived from oblique rotation
Questionnaire Item
1 go to cultural attractions and events while travelling ...
3.16
3.17
3.19
37
3.29
3.3
3.4
3.2
3.26
3.27
3.30
3.28
3.31
3.21
3.20
3.11
3.12
3.13
3.15
to have a change fl-om my daily routine
to forget about demands of dally life
to satisfy my curiosity
to do something 1 want to do
to have a high quality experience
to relax physically
to relax mentally
to be entertained by others
to demonsti-ate my ability to ti-avel
to go somewhere safe
to buy goods and souvenirs
to get value for money
to buy food and drinks to consume at the culhjral experience
to enhance my social position
to tell my friends and relatives about it
to leam about local cultijre
to leam about local history.
to leam about local perfonning arts
to enjoy sometiiing unique to the destination
Reliability Alpha
Factor intercorrelations
Factor 1: Novelty
Factor II: Relaxation
Factor 111: Safe consumption
Factor IV: Leam local culture
Percentage of explained variance
Eigenvalue after rotation
Factors
1
.70
.59
.47
.46
.42
-.08
.05
.15
-.04
.23
-.04
.35
.03
-.18
.11
.04
.05
-.05
.41
.85
.43
.32
-.41
35.63
4.27
II
.07
.18
.09
.31
.19
.94
.88
.50
-.12
.08
.08
-.05
.01
.19
.02
-.03
-.02
.09
.09
.83
.40
-.39
8.02
4.37
III
.05
.19
.12
-.08
.18
.01
.00
.03
.75
.69
.62
.60
.53
.51
.45
.03
.03
.11
-.13
.83
-.28
8.15
4.19
IV
-.14
.07
-.27
-.23
-.17
.00
.03
-.05
-.12
.13
.06
.12
-.13
-.06
-.22
-.91
-.88
-.69
-.43
.87
4.82
4.36
Note: Coeffidents exceeding an arbifrary cut-off loading of .42 are shown in bold type. N = 362
Exti-action Method: Maximum Likelihood; Rotation Method: Oblimin witti Kaiser Normalization; Rotation converged In 20 iterations
Inspection of the pattern coefficients and factor intercon-elations for the final solution displayed in
Table 6.7, shows four interpretable cultural experience motive factors that are consistent with some
theoretical formulations. Three of the factors are based on 12 of the 29 socio-physio-
psychologically-related items that were identified from the literature as commonly found motives for
attending cultural-related attractions and events. Two factors comprise largely psychologically-
based items for going to cultural experiences while travelling: factor one comprises five items
consistent with novelty-related motives, and factor four comprises four items consistent with
learning-related motives. Another factor comprises three items consistent with psycho-socio-
physiologically-based, relaxation-related motives. The other factor in the solution comprises seven
items consistent with safe consumption: two atti-ibute-related and five socio-physio-psychologically-
related items. This factor solution of largely psychologically- or experiential-related dimensions
reflects the trend in the literature emphasising a conceptual shift away from activities and amenities
and toward experiential and psychological outcome (Tian et al., 1996), although the inclusion of two
attribute-based motives in one factor within the EFA solution is noted.
223

Chapter 6: Factor Analysis Results
6.5.2 Confimfiatory Factor Analysis of Motives Dimensionality on the Validation Sample
One-factor congeneric models using maximum likelihood CFAs are initially evaluated for the four
hypothesised cultural experience motive latent constmcts of novelty, relaxation, safe consumption,
and learn local culture derived from the EFA. Multiple criteria for assessing goodness-of-fit of the
models are applied and multiple strategies for identifying possible model respecification are used to
improve the model fit if required, as previously discussed in section 6.2 outlining the CFA statistical
analysis methods used in this study.
The one-factor model for the construct of novelty initially reveals acceptable fit of the data to the
model except statistically it is significant, -^ (5, N= 358) = 19.78, p = .001, and practically, other than
a poor RMSEA = .09 (.05; .14), all of the fit indices are above the .90 threshold with TLI = .93, CFI =
.97, GFI = .98, AGFI = .93 and SRMR = .04. Excellent fit of the data for the construct is achieved
after removing item 3.29 to have a high quality experience as one of a pair of variables with a t-
value greater than +2.0 in the standardised residuals covariance matrix indicating the model was
not explaining the association between these variables and modification indices indicated
correlating this items error term with three other items in the model. The resultant fit of the English-
speaking tourist data to the model is excellent statistically,x^ (2, N= 358) = 3.37, p = .185, and
practically with RMSEA = .04 (.00; .12), TLI = .99, CFI = .99, GFI = .99, AGFI = .98 and SRMR =
.02. The three-item relaxation construct is evaluated as a two-factor model with the novelty latent
construct. Although the two-factor model is statistically significant, x^(13, N= 358) = 47.40, p= .000,
this data is an acceptable fit to the model for the other fit indices, TLI = .94, CFI = .96, GFI = .96,
AGFI = .92, RMSEA = .09 (.06; .011), and SRMR = .06.
Excellent fit of the data for the construct of safe consumption is achieved after removing two items:
3.28 to get value for money as one of several pairs of variables with a f-value greater than +2.0 in
the standardised residuals covariance matrix; and item 3.26 to demonstrate my ability to travel as
one of several pairs of items with high con-elations greater than 1.0 in the sample covariance matrix
indicating some item redundancy or multicollinearity. The resultant fit is excellent both statistically
x'(5, N= 358) = 8.702, p = .122, and practically with TLI = .98, CFI = .99, GFI = .99, AGFI = .97,
RMSEA = .05 (.00; .10), and SRMR = .02.
The four-item leam local culture constaict is evaluated as a one-factor model congeneric model
and the data fit to the model is excellent statistically, y^ (2, N= 358) = 1.493, p= .474, and practically,
TLI = 1.00, CFI = 1.00, GFI = .99, AGFI = .99, RMSEA = .00 (.00; .10), and SRMR = .01.
Scree plots for all four constructs demonstrate that they are unidimensional and the resultant
Cronbach alpha internal consistency reliabilities for the factors comprising four-, two-, five-, and
four-items respectively are .74, .82, .76, and .87, all of which are above the commonly used
threshold value of .70 for acceptable reliability (Hair et al., 2006).
224

Chapter 6: Factor Analysis Results
A four-factor independent cluster measurement model comprising latent variables for liking art and
history interaction; famous culture, traditional perfonning arts, positive word-of-mouth, is specified
so that items load uniquely on their respective latent constiucts as hypothesized from the CFAs.
The conrelations between the four constmcts in the full measurement model are freely estimated
except for the referent parameter loading weight associated with each constmct tiiat is set to unity
to identify the model.
The initial data fit to the model is not acceptable as the model is statistically significant, y^ (98, N=
358) = 299.65, p= .000, and practically, several of the fit indices are less than the recommended .90
threshold measure, GFI = .91, AGFI = .87, TLI = .89, CFI = .92, although the RMSEA = .08 (.07;
.09), and the SRMR = .07 are acceptable. The model is respecified with four items (3.15, 3.7, 3.27
and 3.19) eliminated one at a time based largely on f-values greater than +2.0 in the standardised
residuals covariance matrix. Although the resultant data fit to the model is still statistically
significant, x^(48, N= 358) = 83.60, p = .001, the fit is excellent for the other fit indices, GFI = .96,
AGFI = .94, TLI = .97, CFI = .98, RMSEA = .05 (.03; .06), and the SRMR = .04. The model is also
more parsimonious with a normed chi-square ratio of 1.7.
The factor patterns and stmcture coefficients for the estimated parameters are presented in Table
6.8. All factor pattern coefficients on the respective four factors are statistically significant and
range from a low of .52 to a high of .92. Inspection of the stmcture coefficients shows discriminant
validity with a clear distinction between the items comprising the four cultural experience motive
factors. Intercorrelations between the latent variables are positive and significant (see Figure 6.5).
The factor, social consumption, has correlation of .52, .31 and .25 respectively with the factors,
novelty, learn local culture and relaxation. The novelty factor has con-elation of .32 and .57
respectively with the factors, learn local culture and relaxation. The correlation between these latter
two factors is .35.
Scree plots for each of the four constructs demonstrate that they are unidimensional and the
resultant Cronbach alpha internal consistency reliabilities for the four-item social consumption
factor, the three-item factors of learn local culture and relaxation, and the two-item novelty factor are
respectively .74, .87, .82, and .77, all of which are above the .70 threshold.
225

Chapter 6: Factor Analysis Results
Figure 6.5 Hypothesised model of cultural experience motives for CFA validation sample of English-speaking tourists
tell my friends and relatives
.49
.27
enhance social position e2
.47
buy goods and souvenirs
.42
ly refreshments to consume oi
.58
change from daily routine
.68
forget about demands of daily life
.85
learn about local culture
-:m learn about local history
T4r learn about local performing arts
.33
entertained by others IS.
relax physically ,81
relax mentally
-—N
V
226

Chapter 6: Factor Analysis Results
Table 6.8 CFA on validation sample: Factor pattern and structure coefficients for the four
Questic
factors of cultural experience motives
innaire Item
1 go to cultural attractions and events while travelling
3.20
3.21
3.30
3.31
3.16
3.17
3.11
3.12
3.13
3.2
3.3
3.4
to tell my friends and relatives atxjut it
to enhance my social position
to buy goods and souvenirs
to buy food and drinks to consume at tiie cultural experience
to have a change from my daily routine
to forget about demands of daily life
to leam about local culture
to leam about local history
to leam about local perfomiing arts
to be entertained by otiiers
to relax physically
to relax mentally
Factors
Social consumption
P
.70
.52
.69
.65
0
0=
0"
0=
0" 0=
0"
0
s .70
.52
.69
.65
.40
.43
.29
.28
.21
.19
.28
.29
Novelty
P S
0=
0
0
0'
.77
.83 0"
0"
0=
0=
0=
0"
.36
.27
.36
.34
.77
.83
.30
.29
.22
.33
.49
.51
Leam culture
P
0
0
0 0
0
0 .92
.92
.68
0
0"
0
local
S
.22
.16
.21
.20
.25
.27
.92
.92
.68
.20
.30
.31
Relaxation
P 1
0
0=
0
0
0
0
0=
0"
0"
.58
.86
.90
3
.23
.17
.22
.21
.44
.47
.32
.32
.24
.58
.86
.90
Note: P = pattem coefficient; S = stnjcture coefficient; N = 358. Factor con-elations were free to be estimated. All pattem coeffidents are statistically different from zero.
a. Parameters fixed at reported levels to identify the model
Four motive dimensions for attending cultural attractions and events while traveling were derived
from the EFA (i.e., novelty; relaxation; safe consumption; learn local culture). Results of the CFAs
validate a similar structure of four dimensions for the final hypothesized measurement model for
cultural experience motives except for the safe consumption latent construct that required model
respecification involving the removal of the going somewhere safe item and therefore an
associated name change to social consumption. The resultant four dimensions in the full
measurement model are also consistent with some theoretical formulations. Two factors are
consistent with going to cultural attractions and events while traveling for the largely
psychologically-based motives consistent with novelty and learning which are commonly found
motives or benefits in other research of cultural and tourism experiences (for a summary of
commonly found dimensions see Kay, 2006a). A third factor is consistent with physio-
psychologically-based motives of relaxation (physically and mentally), and relaxation has also been
commonly found in cultural experience motivation research. The fourth factor combines social
prestige and word-of-mouth psychologically-based motives with cultural experience attribute-based
motives of buying goods and souvenirs and consuming refreshments at the cultural experience.
While social prestige is a commonly found motive for attending cultural experiences, this latter
factor contrasts with the trend in the literature emphasising a conceptual shift away from activities
and amenities and toward experiential and psychological outcomes (Tian et al., 1996), by validating
the retention of the two attribute-based motives within the social consumption dimension. This
research finding is similar to other recent research of art museum experiences (Geissler et al.,
2006) and performing arts experiences (Swanson and Davis, 2006), which also acknowledge the
importance of some ancillary services and their quality to the cultural experience. The provision of
cafes or coffee shops was considered to enhance the sociable aspect of the art museum
227

Chapters: Factor Analysis Results
experience in recent focus group research of convenience sampled visitors to art museums in the
United States (Geissler et al., 2006). Similariy, recent exploratory factor analysis research of
performing arts audience members in the United States included attribute importance items for
evaluating the quality of the experience at live performances and found an ancillary quality
dimension that included food quality and gift shop item prices (Swanson and Davis, 2006). The
other important item within this social consumption motive dimension, is going to cultural
experiences to tell others about them, and this finding is supported by theoretical formulations that
have been identified in previous research of tourist motives and benefits dimensionality at cultural
or other types of experiences, whereby either a separate 'show and tell' dimension has been found
(e.g., Lang and O'Leary, 1997) or a similar item is found within a related dimension (e.g.. Weaver et
al., 2002).
The combination of learning and hedonic-entertainment-consumption related dimensions found in
this study is supported by substantive theoretical formulations in cultural and other tourism
motivation and benefits related literature (e.g., Eastgate et al., 2006; Kay, 2006a). Furthermore,
recent qualitative research of art museum visitors (Geissler et al., 2006) endorses the widely
acknowledged perception that cultural experiences offer 'edutainment' - a unique blend of
education and entertainment. In turn, the four cultural experience motive dimensions of novelty,
social consumption, learn local culture, relaxation and their combinations, have extensive marketing
implications, especially in terms of market segmentation, positioning, product development,
branding, programming and packaging, and communication campaigns and strategies.
6.5.3 Invariance Testing of the Hypothesised Cultural Experience Motives Model for Englislvspeaking tourists
To test hypothesis two that there is not a significant difference between different cultural groups of
English-speaking tourists for the cultural experience motive construct, invariance testing of the
cultural experience motives model derived from the English-speaking tourist validation sample is
undertaken. Results of the four-factor measurement model for cultural experience motives (Figure
6.5) assessed separately for each group of English-speaking tourists, establish structural similarity
and excellent fit of the data to the model for each group (see lines 1 to 4, Table 6.9) on most fit
indices. Although the hypothesised model is statistically significant for all groups, all other indices
show practical fit is excellent except for the AGFI that is below the .90 threshold for all groups. For
the multi-group baseline model, the key indexes are the y^ statistic, and the CFI and RMSEA
values (Byrne, 2001). As seen in Table 6.9 (line 5), the x value of 388.97, with 192 degrees of
freedom, provides the baseline value against which all subsequent tests for invariance are
compared. The CFI and RMSEA values of .95 and .06 respectively, indicate that the hypothesised
measurement model of cultural experience attitudes has excellent fit for the baseline model.
228

Chapter 6: Factor Analysis Results
Table 6.9 Invariance testing on validation sample: Model fit for multi-group model of cultural experience motives for four English-speaking tourist groups
Model X" df p-value GFI AGFI TLI CFI RMSEA 90% SRMR confidence interval of RMSEA
Domestic (Australia)
New Zealand
Nortti America
UK and Ireland
Baseline
Metiic invariance:
equal factor loadings
136.18
91.22
79.20
82.22
388.97
436.79
48
48
48
48
192
216
.000
.000
.003
.002
.000
.000
.93
.91
.91
.92
.92
.91
.89
.85
.85
.86
.87
.87
.95
.92
.92
.93
.93
.93
.94
.94
.95
.95
.95
.94
.08
.08
.07
.07
.04
.04
.06, .09
.06, .11
.04, .10
.04, .10
.03, .04
.03, .04
.06
.07
.07
.07
.06
.06
Note: Domestic (Austi-alia) (N= 315); New Zealanders (N = 140); Nortti Americans (N = 124); tourists from UK and Ireland (N = 141)
Having established excellent fit of the baseline model, testing for invariance of factorial metric
measurement across the four groups is undertaken on the constrained model. Chi-square
difference test are used to establish the difference in fit between the baseline model and the
constrained model. As seen in Table 6.9 (lines 5 and 6), comparison of the y^ difference between
these two models and their associated degrees of freedom yields a x difference value of 47.82
with 24 degrees of freedom, which is statistically significant at the .05 probability level. This
indicates that the equality constraints do not hold across the four groups for factor loadings and
further tests of factor loadings are needed to pinpoint the location of any noninvariance. In other
words, the parameter loadings are not equivalent (noninvariant) across the four English-speaking
tourist groups.
6.5.4 Validation and Invariance Testing of tiie Hypothesised Cultural Experience Motives Measurement Model for the Asian Tourist Sample
To test hypothesis one that there is significant difference between Western and Asian tourists for
the cultural experience motive construct, the hypothesised four-factor independent cluster
measurement model for cultural experience motives derived from the English-speaking tourist
validation sample is tested for the Asian tourist sample (N = 241). The model is specified so that
items load uniquely on their respective latent constructs of social consumption, novelty, learn local
culture, and relaxation. The correlations between the four constructs in the model are freely
estimated except for the referent parameter loading weight associated with each constmct that is
set to unity to identify the model.
Significant difference between Western and Asian tourists is hypothesised and the fit of the Asian
tourist data to the four-factor measurement motives model is initially poor. The model is statistically
significant, x^(59, N= 241) = 123.37, p= .000, and other than an acceptable SRMR = .08, the data
is a poor fit to the model for all of the other fit indices, GFI = .89, AGFI = .82, TLI = .85, CFI = .89,
and RMSEA = .11 (.09; 12). Acceptable fit of the data to the model is achieved following the
removal of three items: item 3.2 from the relaxation construct, item 3.13 from the learn local culture
constmct, and item 3.31 from the social consumption construct. The resultant fit of the data to the
229
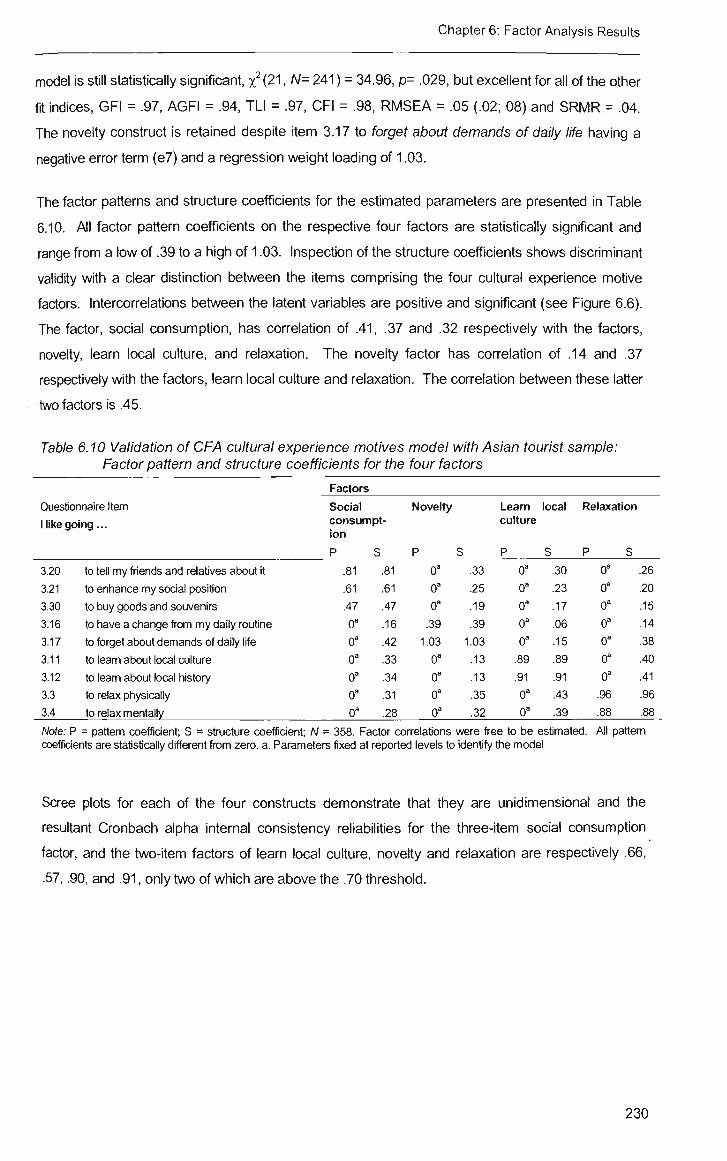
Chapter 6: Factor Analysis Results
model is still statistically significant, x (21, N= 241) = 34.96, p= .029, but excellent for all of the otiier
fit indices, GFI = .97, AGFI = .94, TLI = .97, CFI = .98, RMSEA = .05 (.02; 08) and SRMR = .04.
The novelty construct is retained despite item 3.17 to forget about demands of daily life having a
negative error term (e7) and a regression weight loading of 1.03.
The factor patterns and structure coefficients for the estimated parameters are presented in Table
6.10. All factor pattem coefficients on the respective four factors are statistically significant and
range from a low of .39 to a high of 1.03. Inspection of the structure coefficients shows discriminant
validity with a clear distinction between the items comprising the four cultural experience motive
factors. Intercorrelations between the latent variables are positive and significant (see Figure 6.6).
The factor, social consumption, has correlation of .41, .37 and .32 respectively with the factors,
novelty, learn local culture, and relaxation. The novelty factor has correlation of .14 and .37
respectively witii the factors, learn local culture and relaxation. The comelation between these latter
two factors is .45.
Table 6.10 Validation of CFA cultural experience motives model with Asian tourist sample: Factor pattern and structure coefficients for the four factors
Quest ionnaire Item
Mike going...
3.20
3.21
3.30
3.16
3.17
3.11
3.12
3.3
3.4
to tell my fliends and relatives about it
to enhance my social position
to buy goods and souvenirs
to have a change firom my daily routine
to forget alxiut demands of dally life
to leam about local culture
to leam about local history
to relax physically
to relax mentally
Factors
Social consumption
P
.81
.61
.47
0
0"
0 0'
0=
0
S
.81
.61
.47
.16
.42
.33
.34
.31
.28
Novelty
P
0
0
0 .39
1.03
0
0 0"
0"
S
.33
.25
.19
.39 1.03
.13
.13
.35
.32
Leam culture
P
0=
0= 0=
0 0'
.89
.91 0=
0=
local
S
.30
.23
.17
.06
.15
.89
.91
.43
.39
Relaxation
P
0'
0 0"
0 0
0
0 .96
.88
S
1
.26
.20
.15
.14
.38
.40
.41
.96
.88
Note: P = pattem coefficient; S = stiucture coefficient; N = 358. Factor con-elations were free to be estimated. All pattem coefficients are statistically different from zero. a. Parameters fixed at reported levels to identify tiie model
Scree plots for each of the four constructs demonstrate that they are unidimensional and the
resultant Cronbach alpha internal consistency reliabilities for the three-item social consumption
factor, and the two-item factors of learn local culture, novelty and relaxation are respectively .66,
.57, .90, and .91, only two of which are above the .70 threshold.
230

Chapter 6: Factor Analysis Results
Figure 6.6 Hypothesised model of cultural experience motives from CFA validation sample of English-speaking tourists for international Asian tourists
.65
tell my friends and relatives
.37
enhance social position
Hg) Hg)
.22
buy goods and souvenirs MS)
.15
change from daily routine
1.06
forget about demands of daily life
.79
learn about local culture
:m learn about local history
N5) *~€)
.93
relax physically JZ
relax mentally
To test hypothesis three that there is significant difference between Chinese-speaking and
Japanese-speaking Asian tourists for the cultural experience motive construct, invariance testing of
the cultural experience motives model for Asian tourists is undertaken. Results of the four-factor
231

Chapter 6: Factor Analysis Results
measurement model for cultural experience motives (Figure 6.6) assessed separately for each
group of Asian tourists, establish stmctural similarity and an acceptable fit of the data to the model
on most fit indices for each group (see lines 1 and 2, Table 6.11). Although the hypothesised
model is statistically significant for both groups, other indices show practical fit is acceptable. For
the multi-group baseline model, the key indexes are the y^ statistic, and the CFI and RMSEA
values (Byrne, 2001). As seen in Table 6.11 (line 3), the y^ value of 73.51, with 42 degrees of
freedom, provides the baseline value against which all subsequent tests for invariance are
compared. The CFI and RMSEA values of .96 and .06 respectively, indicate that the hypothesised
measurement model of cultural experience motives has acceptable fit for the baseline model.
Table 6.11 Invariance testing on Asian international tourist sample: Model fit for multi-group model of cultural experience motives for two Asian tourist groups
Model
Chinese-speaking
Japanese-speaking
Baseline
Metiic invariance:
equal factor loadings
-> X'
34.77
38.74
73.51
74.68
df
21
21
42
47
p-value
.030
.010
.002
.006
GFI
.94
.94
.94
.94
AGFI
.88
.87
.87
.88
TLI
.93
.93
.93
.94
CFI
.96
.96
.96
.96
RMSEA
.07
.09
.06
.05
90% confidence Interval of RMSEA
.02, .12
.04, .13
.03, .08
.03, .07
SRMR
.06
.06
.06
.06
Note: Chinese-speaking Asian Intemational tourists (N= 122); Japanese-speaking Asian intemational tourists (N= 119)
Having established acceptable fit of the baseline model, testing for invariance of factorial metric
measurement across the two groups is undertaken on the constrained model. Chi-square
difference test are used to establish the difference in fit between the baseline model and the
constrained model. As seen in Table 6.11 (lines 3 and 4), comparison of the y^ difference between
these two models and their associated degrees of freedom yields a y^ difference value of 1.17 with
5 degrees of freedom, which is not statistically significant at the .05 probability level. This indicates
that the equality constraints hold across the two groups for factor loadings and no further tests of
factor loadings are needed to pinpoint the location of any non-invariance. In other words, the
parameter loadings are equivalent (invariant) across the two Asian tourist groups.
6.5.5 Dimensionality of Cultural Experience Motives Summary Discussion
It was hypothesised that there are significant differences between Western and Asian tourists for
tiie dimensionality of the cultural experience motives construct. It was further hypothesised that the
dimensionality would not be significantly different for different cultural groups of English-speaking
tourists, but would be significantiy different for different language cultural groups of Asian tourists.
There was no evidence to support the significant differences between Western and Asian tourists
for cultural experience motives dimensionality. The Asian sample validated the four-factor
measurement model derived from the Western tourist sample.
The resultant four motive dimensions in the model for attending cultural attractions and events while
on holiday are for social consumption, novelty, relaxation and to learn local culture motives. These
232

Chapters: Factor Analysis Results
dimensions are consistent with some theoretical fonnulations as discussed in section 6.5.2 where
their mari<eting implications are also raised. A summation of the four motive dimensions found in
this study is that two factors are consistent with going to cultural attractions and events while
ti-aveling for the largely psychologically-based motives consistent with novelty and learning which
are commonly found motives or benefits in other research of cultural and tourism experiences. A
third factor is consistent with physio-psychologically-based motives of relaxation (physically and
mentally), and relaxation has also been commonly found in cultural experience motivation
research. The fourth factor combines social prestige and word-of-mouth psychologically-based
motives with cultural experience attribute-based motives of buying goods and souvenirs and
consuming refreshments at the cultural experience. This combination factor validates the
importance of sometimes so-called ancillary services of consuming refreshments and shopping for
goods and souvenirs at cultural experiences because of their contribution to the cultural experience
itself and to other associated socio-psychological aspects such as the cultural experience as a
social experience. The combination of learning and hedonic-entertainment-consumption related
dimensions found in this study endorses the widely acknowledged perception that cultural
experiences are perceived as offering 'edutainment' - a unique blend of education and
entertainment.
Evidence from the invariance testing of different cultural groups within the Westem tourists does not
confirm the hypothesised finding that there would not be significant differences in the dimensionality
of the cultural experience motive construct between these groups. Significant differences are found
in the cultural experience motive dimensions for different cultural groups of English-speaking
Western tourists. For the different cultural groups within the Asian tourists, invariance testing
evidence does not confirm the hypothesised finding that there would be significant differences in
the dimensionality of the cultural experience motive construct between these groups. Rather,
significant differences were not found in the cultural experience motive dimensions for the Chinese-
speaking and Japanese-speaking Asian tourists.
6.6 Dimensionality of Cultural Experience Benefits Sought
6.6.1 Exploratory Factor Analysis of Benefits Sought Dimensionality on the Calibration Sample
The EFA is conducted on the 28 items of the cultural experience benefits sought scale using the
calibration sample (N = 362) and undertaken in SPSS version 12.0 with the maximum likelihood
extraction method and an oblique rotation method (OBLIMIN). Initially five factors are extracted for
cultural experience benefits sought based on eigenvalues greater than 1.0, but four factors are
specified based on the scree plot (see Figure 6.7a) and retained in the final model with satisfactory
factorial stmcture based on both eigenvalues greater than 1.0 and the scree plot (see Figure 6.7b).
233

Chapter 6: Factor Analysis Results
Figure 6.7 Scree plots of EFA benefits sought construct for English-speaking tourist calibration sample
6.7a 6.7b
Scree Plot Scree Plot
I 1 I I I I I I I I I I I I I I I I I I I I I I I I I I 1 2 3 4 5 6 7 8 9 10111213141516171819202122232425262728
Factor Number
1—I—1—I—I—I—I—I—I—1—I—I—I—I—I—I—I—r—I—I—r 1 2 3 4 5 6 7 8 9 10 11 12 13 14 15 16 17 18 19 20 21
Factor Number
Table 6.12 displays the pattern coefficients and the factor intercorrelations for the final solution
based on 21 items. Satisfactory factorial structure is achieved by removing seven items to
respecify the factor model and a new factor solution is derived after the removal of each item
because maximum likelihood extraction is based on shared variance. Various criteria for identifying
and evaluating variables for possible deletion are used as previously discussed in section 6.2
outiining the EFA statistical analysis methods used in this study. Five items (4.16, 4.18, 4.19, 4.15
and 4.9) are removed to improve discriminant validity of the factorial structure based on inspection
of the pattern and structure matrices. One item (4.13) is removed for low loadings of .28 or less on
all four factors and low cross-loadings on two factors. A further item (4.26) is removed to improve
discriminant validity of the factorial structure based on inspection of the pattern and structure
mati-ices. The Cronbach alpha internal consistency reliabilities for these four factors are .78 or
above which is above the commonly used threshold value of .70 for acceptable reliability (Hair et
al., 2006). Because the factors are correlated, the sums of squared loadings cannot be added to
obtain a total variance, but the four-factor solution accounted for 56% of the total variance allowing
for the exti-action sums of squared loadings. Several of the factor intercorrelations are greater than
.30 that justifies using the maximum likelihood extraction method with an oblique rotation.
Inspection of the pattern coefficients and factor intercorrelations for the final solution displayed in
Table 6.12, shows four interpretable cultural experience benefits sought factors that are consistent
with some theoretical formulations.
234

Chapter 6: Factor Analysis Results
Table 6.12 EFA on calibration sample: cultural experience benefits
Questionnaire Item
From my visit 1 expect...
412
4.7
411
417
41
4.8
42
4.10
,4.4
43
4.23
422
4.24
4.25
420
4.31
4.32
4.30
4.29
4.5
4.6
to interact witii ottier visitors
to experienced ttirills and excitement
to interact witti staff
to get a feeling of accomplishment
to be emoti'onally involved
to gain knowledge
to be physically Involved
to escape into another worid
to be entertained
to have fun
signs to be in my language
written infonnation to be in my language
signs to be clear and helpfiji
facilities provided to be clean
to receive high quality service
Factor pattern coefficients for the four factors of sought derived from oblique rotation
a range of food and drinks to purchase and consume at Uie mari<et
a range of food and drinks to purchase and take awray
a range of goods and souvenirs will be available to purchase
good value for money
to relax physically
to relax mentally
Reliability Alpha
Factor intercorrelations
Factor 1: Physio-socio-psychological
Factor II: Own language infonnation
Factor III: Reflreshments and shopping
Factor IV: Relaxation
Percentage of explained variance
Eigenvalue after rotation
Factors
1
.76
.70
.70
.69
.67
.64
.59
.54
.52
.44
-.01
.05
.06
-.08
.22
-.06
.08
.06
-.04
.05
.14
.89
-.38
.29
-.56
34.28
6.11
II
-.07
.03
-.10
-.09
.09
-.00
.03
.01
.04
.06
-.92
-.92
-.73
-.57
-.41
.04
.04
.19
-.17
-.08
-.12
.88
-.46
.29
10.65
4.65
III
-.02
.02
-.01
-.08
.03
-.04
.12
-.00
.10
.25
-.04
-.10
.12
.22
.12
.93
.85
.43
.43
-.05
-.05
.78
-.25
5.92
3.67
IV
.09
-.08
.03
.11
-.08
-.02
-.04
-.18
-.28
-.25
-.03
-.03
.03
-.18
-.03
-.02
.10
.06
-.11
-.89
-.78
.91
5.46
4.12
Note: Coefficients exceeding an arbiti"ary cut-off loading of .40 are shown In bold type. N = 362
Exti-action Mettiod: Maximum Likelihood; Rotation Method: Oblimin witii Kaiser Nonnalization; Rotation converged in 8 iterations
Two factors are based on 12 of the 16 socio-physio-psychologically-related items that were
identified from the literature as commonly found benefits sought for attending cultural-related
attractions and events. The first factor comprises ten items consistent with a range of commonly
sought physio-socio-psychologically-related benefits. The fourth factor comprises two physio-
psychologically-related items that are consistent with relaxation (physical and mental). The other
two factors are predominantly attribute based with the second factor comprising five facility and
service attribute-related items largely consistent with seeking the benefit of own language
information, and the third factor comprising four attribute-related items consistent with seeking
refreshments and shopping. With two attribute-based and two psychologically-based factors, this
EFA factor solution for benefits sought is in contrast with the trend in the literature emphasising a
conceptual shift away from activities and amenities and toward experiential and psychological
outcome (Tian et al., 1996).
235

Chapter 6: Factor Analysis Results
6.6.2 Confinnatory Factor Analysis of Benefits Sought Dimensionality on the Validation Sample
One-factor congeneric models using maximum likelihood CFAs are initially evaluated for the four
hypothesised cultural experience benefits sought latent constixicts derived from the EFA. Multiple
criteria for assessing goodness-of-fit of the models are applied and multiple strategies for identifying
possible model respecification are used to improve the model fit if required, as previously discussed
in section 6.2 outiining the CFA statistical analysis methods used in this study.
The one-factor congeneric model for the constiruct of physio-socio-psychological benefits initially
reveals poor fit of the data to the model, both statistically, -^ (35, N= 358) = 237.02, p = .000, and
practically, for all other fit indices, TLI = .80, CFI = .84, GFI = .88, AGFI = .82, RMSEA = .13 (.11;
.14), and SRMR = .07. Excellent fit of the data for the constmct is achieved after removing three
items with a f-value greater than +2.0 in the standardised residuals covariance matiix indicating the
model was not explaining the association between these variables: 4.12 to interact with other
visitors; 4.2 to be physically involved; and 4.3 to have fun. The resultant fit of the English-speaking
tourist data to the model is excellent statistically,x^ (14, N= 358) = 14.70, p = .399, and practically
with TLI = .99, CFI = .99, GFI = .99, AGFI = .98, RMSEA = .01 (.00; .05), and SRMR = .02. The
final model is renamed, socio-psychological, following the removal of the physical involvement item.
The two-item relaxation construct is evaluated as a two-factor model with the socio-psychological
benefits latent construct. Although the two-factor model is statistically significant, y^ (26, N= 358) =
61.08, p= .000, this data is an excellent fit to the model for the other fit indices, TLI = .96, CFI = .97,
GFI = .96, AGFI = .94, RMSEA = .06 (.04; .08), and SRMR = .04.
The one-factor congeneric model for the construct of refreshments and shopping also reveals poor
fit of the data to the model initially, both statistically, x^(2, N= 358) = 26.81, p = .000, and practically,
for many other fit indices, TLI = .87, CFI = .96, GFI = .96, AGFI = .82, RMSEA = .19 (.13; .25), and
SRMR = .06. To enable removal of item 4.30 expecting a range of goods and souvenirs to be
available for purchase, the three-item construct is evaluated as a two-factor model with the socio-
psychological benefits latent construct. The resultant fit is excellent both statistically y^ (34, N= 358)
= 46.71, p = .072, and practically with TLI = .99, CFI = .99, GFI = .98, AGFI = .96, RMSEA = .03
(.00; .05), and SRMR = .04.
Poor fit of the data to the model is also initially revealed for the one-factor congeneric model for the
construct of own language information both statistically, y^ (5, N= 358) = 175.37, p = .000, and
practically, for all other fit indices, TLI = .71, CFI = .85, GFI = .84, AGFI = .51, RMSEA = .31 (.27;
.35), and SRMR = .12. Item 4.23 expecting signs to be in my language is removed as one of
several pairs of items with high correlations greater than 1.0 in the sample covariance matrix
indicating some item redundancy or multicollinearity. To enable removal of item 4.20 expecting to
receive high quality service, the tiiree-item construct is evaluated as a two-factor model with the
physio-socio-psychological benefits latent construct. The resultant fit is excellent both statistically y^
236

Chapters: Factor Analysis Results
(34, N= 358) = 45.71, p = .087, and practically with TLI = .99, CFI = .99, GFI = .98, AGFI = .96,
RMSEA = .03 (.00; .05), and SRMR = .04.
Scree plots for all four constructs demonstrate that they are unidimensional and the resultant
Cronbach alpha internal consistency reliabilities for the factors comprising six-, two-, and two of
three-items respectively are .81, .81, .77, and .91, all of which are above the commonly used
threshold value of .70 for acceptable reliability (Hair et al., 2006).
A four-factor independent cluster measurement model comprising latent variables for socio-
psychological ly-related benefits, own language information, refreshments and relaxation is
specified so that items load uniquely on their respective latent constructs as hypothesized from the
CFAs. The correlations between the four constructs in the full measurement model are freely
estimated except for the referent parameter loading weight associated with each construct that is
set to unity to identify the model.
Although the model is statistically significant, y^ (84, N= 358) = 193.57, p= .000, the initial data fit to
the model is acceptable for the other fit indices, GFI = .93, AGFI = .91, TLI = .94, CFI = .95,
RMSEA = .06 (.05; .07), and the SRMR = .06. The model is respecified with two items (4.29 and
4.11) eliminated one at a time based largely on f-values greater than +2.0 in the standardised
residuals covariance mati'ix. The socio-psychological factor is renamed edutainment following the
removal of the interaction item. The resultant data fit to the model is excellent, both statistically, y^
(59, N= 358) = 75.35, p = .099, and practically, GFI = .97, AGFI = .95 TLI = .99, CFI = .99, RMSEA
= .03 (.00; .04), and the SRMR = .04. The model is also more parsimonious with a normed chi-
square ratio of 1.3.
The factor patterns and structure coefficients for the estimated parameters are presented in Table
6.13. All factor pattern coefficients on the respective four factors are statistically significant and
range from a low of .51 to a high of .99. Inspection of the structure coefficients shows discriminant
validity with a clear distinction between the items comprising the four cultural experience benefits
sought factors with one exception. The distinction between the factors edutainment and relaxation
lacks discriminatory validity as theoretically expected considering the underlying psychological
basis of both factors. Intercorrelations between the latent variables are positive and significant (see
Figure 6.8). The factor, edutainment, has correlation of .34, .29 and .74 respectively with the
factors, signage and facilities, refreshments, and relaxation. The signage and facilities factor has
correlation of .40 and .24 respectively with the factors, refreshments, and relaxation. The
correlation between these latter two factors is .19.
Scree plots for each of the four constructs demonstrate that they are unidimensional and the
resultant Cronbach alpha internal consistency reliabilities for the six-item edutainment factor, the
three-item signage and facilities factors, and the two-item factors of refreshments and relaxation are
respectively .80, .77, .87, and .91, all of which are above the .70 threshold.
237

Chapter 6: Factor Analysis Results
Table 6.13 CFA on validation sample: Factor pattern and structure coefficients for the four factors of cultural experience benefits sought
Questic
Fromr
417
41
48
410
4.4
4.7
422
4.24
4.25
4.31
4.32
45
4.6
jnnaire Item
nyvisiti expect...
to get a feeling of accomplishment
to be emotionally Involved
to gain knowledge
to escape into anottier vrorid
to be entertained
to experienced ttirills and excitement
written infonnation to be in my language
signs to be clear and helpful
facilities provided to be clean
a range of food and drinks to purchase consume at tiie mari<et
a range of food and drinks to purchase take away
to relax physically
to relax mentally
and
and
Factors
Edutalrv ment
P
.51
.56
.74
.62
.67
.73
0=
0
0
0
0'
0 0
S
.51
.56
.74
.62
.67
.73
.22
.32
.24
.29
.23
.68
.67
Signs facilities
P S
0
0
0
0"
0
0"
.65
.93
.71
0
0'
0
0=
and
.17
.19
.25
.21
.23
.25
.65
.93
.71
.40
.32
.22
.22
Refreshments
P
0
0"
0
0=
0
0
0
0"
0"
.99
.79
0
0=
S
.15
.16
.22
.18
.20
.21
.26
.38
.29
.99
.79
.18
.17
Relaxation
P S
0=
0
0
0
0
0
0
0=
0=
0
0'
.93
.91
1
.37
.42
.55
.46
.50
.54
.15
.22
.17
.19
.15
.93
.91
Note: P = pattem coefficient; S = stiucture coefficient; N •• coeffidents are statistically different from zero.
a. Parameters fixed at reported levels to identify the model
358. Factor conrelations were free to be estimated. All pattem
Four dimensions for benefits sought from experiencing cultural attractions and events while
traveling were derived from the EFA (i.e., physio-socio-psychological benefits; own language
information; refreshments and shopping; and relaxation). Results of the CFAs validate a similar
structure of four dimensions for the final hypothesized measurement model for cultural experience
benefits sought except latent construct minor respecification required an associated name change
to three of the constructs: edutainment; signage and facilities; and refreshments.
The resultant four dimensions in the full measurement model are also consistent with some
theoretical formulations. One factor, edutainment, is wholly psychologically-based, another factor,
relaxation, is part physiological and part psychological, and the other two factors are attribute-
based: one emphasizing the importance of consuming refreshments at the cultural experience and
the other highlighting the importance of clear and helpful signs and clean facilities.
238

Chapter 6: Factor Analysis Results
Figure 6.8 Hypothesised model of cultural experience benefits sought for CFA validation sample of English-speaking tourists
.45
edutainment
be entertained e?; .39
escape into another world
.55
gain knowledge
.32
emotionally Involved
.26
feeling of accomplishment
.53
perience thrills and exciteme
§6;
.42
signage and facilities
- ( - jmvm language written i n fo rma t io^—VG8
signs clear and helpful
.51 facilities to be clean
e9.
.97
refreshments
refreshments onsite
refreshments to take away
.86
relaxation
relax physically
.83
relax mentally
Relaxation is a commonly found benefit sought from tourism experiences in general (Eastgate et
al., 2006) and from cultural and heritage tourism related experiences (Kay, 2006a). In the previous
239

Chapter 6: Factor Analysis Results
section 6.5 of this research on dimensionality of motives for attending cultural attractions and
events while traveling, relaxation was an identified motive factor that is also found as a separate
benefit sought factor from cultural experiences. The other psychologically-based benefits sought
factor is a composite of six-items consistent with the 'edutainment' concept identified in recent
research of art museum visitors (Geissler et al., 2006) and identified in the previous section of this
research on dimensionality of motives for attending cultural attractions and events while traveling as
two separate motive factors: novelty and learn local culture. From the benefits literatijre (e.g.,
Eastgate et al., 2006; Kay, 2006a), other commonly found education-related dimensions include
learning, gaining knowledge or discovery, while commonly found hedonic-entertainment-
consumption-related dimensions include excitement, escape, and entertainment. Recent
qualitative research of art museum experiences also emphasises that for cultural experiences as
entertainment, the art itself is thought to have hedonic value (Geissler et al., 2006). This
edutainment dimension of benefits sought from cultural experiences contrasts with the theoretical
formulation posited by McKercher and du Cros (2002) that many cultural tourism experiences have
their basis in entertainment and only a small number of tourists really seek a deep learning
experience when they travel, with the majority traveling for pleasure or escapist reasons and
participating in activities that will provide a sense of enjoyment.
The findings regarding the role of escapist reasons in this research of tourists' cultural experience
motivational process are contradictory. While they are one of the six items within the composite
edutainment factor for benefits sought from cultural experiences, the escapist reason item was the
one psychologically-related item not associated with dimensionality of attitudes about going to
cultural experiences (section 6.4) nor was it associated within the motives for attending cultural
attractions and events while travelling (section 6.5).
The two attribute-based factors contrast with the trend in the literature emphasising a conceptual
shift away from activities and amenities and toward experiential and psychological outcome (Tian et
al., 1996). However they validate recent qualitative research of art museum experiences (Geissler
et al., 2006) and empirical research of performing arts experiences (Swanson and Davis, 2006),
which acknowledge the importance of some ancillary services and their quality to the cultural
experience, particularly socialising in cultural venue cafes or coffee shops and the importance of
the food quality and other ancillary services such as preshow activities and gift shop items. While
refreshments has been identified in this study as a two-item separate benefit sought factor fi'om
cultural experiences, in the previous section (6.5) on motives for attending cultural attractions and
events while travelling, consuming refreshments at the cultural experience was an item within the
social consumption motive factor. The other attribute-based factor of signs and facilities for benefits
sought from cultural experiences, has only limited theoretical formulations from the benefits sought
research literature (e.g., literature review summaries by Eastgate et al., 2006; Kay, 2006a), but it
highlights the importance of clear signs, clean facilities and for written information to be in the
visitor's language. An investigation of benefits sought by visitors to historic houses combines both
utilitarian and experiential theories within a research methodology that uses a benefits sought scale
240

Chapters: Factor Analysis Results
to identify benefit visitor clusters which are compared with historic house service quality ratings
measured on a HISTOQUAL scale (Frochot, 2004) adapted from SERVQUAL (Parasuraman et al.,
1985, 1988) and based on five dimensions: responsiveness, tangibles, communications,
consumables and empathy. Overall, the tangibles dimension showed to be the most important of
all across the sample, followed by communication, responsiveness, consumables and empathy
with these dimensions displaying significant differences across the four benefit visitor segments
except for the responsiveness dimension.
The cultural experience benefits sought dimensions found in this study, have extensive marketing
implications, especially in terms of mari<et segmentation; product development, programming and
packaging; and communication campaigns and strategies.
6.6.3 Invariance Testing of the Hypothesised Cultural Experience Benefits Sought Model for English-speaking tourists
To test hypothesis two that there is not a significant difference between different cultural groups of
English-speaking tourists for the cultural experience benefits sought construct, invariance testing of
the cultural experience benefits sought model derived from the English-speaking tourist validation
sample is undertaken. Results of the four-factor measurement model for cultural experience
benefits sought (Figure 6.8), assessed separately for each group of English-speaking tourists,
establish stmctural similarity and acceptable fit of the data to the model for each group (see lines 1
to 4, Table 6.14) on most fit indices. Although the hypothesised model is statistically significant for
two groups (domestic tourists, and tourists from NZ), all other indices show practical fit is excellent
except for the AGFI that is below the .90 threshold for three of the four groups except for the
domestic tourist group. For the multi-group baseline model, the key indexes are the y^ statistic, and
the CFI and RMSEA values (Byrne, 2001). As seen in Table 6.14 (line 5), the x value of 386.41,
with 236 degrees of freedom, provides the baseline value against which all subsequent tests for
invariance are compared. The CFI and RMSEA values of .97 and .03 respectively, indicate that the
hypothesised measurement model of cultural experience benefits sought has excellent fit for the
baseline model.
Table 6.14 Invariance testing on validation sample: Model fit for multi-group model of cultural experience benefits sought for four English-speaking tourist groups
Model
Domestic (Austi^lia)
New Zealand North America
UK and Ireland
Baseline
Metiic invariance:
equal factor loadings
•7
X'
141.19
120.40
61.23
63.48
386.41
425.45
df
59
59
59
59
236
263
p-value
.000
.000
.003
.396
.322
.000
GFI
.94
.88
.93
.93
.92
.92
AGFI
.90
.82
.89
.89
.88
.88
TLI
.94
.91
.99
.99
.96
.96
CFI
.96
.93
.99
.99
.97
.96
RMSEA
.07
.09
.02
.02
.03
.03
90% confidence Interval of RMSEA
.05, .08
.06, .11
.00, .06
.00, .06
.02, .04
.02, .03
SRMR
.05
.06
.05
.05
.05
.05
Note: Domestic (Australia) (N= 315); New Zealanders (N = 140); North Americans (N - 124); tourists from UK and Ireland (W = 141)
241

Chapter 6: Factor Analysis Results
Having established excellent fit of the baseline model, testing for invariance of factorial meti-ic
measurement across the four groups is undertaken on the consti-ained model. Chi-square
difference test are used to establish the difference in fit between the baseline model and the
constrained model. As seen in Table 6.14 (lines 5 and 6), comparison of the y^ difference between
these two models and their associated degrees of freedom yields a y^ difference value of 39.04
with 27 degrees of freedom, which is not statistically significant at the .05 probability level. This
indicates that the equality constraints hold across the four groups for factor loadings and further
tests of factor loadings are not needed to pinpoint the location of any non-invariance. In other
words, tiie parameter loadings are equivalent (invariant) across the four English-speaking tourist
groups.
6.6.4 Validation and Invariance Testing of the Hypothesised Cultural Experience Benefits Sought Measurement Model for the Asian Tourist Sample
To test hypothesis one that there is significant difference between Western and Asian tourists for
the cultural experience benefits sought construct, the hypothesised four-factor independent cluster
measurement model for cultural experience benefits sought derived from the English-speaking
tourist validation sample is tested for the Asian tourist sample (N = 241). The model is specified so
that items load uniquely on their respective latent constructs of edutainment, signage and facilities,
refreshments, and relaxation.
The correlations between the four constructs in the model are freely estimated except for the
referent parameter loading weight associated with each construct that is set to unity to identify the
model.
Significant difference between Western and Asian tourists is hypothesised, but the initial fit of the
Asian tourist data to the four-factor measurement benefits sought model is acceptable except for
being statistically significant and an AGFI below the .90 threshold. The model fit is statistically, y^
(59, N= 241) = 139.36, p= .000, and practically, GFI = .92, AGFI = .87, TLI = .93, CFI = .95,
RMSEA = .08 (.06; .09) and SRMR = .06. Excellent fit of the data to the model is achieved
following the removal of three items: item 4.4 and 4.17 fi'om tiie edutainment construct requiring it
to be renamed eduhedonism, and item 4.22 from the signs and facilities construct, indicating that
Asian tourists did not expect vi^itten infonnation to be in their own language. The resultant fit of the
data to the model is still statistically significant, y^ (29, N= 241) = 44.28, p= .034, but excellent for all
of the other fit indices, GFI = .97, AGFI = .93, TLI = .98, CFI = .99, RMSEA = .05 (.01; 07) and
SRMR = .04.
242
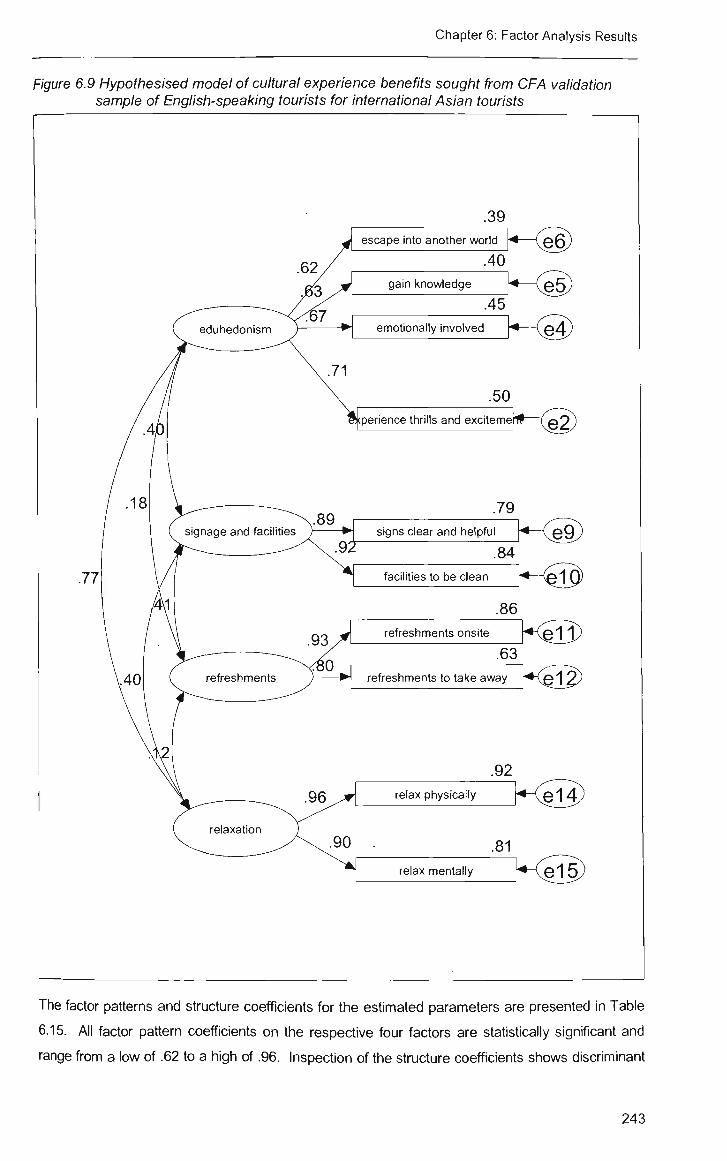
Chapter 6: Factor Analysis Results
Figure 6.9 Hypothesised model of cultural experience benefits sought from CFA validation sample of English-speaking tourists for international Asian tourists
escape into another world
gain knowledge
emotionally involved
.50
perience thrills and excitemerfP ( © 2 )
.79 signs clear and helpful
.84
facilities to be clean
e9.
.86
refreshments onsite <iB) / .63 — H refreshments to take away ' ^ v© 1 2 )
.92
relax physically
.81 relax mentally
The factor patterns and structure coefficients for the estimated parameters are presented in Table
6.15. All factor pattern coefficients on the respective four factors are statistically significant and
range from a low of .62 to a high of .96. Inspection of the stmcture coefficients shows discriminant
243

Chapter 6: Factor Analysis Results
validity v^th a clear distinction between the items comprising the four cultural experience benefits
sought factors with one exception. The distinction between the factors eduhedonism and relaxation
lacks discriminatory validity as theoretically expected considering the underiying psychological
basis of both factors. Intercon-elations between the latent variables are positive and significant (see
Figure 6.9). The factor, eduhedonism, has comelation of .40, .18 and .77 respectively with the
factors, signs and facilities, refreshments, and relaxation. The signs and facilities factor has
con-elation of .41 and .40 respectively with the factors, refreshments, and relaxation. The
correlation between these latter two factors is .12.
Table 6.15 Validation of CFA cultural experience benefits sought model with Asian tourist sample: Factor pattern and structure coefficients for the four factors
Questic
Fromr
41
4.8
410
47
424
4.25
4.31
4.32
4.5
4.6
)nnaire Item
nyvisiti expect...
to be emotionally involved
to gain knowledge
to escape into anotiier worid
to experienced thrills and excitement
signs to be clear and helpful
facilities provided to be dean
a range of food and drinks to purchase consume at tiie mart<et
a range of food and drinks to purchase take away
to relax physically
to relax mentally
and
and
Factors
Psychological
P S
.67
.63
.62
.71
0
0
0
0"
0"
0=
.67
.63
.62
.71
.36 :37
.16
.14
.74
.70
Signs facilities
P S
0
0
0
0 .89
.92
0'
0"
0'
0
and
.27
.26
.25
.29
.89
.92
.38
.33
.39
.36
Refresh' ments
P
0 0
0
0
0=
0
.93
.80
0 0'
S
.12
.11
.11
.12
.37
.38
.93
.80
.11
.11
Relaxation
P S
0 0'
0
0 0
0=
0"
0
.96
.90
1
.52
.49
.48
.55
.36
.37
.11
.09
.96
.90
Note: P = pattem coefficient; S = stiuctijre coeffident; N - 358. Factor conrelations were fi-ee to be estimated. All pattem coeffidents are statistically different fi'om zero.
a. Parameters fixed at reported levels to identify tiie model
Scree plots for each of the four constructs demonstrate that they are unidimensional and the
resultant Cronbach alpha internal consistency reliabilities for the four-item eduhedonism factor, and
two-item factors of signs and facilities, refreshments, and relaxation are respectively .75, .90, .85,
and .93, all of which are above the .70 threshold.
To test hypothesis three that there is significant difference between Chinese-speaking and
Japanese-speaking Asian tourists for the cultural experience benefits sought construct, invariance
testing of the cultural experience motives model for Asian tourists is undertaken. Results of the
four-factor measurement model for cultural experience benefits sought (Figure 6.9) assessed
separately for each group of Asian tourists, establish stmctural similarity and an acceptable fit of the
data to the model on most fit indices for each group (see lines 1 and 2, Table 6.16). Although the
hypothesised model is statistically significant for the Chinese-speaking tourists and not for the
Japanese-speaking tourists, all other indices show practical fit is excellent except for the AGFI that
is below the .90 threshold for both groups. For the multi-group baseline model, the key indexes are
the y^ statistic, and the CFI and RMSEA values (Byrne, 2001). As seen in Table 6.16 (line 3), the
244

Chapter 6: Factor Analysis Results
•^ value of 79.31, with 58 degrees of freedom, provides the baseline value against which all
subsequent tests for invariance are compared. The CFI and RMSEA values of .97 and .04
respectively, indicate that the hypothesised measurement model of cultural experience benefits
sought has acceptable fit for the baseline model.
Table 6.16 Invariance testing on Asian international tourist sample: Model fit for multi-group model of cultural experience benefits sought for two Asian tourist groups
Model
Chinese-speaking
Japanese-speaking
Baseline
Metiic invariance:
equal fador loadings
1
r
43.63
35.67
79.31
90.45
df
29
29
58
64
p-value
.040
.183
.033
.016
GFI
.93
.94
.94
.93
AGFI
.87
.89
.88
.88
TLI
.96
.98
.97
.97
CFI
.97
.99
.98
.98
RMSEA
.07
.04
.04
.04
90% confidence interval of RMSEA
.01,.10
.00, .09
.01,.06
.02, .06
SRMR
.04
.06
.04
.05
Note: Chinese-speaking Asian intemational tourists (N= 122); Japanese-speaking Asian intemational tourists (N= 119)
Having established acceptable fit of the baseline model, testing for invariance of factorial meti-ic
measurement across the two groups is undertaken on the constrained model. Chi-square
difference test are used to establish the difference in fit between the baseline model and the
constrained model. As seen in Table 6.16 (lines 3 and 4), comparison of the y^ difference between
these two models and their associated degrees of freedom yields a y^ difference value of 11.14
with 6 degrees of freedom, which is not statistically significant at the .05 probability level. This
indicates that the equality constraints hold across the two groups for factor loadings and no further
tests of factor loadings are needed to pinpoint the location of any non-invariance. In other words,
the parameter loadings are equivalent (invariant) across the two Asian tourist groups.
6.6.5 Dimensionality of Cultural Experience Benefits Sought Summary Discussion
It was hypothesised that there are significant differences between Western and Asian tourists for
the dimensionality of the cultural experience benefits sought constmct. It was further hypothesised
that the dimensionality would not be significantiy different for different cultural groups of English-
speaking tourists, but would be significantly different for different language cultural groups of Asian
tourists. There was no evidence to support the significant differences between Western and Asian
tourists for cultural experience benefits sought dimensionality. The Asian sample validated a four-
factor measurement model similar to the model derived from the Western tourist sample.
The resultant four benefits sought dimensions in the model that are expected from visiting cultural
experiences are edutainment (eduhedonism for the Asian tourist model), signage and facilities,
refreshments and relaxation. These dimensions are consistent with some theoretical formulations
as discussed in section 6.6.2 where their marketing implications are also raised. A summation of
the four benefits sought dimensions found in this study is that two factors are psychologically-based
and two are attribute-based. The psychologically-based factor of relaxation is commonly found in
the cultural experience benefits sought research. The other psychologically-based factor of
245

Chapter 6: Factor Analysis Results
edutainment (eduhedonism) is a composite of commonly found education-related and hedonic-
entertainment-consumption-related benefits sought dimensions. Recent qualitative research of art
museum experiences acknowledges and furtiier supports the combined edutainment offerings of
such experiences as well as emphasising that for cultural experiences as entertainment, the art
itself is thought to have hedonic value (Geissler et al., 2006). The two attribute-based dimensions
of signage and facilities, and refreshments conti'ast with the trend in the literature emphasizing a
conceptual shift away from activities and amenities and toward experiential and psychological
outcome (Tian et al., 1996). However, they validate recent research of art museum experiences
(Geissler et al., 2006) and perfomning arts experiences (Swanson and Davis, 2006) that
acknowledge the importance of some ancillary services and their quality to the cultural experience.
The relevance of both utilitarian attribute-related dimensions such as tangibles and consumables,
as well as experiential-related dimensions has also been supported in research of benefits sought
by visitors to historic houses (Frochot, 2004).
Evidence from the invariance testing of different cultural groups within the Western tourists and the
Asian tourists, supports equivalence of the factor configural structijre and metric invariance of the
factor loadings indicating that the cultural groups are calibrating the items in a similar fashion, for
different cultural groups of both Western and Asian tourists. This was hypothesised for the English-
speaking Western tourists, but does not confirm the hypothesised finding for the Asian tourists that
there are significant differences between dimensionality of the cultural experience benefits sought
constmct for Chinese-speaking and Japanese-speaking Asian tourists.
6.7 Dimensionality of Cultural Experience Benefits Gained
6.7.1 Exploratory Factor Analysis of Benefits Gained Dimensionality on the Calibration Sample
The EFA is conducted on the 28 items of the cultural experience benefits gained scale using the
calibration sample (N = 169) and undertaken in SPSS version 12.0 with the maximum likelihood
extraction method and an oblique rotation method (OBLIMIN). Initially, extraction of seven factors
based on eigenvalues greater than 1.0 is attempted for cultural experience benefits gained, but a
local minimum is not found despite increasing iterations to 200 and so the extraction is temriinated.
Three factors are specified based on the scree plot (see Figure 6.10a) and retained in the final
model with satisfactory factorial stmcture based on the scree plot (see Figure 6.10b), although five
factors have eigenvalues greater than 1.0.
246

Chapters: Factor Analysis Results
Figure 6.10 Scree plot for EFA benefits gained construct for English-speaking tourist calibration sample
6.10a 6.10b
Scree Plot Scree Plot
I I I I I I I I I I I I I I I I I I I I i I I I I I I I 1 2 3 4 5 6 7 8 9 1 0 1 1 1 2 1 3 1 4 1 5 1 6 1 7 1 8 1 9 2 0 2 1 2 2 2 3 24 25262728
Factor Number
I I I I I I I I I I I I I I I I I I I I I I I 1 2 3 4 5 6 7 6 9 10 11 12 13 14 15 16 17 18 19 20 21 22 23
Factor Number
Table 6.17 displays the pattern coefficients and the factor intercorrelations for the final solution
based on 23 items. Satisfactory factorial structure is achieved by removing five items to respecify
the factor model and a new factor solution is derived after the removal of each item because
maximum likelihood extraction is based on shared variance. Various criteria for identifying and
evaluating variables for possible deletion are used as previously discussed in section 6.2 outiining
the EFA statistical analysis methods used in this study. Three items (6.13, 6.15 and 6.12) are
removed for communality values below the 0.2 threshold indicating that the variable shares a low
amount of variance with all the other variables. One item (6.18) is removed to improve discriminant
validity of the factorial structure based on inspection of the pattern and structure matrices. A further
item (6.24) is removed for cross-loadings greater than .40 on factors one and three. The Cronbach
alpha internal consistency reliabilities for these three factors are .87 or above which is above the
commonly used threshold value of .70 for acceptable reliability (Hair et al., 2006). Because the
factors are comelated, the sums of squared loadings cannot be added to obtain a total variance, but
the three-factor solution accounted for 50% of the total variance allowing for the extractions sums of
squared loadings. One factor intercorrelation is greater than .30 that justifies using the maximum
likelihood extraction method with an oblique rotation.
Inspection of the pattern coefficients and factor intercorrelations for the final solution displayed in
Table 6.17, shows three interpretable cultural experience benefits gained factors that are consistent
with some theoretical formulations. One factor comprises 13 items consistent with a range of
commonly found socio-physio-psychologically-related benefits. These items are from the 16 socio-
physio-psychologically-related items that were identified from the literature as commonly found
benefits gained from attending cultural-related attractions and events. The other two factors are
predomlnantiy attribute-based with the second factor comprising two items consistent with
experiencing own language information and the other factor comprising eight items consistent with
experiencing consumerables of refreshments, goods and souvenirs, and quality facilities and
247

Chapters: Factor Analysis Results
semces. With two attribute-based and one psychologically-based factors, this EFA factor solution
for benefits gained is in contrast with the trend in the literature emphasising a conceptijal shift away
from activities and amenities and toward experiential and psychological outcome (Tian et al., 1996).
Table 6.17 EFA on calibration sample: Factor pattern coefficients for the three factors of cultural experience benefits gained derived from oblique rotation
Questionnaire Item
From my visit... Factors
1
.81
.76
.67
.65
.57
.57
.55
II
-.08
-.02
.16
.00
.01
-.09
-.19
III
.10
.13
-.18
-.10
-.19
-.07
-.06
6.31
6.23
6.22
6.7
6.1
6.17
6.10
6.9
6.2
6.8
6.16
6.3
6.5
6.6
6.11
6.4
.51 -.14 -.07
facilities provided were comfortable
facilities provided were clean
I received high quality service
I was well informed of tiie different faciliti"es and services available
1 received good value for money
a range of goods and souvenirs were available to purchase
a suitable range of food and drinks were available to purchase and take away
a suitable range of food and drinks were available for purchase and consumption
signs were in my language
written information was In my language
1 experienced ttirills and excitement
I was emotionally involved
I got a feeling of accomplishment
I escaped into anottier worid
I forgot about work and responsibilities
I was physically involved
I gained knowledge
I enhanced my social position
1 had fun
I relaxed physically
I relaxed mentally
I interacted with staff
I was entertained
.10
.22
.02
-.09
-.06
.04
•08
-.08
.21
-.03
.28
.25
.23
.17
.30
-.91
-.85
.02
-.11
-.06
-.02
.00
-.16
.08
.09
.00
.14
.14
.00
.03
-.03
-.06
-.78
-.70
-.70
-.65
-.62
-.60
-.60
-.58
-.55
-.54
-.54
-.51
-.50
Reliability Alpha .87 .94 .90
Factor intercorrelations
Factor I: Consumerables, facilities and services
Factor 11: Own language information
Factor 111: Socio-physio-psychological -.25
-.54 .08
Percentage of e)qDlained variance
Eigenvalue after rotation 28.44
6.43
15.90
2.23
5.93
7.03
Note: Coefficients exceeding an arijiti^ry cut-off loading of .40 are shown in bold type. W = 169
Exti-action Metiiod: Maximum Likelihood; Rotation MeUiod: Oblimin with Kaiser Nomnalization; Rotation converged In 9 iterations
Satisfactory factorial structure is achieved by removing five items to respecify the factor model and
a new factor solution is derived after the removal of each item because maximum likelihood
extraction is based on shared variance. Various criteria for identifying and evaluating variables for
possible deletion are used as previously discussed in section 6.2 outiining the EFA statistical
analysis methods used in this study. Three items (6.13, 6.15 and 6.12) are removed for
communality values below the 0.2 threshold indicating that the variable shares a low amount of
variance with all the other variables. One item (6.18) is removed to improve discriminant validity of
the factorial structure based on inspection of the pattern and stmcture matrices. A further item
248

Chapter 6: Factor Analysis Results
(6.24) is removed for cross-loadings greater than .40 on factors one and three. The Cronbach
alpha internal consistency reliabilities for tiiese three factors are .87 or above which is above the
commonly used threshold value of .70 for acceptable reliability (Hair et al., 2006). Because the
factors are correlated, the sums of squared loadings cannot be added to obtain a total variance, but
the three-factor solution accounted for 50% of the total variance allowing for the extractions sums of
squared loadings. One factor intercon'elation is greater than .30 that justifies using the maximum
likelihood exti-action method with an oblique rotation.
Inspection of the pattern coefficients and factor intercon-elations for the final solution displayed in
Table 6.17, shows three interpretable cultural experience benefits gained factors that are consistent
with some theoretical formulations. One factor comprises 13 items consistent with a range of
commonly found socio-physio-psychologically-related benefits. These items are from the 16 socio-
physio-psychologically-related items that were identified fi'om the literature as commonly found
benefits gained from attending cultural-related attractions and events. The other two factors are
predomlnantiy attribute-based with the second factor comprising two items consistent with
experiencing own language inforniation and the other factor comprising eight items consistent with
experiencing consumerables of refreshments, goods and souvenirs, and quality facilities and
services. With two attribute-based and one psychologically-based factors, this EFA factor solution
for benefits gained is in contrast with the trend in the literature emphasising a conceptual shift away
from activities and amenities and toward experiential and psychological outcome (Tian et al., 1996).
6.7.2 Confinnatory Factor Analysis of Etenefits Gained Dimensionality on tfie Validation Sample
One-factor congeneric models using maximum likelihood CFAs are initially evaluated for the three
hypothesised cultural experience benefits gained latent constructs derived from the EFA. Multiple
criteria for assessing goodness-of-fit of the models are applied and multiple strategies for identifying
possible model respecification are used to improve the model fit if required, as previously discussed
in section 6.2 outiining the CFA statistical analysis methods used in this study.
The one-factor congeneric model for the constmct of socio-physio-psychological benefits initially
reveals poor fit of the data to the model, both statistically, y^ (65, N= 156) = 328.95, p = .000, and
practically, for all other fit indices with TLI = .62, CFI = .68, GFI = .77, AGFI = .68, RMSEA = .16
(.15; .18), and SRMR = .10. Four items are removed with a f-value greater than +2.0 in the
standardised residuals covariance matrix indicating the model was not explaining the association
between these variables: 6.5 to relax physically, 6.16 the activities and events were safe, 6.9 forgot
about work and responsibilities, and 6.2 was physically involved. A further two items are removed
based on inspection of the modification indices for values greater than 4.0 which identify
parameters to be estimated in the revised model to significantiy reduce the chi-square and to
improve model fit. Rather than covary the numerous recommended items which creates ambiguity,
two of the items with the lower model weight parameter loading are removed: 6.4 was entertained,
249

Chapter 6: Factor Analysis Results
and 6.3 had fun. The resultant fit of the English-speaking tourist data to the model is excellent
statistically,x^(14, N= 156) = 21.71, p = .085, and practically with TLI = .96, CFI = .97, GFI = .96,
AGFI = .93, RMSEA = .06 (.00; .11), and SRMR = .04. The final model is renamed, eduhedonism,
as the latent constmct is largely consistent with gaining knowledge combined with experiencing
several hedonic-related emotions.
The one-factor congeneric model for the constmct of consumerables, facilities and services also
reveals poor fit of the data to the model initially, both statistically, x^(20, N= 156) = 196.29, p = .000,
and practically, for all other fit indices with TLI = .55, CFI = .68, GFI = .76, AGFI = .57, RMSEA =
.24 (.21; .27), and SRMR = .13. Excellent fit of the data to the model is achieved with removal of
three items with a f-value greater than +2.0 in the standardised residuals covariance matrix
indicating the model was not explaining the association between these variables: 6.79 well
informed of the different facilities and services available, 6.25 facilities were clean, and 6.29 good
value for money. The resultant fit of the English-speaking tourist data to the model is excellent
statistically,x^ (5, N= 156) = 10.57, p = .061, and practically for most of the other fit indices with TLI
= .96, CFI = .98, GFI = .97, AGFI = .92, RMSEA = .09 (.00; .16), and SRMR = .05.
The two-item construct for own language infomnation will be tested in the three-factor full
measurement model for the cultural experience benefits gained latent construct.
Scree plots for all three constmcts demonstrate that they are unidimensional and the resultant
Cronbach alpha internal consistency reliabilities for the factors comprising seven-, five-, and two-
items respectively are .80, .80, and .86, all of which are above the commonly used threshold value
of .70 for acceptable reliability (Hair et al., 2006).
A three-factor independent cluster measurement model comprising latent variables for
eduhedonism, consumerables, facilities and services, and own language information is specified so
that items load uniquely on their respective latent constmcts as hypothesized from the CFAs. The
con-elations between the three constmcts in the full measurement model are freely estimated
except for the referent parameter loading weight associated with each constmct that is set to unity
to identify the model.
The initial data fit to the model is poor, both statistically, y^ (74, N= 156) = 158.86 p = .000, and
practically, for most other fit indices with TLI = .88, CFI = .90, GFI = .87, AGFI = .82, RMSEA = .09
(.07; .10), and SRMR = .09. The model is respecified with six items eliminated one at a time.
Firstiy three items (6.20, 6.26 and 6.30) are removed based largely on f-values greater than +2.0 in
the standardised residuals covariance matrix. Another item (6.7) is removed based on inspection
of the modification indices which indicate it should be covaried with several other items and so its
removal avoids ambiguity created by covarying items. A further two items (6.17 and 6.6) are
removed to improve discriminant validity based on inspection of the factor pattern and structure
coefficients for the estimated parameters in the model. The resultant data fit to the model is
250

Chapter 6: Factor Analysis Results
excellent, both statistically, x^(17, N= 156) = 19.21, p = .317, and practically, GFI = .97, AGFI = .94
TLI = .99, CFI = .99, RMSEA = .03 (.00; .08), and the SRMR = .04. The model is also more
parsimonious with a normed chi-square ratio of 1.13.
Figure 6.11 Hypothesised model of cultural experience benefits gained for CFA validation sample of English-speaking tourists
refreshments
own language Information
.41 was emotionally involved •^—C0X^
.31 eduhedonism " V - g ^ gained knowledge -^—CB4^
escaped Into another world • ^ — G B 5 ^ TtJtr
interacted with staff • ^ — C ^ ^ ^
.75
refreshments consumed onsite
.89 refreshments taken away
.87
9 4 _ _ _ . ^ n language written in format i i ^ i—C^l^ . -^
81 .66 own language signs
251

Chapter 6: Factor Analysis Results
The factor patterns and stmcture coefficients for the estimated parameters are presented in Table
6.18. All factor pattem coefficients on the respective three factors are statistically significant and
range from a low of .55 to a high of .94. Inspection of the stmcture coefficients shows discriminant
validity with a clear distinction between the items comprising the three cultural experience benefits
gained factors. Intercorrelations between the latent variables are positive and significant (see
Figure 6.11). The factor, eduhedonism, has correlation of .50 and .49 respectively with the factors,
refreshments and own language information. The correlation between these latter two factors is
.35.
Saee plots for each of the three constmcts demonstrate that they are unidimensional and the
resultant Cronbach alpha internal consistency reliabilities for the four-item eduhedonism factor and
the two-item factors of refi'eshments and own language infomnation are respectively .72, .90 and
.86, all of which are above the .70 threshold.
Three dimensions for benefits gained from experiencing cultural attractions and events while
traveling were derived from the EFA (i.e., consumerables, facilities and services; own language
information; and socio-physio-psychological benefits). Results of the CFAs validate a similar
structure of three dimensions for the final hypothesized measurement model for cultural experience
benefits gained except respecification of two latent constructs required an associated name change
in the three resultant constmcts: eduhedonism, refreshments and own language infonnation.
Table 6.18 CFA on validation sample: Factor pattern and structure coefficients for the three factors of cultural experience benefits gained
Questionnaire Item
From my visit...
6.1
6.8
6.10
6.11
6.31
6.32
6.22
6.23
1 was emoti'onally involved
1 gained knowledge
1 escaped Into anotiier worid
1 interacted witii staff
a suitable range of food and drinks available for purchase and consumption
a suitable range of f(X)d and drinks available to purchase and take away
written inforniation was in my language
signs were in my language
were
were
Factors
Eduhedonism
P
.64
.55
.59
.74
0
0=
0^
0"
S
.64
.55
.59
.74
.43
.47
.46
.40
Refreshments
P S
0=
0
0
0=
.87
.94
0'
0=
.32
.28
.30
.37
.87
.94
.33
.28
Own language information
P S
0^
0
0
0
0"
0'
.94
.81
.31
.27
.29
.36
.30
.33
.94
.81
Note: P = pattem coefficient; S = stitichjre coefficient; W = 156. Factor con-elations were free to be estimated. All pattem coefficients are statistically different from zero.
a. Parameters fixed at reported levels to identify tiie model
The resultant three dimensions in the full measurement model are also consistent with some
theoretical.formulations. One factor, eduhedonism, is largely psychologically-based and the other
two factors are attribute-based: one emphasizing the importance of consuming refreshments at the
cultural experience and the other highlighting the importance of own language infomnation.
252

Chapter 6: Factor Analysis Results
The eduhedonism dimension combines several commonly found benefits from tourism experiences
in general (Eastgate et al., 2006) and from cultural and heritage tourism related experiences (Kay,
2006a), especially education-related dimensions such as learning, gaining knowledge or discovery,
and hedonic-entertainment-consumption-related dimensions such as excitement, escape and
entertainment. Hedonic consumption is based on emotional feelings and experiences in using
products (Mowen and Minor, 1998) and is highly associated with products that are inti-insically more
emotionally involving than packaged goods with examples from previous research including
perfomiing arts-related products of rock concerts, theatre and dance (Holbrook and Schlndler,
1994). Furthermore, cultural offerings are considered to satisfy consumer wants in the hedonic or
aesthetic realm (Hirschman and Holbrook, 1982; Holbrook and Hirschman, 1982) and recent
qualitative research of art museum experiences (Geissler et al., 2006) also emphasises that the
cultural experience itself is tiiought to have hedonic value. Escapist benefits are included in this
eduhedonism factor for benefits gained from cultural experiences, similar to the inclusion of
escapist benefits within the edutainment factor for benefits sought from cultural experiences.
The two attribute-based factors conti'ast with the trend in the literature emphasising a conceptual
shift away from activities and amenities and toward experiential and psychological outcomes (Tian
et al., 1996). However the refreshments construct validates recent qualitative research of art
museum experiences (Geissler et al., 2006) and empirical research of perfonning arts experiences
(Swanson and Davis, 2006), which acknowledge the importance of some ancillary services and
their quality to the cultural experience, particulariy socialising in cultural venue cafes or coffee
shops. In addition to being a relevant dimension of benefits gained from cultural experiences,
refreshments were identified in this eariier in this study as a relevant dimension of benefits sought
from cultural experiences (section 6.6), and as items within a related dimension of motives for going
to cultural experiences while travelling (section 6.5). The other attribute-based factor of own
language information when experiencing cultural experiences is not identified in literature review
summaries of commonly found benefits from cultural and other tourist experiences (Eastgate et al.,
2006; Kay, 2006a). However, it has some theoretical support from Frochot's (2004) investigation of
benefits sought by visitors to historic houses which combined both utilitarian and experiential
theories and found a communications dimension displayed significant differences across the four
benefit visitor segments. Furthermore, it is a relevant dimension to test in cross-cultural research of
tourist experiences.
The cultural experience benefits gained dimensions found in this study, have extensive marketing
implications, especially in terms of customer satisfaction, positive word-of-mouth and potential
repeat patronage as well as for market segmentation; product development, programming and
packaging; and communication campaigns and strategies.
253

Chapter 6: Factor Analysis Results
6.7.3 Invariance Testing of the Hypothesised Cultural Experience Benefits Gained Model for English-speaking tourists
To test hypothesis two that there is not a significant difference between different culhjral groups of
English-speaking tourists for the cultural experience benefits gained constmct, invariance testing of
the cultural experience benefits gained model derived from the English-speaking tourist validation
sample is undertaken. Results of the three-factor measurement model for cultural experience
benefits sought (Figure 6.11), assessed separately for the two groups of English-speaking
domestic tourists and English-speaking international tourists, establish stmctural similarity and
excellent fit of the data to the model for each group (see lines 1 and 2, Table 6.19) on most fit
indices. For the multi-group baseline model, the key indexes are the x statistic, and the CFI and
RMSEA values (Byrne, 2001). As seen in Table 6.19 (line 3), the -^ value of 32.52, witii 34
degrees of freedom, provides the baseline value against which all subsequent tests for invariance
are compared. The CFI and RMSEA values of 1.00 and .00 respectively, indicate that the
hypothesised measurement model of cultural experience benefits gained has acceptable fit for the
baseline model.
Table 6.19 Invariance testing on validation sample: Model fit for multi-group model of cultural experience benefits sought for two English-speaking tourist groups
Model
Domestic (Austi-alia)
Intemational
Baseline
Metric Invariance:
equal factor loadings
9 X'
19.77
12.74
32.52
33.33
df
17
17
34
39
p-value
.286
.754
.540
.726
GFI
.97
.98
.98
.98
AGF 1
.93
.96
.95
.95
TLI
.99
1.011
1.002
1.007
CFI
.99
1.000
1.000
1.000
RMSEA
.03
.00
.00
.00
90% confidenc e interval of RMSEA
.00, .09
.00, .05
.00, .04
.00, .03
SRMR
.04
.03
.04
.04
Note: Domestic (Austi-alia) (N= 138); Intemational (W = 187)
Having established acceptable fit of the baseline model, testing for invariance of factorial metric
measurement across the two groups is undertaken on the constrained model. Chi-square
difference test are used to establish the difference in fit between the baseline model and the
constrained model. As seen in Table 6.19 (lines 3 and 4), comparison of the y^ difference between
these two models and their associated degrees of freedom yields a -^ difference value of .81 with
five degrees of freedom, which is not statistically significant at the .05 probability level. This
indicates that the equality constraints hold across the two groups for factor loadings and further
tests of factor loadings are not needed to pinpoint the location of any non-invariance. In other
words, the parameter loadings are equivalent (invariant) across the two English-speaking tourist
groups.
254

Chapter 6: Factor Analysis Results
6.7.4 Validation and Invariance Testing of the Hypothesised Cultural Experience Benefits Gained Measurement Model for the Asian Tourist Sample
To test hypothesis one that there is significant difference between Western and Asian tourists for
the cultural experience benefits gained construct, the hypothesised three-factor independent cluster
measurement model for cultural experience benefits gained derived from the English-speaking
tourist validation sample is tested for the Asian tourist sample (N = 93). The model is specified so
that items load uniquely on their respective latent constructs of eduhedonism, refreshments, and
own language information. The con'elations between the three constmcts in the model are freely
estimated except for the referent parameter loading weight associated with each constmct that is
set to unity to identify the model.
Significant difference between Western and Asian tourists is hypothesised, but the initial fit of the
Asian tourist data to the three-factor measurement benefits gained model is excellent except for an
AGFI below the .90 threshold, both statistically, y^ (17, A/ = 93) = 20.13, p= .268, and practically,
GFI = .95, AGFI = .89, TLI = .98, CFI = .99, RMSEA = .05 (.00; .11) and SRMR = .06. Excellent fit
for all fit indices is achieved following the removal of the own language information latent construct
as the covariance with the refreshment latent constmct is non significant and the error variance
(el 3) for the own language written information item within this two-item constmct is also non
significant. The resultant fit of the data to the model is excellent both statistically, y^ (8, N= 93) =
9.172, p= .328, and practically with GFI = .97, AGFI = .91, TLI = .99, CFI = .99, RMSEA = .04 (.00;
.13) and SRMR = .04.
The factor patterns and stmcture coefficients for the estimated parameters are presented in Table
6.20. All factor pattern coefficients on the respective two factors are statistically significant and
range from a low of .21 to a high of .98. Inspection of the structure coefficients shows discriminant
validity with a clear distinction between the items comprising the two cultural experience benefits
gained factors. Intercomelation between the latent variables is positive and significant (see Figure
6.12) with the correlation between the eduhedonism and refreshment factors being .17.
Table 6.20 Validation of CFA cultural experience benefits gained model with Asian tourists sample: Factor pattern and structure coefficients for the two factors
Factors Questionnaire Item From
6.1
6.8
6.10 6.11
6.31
6.32
my visit...
1 was emotionally involved
1 gained knowledge
1 escaped Into anottier world
1 interacted with staff
a suitable range of fcxx) and drinks available for purchase and consumption
a suitable range of food and drinks available to purchase and take away
were
were
Eduhedonism
P
.71
.50
.60
.21
0
0"
S
.71
.50
.60
.21
.15
.17
Refreshments
P S
0=
0
0
0=
.91
.98
.12
.08
.10
.04
.91
.98
Note: P = pattem coefficient; S = stiucture coefficient; N = 93. Factor con-elations were free to be estimated. All pattem coeffidents are statistically different from zero.
a. Parameters fixed at reported levels to identify tiie model
255

Chapter 6: Factor Analysis Results
Figure 6.12 Hypothesised model of cultural experience benefits gained from CFA validation sample of English-speaking tourists for international Asian tourists
.50
eduhedonism
was emotionally involved MS)
.25
- ^ gained knowledge • ^ — C s 4 )
esc^aped into another world <—CsH^
interacted with staff - ^ — C J 6 0 )
.17
.83
refreshments
refreshments consumed onsite
.95 refreshments taken away
Scree plots for the two constructs demonstrate that they are unidimensional and the resultant
Cronbach alpha internal consistency reliabilities for the four-item eduhedonism factor and the two-
256

Chapter 6: Factor Analysis Results
item refreshments factor are respectively .57 and .94 which identifies the Cronbach alpha for tiie
eduhedonism factor as below the recommended .70 threshold (Hair et al., 2006).
Hypothesis three that there is significant difference between Chinese-speaking and Japanese-
speaking Asian tourists for the cultural experience benefits gained constmct cannot be tested as
the subsample size for the two groups of Asian tourists, namely Chinese-speaking and Japanese-
speaking, required for invariance testing of the cultural experience benefits gained model for Asian
tourists to be undertaken is below the recommended minimum of 100 cases for each group.
6.7.5 Dimensionality of Cultural Experience Benefits Gained Summary Discussion
It was hypothesised that there are significant differences between Westem and Asian tourists for
the dimensionality of the cultural experience benefits gained constiuct. It was further hypothesised
that the dimensionality would not be significantly different for different cultural groups of English-
speaking tourists, but would be significantiy different for different language cultural groups of Asian
tourists.
The first hypothesis was supported with differences between Western and Asian tourists for cultural
experience benefits gained dimensionality. Of the three-factor model derived from the Westem
tourist sample, the Asian sample validated two factors: eduhedonism and refreshments. The own
language information benefit gained from experiencing cultural attractions was not validated for the
Asian tourists which is expected as very few cultural attractions in Austi'alia provide written
information in languages other than English.
These dimensions are consistent with some theoretical formulations as discussed in section 6.7.2
where their marketing implications are also raised.
A summation of the three benefits gained dimensions found in this study is that one factor is
psychologically-based and two are attribute-based. The psychologically-based factor of
eduhedonism is a composite of commonly found education-related and hedonic-entertainment-
consumption-related dimensions. That the cultural experience itself has hedonic value has been
acknowledged in the literature (Geissler et al., 2006; Hirschman and Holbrook, 1982; Holbrook and
Hirschman, 1982; Holbrook and Schlndler, 1994). The two attribute-based dimensions of
refreshments and own language information contrast with the trend in the literature emphasizing a
conceptual shift away from activities and amenities and toward experiential and psychological
outcome (Tian et al., 1996). However, the refreshment dimension validates recent research of art
museum experiences (Geissler et al., 2006) and performing arts experiences (Swanson and Davis,
2006) that acknowledge the importance of some ancillary services and their quality to the cultural
experience. The own language information dimension is a relevant dimension to test in cross-
cultural research of tourist experiences and has some theoretical support from Frochot's (2004)
investigation of benefits sought by visitors to historic houses which combined both utilitarian and
257

Chapter 6: Factor Analysis Results
experiential theories and found a communications dimensions displayed significant differences
across the benefit visitor segments.
Invariance testing of the benefits gained cultural experience constmct for different cultural groups of
Western tourists supports hypothesis two that there is not a significant differences between these
tourists. The invariance of the factor configural stmchjre and metiic invariance of the factor
loadings indicate that the two different cultural groups of English-speaking tourists, domestic
tourists in Australia and international tourists, are calibrating the items in a similar fashion.
Hypothesis three that there is a significant difference between different language cultural groups of
Asian tourists could not be tested as the subsample size for the two groups of Asian tourists of
interest to this study, namely Chinese-speaking and Japanese-speaking, were below the
recommended minimum of 100 cases for each group.
6.8 Exploratory Factor Analysis of the Westem Tourist Motives Differences
6.8.1 Exploratory Factor Analysis of Motive Dimensionality for the Domestic Tourist Sample
The EFA is conducted on the 31 items of the cultural experience motive scale using the domestic
tourist sample (N = 315) and undertaken in SPSS version 12.0 with the maximum likelihood
extraction method and an oblique rotation method (OBLIMIN). Initially six factors are exti-acted for
cultural experience motives based on eigenvalues greater than 1.0, but three factors are specified
based on the scree plot (see Figure 6.13a) that are later increased to a final model of five factors
based on both eigenvalues greater than 1.0 and the scree plot (see Figure 6.13b) with satisfactory
factorial stmcture.
Figure 6.13 Scree plots of EFA motives construct for English-speaking domestic tourist sample
6.13a 6.13b
IS 16 17 1
Factor Numbar Factor Number
Table 6.21 displays the pattern coefficients and the factor intercorrelations for the final solution
based on 25 items. Satisfactory factorial stmcture is achieved by removing six items to respecify
258

Chapter 6: Factor Analysis Results
tiie factor model and a new factor solution is derived after the removal of each item because
maximum likelihood extraction is based on shared variance. Various criteria for identifying and
evaluating variables for possible deletion are used as previously discussed in section 6.2 outiining
the EFA statistical analysis methods used in this study. Two items are firstiy removed to improve
discriminant validity of the factorial structure based on inspection of the pattem and sti^jcture
mati-ices (3.23 and 3.9). One item (3.14) is then removed for communality values below the 0.2
tiireshold indicating that the variable shares a low amount of variance with all the other variables.
Five factors are specified based on the scree plot and a further two items are removed to improve
discriminant validity (3.24 and 3.6) with one further item removed for cross-loadings greater than
3.2 on factors three and five.
Table 6.21 EFA for the domestic tourist sample: Factor pattern coefficients for the five factors of cultural experience motives derived from oblique rotation
Questionnaire Item
1 go to cultural attractions and events while travelling...
3.11
3.12
3.13
3.15
3.10
3.22
3.17
3.18
3.16
3.19
3.25
3.21
3.3 3.4
3.2
3.1
3.7
3.5
3.8
3.28
3.27
3.30
3.31
3.29
3.20
to leam about local culture
to leam about local history
to leam about local performing arts
to enjoy something unique to Vne destination
to meet locals
to see famous places
to forget about demands of daily life
to escape into another worid
to have a change from my dally routine
to satisfy my curiosity
to gain the respect of otiiers
to enhance my social position
to relax physically
to relax mentally
to be entertained by otiiers
to have fun
to do sometiiing 1 want to do
to have ttirills and excitement
to do sometiiing with my family and fliends
to get value for money
to go somewhere safe
to buy goods and souvenirs
to buy food and drinks to consume at Uie cultural experience
to have a high quality experience
to tell my fliends and relatives about it
Reliability Alpha
Factor Intercorrelations
Factor 1: Local Cultijre Knowledge
Factor II: Escape and Novelty
Factor 111: Social Recognition
Factor IV: Hedonism
Factor V; Good Value Consumption
Percentage of explained variance
Eigenvalue after rotation
Factors
1
.98
.93
.75
.53
.52
.45
-.04
.01
.20
.32
.11
.15
-.07
-.02
.09
.16
-.05
.11
-.05
-.04
.08
-.03
.07
.18
.19
.88
.38
.04
.50
.40
34.40
6.10
II
-.02
-.00
.06
.08
.01
.04
.84
.78
.45
.40
.00
.10
.14
.22
-.13
-.07
.06
.14
-.04
-.01
.09
.05
.05
.09
.19
.83
.13
.49
.50
7.98
5.18
III
.01
-.02
.08
-.30
.23
.02
-.07
.14
-.33
-.09 .69
.63
.10
.02
.04
-.07
-.19
.16
-.23
-.06
.11
.20
.19
-.20
.23
.79
.01
.18
7.31
1.72
IV
-.02
-.01
.06
.14
.08
.07
.09
.02
.15
-.05
.06
.04
.83
.75
.73
.72
.52
.52
.46
-.05
.07
.08
.10
.16
-.06
.88
.42
4.14
6.32
V
-.07
.01
-.08
.09
-.03
.24
.03
-.03
.17
.25
.21
.16
-.10
-.09
.03
.01
.16
.09
.22
.86
.67
.49
.45
.45
.41
.82
3.32
5.34
Note: Coefficients exceeding an ariaiti ry cut-off loading of .41 are shown in bold type. A/ = 315
259

Chapter 6: Factor Analysis Results
Extinction Mettiod: Maximum Likelihood; Rotation Metiiod: Oblimin witii Kaiser Normalization; Rotation converged in 18 iterations
The internal reliability of each dimension is then calculated using Cronbach alpha coefficients and
the coefficients for all five factors are above the commonly used threshold value of .70 for
acceptable reliability (Hair et al., 2006) as seen in table 6.21. Because the factors are correlated,
the sums of squared loadings cannot be added to obtain a total variance, but the five-factor solution
accounts for 57 percent of the total variance allowing for the extraction sums of squared loadings.
Several of the factor intercon'elations are .30 or greater, which justifies using the maximum
likelihood extraction method with an oblique rotation.
Inspection of the pattern coefficients and factor intercorrelations for the final solution displayed in
Table 6.21, shows five interpretable cultural experience motive factors that are consistent with
some theoretical formulations. Three of the factors are based on 13 of the 29 psycho-socio-
physiologically-related items that were identified from the literature as commonly found motives for
attending cultural-related attractions and events and these items comprise factors that are highly
compatible with the literature: Escape and Novelty (4 items), Social Recognition {2 items) and
Hedonism (7 items). The other two factors are largely psycho-socio-physiologically-based, but
include some attribute-related items as well. One seven-item factor is dominantly local culture
learning-related, but includes the partly attribute-based items of enjoying something unique to the
destination, meeting locals and seeing famous cultural places. The other six-item factor. Good
Value Consumption, includes the attribute-based items of going to cultural experiences while
travelling to buy goods and souvenirs and to buy refreshments to consume at the cultural
experience as well as the partly attribute-based item of seeking a high quality experience.
This factor solution for the domestic tourist sample retains more motive items than any other
samples in this study, extracts the largest number of motive factors (five) at least two of which are
partly attribute-related. Consumption of refreshments and shopping for goods and souvenirs are
important attributes that motivate domestic tourists to attend cultural experiences while travelling.
6.8.2 Exploratory Factor Analysis of Motive Dimensionality for the New Zealand Tourist Sample
The EFA is conducted on the 31 items of the cultural experience motive scale using the New
Zealand tourist sample (N = 140) and undertaken in SPSS version 12.0 with the maximum
likelihood extraction method and an oblique rotation method (OBLIMIN). Initially seven factors are
extracted for cultural experience motives based on eigenvalues greater tiian 1.0, but four factors
are specified based on the scree plot (see Figure 6.14a) that are further reduced to three factors,
but then increased back to four factors in the final model based on both eigenvalues greater than
1.0 and the scree plot (see Figure 6.14b) with satisfactory factorial stmcture.
Table 6.22 displays the pattern coefficients and the factor intercon'elations for the final solution
based on 17 items. Satisfactory factorial structure is achieved by removing 14 items based on
260

Chapters: Factor Analysis Results
various criteria (see section 6.2) to respecify the factor model and a new factor solution is derived
after the removal of each item because maximum likelihood extraction is based on shared
variance. One item (3.9) is removed for communality values below the 0.2 threshold indicating that
the variable shares a low amount of variance with all the other variables. Nine items are tiien
removed to improve discriminant validity of the factorial stiTJCture based on inspection of the pattern
and structure matrices (3.18, 3.14, 3.6, 3.17, 3.30, 3.8, 3.22, 3.24 and 3.23). A further four items
are then removed: one item (3.10) for cross-loadings greater than .32 on two factors, one item
(3.16) so that all items retained have con-ected item-to-total correlations greater than 0.5 as
generally recommended (Hair et al., 2006), one item (3.15) to increase the Cronbach alpha
coefficient for Factor 2 as recommended by the SPSS analysis output, and a fourth item (3.4) so
that all factors are positive. The internal reliability of each dimension is then calculated using
Cronbach alpha coefficients and the coefficients for all of four factors are .77 or above which is
above the commonly used threshold value of .70 for acceptable reliability (Hair et al., 2006).
Because the factors are correlated, the sums of squared loadings cannot be added to obtain a total
variance, but the four-factor solution accounts for 57% of the total variance allowing for tiie
extraction sums of squared loadings. Several of the factor intercorrelations are .30 or greater,
which justifies using the maximum likelihood extraction method with an oblique rotation.
Figure 6.14 Scree plots of EFA motives construct for English-speaking New Zealand tourist sample
6.14a 6.14b
Scree Plot
Factor Number Factor Number
Inspection of the pattem coefficients and factor intercon'elations for the final solution displayed in
Table 6.22, shows four interpretable cultural experience motive factors that are consistent with
some theoretical formulations. Three factors comprise largely psychologically-based items for
going to cultural experiences while travelling: factor one comprises three items consistent with
learning about local culture, factor three comprises six items that are hedonic-related, while factor
four has four items that are largely social recognition-related. The other factor of four items is
largely attribute-based and consumption-related whereby these tourists go to cultural attractions
261

Chapter 6: Factor Analysis Results
while tiravelling to go somewhere safe, get value for money, have a high quality experience and
consume refreshments at the cultural experience.
Table 6.22 EFA for the New Zealand tourist sample: Factor pattern coefficients for the four factors of cultural experience motives derived from oblique rotation
Questionnaire Item
1 go to cultural attractions and events while travelling...
3.11
3.12
3.13
3.27
3.28
3.29
3.31
3.1
3.2
3.5
3.3
3.19
3.7
3.25
3.21
3.26
3.20
to leam about local culture
to leam about local history
to leam about local perfomiing arts
to go somewhere safe
to get value for money
to have a high quality experience
to buy food and drinks to consume at the cultural experience
to have fun
to be entertained by otiiers
to have thrills and exdtement
to relax physically
to sati'sfy my curiosity
to do something 1 want to do
to gain tiie respect of others
to enhance my social position
to demonsb"ate my ability to travel
to tell my friends and relatives about it
Reliability Alpha
Factor intercon-elations
Factor 1: Local Culture Knowledge
Factor II: Safe and Good Value Consumption
Factor III: Hedonism
Factor IV: Sodal Recognition
Percentage of explained variance
Eigenvalue after rotation
Factors
1
.95
.91
.80
-.13
-.08
.27
.14
-.03
.01
-.08
-.11
.22
.06
.07
.02
-.04
.07
.91
.28
.36
.11
25.95
3.33
II
-.00
-.03
-.06
.80
.80
.51
.47
.02
-.06
-.08
.03
.19
.27
.09
-.02
.29
.21
.77
.38
.42
17.37
3.55
III
.02
-.01
-.00
.01
.08
.17
-.11
.85
.78
.69
.52
.48
.45
-.06
.12
-.02
.29
.83
.21
8.85
3.84
IV
-.10
.00
.15
.06
.04
-.06
.20
-.14
.01
.31
.15
-.18
-.03
.75
.69
.54
.35
.77
4.85
2.65
Note: Coeffidents exceeding an art)iti-ary cut-off loading of .35 are shown in bold type. A/ = 140 Exti-action Method: Maximum Likelihood; Rotation Metiiod: Oblimin vwtii Kaiser Nomialization; Rotation converged in 11 iterations
6.8.3 Exploratory Factor Analysis of Motive Dimensionality for the North American Tourist Sample
The EFA is conducted on the 31 items of the cultural experience motive scale using the North
American sample (N = 124) and undertaken in SPSS version 12.0 with the maximum likelihood
extraction method and an oblique rotation method (OBLIMIN). Initially eight factors are exti'acted
for cultural experience motives based on eigenvalues greater than 1.0, but four factors are specified
based on the scree plot (see Figure 6.15a) and are retained in the final model based on both
eigenvalues greater than 1.0 and the scree plot (see Figure 6.15b) with satisfactory factorial
structure.
Table 6.23 displays the pattern coefficients and the factor intercorrelations for the final solution
based on 17 items. Satisfactory factorial stmcture is achieved by removing 14 items based on
various criteria (see section 6.2) to respecify the factor model and a new factor solution is derived
after the removal of each item because maximum likelihood extraction is based on shared
262

Chapters: Factor Analysis Results
variance. Five items (3.14, 3.8, 3.22, 3.20 and 3.6) are removed to improve discriminant validity of
the factorial stixicture based on inspection of the pattern and structure matrices. Two items (3.9
and 3.28) are removed for communality values below the 0.2 threshold indicating that the variable
shares a low amount of variance with all the other variables. A further two items (3.29 and 3.17)
are removed for cross-loadings greater than .32 on several factors and an additional five items (3.1,
3.18, 3.31, 3.30 and 3.17) are removed so that all items retained have corrected item-to-total
con'elations greater than 0.5 as generally recommended (Hair et al., 2006). The internal reliability
coefficients for all of four factors are .81 or above which is above the commonly used threshold
value of .70 for acceptable reliability (Hair et al., 2006). Because the factors are correlated, the
sums of squared loadings cannot be added to obtain a total variance, but the four-factor solution
accounts for 57% of the total variance allowing for the extraction sums of squared loadings. At
least two factor intercorrelations are .30 or close to it, which justifies using the maximum likelihood
extraction method with an oblique rotation.
Figure 6.15 Scree plots of EFA motives construct for English-speaking North American tourist sample
6.15a 6.15b
1 2 3 4 S 6 14 15 16 17
Factor Number Factor Number
Inspection of the pattern coefficients and factor intercorrelations for the final solution displayed in
Table 6.23, shows four interpretable cultural experience motive factors that are consistent with
some theoretical formulations.
Two of the factors are based on eight of the 29 psycho-socio-physiologically-related items that were
identified from the literature as commonly found motives for attending cultural-related attractions
and events and these items comprise factors that are highly compatible with the literature:
hedonism (4 items) and social recognition (4 items). The other two factors include some attribute-
related items to different degrees. One eight-item factor. Local Culture and Knowledge, is
dominantiy local culture learning-related, but includes the partly attribute-based items of enjoying
something unique to the destination and meeting locals. The other two-item Famous Culture factor
is dominantiy attribute-based with the motives for going to cultural experiences while travelling
being to hear famous performers/entertainers and to see famous shows performed.
263

Chapter 6: Factor Analysis Results
Table 6.23 EFA on the North American tourist sample: Factor pattern coefficients for the four factors of cultural experience motives derived from oblique rotation
Questionnaire Item
I go to cultural attractions and events while travelling... Factors
1
.96
.72
.67
.65
.58
.57
.57
.54
-.03
-.04
.01
.17
.03
-.02
.06
-.09
.07
II
-.01
-.11
-.09
.07
-.04
.10
.20
.08
.95
.82
.64
.47
.10
.08
-.02
..13
.00
III
.07
.18
.20
-.04
-.11
-.19
-.05
-.07
.-.09
.04
.14
.04
.85
.84
-.05
.08
.16
IV
-.10
.05
-.17
.09
.21
.06
-.16
.14
.02
.06
-.07
.13
.10
.08
.81
.74
.70
3.11 to leam about local culture
3.13 to leam about local performing arts
3.12 to leam about local history
3.15 to enjoy sometiiing unique to tiie destination
3.10 to meet locals
3.19 to satisfy my curiosity
3.7 to do something I want to do
3.16 to have a change fl-om my daily routine
3.4 to relax mentally
3.3 to relax physically
3.2 to be entertained by others
3.5 to have tiirills and excitement
3.23 to hear famous perfonners/entertainers
3.24 to see famous shows perfonned
3.26 to demonsti-ate my ability to ti-avel
3.21 to enhance my sodal position
3.25 to gain ttie respect of others
Reliability Alpha .86 .82 .87 .81
Factor intercon-elations
Fador I: Local Culture Knowledge and Novelty
Factor II: Hedonism
Fador III: Famous Culture
Fador IV: Sodal Recognition
.28
.07
.18
27.16
401
.15
.30
13.21
3.06
.09
8.71
1.82
8.28
2.40
Percentage of explained variance
Eigenvalue after rotation
Note: Coefficients exceeding an artDitrary cut-off loading of .47 are shown in bold type. A/ = 124 Exti-action Metiiod: Maximum Likelihood; Rotation Metiiod: Oblimin witii Kaiser Nonnalization; Rotation converged in 6 iterations
6.8.4 Exploratory Factor Analysis of Motive Dimensionality for the United Kingdom and Ireland Tourist Sample
The EFA is conducted on the 31 items of the cultural experience motive scale using the UK and
Ireland sample (N = 141) and undertaken in SPSS version 12.0 with the maximum likelihood
extraction method and an oblique rotation method (OBLIMIN). Initially eight factors are extracted
for cultural experience motives based on eigenvalues greater than 1.0, but five factors are specified
based on the scree plot (see Figure 6.16a) that are further reduced to a final model of three factors
based on both eigenvalues greater than 1.0 and the scree plot (see Figure 6.16b) with satisfactory
factorial stmcture.
264

Chapter 6: Factor Analysis Results
Figure 6.16 Scree plots of EFA motives construct for English-speaking UK and Ireland tourist sample
6.16a 6.16b
3 3 4 S 6 7 B 9
Factor Number Factor Number
Table 6.24 displays the pattern coefficients and the factor intercorrelations for the final solution
based on 14 items. Satisfactory factorial structure is achieved by removing 17 items based on
various criteria (see section 6.2) to respecify the factor model and a new factor solution is derived
after the removal of each item because maximum likelihood extraction is based on shared
variance. Three items (3.8, 3.9 and 3.14) are removed for communality values below the 0.2
threshold indicating that the variable shares a low amount of variance with all the other variables.
Four factors are specified based on the scree plot and a further two items are removed for low
communality values below the 0.2 threshold (3.13 and 3.6). Four items (3.5, 3.1, 3.7, and 3.10) are
removed to improve discriminant validity of the factorial structure based on inspection of the pattern
and structure matrices. Three factors are tiien specified based on the scree plot and a further two
factors are removed: one to improve discriminant validity (3.23) and the other for communality
below the minimum threshold (3.24). Internal reliability of each dimension is then calculated using
Cronbach alpha coefficients. While the coefficients for all three factors are above the commonly
used threshold value of .70 for acceptable reliability (Hair et al., 2006), two further items (3.22 and
3.21) are eliminated so that all items retained have corrected item-to-total correlations greater than
0.5 as generally recommended (Hair et al., 2006). A further two items are removed for discriminant
validity reasons (3.3 and 3.17) and three factors are specified based on the scree plot (Figure
3.16b) after the removal of these items. Item 3.28 is then removed for cross-loading on all factors
and the internal reliability coefficients are recalculated for the 15 items with one further item (3.2)
removed so that items retained have corrected item-to-total comelations greater than 0.5. The
Cronbach alpha coefficients for all three factors are .82 or above which is above the commonly
used threshold value of .70 for acceptable reliability (Hair et al., 2006). Because the factors are
correlated, the sums of squared loadings cannot be added to obtain a total variance, but the three-
factor solution accounts for 56 percent of the total variance allowing for the extraction sums of
265

Chapter 6: Factor Analysis Results
squared loadings. Several of the factor intercorrelations are .30 or greater, which justifies using the
maximum likelihood exti-action method with an oblique rotation.
Inspection of the pattem coefficients and factor intercorrelations for the final solution displayed in
Table 6.24, shows three interpretable cultural experience motive factors that are consistent with
some theoretical formulations. The three factors are largely based on psycho-socio-physiologically-
related items that were identified from the literature as commonly found motives for attending
cultural-related attractions and events. One factor of two items is entirely local culture and history
learning-related. The other two factors each comprise six items respectively, one largely social
recognition-related but including the attribute-based item of going to cultural experiences while
travelling to buy goods and souvenirs, and the other is largely escape- and novelty-related,
although it includes two attribute-related items of seeking a high quality experience and enjoying
something unique to the destination.
Table 6.24 EFA on the United Kingdom and Ireland tourist sample: Factor pattern coefficients for the three factors of cultural experience motives derived from oblique rotation
Questionnaire Item Factors I go to cultural attractions and events while travelling ...
3.12 to leam about local history
3.11 to leam about local culture
3.25 to gain tiie resped of otiiers
3.21 to enhance my sodal position
3.26 to demonstiBte my ability to travel
3.27 to go somewhere safe
3.30 to buy goods and souvenirs
3.20 to tell my friends and relatives about It
3.16 to have a change from my daily routine
3.18 to escape into another worid
3.19 to satisfy my curiosify
3.15 to enjoy sometiiing unique to ttie destination
3.29 to have a high quality experience
3.4 to relax mentally
Reliability Alpha .92 .85 .82
Fador intercon-elations
Fador 1: Local Culture Knowledge
Fador II: Social Recognition, Consumption and Safety .09
Fador III: Escape and Novelty 45 J2
Percentage of explained variance . 27.27 19.71 9.32
Eigenvalue after rotation 2.78 3.41 3.77
Note: Coeffidents exceeding an artaiti ry cut-off loading of .42 are shown in bold type. W = 141
Extiaction Metiiod: Maximum Likelihood; Rotation Metiiod: Oblimin witti Kaiser Nonnalization; Rotation converged in 6 iterations
6.9 Chapter Summary
Confirmatory factor analysis of the cultural experience motivational process constructs to test for
cultural differences is used in this chapter. This is an appropriate test given a lack of cross-cultural
tourist motivational research despite the cross-cultural nature of international tourism noted in the
literature (Reisinger, 2005), and an appropriate method considering extensive theoretical
266
1
.95
.85
.08
.03
.06
-.01
-.12
.11
-.05
-.15
.12
.25
.18
.24
It
.03
.07
.87
.80
.77
.63
.50
.49
.02
.12
-.04
-.19
.14
.07
III
.01
.07
-.13
-.20
.09
.27
.10
.21
.77
.70
.69
.58
.56
.42

Chapter 6: Factor Analysis Results
fomnulations arguing the global hypothesis that Asian consumer behaviour is distinctively different
from Western consumer behaviour and therefore these cultural differences call for different
marketing strategies. The specific hypotheses tested in this chapter regarding the dimensionality of
the cultural experience motivational process constiructs of attitudes, motives, benefits sought and
benefits gained are threefold: (i) that they would be different for Western and Asian tourists, (ii) not
different for four groups of English-speaking Westem tourists and (iii) different for two groups of
Asian tourists, namely Chinese-speaking and Japanese-speaking.
The findings do not support the first hypothesis for cultural experience attitudes, motives and
benefits sought dimensionality, but support it for the benefits gained construct. The second
hypothesis is supported for all constructs except motives where differences are found for different
groups of English-speaking Western tourists. The third hypothesis can only be tested for tiie first
three constmcts in the cultural experience motivational process due to sample sizes, but these
findings do not support the hypothesis of differences between different language cultural groups of
Asian tourists for cultural experience attitudes, motives and benefits sought.
Dimensionality derived for cultural experience attitudes comprises four factors that are validated for
Western and Asian tourists as well as for different cultural groups of both Western and Asian
tourists: a liking for art, culture and history; traditional performing arts; famous culture; and positive
word-of-mouth cultural experiences. Dimensionality derived for cultural experience motives
comprises four factors that are validated for Western and Asian tourists as well as for different
cultural groups of Asian tourists, but found to be not equivalent for different cultural groups of
Western tourists: novelty, social consumption, learning local culture, and relaxation. Dimensionality
for cultural experience benefits sought comprises four factors that are validated for Western and
Asian tourists as well as for different cultural groups of both Western and Asian tourists:
edutainment, signs and facilities, refreshments, and relaxation. Dimensionality for cultural
experience benefits gained comprises three factors that are validated for different groups of
Westem tourists, with only the first two factors validated for Asian tourists: eduhedonism,
refreshments, and own language information.
While there are theoretical formulations for most of these dimensions as discussed in sections
6.4.2, 6.5.2, 6.6.2 and 6.7.2, there are unique interrelations between them as noted from this study.
Positive word-of-mouth has an important role in the cultural experience motivational process, not
only as a separate attitude dimension whereby there was an expressed liking for going to cultural
experiences that have been recommended by others and that friends and family have done, and
an important item within the motive dimension of social consumption, but benefits gained from the
cultural experience have behavioural outcomes of relevance to the likelihood of recommending the
experience to others. Relaxation (mentally and physically) is a separate motive dimension and a
benefits sought dimension, but only mental relaxation is gained from cultural experiences as a part
of the eduhedonism dimension. Ancillary consumerables such as consuming refreshments on-site
are an important part of the cultural experience. Social consumption is one of the four motives for
267

Chapter 6: Factor Analysis Results
attending cultural experiences while ti^aveling, and refreshments are a separate benefit dimension
that is both sought and gained from cultural experiences. Another major finding is that cultural
experiences offer a unique combination of education and entertainment, edutainment, and also
uniquely combine education with emotionally-involving consumption experiences, eduhedonism,
which are benefits both sought and gained by tourists. These and other dimensions found in this
study for the cultural experience motivational process further combine utilitarian, attribute-based
dimensions as well as psychologically-based dimensions and this finding contrasts with the trend in
the literature emphasizing a conceptual shift away from activities and amenities and towards
experiential and psychological outcomes (Tian et al., 1996). Consumers in the twenty-first centijry
consume experiences as a complex package of tangible and intangible elements.
These findings have mari<eting implications that have been raised in this chapter and will be further
discussed in the next chapter. The lack of differences between Western and Asian tourists and
between Chinese-speaking and Japanese Asian tourists, have market segmentation implications
and highlights the existence of some global market segments across cultures that are also
distinguishable market segments within their respective cultural groups. For example, the sample
of Asian tourists inten/iewed in this study by purposeful convenience quota sampling at a major
tourist attraction are an identifiable and attractive market segment characterized by demographic,
travel and trip characteristics, and cultural experience motivational dimensions, but they cannot be
considered representative of all tourists from China and Japan. Considering that all the tourists in
this study were sampled at a major tourist attraction rather than at cultural venues per se, the
findings are very encouraging for cultural attractions and also for destinations such as Melboume
positioning themselves as cultural capitals, because they indicate a liking for particular types of
cultural experiences by all six tourist markets of interest to this study. The other dimensions
identified for each of the motivational process constructs have extensive marketing implications,
especially in terms of market segmentation, product development, branding, programming and
packaging, communication campaigns and strategies. In addition, benefits gained as the
behavioural outcome construct in the cultural experience motivational process have implications for
future behaviour such as the likelihood to revisit and to recommend the experience to others. The
importance of the latter for cultural experiences has been noted in the literature and validated in this
study's findings as important to the constructs of attitudes and motives towards cultural experiences
that occur in the eariy stages of the motivational process.
268

Chapter 7: Conclusions
Chapter 7 Conclusions
7.1 Introduction
In this study, a body of tourist motivation literature was systematically reviewed and research gaps
for the study of tourist cultural experience motivation were identified. These findings directed the
focus of this study that investigated the nature of the cultijral experience motivational process for
tourists. Overviews of the literature of specific relevance to the motivational process consti'ucts of
personal attitijdes, motives, benefits sought and benefits gained were provided in Chapter Two. A
conceptual framework model was developed in Chapter Three that drew these areas of research
together within the context of tourists' motivational process for attending cultural experiences.
Having outlined the research methodology for testing the hypothesised conceptual model for the
constructs of relevance to tourists' motivational process for cultural experiences and their
dimensionality in Chapter Four, the results were presented and discussed in Chapters Five and
Six. This chapter presents the conclusions that are drawn from this study.
In the introductory chapters of this thesis, the background and need for this study were established
whereby many destinations are positioned and marketed as 'cultural and event capitals' yet little is
known about tourists' motivational processes for attending cultural experiences, especially the more
temporal performances, festivals and events. From the cultural providers' perspective, tourist
markets represent new audiences. Existent research on cultural tourists has largely focused on
identifying cultural tourists per se by their attendance at particular cultural experiences and
understanding their motivations in a situational context. Furthermore, cross-cultural research of
tourists' attitudes and motivations is lacking despite the cross-cultural nature of international tourism
(Reisinger, 2005).
The present study addresses these gaps by focusing on the potential of major tourist markets firom
Western and Asian cultures as new audiences for various cultural experiences. It recognises that
consumer motivation is a complex process involving attitudes, motives and expected benefits
sought from the cultural experience and the related behavioural outcome of benefits gained.
Developing generic models and parsimonious scales for measuring these motivational process
constructs and their underiying dimensionality, testing them for cultural group invariance and
considering the marketing implications, are the new contributions of this study to the understanding
of tourists' motivational processes for cultural experiences.
In the literature review and research methods chapters, the absence of suitable, pre-validated,
generic scales for measuring tiie motivational constructs and their dimensionality in a cultural
experience context are acknowledged and an extensive literature review was undertaken.
Instrument development was therefore necessary and implemented in a thorough manner with
particular attention to various cross-cultural research methodology problems such as ensuring that
it was culturally sensitive and demonstrated cultural equivalence and scalar measurement
269

Chapter 7: Conclusions
equivalence for the three cultural language groups of interest to this study: English-speaking
Western tourists, Chinese-speaking or Japanese-speaking tourists from Asia. Despite confusion in
the motivation literature with divergent research approaches and the constructs often used
interchangeably, three multi-item measurement scales were developed to measure the four
motivational process constructs of attitudes, motives, benefits sought and benefits gained, all
incorporating utilitarian-based items in recognition of Haley's (1968) seminal work as well as the
more recentiy favoured psychologically-based items (Tian et al., 1996). These items also tested the
push/pull dimension approach to tourist motivation emphasised in Crompton's (1979) seminal study
of motivations for pleasure travel which identified seven socio-psychological domains: two 'pull'
dimensions (novelty and educational/intellectual fulfilment) and five 'push' dimensions (rest and
relaxation, prestige/status, socialization, social kinship, and regression). The three motivational
process constructs of motives, benefits sought and benefits gained, also included hedonic-related
items because of their fundamental relevance to aesthetic products (Hirschman and Holbrook,
1982; Holbrook and Hirschman, 1982) which are the context for this study and it was hypothesised
that hedonic-based underiying dimension(s) would be found. Two other types of underlying
dimensions were also hypothesised for these constructs based on the conceptual approach to
leisure and tourism motivation of Iso-Ahola (1982; 1989) who theorised a dichotomy of tourist
intrinsic motives based on seeking and avoidance/escape motives.
A large dataset was needed to undertake the statistical analysis associated with testing the four
constiucts for the six major tourist markets idenfrfied as sampling populations for this study: four
Western cultures represented by English-speaking tourists fi'om North America, New Zealand,
United Kingdom and Ireland, Australia (interstate); and two Asian cultures represented by
Japanese tourists and Chinese-speaking tourists from any Asian countries. A popular tourist
attraction was needed as the sampling site and the Queen Victoria Market (QVM) in the Melboume
CBD proved ideal with 961 usable sun/eys obtained from on-site data collection between
December 2005 and February 2006 using a stmctured questionnaire administered by bilingual data
collectors fiuent in English and Chinese or Japanese.
The data was examined in SPSS 12.0 to determine sample characteristics, data nomnality and
factorability and one distinguishing feature of the data sample was the predominance of
independent tourists compared with tourists on tour groups for the overall sample (90% cf 4%) as
well as for all six subsamples: domestic (92% cf 4%) New Zealand (96% cf 2%), North American
(87% cf 9%), UK and Ireland (92% cf 4%), Asian Chinese-speaking, (94% cf 3%) and Asian
Japanese-speaking(75% cf 5%).
To develop the construct models, determine dimensionality, and test for cultural group differences,
a two-stage exploration and validation procedure on randomly split samples (Anderson and
Gerbing, 1988) was undertaken using Maximum Likelihood extraction and Oblimin rotation in the
exploratory factor analysis, followed by confirmatory factor analysis in AMOS 5.0 with invariance
270

Chapter 7: Conclusions
testing for Western cultural group differences. The model fit and invariance of the Asian data were
then tested.
In section 7.2, conclusions that stem from the analysis of the body of literature relating to the tourist
motivational process and this study's research of tourists' motivational process for cultural
experiences are discussed. Conclusions drawn in relation to the dimensionality of cultural
experience motivation constructs tested in the hypothesised models and the concepts within these
models are also presented in this section. For attitudes and motives consti'ucts this research is a
generic study of tourist's attitudes towards attending cultural experiences in general and their
motives for attending (or not attending) cultural experiences while on holiday. For the benefits
sought and gained constructs of the cultural experiences motivational process, this research is a
case study of tourists' experiences at a single destination, but these findings are also worthy of
consideration within the broader context of other tourists' motivational process for cultijral
experiences because they focus on generic benefits (sought and gained) by tourists at any cultural
experience. Marketing implications and other related managerial considerations of the findings of
this research are presented in section 7.3. Limitations of this research on tourists' cultural
experiences motivational process and the constmcts of personal attitudes, motives, benefits sought
and benefits gained are presented in 7.4 and their implications for future research are also
considered in this section. Recommendations for future research are suggested in Section 7.5.
7.2 Conclusions from this Study of Cultural Experience Motivation for
Tourists and its Dimensionality
The salient constructs of attitudes, motives, benefits sought and benefits gained within the
motivational process for cultural experiences are reduced to a small set of dimensions that support
the first three hypotheses of this study (HI, H2 and H3) whereby the underiying dimensions of the
attitudes construct, primarily include cultural experiences and psycho-socio-physiologically-related
outcomes, while for the motives, benefits sought and benefits gained constmcts, they primarily
include hedonic, seeking and escaping related dimensions. Furthermore, some of these underlying
dimensions are attribute-based and others are psychologically-based, socio-psychologically-based
or psycho-socio-physiologically-based. Dimensions relevant to more than one construct are
identified, indicating construct inter-relationships. For the hypotheses claiming that the motivational
process will differ by culture (H4), although significant differences were hypothesised between
Western and Asian cultures (H4a), and within the two Asian cultural groups (H4c), these were not
supported, revealing an unexpected breaking down of the previously identified cultural divide
between Western and Asian cultures that will be discussed in the next section and the new finding
of a global market segment of independentiy travelling tourists with similar motivational processes
for cultural experiences, the marketing implications for which will be discussed in Section 7.3. The
four Westem cultural groups have similar attitudes and benefits as predicted in Hypothesis 4b, but
differing motives whereby H4b is not supported for the motives construct within the cultural
271

Chapter 7: Conclusions
experience motivational process for the Western tourists. This latter finding is extremely interesting
as it has not been found before and is discussed further in section 7.2.3.
7J2.1 Breaking Down of the Cultural Divide Between the West and the East
The unexpected finding of this study is its lack of support for the previously identified great cultural
divide between Western and Asian consumer behaviour in general (Schutte and Ciariante, 1998),
in tourism sen/ices contexts between hosts and guests (Reisinger and Turner, 1998a, 1998b,
2002a, 2002b; Turner et al., 2001), and in one study of tourist cultural festival motivations in an
Asian setting (Lee, 2000). Rattier this study found more differences between English-speaking
Western cultures than between Western and Asian cultures or amongst different Asian cultures. As
summarised in Tables 7.1, 7.2 and 7.3, there were no significant differences found for the
underiying dimensions between West and East cultural language groups, with the exception of one
benefits gained dimension. This will be further discussed in the next section on the findings of this
stijdy compared with the first three hypotheses of this study (HI, H2 and H3) regarding the nature
of the underiying dimensions for the four motivational process constixicts. The measurement
models identifying the underiying dimensions or factors for each of the four motivational process
constructs were firstly developed with the total Western tourist sample, then tested with the total
Asian tourist sample data.
Table 7.1 Summary of motivational process construct items, factors and invariance testing
Attitudes
Motives
Benefits Sought
Benefits Gained
Items
In ttie Scale
29
31
28
28
EFA
Items
22
19
21
24
Factors
4
4
4
3
Westem Tourists
(English-speaking)
CFA
Items
10
12
13
10
Factors
4
4
4
3
Invariance
Testing
invarianf
not invariant
invariant
invariant''
Asian Tourists
(Chinese- or Japanese-speaking)
CFA
Items
10
9
10
6
Factors
4
4
4
2
Invariance
Testing
invariant"
invariant""
invariant"
Insufficient sample sizes for testing differences in Asian cxjltural language groups
' Invariance testing of 4 English-speaking Westem Tourist groups: Domestic, NZ, Nortii American, UK and Ireland
Invariance testing of 2 English-speaking Westem Tourist groups: Domestic, Intemational
"Invariance testing of 2 Asian Tourist groups: Chinese-speaking and Japanese-speaking
Table 7.1 highlights that the number of factors is the same for the Western tourists and the Asian
tourists with the one benefits gained constmct dimension exception, which means hypothesis 4a,
that there is a significant difference between Western and Asian tourists for each of the four cultural
experiences motivational process consti'ucts of attitudes, motives, benefits sought and benefits
gained, is not supported. Table 7.1 further highlights the findings of the invariance testing of the
constmct models for each of the four motivational process constructs associated with testing H4b
and H4c. The invariant results for the Western tourists in three of the four tests, support H4b for
attitudes, benefits sought and benefits gained but provide the new insight that there are significant
differences between Western tourists in relation to cultural experience motives. The invariant
272

Chapter 7: Conclusions
results for the three tests that could be undertaken for the Asian tourists, surprisingly reveal tfiat
H4c is not supported for attitudes, motives or benefits sought whereby there would be significant
differences between different cultural groups of international tourists from Asia, namely, Chinese-
speaking, and Japanese-speaking. Insufficient sample sizes prevented the testing of H4c for the
benefits gained constiuct.
Table 7.2 Summary confirmatory factor analysis dimensions for Western Tourist (English-speaking) validation sample
Attitudes
Art, Culture & History (4)*
Traditional Performing Arts (3)
Famous Cultijre (2)
Positive W-O-M and Social lnteraction{4)
Motives
Novelty (2)
Social Consumption (4)
Local Culture Knowledge (3)
Relaxation (3)
Benefits Sought
Edutainment (6)
Signage & Facilities (3)
Refreshments (2)
Relaxation (2)
Benefits Gained
Eduhedonism (4)
Own Language Infomnation (2)
Refreshments (2)
NB: 0* number in brackets refers to number of items comprising tiie dimension
Table 7.3 Summary confirmatory factor analysis dimensions for Asian Tourist (Chinese- and Japanese-speaking) samples
Attitudes
Art, Culture & History (4)*
Traditional Perfomiing Arts (3)
Famous Culture (2)
Positive W-O-M and Social lnteraction(4)
Motives
Novelty (2)
Social Consumption (3)
Local Culture Knowledge 2)
Relaxation (2)
Benefits Sought
Eduhedonism (4)
Signage & Facilities (2)
Refreshments (2)
Relaxation (2)
Benefits Gained
Eduhedonism (4)
Refreshments (2)
NB: 0* number In brackets refers to number of items comprising tiie dimension
Cultural differences between the Western and Asian tourists are not found in this study and this
was unexpected based on the body of previous literature considered in the literature review where
the cultural divide has been supported for consumer behaviour in general (e.g., Schutte and
Ciariante, 1998) and for tourists' satisfaction with hotels-based service quality and reaction to
service personnel (e.g., Reisinger and Turner, 1998a; Reisinger and Turner, 1998b, 2002a, 2002b;
Turner et al., 2001). The unexpected finding in this study, suggests the issue is unique to the
context of understanding tourist motivation in relation to attending cultural experiences such as
cultural attractions and events. Another possible explanation could be that the cultural divide
between Western and Asian cultures is breaking down rapidly and tourism is contributing to this by
giving Westerners a greater understanding of Asian culture and vice versa. Some supporting
evidence for this, especially from the Asian tourist's perspective, is provided in this study by the
previously noted high proportions within this study's sample of repeat visitors to Melboume as a
destination and the QVM as an attraction at the destination indicating a familiarity of the Asian
tourists with Western culture and a satisfaction with their previous visits and experiences (see
section 5.4.1). Repeat tourism is a woridwide phenomenon and is a widely acknowledged
important goal of the marketing function for many destinations, attractions, and events (Kotier et al.,
2006). Another conti'ibuting factor in this study is that the sample may have been distinct in some
273

Chapter 7: Conclusions
ways. Although sampled onsite at the popular QVM attraction using purposeful convenience
sampling to achieve quotas in tiie six different cultural groups being studied, the proportion of the
sample staying in 3-star accommodation or higher, is a significantiy greater proportion of the
sample than for tourists in general to Australia and Melbourne (see section 5.4) which may be due
to the CBD location of QVB. This accommodation characteristic implies that the sample may also
have been distinct in other ways with a stronger predominance of people with high income levels
and high education levels (two socio-demographics that are not directiy measured in this study).
7.22 The Cultural Experience Motivational Process Construct Dimensions
This study posits that Western and Asian tourists' motivation is a complex process involving and
influenced by their enthusiasm towards different types of experiences and what these experiences
offer as well as the motives that drive tourists to attend, and the expectations they form in
anticipation of the cultural experience. The findings infonn marketing strategies for attracting
independentiy travelling tourists from major Western and Asian markets to cultural experiences that
are complex packages of elements.
The overall research hypotheses relating to the underlying dimensions of the motivational process
constmcts claimed that the attitudes construct would primarily include cultural experience and
psycho-socio-physiological outcome related dimensions, while for the motives, benefits sought and
benefits gained constmcts, they would primarily include hedonic, seeking, and escaping-related
dimensions (HI, H2 and H3). The findings from the descriptive analysis of individual items
measuring each construct (Chapter 5), the exploratory and confirmatory factor analyses of the
dimension structure and composition (Chapter 6), and the further exploratory factor analysis of the
motives construct for English-speaking Western tourists (discussed in the next section), strongly
support these hypotheses relating to the types and character of underiying dimensions of the
cultural experience motivational process constructs for tourists. Unexpected differences were found
for the cultural experience motivational process by ethnic cultural group, but these differences are
the focus of separate Hypothesis 4 (H4a, b, and c), that is discussed in the sections preceding and
following this section.
Table 7.2 summarises the confirmatory factor analysis dimensions found for the English-speaking
Western tourist validation sample and Table 7.3 highlights the similarity of dimensions found when
the construct measurement models were tested for model fit with the Asian data sample. These
findings support the first three hypotheses of this study (HI, H2 and H3) in relation to the underiying
dimensions of the salient constiucts of attitudes, motives, benefits sought and benefits gained
within the motivational process for cultural experiences whereby the underiying dimensions of the
attitudes constmct, primarily include cultural experiences and psycho-socio-physiologically-related
outcomes, while for the motives, benefits sought and benefits gained constructs, they primarily
include hedonic and seeking related dimensions. Only the escape-related dimensions for the
motives, benefits sought and benefits gained constmcts in the overall measurement models of this
274

Chapter 7: Conclusions
shjdy are not supported by the findings, indicating only partial support for Iso-Ahola's general
leisure motivation theory (1982; 1989) tiiat leisure motivation primarily involves seeking-related,
intirinsic reward motivations and escape-related motivations. Some caution needs to be taken
tiiough before interpreting the absence of escape-related dimensions found for the overall
measurement models of this study as applicable across all motivational process constructs for all
cultural groups. As discussed in the next section of this chapter, cultural differences for the motives
constmct were found for English-speaking Westem tourists and further exploratory analysis of the
motives constmct for each of tiie four Western tourist subsamples found escape to be an
underiying motive dimension for domestic Austi-alian tourists and tourists from the UK and Ireland.
The hedonic-related dimensions for the motives, benefits sought and benefits gained consti'ucts
furtiier supports Hirschman and Holbrook's hedonic and experiential consumption theory
(Hirschman and Holbrook, 1982; Holbrook and Hirschman, 1982) as being particulariy applicable to
aesthetic product.
Furthennore, some of these underiying dimensions are attribute-based in stark contrast to others
that are largely psycho-socio-physiologically-based. More attribute-based dimensions are found for
the benefits sought and benefits gained constructs re-affirming Haley's (1968) eariy benefits
research with its emphasis on attribute-based dimensions but the existence of emphasis on largely
psycho-socio-physiologically-based dimensions also partially supports the more recent claim that
the operationallsation of benefits research is experiencing a conceptual shift away from activities
and amenities and toward experiential and psychological outcomes (Tian et al., 1996). Some are a
mixture of both, such as the motive dimension of social consumption which mixes the consumption
of refreshments at the cultural experience as an opportunity for social interaction, a finding recently
identified in an exploratory qualitative study of services sought at cultural attractions of relevance to
arts marketing (Geissler et al., 2006).
Dimensions relevant to more than one constmct within the motivational process model are also
identifable in Tables 7.2 and 7.3, suggesting constmct inter-relationships. For example, a liking for
social interaction is identified within an attitude dimension associated with going to cultural
experiences, and a motive dimension. Two motive dimensions of novelty and local cultural
knowledge carry through the motivational process as a combined hedonic- and education-related
benefits sought dimension, edutainment for Westerners and eduhedonism for Asians, that then
becomes a combined hedonic- and education-related benefits gained dimension. The hedonic-
related motive of relaxation also carries through the motivational process as an expected benefits
sought from the experience, but is not found as a benefit gained from the experience. The concern
expressed in Chapter Five from the analysis of mean scores for individual construct measurement
items, that QVM experience (benefits sought and benefits gained) differed from the expressed
motives for attending cultural experiences, suggesting that the QVM experience was different to
cultural experiences for most respondents, was not found to be the case in either the exploratory
factor analysis or the confirmatory factor analysis. These noted inter-relationships across consti'ucts
from the EFA and CFA confirm that the QVM experience can be considered a type of cultural
275

Chapter 7: Conclusions
experience. At the minimum they suggest that attitudes and motives driving tourists to attend
cultural experiences were of relevance to the benefits sought and some of the benefits gained from
the QVM experience.
These last two examples of consti'uct inter-relationships spanning both benefits sought and benefits
gained are also examples of where satisfaction/dissatisfaction with the experience can be inferred
from comparing the differences between benefits sought and benefits gained dimensions. Western
and Asian tourists are satisfied with their edutainment/eduhedonism benefits from the QVM
experience and the attribute-based refreshments benefits, but their relaxation expectations are not
achieved and other attributes of signage and facilities could be improved for Westemers. The one
significant difference found for the underiying dimensions between Western and Asian cultural
language groups is 'own language information' which was identified in the benefits gained
confinnatory analysis model developed with Western tourist sample dataset, but was removed in
the respecified model for the Asian tourist sample dataset. Considering that the QVM does not
provide signs or other information in languages other than English, but both Western and Asian
cultural groups expect signs and facilities as an underiying benefits sought dimension, this finding is
not surprising and indicates an area where dissatisfaction can be inferred for the Chinese- and
Japanese-speaking tourists. These satisfaction/dissatisfaction findings have marketing implications
that are further discussed in section 7.3.
7.2.3 Differences in Westem Tourist Cultural Experience Motives Dimensions
The lack of invariance found in the cultural experience motive construct dimensionality for the
English-speaking Western tourists, required exploratory factor analysis to be undertaken for each of
the four different cultural groups of Western tourists, particularly as the expectation was that the
samples would interpret the items using identical frames of reference (Huriey et al., 1997). This
further research for the English-speaking Western tourists and the motives constmct explores the
cultural differences within the different groups of Western tourists for construct dimensionality
structure overall and differences in the importance of individual variables within the factors. It
provides extremely interesting findings that have not been found before and are summarised in
Table 7.4.
Table 7.4 Summary exploratory factor analysis motive dimensions for Western Tourist (English-speaking) subsamples found to be not invariant in the motive construct CFA
Motives
Domestic Tourists
Local Cultijre Knowledge (6)
Escape and Novelty (6)
Social Recognition (2)
Hedonism (7)
Good Value Consumption .(7)
New Zealand Tourists
Local Culture Knowledge (3)
Safe and Good Value Consumption (4)
Hedonism (6)
Social Recognition (4)
North American Tourists
Local Culture Knowledge and Novelty (8)
Hedonism (4)
Famous Cultijre (2)
Socaal Recognition (4)
UK and Ireland Tourists
Local Culture Knowledge (2)
Sodal Recognition, Consumption and Safety (6)
Escape and Novelty (6)
276

Chapter 7: Conclusions
NB: 0* number in brackets refers to number of items comprising ttie dimension
All four groups share a motivation for going to cultural experiences for the seeking-related
dimensions which supports Iso-Ahola's general leisure motivation theory (1982; 1989). The specific
dimensions sought by all four groups of Westem tourists from cultural experiences are acquiring
local culture knowledge. Another seeking-related motivation sought from cultural experiences is
hedonic-related experiences, excepting those from the UK and Ireland. This emphasis on hedonic-
related experiences from attending cultural experiences further supports Hirschman and Holbrook's
hedonic and experiential consumption theory (Hirschman and Holbrook, 1982; Holbrook and
Hirschman, 1982) as being particulariy applicable to aesthetic product. Only two groups of Westem
tourists exhibit escape-related dimensions in support of the other part of Iso-Ahola's general leisure
motivation theory (1982; 1989). Australian domestic tourists and tourists from the UK and Ireland
exhibit escape-related dimensions from attending cultural experiences. One other finding that is
applicable to all four groups is the presence of a social recognition-related dimension. This finding is
of particular interest because eariier analysis of individual measurement items by mean scores
within the motivational process constructs discussed in Chapter Five, found that social recognition
was a psycho-sociologically-based motive that in this study for the total sample is not positively
associated as a motive for going to cultural attractions and events while travelling, with all three
items scoring as the three lowest motive items and marginally below the 3.5 midway neutral point
on the 6-point measurement scale. Enhancing social position, however, is an important item within
the social consumption dimension of the measurement model for the underiying motives
dimensions developed in the exploratory and confirmatory factor analyses for the Western tourists
and then reconfirmed with the Asian tourist dataset, confirming its relevance as a cultural
experience motive for both of these cultural language groups. So the presence of a social
recognition-related dimension in the exploratory factor analysis of the motives constmct for all four
English-speaking Western tourist subsamples, further reaffirms its relevance as a motive for
Western tourists to attend cultural experiences.
In addition to these broad findings in common to all or several of the four English-speaking Western
tourist motives for attending cultural experiences while on holiday, the exploratory factor analysis
findings for the underiying dimensions of the motives constmct also exhibit some cultural group
differences. Seeking local cultural knowledge, hedonism and social recognition is common to the
domestic tourists. New Zealanders and the North Americans. In addition, the North Americans are
interested in novelty and famous culture, a combination that could be summarised as a driving
motive for 'must do' cultural experiences. The New Zealanders' additional dimension is safe and
good value consumption which suggests they are less adventurous than the North Americans and
the domestic Australian tourists, and more thrifty tourists than the other Westem cultural groups
excepting the domestic Australian tourists. Both the New Zealanders and the North Americans are
less escapist as tourists than the domestic Australian tourists and the tourists from the United
Kingdom and Ireland. Tourists from the UK and Ireland are not as hedonistic, seek safety in
common with the New Zealanders and escape and novelty in common with the domestic Australian
277

Chapter 7: Conclusions
tourists, but otherwise seek the commonly found motives of local cultural knowledge and social
recognition (albeit combined witii safety). Domestic Austi'alian tourists are more hedonistic than the
New Zealanders and the Nortii Americans based on number of hedonistic-related items comprising
tiie dimension. OthenA/ise they seek escape and novelty in common with the tourists from UK and
Ireland, good value consumption in common with the New Zealanders, social recognition and local
cultural knowledge in common with all other Westem cultural groups.
7.3 Marketing Implications
Overall, this study finds strong positive agreement by all six tourist populations studied towards
attending cultural attractions and events. This is an encouraging outcome as it highlights the
potential of tourist markets from diverse cultural backgrounds. Some findings of this study that are
contrary to existing research or new contributions to the understanding of tourists' motivational
process for attending cultural attractions and events, have multiple marketing implications. Firstiy,
the absence of cultural group differences between Western and Asian tourists in the motivational
process constructs and their underiying dimensions, is contrary to the differences found in much
consumer behaviour, tourism and hospitality literature. The similarity in underiying dimensions of
attitudes, motives, benefits sought and benefits gained for Western and Asian tourists highlights a
global mari<et segment of independentiy travelling tourists with similar motivational processes for
cultural experiences. In the eariy stages of the motivational process, marketing communication
campaigns and activities, in particular, have an important role to play in converting positive attitudes
and motives for attending cultural experiences into actual attendances. However, the presence of
cultural group differences for different groups of English-speaking, Western tourists, in relation to
the motives construct is a new and interesting finding of this study with further market segmentation
implications. These findings encourage marketing cultural attractions and events to tourists, without
focussing on cultural group differences, except when addressing different cultural groups of
Western tourists.
The improved understanding of the motivational process of tourist markets for cultural experiences
while on holiday resulting from this study, has numerous marketing implications as previously
discussed in relation to each of the four motivational process constructs and summarised below.
From the attitudes constmct findings (sections 6.4.2 and 6.4.5), the development of appropriate
marketing communication campaigns and the importance of branding to attract tourists to cultural
experiences are acknowledged. The liking of cultural experiences that have been positively
recommended emphasises the importance of word-of-mouth (W-O-M) communications as
information sources influencing tourists' liking for different types of cultural experiences. This finding
supports the general finding in the literature of the importance of W-O-M communications in the
consumer decision-making process for cultural products (Geissler et al., 2006; Haywood, 1989).
Three types of cultural experiences are liked by all tourist markets and should be considered in
mari<eting campaigns: art and history, traditional performing arts and famous culture.
278

Chapter 7: Conclusions
From the motives constmct findings (sections 6.5.2 and 6.5.5), where the greatest cultijral group
differences were found within the different cultural groups of Western tourists (section 6.8), psycho-
socio-physiologically-based dimensions commonly found in the literature are supported for tourist
maricets in general such as social recognition, novelty, learning local culture, and relaxation. This
combination of leaming and hedonic-entertainment consumption related dimensions supports
substantial theoretical fonnulations Identified in cultural and other tourism motivation literature
reviews (e.g., Eastgate et al., 2006; Kay, 2006b) and recent qualitative research endorsing the
perception that cultural experiences offer a unique blend of education and entertainment, referred
to as 'edutainment' (Geissler et al., 2006). However the inclusion of some attribute-based motives
within some dimensions is contrary to the trend acknowledged in tiie literature of a conceptual shift
away from activities and amenities and toward experiential and psychological outcomes (Tian et al.,
1996), but consistent with recent exploratory research of cultural experiences where the provision
of ancillary services such as cafes and gift shops are considered to enhance the sociable aspects
of the experience (Geissler et al., 2006; Swanson and Davis, 2006). When marketing to Western
cultural groups, discemable differences highlighted in the previous section (section 7.2.3) should be
addressed. Edutainment-related and social recognition dimensions are relevant to all Western
cultural groups, but unique cultural group differences are also noted. Tourists from the UK and
Ireland are not as hedonistic but are more escapist, New Zealand tourists are less adventurous and
more thrifty, the North American combination of novelty and famous culture related dimensions is
summarised as a driving motive for 'must do' cultural experiences, while the domestic tourists are
the most hedonistic of the four cultural groups. These findings have extensive marketing
implications for market segmentation, positioning, product development, branding, programming
and packaging as well as for communication campaigns and strategies.
In the two benefits-related later stages of the motivational process, the findings (sections 6.6.2,
6.6.5, 6.7.2 and 6.7.5) emphasise the importance of the cultural experience delivering the desired
benefits in order for positive behavioural outcomes to result from the experience such as
satisfaction (section 7.2.2). Measuring the benefits sought and benefits gained from the cultural
experience in two stages, enables tourist satisfaction/dissatisfaction to be inferred (section 7.2.2)
and all three constructs have marketing implications for determining appropriate types and levels of
psycho-socio-physiologically-related benefits as well as service attributes and quality sought by the
tourists from the cultural experience. Behavioural outcomes such as benefits gained and
satisfaction, in turn, infiuence future behavioural intentions such as positive word-of-mouth
communications to other potential tourist markets for cultural experiences and intentions to revisit
(e.g., Thrane, 2002). This study's findings highlight that all tourist target markets seek and gain from
their cultural experiences several attribute-based features as well as psycho-socio-physiologically-
based benefits. Edutainment and hedonism-related benefits are sought and gained from cultural
experiences, but all tourist target markets also sought attribute-based benefits of refreshments,
signage and other facilities. Eduhedonism-related benefits and attribute-based refreshments
benefits are gained from the QVM experience for all tourist groups, but information in own language
279
Chapter 7: Conclusions
was only found as a benefit gained for Western tourists. Considering both Westem and Asian
cultural groups were expecting written information in own language as an underiying benefits
sought dimension and tiie QVM does not provide signs or other information in languages other
than English, the lack of support by the Asian tourists for a benefits gained dimension based on
own language infonnation is not surprising and indicates an area where dissatisfaction can be
interned for the Chinese- and Japanese-speaking tourists. These benefit and
satisfaction/dissatisfaction-related findings have multiple marketing implications, especially for
communication strategies, product development and delivery, including service and attribute quality
levels.
In the conceptual framework procedural model for researching segmentation of the cultural
experience tourist market and for developing effective marketing strategies presented in Chapter
Three (Figure 3.2, p. 123) which was adapted from the literature (particularly, Alzua et al., 1998;
Morrison et al., 1994), the final steps proposed are identifying target markets for cultural
experiences and developing a marketing strategy model for each cultural experience tourist target
market based on the eariier findings of this study. The target markets have been identified as the
six tourist populations of interest to this study, with Asian tourists and Western tourists comprising
one global market segment, except for cultural group differences between the Western tourists in
relation to their motives for attending cultural experiences. The marketing strategy model resulting
from this study's findings endorses the importance of an understanding of the tourist motivational
process for cultural experiences as an essential foundation for developing effective marinating
strategies or campaigns for attracting tourists to cultural experiences and delivering cultural
experiences with positive behavioural outcomes that have been infiuenced by the eariier
motivational process constmcts of attitudes, motives and expectations. That all tourist markets are
motivated to attend and consume cultural experiences that are a complex bundle of product
attributes and psycho-socio-physiologically-related benefits has been confirmed in this study.
Furthermore, the marketing implications of this study's findings highlight how different marketing
strategies and activities are particulariy relevant to different stages of the motivational process for
cultural experiences. Communication campaigns and sti ategies are particularly relevant to the
formation of attitudes, motives and expectations towards cultural experiences, while product
development, delivery, packaging and programming are relevant to the consumption experience,
especially the expected benefits sought from the experience, the motivational process related
behavioural outcomes of perceived benefits gained following the consumption experience and
satisfaction/dissatisfaction with the experience which in turn influences future attitudes and motives
towards cultural experiences.
The parsimonious, generic scales for measuring cultural experience motivational process
constructs that were developed and tested in this study resulted in new knowledge about the
cultural experience motivational process for tourists and the associated marketing implications.
280

Chapter 7: Conclusions
7.4 Research Limitations
While the research of tourist motivation to date is substantial, especially for tourist motives and
benefits, there is a lack of pre-validated measurement scales for each of the constmcts, CTOSS-
cultural research of cultural group differences, and substantive theory of constmct dimensionality to
govern confirmatory factor analysis model development and re-specification. Nonetheless, despite
this limitation, a comprehensive and well thought through measurement instmment is developed
which proves to be culturally sensitive, while avoiding the cross-cultural research problems of
cultural or measurement scale inequivalence.
Due to the large number of populations selected for sampling in this research (four English-
speaking Western groups and two Asian tourist groups: Chinese-speaking and Japanese-
speaking), combined with reduced sample sizes for the after-visit sample which measured the
benefits gained constmct, limitations occurred for the testing of the benefits gained construct in
H4a, b and c. In H4b, the invariance testing for the benefits gained construct within the Western
tourist sample is restricted to two groups of English-speaking tourists (domestic tourists and
international tourists) compared with analysis for the other three cultural experience latent
constmcts that is undertaken for four groups of English-speaking tourists (domestic tourists, and
international tourists from New Zealand, North America, and the United Kingdom and Ireland).
Insufficient sample sizes for the two Asian tourist samples responding to the after-visit survey
measuring the benefits gained construct, prevented the testing of H4c for the benefits gained
construct as the sample sizes for the two groups of Asian tourists (Chinese- and Japanese
speaking) are below the recommended minimum of 100-150 cases for each group in confirmatory
factor analysis invariance testing. Indeed, the combined Asian sample for the benefits gained
construct (N = 93) is close to this minimum threshold for confirmatory factor analysis sample size
within the testing of H4a for cultural differences between the Western and Asian tourist groups. Also
caution is recommended in interpreting any findings from this study for the domestic tourist younger
adults (18-34 years), as this age group is under-represented in the sample, especially in
comparison with the proportions of this age group for domestic tourists in Australia and to
Melbourne.
International tourist's ethnic cultural orientation tested in H4 (a,b and c) for differences in the
motivational process constmcts by culture is measured in this study by language spoken at home.
This is considered a broader measure of culture than nationality as language is one of the key
underiying dimensions of culture (Cateora and Graham, 2002). That it does not cover all cultural
dimensions recommended in cross-cultural studies for more grounded inferences of culture is
acknowledged, such as Hofstede's (1984) cultural dimensions of power distance,
collectivism/individualism, masculinity/femininity, and uncertainty avoidance. These dimensions
have been used extensively in cross-cultural studies in international marketing. Schutte and
Ciariante (1998) warn however, of great variation between both Westem and Asian cultures along
two of Hofstede's cultural dimensions: uncertainty avoidance and masculinity/femininity, and of
281

Chapter 7: Conclusions
great variation between the individual Asian cultures themselves. Nevertheless, they acknowledge
the similarities between Asian cultures along the dimensions, and their contrast with Western
cultures lead them to conclude that 'Asian' cultural is indeed fundamentally different from 'Western'
culture (Schutte and Ciariante, 1998).
The significant new findings of a lack of difference between Western and Asian tourists in this
study's rigorous quantitative measurement of cultijral differences in attitudes and behaviour, could
have been influenced by limitations associated with the cultural site and the research method used
in this study. Resti icting the enquiry to a single site in a single location raises some limitations,
especially for the benefits sought and gained constructs that were measured in a site specific
context to generate data of sufficient richness to apply multivariate analysis techniques. Site
specific research makes it more difficult to link the research to the wider field of enquiry and to
generalise about the results obtained. Markets may induce more familiarity with the basic
experience than other cultural contexts, such as museums and monuments, and whether markets
are cultural events could be debated. These limitations are also associated with the breadth versus
depth of research dilemma. This study adopted a breadth approach in relation to the motivational
process by investigating four interrelated constmcts so that the relationships and any cultural
differences could be examined. Depth in research from the cultural differences in the motivational
process examined in this study is achieved by including two Asian groups (Chinese and Japanese)
to allow comparisons to be made between Western and Asian cultural groups. Quantitative
research was used in this study to empirically test cultural differences and to build upon the existing
body of research relating to tourist's motivational process. Limitations of quantitative research,
especially in a cross-cultural context have been previously acknowledged and in view of the
findings of this research and the rich mix of motivational constmcts identified in the literature review,
future research using a qualitative approach may uncover any limitations of the quantitative
approach used in this study and enable further indepth analysis of the motivational process
constmcts and cultural differences.
7.5 Recommendations for Future Research
In this study, parsimonious, generic scales for measuring the motivational process constmcts of
attitudes, motives, benefits sought and benefits gained in a cultural experience context have been
developed for use in future studies. These scales are also suitable for inferring the visitor related
motivational process constmct of satisfaction/dissatisfaction by comparing the benefits sought
results with the benefits gained results for any discrepancies or gaps. The influence of the selected
socio-demographic variable of culture on the motivational process for cultural experiences was
specifically tested in this study and found to have a major infiuence on the cultural experience
motivational process such as culture of English-speaking Western tourists. Other socio-
demographics of potential relevance to the cultural experience motivational process could be tested
in future research. For example, age group may have a significant influence and two other socio-
demographics not directiy measured in this study, but acknowledged as characteristics of this
282

Chapter 7: Conclusions
stiJdy's sample population and therefore of possible indirect infiuence are high income levels and
high education levels infen'ed from the high proportion staying in 3-star accommodation or higher.
With the new conclusion from this study that there are more differences between Westem tourists
in the cultural experience motivational process for motives than between Western and Asian
tourists or between different Asian cultural groups, future research needs to explore and test
differences between the different groups of English-speaking tourists for each of the other
consti'ucts. For example, it was decided in this research to develop and confimn the measurement
models for each motivational process construct using a combined sample of English-speaking
Western tourists who were then compared with the Asian tourists. Future research could develop
and confirm measurement models for the constructs using a sample of English-speaking
international tourists, and these models could then be tested with the domestic tourist sample as
well as the Asian tourist sample. This approach would provide more detailed analysis and
understanding of the underlying differences and similarities in cultural experience motivational
constructs dimensionality for these major markets of English-speaking Western tourists who share
some cultural similarities as supported by the invariance testing findings for the cultural experience
constructs of attitudes, benefits sought and benefits gained, but also some differences as
evidenced by the non-invariant finding for the cultural experience motives construct.
Having found some unexpected differences between English-speaking Western tourists in this
study and recommended future research methods for gaining more insight into these differences in
the previous paragraph, future research should also focus on testing for differences between
important tourist markets of non-English-speaking Western tourists. For Australia, these markets
should include tourists from the current major European market of Gemnany identified as a Tier 2
market and also the potential European markets identified as Tier 3 Markets in forecasts of
international tourists to Australia and Victoria over the next ten years between 2006-2015 of
France, Italy, the Netheriands and Switzeriand (Tourism Victoria, 2006a).
Acknowledging the high proportions of independent tourists sampled in this study which enables an
important contribution to understanding the cultural experience motivational process for these
tourists and associated cultural language group differences, future research could focus on tour
groups from major tourist markets and a comparison of their motivational process and underiying
dimensions. Independent tourists are an important and growing market, especially given the high
proportions of repeat visitors found in this study. These tourists are also highly receptive and
responsive to marketing communication activities and strategies, as their plans are less fixed than
tourists travelling on tour groups. Independent tourists however, are only a segment of the large,
emerging tourists markets of Asia such as China. Tour groups are another important market
segment, and based on Pearce's (Pearce and Lee, 2005) travel career approach to tourist
motivation, one that is particulariy relevant to emerging tourist markets, in the early stages of
international travel careers.
283

Chapter 7: Conclusions
The new conclusions from this study identify cross-cultural tourist marinets as new audiences for
cultijral experiences. This addresses the research problem of the potential of major tourist mari<ets
as new audiences for cultural experiences at cultural attractions and events. By researching their
cultural experience motivational process, detemiining the underiying dimensions of relevance to the
process, and any cultural language group similarities and differences, this research complements
and contributes to the existing cultural tourism research that largely focuses on understanding
tourist motivation and behaviour at cultural experiences per se and neglects cross-cultural
perspectives despite their importance to international tourism. By applying the latest methods of
confinnatory factor analysis in stmctural equation modeling to determine measurement models for
each of the significant constructs of the cultural experience motivational process and their
underiying dimensionality, it is possible to statistically test for cultural language group similarities
and differences in relation to these using invariance testing, and this is a further conti'ibution of this
study to understanding cultural differences in the cultural experience motivational process. From
these latest methods and the resulting conclusions, new insight with marketing implications for
destinations, attractions and events is provided in addition to parsimonious, generic scales for use
in future studies.
284

References
References
Ajzen, I. (1985). From Intentions to Action: A Theory of Planned Behavior. In J. Kuhl & J. Bechman (Eds.), Action-Control: From Cognition to Behavior {(ip. 11-39). Heidelberg: Springer.
Ajzen, I. (1991). Benefits of Leisure: A Social Psychological Perspective. In B. L Driver, P. J. Brown & G. L. Peterson (Eds.), Benefits of Leisure (pp. 411-417). State College, PA: Venture Publishing.
Ajzen, I., and Fishbein, M. (1980). Understanding Attitudes and Predicting Social Behavior. New Jersey: Prentice-Hall, Inc.
Allport, G. W. (1935). In C. Murchison (Ed.), Handbook of Social Psychology: Clark University Press.
Alzua, A., O'Leary, J. T., and Morrison, A. M. (1998). Cultural and Heritage Tourism: Identifying Niches for International Travelers. The Journal of Tourism Studies, 9(2), 2-13.
Andersen, V., Prentice, R. C , and Watanabe, K. (2000). Journeys for Experiences: Japanese Independent Travelers in Scotiand. Journal of Travel & Tourism Marketing, 9(1/2), 129-151.
Anderson, J. C, and Gerbing, D. W. (1988). Structural Equation Modeling in Practice: A Review and Recommended Two-Step Approach. Psychological Bulletin, 103{3), 411-421.
Arts Victoria. (1997a). Classical Music and Opera Audiences in Victoria. Retrieved 10 June 2004. from www.arts.vic.qov.au.
Arts Victoria. (1997b). Dance Audiences in Victoria. Retrieved 10 June 2004. from www.arts.vic.qov.au.
Arts Victoria. (1997c). Theatre Audiences in Victoria. Retrieved 10 June 2004. from www.arts.vic.qov.au.
Arts Victoria. (2000). The Arts Industry in Victoria: A Statistical Overview. Melbourne: Arts Victoria.
Atkinson, L. R., Atkinson, C. R., and Hilgard, R. E. (1983). Introduction to Psychology (Sth ed.). New York: Harcourt Brace Jovanich.
Australia Council for the Arts. (1990). Arts Participation by International Visitors to Australia. Research Paper No.2. Sydney: Australia Council for the Arts.
Australia Council for the Arts. (1991). Arts Participation by International Visitors to Australia. Research Paper No.5. Sydney: Australia Council for the Arts.
Australia Council for the Arts. (1997). Marketing the Arts: A Study of Marketing and Audience Development by Australian Arts Organisations. Sydney: Australia Council.
Australia Council for the Arts. (1999). Selling the Performing Arts. Sydney: Australia Council for the Arts.
Australian Bureau of Statistics. (1999). Attendance at Selected Cultural Venues, Australia, Cat.No.4114.0. Canberra: Australian Bureau of Statistics.
Australian Bureau of Statistics. (2000). Performing Arts Industries, Australia, 1999-2000. Cat No.8697.0. Canberra: Australian Bureau of Statistics.
Australian Bureau of Statistics. (2001). Overseas Arrivals and Departures, Australia. Cat. No. 3401.0. Canberra: Australian Bureau of Statistics.
Australian Bureau of Statistics. (2003). Attendance at Selected Cultural Venues and Events, 2002. Canberra: Australian Bureau of Statistics.
285

References
Australian Bureau of Statistics. (2005a). Australia Now: Year Book Australia. Canberra: Australian Bureau of Statistics.
Australian Bureau of Statistics. (2005b). Australian Demographic Statistics December 2005. Cat No. 3101.0. Canberra: Australian Bureau of Statistics.
Australian Bureau of Statistics. (2005c). Regional Population Growth Australia Highlights for 2004-05. Cat No. 3218.0 (No. Cat. No. 3218.0). Canberra: Australian Bureau of Statistics.
Australian Bureau of Statistics. (2006). National Regional Profile: Melbourne (Statistical Division). Retrieved 5 January 2007. from www.abs.gov.au.
Avrich, B. (1994). Event and Entertainment Marketing. Chicago: Porbus Publishing.
Axelsen, M., and Arcodia, C. (2004). Motivations for Attending the Asia-Pacific Triennial Exhibition. Paper presented at the CAUTHE 2004: Creating Tourism Knowledge, Brisbane.
Backman, K. F., Backman, S. J., Uysal, M., and Sunshine, K. M. (1995). Event Tourism: An Examination of Motivations and Activities. Festival Management and Event Tourism, 3(1), 15-24.
BagozzI, R. P. (1982). Introduction to Special Issue on Causal Modeling. Journal of Marketing Research, 19(4), 403.
Bagozzi, R. P., and Burnkrant, R. E. (1979). Attitude Organization and the Attitude-Behaviour Relationship. Journal of Personality and Social Psychology, 37(6), 913-929.
Baker, D. A., and Crompton, J. L. (2000). Quality, Satisfaction and Behavioral Intentions. Annals of Tourism Research, 27(3), 785-804.
Batra, R., and Ahtola, O. T. (1990). Measuring the Hedonic and Utilitarian Sources of Consumer Attitudes. Marketing Letters, 2(2), 159-170.
Beard, J. G., and Ragheb, M. G. (1980). Measuring Leisure Satisfaction. Journal of Leisure Research, r2(1), 20-33.
Beard, J. G., and Ragheb, M. G. (1983). Measuring Leisure Motivation. Journal of Leisure Research, •/5(3), 219-228.
Becker, H. S. (1978). Arts and Crafts. American Journal of Sociology, 83(4), 862-889.
Bettman, J. R. (1979). An Information Processing Theory of Consumer Choice. Reading, MA: Addison-Wesley.
Bollen, K. A. (1989). Structural Equations with Latent Variables. New York: John Wiley & Sons.
Boulding, W., Kaira, A., Staelin, R., and Zelthaml, V. A. (1993). A Dynamic Process of Service Quality: From Expectations to Behavioral Intentions. Journal of Marketing Research, 30(1), 7-27.
Brokensha, P., and Guldberg, H. (1992). Cultural Tourism in Australia. Canberra: Australian Government Publishing Service.
Browne, M. W., and Cudeck, R. (1992). Alternative Ways of Assessing Model Fit. Sociological Methods and Research, 21(2), 230-258.
Bultena, G. L., and Klessig, L. L. (1969). Satisfaction in Camping: A Conceptualisation and guide to Social Research. Journal of Leisure Research, 7, 348-354.
Bureau of Tourism Research. (2001). Annual Results of the National Visitor Survey: Travel by Australians 1999. Canberra: Bureau of Tourism Research.
Bureau of Tourism Research. (2003). International Visitors in Australia: Annual Results of the International Visitor Survey 1999-2002. Canberra: Bureau of Tourism Research.
Byrne, B. M. (2001). Structural Equation Modeling with AMOS: Basic Concepts, Applications, and Programming. New Jersey: Lawrence Eribaum Associates Publishers.
286

References
Byrne, B. M., and Campbell, T. L. (1999). Cross-cultural Comparisons and the Presumption of Equivalent Measurement and Theoretical Structure: A Look Beneath the Surface. Journal of Cross-Cultural Psychology, 30(5), 555-574.
Carpenter, G. (2004). Collaborating to Address Cultural Tourists' Interests for Experience, e-Review of Tourism Research, 2(1), 5-10.
Cartwrlght, D. (1949). Some Principles of Mass Persuasion: Selected Findings of Research on the Sale of United States War Bonds. Human Relations, 2, 253-267.
Cateora, P. R., and Graham, J. L. (2002). International Marketing (11th ed.). New York: McGraw-Hill.
Cha, S., McCleary, K. W., and Uysal, M. (1995). Travel Motivations of Japanese Overseas Travelers: A Factor-Cluster Segmentation Approach. Journal of Travel Research, 34(1), 33-39.
Chan, A., and Rossiter, J. (2003,1-3 December). Measurement Issues in Cross-Cultural Values Research. Paper presented at the ANZMAC 2003 Conference Proceedings, Adelaide.
Chen, C, Lee, S. Y., and Stevenson, H. (1995). Response Style and Cross Cultural Comparisons of Rating Scales Among East Asian and North American Students. Psychological Science, 6, 170-175.
Cheung, G. W., and Rensvold, R. B. (2002). Evaluating Goodness-of-Fit Indexes for Testing Measurement Invariance. Structural Equation Modeling, 9(2), 233-255.
Childress, R. D., and Crompton, J. L. (1997). A Comparison of Alternative Direct and Discrepancy Approaches to Measuring Quality of Performance at a Festival. Journal of Travel Research, 36(2), 43-57.
Churchill, G. A. (1979). A Paradigm for Developing Better Measures of Marketing Constructs. Journal of Marketing Research, '?6(February), 64-73.
Churchill, G. A., and Suprenant, C. (1982). An Investigation into the Determinants of Customer Satisfaction. Journal of Marketing Research, 79(November), 491-504.
Cohen, E. (1972). Toward a Sociology of International Tourism. Journal of Social Research, 39(1), 164-182.
Cohen, E. (1974). Who is a Tourist? A Conceptual Clarification. Sociological Review, 22(4), 527-555.
Cohen, E. (1979). A Phenomenology of Tourist Experiences. Sociology, 13, 179-201.
Cohen, E. (1993). Introduction: Investigating Tourist Arts. Annals of Tourism Research, 20(1), 1-8.
Costello, A. B., and Osborne, J. W. (2005). Best Practices in Exploratory Factor Analysis: Four Recommendations for Getting the Most From Your Analysis. Practical Assessment Research & Evaluation, 10(7), 1-9 Available online: http://pareonline.net/qetvn.asp?v=1.0&n=17.
Crandell, R. (1980). Motivations for Leisure. Journal of Leisure Research, 12(^), 45-54.
Crask, M. R. (1981). Segmenting the Vacationer Market: Identifying the Vacationer Preferences, Demographics, and Magazine Readership of Each Group. Journal of Travel Research, 20(2), 29-34.
Crompton, J. L. (1979). Motivations for Pleasure Vacation. Annals of Tourism Research, 6(4), 408-424.
Crompton, J. L., and McKay, S. L. (1997). Motives of Visitors Attending Festival Events. Annals of Tourism Research, 24(2), 425-439.
Crompton, J. L., and Tian-Cole, S. (2001). An Analysis of 13 Tourism Surveys: Are Three Waves of Data Collection Necessary? Journal of Travel Research, 39(4), 356-368.
287

References
Cronin, J. J., and Taylor, S. A. (1992). Measuring Service Quality: A Re-examination and Extension. Journal of Marketing, 56, 55-68.
Cultural Ministers Council Statistics Working Group. (1997). Domestic Cultural Tourism in Australia 1994-95. Canberra: Cultural Ministers Council Statistics Working Group.
Cultural Tourism Industry Group. (2005). Victoria's Cultural Guide 2005-2006. Melbourne: Tourism Victoria.
Cunningham, M. H., and Taylor, S. F. (1995). Event Marketing: State of the Industry and Research Agenda. Festival Management and Event Tourism, 2, 123-137.
Daghfous, N., Petrof, J., and Pons, F. (1999). Values and Adoption of Innovations: A Cross-Cultural Study. Journal of Consumer Marketing, 76(4), 314-331.
Dai, Y.-D., Parks, S. C, and Graefe, A. (2006). Beyond Customer Satisfaction: A Structural Equation Model. In C. Chen (Ed.), Twelfth Asia Pacific Tourist Association and Fourth Asia Pacific CHRIE Joint Annual Conference (pp. 1436-1447). Hualien, Taiwan: Taiwan Hospitality and Tourism College/National Taiwan Normal University.
Dann, G. M. S. (1977). Anomie, Ego-Enhancement and Tourism. Annals of Tourism Research, 4(4), 184-194.
Dann, G. M. S. (1981). Tourist Motivation: An Appraisal. Annals of Tourism Research, 8(2), 187-219.
Dann, G. M. S. (1993). Limitations in the Use of 'Nationality' and 'Country of Residence' Variables. In D. G. Pearce & R. W. Butler (Eds.), Tourism Research: Critiques and Challenges (pp. 88-112). London: Routledge/lntemational Academy for the Study of Tourism.
Davidoff, L. L. (1994). Introduction to Psychology (3 ed.). New York: McGraw-Hill.
Deci, E. L. (1985). Intrinsic Motivation and Self-Determination in Human Behaviour. New York: Plenum.
Derbaix, C. M. (1995). The Impact of Affective Reactions on Attitudes Toward the Advertisement and the Brand: A Step toward Ecological Validity. Journal of Marketing Research, 32, 470-479.
Diaz-Martin, A. M., Iglesias, V., Vazquez, R., and Ruiz, A. V. (2000). The Use of Quality Expectations to Segment a Service Market. Journal of Services Marketing, 74(2), 132-146.
Dibb, S., and Stern, P. (1995). Questioning the Reliability of Market Segmentation Techniques. Omega International Journal of Management Science, 23(6), 625-636.
Dickman, S. (1997). Arts Marketing: The Pocket Guide. Melbourne: Centre for Professional Development, Australia.
Dimanche, F. (1994). Cross-Cultural Tourism Marketing Research: An Assessment and Recommendations for Future Studies. Journal of Travel & Tourism Marketing, 6(3-4), 123-134.
Dolnicar, S. (2002a). Activity-Based Market Sub-Segmentation of Cultural Tourists. Journal of Hospitality and Tourism Management 9(2), 94-105.
Dolnicar, S. (2002b). A Review of Data-Driven Market Segmentation in Tourism. Journal of Travel & Tourism Marketing, 72(1), 1-22.
Dolnicar, S. (2002c). A Review of Unquestioned Standards in Using Cluster Analysis for Data-Driven Market Segmentation, ANZMAC 2002 Conference Proceedings (pp. 31-37).
Dolnicar, S. (2004). Tracking Data-Driven Market Segments. Tourism Analysis, 8(2-4), 227-232.
Dolnicar, S., and Leish, F. (2003). Winter Tourist Segments in Austria: Identifying Stable Vacation Styles using Bagged Clustering Techniques. Journal of Travel Research, 41, 281-292.
288

References
Driver, B. L., Brown, P., J, and Peterson, G. L. (Eds.). (1991a). Benefits of Leisure. Pennsylvania: Venture Publishing, Inc.
Driver, B. L., Brown, P. J., and Peterson, G. L. (1991b). Research on Leisure Benefits: An Introduction. In B. L. Driver, P. J. Brown & G. L. Peterson (Eds.), Benefits of Leisure (pp. 3-11). Pennsylvania: Venture Publishing, Inc.
Driver, B. L., Brown, P. J., Stankey, G. H., and Gregoire, T. G. (1987). The ROS Planning System. Leisure Sciences, 9, 201-212.
Driver, B. L., and Bruns, D. H. (1999). Concepts and Uses of the Benefits Approach to Leisure. In E. L. Jackson & T. L. Burton (Eds.), Leisure Studies: Prospects for the Twenty-First Century (pp. 349-369). Pennsylvania: Venture Publishing.
Driver, B. L., Tinsley, H. E. A., and Manfredo, M. J. (1991c). Leisure and Recreation Experience Preference Scales. In B. L. Driver, P. J. Brown & G. L. Peterson (Eds.), Benefits of Leisure (pp. 263-286). Pennsylvania: Venture Publishing, Inc.
Dunn Ross, E. L., and Iso-Ahola, S. E. (1991). Sightseeing Tourists' Motivation and Satisfaction. Annals of Tourism Research, 78(2), 226-237.
Eagly, A. H., and Chaiken, S. (1993). The Psychology of Attitudes. Oriando: Harcourt Brace.
Eastgate, A., Chalip, L., and Funk, D. C. (2006). The Development of a Generic Tourism Benefits Scale. In G. B. O'Mahony & P. Whitelaw (Eds.), Proceedings of the 16th Annual CAUTHE Conference (pp. 676-688). Melbourne: School of Hospitality, Tourism and Marketing, Victoria University.
Ekinci, Y., and Chen, J. S. (2002). Segmenting Overseas British Holldaymakers by Personal Values. Journal of Hospitality and Leisure Marketing, 9(3/4), 5-15.
Fazio, R. H., and Zanna, M. (1978). Attitudinal Qualities Relating to the Strength of the Attitude-Behavior Relationship. Journal of Experimental Social Psychology, 14, 398-408.
Feather, N. T. (1975). Values in Education and Society. New York: The Free Press.
Fishbein, M. (1967). Attitudes and the Prediction of Behaviour. In M. Fishbein (Ed.), Readings in Attitudes Theory and Measurements. New York: John Wiley.
Fishbein, M. (1970). The Relationship between Beliefs, Attitudes and Behavior. In Research in Consumer Behavior (pp. 216-235). New York: Holt, Rinehart and Winston.
Fishbein, M., and Ajzen, I. (1975). Belief, Attitude, Intention, and Behavior: An Introduction to Theory and Research. Reading, MA: Addison-Wesley.
FItzmaurice, J. (2005). Incorporating Consumers' Motivations into the Theory of Reasoned Action. Psychology and Marketing, 22(\ 1), 911 -929.
Fodness, D. (1994). Measuring Tourist Motivation. Annals of Tourism Research, 27(3), 555-581.
Foo, L. M., and Rossetto, A. (1998). Cultural Tourism in Australia: Characteristics and Motivations. Occasional Paper No. 27. Canberra: Bureau of Tourism Research.
Formica, S., and Murrmann, S. (1996). The Effects of Group Membership and Motivation on Attendance: An International Festival Case. Tourism Analysis, 3(3-4), 197-207.
Formica, S., and Uysal, M. (1996). A Market Segmentation of Festival Visitors: Umbria Jazz Festival in Italy. Festival Management and Event Tourism, 3(4), 175-182.
Formica, S., and Uysal, M. (1998). Market Segmentation of an International Cultural-Historical Event in Italy. Journal of Travel Research, 36(4), 16-24.
Frochot, I. (2004). An Investigation into the Influence of the Benefits Sought by Visitors on their Quality Evaluation of Historic Houses' Service Provision. Journal of Vacation Marketing, 70(3), 223-237.
Frochot, I. (2005). A Benefit Segmentation of Tourists in Rural Areas: A Scottish Perspective. Tourism Management 26(3), 335-346.
289

References
Frochot, I., and Hughes, H. (2000). HISTOQUAL: The Development of a Historic Houses Assessment Scale. Tourism Management, 27(2), 157-167.
Frochot, I., and Morrison, A. M. (2000). Benefit Segmentation: A Review of Its Applications to Travel and Tourism Research. Journal of Travel & Tourism Marketing, 9(4), 21-45.
Galloway, G. (1998). Motivations for Leisure Travel: A Critical Examination. Paper presented at the Eighth Australian Tourism and Hospitality Research Conference, Gold Coast, Queensland, Australia.
Galloway, G. (2002). Psychographic Segmentation of Park Visitor Markets: Evidence for the Utility of Sensation Seeking. Tourism Management 23(6), 581-596.
Gantner, V. (2005). Commissioning for Creativity - Inspiring the Imagination of the Audience. The Alfred Deakin Innovation Lectures Retrieved 3 July, 2005, from www.deakinlectures.com
Geissler, G. L., Rucks, C. T., and Edison, S. W. (2006). Understanding the Role of Service Convenience in Art Museum Marketing: An Exploratory Study. Journal of Hospitality & Leisure Marketing, 74(4), 69-87.
Gerbing, D. W., and Hamilton, J. G. (1996). Viability of Exploratory Factor Analysis as a Precursor to Confirmatory Factor Analysis. Structural Equation Modeling, 3(1), 62-72.
Getz, D. (1991). Festivals, Special Events and Tourism. New York: Van Nostrand Reinhold.
Getz, D. (1993). Festivals and Special Events. In M. A. Khan, M. D. Olsen & T. Var (Eds.), VNR's Encyclopedia of Hospitality and Tourism (pp. 945-955). New York: Van Nostrand Reinhold.
Getz, D. (1997). Event Management and Event Tourism. New York: Cognizant Communication.
GItelson, R. J., and Kerstetter, D. L. (1990). The Relationship between Sociodemographic Variables, Benefits Sought and Subsequent Vacation Behavior. Journal of Travel Research, 28(3), 24-29.
Gnoth, J. (1997). Tourism Motivation and Expectation Formation. Annals of Tourism Research, 24(2), 283-304.
Gnoth, J. (1999). Tourism Expectation Formation: The Case of Camper-Van Tourists in New Zealand. In A. Pizam & Y. Mansfeld (Eds.), Consumer Behavior in Travel and Tourism (pp. 245-266). New York: The Haworth Hospitality Press.
Goldblatt, J. J. (1997). Special Events: Best Practices in Modern Event Management (2nd ed.). New York: John Wiley & Sons.
Goossens, C. (2000). Tourism Information and Pleasure Motivation. Annals of Tourism Research, 27(2), 301-321.
Gorsuch, R. L. (1990). Common Factor analysis Versus Component Analysis: Some Well and Little Known Facts. Multivariate Behavioral Research, 25(1), 33-39.
Grant, D., and Paliwoda, S. (1998). Segmenting Alberta Arts and Festival consumers. Part 1: Overview of the Arts Consumer. Festival Management and Event Tourism, 5(4), 207-220.
Gronroos, C. (1990). Service Management and Marketing: Managing the Moments of Truth in Service Competition. Lexington, MA: Lexington Books.
Gross, D. R. (1992). Psychology: the Science of mind and Behaviour {2 ed.). London: Hodder and Stoughton.
Haas, G. E., Driver, B. L., and Brown, P. J. (1980). Measuring Wilderness Experiences., Proceedings of the Wilderness Psychology Group (pp. 20-40). New Hampshire: Durham.
290

References
Haggard, L. M., and Williams, D. R. (1991). Self Identity Benefits of Leisure Activities. In B. L. Driver, P. J. Brown & G. L. Peterson (Eds.), Benefits of Leisure (pp. 103-119). State College, PA: Venture Publishing.
Hair, J. F., Anderson, R. E., Tatham, R. L., and Black, W. C. (1995). Multivariate Data Analysis with Readings (4th ed.). New Jersey: Prentice Hall.
Hair, J. F., Black, W. C, Babin, B. J., Anderson, R. E., and Tatham, R. L. (2006). Multivariate Data Analysis. New Jersey: Pearson Prentice Hall.
Haley, R. I. (1968). Benefit Segmentation: A Decision Orientated Research Tool. Journal of Marketing, 32(July), 30-35.
Haley, R. I. (1971). Benefit Segmentation: A Decision Oriented Research Tool. In J. F. Engel, H. F. Fiorillo & M. A. Cayley (Eds.), Market Segmentation: Concepts and Applications (pp. 196-205). New York: Reinehart & Winston.
Hall, C. M., and Zeppel, H. (1990). Cultural and Heritage Tourism: The New Grand Tour? Historic Environment w7(3 & 4), 86-98.
Hall, E. T. (1977, reprinted 1989). Beyond Culture. New York: Anchor Press.
Halvena, W. J., and Holbrook, M. B. (1986). The Varieties of Consumption Experience: Comparing Two Typologies of Emotion in Consumer Behavior. Journal of Consumer Research, 73(3), 394-404.
Hanqin, Z. Q., and Lam, T. (1999). An Analysis of Mainland Chinese Visitors' Motivations to visit Hong Kong. Tourism Management 20, 587-594.
Harrill, R., and Potts, T. D. (2002). Social Psychological Theories of Tourist Motivation: Exploration, Debate, and Transition. Tourism Analysis, 7(2), 105-114.
Haywood, K. M. (1989). Managing Word-of-Mouth Communications. Journal of Services Marketing, 3(Spring), 55-67.
Heaney, L., and Salma, U. (2004). Culture Seekers: The Economic Impact of Cultural Visitors in Australia, 1997/98-2000/01. Bureau of Tourism Research Report, 5(2), 1-12.
Henderson, J. (2001). Tourism and the Arts: A View from Singapore. Tourism, Culture and Communication, 3, 27-36.
Herskovits, M. (1952). Man and His Works. New York: Alfred A Knopf.
Heung, V., C S, Qu, H., and Chu, R. (2001). The Relationship between Vacation Factors and Socio-Demographic and Travelling Characteristics: The Case of Japanese Leisure Travellers. Tourism Management 22(3), 259-269.
Higgs, B., Polonsky, M. J., and Hollick, M. (2005). Measuring Expectations: Forecast vs. Ideal Expectations. Does it Really Matter? Journal of Retailing and Consumer Services, 72(1), 49-64.
Hirschman, E. C, and Holbrook, M. B. (1982). Hedonic Consumption: Emerging Concepts, Methods and Propositions. Journal of Marketing, 46(Summer), 92-101.
Hoek, J., Gendall, P., and Esslemont, D. (1993). Market Segmentation: A Search for the Holy Grail? Asia-Australia Marketing Journal, 7(1), 41-46.
Hofstede, G. (1980). Culture's Consequences: International Differences in Work-Related Values. California: Sage Publications.
Hofstede, G. (1984). Culture's Consequences: International Differences in Work-Related Values (Abridged ed.). California: Sage Publications.
Holbrook, M. B. (1986). Aims, Concepts, and Methods for the Representation of Individual Differences in Esthetic Responses to Design Features. Journal of Consumer Research, 73(December), 337-347.
Holbrook, M. B., and Batra, R. (1987). Assessing the Role of Emotions as Mediators of Consumer Responses to Advertising. Journal of Consumer Research, 14, 405-420.
291

References
Holbrook, M. B., and Hirschman, E. C. (1982). The Experiential Aspects of Consumption: Consumer Fantasies, Feelings, and Fun. Journal of Consumer Research, 9(September), 132-140.
Holbrook, M. B., and Schlndler, R. M. (1994). Age, Sex, and Attitude Toward the Past as Predictors of Consumers' Aesthetic Tastes for Cultural Products. Journal of Marketing Research, 37(August), 412-422.
Holden, A., and Sparrowhawk, J. (2002). Understanding the Motivations of Ecotourists: the Case of Trekkers in Annapurna, Nepal. International Journal of Tourism Research, 4, 435-446.
Homer, P., and Kahle, L. (1988). A Structural Equation Test of the Value-Attitude-Behavior Hierarchy. Journal of Personality and Social Psychology, 54(4), 638-646.
Hossain, A., Heaney, L., and Carter, P. (2005). Cultural Tourism in Regions of Australia. Canberra: Tourism Research Australia.
Howat, G., Crilley, G., Mikilewicz, S., Edgecombe, S., March, H., Murray, D., et al. (2002). Service Quality, Customer Satisfaction and Behavioural Intentions of Australian Aquatic Centre Customers, 1999-2001. Anria/s of Leisure Research, 5, 51-64.
Hsieh, S., O'Leary, J. T., and Morrison, A. M. (1992). Segmenting the International Travel Market by Activity. Tourism Management 73(2), 209-223.
Hsieh, S., O'Leary, J. T., Morrison, A. M., and Chiang, D. (1997). Travel Decision Pattern Segmentation of Pleasure Travel. Journal of Vacation Marketing, 3(4), 289-302.
Hsu, C. H. C. (2001). Importance and Dimensionality of Senior Motorcoach Traveler Choice Attributes. Journal of Hospitality & Leisure Marketing, 8(3/4), 51-70.
Hu, L.-T., and Bentier, P. M. (1999). Cutoff Criteria for Fit Indexes in Covariance Structure Analysis: Conventional Criteria Versus New Alternatives. Structural Equation Modeling, 6(1), 1-55.
Hughes, H. L. (1987). Culture as a Tourist Resource - A Theoretical Consideration. Tourism Management 8(3), 205-216.
Hughes, H. L. (1989). Tourism and the Arts: A Potentially Destructive Relationship? Tourism Management{June), 97-99.
Hughes, H. L. (1996). Redefining Cultural Tourism. Annals of Tourism Research, 23(3), 707-709.
Hull, R. B. (1990). Mood as the Product of Leisure: Causes and Consequences. Journal of Leisure Research, 22, 99-111.
Hull, R. B. (1991). Mood as a Product of Leisure. In B. L. Driver, P. J. Brown & G. L. Peterson (Eds.), Benefits of Leisure (pp. 323-345). State College, PA: Venture Publishing.
Hull, R. B., and Harvey, A. (1989). Explaining the Emotion Experienced in Surburban Parks. Environment and Behaviour, 21, 323-345.
Hunt, H. K. (1977). Conceptualisation and Measurement of Consumer Satisfaction and Dissatisfaction. Cambridge, MA: Marketing Science Institute.
Hunt, H. K. (1991). Consumer Satisfaction, Dissatisfaction, adn Complaining Behavior. Journal of Social Issues, 47(1), 107-117.
Hurley, A. E., Scandura, T. A., Schriesheim, C. A., Brannick, M. T., Seers, A., Vandenberg, R. J., et al. (1997). Exploratory and Confirmatory Factor Analysis: Guidelines, Issues, and Alternatives. Journal of Organizational Behavior, 18, 667-683.
Hwang, Y.-H., and Lim, S. T. (2006). Factors Influencing Travelers' Unplanned Attraction Visits: An Exploratory Study. In C. Chen (Ed.), Twelfth Asia Pacific Tourist Association and Fourth Asia Pacific CHRIE Joint Annual Conference (pp. 993-1005). Hualien, Taiwan: Taiwan Hospitality and Tourism College/national Taiwan Normal University.
292

References
International Chamber of Commerce/European Society for Opinion and Marketing Research. (1995). ICC/ESOMAR International Code of Marketing and Social Research Practice. Retrieved 20 December, 2005, from www.iccwbo.orq
Iso-Ahola, S. E. (1980). The Social Psychology of Leisure and Recreation. Dubuque, Iowa: Wm C Brown Co.
Iso-Ahola, S. E. (1982). Toward a Social Psychology Theory of Tourism Motivation: A Rejoinder. Annals of Tourism Research, 9(2), 256-262.
Iso-Ahola, S. E. (1983). Towards a Social Psychology of Recreational Travel. Leisure Studies, 2(1), 45-56.
Iso-Ahola, S. E. (1989). Motivation for Leisure. In E. L. Jackson & T. L. Burton (Eds.), Understanding Leisure and Recreation: Mapping the Past Charting the Future (pp. 247-280). State College, PA: Venture Publishing.
Iso-Ahola, S. E. (1999). Motivational Foundations of Leisure. In E. L. Jackson &T. L. Burton (Eds.), Leisure Studies: Prospects for the Twentieth Century (pp. 35-51). Pennsylvania: Venture College.
Jackson, E. L., and Burton, T. L. (1999). Leisure Studies: Prospects for the Twentieth Century. Pennsylvania: Venture Publishing, Inc.
Jamal, T., and Lee, J.-H. (2003). Integrating Micro and Macro Apporaches to Tourist Motivations: Toward an Interdisciplinary Theory. Tourism Analysis, 8(1), 47-59.
Jamrozy, U., and Uysal, M. (1994). Travel Motivation Variations of Overseas German Visitors. Journal of International Consumer Marketing, 6(3/4), 135-160.
Jang, S. C, Morrison, A. M., and O'Leary, J. T. (2002). Benefit Segmentation of Japanese Pleasure Travelers to the USA and Canada: Selecting Target Markets based on the Profitability and Risk of Individual Market Segments. Tourism Management 23(4), 367-378.
Kahle, L. R. (1986). The Nine Nations of North American and the Value Basis of Geographic Segmentation. Journal of Marketing, 50(April), 37-47.
Kahle, L. R., and Kennedy, P. (1989). Using the List of Values (LOV) to Understand Consumers. Journal of Consumer Marketing, 6(3), 5-12.
Kamakura, W. A,, and Novak, T. (1992). Value System Segmentation: Exploring the Meaning of LOV. Journal of Consumer Research, 79(June), 119-132.
Katz, D., and Stotiand, E. (1959). A Preliminary Statement to a Theory of Attitude Structure and Change. In E. Koch (Ed.), Psychology: A Study of a Science. (Vol.3) (pp. 423-475). New York: McGraw-Hill.
Kay, P. (2003). Consumer Motivation in a Tourism Context: Continuing the Work of Maslow, Rokeach, Vroom, Deci, Haley and Others. In R. Kennedy (Ed.), Proceedings of ANZMAC 2003 (pp. 600-614). Adelaide: University of South Australia.
Kay, P. (2006a). Tourist Benefits Research: Old and New Issues and Uses in a Cultural Tourism Context. In G. B. O'Mahony & P. Whitelaw (Eds.), Proceedings of the 16th Annual CAUTHE Conference (pp. 809-824). Melbourne: School of Hospitality, Tourism and Marketing, Victoria University.
Kay, P. (2006b). Understanding Tourists' Cultural Experiences: Beneftis and Satisfaction at the Queen Victoria Market, Melbourne. In J. Drennan (Ed.), Proceedings of the ANZMAC 2006 Conference (pp. 6 in total). Brisbane: School of Advertising, Marketing and Public Relations, Queensland University of Technology.
Kemp, C. (2000). Music Industry Management and Promotion. Huntingdon: Elm Publications.
Kerstetter, D., Confer, J., and Bricker, K. (1998). Industrial Heritage Attractions: Types and Tourists. Journal of Travel & Tourism Marketing, 7(2), 91-104.
Kerstetter, D., Confer, J., and Graefe, A. (2001). An Exploration of the Specialization Concept within the Context of Heritage Tourism. Journal of Travel Research, 39(3), 267-274.
293

References
Kim, C. (1998). Cross-Cultural Perspectives on Motivation. Annals of Tourism Research{25), 4.
Kim, C, and Lee, S. (2000). Understanding the Cultural Differences in Tourism Motivation Between Anglo-American and Japanese Tourists. Journal of Travel & Tourism Marketing, 9(1/2), 153-170.
Kim, S. S., Choong-Ki, L., and Klenosky, D. B. (2003). The Influence of Push and Pull Factors at Korean National Parks. Tourism Management 24(2), 169-180.
Kim, S. S., and Prideaux, B. (2005). Marketing Implications Arising from a Comparative Study of International Pleasure Tourist Motivations and Other Travel-Related Characteristics of Visitors to Korea. Tourism Management 26(3), 347-357.
Kline, R. B. (2005). Principles and Practice of Structural Equation Modeling (2nd ed.). New York: The Guilford Press.
Klinger, E. (1971). Structure and Functions of Fantasy. New York: Wiley-lnterscience.
Kolb, B. M. (2000). Marketing Cultural Organisations: New Strategies for Attracting Audiences to Classical Music, Dance, Museums, Theatre and Opera. Dublin: Oak Tree Press.
Kolb, B. M. (2002). Ethnic Preference for the Arts: The role of the social experience as attendance motivation. International Journal of Nonprofit and Voluntary Sector Marketing, 7(2), 172-181.
Kotler, P. (1997). Marketing Management Analysis, Planning, Implementation and Control (9th ed.). New Jersey: Prentice-Hall International.
Kotier, P. (2000). Principles of Marketing. New Jersey: Prentice Hall.
Kotler, P., Bowen, J. T., and Makens, J. C. (2006). Marketing for Hospitality and Tourism (4th ed.). New Jersey: Pearson Education Inc.
Kotier, P., and Scheff, J. (1997). Standing Room Only: Strategies for Marketing the Performing Arts. Boston: Harvard Business School Press.
Kozak, M. (2002). Comparative Analysis of Tourist Motivations by Nationality and Destinations. Tourism Management 23(3), 221-232.
Krippendorf, J. (1987). The Holiday Makers: Understanding the Impact of Leisure and Travel. Oxford: Butterworth-Heinemann.
Lang, C.-T., and O'Leary, J. T. (1997). Motivation, Participation, and Preference: A Multi-Segmentation Approach of the Australian Nature Travel Market. Journal of Travel & Tourism Marketing, 6(3/4), 159-180.
Lang, C.-T., O'Leary, J. T., and Morrison, A. M. (1993). Segmentation of Japanese Female Overseas Travelers. Journal of Travel & Tourism Marketing, 2(4), 1-22.
Lankford, S. V., and Howard, D. R. (1994). Developing a Tourism Impact Attitude Scale. Annals of Tourism Research, 21{\), 121-139.
Lee, C.-K. (2000). A Comparative Study of Caucasian and Asian Visitors to a Cultural Expo in an Asian Setting. Tourism Management 27(2), 169-176.
Lee, C.-K., Lee, Y.-K., and Wicks, B. E. (2004a). Segmentation of Festival Motivation by Nationality and Satisfaction. Tourism Management 25(1), 61-70.
Lee, C, and Green, R. T. (1991). Cross-Cultural Examination of the Fishbein Behavioural Interntions Models. Journal of International Business Studies, 22(2), 289-305.
Lee, J., Graefe, A. R., and Burns, R. C. (2004b). Service Quality, Satisfaction, and Behavioral Intention Among Forest Visitors. Journal of Travel & Tourism Marketing, 77(1), 73-82.
Lee, S.-H., and TIdeswell, C. (2005). Understanding Attitudes Towards Leisure Travel and the Constraints Faced by Senior Koreans. Journal of Vacation Marketing, 17(3), 249-263.
Levy, S. J. (1959). Symbols for Sale. Harvard Business Review, 37(July/August), 117-124.
294

References
Lewis, R. C. (1981). Marketing for Full Service Restaurant - An Analysis of Demographic and Benefit Segmentation. In J. H. Donnelly & W. R. George (Eds.), Marketing of Services (pp. 43-46). Chicago: American Marketing Association.
Likert, R. (1932). A Technique for the Measurement of Attitudes, Archives of Psychology, No 140.
Linton, R. (1945). The Cultural Background of Personality. New York: Appleton-Century-Crofts.
Loker-Murphy, L. (1996). Backpackers in Australia: A Motivation-Based Segmentation Study. Journal of Travel & Tourism Marketing, 5(4), 23-45.
Loker, L. E., and Perdue, R. R. (1992). A Benefit-Based Segmentation of a Nonresident Summer Travel Market. Journal of Travel Research, 37(1), 30-35.
Lounsbury, J. W., and Hoopes, L. L. (1985). An Investigation of Factors Associated with Vacation Satisfaction. Journal of Leisure Research, 17{\), 1-13.
Lumpkin, J. R. (1985). Shopping Orientation Segmentation of the Elderiy Consumer. Journal of the Academy of Marketing Science, 73(Spring), 271-289.
Lundberg, D. E. (1971). Why Tourists Travel. The Cornell Hotel and Restaurant Administration Quarterly, 26(February), 75-81.
Lundberg, D. E. (1972). The Tourism Business. Chicago: Institutions/Volume Feeding Management Magazine.
Madrigal, R. (1995). Personal Values, Traveler Personality Type, and Leisure Travel Style. Journal of Leisure Research, 27(2), 125-142.
Madrigal, R., and Kahle, L. (1994). Predicting Vacation Activity Preferences on the Basis of Value-System Segmentation. Journal of Travel Research, 27(2), 22-28.
Malhotra, N. K., Hall, J., Shaw, M., and Crisp, M. (1996). Marketing Research: An Applied Orientation. Sydney: Prentice Hall Australia.
Mannell, R., and Iso-Ahola, S. E. (1987). Psychological Nature of Leisure and Tourism Experience. Annals of Tourism Research, 14(3), 314-329.
Mannell, R. C. (1999). Leisure Experience and Satisfaction. In E. L. Jackson & T. L. Burton (Eds.), Leisure Studies: Prospects for the Twenty-first Century (pp. 235-251). Pennsylvania: Venture Publishing.
Manning, R. E. (1986). Studies in Outdoor Recreation. Search and Research for Satisfaction. Corvallis: Oregon Stat University Press.
Mano, H., and Oliver, R. L. (1993). Assessing the Dimensionality and Structure of the Consumption Experience: Evaluation, Feeling, and Satisfaction. Journal of Consumer Research, 20(December), 451-466.
Masberg, B. A., and Silverman, L. H. (1996). Visitor Experiences at Heritage Sites: A Phenomenological Approach. Journal of Travel Research, 34(4), 20-25.
Maslow, A. H. (1943). A Theory of Human Motivation. Psychological Review, 50, 370-396.
Maslow, A. H. (1954). Motivation and Personality. New York: Harper.
Mattila, A. (1999). The Role of Culture in the Service Evaluation Process. Journal of Service Research, 1, 250-261.
Mayo, E. J., and Jarvis, L. P. (1981). The Psychology of Leisure Travel: Effective Marketing and Selling of Travel Services. Boston: CBI Publishing Company.
Mazanec, J. A. (1994). Segmenting Travel Markets. In R. Teare, J. A. Mazanec, S. Crav /ford-Welch & S. Calver (Eds.), Marketing in Hospitality and Tourism: A Consumer Focus (pp. 99-164). London: Cassell.
McCarthy, K. F., Brooks, A., Lowell, J., and Zakaras, L. (2001). The Performing Arts in a New Era. United States: RAND/The Pew Charitable Trusts.
295

References
McClelland, D. (1965). Achievement and Entrepreneurship: A Longitudinal Study. Journal of Personality and Social Psychology, April, 1, 389-392.
McClelland, D. C. (1955). Studies in Motivation. New York: Appleton-Century-Crofts.
McCool, S. F., and Reilly, M. (1993). Benefit Segmentation Analysis of State Park Visitor Setting Preference and Behavior. Journal of Park and Recreation Administration, 77(4), 1-14.
McGehee, N. G., Kim, K., and Jennings, G. R. (2007). Gender and Motivation for Agri-Tourism Entrepreneurship. Tourism Management 28(1), 280-289.
McGregor, R. (1974). Art and the Aesthetic. Journal of Art Criticism, 32(Summer), 549-559.
Mcintosh, A. J., and Prentice, R. C. (1999). Affirming Authenticity: Consuming Cultural Heritage. Annals of Tourism Research, 26(3), 589-612.
Mcintosh, R., Goeldner, C, and Ritchie, B. (1994). Tourism: Principles, Practices, Philosophies (7th ed.). New York: Wiley.
McKercher, B. (2002). Towards a Classification of Cultural Tourists. International Journal of Tourism Research, 4, 29-38.
McKercher, B. (2004). A Comparative Study of International Cultural Tourists. Paper presented at the CAUTHE 2004: Creating Tourism Knowledge, Brisbane.
McKercher, B., and Chow, S.-M. (2001). Cultural Distance and Participation in Cultural Tourism. Pacific Tourism Review, 5(1/2), 21-30.
McKercher, B., and du Cros, H. (2002). Cultural Tourism: The Partnership Between Tourism and Cultural Heritage Management. New York: The Haworth Hospitality Press.
McKercher, B., and du Cros, H. (2003). Testing a Cultural Tourism Typology. International Journal of Tourism Research, 5, 45-58.
McKercher, B., Ho, P. S. Y., du Cros, H., and So-Ming, B. C. (2002). Activities-Based Segmentation of the Cultural Tourism Market. Journal of Travel & Tourism Marketing, 72(1), 23-46.
Middleton, V. T. C, and Clarke, J. (2001). Marketing in Travel and Tourism (3rd ed.). Oxford: Butterworth-Heinemann.
Minor, M. S., Wagner, T., Brewerton, F. J., and Hausman, A. (2004). Rock On! An Elementary Model of Customer Satisfaction with Musical Performances. Journal of Services Marketing, 78(1), 7-18.
Mitchell, A. (1983). The Nine American Lifestyles. New York: Warner.
Mohr, K., Backman, K. F., Gahan, L. W., and Backman, S. J. (1993). An Investigation of Festival Motivations and Events Satisfaction by Visitor Type. Festival Management and Event Tourism, 7(3), 89-97.
Mohsin, A., and Ryan, C. (2003). Backpackers in the Northern Territory of Australia - Motives, Behaviours and Satisfactions. International Journal of Tourism Research, 5,113-131.
Moore, D. J., and Harris, W. D. (1996). Affect Intensity and the Consumer's Attitude toward High Impact Emotional Advertising Appeals. Journal of Advertising, 25(2), 37-50.
Morrison, A. M. (2001). Hospitality and Travel Marketing (3rd ed.). Albany: Delmar Thomson Leaming.
Morrison, A. M., Hsieh, S., and O'Leary, J. T. (1994). Segmenting the Australian Domestic Travel Market by Holiday Activity Participation. The Journal of Tourism Studies, 5(1), 39-56.
Moscardo, G. M., Morrison, A. M., Pearce, P. L., Lang, C.-T., and O'Leary, J. T. (1996). Understanding Vacation Destination Choice Through Travel Motivation and Activities. Journal of Vacation Marketing, 2(2), 109-122.
296

References
Moscardo, G. M., and Pearce, P. L. (1986). Historic Themeparks: An Australian Experience in Authenticity. Annals of Tourism Research, 73(3), 467-479.
Moutinho, L. (1987). Consumer Behaviour in Tourism. European Journal of Marketing 27(10) 5-44.
Mowen, J. C, and Minor, M. (1998). Consumer Behavior {5ih ed.). New Jersey: Prentice-Hall.
Mueller, T. (1991). Using Personal Values to Define Segments in an International Tourism Market. International Marketing Review, 8(1), 57-70.
Muller, T. E. (1991). Using Personal Values to Define Segments in an International Tourism Market. International Marketing Review, 8(1), 57-70.
Mundfrom, D. J., Shaw, D. G., and Ke, T. L. (2005). Minimum Sample Size Recommendations for Conducting Factor Analyses. International Journal of Testing, 5(2), 159-168.
Munsters, W. (1996). Cultural Tourism in Belgium. In G. Richards (Ed.), Cultural Tourism in Europe (pp. 109-126). Wallingford: CAB International.
Murray, E. J. (1964). Motivation and Emotion. Englewood Cliffs: Prentice-Hall.
Murray, H. A. (1938). Explorations in Personality. London: Oxford University Press.
Nasser, F., and Wisenbaker, J. (2003). A Monte Cario Study Investigating the Impact of Item Parceling on Measures of Fit in Confirmatory Factor Analysis. Educational and Psychological Measurement 63(October), 729-757.
Netemeyer, R. G., Bearden, W. O., and Sharma, S. (2003). Scaling Procedures: Issues and Applications. Thousand Oaks, California: Sage Publications, Inc.
Nicholson, R. E., and Pearce, D. G. (2000). Who Goes to Events: A Comparative Analysis of the Profile Characteristics of Visitors to Four South Island Events. Journal of Vacation Marketing, 6(3), 236-253.
Nicholson, R. E., and Pearce, D. G. (2001). Why do People Attend Events: A Comparative Analysis of Visitor Motivations at Four South Island Events. Journal of Travel Research, 39(4), 449-460.
Norusis, M. J. (1990). SPSS Introductory Statistics Student Guide. Chicago: SPSS Inc.
Novak, T., and MacEvoy, B. (1990). On Comparing Alternative Segmentation Schemes: The List of Values (LOV) and Values and Life Styles (VALS). Journal of Consumer Research, 77(June), 105-109.
Nugent, H. (1999). Securing the Future: Major Performing Arts Inquiry Final Report. Canberra: Department of Communications, Information Technology and the Arts.
Nunnally, J. C. (1967). Psychometric Method. New York: McGraw-Hill Book Company.
Nunnally, J. C, and Bernstein, I. H. (1994). Psychometric Theory (3rd ed.). New York: McGraw Hill Inc.
O'Halloran, M., and Allcock, A. (2000). Profile of the Heritage Tourism Market. BTR Tourism Research Report, 2(2), 13-19.
O'Leary, S., and Deegan, J. (2005). Ireland's Image as a Tourist Destination in France: Attribute Importance and Performance. Journal of Travel Research, 43(3), 247-246.
Oh, H. (2001). Revisiting Importance-Performance Analysis. Tourism Management 22, 616-627.
Oh, H., Kim, B.-Y., and Shin, J.-H. (2004). Hospitality and Tourism Marketing: Recent Developments in Research and Future Directions. Hospitality Management, 23(5), 425-447.
Oliver, R. L. (1976). Hedonic Reactions to the Disconfirmation of Product Performance Expectations: some Moderating Conditions. Journal of Applied Psychology, 61, 246-250.
297

References
Oliver, R. L. (1979). Product Satisfaction as a Function of Prior Expectation and Subsequent Disconfirmation: New Evidence. In R. Day & H. K. Hunt (Eds.), New Dimensions of Consumer Satisfaction and Complaining Behaviour (pp. 66-71). Bloomington: Indiana University.
Oliver, R. L. (1980a). A Cognitive Model of the Antecedents and Consequences of Satisfaction Decisions. Journal of Marketing Research, 77(November), 460-469.
Oliver, R. L. (1980b). Theoretical Bases of Consumer Satisfaction Research: Review, Critique, and Future Direction, American Marketing Association Second Special Conference on Marketing Theory. United States.
Oliver, R. L. (1981). Measurement and Evaluation of Satisfaction Process in Retail Settings. Journal of Retailing, 57(Fall), 25-48.
Oliver, R. L. (1994). Conceptual Issues in The Structural Analysis of Consumption Emotion, Satisfaction, and Quality: Evidence in a Service Setting. Advances in Consumer Research, 21 {^), ^6-22.
Oliver, R. L. (1997). Satisfaction: A Behavioral Perspective on the Consumer. Boston, Massachusetts: Irwin McGraw-Hill.
Olney, T. J., Holbrook, M. B., and Batra, R. (1991). Consumer Responses to Advertising: The Effects of Ad Content, Emotions, and Attitude Toward the Ad on Viewing Time. Journal of Consumer Research, 77(March), 440-453.
Ostrom, T. M. (1969). The Relationship between the Affective, Behavioral, and Cognitive Components of Attitudes. Journal of Experimental Psychology, 5, 12-30.
Otto, J. E., and Ritchie, J. R. B. (1996). The Service Experience in Tourism. Tourism Management 77(3), 165-174.
Page, C, and Meyer, D. (2000). Applied Research Design for Business and Management. Sydney: McGraw-Hill.
Parasuraman, A., Berry, L. L., and Zelthaml, V. A. (1991). Understanding Customer Expectations of Service. Sloan Management Review, 32(3), 39-48.
Parasuraman, A., Zelthaml, V. A., and Berry, L. L. (1985). A Conceptual Model of Service Quality and Its Implications for Future Research. Journal of Marketing, 49(Fall), 41-50.
Parasuraman, A., Zelthaml, V. A., and Berry, L. L. (1988). SERVQUAL: A Multiple-item Scale for Measuring Consumer Perceptions of Service Quality. Journal of Retailing, 64(1), 12-40.
Parasuraman, A., Zelthaml, V. A., and Berry, L. L. (1994a). Alternative Scales for Measuring Service Quality: A Comparative Assessment Based on Psychometric and Diagnostic Criteria. Journal of Retailing, 70(3), 201-230.
Parasuraman, A., Zelthaml, V. A., and Berry, L. L. (1994b). Reassessment of Expectations as a Comparison Standard in Measuring Service Quality: Implications for Further Research. Journal of Marketing, 58(January), 111-124.
Pearce, P. L. (1982). The Social Psychology of Tourist Behaviour (Vol. 3). Oxford: Pergamon.
Pearce, P. L. (1988). The Ulysses Factor: Evaluating Visitors in Tourist Settings. New York: Springer-Veriag.
Pearce, P. L., and Caltablano, M. L. (1983). Inferring Travel Motivation from Travelers' Experiences. Journal of Travel Research, 22(Fall), 16-20.
Pearce, P. L., and Lee, U.-l. (2005). Developing the Travel Career Approach to Tourist Motivation. Journal of Travel Research, 43(3), 226-237.
Peleggi, M. (1996). National Heritage and Global Tourism in Thailand. Annals of Tourism Research, 23(2), 432-438.
298

References
Peter, P. J. (1979). Reliability: A Review of Psychometric Basics and Recent Marketing PracWces. Journal of Marketing Research, 7979(16), 1.
Pitts, R., and Woodside, A. G. (1986). Personal Values and Travel Decisions. Journal of Travel Research, 25(Summer), 20-25.
Pizam, A. (1999). Cross-Cultural Tourist Behavior. In A. Pizam & Y. Mansfeld (Eds.), Consumer Behavior in Travel and Tourism (pp. 393-411). New York: The Haworth Hospitality Press.
Pizam, A., and Calantone, R. (1987). Beyond Psychographics - Values as Determinants of Tourist Behaviour. International Journal of Hospitality Management 6(3), 177-181.
Pizam, A., and Mansfeld, Y. (Eds.). (1999). Consumer Behavior in Travel and Tourism. New York: The Haworth Hospitality Press.
Plog, S. C. (1974). Why Destination Areas Rise and Fall in Popularity. The Cornell Hotel and Restaurant Administration Quarterly, 14(4), 55-58.
Plog, S. C. (1990). A Carpenter's Tools: An Answer to Stephen L.J. Smith's Review of Psychocentrism/Allocentrism. Journal of Travel Research, 28(4), 43-45.
Poria, Y., Reichel, A., and Biran, A. (2006). Heritage Site Perceptions and Motivations to Visit. Journal of Travel Research, 44(3), 318-326.
Prentice, R. C. (1993a). Motivations of the Heritage Consumer in the Leisure Market: An Application of the Manning-Haas Demand Hierarchy. Leisure Sciences, 15, 273-290.
Prentice, R. C. (1993b). Tourism and Heritage Attractions. United Kingdom: Routiedge.
Prentice, R. C, Davies, A., and Beeho, A. (1997). Seeking Generic Motivations for Visiting and Not Visiting Museums and Like Cultural Attractions. Museum Management and Curatorship, 76(1), 45-70.
Prentice, R. C, Witt, S. F., and Hamer, C. (1998). Tourism as Experience: The Case of Heritage Parks. Annals of Tourism Research, 25(1), 1-24.
Prohaska, S. S. (1995). Trends in Cultural Heritage Tourism. In M. V. Colin & T. Baum (Eds.), Tourism: Management Principles and Practice (pp. 35-51). Chichester: Wiley.
Raybould, M., Digance, J., and McCullough, C. (1999). Fire and Festival: Authenticity and Visitor Motivation at an Australian Folk Festival. Pacific Tourism Review, 3, 201-212.
Regan, D. T., and Fazio, R. H. (1977). On the Consistency between Attitudes and Behavior: Look to the Method of Attitude Formation. Journal of Experimental Social Psychology, 13, 28-45.
Reisinger, Y. (1994). Tourist-Host Contact as a Part of Cultural Tourism. World Leisure and Recreation, 36(Summer), 24-28.
Reisinger, Y. (2005). Leisure Travel: National Trends, Cultural Differences. Journal of Vacation Marketing, 77(3), 195-196.
Reisinger, Y., and Turner, L. (1998a). Asian and Western Cultural Differences: The New Challenge for Tourism Marketplaces. Journal of International Hospitality, Leisure & Tourism Management, 7(3), 21-35.
Reisinger, Y., and Turner, L. (1998b). Cross-Cultural Differences in Tourism: A Strategy for Tourism Marketers. Journal of Travel & Tourism Marketing, 7(4), 79-106.
Reisinger, Y., and Turner, L. (2002a). Cultural Differences between Asian Tourist Markets and Australian Hosts. Part 1. Journal of Travel Research, 40(3), 295-313.
Reisinger, Y., and Turner, L. (2002b). Cultural Differences between Asian Tourist Markets and Australian Hosts. Part 2. Journal of Travel Research, 40(4), 374-384.
Reisinger, Y., and Turner, L. W. (2003). Cross-Cultural Behaviour in Tourism: Concepts and Analysis. Oxford: Butterworth Heinemann.
Rentschler, R. (Ed.). (1999). Innovative Arts Marketing. Sydney: Allen & Unwin.
299

References
Richards, B. (1994). How to Market Tourist Attractions, Festivals and Special Events: A Practical Guide to Maximising Visitor Attendance and Income. United Kingdom: Longman Group Ltd.
Richards, G. (1996a). Production and Consumption of European Cultural Tourism. Annals of Tourism Research, 23(2), 261-283.
Richards, G. (2001a). The Development of Cultural Tourism in Europe. In G. Richards (Ed.), Cultural Attractions and European Tourism (pp. 3-29). Wallingford: CABI Publishing.
Richards, G. (Ed.). (1996b). Cultural Tourism in Europe. Wallingford: CAB International.
Richards, G. (Ed.). (2001b). Cultural Attractions and European Tourism. Wallingford: CABI Publishing.
Richards, G., and Queiros, C. (2005). ATLAS Cultural Tourism Research Project 2004. Barcelona: ATLAS.
Robinson, M., Evans, N., and Callaghan, P. (Eds.). (1996). Culture as the Tourist Product Tourism and Culture Towards the 21st Century Conference Proceedings. Great Britain: Centre for Travel and Tourism/Business Education Publishers Ltd.
Roggenbuck, J. W., Loomis, R. J., and Dagostino, J. V. (1991). The Learning Benefits of Leisure. In B. L. Driver, P. J. Brown & G. L. Peterson (Eds.), Benefits of Leisure (pp. 195-213). State College, PA: Venture Publishing.
Rokeach, M. (1968). Beliefs, Attitudes, and Values. San Francisco: Jossey-Bass.
Rokeach, M. (1973). The Nature of Human Values. New York: Free Press.
Rosenberg, M. J. (1968). Medonism, Inauthenticity, and Other Goals Toward Expansion in a Consistency Theory. In R. P. Abelson (Ed.), Theories of Cognitive Consistency: A Source Book. Chicago: Rand-McNally,
Ryan, C. (1999). From the Psychometrics of SERVQUAL to Sex: Measurements of Tourist Satisfaction. In A. Pizam & Y. Mansfeld (Eds.), Consumer Behaviour in Travel and Tourism (pp. 267-286). New York: The Haworth Hospitality Press.
Ryan, C. (Ed.). (2002). The Tourist Experience. London: Continuum.
Ryan, C, and Mo, X. (2001). Chinese Visitors to New Zealand - Demographics and. Perceptions. Journal of Vacation Marketing, 8(1), 13-27.
Schiffman, B., and Kanuk, W. (1997). Consumer Behaviour. Sydney: Prentice Hall Australia.
Schneider, I. E., and Backman, S. J. (1996). Cross-Cultural Equivalence of Festival Motivations: A Study in Jordan. Festival Management and Event Tourism, 4(3/4), 139-144.
Schreiber, J. B., Nora, A., Stage, F. K., Bartow, E. A., and King, J. (2006). Reporting Structural Equation Modeling and Confirmatory Factor Analysis Results: A Review. The Journal of Educational Research, 99(6), 323-337.
S.chrocer, R. (1991). Maxlow's Hierarchy of Needs as a Framework for Identifying Emotional Triggers. Marketing Review, 46(5), 26,28.
Schuman, H., and Johnson, M. P. (1976). Attitudes and Behavior. Annual Reivew of Sociology, 2, 161-207.
Schutte, H., and Ciariante, D. (1998). Consumer Behaviour in Asia. London: Macmillan Press Ltd.
Scott, D. (1996). A Comparison of Visitors' Motivations to Attend Three Urban Festivals. Festival Management and Event Tourism, 3(3), 121-128.
Scott, W. A. (1968). Attitude Measurement. In G. Lindzey & E. Aronson (Eds.), The Handbook of Social Psychology (2r)d ed.). Reading, MA: Addison-Wesley.
Sculpin, R. (1999). Cultural Anthropology: A Global Perspective (4th ed.). New Jersey: Alfred A Knopf.
300

References
Sharpley, R. (1994). Tourism, Tourists and Society. Cambridgeshire: ELM Publications.
Shih, D. (1986). VALS as a Tool of Tourism Market Research: The Pennsylvania Experience. Journal of Travel Research, 24(4), 2-11.
Shoemaker, S. (1994). Segmenting the U.S. Travel Market According to Benefits Realized. Journal of Travel Research, 33(2), 8-21.
Sllberberg, T. (1995). Cultural Tourism and Business Opportunities for Museums and Heritage Sites. Tourism Management 76(5), 361-365.
Skidmore, S., and Pyszka, R. (1987). US International Pleasure Travel Market - A Values Perspective. Tourism Management 8(2), 121-122.
Smith, M. B. (1947). The Personal Setting of Public Opinions: A Study of Attitudes toward Russia. Public Opinion Quarterly, 11, 507-523.
Smith, S. L. J. (1989). Tourism Analysis. Essex: Longman Scientific & Technical.
Snepenger, D., King, J., Marshall, E., and Uysal, M. (2006). Modeling Iso-Ahola's Motivation Theory in the Tourism Context. Journal of Travel Research, 45(2), 140-149.
Spangenberg, E. R., Voss, K. E., and Crowley, A. E. (1997). Measuring the Hedonic and Utilitarian Dimensions of Attitude: A Generally Applicable Scale. Advances in Consumer Research, 24, 235-241.
Stebbins, R. A. (1996). Cultural Tourism as Serious Leisure. Annals of Tourism Research, 23, 948-950.
Steenkamp, J.-B. E. M., and Baumgartner, H. (1998). Assessing Measurement Invariance in Cross-National Consumer Research. Journal of Consumer Research, 25(1), 78-90.
Steidl, P. (1997). Marketing Strategies for Arts Organisations. Sydney: Australia Council for the Arts.
Sudman, S. (1983). Applied Sampling. In P. H. Rossi, J. D. Wright & A. B. Anderson (Eds.), Handbook of Survey Research. New York: Academic Press.
Sung, H. Y., Morrison, A. M., and O'Leary, J. T. (2000). Segmenting the Adventure Travel Market by Activities: From the North American Industry Providers' Perspective. Journal of Travel & Tourism Marketing, 9(4), 1-20.
Swanson, S. R., and Davis, J. C. (2006). Arts Patronage: A Social Identity Perspective. Journal of Marketing Theory and Practice, 74(2), 125-138.
Teas, R. K. (1993). Expectations, Performance Evaluation, and Consumers' Perceptions of Quality. Journal of Marketing, 57(4), 18-34.
Teas, R. K. (1994). Expectations as a Comparative Standard in Measuring Service Quality: An Assessment of a Reassessment. Journal of Marketing, 58(1), 132-138.
Thompson, B. (1997). The Importance of Structure Coefficients in Structural Equation Modeling Confirmatory. Factor Analysis. Educational and Psychological Measurement, 57(1), 5-19.
Thorburn, A. (1986). Marketing Cultural Heritage. Travel and Tourism Analyst{December), 39-48.
Thrane, C. (1997). Vacation Motives and Personal Value Systems. Journal of Vacation Marketing, 3(3), 234-244.
Thrane, C. (2002). Music Quality, Satisfaction, and Behavioral Intentions within a Jazz Festival Context. Event Management 7(3), 143-150.
Thurstone, L. L. (1931). The Measurement of Attitudes. Journal of Abnormal and Social Psychology, 26, 249-269.
Tian, S., Crompton, J. L., and Witt, P. A. (1996). Integrating Constraints and Benefits to Identify Responsive Target Markets for Museum Attractions. Journal of Travel Research, 35(2), 34-45.
301

References
Tighe, A. J. (1985). Cultural Tourism in the USA. Tourism Management December(\N\nter), 234-251.
Tighe, A. J. (1986). The Arts/Tourism Partnership. Journal of Travel Research, 24(3), 2-5.
Timothy, D. J. (1997). Tourism and the Personal Heritage Experience. Annals of Tourism Research, 24(3), 751-754.
Tourism Australia. (2005). Inbound Tourism Trends, Year ended 30 December 2004. Retrieved 10 August 2005. from www.tourism.australia.com.
Tourism Research Australia. (2004). International Visitors in Australia. Canberra: Tourism Research Australia.
Tourism Research Australia. (2006a). International Visitors in Australia: December Quarter 2005. Canberra: Tourism Research Australia.
Tourism Research Australia. (2006b). International Visitors in Australia: March Quarter 2006. Canberra: Tourism Research Australia.
Tourism Victoria. (2002). Victoria's Arts, Theatre and Cultural Heritage Tourism Plan 2002-2006. Retrieved 10 August 2005. from vwtw.tourismvictoria.com.au.
Tourism Victoria. (2003). Cultural Tourism. Retrieved 10 August 2005. from vww.tourismvictoria.com.au.
Tourism Victoria. (2004a). Motivations and Behaviours of Interstate Cultural Tourists. Retrieved 10 August 2005. from www.tourismvictoria.com.au.
Tourism Victoria. (2004b). Victoria Market Profile Year Ending June 2004. Retrieved 10 August 2005. from www.tourismvictoria.com.au.
Tourism Victoria. (2005a). Domestic Overnight Visitors to Victoria by Origin. Retrieved 10 August 2005. from www.tourismvictoria.com.au.
Tourism Victoria. (2005b). International Visitor Forecasts 2005-2014. Retrieved 10 August 2005. from www.tourismvictoria.com.au.
Tourism Victoria. (2005c). Victoria Market Profile Year Ending June 2005. Retrieved 26 June 2006. from www.tourismvictoria.com.au.
Tourism Victoria. (2006a). International Visitor Forecast 2006-2015. Retrieved 25 June 2006. from www.tourismvictoria.com.au.
Tourism Victoria. (2006b). Victoria Market Profile Year Ending June 2006. Retrieved 20 March 2006. from www.tourismvictoria.com.au.
Tourism Victoria. (2007). Domestic Visitation to Victoria by Origin Year Ending December 2006. Retrieved 20 March 2007. from www.tourismvictoria.com.au.
Trompenaars, E. (1993). Riding the Waves of Culture. London: Economist Books.
Tse, D., and Wilton, P. C. (1988). Models of Consumer Satisfaction Formation: An Extension. Journal of Marketing Research, 25(May), 204-212.
Turner, L., Reisinger, Y., and McQuilken, L. (2001). How Cultural Differences Cause Dimensions of Tourism Satisfaction. Journal of Travel & Tourism Marketing, 77(1), 79-101.
United Nations, and World Tourism Organisation. (1994). Recommendations on Tourist Statistics. New York: United Nations.
Urry, J. (1990). The Tourist Gaze: Leisure and Travel in Contemporary Society. London: Sage.
Usher, R. (2005, August 2). One Budget, Two Art Galleries. The Age, p. 15.
Usunier, J.-C, and Lee, J. A. (2005). Marketing Across Cultures (4th ed.). England: Pearson Education Ltd.
302

References
Uysal, M., Gahan, L., and Martin, B. (1993). An Examination of Event Motivations: A Case Study. Festival Management and Event Tourism, 7(1), 5-10.
Uysal, M., and JurowskI, C. (1993). An Empirical Testing of the Push and Pull Factors of Tourist Motivations. Paper presented at the 1993 CHRIE Conference, Chicago.
van Zyl, C, and Botha, C. (2004). Motivational Factors of Local Residents to Attend the Aardklop National Arts Festival. Event Management 8(4), 213-222.
Vaske, J. J., Beaman, J., Stanley, R., and Grenier, M. (1996). Importance-Pert^ormance and Segmentation: Where Do We Go from Here? Journal of Travel & Tourism Marketing, 5(3), 225-240.
Victorian Government. (2005). Victoria's Tourism and Events Industry - Building a 10-year Government Strategy Discussion Paper. Melbourne: Department of Innovation, Industry & Regional Development.
Voss, K. E., Spangenberg, E. R., arid Grohmann, B. (2003). Measuring the Hedonic and Utilitarian Dimensions of Consumer Attitude. Journal of Marketing Research, 40(3), 310-320.
Vroom, V. H. (1964). Work and Motivation. New York: Wiley.
Waller, J., and Lea, S. E. G. (1998). Seeking the Real Spain?: Authenticity in Motivation. Annals of Tourism Research, 25(4), 110-129.
Walmsley, D. J., and Young, M. (1998). Evalutive Images and Tourism: The Use of Personal Constructs to Describe the Structure of Destination Images. Journal of Travel Research, 36(3), 65-69.
Weaver, P., Kaufman, T. J., and Yoon, Y. (2002). A Market Segmentation Study Based on Benefits Sought by Visitors at Heritage Sites. Tourism Analysis, 6(3/4), 213-222.
Weiler, B., and Yu, X. (2004). Understanding Experiences of Chinese Visitors to Victoria, Australia. Australia: CRC for Sustainable Tourism.
Wells, W. D., and Tigert, D. J. (1971). Activities, Interests and Opinions. Journal of Advertising Research, 11(4), 27-35.
Wiener, L. (1980). Cultural Resources; An Old Asset - A New Market for Tourism. Journal of Cultural Economics, 4(1), 1-7.
Witt, C. A., and Wright, P. L. (1992). Tourist Motivation: Life after Maslow. In P. Johnson & B. Thomas (Eds.), Choice and Demand in Tourism (pp. 35-55). London: Mansell.
Woodside, A. G., and Jacobs, L. W. (1985). Step Two in Benefit Segmentation: Learning the Benefits Realized by Major Travel Markets. Journal of Travel Research, 24(1), 7-13.
Worid Tourism Organisation. (1985). The State's Role in Protecting and Promoting Culture as a Factor of Tourism Development and the Proper Use and Exploitation of the National Cultural heritage of Sites and Monuments for Tourism. Madrid: World Tourism Organisation.
Yau, O. H. M. (1994). Consumer Behaviour in China: Customer Satisfaction and Cultural Values. New York: Routiedge.
Yi, Y. (1990). A Critical Review of Consumer Satisfaction. In V. A. Zelthaml (Ed.), Review of Marketing 1990 (pp. 68-123). Chicago: American Marketing Association.
Yin, R. K. (2003). Case Study Research, Design and Methods (3rd ed.). Thousand Oaks, California: Sage Publications.
Yoon, Y., and Uysal, M. (2005). An Examination of the Effects of Motivation and Satisfaction on Destination Loyalty: A Structural Model. Tourism Management, 26(1), 45-56.
Yu, X., and Weiler, B. (2006). The Experiences of Chinese Visitors to Victoria Australia. Melbourne: Monash University Department of Management Working Paper Series.
Yuan, S., and McDonald, C. (1990). Motivational Determinates of International Pleasure Time. Journal of Travel Research, 29(1), 42-44.
303

References
Yuksel, A., and Yuksel, F. (2001). Measurement and Management Issues in Customer Satisfaction Research: Review, Critique and Research Agenda: Part Two. Journal of Travel & Tourism Marketing, 70(4), 81-111.
Zajonc, R. A., and Markus, H. (1982). Affective and Cognitive Factors in Preferences. Journal of Consumer Research, 9(September), 123-131.
ZeithamI, V. A., and Bitner, M. J. (2000). Services Marketing: Integrating Customer Focus across the Firm. New York: McGraw-Hill.
ZeithamI, V. A., Parasuraman, A., and Berry, L. L. (1990). Delivering Quality Service: Balancing Customer Perceptions and Expectations. New York: The Free Press.
Zeitiin, D. M., and Westwood, R. A. (1986). Measuring Emotional Response. Journal of Advertising f?esearc/7(October-November), 34-44.
Zeppel, H., and Hall, C. M. (1991). Selling Art and History: Cultural Heritage and Tourism. The Journal of Tourism Studies, 2(1), 29-45.
Zeppel, H., and Hall, C. M. (1992). Review. Arts and Heritage Tourism. In B. Weiler & 0. M. Hall (Eds.), Special Interest Tourism (pp. 47-69). London: Belhaven Press.
Zhang, H. Q., and Heung, V. C. S. (2001). The Emergence of the Mainland Chinese Outbound Travel Market and Its Implications for Tourism Marketing. Journal of Vacation Marketing, 8(1), 7-12.
Zikmund, W. G. (2000). Business Research Methods (6th ed.). Florida: Dryden Press.
Zuckerman, M. (1990). The Psychophysiology of Sensation Seeking. Journal of Personality, 58(1), 313-345.
304

Appendices
APPENDICES
1 Survey Instruments and Cover Letter - English Version A.1
2 Survey Instruments and Cover Letter - Chinese (Simplified) Version A.2
3 Survey Instrument - Chinese (Traditional) Version A.3
4 Survey Instruments and Cover Letter - Japanese Version A.4
5 Data Collection Show Cards — English Version A.5
6 Data Collection Show Cards — Chinese (Simplified) Version A.6
7 Data Collection Show Cards — Japanese Version A.7
305

Appendices
Appendices
Appendix 1: Survey Instruments and Cover Letter- English Version

Victoria University
PO Box 14428 Melbourru.,' VlC 800!
Tif/iephone; (03) 9919 4430 facsimde; (03) 99!9 4931
VICTORIA : UNIVERSITY
School ol Hospitality, fowrism & MaHketin§ Footscray Perk Can-pus
Boltaicit Rood
Foofscray
We would like to invite you to be part of a study into why tourists attend cultural attractions and events
A Victoria University research project being undertaken by Pandora Kay as part of the requirements for a PhD
supervised by Dr Lindsay Turner
Your participation would be to complete A SURVEY OF TOURISTS to Queen Victoria Market
Information to Survey Participants The results of the study will be used to understand why tourists attend tocai cultural attractions and events and lo identify tourist market segments for whorti appropriate marl<eting strategies can be developed.
Participants to be surveyed have been recruited by being the first encountered, at (east 18 years of age, and are a tourist to Melbourne (internationaf or domestic interstate). If in a group, then the preferred respondent will be the person whose birthday is nearest to 30 June.
Your participation is voluntary and there is no advantage or disadvantage to the person participating in the survey. You can withdraw from this survey al any time and this withdrawal will not jeopardise you in any way.
Piease be assured that your infornnation and answers to these questions WNI remain strictly confidential and anonymous whereby no information will be released in a way that would enable any person to be identified.
If you would like information of the completed study, please provide your business card or address to the researcher, Pandora Kay.
If you have any queries or complaints about the way you have been treated, you may cqntaci the Human Research Ethics Committee, Victoria University
Contact Details for Pandora Kay:
School of Hospitality, Tourism and Marketing Faculty of Business and Law
Foofscray Park Campus Victoria University
P.O. Box 14428, Melbourne City MC 8001 Australia
Telephone : 61 3 9919 5367 Fax: 613 9919 4931 Email; [email protected],au
WINNER
«BN «37;6954731 Victoria U'MW%iV<^ k.. KnukKjv !>V<,rYib.-J-.

Intercept Questions (record number for this intercept sheet)
(record date)
Hello, my name is and I am an interviewer for a Victoria University study on tourists attending cultural attractions and events in Melbourne and your visit to the Queen Victoria Market. The following questions will take less than 5 minutes to complete and the full survey will only take 15 minutes, if you are eligible. We hope you will help us to learn about tourists' cultural experiences. Your answers will remain strictly confidential and anonymous.
Q1.1 What region or country do you live in? (Show card No. 1) (Circle one) Australia New Zealand North America North East Asia South East Asia United Kingdom and Ireland Other (please record country)
01 02 03 04 05 06 07
Go to 01.2 Go to 01.3 Go to 01.3 Go to 01.3 Go to 01.3 Go to 01.3
*
*(lf not living in any of these, the respondent is not eligible to participate in this study, end interview and thanl< them for their time)
01.2 If you live in Australia as a permanent resident, in which state or territory do you live? (Circle one) New South Wales Northern Territory Queensland South Australia Tasmania Victoria Western Australia
01 02 03 04 05 06 07
Go to 01.3 *
Go to 01.3 Go to 01.3
*
* *
*(lf not living in NSW, Qld or South Australia, the respondent is not eligible to participate in this study, end interview and thank them for their time)
01.3 What language is the one most spoken at home? (Circle one) English Chinese (Mandarin) Chinese (Cantonese) Chinese (Dialect) Japanese Other (please record language)
01 02 03 04 05 06
Go to 01.4 Go to 01.4 Go to 01.4 Go to 01.4 Go to 01.4
*
*(lf not English, Chinese or Japanese, end interview and thank them for their time)
Q1.4 How many nights are you staying in Melbourne this trip? (Circle one) 1-3 nights 4-7 nights 8-14 nights 15 or more nights
01 02 03 04
Go to 01.5 Go to 01.5 Go to 01.5 Go to 01.5
(If staying less than one night or more than one year, end interview and thank them for their time)
01.5 What is your age group? (Circle one)
18-24 25-34 35-44 45-54
(If under 18 years of age, end interview and thank them for their time)
55-64 65-74 75+
01.6 Record gender
female ....01
(Circle one)
male ....02
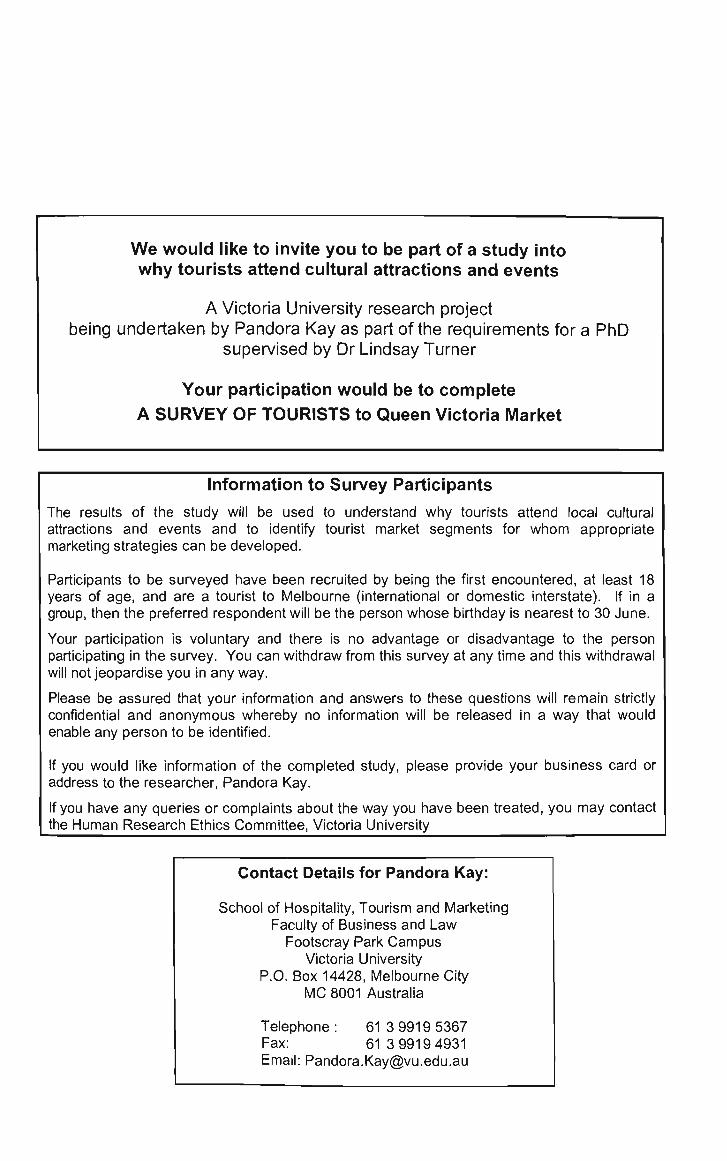
We would like to invite you to be part of a study into why tourists attend cultural attractions and events
A Victoria University research project being undertaken by Pandora Kay as part of the requirements for a PhD
supervised by Dr Lindsay Turner
Your participation would be to complete A SURVEY OF TOURISTS to Queen Victoria Market
Information to Survey Participants The results of the study will be used to understand why tourists attend local cultural attractions and events and to identify tourist market segments for whom appropriate marketing strategies can be developed.
Participants to be surveyed have been recruited by being the first encountered, at least 18 years of age, and are a tourist to Melbourne (international or domestic interstate). If in a group, then the preferred respondent will be the person whose birthday is nearest to 30 June.
Your participation is voluntary and there is no advantage or disadvantage to the person participating in the survey. You can withdraw from this survey at any time and this withdrawal will not jeopardise you in any way.
Please be assured that your information and answers to these questions will remain strictly confidential and anonymous whereby no information will be released in a way that would enable any person to be identified.
If you would like information of the completed study, please provide your business card or address to the researcher, Pandora Kay.
If you have any queries or complaints about the way you have been treated, you may contact the Human Research Ethics Committee, Victoria University
Contact Details for Pandora Kay:
School of Hospitality, Tourism and Marketing Faculty of Business and Law
Foofscray Park Campus Victoria University
P.O. Box 14428, Melbourne City MC 8001 Australia
Telephone : 61 3 9919 5367 Fax: 613 9919 4931 Email: [email protected]

(record intercept sheet number onto this survey)
(record date)
A SURVEY OF TOURISTS visiting Queen Victoria Market
(hand over 'Information to Survey Participants' letter)
(read) Instructions to Survey Participants
On the following pages, you will be presented with a series of questions about you and your cultural tourism experiences. You will be asked to answer all questions, even if some may appear similar.
If uncertain about some answers, please make the best estimate.
If you are unable to answer some questions, please complete the rest of the survey.
We are interested in ALL your comments, whether they are POSITIVE or NEGATIVE
Your completion of this survey is given as your consent to participate.
The personal interview survey should take approximately 10 minutes to complete.

02. Please indicate the extent to which you agree or disagree with the following statements about what cultural experiences you like.
(Show card No.2 - read statements randomly, ask respondent to indicate a level of agreement and circle the appropriate response)
(Q
O
Tot
ally
Dis
agre
e
Dis
agre
e
Slig
htly
Dis
agre
e
Slig
htly
Agr
ee
Agr
ee
Tot
ally
Agr
ee
2.1 to art galleries 1 2 3 4 5 6
2.2 to classical music performances 1 2 3 4 5 6
2.3 to modern music performances 1 2 3 4 5 6
2.4 to the ballet 1 2 3 4 5 6
2.5 to dance performances 1 2 3 4 5 6
2.6 to the opera 1 2 3 4 5 6
2.7 to theatrical performances of written stories 1 2 3 4 5 6
2.8 to musicals 1 2 3 4 5 6
2.9 to museums 1 2 3 4 5 6
2.10 to arts and cultural festivals 1 2 3 4 5 6
2.11 to historic buildings, sites, and monuments 1 2 3 4 5 6
2.12 to Australian Aboriginal cultural performances 1 2 3 4 5 6 and exhibitions
2.13 to markets 1 2 3 4 5 6
2.14 to cultural performances held in historical 1 2 3 4 5 6
settings
2.15 to cultural experiences involving Australian 1 2 3 4 5 6
history
2.16 to see Australian art 1 2 3 4 5 6
2.17 to cultural experiences because they are related 1 2 3 4 5 6
to my work
2.18 to cultural experiences to have fun 1 2 3 4 5 6
2.19 to cultural experiences to make others happy 1 2 3 4 5 6
2.20 to cultural experiences that my friends and 1 2 3 4 5 6
family have done
2.21 to cultural experiences because local people 1 2 3 4 5 6
attend
2.22 to cultural experiences that have been 1 2 3 4 5 6
recommended by others 2.23 to famous cultural places 1 2 3 4 5 6
2.24 to see famous performers/entertainers 1 2 3 4 5 6
2,25 to see famous shows performed 1 2 3 4 5 6
2.26 to cultural experiences to learn 1 2 3 4 5 6
2.27 to cultural experiences for a sense of escaping 1 2 3 4 5 6
into another world and getting away from it all
2.28 to cultural experiences for the chance to interact 1 2 3 4 5 6 with others
2.29 to cultural experiences on package tours 1 2 3 4 5 6

03 Please indicate the extent to which you agree or disagree with the following statements about why you go to cultural attractions and events while travelling.
(Show card No.3 - read statements randomly, ask respondent to indicate a level of agreement and circle the appropriate response)
S .2 g, £ 5 $ Q < ^ ^ '- — — >.
1 go to cultural attractions and events while l ^ ^ ^ P = •Q M .2' .2> te, -g
travelling K b w w < H 3.1 to have fun 1 2 3 4 5 6
3.2 to be entertained by others 1 2 3 4 5 6
3.3 to relax physically 1 2 3 4 5 6
3.4 to relax mentally 1 2 3 4 5 6
3,5 to have thrills and excitement 1 2 3 4 5 6
3.6 to get emotionally involved 1 2 3 4 5 6
3.7 to do something 1 want to do 1 2 3 4 5 6
3.8 to do something with my family and friends 1 2 3 4 5 6
3,9 to do something by myself 1 2 3 4 5 5
3,10 to meet locals 1 2 3 4 5 6
3.11 to learn about local culture 1 2 3 4 5 6
3.12 to learn about local history 1 2 3 4 5 6
3.13 to learn about local performing arts 1 2 3 4 5 6
3.14 to do something related to my work 1 2 3 4 5 6
3.15 to enjoy something unique to the destination 1 2 3 4 5 6
3.16 to have a change from my daily routine 1 2 3 4 5 6 3.17 to forget about demands of daily life 1 2 3 4 5 6
3.18 to escape into another world 1 2 3 4 5 6
3.19 to satisfy my curiosity 1 2 3 4 5 6
3.20 to tell my friends and relatives about it 1 2 3 4 5 6
3.21 to enhance my social position 1 2 3 4 5 6
3.22 to see famous cultural places 1 2 3 4 5 6
3.23 to hear famous performers/entertainers 1 2 3 4 5 6
3.24 to see famous shows performed 1 2 3 4 5 6
3.25 to gain the respect of others 1 2 3 4 5 6
3.26 to demonstrate my ability to travel 1 2 3 4 5 6
3.27 to go somewhere safe 1 2 3 4 5 6
3.28 to get value for money 1 2 3 4 5 6
3.29 to have a high quality experience 1 2 3 4 5 6
3.30 to buy goods and souvenirs 1 2 3 4 5 6
3.31 to buy food and drinks to consume at the cultural 1 2 3 4 5 6 experience

04 Please indicate the extent to which you agree or disagree with the following statements about wfiat you expect from your visit to the Queen Victoria Market
(Show card No.4 - read statements randomly, ask respondent to Indicate a level of agreement and circle the appropriate response)
^ s i s s $ Q < ^
From my visit to Queen Victoria IVIarket, 1 s 1" l i •& £ 1 expect... ^ a '^ '^ ^ ^
4.1 to be emotionally involved 1 2 3 4 5 5
4.2 to be physically involved 1 2 3 4 5 6
4.3 to have fun 1 2 3 4 5 5
4,4 to be entertained 1 2 3 4 5 5
4,5 to relax physically 1 2 3 4 5 5
4,6 to relax mentally 1 2 3 4 5 5
4.7 to experience thrills and excitement 1 2 3 4 5 6
4.8 to gain knowledge 1 2 3 4 5 5
4.9 to forget about work and responsibilities 1 2 3 4 5 5 4.10 to escape into another wodd 1 2 3 4 5 5
4.11 to interact with staff 1 2 3 4 5 6
4.12 to interact with other visitors 1 2 3 4 5 6
4.13 to have a good time with my companions 1 2 3 4 5 6
4.14 to gain the respect of others 1 2 3 4 5 6
4.15 to see a famous place 1 2 3 4 5 6
4.16 to enhance my social position 1 2 3 4 5 6
4.17 to get a feeling of accomplishment 1 2 3 4 5 6
4.18 the activities and events to be safe 1 2 3 4 5 6
4.19 to be well informed of the different facilities and 1 2 3 4 5 6
services available 4.20 to receive high quality service 1 2 3 4 5 6
4.21 the activities and events to be delivered at 1 2 3 4 5 6
promised times 4.22 written information to be in my language 1 2 3 4 5 6
4.23 signs to be in my language 1 2 3 4 5 6
4.24 signs to be clear and helpful 1 2 3 4 5 6
4.25 the facilities provided to be clean 1 2 3 4 5 6
4,26 the facilities provided to be comfortable 1 2 3 4 5 6
4,27 facilities for children to be provided 1 2 3 4 5 6
4,28 facilities for disabled visitors to be provided 1 2 3 4 5 6 4.29 good value for money 1 2 3 4 5 6
4.30 a range of goods and souvenirs will be available 1 2 3 4 5 6
for purchase
4.31 a range of food and drinks will be available for 1 2 3 4 5 6 purchase and consumption at the market
4.32 a range of food and drinks will be available to 1 2 3 4 5 6
purchase and take away from the market

Q5 The following questions are about your trip and travel group characteristics on this visit.
5.1 Have you visited Melbourne before? (Circle one)
Yes No
01 02
5.2 What is the main purpose of this trip to Melbourne?
(Circle one) Holiday Visiting friends/relatives Convention/conference Business Employment Education Other
01 02 03 04 05 06 07
5.3 Where are you staying in Melbourne this trip?
(Circle one) Home of friends/relatives Hotel (4 or 5 star) Hotel (3 star) Hotel (2 star or less) Motel Bed & breakfast/guest house Backpacker/youth hostel Serviced apartment Rented house/apartment/unit/flat Own property (e.g. holiday house) Other
01 02 03 04 05 06 07 08 09
10
11
5.4 What main form of transport did you use to get to the Queen Victoria Market?
(Circle one) Bicycle Bus Car Taxi Train Tram Walked Other
01 02 03 04 05 06 07 08
-
5.5 Have you visited the Queen Victoria Market before?
(Circle one) Yes No
01 02
5.6 How did you arrange this visit to the Queen Victoria Market?
(Circle one) Independently 1 01 Organised tour group Other
02 03
5.7 How are you visiting the Queen Victoria Market? (Circle one) Alone As a couple As a group of parents and children With other relatives With friends With family and friends With a tour group With business colleagues Sporting/community group Other
01 02 03
04 05 06 07 08 09 10
5.8 How did you hear about the Queen Victoria Market?
(Circle one or more) Friends/relatives Travel agent Internet Television Magazine Newspaper Radio Brochure Travel guide book Airline Accommodation provider Visitor information centre Tour operator Been there before Walked past Other
01 02 03 04 05 06 07 08 09 10 11 12 13 14 15 16

(read to respondent) This completes part one of the questionnaire and after your visit we hope you will be willing to complete a very short sun/ey of less than 5 minutes about your experience at the Queen Victoria Market.
To match both parts together, please provide a fictional name or some other form of identification to be recorded below and on the 'after visit' survey.
(record fictional name here)
(record fictional name on 'after visit' survey and hand over 'after visit' survey and the return envelope)
(read to respondent) As part of the Quality Assurance process for this research to verify that you were a survey respondent and this survey has been correctly presented to you, could we please have the following details to enable a Victoria University researcher to contact you. Completion of this information is entirely voluntary, but if you choose to do so, your name will be entered in a draw for an iPod nano song player. Completion and return of the 'after visit' survey will give you an additional chance to win the iPod nano player.
Your name:
Your country of residence
Your home phone number:
Your email address:
The completed questionnaires will be kept in a secure place at Victoria University.
(read to respondent) Thank you very much for your time and co-operation in participating in this survey.
Your generous assistance is appreciated.
We would like you to accept this item as a token of our appreciation (hand over item)
We hope you enjoy your stay in Melbourne.
INTERVIEWER DECLARATION (to be completed by interviewer) I certify that I have conducted this interview in accordance with my interviewing guidelines and it is a true and accurate record to the best of my knowledge. I also agree to hold in confidence and not disclose to any other person the content of these questionnaires or any other information relating to this project
INTERVIEWER NAME:
INTERVIEWER SIGNATURE:
DATE:

(inten/iewer to record intercept sheet number onto this survey)
(interviewer to record fictional name here)
Why tourists attend cultural attractions and events
A SURVEY OF TOURISTS after visiting Queen Victoria Market
A Victoria University Research Project being undertaken by Pandora Kay as part of the requirements for a PhD
supervised by Dr Lindsay Turner
Instructions to Survey Participants
On the following pages, you will be presented with a series of questions about you and your cultural tourism experiences. You will be asked to answer all questions, even if some may appear similar.
If uncertain about some answers, please make the best estimate.
If you are unable to answer some questions, please complete the rest of the survey.
We are interested in ALL your comments, whether they are POSITIVE or NEGATIVE
Your completion of this survey is given as your consent to participate.
This survey should take less than 5 minutes to complete.

Part 2: Please indicate the extent to which you agree or disagree with the following statements about what you gained or received from your visit to the Queen Victoria Market
For each of the 32 statements please circle the number that best represents your level of agreement.
a) 2
S .2 i , £
^ I f f « ^ From my visit to the Queen Victoria Market ^ « 2> .w £ s
1- Q CO w < |2
01 1 was emotionally involved 1 2 3 4 5 5
02 1 was physically involved 1 2 3 4 5 5
03 1 had fun 1 2 3 4 5 6
04 1 was entertained 1 2 3 4 5 5
05 1 relaxed physically 1 2 3 4 5 6
06 1 relaxed mentally 1 2 3 4 5 6
07 1 experienced thrills and excitement 1 2 3 4 5 5
08 1 gained knowledge 1 2 3 4 5 6
09 1 forget about work and responsibilities 1 2 3 4 5 5 10 1 escaped into another world 1 2 3 4 5 6
11 1 interacted with staff 1 2 3 4 5 6
12 1 interacted with other visitors 1 2 3 4 5 6
13 1 had a good time with my companions 1 2 3 4 5 5
14 1 gained the respect of others 1 2 3 4 5 6
15 1 saw a famous place 1 2 3 4 5 6
16 1 enhanced my social position 1 2 3 4 5 6
17 1 got a feeling of accomplishment 1 2 3 4 5 5
18 the activities and events were safe 1 2 3 4 5 6
19 1 was well informed of the different facilities and 1 2 3 4 5 5 services available
20 1 received high quality service 1 2 3 4 5 6
21 the activities and events were delivered at 1 2 3 4 5 5 promised times
22 written information was available in my language 1 2 3 4 5 6
23 signs were in my language 1 2 3 4 5 6
24 signs were clear and helpful 1 2 3 4 5 6
25 the facilities were clean 1 2 3 4 5 6
26 the facilities were comfortable 1 2 3 4 5 6
27 facilities for children were provided 1 2 3 4 5 6
28 facilities for disabled visitors were provided 1 2 3 4 5 6
29 1 received good value for money 1 2 3 4 5 6
30 a suitable range of goods and souvenirs were 1 2 3 4 5 6 available for purchase
31 a suitable range of food and drinks were 1 2 3 4 5 6 available for purchase and consumption at the market
32 a suitable range of food and drinks were 1 2 3 4 5 6 available to purchase and take away from the market

Thank you very much for completing this survey.
Your generous assistance is appreciated.
Please return the survey by enclosing it in the addressed postage-paid envelope and posting it
to Pandora Kay, Victoria University
We hope you enjoyed your stay in Melbourne.

Appendices
Appendices
Appendix 2: Survey Instmments and Cover Letter - Chinese (Simplified) Version
A.2

Vkteria University
PO Box H428 Melbourne VIC 8001 (03) 9919 4430
(03) 9919 4931
$ctK>oi oif Hospitolity, Tourism &. MaAeHng Footscroy hifK Campui
Bolbrat Road
Foofscray ____ , „
VICTORIA :. UNIVERSITY
#: t t ]#®^ l^ l l . ^4-y'\^'^7 ^yT ' " •^ -^ !y Mrt$M1-5
o
r®iff$s©is5Ut-, Ii
rv^- hWri^^fc^^^lf # 7fe^^^ifi^<75:titT h^^i^si y^ - f '<y hic;fcs«ffi*r
{ ; , j ; ^ ^ _ y ^ ^ ^ ^ > h ^ ^ i ^ — t ' l « | g T ' 5 f c * ^ ^ i e : ) t ^ — ^ : y h<DM*^#) i ! iliffl$n:l:-ro
::VJW%-T?II. | J J * T t ! $ n 5 « * S ^ 5 ? f « l BizMi%s5.\>'At^^
#t)PLTVv/t,/!:< .^.fc'
l '>oTW*^JI-t)^f)J X*^ivv | ; i t /u , ^ f c
t l i ^ i f i l t Cti.B*'// ^tl6*1/rellltld'5BII
::co|i^fi('#tti~5 igatAii^:) ^ . t fci-igjf *^e>cD)
iPML. i i
-r^Bt^x
/ /VJH/UV
£ t T t ^ i 1 - « ^ /k—:/c ; ) i l# . ^ ' : LV'[5l##-ii. i g 5 £ B # 6 f l 30 xi"»
5*^li-f£ST*3 9 . ^ © r y ^ - - Ki3#j}i]LTv^fcf^< :: lr , t>^9'it-fr^« V ^ - o - t t > w ^ T y ^ — h'^c/^iejist--^* r t ) . Ri1]l*5|6^il-r^CtKfo^*-ttA^.
fl -Ud^if 5lllTttfS:*cr)iig-?5J|5<i: L T ^ ^ I g b t U i l ^ # l t ^ - i :{l-t ; / | fe!)^l; i t^.
«ff%*iTf&, i$«:^*fl^/cv^:f;tt, m%^^<D^<y\'y ' ^^ic^m^m-ti^^ti 'mh^lx<fz-^\^\
mm&ln>hZ)1y. t (oxmm^^mmi^k^
^«>ic?)iSi: ' t?0Sfcix:;^lC'OV^TS^If©$>S*lt. i:^^ (Human Research Ethics Committee) % "C ZlM^ < /J' $ V «
tUs f:% T V"»fc / i: I' "*
??#z}^#iir
l i r t t i? r«r
hy-TJ vif:
., i /•?V F y • ^ - f (Pandora ICay}( l»5fe:
School of Hospitality, Tourism and Marketing Faculty of Business and Law
Footscray Park Campus Victoria University
P.O. Box 14428, Melbourne City MC 8001 Ausfralla
€,ig: 613 9919 5367 yjv^y^: 613 9919 4931
frT-> ~—}\y\ [email protected]
WINNER ja»*i.:!,'rw>ji<i.n
'w l 837769S4731 Vicjorta Unlvefsiiy ol Technology
••—wii»#<irfiiif*nwiiMrtyi^.

Q1.1 i&m^^m^m&mmm^ (^/ti)
mi^m^ ifffi^ imm ^xibSE ^ ^ 3 E
f l-^iSIPg^^ ^-S midMB^)
01 02 03 04 05 06 07
^MQ1.2 ffMQ1.3 ^MQ1.3 ^ S Q 1 . 3 $tMQ1.3 $ISQ1.3
*
* (^•s*stt«w±ftt5iffl*/itkE, MS*^^rf^#iPitti:^Ti?gw^#. ^^»i:j^#sajM]as#iqo )
Q1.6 7&#)^^y
:^tt ....01 '14 ....02
Q1.2 ^it-^^mxmM±m^7txM^, M^A^^m—>mm~^m CMM-W ifmiE^iW :lbl5aiik
Si^ffl m«:^fiJ3Ej-H t^»fS,jl3Ej'H ^t^^ij3Ej-N ffiit;>;fiJ3E^'H
01 02 03 04 05 06 07
$tSQ1.3 *
^SQ1.3 2^MQ1.3
* * *
Q1.3 ^m^m^im^mMm-^^'^ csM-m) l?T§
u^ (waiS) JXiS cr^xiS) 'iXiS (Ut) His St: cigiBMmw
01 02 03 04 05 06
* («®^-l'^ji^ig> RigSKHig, KiJg^5i5i;&#iifflM]ft&a#Jno )
^SQ1.4 ^SQ1.4 $fSQ1.4 ^MQ1.4 ^MQ1.4
*
Q1.4 ^it'Am^n^, f^SI I^*31SA4^f t^±? (SM-iM) 1-3 4'Bfe± 4-7 Bfe± 8-14 4'?fe± 15^Pfe±lKE^
01 02 03 04
#SQ1.5 ^SQ1.5 ^SQ1.5 ^MQ1.5
(«3lgBtfB]i!>i^-^^±sE®a-^, !Jl iJ^S*i*#/i i l tM]ae#iP. )
Q1.5 i^M'f-m-^^^m cmM-m) 18-24 25-34 35-44
75+
(«: ?«18 , n^-rnkMi^mmmvi^-^m^, )
45-54 55-64 65-74

*JM S S Pandora Kay fi^JfM, ^ ^ ^ f f W ± ^ { i ^ * : t --^jlfp: Lindsay Turner 1#±
^ # M 7 A ? i ] ^ 2 ^ m i 5 M K # 4 , i f [^TJIS^ Pandora Kay M^f^ .W^>t^ i ik i i to
(Human Research Ethics Committee)o
Pandora Kay ^WmM^-^^:
School of Hospitality, Tourism and Marketing Faculty of Business and Law
Footscray Park Campus Victoria University
P.O. Box 14428, Melbourne City MC 8001 Australia
^ T S : 61 3 9919 5367 # * : 61 3 9919 4931
^ftP: [email protected]

(S^iMXm± idM^^M -¥m)
(^idBm
(^M "iMS0^mM^n" )
cm) T^S#-^#fim

Q2.^^^#>5*:ft-<^#6<j3tft.#^. Mf\^:xyji^mm, immmmmM^-mm^mm.
^Wk-
2.1 m%m.%'^
If
If
os: K-
^ *
5
5
n:
2.2 /t^K^A^.^*^/^
2.3 / «5M- W. i 2.4 ^mm 2.5 /t^K^g@^?g
2.6 ^^mm 2.7 p^'-S' ^''JHi^Sfe^ j ^ ^ ^ l
2.8 ^%.^^.m 2.9 #^ ja» t l t t
2.10 mv^-^i^-^MX^-^ 2.11 # l ! J S i S m . iftih^n^S^ - ^ ?
2.12 J i ^ : t * ; ^ f i jM±^3 t4 t« fg fPM^ 2.13 #)5KllTi|i
2.14 # l l M i J f « t W X 4 t « ^
2.15 #^-^«;^^ijMEJS5&W^WXit^J^ 2.16 /t^»m;^fij3227|t
2.17 '^m.x^m.m, ^%Hm^T.{'^i^^ 2.18 #^:ij^^5Miil*^.*® 2.19 #^X4t^J55!^'i[tJ^teA
2.20 #^^A^;S:^ika#i^a6^iit^^ 2.21 wmxit^w, m^mtx^miiu 2.22 #^JlfaA«#W^i-fc^5j»
2.23 mm^^xitmjj 2.24 m:&*^^M^/t^XA± 2.25 i « ;g6<]3 2.26 w^xitiiw^m^mR 2.27 fls:^^j^^i^, * g g A ^ ^ - ^ 1 t ^ 6 < ] . ^ ® ,
2.28 ft^^^-fc^JSliill-^jtfeAS^ 2.29 ft^ie|ffl|rfe>^6<]^4fc^5iS

Q3 ^^mmitm^M^i^PMXiiM^Mmm^, m^inTAn^m, mmMmmMmT-^M^ :i^o
(-^M- 3—mm^m^^mm, s^^w^nBBM{^M&^m&, ^nm'^^6<j^M)
ffi^
3.1 ^^^sl
w. Kr ^ tiK
m K K-
W. f in:
fr
^ Es' ^ fr Is:
IE
3.2 i i a j l J l A ^ l t t t S B
3.3 mk^w 3.4 ^ r i f f i t t
3.5 ^ i 3.6 ^ t t S A
3.7 m^#)(^#6<]3
3.8 ^uKmti-mk^j 3.9 gSfJ;53
3.10 iAW iikA 3.11 imm^x^ 3.12 TiSSifeiSi 3.13 immt^^^t^if. 3.14 1J^S.^X#;i^6<]3
3.15 #^SMM6<]?*# : t ^ 3.16 gf^H^' l f^ iJ
3.17 :g4pam^vSMff i* 3.18 a ^ ^ ^ ^ h - ^ t t i : ^
3.19 ri;S.Sei6 $? 'i:» 3.20 m^*jgc^:S:n;f
3.21 tiwrni.^"^^
3.22 # i i ^ ^ w i ^ ; ; f
3.23 mmm^m^wm^x^^mh 3.24 / ^ ; g ^ ^ a ^ ^ . ^
3.25 at#teAW*t$[
3.26 m^u^mmmmii 3.27 i t r f t ^^w i tk : ^
3.28 ]tm!Km:mm^miK 3.29 ^ ^ i ^ J ^ « W # ^ 3.30 Ji!^^^B°n^n^S:t:ja
3.31 mm-k^x^mxm, \>x^xvcw^nM^^^^^

04 ^'f-itMmj)immmii:^mmPsmm., )^t^i^T/L^«^, mmmmmm^^mM^n&,
n^f^Mm^mm.-k^i^^. m^mm^
4.1 ^^C^SA 4.2 ±M^A
4.3 m^ff^m
4.4 tfilJ'^tt 4.5 mj^MW 4.6 mmn 4.7 # ^ $ l J ^ f P ^ ^
4.8 mUQiP. 4.9 :S4PX#fP»^i 4.10 B A ^ ^ - ^ 1 t # 4.11 - ^ ^ 1 5 ^ 4.12 ^^j^m^^m
4.13 ^lHj#fcff?f'll^ 4.14 ^ ^ ^ A M : ^ ^ 4.15 mm^im 4.16 ip^Stt^ife^
4.17 w^-^j^mm
4.18 v g ^ m ^ ^
4.19 ^5}-T»mJlii^W^ft^ll^PM^ 4.20 ^^mMtmm
4.21 t^^gMflgffinBlJfSvS^
4.22 ^nmwi^M^.^mw¥\^ 4.23 t*i^tg^35ffiaW#i^ 4.24 # i ^ » M , t g ^ ^ i ^ ^ ^ 4.25 ^/fJlf*6tl^MT^?f?§ 4.26 BffJliita<]^;^m^3S 4.27 M^JlM^^T^m
4.28 Jliit^^<^§^ffi6tmM 4.29 mm^^mm 4.30 W;0: n°o?n B: B"«nXLUlj} ^
4.31 T!Ji^i*iW:0;^nIia-l!«^^W'^p^^t^M, ^^^m^
Mm 4.32 rU i WX); RTl>APl ^M'i-p°n^PiJ:f4, ^ R T » ^
m: If
1
IE If
2
2
2
2
2
2
2
2
2
2
2
2
2
2
2
2
2
2
2
2
2
2
2
2
2
2
2
2
2
2
2
2
Eg If
3
3
3
3
3
3
3
3
3
3
3
3
3
3
3
3
3
3
3
3
3
3
3
3
3
3
3
3
3
3
3
3
IE
4
4
4
4
4
4
4
4
4
4
4
4
4
4
4
4
4
4
4
4
4
4
4
4
4
4
4
4
4
4
4
4
E?
5
5
5
5
5
5
5
5
5
5
5
5
5
5
5
5
5
5
5
5
5
5
5
5
5
5
5
5
5
5
5
5
m m.
6
6
6
6
6
6
6
6
6
6
6
6
6
6
6
6
6
6
6
6
6
6
6
6
6
6
6
6
6
6
6
6

Q5 i:x-Ti^m^^'f-itmxmmmmmm.mm^i^..
5.1 yXluf^iiJM^^jirfe^jin^? (SM-i^)
^
^
01 02
5.5 likmMmmmmm^iK^tim
&
^
01 02
5.2 fgjibiS^^M^N^Jfe^f 6 ^ ± 5 @ ^mit
mi mmiii% ^^l^iX tijM
m^ I W -s
01 02 03 04 05 06 07
5.3 mxmjxim'p, f , «S/i *ff- *
^•kU^ mj^ (H^ss^) MiS ( H S ^ ) MiS (-M^my.T) n^jfeii ^^ft!t^p^«e<]m±/ts#^;f =^^^m^mm mj^^^^n unmBmrj^%i^7t^i'¥-B u^Br mB.^mm) ^-t :
01 02 03 04 05 06 07 08 09 10
11
5.4 mtmnn^m.-}j^mtmmm-k^
g t l ^ E i
^hn$ ttiffi$ A ^ % $
^ t l K'S
01 02 03 04 05 06 07 08
5.6 ^•^n'^nmkm^^mw.-k^ti
Stf^ft ^mmmm^s %'^
01 02 03
5.7 lij$flM#^J^i^^!J3E^3Efl3i^? (mj&-m)
?4S A « ^ # 5^^^0^^-^A -^Kjtli*i^-| - ^ ^ ^ - ^ Hn^Km%-i -^Jfeilffl-^ - ^ ^ ^ - ^
#W/ttlxffl^ K'S
01 02 03 04 05 06 07 08 09 10
5.8 ]^.^}kmm.'f^j^\%mmm-k-i.m^ m (mm-mm^m) ^M Sfetftt SKP^ ^n
ffiiK i B c l ^ ^
S#¥flt ;&fetf?gm45|| MS^A^Wl
MB m^^M^'t^ mm^'^mti i^m^^ ii&a s-s
01 02 03 04 05 06 07 08 09 10 11 12 13 14 15 16

in V/\o
(^iltidMm^6<J^^)
(^ "0mjs" iMmmmidMrn^m^^, ^^M "0mjs" iMsmRm$mm)
^ i i : i & ^ g f 4 ^ ^ t t i ^ g M , ii{^^f^>$ltiti^^g|4, f|JicWm##-^ iPod nano ^ . ^ » ^ ^ S ^ tt^c il^^flUSU " # l i ; 5 " TJS^# , /^>^^S^-^:^#-^iPodnano^.^#jK^#^^&(ja^o
tj6<]M^:
lijJ^ttWIl*:
li?«6<]^E*iS-^5^:
fljW ftPifefei::
(i^^w^mm)
^Mi
3^ 0
^m^m (^M^Ln"n)
K^Ao
35i;^M^^:
^i:^^^^:
019:

(i^TMS^± idM^mM ^m)
(Midam
m^%nm3iXik.^^Amwm^
m^mm^^mmii:^-^Mjis2,m-'.
* i ^ @ S Pandora Kay fi^^M, ^ ^ ^ # t f ± ^ ^ i ^ ^ : t -^ 0 : Lindsay Turner 1#±
(mm) T^S#^t-fti

^2u^: ^^MJAm^m^mM:k^m^^mnmikmif^^,, m^i:xTA^mm, itiiB^ iwii
m.n.^WM^MW.-k^i^'^-
01 ^n^'b^K 02 m t f ^ ^ S A 03 mM^M^M
04 Sffi'JT'irft
Es: if
IE If
Es: If in;
ES
IE
5
5
5
Es:
05 ^mhJMW
06 a^fe^7fl# 07 lt#^iiJ$iJ'«fn^i
08 ^m^imR 09 a:g4PTX#fp»ft 10 m i ^ # S A i ^ - ^ 1 f t ^
11 S^a^^XfilJS^ 12 ^-^^^lii^^^MSgl]
13 ^^n'^uwi^fi't^ 14 a^t#7<lfeAW^m 15 ^m3iim^m^M)i 16 a iP?STgS6<] t t ^*^ 17 l 5 # ^ T - # ^ f c ^ 18 i^Mfi^JS^^^S^^
19 i5^5>7lf7m®{S6<]^ft^;&S^PM^ 20 ^ 3 ^^^ jra^ 21 i^MKl^^tPSmM^BtlHUf®
22 ^m'&m^m^mw^ 23 tii^jRfflisW#i^
24 ummm^, mwflfaj 25 ^M^?f^«yg
26 ^mu^m. 27 J|i^7JL4^ffi 28 Jliii7^i^?5l^^fflW^i
29 ^'n.nmkm^i^^m^ 30 W!)^55W^n°n^P^a:t:n"n^S^
31 ^^tim^m^j^m^^-k^ummm'^^ 32 ^ftrUJ:|,rt!«^^^^tiil1?Ji,6<]'frB°pS]tfcf4+IS^

mm^m^m^X^^ pandora Kay
um^m^^^m'^m^o

Appendices
Appendices
Appendix 3: Survey Instruments - Chinese (Traditional) Version
A.3

(^:^iMS^± iaMmm^ ^m
(SiBBm
(^as^^jttsBmam^^)
m^nn^m:$cim:^'SLm\mm
m^mmmw^-tx^^m^-^m^
: $ : * ^ S Pandora Kay ^ P f M ' m ^ ® f # t f ± * f i g ^ ; ^ -BfU : Lindsay Turner i^dr

mmmwmm^i^-ic^wm-
01 m^^'ij't^A
02 a t f ^ ^sA 03 m m
w. If
If
IN
If is 4H
ilR
04 WmiT'WM 05 mmTMm 06 mBmrmm 07 a i e!l$iMfnSL1 08 | ! ^» f#7^ i 09 aJS@P7xMn«ff 10 mijmm.Mn^~m^^ 11 a i ixwsi 12 nmnmm^mm 13 ®^|SIf^fct#tSIS'L^ 14 a»f#7fteA&!]i 15 nmrnj^^mi 16 ai]0?S7 g B6^f±t-%{u 17 a ^ ^ 7 - t t ) ^ s f c S
18 ags^-swfs^^ 19 ®^5?-ii»Tmigfii6^#aiSMfpsgi 20 ^ 3 nmshmmm 21 aS6^«SjfI5SR^S^0#PHllFlM
22 «®«^^ffiaws^ ua
23 ^igs^ffiaa^ffii 24 #is#^s«@' mw«s 25 isi 26 m^Mm 27 ^«75E**M6^^I
28 ! i « 7 ^ ^ ^ ^ * ^ w ^ m 29 nm^it'^mm'^i^wm 30 pri«MW®p°pffif<fl:^p"p^Sm#
31 ^riii^mnmmmmm^§hmm.mm^ 32 pi £m«p3»K3£ aim 6<jAn"pWi j i##

tmmmitMm&mt-^m^.
mm^Mmtmm > mi^m^Mmmmi
^mMjfmxm^zm'
mxm%m&m±KmmBitmB^m mmft^m^m^Xm^ Pandora Kay
mit-^mm^mnm^.

Appendices
Appendices
Appendix 4: Survey Instruments and Cover Letter - Japanese Version
A.4

Virtorio Unhrersity
PO Box 14428 Melboume VIC 8001 AifStralsa
f'/i'/;phone:
(03) 9919 4430 Focaimiie:
(03) 9919 4931
VICTORIA Z UNIVERSITY
School of HospifolitY; Tourisfn & Waf^s^ng foo»scray ferk Campus Baliaraf Road Footscray
•%
--.JK-
Mli«
X i -=v ,* •/,' @ m
. # - %
#Jn—35
Pandorg
Wrt#f
iKay i / iSJ f l i . ^i' ',t^ ^'ii" ' / f -t#llfp: Lindsay Turner \$±
m^mm^mM.±^0mm m%
fMWM'H
>j^ 4< d -
i lS)>
z o
IX'XK Y' Xl.'-.'XrX. .^''•:.
u ')^ i ^ . ii X l^]to7t^-tjiit.y ' '*H'.AM^^I^iiJti±H#'fi» tJiilWiiASiBfiilli-ill ^ , ^ ; 5 ^ ; W'l r [En 1 X\\X^. X] _ ^ .
ifE'i: , ; / i ^ - K ^ P J ^ ^ h n ^ ^ ^I^A.K..S^'jt. S;fy/^ft^ft^Jii;£» i l ;# , XX\(-lX.X, 4 M /. / : /J 4 < fM' / ^ 1 A f-"" -fo-,
> ^ I* j ' ^ r ' J f f ' / / A ror I . /ifoS.'.h<f5i Pandora Kay^t l t t iW^i tHXiat t .
(Human Research Ethics Committee).
Pandora Kay ^'^mMMcMt.i
School of Hospitality, Tourism and Marketing Faculty of Business and Law
Footscray Park Campus Victoria University
P.O. Box 14428, Melboume City MC 8001 Australia
•UiS-; 61 3 9919 5367 XX^'.^ 61 3 9919 4931
^^}M'i EiildoraJ^^^^vu.,edu.au WINNER
«8N 837769S4731 Victorio Ur iv rsily erf T&chncJogy
HAM. OF FA.\lf-: :>:o\ \ iCTf .R i . v , '•••

(mms)
^hKh\-t. m-i t^L*1-o t-^ ^yT^^TiToTV^5. }^;v^sjvy(DX\tT
\z.mx^m^\^:::w,x\'Xcf£nfi\ttm^-^Xo ^^mt^h(Dmmx m^(Dmmw^t Lxwi-t^ntx^
Q1.1 t'(Dmi$.1^tcnmi^i-^XX\^~^Xt>7 f;^- h'No.l ^Mit-5) (1 -D^^^lf5) :t~^ hy])T ::^^ — \^—yV K i\J':>-')io A\MJ"yT ^MTi^^T a - ^ m t T ^ ^ v y v K ^(Dftii (IS^^mALrKfc^i.^)
01 02 03 04 05 06 07
01.2-^ Q1.3--Q1.3--Q1.3--Q1.3--Q1.3-^
* *{±fEcDi. -ftv;e^<^Jfi«, @icf£^T'V^/^^^®-g•(i. ::<5D?5f%(0*f*i:(l/i'i9 S-tirA/o -T : / ^ k'^-^H-TUT^Dl^L^
Q1.6 itm
M4....01
(l-oAt^if?))
^t4.. . .02
Q1.2 ;^-;^ by Ttcij cfiLTV^sm-a-^ if~t7)'jii fctt2p#UcftA- -v>*1~;6^? fto^i^o//^; = . 3 L — ! ^ ! > y ^ ' > r c ; V X
:|ba5*'>H ^ ^ — : / X 7 > ' K ^ ^ - ^ VJ^)T ^•7s-^=.T
\f^ X)T mir-7. VyVT
01 02 03 04 05 06 07
Q1.3-^ *
Q I .S ' ^ Q1.3--
* * *
Q1.3 gllTft^|g$n-cv^?)•i•|&ft{R^'e-r^^?ao^^^//^;
'pmmimm^mm) ^mm(ij:Mm) t l l f&(*W) 0*f&
't(Di& (wm^ESALr<fc^i^)
01 02 03 04 05 06
Q1.4--Q1.4--Q1.4-^ Q1.4--01.4^^
*
\^m. *ss*fc{ia;*:ifT'7iv^:^^(i. ^y^\i:^---^i^'T\..xmi^'&^t.x. )
Q1.4 ^(Dm^i;X\ 7«/^xK/u>}cfpiv'eL^-t-7)^? l-o^^-oifS) i-3-?e 4-7 m 8-14 -?e 15 •/6i^±
01 02 03 04
QI .S ' ^ Q1.5-^ Q1.5--Q1.5-^
(i?fi*«. *fc(±i¥w±wsF-g-. ^y-9\f=.--^^j\^xmi-k'>&-<t.x)
QI.5 ^(Z)¥*p)i'C-r^^? (io>i,^o//^;
18-24 25-34 35-44 45-54 55-64 65-74 75+

^^^: y y-^x ' ^-x-n±
m^(D:^iat. ^x-y-^^^ wr-^-^y V^Vi^-t^ m%^^(ory^-Y\z.m^\.x\^fz.fz.^^'to
ws:-^—XX4^X7. hyxy~-^m^x^tc)^(Dm^'^~^y V(Dmmi:<w^x^nmx-
z(Dm^x\x ^^x^(Dm^^^^MX^ \&Mu±(D {m^t.tci-im^^^h(D) :^}vit^)wy
B}-ft i£V^Ai: l9t-ro m\iLX\Xzfz<:^^}fXt>mi:MXh'0. ^(DTy^-h\^mwi.X\^Xztc<:itn. W^ fct<^x^m^-hxm^-h^j:"9tit^o \^^<)X-h:i<Dryx— --(DIH] ^ feTv /cfcv^
wm(D^nt^tiib(D'M:m\^MX^mm-im.^(Dmm^mt LT^'9&^ti. m^^i^sii^^
O^Xf^^^^nSM.^ (Human Research Ethics Committee) •^XXM'S<fc^\^\
/-s y K 7 • ^4{Pandora Kay)(DMif^%:
School of Hospitality, Tourism and Marketing Faculty of Business and Law
Footscray Park Campus Victoria University
P.O. Box 14428, Melbourne City MC 8001 Australia
M^: 613 9919 5367 yyy^y^: 613 9919 4931
MX}^~-/\^: [email protected]

^x-y-^f'^ Yvr '^-^y V'^^f\.^m.%^^(DTy^-v
( rr^x- h0M^cDfcii>cofmj ^mmx)
^m^^iti)'^^^^^
(m^±if^)Ty^-' hm\i^^(om-^
m^\t. %m^^<\^xwm\^x<tz.^\\
^X\^Xctd^~^i-mxmfj:-^y^\f
^ti^^commi
^
tPn1;^stE^$tLTv^*i-o
lit^X
'^^flt^'^<D'^:^yV\z.i)^-h^f^h-f. X^X(D-=^:^
0
m^K^M't^\i
^^-(nWM't^ ^^^\^'^f^-h---t^'0%X-o
^S^v^
S J; 5
yhK
fz.tc\^'
xhx<rc
m^^n^
fct^fl^

Q2. if/wfJ:Xiti^m^tt!•1Jt^z-^^^X. d:(DX\zt'(DU^mMX^-i^is^^<tz^\^\
^^^X6o )
2.1
2.2
2.3
2.4
2.5
2.6
2.7
2.8
2.9
2.10
2.11
2.12
2.13
2.14
2.15
2.16
2.17
2.18
2.19
2.20
2.21
2.22
2.23
2.24
2.25
2.26
2.27
2.28
2.29
^(D^Wr\^"i7< ^bt^U^X-t
T-h=¥>7y-/^tflt ^ 7 V/-> ^ ^ ^ © =3 Vf— h
m{-t^5^0=3V1^-b /< l^OL
^yy.(D='y-^~ h
:t^y
'hm(Dmm<i^^ 5 3- —v/;^yv
nmm T— hy'iy^-r-f/</^i::fc'fb7m;^x^^</V m^mfimm. m%s m^M ir-y^ h7 y r9tii.^(DXi\:<i^^tm%^ -7~-->ry Y
m^mf-i:mmxmi>tiiXit<ii''^ :t-y Vy') T(73S^fcMiibfc:S:{k^^ :^~y^ h7 y Tm.Wit^n.hx^m^
mm mi^tst:^^<DXitw^f)'ix^ zmwr fliKDAfc^LAyTt fj 5/c*(Z)X'fbf*^
ficp^ji i: -^mt^W-^ \.tz.Xi\:W-^ m5i.(DA^ i^MX^Xiti^m mcD Afciiife it>ivfcXi\:itm. ^^f£X<tm£mm
mm ^^fj:yB—fy^n.^K^mw '^^^xitwmt^x^ ^mm
^(DXh'^^'^^li^h^XitW-^ /^•y ^~\yyr~(DXitW^
ffia
2
2
2
2
2
2
2
2
2
2
2
2
2
2
2
2
2
2
2
2
2
2
2
2
2
2
2
2
2
AJ
^ j ffia
3
3
3
3
3
3
3
3
3
3
3
3
3
3
3
3
3
3
3
3
3
3
3
3
3
3
3
3
3
+* -
AJ
X J
4
4
4
4
4
4
4
4
4
4
4
4
4
4
4
4
4
4
4
4
4
4
4
4
4
4
4
4
4
EB; ffl3
5
5
5
5
5
5
5
5
5
5
5
5
5
5
5
5
5
5
5
5
5
5
5
5
5
5
5
5
5
A'
6
6
6
6
6
6
6
6
6
6
6
6
6
6
6
6
6
6
6
6
6
6
6
6
6
6
6
6
6

Q3 S^^^T't fcSi'fCT ^ 7 ^ ^ / 3 : / t - f ' < > ^ ^ 3 : f T < a S f c o ^ ^ T , d:(D^\::t'<D^^mMXZ^^io^^
if 60)
3.1
3.2
3.3
3.4
3.5
3.6
3.7
3.8
3.9
3.10
3.11
3.12
3.13
3.14
3.15
3.16
3.17
3.18
3.19
3.20
3.21
3.22
3.23
3.24
3.25
3.26
3.27
3.28
3.29
3.30
3.31
m.^'¥\^. '^(Dn&^XXitThyi^yayt
4-<yhKn^'^X
mvt^fcn^ hXf£LXhhotcl^ Wi:')yy^^-^^^fzt>
mn^'Jyy^^^^^tcib y.V^i^tm^(Dtcib
m'Wm^A>:i>iy^tci^
(SIT!) ^ "9 fc V ^ r ir ^ - r 5 : c to
mm'^xxt-mi^im^x^tci^ ^^T^xm^x^tc}^ tfiTcOA-^fc^^fcto
m7vx^tii^-o\,'^x^j^tzi^ ifi5t i^Mi (r 0 V T ^ i ^ fc to ±ifi7CO|f•^Sff^COV^T^^fcfc
tt*fcMa-r5 r t &i-sfcto mn9cm^(D^t ^mLntci^ nG<DBmtirMo^t^x^tcib mB (D±^xm>k^X^ r t &Si^5fc^!6
^(Dikm^mmx^tc)^ m^'b^mtcxtz)^ Kmtmm^mxfc^ i^(Z)tt^WififS^i«to5fcfe ^*/£^FJT^E?>fcto
' t ^ fiy 3 -(D<2^?^^^5 fc to
flfiA«*ffc*#5fcto
sf tT-r?>tg; ^ t-fcto ^^/<f:^FJffctT<fcto
^litsJ^cDMffi^tts fc to K(Z)i^l/N#:^^-r5>fcto ®p"p^*5±M^M9fcto
:5:{l:l2^^T^-<'^^t):^t)*R 5 fcto
ft
ft
2
2
2
2
2
2
2
2
2
2
2
2
2
2
2
2
2
2
2
2
2
2
2
2
2
2
2
2
2
2
2
AJ ii •^ ft
3
3
3
3
3
3
3
3
3
3
3
3
3
3
3
3
3
3
3
3
3
3
3
3
3
3
3
3
3
3
3
AJ
XJ
4
4
4
4
4
4
4
4
4
4
4
4
4
4
4
4
4
4
4
4
4
4
4
4
4
4
4
4
4
4
4
aa na
5
5
5
5
5
5
5
5
5
5
5
5
5
5
5
5
5
5
5
5
5
5
5
5
5
5
5
5
5
5
5
aa
6
6
6
6
6
6
6
6
6
6
6
6
6
6
6
6
6
6
6
6
6
6
6
6
6
6
6
6
6
6
6

/5>*3^x.<fc$V\
4.1
4.2
4.3
4.4
4.5
4.6
4.7
4.8
4.9
4.10
4.11
4.12
4.13
4.14
4.15
4.16
4.17
4.18
4.19
4.20
4.2!
4.22
4.23
4.24
4.25
4.26
4.27
4.28
4.29
4.30
4.31
4.32
m^^K:A^t^f^^ i^Xf)^t>io:b
rn^ts hXfj:l.Xhho
W-^Vyy^y^^^
m^-^')yy^y^^^^
7.^})VtmM^^^^ ^fS^ t t 'S t t * i : * ^ f c o V N T S n s SfJ(Dia:#(ciiig-t-S
y^y-yh'^'0'^'^X^
^(D{^(nm^^ i ^ "9:5i D -r 5
{^f^ <!r ^ L V B#ffi i i r~-r
ftilA(^^tSc
^^fimm^%^ ^x^mmtL-^n^^ i i ^ i t ^ # 6
hX\
r^y--^ yfy-^ — hA^WIfi'k^X^'^
W.(D^^^^~-\fy^^\-^^
»ffi(D'|f # ; jS^l l l I -e» ;5^t iT V N
W^W)mm^X^1i^XX \ 5
wm.ti^mkx'^tL^ *i#^ $ t l T V 5illS^^it-i^Tfe 5 ffi#t$i^T^^5Jfela;^5'L^jicfcv^ X^W^(f^m^ifi^'^^XX\^^
mm^m<D%wifiw^^X'z\^^ ^m^]^-(Dnmm^hf\.-i> ^Wl'^S^^^X'&-b^^XX% 5
t;''';^(>iov->T
ty^> hmft'
5
^(nmxm%x^^
x^^ , n-h-Bizti'^
ft aa »V \^ 4H
1
•ft* ft aa
2
2
2
2
2
2
2
2
2
2
2
2
2
2
2
2
2
2
2
2
2
2
2
2
2
2
2
2
2
2
2
2
AJ
•R
XJ
3
3
3
3
3
3
3
3
3
3
3
3
3
3
3
3
3
3
3
3
3
3
3
3
3
3
3
3
3
3
3
3
'fi
-> _> a AJ ft -fe aa to
rV Xl
4
4
4
4
4
4
4
4
4
4
4
4
4
4
4
4
4
4
4
4
4
4
4
4
4
4
4
4
4
4
4
4
aa aa
5
5
5
5
5
5
5
5
5
5
5
5
5
5
5
5
5
5
5
5
5
5
5
5
5
5
5
5
5
5
5
5
aa
>V V <tl
6
6
6
6
6
6
6
6
6
6
6
6
6
6
6
6
6
6
6
6
6
6
6
6
6
6
6
6
6
6
6
6

Q5 yx<Dnr^n. ^m(Dmn^^-c^Mn::^^i^-X(Dwm\^mx^h(Dxx.
5.1 l^HtJ^ /^*V^vfc* fc r <b;65fc^*-f-d^? (1
«V^ v^v^x:
01 02
5.5 l ^ t i I ^ ^ - > - b-i? h y T • ^ - > r
(1 o j fe^o//5j fiV^ VH^X.
01 02
Z]
5.2 ^my^^^t^^)^yi:nStitc±f^m^lii^XX t^7
(1 -Dji^OlfS)
mw Kx/mmx^ 0 x^i^m mm M^ IScW •^(DM
01 02 03 04 05 06 07
(1 o^^-oifS)
'M^\-
KKm^<DW. ; }^x /K4^fc t t5oa ) /j^xM3 ^m.) ;}^r;K2 oMl^T) •^—x/ i^
y^ 5/ ^ / ° y tl —l=L — y:^y.-r)\y
m^T^^-Y « j ^ L f c ^ / T / ^ - Vl=^=-y Vly yyV
^hn.{^\\mi:E) ^(Z)fth,
01 02 03 04 05 06
07 08 09
10 11
5 .4±(c : t ' (DSi i#^^i£oT^^-^- i : : - "^ h y T ' - ^ - ^ y h(C3|5*Lfc;5^?
(1 ^^^^lf6) e ^ ^ ^^y? .
% 9 ^y~ mM-h 7 A
i^# ^(D'^
01 02
03 04
05 06 07
08
5.6 }£ ^^-oX^^y — y- }f^ h y T •
(1 <}^^'on?>) ^*gfc¥ifiUfc ^ y r - ^ v ^ - y ^ ^ ^ i f i b f c ^(75te
01 02 03
5 . 7 i i i ^ - r - > - t - ^ h y r y Y\c%x\^~^Xi)^l (1 -O^^-Dif^) 1XX io y XJVX
Wim.. X^(DXJV-^X ^(DmcDM^t MXt WMt^Xt vr—X)^~xx m%h y. /K- y • mi^^t^ X)^— XX ^(D^
.-^ — /r
01 02 03 04
05 06 07
08 09
10
5.8 i ^ ^ - V - t ' ^ hy T--v->ry Y\z
(1 o^^olfS) Kxim^ miixmrn ^y^—^-y h y-V\f
^ I f e mm yX:^ /<yyyy y Wi'Jf^X YXy^ f L ^ # t t m'inmn<D^^m^ t- 'v^^"' |f$g-fey^-yr~:t^y—'^— rnxMcz^tt^h^ m'o^^^Xc^Lt-i^^h^ ^(D^
01 02
03 04 05 06 07
08 09 10
11 12
13 14
15 16
([Bj^^i^M L rm^XffS)
x<Di^mi^mLx. 5^j^^mxmxx^^$¥^Km.^^Tyx-vizhm^Lxvxctzi'^i\i-£^\^x t o
/N°-M i/N-h2 'a^^-it5fc46fc. ^(Dxt ^^mkoTyx~v\ \z.%zmt^fz^<Dm^ tfcfi^cDftil© ID ^^#tLTV^fcfc#t1-o
(zzizm^^mmx5)
( ^w.mk(oryx~v\ fcfii^^is^L. ^^mk(Dry^-hi XM^mmm^mx)
wmi)^ryx-v<Dm^%fi^fc^th. :L(Dryx~vt>^v.<m^^f\.fz.^t^u.mx^^a 9.%UXn-^y.(D-nt t r . \f^ X)rX^(DW%^i>mmiXmm^t^^}it^X^^i:.0 fc. rj (D'W^ # LT<fc VN„ r(7)lf#^^#ttrvNfcfc<^>^'5;0^fi*ofc<{iE-ci-;i' . ^^\..X\X-fi<m^. iPod^y 'Xv4-^-i^'^fc^^m\^mm(Di6<^mt^X^-^X. \%^%.(oryX-Y\ fciBA. ^m\Xz.fz.\Xz.:X\z.\x ^h\z- iPod^y -Xy^^-i^^m^-b
^"^m:
m\^m
r~s (75aM#- :
^ ^ 7 < — 7 U T Yyy^:
:lUX\Xz.-fl\Xz.ryx-v\x ^^ YVrx^n^^f^mmx^'^^fi'^X.
(m^^^^M L xm^±if6) iinW\^}i-:>xz.(Dryx—y\-c:l'^X\Xz.tt^%\.xmX-'h'oii^h b r^'v^*i-o
^^mt^h(D%xfi:i-^m\^x^mm\.x^ (9 1-0
^ ^ ^ If ^ 'f ^/^ t-;x
- T fc J; ^B^r-^ > ^ t-^ - TX^ ~-(D^m-^'{'^oX^(D4 y^ \f=^-
ofcri:^fJEP^V^fcL*-ro fAti^fc. ^«a&>/^
:L=)c\.h(DTyx—V<Dt^M%fc\ti i: L. ^(Dmi^^f^X^\.fl\^^h\
mAX?>) -Sr^tTL. fi«(7)^ 5PS "9 IE5|f«^Ei^^ i:
:(7?'7"n-::/ji^ h i :
ilRlEv^fcL^to .MiS-rs^wffi<7)1f^
^ > ' ^ t ^ - ^ - T i O i S t i l :
^ ^ ^ f"^—TcDl- ig:
B # :

m^^-^^XitTYy^yBytx^yVK^^m^
^X-y-^f^ YVr '-^-fry VE^M^Ty^-Y
^^7 Y V TX^m^x^ y:n Y w±mu(D-mtLxy<yYy' X4\^xy)mm
^ # # : y y^4 • ^ -x-w±
(m^±X3)ry^— Y^M^^(Dm^
i!K(o^-'y\^\x ^mtmm(DXitu%w-mz.mx^-m(Dm^mtm^fhx\^'^x.
V^V^fcL^-t-o
-t^e^. •^tL\^^'^mi:P^^(D^?^yY\^i^^t^fDhX. X^X(D-=i^yY\^m^^n^
z.(Dryx— Y\zn^\^x\xz.fi\Xz.m'^. m^\^^Mx^nM^^^xz.fi\x^b^fi^
z,(Dryx-Y(Dmx\z.t^i)^^nm\-t5'7^^mxXo

y<-Y2: ^ 4 ~-y - \^X Y V T --^-Xy h^Witlxmmhnfct^Z-D\,^X. '^<DX\i t'(DU&mMX^^^^i^^x. < fc $ V \
32ro^SPB1ico^^T, |5]S-t-2.^^/i^'SrS'bji^ic^-t-#-^|c^$rolj-T<fc:$V\
01
02
03
04
05
06
07
08
09
10
11
12
13
14
15
16
17
18
19
20
21
22
23
24
25
26
27
28
29
30 31
32
^4-y'\f^ YVT "^-Xy Y^tJjfiX
iStt6^fc^^/6^:bofc
i$.XA^t^t><ytc
m^t^-otz hXfj:^Xtc
m^Vyy^y t f c
^W^ V y y ^ y^ Ltc
:^V/vtmm^i^mL'tz
^ i ^ & # f c
t t » t » ^ f c o v ^ - c : S t L f c
wKDwm^mmLtc y^yyh.^^M'OX.fz
f/ia,(Dm^^tX'OM^ t f c
f r l ^ - I t f c sH Ll/^Pt^ig r Lfc
mK(Dmkm%fz ^^f^mm^^^Lfz
l±^6<]±fifS^i«tofc
mi^m^mz 7^=7-4'dy-4~h4^yV tt^^fcc
tt$&;i5fcofc
K(Dfi5v^-y—t-x:SrS(tfc i^^$;t^fcB#rB1ii 19 fcT ^ X ^ t-~x ^ -
%(nwmmxmm(omm.-b^xxx% tz %(Dnmmxmm.tih-^tz ^f^tt0^lfe-e!S:3io t (Dfco fc mnn.mMfzofz SSiS:ttg'il^itfi(D>/^v ^ ^ © f c o fco
=^i^^(Dmwtt^^m^xx\^fz Pf »#ff l 0 J S ^ ^ S g ^ $ t l T V Nfc
^m.\z.%^bnm^mfz
>fz
^•r+^v^
- t ^ - < > h
mwi:mm(D^^u'^is±mtm%^fix\^tz mxi^x^nmxmmx^^. mmfi:mm<r)
mxi.xn-hm^:Ltt^x^^^ m.mfi:mm(D
if ft aa
A>
4»l
1
if 4; aa
2
2
2
2
2
2
2
2
2
2
2
2
2
2
2
2
2
2
2
2
2
2
2
2
2
2
2
2
2
2
2
2
AJ -R vD
XJ
3
3
3
3
3
3
3
3
3
3
3
3
3
3
3
3
3
3
3
3
3
3
3
3
3
3
3
3
3
3
3
3
'fi
•ft* A) ft -R aa ^
4
4
4
4
4
4
4
4
4
4
4
4
4
4
4
4
4
4
4
4
4
4
4
4
4
4
4
4
4
4
4
4
aa aa
5
5
5
5
5
5
5
5
5
5
5
5
5
5
5
5
5
5
5
5
5
5
5
5
5
5
5
5
5
5
5
5
aa
6
6
6
6
6
6
6
6
6
6
6
6
6
6
6
6
6
6
6
6
6
6
6
6
6
6
6
6
6
6
6
6
ryx- hfcrm^v^fcfct*LTfe'9d^t 5r' 'vN^Lfcc
ir-7.Yy3r-km%X^m\z.^(r^TyX-Y-kW&\.X<tt^\^
Pandora Kay, Victoria University ^ XW^ L T < fc $ V N„
p<;^7}<7^^-t-^LV^B#^B^^i^rLTV^fcfc^t^Lfc^^v^T"t-o

<

V c 0 a a <

2 •4—'
O
CO
O
<
o X CO
c
>
(0
• •IHI
0 > 0
c OS 0) c o <0
(0
15
"5 o o o G)
E
CO 0)
C CO CO Ui (/) "O o c O CO N (/)
CD CO • C CL 0 . .
^ CO CO •+i
CO " D c CO CO
E 13 C O
E E?
Is?
£=§ S ^ O CO
o (0
CD
CO O
( 0 CO
±: o go
l o
CD" o c CO
T3
co" 0 Q. O o"
"co
E CD"
•t—'
CO Q)
JO -I—»
CO
co E .
~ CO CO > » "co i5 > Q .
• ^ CO CO : =
^ - D C C CO CO g CO E c 0 . 0
c 0 > o IS
X 0
co" 0 o c
Ii OQ Q .
C4 CO lf>
o U) cs (0
0) 0)
o
0) 0)
<
55 CO
0)
<

c 0) a a <

so <

4in Q
w
-K
H 5 ^11 :?f;
m.
w 44P-
nn
4 ^
TJTll IJIII
4.11L +Trr
^
Ff
^
<ln ^
n
4P(
U i
/ TBt X
a:
%
-t-N^
1
H
•4n


•0 c 0 a a <
<
I S 1

1 -5^
K ^ N
l^ j -
K 1 -k
'X. \
l^ 1
X 1 tl
ll
•f^
K
M fi
in
m •fi-
AJ AJ
K . ^
1
K +? ih -4
. - ^
K l
^ \
. . ^
K . "^ 1
K ^
•ffi ^
1 H
•{N
^
n K
r
\
K
K
\
V
V
JO

CM
1 4^
AJ
ii
G
cs O
BBS
\ /
CM CO
r ^
^
4i ffl'5 AfN
^ ^
/" ^ AJ
-il 4 \J
^>
AJ / I
AJ
LO CD

CO
1
"(
V AJ A m
^ >
s nn G
% •
IH
*
•H
ih
H 4SJ
11 I
A ru .{on. iliia
*8 AJ
m .% ^ ' ^
IN ^
CO O
?< H
N
K
iK °<
51
^
1 ^ o
^ V \ AJ V y] W Q K <K
I i H AJ 4^
X \ AJ
04
4i ffi§ x^^
V \ /
<w
r ^ a ^ &a i r s
»V
CO
- ^
4i ffi§ *c> V
V6
^ ^ < ^ r ^
AJ /^
'R >LD
4^ XJ
*C>
ffl^ *r\ V
V6
^ ^ < ^ ^ ^
AJ /^ 'R >LO
4^ \ J
in (O

1
J)
1 ^
AJ y) G
G
^
1
'iJ
A 1 V
fflS
CN CO
^ >
•t* 4^ fflS AfN
^
' ^
^^<i /" ^
A)
ACN
& 5 AfN
^V^ 't ^ ^ < ^ /" ^
AJ r.
AJ 'AJ
in CD