determinants and value of enterprise risk management ... · 1 determinants and value of enterprise...
TRANSCRIPT

Determinants and Value of Enterprise Risk Management: Empirical Evidence from the Literature
Nadine Gatzert, Michael Martin
Working Paper
Department for Insurance Economics and Risk Management
Friedrich-Alexander-University (FAU) of Erlangen-Nürnberg
Version: November 2013

1
DETERMINANTS AND VALUE OF ENTERPRISE RISK MANAGEMENT:
EMPIRICAL EVIDENCE FROM THE LITERATURE
Nadine Gatzert, Michael Martin∗
This version: November 23, 2013
ABSTRACT The development of an enterprise risk management (ERM) program enables com-panies to manage corporate risks in a holistic manner as opposed to the silo-based perspective in traditional risk management frameworks. One main question in this regard is what factors drive the implementation of an ERM system in companies and whether ERM programs can actually create value once implemented. This pa-per addresses these questions by conducting a comparative assessment of empirical evidence from the literature regarding the determinants of ERM and its value once implemented. In doing so we are able to illustrate differences in model specifica-tions and the underlying data. Our literature study shows that particularly the com-pany size and the level of institutional ownership are significantly positively relat-ed to the implementation of ERM in most empirical studies and, furthermore, that ERM generally has a (significant) positive impact on corporate value and perfor-mance (to a different extent and depending on the focus of the studies). However, geographic and / or industrial restrictions regarding the underlying datasets partly limit the generalization of the empirical results.
Keywords: Enterprise risk management; shareholder value; performance
JEL Classification: G32
1. INTRODUCTION
In recent years, enterprise risk management (ERM) has become increasingly relevant for
managing corporate risk. In contrast to the traditional silo-based risk management, ERM con-
siders the company’s entire risk portfolio in an integrated and holistic manner. It further con-
stitutes a part of the overall business strategy and is intended to contribute to protecting and
enhancing shareholder value (see Meulbroek, 2002; Hoyt and Liebenberg, 2011). The need
and demand for ERM as a holistic and company-wide risk management framework is a result
of several changing internal and external factors in the corporate environment, which involve
a broader risk scope, a higher risk complexity, and increasing interactions and dependencies
∗ Nadine Gatzert and Michael Martin are at the Friedrich-Alexander-University (FAU) of Erlangen-
Nuremberg, Department of Insurance Economics and Risk Management, Lange Gasse 20, 90403 Nuremberg,
Germany. Email: [email protected], [email protected].

2
between risk sources. Relevant external factors include, e.g., globalization, industry consoli-
dation and deregulation as well as regulatory pressure (see, e.g., Pagach and Warr, 2011).
Furthermore, rating agencies have started to incorporate companies’ internal (enterprise) risk
management systems in their rating processes (see Hoyt and Liebenberg, 2011).1 In general,
the internal factors can be reduced to the objective of risk management, which is to enhance
the firm’s shareholder value (see Meulbroek, 2002). ERM is also driven by methodological
and technological progress including advanced methods of risk quantification and information
technologies (see Jablonowski, 2001). Overall, an ERM system thus enables the board and
senior management to better monitor the company’s risk portfolio as a whole (see Beasley,
Clune, and Hermanson, 2005).
The benefits and disadvantages of implementing an ERM are comprehensively discussed in
the literature. The consideration of the company’s entire risk portfolio in a holistic process is
said to contribute to reduced earnings volatility, stock price volatility and external capital
costs as well as a higher capital efficiency, where the consideration of risk dependencies fur-
ther allows companies to exploit synergy effects in the risk management process (see
Liebenberg and Hoyt, 2003). However, the necessary financial and human resources, as well
as the required IT systems, constitute an obstacle for ERM (see McShane, Nair, and
Rustambekov, 2011). In addition, establishing a strong risk culture and the development of
adequate (compensation) incentive systems are needed for the successful implementation of
ERM (see Rochette, 2009). Furthermore, as part of the global corporate strategy, ERM shifts
risk management to a more offensive function that also accounts for emerging and strategic
opportunities and involves a better decision process with respect to operational and strategic
decisions in order to eventually increase shareholder value (see Liebenberg and Hoyt, 2003;
Rochette, 2009). To ensure the appropriate coordination and functionality of the ERM system,
a senior executive such as a Chief Risk Officer (CRO) or a committee of experts should there-
fore direct the risk management process. Despite the growing importance of holistic risk man-
agement systems, however, ERM has only been adopted by some companies.2 Thus, ques-
tions arise as to why companies implement an ERM framework while others do not, to what
extent and in which way ERM system actually impacts a firm’s performance, and whether it
actually contributes to increasing shareholder value, for instance.
1 Since 2008, Standard & Poor’s accounts for the level of ERM implementation in their rating process of non-
financial companies, at the same time also considering the risk management culture, strategic risk manage-
ment and ERM resources (see Dreyer and Ingram, 2008); for insurers, this has been so since 2005, for in-
stance. 2 According to a worldwide survey by Deloitte (2011), only 52% of companies in the financial services indus-
try had an ERM or a comparable system in 2010. By comparison with 2008, this constitutes an increase of 16
percent.

3
In the literature, ERM frameworks and their implementation are widely discussed. For in-
stance, several authors descriptively study the stage of the ERM implementation based on sur-
veys, questionnaires or interviews (see, e.g., Thiessen, Hoyt, and Merkley, 2001; Kleffner,
Lee, and McGannon, 2003; Beasley, Branson, and Hancock, 2009, 2010; Daud, Yazid, and
Hussin, 2010; Altuntas, Berry-Stölzle, and Hoyt, 2011; Daud, Haron, and, Ibrahim, 2011;
Yazid, Hussin, and Daud, 2011). Furthermore, there are quantitative studies which examine
the determinants that significantly affect the implementation (or level) of an ERM framework
by applying multivariate methods (see Liebenberg and Hoyt, 2003; Beasley, Clune, and Her-
manson, 2005; Hoyt and Liebenberg, 2008; Hoyt and Liebenberg, 2011; Pagach and Warr,
2011; Razali, Yazid, and Tahir, 2011; Golshan and Rasid, 2012),3 while other quantitative
studies deal with the shareholder (firm) value and performance as a consequence of an ERM
implementation (see Beasley, Pagach, and Warr, 2008; Hoyt and Liebenberg, 2008; Gordon,
Loeb, and Tseng, 2009; Grace et al., 2013; Pagach and Warr, 2010; Hoyt and Liebenberg,
2011; McShane, Nair, and Rustambekov, 2011; Tahir and Razali, 2011).
The aim of this paper is to conduct a structured review and comparative assessment of the
empirical literature regarding the determinants for implementing a corporate ERM system and
the resulting performance for the company. This analysis is intended to allow for the identifi-
cation of commonalities and differences between the empirical studies to obtain a deeper and
more holistic insight into the drivers of ERM and its impact on firm value. We therefore focus
on the quantitative studies listed above, where determinants (seven studies) and the impact of
an ERM system on the corporate performance (eight studies) are tested for statistical signifi-
cance, and comprehensively discuss the data and the respective assumptions underlying the
empirical work regarding ERM.
Our study emphasizes that the collection of data constitutes one major challenge, with the
consequence that empirical studies are often restricted to single countries and / or certain in-
dustry sectors. As a result, the empirical findings partly differ. Regarding the determinants of
ERM, for instance, our findings show that while some determinants (assets’ opacity, growth
opportunities) are not significantly related to the development of an ERM system or are am-
biguous regarding the direction (financial leverage), the company size and the level of institu-
tional ownership are, in particular, identified in most studies as significant factors that posi-
tively affect the implementation of an ERM system (generally approximated by the existence
3 Further studies deal with general risk management activities, not focusing on ERM. For instance, Dionne and
Garand (2003) analyze significant determinants for risk hedging in the mining industry in North America. A
mathematical approach regarding the implementation of ERM to achieve strategic goals is presented in Ai et
al. (2010).

4
of a CRO and partly by additional ERM keywords). When looking at the performance and
shareholder value after having implemented an ERM system, despite different assumptions
and models, we find that most studies indeed reveal a (mostly significant) positive relation
between the implementation of an ERM system and the corporate performance or shareholder
value, whereby the extent depends on the focus and assumptions of the study.
The remainder of the paper is structured as follows. Section 2 defines and describes ERM and
the differences from traditional concepts. Section 3 contains a comparative assessment of em-
pirical studies on the determinants of an ERM implementation and Section 4 focuses on the
corporate value and performance as a consequence of ERM implementation. Section 5 con-
cludes.
2. ENTERPRISE RISK MANAGEMENT
2.1 Definition of ERM and differences from traditional risk management
In recent years, several conceptual frameworks have been developed and published that pro-
vide an overview of the key elements of ERM.4 The COSO (Committee of Sponsoring Organ-
izations of the Treadway Commission), for instance, defines ERM as (see COSO, 2004, p. 2)
“a process, effected by an entity’s board of directors, management and other personnel, ap-
plied in strategy setting and across the enterprise, designed to identify potential events that
may affect the entity, and manage risk to be within its risk appetite, to provide reasonable
assurance regarding the achievement of entity objectives.”
Hence, ERM considerably differs from traditional risk management concepts. ERM defines a
process that combines the corporate’s entire risk management activities in one integrated, ho-
listic framework to achieve a comprehensive corporate perspective. Traditional approaches, in
contrast, are generally based on a silo-based risk consideration and a department-by-
department perspective (see Kleffner, Lee, and McGannon, 2003) where risks are measured in
isolation. ERM aggregates all the risks across the entire firm, thereby taking into account in-
terdependencies between risks, which allows for a better assessment of the firm’s risk situa-
tion and further improves the decision process with respect to strategic and operative devel-
4 In 2001, KPMG published a guideline called KPMG Enterprise Risk Management (see KPMG, 2001). A
framework for ERM was also developed by the Federation of European Risk Management Associations
(FERMA) in 2002 (see FERMA, 2002). In addition, the International Organization for Standardization (ISO)
proposed the ISO 31000 Risk Management principles in 2009 (see ISO, 2009), for instance.

5
opments (see Meulbroek, 2002; Nocco and Stulz, 2006; Pagach and Warr, 2011; Hoyt and
Liebenberg, 2011).
Furthermore, risk handling in traditional approaches is generally rather defensive in that it
concentrates on the protection of the firm against adverse financial scenarios. In ERM, the
focus is shifted towards a more offensive handling through the integration of ERM into the
corporate strategy and the decision process and is explicitly intended to contribute to increas-
ing shareholder value (see Meulbroek, 2002; Liebenberg and Hoyt, 2003). ERM thus does not
only attempt to minimize risk but explicitly accounts for potential opportunities.
Due to the fact that ERM is part of the corporate strategy and the high relevance of an ERM
implementation, ERM is directed top-down by the senior management (see COSO, 2009, p.
4). The senior management is therefore responsible for defining the objectives of the ERM
and for integrating them into an integrated corporate strategy, ensuring that the company’s
defined risk appetite will not be exceeded while taking into account opportunities as discussed
above. ERM thereby typically includes the appointment of a CRO or a committee of experts
serving as a supervisor and coordinator of risk management, a position that in general does
not exist in traditional approaches (see Liebenberg and Hoyt, 2003). The appointment of a
CRO is thus intended to ensure an effective and efficient integrated risk management, which
also includes a communication function with direct reporting to the executive board and
shareholders concerning the corporate firm’s risk situation and profile. Thus, information
asymmetries between the company representatives and shareholders can be reduced (see, e.g.,
Liebenberg and Hoyt, 2003; Beasley, Pagach, and Warr, 2008).
2.2 Data collection and measuring the implementation and level of an ERM
In general, companies hardly publish any comprehensive information about their existing risk
management system or plans. Hence, the empirical literature is faced with the challenge of
gathering information about whether or not an ERM system has been adopted and to what
degree.5 Information about the current corporate risk management system can either be col-
lected by using surveys or by scanning public sources. An overview of the two data collection
methods used in the empirical literature is given in Table 1.
Surveys are typically used to study the level or stage of the ERM implementation. Beasley,
Clune, and Hermanson (2005), for instance, conduct a survey and introduce a classification of
5 This lack of sufficient data may make for smaller sample sizes and lead to problems regarding the quality.

6
five stages to analyze the determinants of ERM.6 Further studies make use of external data-
bases such as Standard & Poor’s (S&P) ERM rating (McShane, Nair, and Rustambekov,
2011) and the Osiris database (Razali, Yazid, and Tahir, 2011; Tahir and Razali, 2011) or
develop their own index for the firm’s ERM (Gordon, Loeb, and Tseng, 2009).
Table 1: Data collection methods of studies regarding the existence of ERM
Survey Public source Colquitt, Hoyt, and Lee (1999) Thiessen, Hoyt, and Merkley (2001) Kleffner, Lee, and McGannon (2003) Beasley, Clune, and Hermanson (2005) Beasley, Branson, and Hancock (2009) Beasley, Branson, and Hancock (2010) Daud, Yazid, and Hussin (2010) Daud, Haron, and Ibrahim (2011) Grace et al. (2013) Altuntas, Berry-Stölzle, and Hoyt (2011) Deloitte (2011) Yazid, Hussin, and Daud (2011)
Liebenberg and Hoyt (2003) Beasley, Pagach, and Warr (2008) Hoyt and Liebenberg (2008) Gordon, Loeb, and Tseng (2009) Pagach and Warr (2010) Hoyt and Liebenberg (2011) McShane, Nair, and Rustambekov (2011) Pagach and Warr (2011) Razali, Yazid, and Tahir (2011) Tahir and Razali (2011) Golshan and Rasid (2012)
An alternative to surveys are public sources, where, e.g., business libraries or annual reports
are scanned for key words, their acronyms or individual words within the same paragraph that
indicate an implemented ERM system (ERM key words). Many studies thereby revert to the
appointment of a CRO as a signal of an ERM system (CRO key words) (see, e.g., Liebenberg
and Hoyt, 2003; Pagach and Warr, 2011; Golshan and Rasid, 2012).7 This assumption may
lead to biased results in cases where the existence of a CRO does not correspond to an im-
plemented ERM system or in cases where the title or person changes (see Grace et al., 2013).
Furthermore, it allows for no differentiation with respect to the level of the ERM implementa-
tion. However, there are several strong arguments for using a CRO appointment as a signal.
For instance, as described in the previous subsection, an ERM implementation process should
typically be overseen and led by a senior executive due to the considerable impact of ERM
and its complexity (see Pagach and Warr, 2011). In addition, Beasley, Clune, and Hermanson
6 Levels include: (1) No plans exist to implement ERM; (2) Investigating ERM, but no decision made yet; (3)
Planning to implement ERM; (4) Partial ERM is in place; (5) Complete ERM is in place. The classification
into five levels by Beasley, Clune, and Hermanson (2005) is adopted in various further empirical studies (see,
e.g., Branson, Beasley, and Hancock, 2009, 2010; Daud, Yazid, and Hussin, 2010; Daud, Haron, and Ibra-
him, 2011). 7 In the literature, business libraries such as Lexis-Nexis, PR Newswire or Thomson are used. Search criterions
are, e.g., “enterprise risk management” or “holistic risk management for ERM and “chief risk officer“, “di-
rector of risk management”, or “risk committee” for CRO. For further examples, see, e.g., Beasley, Pagach,
and Warr (2008), Hoyt and Liebenberg (2011), or Golshan and Rasid (2012).

7
(2005) empirically show that there is a significant positive relationship between the presence
of a CRO and the ERM implementation stage (see next section), thus providing support for
the proxy used in the empirical studies.
3. DETERMINANTS OF ERM IMPLEMENTATION
Regarding the implementation and determinants of an ERM system, several studies have a
primarily qualitative focus. While Thiessen, Hoyt and Merkley (2001) survey 21 CROs in
North America to examine their roles, responsibilities and skills, the decision criteria for
adopting an ERM system in Canada is analyzed by Kleffner, Lee, and McGannon (2003)
based on a mail survey and telephone interviews. In 2009 and 2010, Beasley, Branson, and
Hancock (2009 and 2010) conduct an online survey with 710 and 460 US participants, respec-
tively, to examine risk management practices including the level of ERM implementation and
several aspects of risk oversight. Furthermore, surveys by Daud, Yazid, and Hussin (2010)
and Daud, Haron, and Ibrahim (2011) in the Malaysian market show that the level of ERM
implementation is strongly influenced by the quality of the CRO and the board of directors.8
Based on a survey of 95 German property-liability insurers, Altuntas, Berry-Stölzle, and Hoyt
(2011) analyze how these companies adopt an ERM system and which risk sources are in-
cluded in this holistic approach.
3.1 Empirical studies of ERM determinants
Hence, while there are numerous studies on the determinants of an ERM implementation as
discussed above and also shown in Table 1, in the following we focus on seven studies that
apply multivariate methods to derive statistically significant evidence regarding the determi-
nants of ERM. An overview of the seven empirical studies along with their underlying data,
time period, methodology, ERM proxy as well as empirical results is given in Table 2. As can
be seen from Table 2, most of the studies are based on data from US firms for different time
periods and in most studies, the appointment or existence of a CRO is used by itself or in ad-
dition to ERM key words as a proxy for the implementation of an ERM system. The supposed
determinants related to an ERM implementation comprise company-specific variables such as
financial, structural or ownership characteristics. In the following, we present the most com-
monly analyzed hypotheses (H) in the seven considered studies and describe the generally
assumed relation.
8 Yazid, Hussin, and Daud (2011) consider government-linked companies in Malaysia and find similar results.

8
Table 2: Determinants of ERM implementation: Evidence from empirical studies H1 H2 H3 H4 H5 H6 H7 H8
Authors Data Time period
Metho-dology
ERM proxy
Company size
Financial leverage
Earnings volatility
Stock price vol-atility
Asset opacity
Growth opportu-nity
Diversi-fication
Institu-tional ownership
LH (2003) 26 U.S. companies
1997-2001
Logistic regression
CRO key words –* +** – + + +
BCH (2005) 123 com-panies
2004 Logistic regression
ERM stage (survey)
+**
HL (2008) 125 U.S. insurers
2000-2005
ML model ERM / CRO key words
+*** –** – / –
(indust. / internat.)
+***
HL (2011) 117 U.S. insurers
1998-2005
ML model ERM / CRO key words
+*** –** + + – + / –*
(indust. / internat.)
+**
PW (2011) 138 U.S. companies
1992-2005
Hazard model
CRO key words
+*** – +** (cash flow volatility)
+** - - – (indust.)
+**
RYT (2011) 528 Ma-laysian firms
2007 Logistic regression
Osiris database
+ + +* (internat.)
+
GR (2012) 90 Malay-sian firms
not speci-fied
Logistic regression
CRO key words
+ +* + + – (indust.) –
Notes: LH (2003): Liebenberg and Hoyt (2003); BCH (2005): Beasley, Clune, and Hermanson (2005); HL (2008): Hoyt and Liebenberg (2008); HL (2011): Hoyt and Liebenberg (2011); PW (2011): Pagach and Warr (2011); RYT (2011): Razali, Yazid, and Tahir (2011); GR (2012): Golshan and Rasid (2012). Significance levels: 1% (***), 5% (**), 10% (*). ML = maximum likelihood.

9
H: Companies are more likely to implement an ERM system with increasing…
H1: …company size.
A larger company size is generally associated with an increasing scope and complexity of
risks, which increases the likelihood of an ERM implementation. Furthermore, according to
Beasley, Clune, and Hermanson (2005) and Golshan and Rasid (2012), larger companies also
tend to have more resources with which to implement an ERM system. A positive correlation
of the company size with the extent of the risk management system has also been shown pre-
viously (see, e.g., Colquitt, Hoyt, and Lee, 1999). The studies considered in Table 2 measure
company size using the natural log of the firm’s (book value of) assets except for Beasley,
Clune, and Hermanson (2005), who consider the firm’s revenues.
H2: …financial leverage.
Greater financial leverage is expected to generally induce a higher shortfall risk and thus
higher financial distress costs. Even though the relationship between financial leverage and
the adoption of an ERM system is not entirely clear (see Hoyt and Liebenberg, 2011, p. 805),
financial leverage is expected to positively affect the adoption of an ERM system (see, e.g.,
Liebenberg and Hoyt, 2003). Financial leverage is mostly defined by the debt (or liability) to
asset ratio.9
H3: …earnings / cash flow volatility.
A reduction in earnings volatility is typically stated as one major benefit of ERM, which is
expected to result from the comprehensive consideration of interdependencies between enter-
prise-wide risks (Liebenberg and Hoyt, 2003). In the empirical studies considered, earnings
volatility is measured by the coefficient of variation of earnings before interest and taxes
(EBIT). Pagach and Warr (2011) are the only ones in Table 2 to study cash flow volatilities
instead of earnings volatility, using the firm’s operating cash flows and hypothesizing that
smoothing cash flows leads to a reduction in the likelihood of lower tail cash flow outcomes
and, thus, that firms with higher cash flow volatility are more likely to benefit from an ERM
implementation (p. 192).
H4: …stock price volatility.
Similar to earnings and cash flow volatility, the implementation of a holistic risk management
can also reduce the firm’s stock price volatility, as a higher stock price volatility implies that
companies are faced with greater risks and consequently benefit more from ERM system.
9 Hoyt, Moore, and Liebenberg (2008), Hoyt and Liebenberg (2011), and Razali, Yazid, and Tahir (2011) use
the ratio of the book value of debt to the market value of equity.

10
Hence, a positive relation between the volatility of stocks and ERM is typically expected. In
the empirical literature, this variable is defined as the standard deviation of stock prices or
stock returns.10
H5: …asset opacity.
In situations of financial distress, companies with more opaque assets have more difficulties
liquidating their assets at purchase costs to prevent financial distress and they are more likely
to cause an undervaluation of the company, also due to higher information asymmetry (see,
e.g., Pagach and Warr, 2011, p. 192). In addition, Liebenberg and Hoyt (2003) argue that the
economic benefit of ERM may be greater for companies with higher opacity due to the ability
of the CRO to communicate the firm’s risk profile and financial strength to prevent disagree-
ment. The assets’ opacity is measured by the ratio of intangible assets to total assets.
H6: …growth opportunity.
Liebenberg and Hoyt (2003) and Pagach and Warr (2011) expect that firms with greater
growth opportunities face an increasing degree of uncertainty with respect to future cash
flows and are thus more likely to implement an ERM system. In particular, ERM does not
only help reduce risks but also accounts for potential opportunities, such that the growth po-
tential can be realized in an optimal way by means of an ERM system. Furthermore, accord-
ing to Beasley, Pagach and Warr (2008), the growth opportunities of high potential companies
are generally undervalued resulting in higher costs of debt. Hence, greater growth opportuni-
ties enhance the benefit of ERM and are measured by the (average) market-to-book asset ratio
in the studies considered.
H7: …diversification.
Companies that operate in several segments or business units are overall more broadly diver-
sified, thus potentially helping to reduce operating and financial risks (see, e.g., Pagach and
Warr, 2011). However, a higher diversification within the company is also consistent with
higher risk complexity, thus resulting in the assumption of a positive relation between an
ERM system and the firms’ level of diversification (see, e.g., Golshan and Rasid, 2012). Hoyt
and Liebenberg (2008) and Hoyt and Liebenberg (2011) (focusing on the insurance industry)
measure diversification by means of dummy variables for industrial and international diversi-
fication that are derived from the firm’s industrial and international sales, while the other two
10 Hoyt and Liebenberg (2011) use the natural log of the stock returns’ standard deviation, while Golshan and
Rasid (2012) consider the difference of the year high and year low stock prices.

11
studies use the number of (operating) segments (see Pagach and Warr, 2011; Golshan and
Rasid, 2012).11
H8: …institutional ownership.
Firms with a higher proportion of institutional share ownership are assumed to be exposed to
a higher pressure to introduce a control system, and thus tend more towards the implementa-
tion of a holistic ERM framework (see Liebenberg and Hoyt, 2003; Hoyt and Liebenberg,
2011).12
3.2 Empirical results regarding the determinants of an ERM implementation
In the empirical literature on the determinants of ERM, different multivariate methods are
applied to study the hypotheses laid out in the previous subsection.13 Liebenberg and Hoyt
(2003), Beasley, Clune, and Hermanson (2005), Razali, Yazid, and Tahir (2011), and Golshan
and Rasid (2012) use logistic regression models, for instance,14 while Pagach and Warr
(2011) apply a (proportional) hazard model (Cox model), which takes into account the impact
of time on the hiring decision of a CRO, to overcome the issue of the assumption of the inde-
pendence of all firm observations.15
The results of the empirical studies are summarized and presented in Table 2 for the eight
discussed determinants. In the majority of the empirical studies, the impact of the company’s
size (H1) on ERM is identified as a (significant) positive determinant. In Hoyt and Liebenberg
(2008), Hoyt and Liebenberg (2011), and Pagach and Warr (2011), for instance, the size of
the company is even significant at the 1% level. Thus, as expected, larger companies appear
to require a more efficient risk management system as a result of the increasing scope and
complexity of risks. This argumentation also generally applies for the determinant diversifica-
tion (H7). Since more diversified companies are faced with an increasing risk complexity,
similar to company size, a positive relationship to ERM is assumed. The empirical results,
however, cannot confirm this assumption in general, as only Razali, Yazid, and Tahir (2011)
find a positive significant relation for international diversification. Apart from that, the coeffi-
11 In Razali, Yazid, and Tahir (2011), the measurement of (international) diversification (as a dummy variable)
is not specified in detail. 12 The percentage of the 30 largest shareholders is considered in Razali, Yazid, and Tahir (2011). 13 Besides multivariate methods, several studies additionally present univariate statistics of the determinants for
comparison between ERM and non-ERM companies. 14 The dependent variable is therefore binary (ERM is implemented or not). In Beasley, Clune, and Hermanson
(2005) the values of the dependent ERM variable can vary from one to five (level of ERM implementation). 15 The estimation results with the hazard model should hardly differ when compared to the logistic regression;
only the test statistics are superior (see Pagach and Warr, 2011).

12
cients for (industrial and international) diversification are generally not significant and more-
over negative with the exception of a positive relation for industrial diversification found in
the insurance sample studied by Hoyt and Liebenberg (2011). The relation between interna-
tional diversification and ERM in this study is even negatively significant at the 10% level.
When looking at the financial leverage (H2), results are ambiguous. While Liebenberg and
Hoyt (2003) and Golshan and Rasid (2012) find this factor to be significantly positively relat-
ed to ERM,16 the studies from Hoyt and Liebenberg (2008) and Hoyt and Liebenberg (2011)
show a significant negative relationship. The positive coefficient supports the assumption of
more efficient risk management systems in higher leveraged companies to mitigate potential
losses due to a greater risk of financial distress (see Golshan and Rasid, 2012). In contrast,
according to the results in Hoyt and Liebenberg (2011), for instance, companies with lower
financial leverage, which is generally associated with lower financial risks, may decide in
favor of an ERM system to be able to take more financial risk in the future.
The volatilities of earnings (or cash flows) (H3) and stock prices (H4) are always positively
related to the adoption of an ERM system in cases where the relationship is significant. This
is mainly in line with our expectations, as firms with more volatile earnings, cash flows or
stock prices benefit from an ERM system due to smoothed earnings and a better control of
stock prices (e.g., Pagach and Warr, 2011).
Regarding the impact of the assets’ opacity (H5) and the growth opportunity (H6) on ERM, in
general, no significant evidence is found. Furthermore, the (insignificant) direction of the re-
lationship is inconsistent across the empirical literature. Regarding H8, the findings confirm
that institutional shareholders indeed appear to apply pressure to develop an efficient and ho-
listic corporate risk management, as most studies find a (significant) positive relation between
institutional ownership and an ERM adoption.
In contrast to the six studies described above, Beasley, Clune, and Hermanson (2005) use a
different approach by distinguishing the state of the ERM implementation into five levels
based on a survey as described in Section 2.2. The results of their study show that the exist-
ence of a CRO constitutes a highly significant determinant for an existing ERM system (at the
1% level), thus providing support for the use of the CRO as a proxy for ERM in the other
studies listed in Table 2. Besides the company size (significant at the 10% level),17 the results
of the study emphasize the high significance of the independence of the board of directors
16 Razali, Yazid, and Tahir (2011) detect a positive but not significant relationship. 17 In contrast to the further studies (see Table 2), the company size is here measured by the firm’s revenues.

13
(significant at the 1% level) and the auditor type (Big Four, significant at a 1% level) as posi-
tively impacting an ERM implementation. The latter result is similar to Golshan and Rasid
(2012), who also find the auditor type to be a significant (positive) determinant at the 5% lev-
el, which implies that an audit by one of the Big Four can be considered as being associated
with a higher developed corporate risk management system.
In the comparative assessment of the empirical results, one also has to take into account the
role of the industry sector and the firm’s geographical location as relevant determinants of an
ERM program, as some industries are more strictly regulated than others. Hence, regulated
industry sectors such as the banking or energy sector are more likely to implement an ERM
system to assure an adequate and effective risk management system (see Golshan und Rasid,
2012). Pagach and Warr (2011) further restrict their analysis to only financial firms and banks
and, for the bank sample, find company size, institutional ownership, and the tier 1 capital
ratio to be significant ERM determinants. Liebenberg and Hoyt (2003) test the hypothesis as
to whether US companies are more likely to adopt an ERM system when they have subsidiar-
ies in the UK or Canada and find a positive but not significant effect. In a similar analysis,
Beasley, Clune, and Hermanson (2005) find that US organizations have a less developed
ERM system than international organizations. In Golshan und Rasid (2012), a firm’s head-
quarters or subsidiary being in the UK, Canada, Australia or New Zealand is found to be a
positive but not significant determinant for ERM. To account for differences with respect to
specific business lines within the insurance sector, Hoyt and Liebenberg (2008) and Hoyt and
Liebenberg (2011) include a dummy variable for life insurers, which in both studies is found
to be positive but not significantly related to ERM. The impact of the industry sector is also
studied by Beasley, Clune, and Hermanson (2005), focusing on the banking, education, and
insurance industry. Their results show that these industries are indeed more advanced in the
development of ERM frameworks as opposed to other sectors. A similar approach is taken by
Golshan und Rasid (2012) for the (Malaysian) regulated financial and energy sectors, which,
however, could not detect a significant relationship.
4. THE VALUE OF IMPLEMENTING AN ERM SYSTEM
We next investigate the value of a holistic ERM framework and the evidence provided in the
empirical literature. We also show that the approaches used for assessing the value or the per-
formance of implementing an ERM program from a firm’s perspective can considerably dif-
fer. In what follows, we first discuss the procedures and objectives of the considered studies
and then assess and compare the empirical evidence with respect to the value of ERM.

14
4.1 Empirical studies on ERM performance
Eight studies are identified that empirically deal with the impact of ERM on firm performance
and shareholder value in the sense of providing statistical evidence. The underlying data, time
period, methodology and assumptions regarding the ERM proxy along with the key findings
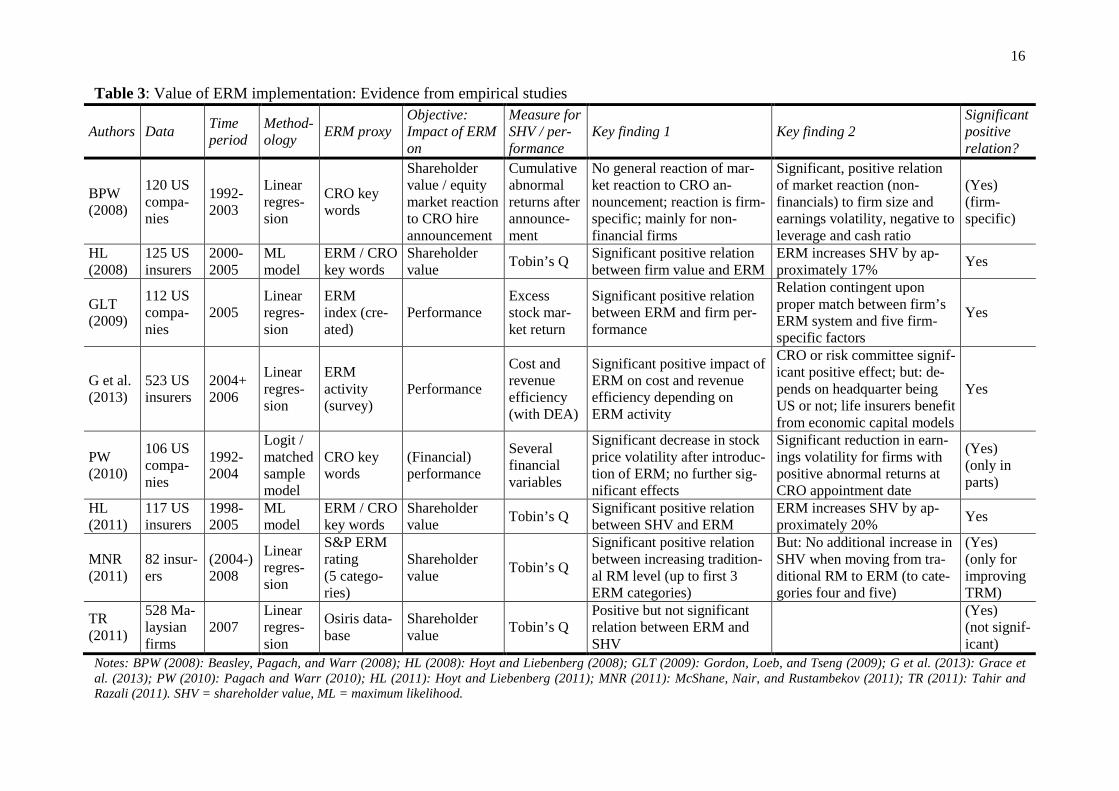
are summarized in Table 3.
As can be seen from Table 3, five of the eight studies focus on the impact of ERM on share-
holder value, while three studies examine the impact on the company’s (financial) perfor-
mance. In all studies on shareholder value, Tobin’s Q is used to approximate the firm’s value
from the shareholder perspective,18 which is useful as it reflects the future expectations of
shareholders (Hoyt and Liebenberg, 2008). Only the study by Beasley, Pagach, and Warr
(2008) reverts to using the cumulative abnormal returns after the announcement of a CRO
being hired instead of Tobin’s Q, thus focusing on equity market reactions after the an-
nouncement of a CRO being hired.
In the three studies that assess the (financial) performance of ERM, the impact is measured by
excess stock market returns (Gordon, Loeb, and Tseng, 2009), cost and revenue efficiency
including return on assets (ROA) (Grace et al., 2013) or several financial variables, such as
financial leverage, return on equity (ROE), as well as stock price and cash flow volatility (Pa-
gach and Warr, 2010).
Regarding the methodology and the underlying data of the shareholder value studies, Beasley,
Pagach, and Warr (2008) use a linear regression model to investigate the impact of an ERM
implementation on shareholder value, which is approximated by equity market reactions after
the hiring of a CRO, where the dependent variable is the cumulative abnormal return after the
announcement. The study includes 120 US companies, which are further divided into sub-
samples comprising 47 financial firms and 73 non-financials (including the insurance sector,
the energy sector, and miscellaneous) from 1992 to 2003. In Hoyt and Liebenberg (2008) and
Hoyt and Liebenberg (2011), a maximum likelihood (ML) model is applied to assess the im-
pact of ERM on shareholder value using CRO and ERM key words as described in the previ-
ous section. As such a model setting may cause an endogeneity problem due to correlations
between the decision to adopt an ERM system and the considered differences in the share-
holder value, a two-equation system is adopted to jointly model the determinants of ERM and
the impact on shareholder value. This allows for the adjusting of the standard errors for firm-
level clustering (see Hoyt and Liebenberg, 2008). The sample data in Hoyt and Liebenberg
18 Tobin’s Q is given by the ratio of the market value of equity plus liabilities (at book value) and assets (at
book value).

15
(2008) (Hoyt and Liebenberg, 2011) are made up of 125 (117) US life and non-life insurers in
the time period 2000 to 2005 (1998 to 2005). By means of a linear regression with data from
82 publicly traded US insurers in 2008. McShane, Nair, and Rustambekov (2011) describe the
impact of the S&P ERM rating19 and further company variables on Tobin’s Q. A similar ap-
proach is used in Tahir and Razali (2011) regarding the Malaysian market (comprising 528
publicly listed companies) in 2007, using a binary ERM variable (ERM is adopted or not)
derived from the Osiris database.
The studies dealing with the impact of ERM on performance are even more diverse in their
methodology. Gordon, Loeb, and Tseng (2009) consider the relationship between ERM and
firm performance as being dependent on the appropriate match between the firm’s ERM and
five firm-specific factors, namely environmental uncertainty, industry competition, size, com-
plexity, and the monitoring of the board of directors. They thus only consider companies that
have an ERM by searching for matching key words.20 To address the impact of ERM on firm
performance (contingent upon a proper match with the firm-specific factors), they first derive
the respective firm’s ERM index by using four criteria following the COSO framework and,
as a second step, derive the relation between the ERM indices for the highest performing (in
the sense of excess returns) firms and the five firm-specific factors by means of a linear re-
gression.21 They thus identify a “best practice” or “benchmark” model for ERM, assuming
that firms following this model (i.e., firms with these characteristics) will exhibit a higher
performance.22 To test this assumption, Gordon, Loeb, and Tseng (2009) revert to a residual
analysis by considering the difference in the ERM index of the highest performing companies
as a benchmark index and the individual firm’s ERM, where this residual value, as the devia-
tion from the benchmark, constitutes the dependent variable in the linear regression of the
firm’s performance.23 Firm performance is here measured based on the company’s excess
returns in the year 2005 for 112 US companies.24
19 S&P conduct a corporate risk management rating as a proxy for the level of ERM implementation, where
five categories are distinguished: a weak, adequate, adequate with a positive trend, strong, and excellent de-
velopment of an ERM program. For their analysis, McShane, Nair, and Rustambekov (2011) translate the
S&P ratings for ERM into numerical scores (1 = weak, …, 5 = excellent). 20 The key words are “enterprise risk management”, “strategic risk management”, “corporate risk manage-
ment”, “risk management committee”, “risk committee” and “chief risk officer”. 21 Based on the four ERM objectives from COSO, namely strategy, operations, reporting and compliance, the
ERM index is calculated by the sum of eight indicators (two for each objective). 22 They identify 53 high performing companies (with excess returns higher than 2%) and 59 other companies, 23 Hence, the residual value is assumed to be negatively related to firm performance. 24 The firm performance Pi is measured by
( )( ) ,i i f i m fP R R R Rβ= − + −
where Ri denotes the one-year excess stock market return for company i, Rm the return for the market, Rf the
risk-free interest rate and βi the beta of company i.
16
Table 3: Value of ERM implementation: Evidence from empirical studies
Authors Data Time period
Method-ology
ERM proxy Objective: Impact of ERM on
Measure for SHV / per-formance
Key finding 1 Key finding 2 Significant positive relation?
BPW (2008)
120 US compa-nies
1992-2003
Linear regres-sion
CRO key words
Shareholder value / equity market reaction to CRO hire announcement
Cumulative abnormal returns after announce-ment
No general reaction of mar-ket reaction to CRO an-nouncement; reaction is firm-specific; mainly for non-financial firms
Significant, positive relation of market reaction (non-financials) to firm size and earnings volatility, negative to leverage and cash ratio
(Yes) (firm-specific)
HL (2008)
125 US insurers
2000-2005
ML model
ERM / CRO key words
Shareholder value
Tobin’s Q Significant positive relation between firm value and ERM
ERM increases SHV by ap-proximately 17%
Yes
GLT (2009)
112 US compa-nies
2005 Linear regres-sion
ERM index (cre-ated)
Performance Excess stock mar-ket return
Significant positive relation between ERM and firm per-formance
Relation contingent upon proper match between firm’s ERM system and five firm-specific factors
Yes
G et al. (2013)
523 US insurers
2004+ 2006
Linear regres-sion
ERM activity (survey)
Performance
Cost and revenue efficiency (with DEA)
Significant positive impact of ERM on cost and revenue efficiency depending on ERM activity
CRO or risk committee signif-icant positive effect; but: de-pends on headquarter being US or not; life insurers benefit from economic capital models
Yes
PW (2010)
106 US compa-nies
1992-2004
Logit / matched sample model
CRO key words
(Financial) performance
Several financial variables
Significant decrease in stock price volatility after introduc-tion of ERM; no further sig-nificant effects
Significant reduction in earn-ings volatility for firms with positive abnormal returns at CRO appointment date
(Yes) (only in parts)
HL (2011)
117 US insurers
1998-2005
ML model
ERM / CRO key words
Shareholder value
Tobin’s Q Significant positive relation between SHV and ERM
ERM increases SHV by ap-proximately 20%
Yes
MNR (2011)
82 insur-ers
(2004-) 2008
Linear regres-sion
S&P ERM rating (5 catego-ries)
Shareholder value
Tobin’s Q
Significant positive relation between increasing tradition-al RM level (up to first 3 ERM categories)
But: No additional increase in SHV when moving from tra-ditional RM to ERM (to cate-gories four and five)
(Yes) (only for improving TRM)
TR (2011)
528 Ma-laysian firms
2007 Linear regres-sion
Osiris data-base
Shareholder value
Tobin’s Q Positive but not significant relation between ERM and SHV
(Yes) (not signif-icant)
Notes: BPW (2008): Beasley, Pagach, and Warr (2008); HL (2008): Hoyt and Liebenberg (2008); GLT (2009): Gordon, Loeb, and Tseng (2009); G et al. (2013): Grace et al. (2013); PW (2010): Pagach and Warr (2010); HL (2011): Hoyt and Liebenberg (2011); MNR (2011): McShane, Nair, and Rustambekov (2011); TR (2011): Tahir and Razali (2011). SHV = shareholder value, ML = maximum likelihood.
17
Grace et al. (2013) focus on cost efficiency and revenue efficiency as a proxy for perfor-
mance, which are modeled based on firm characteristics and firm-specific ERM activities.25
Applying data envelopment analysis (DEA), a benchmark of “best practice” is derived to
measure the distance of the company’s individual efficiency to this benchmark. The ERM
activities stem from a survey in 2004 and 2006 of US life and property-liability insurers con-
ducted by Tillinghast. The ERM activities derived from the survey are a risk management
function (CRO or similar), the underlying economic capital model, financial metrics (market
value based or not), reporting relationships, executive compensation, and the firm’s decision
making process. The overall analysis is then composed of data from the years 2004 and 2006
for 523 insurance companies from the US market of which 215 are life insurers and 306 are
US-headquartered, which were matched with the ERM survey results.
The approach in Pagach and Warr (2010) differs from the other works in that they study the
impact of an ERM implementation (proxied by the appointment of a CRO) on a firm’s key
(financial) variables.26 This is done by comparing the financial variables in the two years be-
fore and after the appointment of a CRO and by studying the differences between the sample
with and without the CRO appointment using a matched sample and logit model. The sample
data of 106 US firms, based on the years from 1992 to 2004, are then further divided into fi-
nancials (56), utilities (15) and others (35).
4.2 Empirical results regarding the value of implementing an ERM system
Regarding the key findings in the empirical studies, we find that a positive relation between
the implementation of an ERM system and the shareholder value or performance is evident in
all studies, but to a different extent and depending on the respective objective (see Table 3).
Among the five studies that analyze the impact of ERM on shareholder value, Hoyt and
Liebenberg (2008) and Hoyt and Liebenberg (2011), for instance, find a positive and highly
significant impact of ERM on their insurance sample, which results in a higher shareholder
value of approximately 17% to 20%. This is partly consistent with the results from McShane,
Nair, and Rustambekov (2011), who find a significant positive relationship with shareholder
value, but only in the case of an increasing level of traditional risk management, whereas
25 Cost efficiency is defined by the ratio of the minimum required costs and actual utilized costs to produce a
given level of output; revenue efficiency is given by the ratio of the company’s revenues and the revenues of
a fully efficient company with the same input vector and output prices. 26 The key variables comprise earnings and stock price volatility, financial leverage, return on equity (ROE),
financial slack, assets’ opacity, growth opportunities, and research and development expense. Pagach and
Warr (2010) additionally focus on the banking sector including bank-specific characteristics such as the dura-
tion ratio, loan loss provision, and the tier 1 risk adjusted capital ratio.

18
moving from a traditional to an ERM does not additionally increase shareholder value in the
considered sample of insurers.27 Furthermore, Beasley, Pagach, and Warr (2008) do not find
an equity market reaction to the announcement of a CRO being hired in general, but only in
the case of non-financial firms. Hence, they identify a significant positive market reaction for
firm-specific characteristics, including firm size and earnings volatility, as well as a negative
reaction for financial leverage28 and cash ratio.29 For the Malaysian market, Tahir and Razali
(2011) find a positive but not significant relation between ERM and shareholder value.30
Of the three studies that conduct an analysis of the impact of ERM on the firm’s performance,
two find a significant and positive relationship. First, Grace et al. (2013) find a significant
positive effect of ERM on cost and revenue efficiency, which, however, depends on the type
of ERM activity. In particular, the existence of a CRO or (with an even higher significance
level) a risk management committee as well as the application of market value based risk
measures significantly impact cost efficiency in a positive way. The results further show a
significant positive relation of the sophistication of life insurers’ economic capital models to
cost efficiency, which is not the case for property-liability insurers. For revenue efficiency,
the identified (significant) variables are similar to before, but particularly the relation of a
CRO to revenue efficiency is reversed.31 In contrast to cost efficiency, the risk metric is not
detected as being significant, whereas the risk management reporting is positive and signifi-
cant. When looking at US headquartered insurers, the empirical results are generally robust
for cost efficiency. For revenue efficiency, statistical significance is particularly reduced for
the presence of a CRO or a risk management committee.32 Second, Gordon, Loeb, and Tseng
(2009) also find strong evidence for the positive impact of an ERM system on firm perfor-
mance, measured by the one-year excess stock market return. The results reveal that this rela-
tion is contingent upon a proper match between the firm’s ERM system and the five firm-
specific key variables described in the previous subsection. Third, Pagach and Warr (2010)
27 The first three (of five) S&P ERM rating categories are assumed to reflect a traditional risk management
approach, while levels four and five represent holistic ERM concepts. Further results show, for instance, a
significant negative relation of financial leverage, systemic risk and cash flow volatility to shareholder value,
and firm profitability as significantly positive. No significant results were found for company size. 28 Financial leverage is here measured by the liability to equity ratio. 29 In the case of financial firms, only the cash ratio (negative), financial leverage (positive), and the change in
the firm’s β (negative) significantly impact the equity market reaction after the announcement of a CRO be-
ing hired. 30 The study further indicates a significant positive relation of financial leverage and (international) diversifica-
tion to shareholder value and a significant negative relation of company size and profitability. 31 Grace et al. (2013) argue that CROs or a risk management committee may prevent insurers from offering
high-risk products, thus limiting the potential for revenue. 32 A further analysis accounts for the impact of ERM activities on the return on equity (ROE). Here, a signifi-
cantly positive relation between a CRO or risk committee and the ROE could be found.

19
only partially detect significant positive effects of a CRO being hired and this depending on
the financial variable considered. For instance, the authors find a significant decrease in the
stock price volatility of firms after the introduction of an ERM (proxied by a CRO being
hired). Furthermore, when restricting the sample to companies that supposedly benefit more
from ERM as defined by a positive one-day abnormal stock return on the date of the an-
nouncement of the CRO being hired, a significant decrease in earnings volatility is observed
as well as a significant increase in financial leverage and return on equity (ROE).
These empirical findings are generally consistent with theoretical arguments regarding the
positive impact of an ERM implementation on shareholder value and company performance
(see, e.g., Hoyt and Liebenberg, 2011, pp. 797-798). In particular, firms with an ERM system
are assumed to benefit from the holistic perspective and the improved coordination between
the various risk management departments as well as the exploitation of natural hedges within
the firm. In particular, as ERM constitutes a holistic framework based on an integrated ap-
proach to the company’s entire risk portfolio, it allows for a comprehensive identification and
measurement of interdependencies between risk sources (see Hoyt and Liebenberg, 2008;
Hoyt and Liebenberg, 2011). Inefficiencies in the risk management process can thus be re-
duced since decisions are reached across all risk classes and a duplication of risk management
activities can be avoided. The improved understanding of aggregated firm risk and better re-
source allocation may further contribute to an improved capital efficiency and ROE. ERM can
also contribute (as one main objective) to reducing the probability of failure or financial dis-
tress by decreasing earnings and cash flow volatilities (see Pagach and Warr, 2010; Gordon,
Loeb, and Tseng, 2009). A further benefit of ERM is the improved communication of the
company’s risk profile within the company (for decision making) as well as with investors
and stakeholders to evaluate the firm’s financial and risk situation (see Hoyt and Liebenberg,
2011). Thus, ERM may contribute to reducing regulatory costs as well as external capital
costs (see Hoyt and Liebenberg, 2011).
Hence, while the empirical evidence is generally in line with theoretical considerations and
despite their consistent findings regarding the (generally positive) impact of ERM on firm
value or performance, the comparability is still limited in several ways. In particular, the ap-
proaches used in the literature to assess the value of ERM partly differ with regards to the
estimation methodology as well as the approximation used for ERM or the measurement of
firm value and performance. In addition, the underlying data, industries, and time periods
vary substantially (see also Tables A.1 and A.2). However, our comparative analysis of the
empirical evidence in the literature still emphasizes that ERM can have a (significant) positive
effect on firm value and performance in various ways.

20
5. CONCLUSION
In this paper, we study the literature regarding empirical evidence on 1) the determinants of
an ERM implementation in firms and 2) on the value generated by ERM. Toward this end, we
conduct a comparative assessment of the quantitative literature that provides statistical evi-
dence on these questions and in doing so take into account the differences in the underlying
sample data and methodology. We focus on seven studies that deal with the identification of
determinants for ERM based on multivariate methods, and eight studies that consider the val-
ue of ERM. We find that due to often insufficient information regarding the degree of an
ERM implementation, most studies revert to the existence of a CRO or respective ERM key
words as a signal for ERM, while other studies (especially regarding the value of ERM) make
use of surveys. Obtaining data regarding the extent to which ERM is implemented in a firm
thus appears to be one main challenge in the empirical literature.
The results of our comparative assessment of the seven studies regarding the determinants of
an ERM system are partly ambiguous. On the one hand, we find a broad consistency in the
empirical literature with respect to specific firm characteristics such as company size and in-
stitutional ownership that almost all studies detect as significant and positively related to the
existence of an ERM system. On the other hand, the relationship of other determinants of
ERM are either shown with different directions (e.g., financial leverage) or found not to be
significant (e.g., assets’ opacity, growth opportunity). Other determinants such as earnings
and stock price volatility were found to be significantly positively related to ERM only in one
study, whereas other studies only found a positive but not significant sign.
Regarding the impact of implementing an ERM system on shareholder value (five out of eight
studies on ERM value), we find that Tobin’s Q is mostly used as a proxy for shareholder val-
ue, while one study considers equity market reactions to the announcement of a CRO being
hired, using cumulative abnormal returns after the announcement. Concerning the perfor-
mance of ERM (three out of eight studies), focus is mostly laid on financial variables as well
as cost and revenue efficiency. Our comparison shows that all the studies at least to some ex-
tent identify a positive (and mostly significant) relation between ERM and shareholder value
or performance. While two studies even provide statistically strong evidence for this relation,
further works find significance only for restricted data (non-financials; companies that are
expected to benefit more from an ERM program) or a restricted implementation level (high
level of traditional risk management). One further analysis provides a positive indication
based on Malaysian firm data, which, however, is not significant.

21
Thus, even though the comparability of the studies on determinants and performance is partly
limited due to the differences in sample data and methodologies, the empirical evidence
shows several common determinants regarding the implementation of an ERM system and,
most importantly, all empirical studies demonstrate (to a different extent) the positive effects
of implementing an ERM system with respect to shareholder value or firm performance. For
the insurance industry, the empirical literature shows even more significant results than for
companies in general, which can be an indicator of the higher relevance of a holistic risk
management system in the insurance sector. However, further research regarding the determi-
nants of ERM and its impact on firm value appears necessary. Larger and international data
samples could reveal further geographical and industrial differences regarding the determi-
nants and the performance of an ERM program. One particular problem that needs to be ad-
dressed in this context is the availability of reliable data and the challenge of data collection.
To overcome this issue, future research could focus on newer methods, such as, e.g., data and
text mining approaches. This is also of relevance as the importance of ERM can be expected
to further increase in the future, especially in the banking and insurance sector, where new
and revised risk-based regulatory frameworks are introduced, which require comprehensive
risk management systems to assess and manage risks in a holistic way according to the pro-
portionality principle, i.e., depending on the complexity of risks firms are exposed to. The
empirical literature thus contributes to understanding the actual drivers and value of ERM.
REFERENCES
Ai, J., Brockett, P. L., Cooper, W. W., Golden, L. L. (2012): Enterprise Risk Management
through Strategic Allocation of Capital, Journal of Risk and Insurance 79(1): 29-56.
Altuntas, M., Berry-Stölzle, T. R., and Hoyt, R. E. (2011): Implementation of Enterprise Risk
Management: Evidence from the German Property-Liability Insurance Industry, Geneva
Papers on Risk & Insurance - Issues and Practice 36(3): 414-439.
Beasley, M., Clune, R., and Hermanson, D. (2005): Enterprise Risk Management: An Empiri-
cal Analysis of Factors Associated with the Extent of Implementation, Journal of Account-
ing and Public Policy 24(6): 521-531.
Beasley, M., Pagach, D., and Warr, R. (2008): Information Conveyed in Hiring Announce-
ments of Senior Executives Overseeing Enterprise-Wide Risk Management, Journal of Ac-
counting, Auditing and Finance 23(3): 311-332.
Beasley, M., Branson, B., and Hancock, B. (2009): Report on the Current State of Enterprise
Risk Oversight, ERM Initiative at North Carolina State University, Raleigh.

22
Beasley, M., Branson, B., and Hancock, B. (2010): COSO’s Report on ERM - Current State
of Enterprise Risk Oversight and Market Perceptions of COSO’s ERM Framework, ERM
Initiative at North Carolina State University, Raleigh.
Colquitt, L. L., Hoyt, R. E., and Lee, R. B. (1999): Integrated Risk Management and the Role
of the Risk Manager, Risk Management and Insurance Review 2(3): 43-61.
Committee of Sponsoring Organizations of the Treadway Commission (COSO) (2004): En-
terprise Risk Management - Integrated Framework, available at http://www.coso.org, ac-
cessed 07/01/2013.
Committee of Sponsoring Organizations of the Treadway Commission (COSO) (2009):
Strengthening Enterprise Risk Management for Strategic Advantage, available at
http://www.coso.org, accessed 07/01/2013.
Daud, W. N. W., Haron, H., and Ibrahim, D. N. (2011): The Role of Quality Board of Direc-
tors in Enterprise Risk Management (ERM) Practices: Evidence from Binary Logistic Re-
gression, International Journal of Business and Management 6(12): 205-211.
Daud, W. N. W., Yazid, A. S., and Hussin, M. R. (2010): The Effect of Chief Risk Officer
(CRO) on Enterprise Risk Management (ERM) Practices: Evidence from Malaysia, Inter-
national Business & Economics Research Journal 9(11): 55-64.
Deloitte (2011): Global Risk Management Survey - Seventh Edition: Navigating in a Changed
World, available at http://www.deloitte.com, accessed 07/01/2013.
Dionne, G., and Garand, M. (2003): Risk Management Determinants Affecting Firms’ Values
in the Gold Mining Industry: New Empirical Results, Economics Letters 79: 43-52.
Dreyer, S. J., and Ingram, D. (2008): Enterprise Risk Management: Standard & Poor’s To
Apply Enterprise Risk Analysis to Corporate Ratings, Standard & Poor’s (S&P), New
York.
Federation of European Risk Management Associations (FERMA) (2002): Risk Management
Standard, available at http://www.ferma.eu, accessed 07/01/2013.
Golshan, N. M., and Rasid, S. A. (2012): Determinants of Enterprise Risk Management
Adoption: An Empirical Analysis of Malaysian Public Listed Firms, International Journal
of Social and Human Sciences 6: 119-126.
Gordon, L., Loeb, M., and Tseng, C. (2009): Enterprise Risk Management and Firm Perfor-
mance: A Contingency Perspective, Journal of Accounting and Public Policy 28(4): 301-
327.

23
Grace, M., Leverty, J., Phillips, R., and Shimpi, P. (2013): The Value of Investing in Enter-
prise Risk Management, Working Paper, Georgia State University and University of Iowa
(2010), Journal of Risk and Insurance (forthcoming).
Jablonowski, M. (2001): Thinking in Numbers, Risk Management 48(2): 30-35.
Hoyt, R. E., and Liebenberg, A. P. (2011): The Value of Enterprise Risk Management, Jour-
nal of Risk and Insurance 78(4): 795-822.
Hoyt, R. E., and Liebenberg, A. P. (2008): The Value of Enterprise Risk Management: Evi-
dence from the U.S. Insurance Industry, Society of Actuaries, ERM Monograph Paper,
available at http://www.soa.org, accessed 07/01/2013.
International Organization for Standardization (ISO) (2009): ISO 31000:2009 - Risk man-
agement - Principles and Guidelines, available at http://www.iso.org, accessed 07/01/2013.
Kleffner, A. E., Lee, R. B., and McGannon, B. (2003): The Effect of Corporate Governance
on the Use of Enterprise Risk Management: Evidence from Canada, Risk Management In-
surance Review 6(1): 53-73.
KPMG (2001): Enterprise Risk Management – An Emerging Model for Building Shareholder
Value, available at http://www.kpmg.com, accessed 07/01/2013.
Liebenberg, A. P., and Hoyt, R. E. (2003): The Determinants of Enterprise Risk Management
Evidence from the Appointment of Chief Risk Officers, Risk Management and Insurance
Review 6(1): 37-52.
Meulbroek, L. M. (2002): Integrated Risk Management for the Firm: A Senior Manager’s
Guide, Journal of Applied Corporate Finance 14(1): 56-70.
McShane, M. K., Nair, A., and Rustambekov, E. (2011): Does Enterprise Risk Management
Increase Firm Value?, Journal of Accounting, Auditing & Finance 16(4): 641-658.
Nocco, B., and Stulz, R. (2006): Enterprise Risk Management: Theory and Practice, Journal
of Applied Corporate Finance 18(4): 8-20.
Pagach, D., and Warr, R. (2010): The Effects of Enterprise Risk Management on Firm Per-
formance, Working Paper, North Carolina State University, Raleigh.
Pagach, D., and Warr, R. (2011): The Characteristics of Firms that Hire Chief Risk Officers,
Journal of Risk and Insurance 78(1): 185-211.
Razali, A. R., Yazid, A. S., and Tahir, I. M. (2011): The Determinants of Enterprise Risk
Management (ERM) Practices in Malaysian Public Listed Companies, Journal of Social
and Development Sciences 1(5): 202-207.
Rochette, M. (2009): From Risk Management to ERM, Journal of Risk Management in Fi-
nancial Institutions 2(4): 394-408.

24
Tahir, I. M., and Razali, A. R. (2011): The Relationship between Enterprise Risk Manage-
ment and Firm Value: Evidence from Malaysian Public Listed Companies, International
Journal of Economics and Management Sciences 1(2): 32-41.
Thiessen, K., Hoyt, R. E., Merkley, B. M. (2001): A Composite Sketch of a Chief Risk Of-
ficer, The Conference Board of Canada, Ottawa, Canada.
Yazid, A. S., Hussin, M. R., and Daud, W. N. W. (2011): An Examination of Enterprise Risk
Management (ERM) Practices among the Government-Linked Companies (GLCs) in Ma-
laysia, International Business Research 4(4): 94-103.

25
APPENDIX
Table A.1: Details regarding the studies on the determinants of ERM in Table 2
Authors Market Sample size Industry (sample size) Analyzed sub-samples Additional industrial / geographical variable (dummy)
LH (2003) US 26 - Financial (15) - Energy (11)
- Financial services - Subsidiary in UK or Canada
BCH (2005) International 123 - Banking, education or insurance - Headquarter in US
HML (2008) US 125
- Fire, marine and casualty insurance (73) - Life insurance (25) - Other insurance (27)
Life insurance
HL (2011) US 117 - Life insurance (NS) - Non-life insurance (NS)
Life insurance
PW (2011) US 138 - Financial (77) - Utility (18) - Other (43)
- Financial - Banking
RYT (2011) Malaysia 528
- Industrial (139) - Trading / Services (124) - Property (79) - Other (186)
International diversified (no further specification)
GR (2012) Malaysia 90 Headquarter or subsidiary in UK, Canada, Australia or New Zealand
Notes: LH (2003): Liebenberg and Hoyt (2003), BCH (2005): Beasley, Clune, and Hermanson (2005), HML (2008): Hoyt, Moore, and Liebenberg (2008), HL (2011): Hoyt and Liebenberg (2011), PW (2011): Pagach and Warr (2011), RYT (2011): Razali, Yazid, and Tahir (2011), GR (2012): Golshan and Rasid (2012). ML = maximum likeli-hood. NS = not specified.

26
Table A.2: Details regarding the studies on the performance impact of ERM in Table 3
Authors Market Sample size Industry (sample size) Analyzed sub-samples
BPW (2008) US 120
- Financial (47) - Energy (24) - Insurance (15) - Others (34)
- Financial - Non-financial
HML (2008) US 125
- Fire, marine and casualty insurance (73) - Life insurance (25) - Other insurance (27)
GLT (2009) US 112
- Utility (30) - Financial trading (13) - Business services (9) - Insurance (9) - Other (51)
G et al. (2013) US 523 - Life insurance (NS) - Property-liability insurance (NS)
- US headquartered - Non-US headquartered
PW (2010) US 106 - Financial (56) - Utility (15) - Other (35)
Firms that expectedly benefit more from ERM
HL (2011) US 117 - Life insurance (NS) - Non-life insurance (NS)
MNR (2011) International 82 - Insurance (82)
TR (2011) Malaysia 528
- Industrial (139) - Trading / services (124) - Properties (79) - Consumer (79) - Other (107)
Notes: BPW (2008): Beasley, Pagach, and Warr (2008), HML (2008): Hoyt, Moore, and Liebenberg (2008), GLT (2009): Gordon, Loeb, and Tseng (2009), G et al. (2013):
Grace et al. (2013), PW (2010): Pagach and Warr (2010), HL (2011): Hoyt and Liebenberg (2011), MNR (2011): McShane, Nair, and Rustambekov (2011), TR (2011): Tahir
and Razali (2011). NS = not specified.