detection of retinal abnormalities in fundus image using
TRANSCRIPT
HAL Id: hal-02428351https://hal-upec-upem.archives-ouvertes.fr/hal-02428351
Submitted on 12 Jan 2020
HAL is a multi-disciplinary open accessarchive for the deposit and dissemination of sci-entific research documents, whether they are pub-lished or not. The documents may come fromteaching and research institutions in France orabroad, or from public or private research centers.
L’archive ouverte pluridisciplinaire HAL, estdestinée au dépôt et à la diffusion de documentsscientifiques de niveau recherche, publiés ou non,émanant des établissements d’enseignement et derecherche français ou étrangers, des laboratoirespublics ou privés.
Detection of Retinal Abnormalities in Fundus ImageUsing CNN Deep Learning NetworksMohamed Akil, Yaroub Elloumi, Rostom Kachouri
To cite this version:Mohamed Akil, Yaroub Elloumi, Rostom Kachouri. Detection of Retinal Abnormalities in FundusImage Using CNN Deep Learning Networks. Elsevier. State of the Art in Neural Networks, 1, AymanS. El-Baz; Jasjit S. Suri, In press. �hal-02428351�
1
Chapter #.
DETECTION OF RETINAL ABNORMALITIESIN FUNDUS IMAGE
USING CNN DEEP LEARNING NETWORKS
Mohamed Akila (*), Yaroub Elloumia,b,c , Rostom Kachouria
aGaspard Monge Computer Science Laboratory, ESIEE-Paris, University Paris-Est Marne-la-
Vallée, France. bMedical Technology and Image Processing Laboratory, Faculty of medicine, University of
Monastir, Tunisia. cISITCom Hammam-Sousse, University of Sousse, Tunisia.
(*) Corresponding author
Name and email: Mohamed Akil ([email protected]),), Yaroub Elloumi
([email protected]), Rostom Kachouri ([email protected].
Abstract
The World Health Organization (WHO) estimates that 285 million people are visually impaired
worldwide, with 39 million blinds. Glaucoma, Cataract, Age-related macular degeneration,
Diabetic retinopathy are among the leading retinal diseases. Thus, there is an active effort to create
and develop methods to automate screening of retinal diseases. Many Computer Aided Diagnosis
(CAD) systems for ocular diseases have been developed and are widely used. Deep learning (DL)
has shown its capabilities in field of public health including ophthalmology. In retinal disease
diagnosis, the approach based upon DL and convolutional neural networks (CNNs) is used to
locate, identify, quantify pathological features. The performance of this approach keeps growing.
This chapter, addresses an overview of the used methods based upon DL and CNNs in detection
of retinal abnormalities related to the most severe ocular diseases in retinal images, where network
architectures, post/preprocessing and evaluation experiments are detailed. We also present some
related work concerning the Deep Learning-based Smartphone applications for earlier screening
and diagnosisof retinal diseases.
Keywords: Deep Learning, Convolutional Neural Networks, Ocular diseases screening,
detection, diagnosis, classification, Smartphone applications
2
1. Introduction
The WHO estimates that 285 million people are visually impaired worldwide, with 39 million
blinds [1]. The main retinal diseases are Glaucoma, Cataract, Age-related macular degeneration
(AMD), Diabetic retinopathy (DR), Retinitis pigmentosa, Pterygium and Ocular surface neoplasia.
There are several causes that contribute to increase the risk of progression and development of
these diseases such as family story and genetics, diabetes, obesity, smoking, cardiovascular
disease, aging, etc. Therefore, the Dry macular degeneration (Dry AMD) may first develop in one
eye and then affect both. The increase of dry AMD stage damages the form of the eye. This
progression is known as neovascular AMD or wet macular degeneration. For Glaucoma, the Open-
angle glaucoma (OAG) is the most common form of glaucoma. The nuclear cataracts are the most
common type of the cataract disease. The DR is a major complication of diabetes and
Nonproliferative DR is the most common type of DR. Glaucoma, AMD, Cataract and DR are the
major causes of blindness worldwide [2–5]. However, most ocular diseases affect both eyes and
80% of all causes of visual impairment are preventable or curable [1] in early stages. Late stages
on ocular pathologies lead always to severe damage on visual acuity and may be irreversible such
as the wet AMD. Therefore, early screening, detection and diagnosis of these ocular diseases are
important for slowing down and preventing total vision loss.
Nevertheless, early screening is not ensured due to the lack of ophthalmologist where important
waiting times are registered specially in industrialized countries. Moreover, patient mobility is a
limiting factor in particularly of aging patients. Thus, there is an active effort to create and develop
methods to automate screening of retinal diseases. Many CAD systems have been expanded and
are widely used for diagnosing ocular diseases [6].
In addition, a variety of imaging modalities been developed to capture the anatomic structure of
the eye. The principal imaging technologies for the retina, are scanning laser ophthalmoscopy
(Scanning laser ophthalmoscope - SLO) [7] and Optical Coherence Tomography (OCT) [8] and
fundus imaging technique [9] which is the commonly used to capture retinal images by fundus
camera. Retinal fundus imaging provides a noninvasive tool currently used in ophthalmology.
3
Thus, some CAD systems based on retinal analysis were developed, extracting the anatomic
structures in retinal images, such as vessel segmentation [10], detecting lesions related to DR [11],
diagnosing glaucoma [12, 13], AMD [14] and cataract [15].
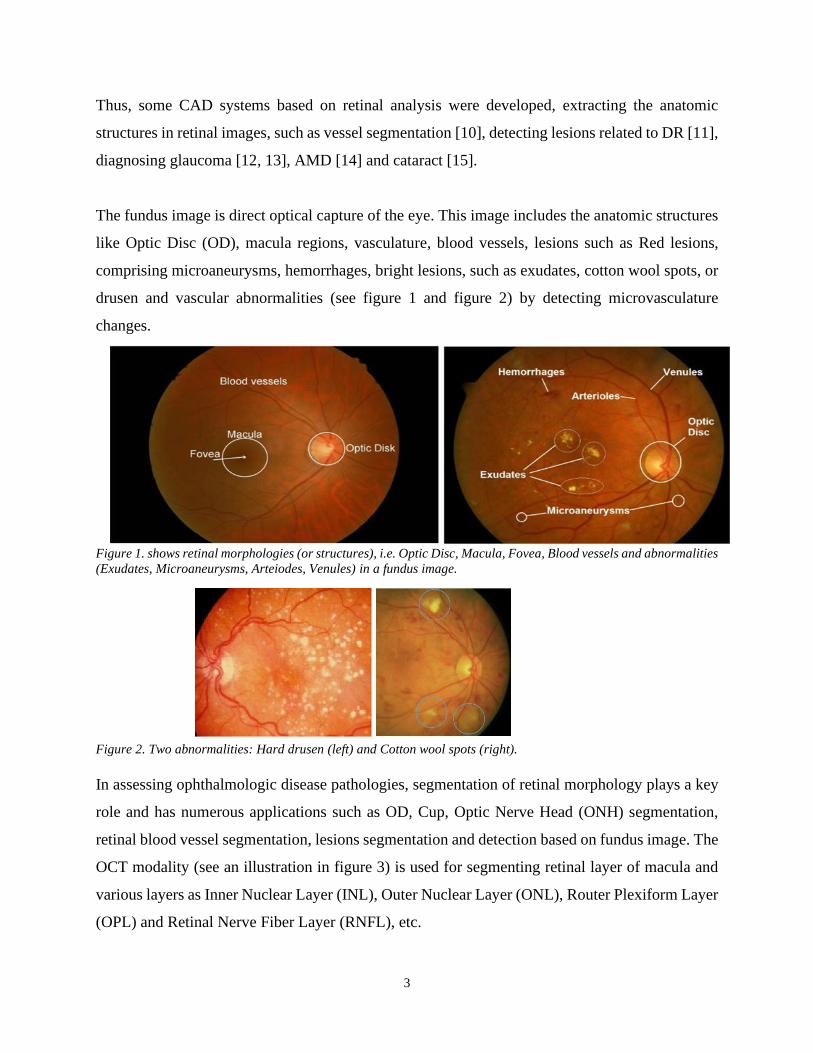
The fundus image is direct optical capture of the eye. This image includes the anatomic structures
like Optic Disc (OD), macula regions, vasculature, blood vessels, lesions such as Red lesions,
comprising microaneurysms, hemorrhages, bright lesions, such as exudates, cotton wool spots, or
drusen and vascular abnormalities (see figure 1 and figure 2) by detecting microvasculature
changes.
Figure 1. shows retinal morphologies (or structures), i.e. Optic Disc, Macula, Fovea, Blood vessels and abnormalities
(Exudates, Microaneurysms, Arteiodes, Venules) in a fundus image.
Figure 2. Two abnormalities: Hard drusen (left) and Cotton wool spots (right).
In assessing ophthalmologic disease pathologies, segmentation of retinal morphology plays a key
role and has numerous applications such as OD, Cup, Optic Nerve Head (ONH) segmentation,
retinal blood vessel segmentation, lesions segmentation and detection based on fundus image. The
OCT modality (see an illustration in figure 3) is used for segmenting retinal layer of macula and
various layers as Inner Nuclear Layer (INL), Outer Nuclear Layer (ONL), Router Plexiform Layer
(OPL) and Retinal Nerve Fiber Layer (RNFL), etc.
4
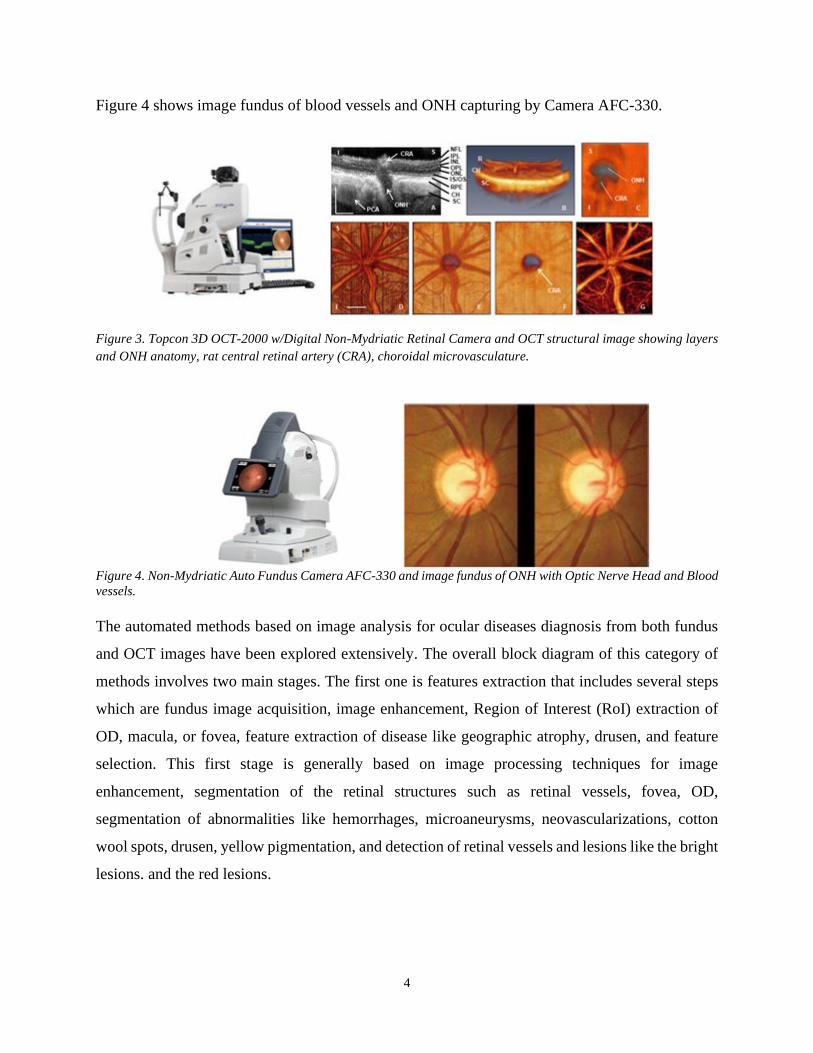
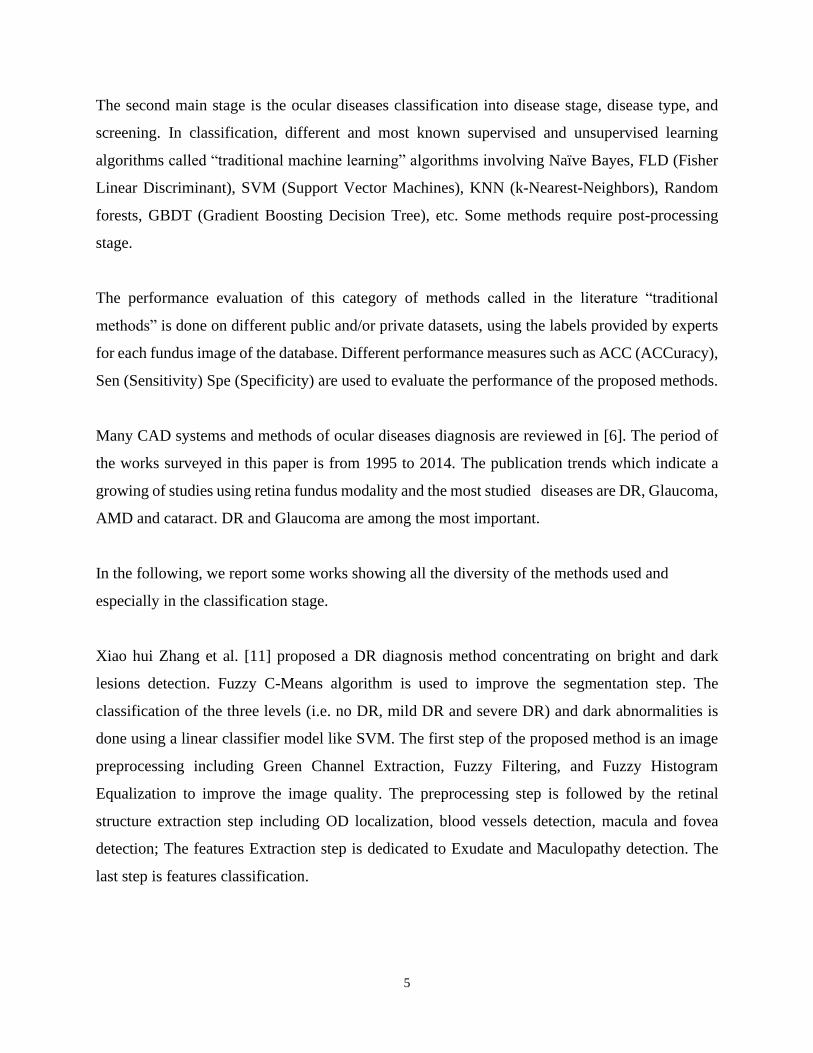
Figure 4 shows image fundus of blood vessels and ONH capturing by Camera AFC-330.
Figure 3. Topcon 3D OCT-2000 w/Digital Non-Mydriatic Retinal Camera and OCT structural image showing layers
and ONH anatomy, rat central retinal artery (CRA), choroidal microvasculature.
Figure 4. Non-Mydriatic Auto Fundus Camera AFC-330 and image fundus of ONH with Optic Nerve Head and Blood
vessels.
The automated methods based on image analysis for ocular diseases diagnosis from both fundus
and OCT images have been explored extensively. The overall block diagram of this category of
methods involves two main stages. The first one is features extraction that includes several steps
which are fundus image acquisition, image enhancement, Region of Interest (RoI) extraction of
OD, macula, or fovea, feature extraction of disease like geographic atrophy, drusen, and feature
selection. This first stage is generally based on image processing techniques for image
enhancement, segmentation of the retinal structures such as retinal vessels, fovea, OD,
segmentation of abnormalities like hemorrhages, microaneurysms, neovascularizations, cotton
wool spots, drusen, yellow pigmentation, and detection of retinal vessels and lesions like the bright
lesions. and the red lesions.
5
The second main stage is the ocular diseases classification into disease stage, disease type, and
screening. In classification, different and most known supervised and unsupervised learning
algorithms called “traditional machine learning” algorithms involving Naïve Bayes, FLD (Fisher
Linear Discriminant), SVM (Support Vector Machines), KNN (k-Nearest-Neighbors), Random
forests, GBDT (Gradient Boosting Decision Tree), etc. Some methods require post-processing
stage.
The performance evaluation of this category of methods called in the literature “traditional
methods” is done on different public and/or private datasets, using the labels provided by experts
for each fundus image of the database. Different performance measures such as ACC (ACCuracy),
Sen (Sensitivity) Spe (Specificity) are used to evaluate the performance of the proposed methods.
Many CAD systems and methods of ocular diseases diagnosis are reviewed in [6]. The period of
the works surveyed in this paper is from 1995 to 2014. The publication trends which indicate a
growing of studies using retina fundus modality and the most studied diseases are DR, Glaucoma,
AMD and cataract. DR and Glaucoma are among the most important.
In the following, we report some works showing all the diversity of the methods used and
especially in the classification stage.
Xiao hui Zhang et al. [11] proposed a DR diagnosis method concentrating on bright and dark
lesions detection. Fuzzy C-Means algorithm is used to improve the segmentation step. The
classification of the three levels (i.e. no DR, mild DR and severe DR) and dark abnormalities is
done using a linear classifier model like SVM. The first step of the proposed method is an image
preprocessing including Green Channel Extraction, Fuzzy Filtering, and Fuzzy Histogram
Equalization to improve the image quality. The preprocessing step is followed by the retinal
structure extraction step including OD localization, blood vessels detection, macula and fovea
detection; The features Extraction step is dedicated to Exudate and Maculopathy detection. The
last step is features classification.
6
To train and classify the extracted features into their respective classes, the classification stage
involves several machine learning algorithms such as k-NN, polynomial Kernel SVM, RBF Kernel
SVM, Naïve-Bayes. The average results of the accuracy when using the four classifiers k-NN,
Polynomial Kernel, SVM RBF Kernel, SVM Naive Bayes are 0.93, 0.7, 0.93, and 0.75
respectively.
Jôrg Meier et al. [12] described an automated processing and classification for Glaucoma detection
from fundus images. In particular, the effects of the preprocessing on classification results have
been studied. In particular, non-uniform illumination is corrected, blood vessels inpainting is used
and the RoI is normalized before features extraction and classification. The features are computed
by the Principal component analysis (PCA). Then, SVM is used for features classification. The
PCA provides a classification success rate of 81%.
A. Mvoulana et al. [13] proposed a fully automated methodology for glaucoma. Their method
provides an OD detection method, combining a brightness criterion and a template matching
technique, to detect the OD as a RoI and segment the OD and OD. The CDR clinical feature is
computed and then used for binary classification thus obtained two classes (i.e. healthy and
glaucomatous patients). The publicly available DRISHTI-GS1 dataset is used to evaluate the
performance of the proposed method achieving 98% of accuracy on final glaucoma screening and
diagnosis.
Mookiah et al. [14] addressed an automated AMD detection system. The proposed system incudes
fundus image acquisition, preprocessing, Discrete Wavelet Transform (DWT), feature extraction,
feature ranking and selection, and classification. Various feature ranking strategies have been used
like t-test, KLD (Kullback-Lieber Divergence), CBBD (Chernoff Bound and Bhattacharyya
Distance) to identify an optimal feature set. A set of supervised classifiers namely SVM, DT
(Decision Tree), k-NN, Naive Bayes (NB) and Probabilistic Neural Network (PNN) were used to
measure the best performance which uses a minimum number of features. The classification
provides normal and dry AMD.
7
KLD ranking and SVM Classifier provide the best performance with an average accuracy of
93.70%, sensitivity of 91.11% and specificity of 96.30%.
In [15], Liye Guo et al. proposed a framework of cataract classification and grading from image
fundus as an input. Their framework includes fundus image pre-processing, feature extraction, and
automatic cataract classification and grading. The feature extraction method is based on the sketch
method with discrete cosine transform. For classification and grading of cataract disease, a multi-
class discriminant analysis is applied. For training and testing, the proposed framework uses 445
fundus image samples as dataset including fundus image samples with mild, moderate, and severe
cataract grades. This dataset is real-world one. The classification rate in cataract or non-cataract
classes is 90.9%. For cataract grading in nuclear cataract, or cortical cataract or posterior sub-
capsular cataract grade, the classification rate is equal to 77.1%.
These methods under-perform due to variations in image properties and quality such as non-
uniform illumination, small size of the objects in retinal imaging. Also, the technical specifications
and conditions use of the fundus camera, resulting from the use of varying capture devices are the
important causes of deterioration of the performance of these methods. We can note that robustness
and accuracy of the used approaches for RoI detection and segmentation of the retinal structures
(i.e. Optic Disc, Cup, Nerve Head, Blood vessel, drusen, red lesions, microaneurysms,
hemorrhages, exudates, retinal neovascularization) play a major role in terms of performance. DL
and CNN has shown its abilities in different health domains including ophthalmology [16]. DL
and CNN can identify, localize, quantify and analyze the pathological features and diagnose the
retinal diseases. The performance of the approach based upon DL and CNN keeps growing.
8
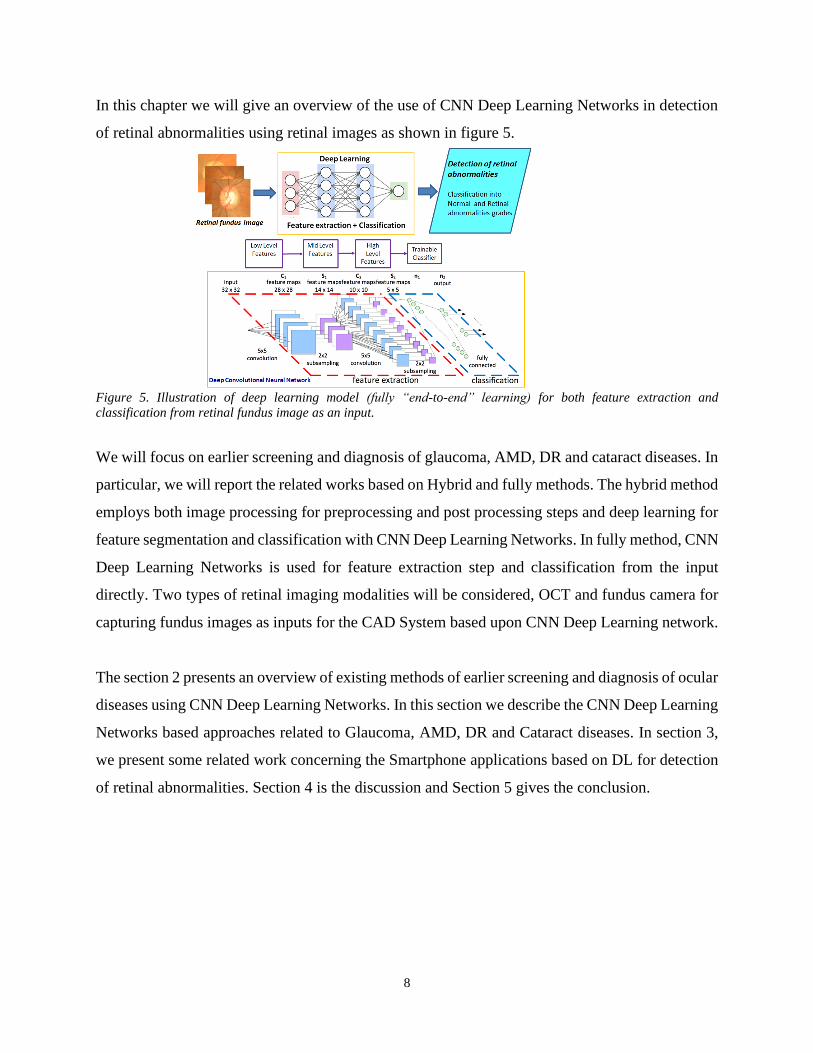
In this chapter we will give an overview of the use of CNN Deep Learning Networks in detection
of retinal abnormalities using retinal images as shown in figure 5.
Figure 5. Illustration of deep learning model (fully “end-to-end” learning) for both feature extraction and
classification from retinal fundus image as an input.
We will focus on earlier screening and diagnosis of glaucoma, AMD, DR and cataract diseases. In
particular, we will report the related works based on Hybrid and fully methods. The hybrid method
employs both image processing for preprocessing and post processing steps and deep learning for
feature segmentation and classification with CNN Deep Learning Networks. In fully method, CNN
Deep Learning Networks is used for feature extraction step and classification from the input
directly. Two types of retinal imaging modalities will be considered, OCT and fundus camera for
capturing fundus images as inputs for the CAD System based upon CNN Deep Learning network.
The section 2 presents an overview of existing methods of earlier screening and diagnosis of ocular
diseases using CNN Deep Learning Networks. In this section we describe the CNN Deep Learning
Networks based approaches related to Glaucoma, AMD, DR and Cataract diseases. In section 3,
we present some related work concerning the Smartphone applications based on DL for detection
of retinal abnormalities. Section 4 is the discussion and Section 5 gives the conclusion.
9
2. Earlier screening and diagnosis of ocular diseases with CNN Deep Learning
Networks
Several ocular pathologies may affect retinal components and features (see section 1), which
causes abnormalities and lesions like exudates or hemorrhages in the retina. In this section, we
consider the most severe ocular diseases and we focus on existing methods of earlier screening
and diagnosis of these diseases. A summary report of the recent work carried out on CNN Deep
Learning Networks methods is provided.
2.1. Glaucoma
2.1.1. Methods and Materials
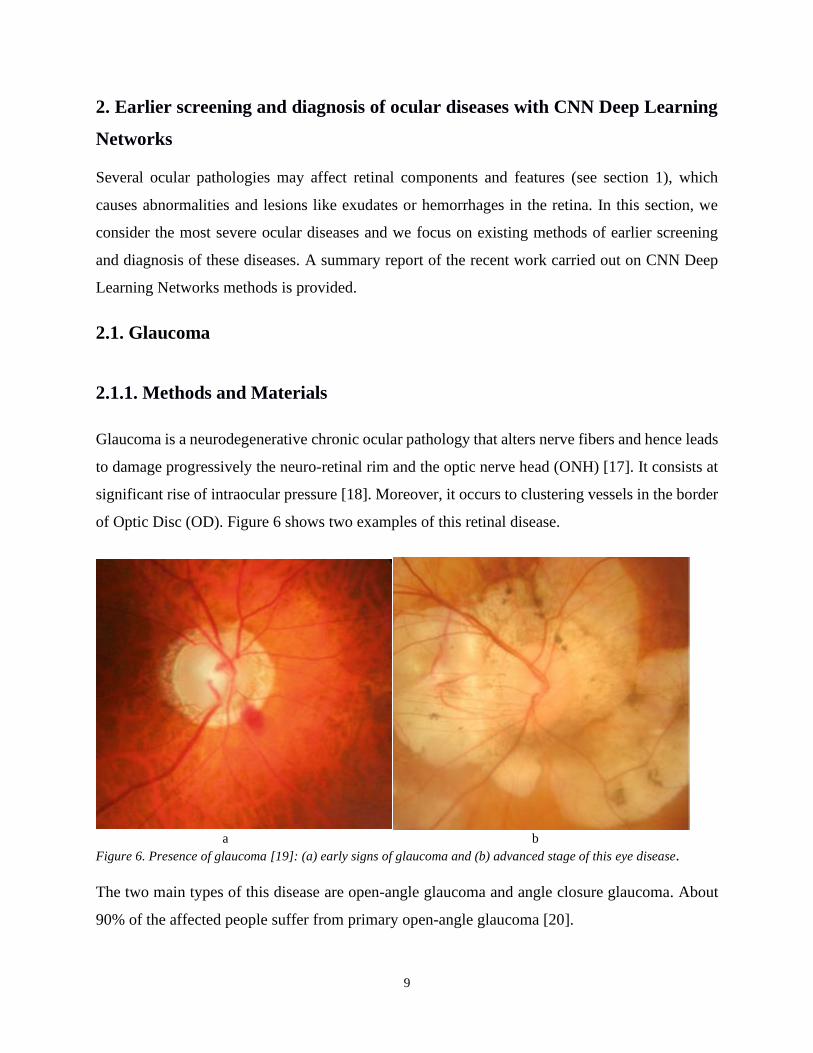
Glaucoma is a neurodegenerative chronic ocular pathology that alters nerve fibers and hence leads
to damage progressively the neuro-retinal rim and the optic nerve head (ONH) [17]. It consists at
significant rise of intraocular pressure [18]. Moreover, it occurs to clustering vessels in the border
of Optic Disc (OD). Figure 6 shows two examples of this retinal disease.
a b
Figure 6. Presence of glaucoma [19]: (a) early signs of glaucoma and (b) advanced stage of this eye disease.
The two main types of this disease are open-angle glaucoma and angle closure glaucoma. About
90% of the affected people suffer from primary open-angle glaucoma [20].
10
Current open-angle glaucoma detection has been established in a community-based healthcare
system, and it is heavily dependent on accessibility to qualified ophthalmologists, optometrists, or
general practitioners for clinical examination as well as dedicated ophthalmic testing equipment,
including tonometer’s, automated perimetry, and disc photography or OCT. The early stage of
glaucoma does not generate symptoms or changes to the visual field [18]. However, this
neuropathy is highlighted by a progressive lack of vision sensitivity, potentially, if not treated,
leading to blindness at term [21].
Indeed, the glaucoma disease leads to shift blood vessels in the optic disc region. Moreover,
bifurcations and their angles are adjusted with respect to the excavation. In addition, grouping
vessels leads to superimpose them where may be modeled as unique vessel in the fundus image.
Glaucoma is known as affecting a significant part of the population worldwide, with more than 64
million cases globally reported in 2013, and estimations reaching 80 million and 111.8 million
cases respectively by 2020 and 2040 [17, 22, 23]. Given the irreversible nature of glaucomatous
optic nerve degeneration combined with increased longevity of the population, early diagnosis is
important to prevent severe visual morbidity and the associated healthcare and society burdens
[24].
Traditionally glaucoma is diagnosed by measuring the IOP with a tonometer, and rating an
abnormal high-pressure rate, which is not always a reliable and sufficient criterion for glaucoma
assessment [25, 26]. Otherwise, glaucoma can be diagnosed within the assessment of the ONH.
The ONH is the region in the retina where blood vessels converge, it is composed of a bright
circular region called the optic disc (OD), and inside the OD, a brighter region called the optic cup
(OC) is apparent.
11
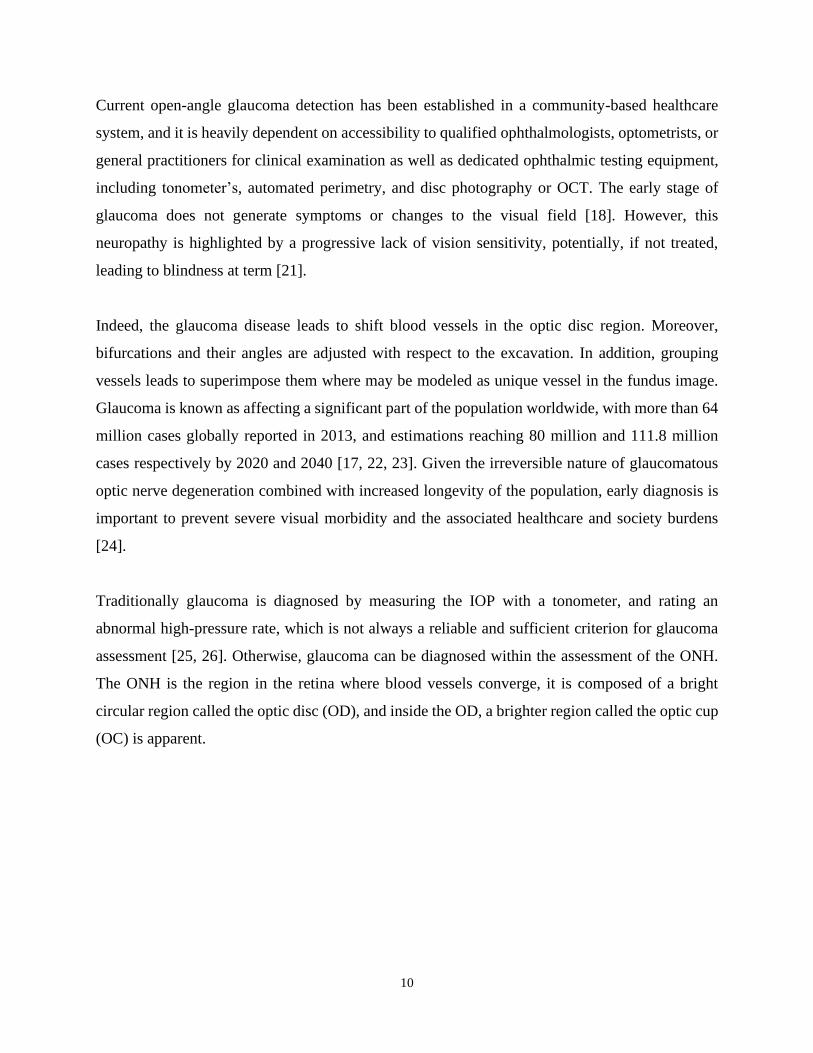
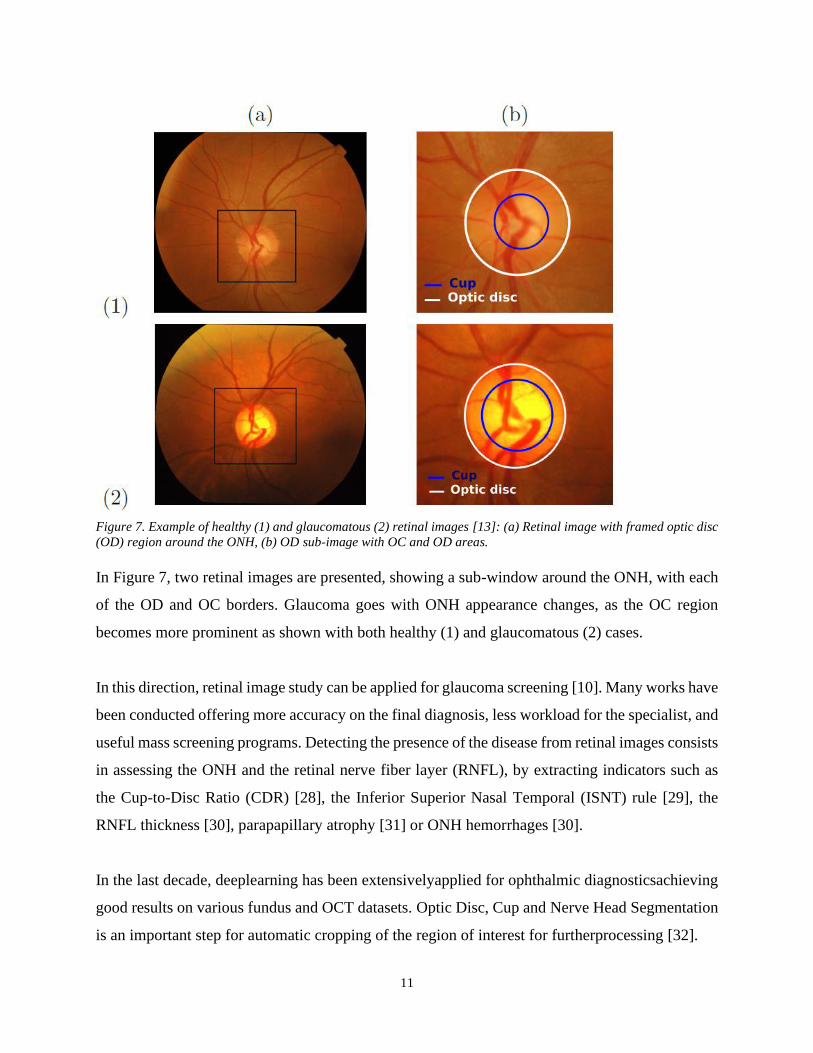
Figure 7. Example of healthy (1) and glaucomatous (2) retinal images [13]: (a) Retinal image with framed optic disc
(OD) region around the ONH, (b) OD sub-image with OC and OD areas.
In Figure 7, two retinal images are presented, showing a sub-window around the ONH, with each
of the OD and OC borders. Glaucoma goes with ONH appearance changes, as the OC region
becomes more prominent as shown with both healthy (1) and glaucomatous (2) cases.
In this direction, retinal image study can be applied for glaucoma screening [10]. Many works have
been conducted offering more accuracy on the final diagnosis, less workload for the specialist, and
useful mass screening programs. Detecting the presence of the disease from retinal images consists
in assessing the ONH and the retinal nerve fiber layer (RNFL), by extracting indicators such as
the Cup-to-Disc Ratio (CDR) [28], the Inferior Superior Nasal Temporal (ISNT) rule [29], the
RNFL thickness [30], parapapillary atrophy [31] or ONH hemorrhages [30].
In the last decade, deeplearning has been extensivelyapplied for ophthalmic diagnosticsachieving
good results on various fundus and OCT datasets. Optic Disc, Cup and Nerve Head Segmentation
is an important step for automatic cropping of the region of interest for furtherprocessing [32].
12
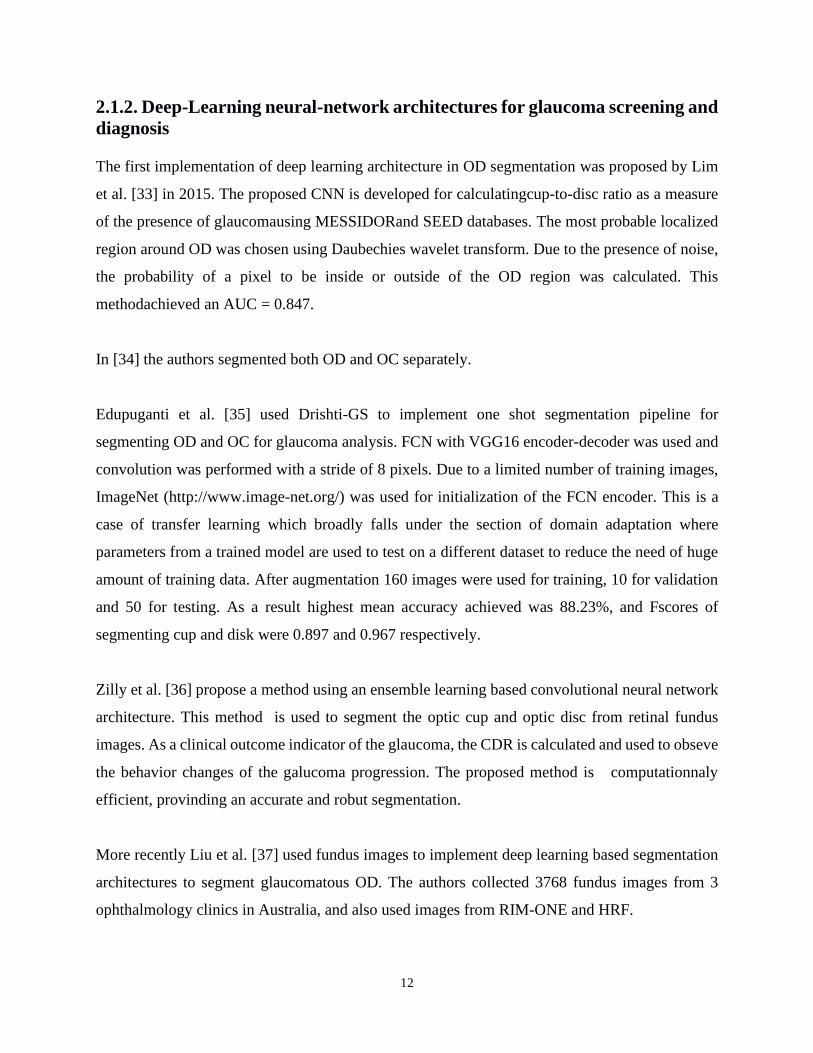
2.1.2. Deep-Learning neural-network architectures for glaucoma screening and
diagnosis
The first implementation of deep learning architecture in OD segmentation was proposed by Lim
et al. [33] in 2015. The proposed CNN is developed for calculatingcup-to-disc ratio as a measure
of the presence of glaucomausing MESSIDORand SEED databases. The most probable localized
region around OD was chosen using Daubechies wavelet transform. Due to the presence of noise,
the probability of a pixel to be inside or outside of the OD region was calculated. This
methodachieved an AUC = 0.847.
In [34] the authors segmented both OD and OC separately.
Edupuganti et al. [35] used Drishti-GS to implement one shot segmentation pipeline for
segmenting OD and OC for glaucoma analysis. FCN with VGG16 encoder-decoder was used and
convolution was performed with a stride of 8 pixels. Due to a limited number of training images,
ImageNet (http://www.image-net.org/) was used for initialization of the FCN encoder. This is a
case of transfer learning which broadly falls under the section of domain adaptation where
parameters from a trained model are used to test on a different dataset to reduce the need of huge
amount of training data. After augmentation 160 images were used for training, 10 for validation
and 50 for testing. As a result highest mean accuracy achieved was 88.23%, and Fscores of
segmenting cup and disk were 0.897 and 0.967 respectively.
Zilly et al. [36] propose a method using an ensemble learning based convolutional neural network
architecture. This method is used to segment the optic cup and optic disc from retinal fundus
images. As a clinical outcome indicator of the glaucoma, the CDR is calculated and used to obseve
the behavior changes of the galucoma progression. The proposed method is computationnaly
efficient, provinding an accurate and robut segmentation.
More recently Liu et al. [37] used fundus images to implement deep learning based segmentation
architectures to segment glaucomatous OD. The authors collected 3768 fundus images from 3
ophthalmology clinics in Australia, and also used images from RIM-ONE and HRF.
13
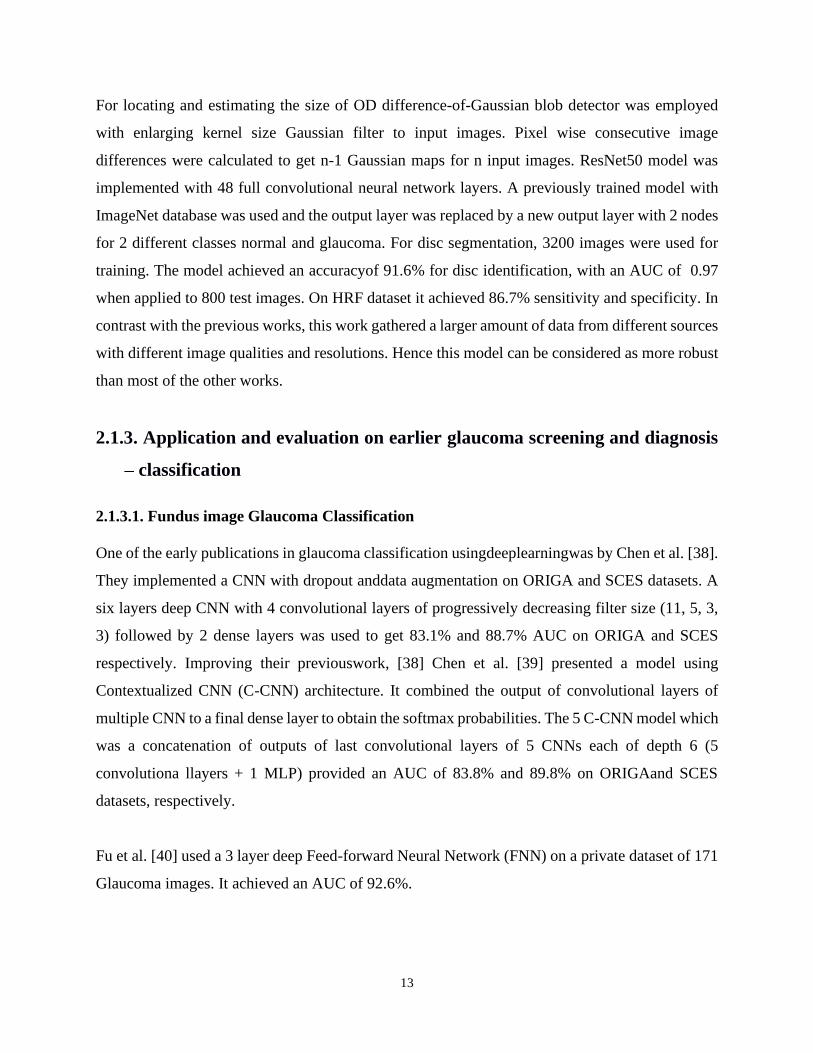
For locating and estimating the size of OD difference-of-Gaussian blob detector was employed
with enlarging kernel size Gaussian filter to input images. Pixel wise consecutive image
differences were calculated to get n-1 Gaussian maps for n input images. ResNet50 model was
implemented with 48 full convolutional neural network layers. A previously trained model with
ImageNet database was used and the output layer was replaced by a new output layer with 2 nodes
for 2 different classes normal and glaucoma. For disc segmentation, 3200 images were used for
training. The model achieved an accuracyof 91.6% for disc identification, with an AUC of 0.97
when applied to 800 test images. On HRF dataset it achieved 86.7% sensitivity and specificity. In
contrast with the previous works, this work gathered a larger amount of data from different sources
with different image qualities and resolutions. Hence this model can be considered as more robust
than most of the other works.
2.1.3. Application and evaluation on earlier glaucoma screening and diagnosis
– classification
2.1.3.1. Fundus image Glaucoma Classification
One of the early publications in glaucoma classification usingdeeplearningwas by Chen et al. [38].
They implemented a CNN with dropout anddata augmentation on ORIGA and SCES datasets. A
six layers deep CNN with 4 convolutional layers of progressively decreasing filter size (11, 5, 3,
3) followed by 2 dense layers was used to get 83.1% and 88.7% AUC on ORIGA and SCES
respectively. Improving their previouswork, [38] Chen et al. [39] presented a model using
Contextualized CNN (C-CNN) architecture. It combined the output of convolutional layers of
multiple CNN to a final dense layer to obtain the softmax probabilities. The 5 C-CNN model which
was a concatenation of outputs of last convolutional layers of 5 CNNs each of depth 6 (5
convolutiona llayers + 1 MLP) provided an AUC of 83.8% and 89.8% on ORIGAand SCES
datasets, respectively.
Fu et al. [40] used a 3 layer deep Feed-forward Neural Network (FNN) on a private dataset of 171
Glaucoma images. It achieved an AUC of 92.6%.
14
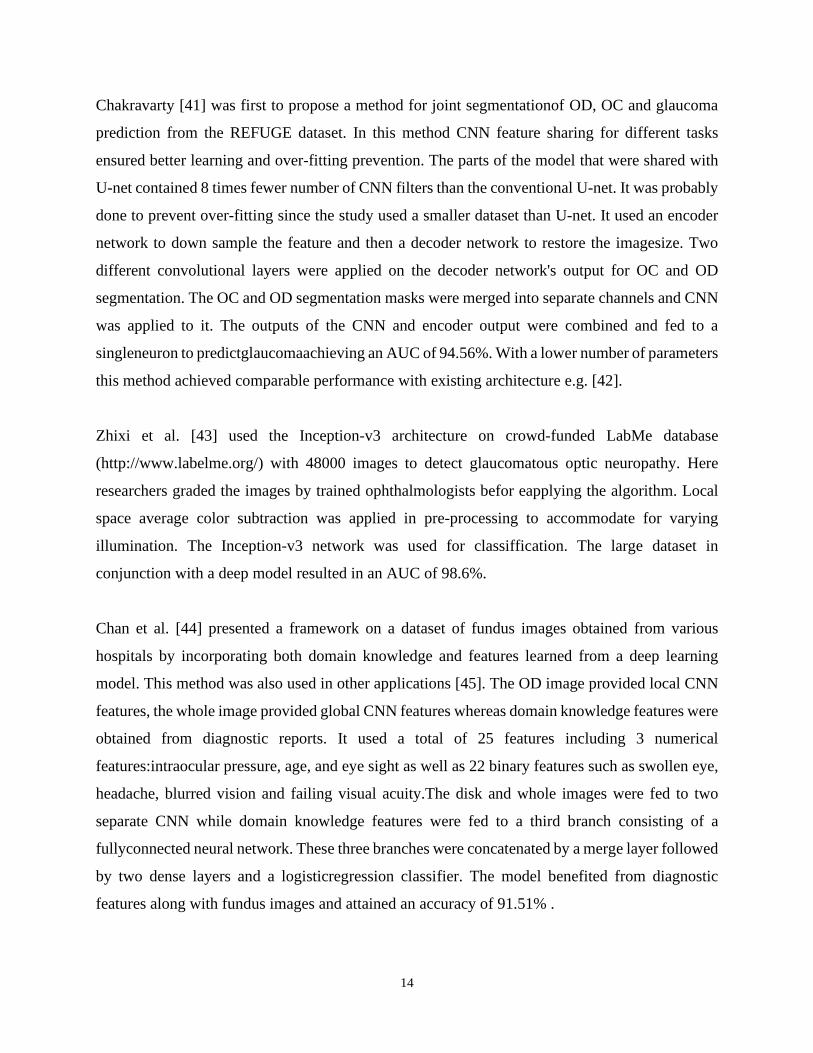
Chakravarty [41] was first to propose a method for joint segmentationof OD, OC and glaucoma
prediction from the REFUGE dataset. In this method CNN feature sharing for different tasks
ensured better learning and over-fitting prevention. The parts of the model that were shared with
U-net contained 8 times fewer number of CNN filters than the conventional U-net. It was probably
done to prevent over-fitting since the study used a smaller dataset than U-net. It used an encoder
network to down sample the feature and then a decoder network to restore the imagesize. Two
different convolutional layers were applied on the decoder network's output for OC and OD
segmentation. The OC and OD segmentation masks were merged into separate channels and CNN
was applied to it. The outputs of the CNN and encoder output were combined and fed to a
singleneuron to predictglaucomaachieving an AUC of 94.56%. With a lower number of parameters
this method achieved comparable performance with existing architecture e.g. [42].
Zhixi et al. [43] used the Inception-v3 architecture on crowd-funded LabMe database
(http://www.labelme.org/) with 48000 images to detect glaucomatous optic neuropathy. Here
researchers graded the images by trained ophthalmologists befor eapplying the algorithm. Local
space average color subtraction was applied in pre-processing to accommodate for varying
illumination. The Inception-v3 network was used for classiffication. The large dataset in
conjunction with a deep model resulted in an AUC of 98.6%.
Chan et al. [44] presented a framework on a dataset of fundus images obtained from various
hospitals by incorporating both domain knowledge and features learned from a deep learning
model. This method was also used in other applications [45]. The OD image provided local CNN
features, the whole image provided global CNN features whereas domain knowledge features were
obtained from diagnostic reports. It used a total of 25 features including 3 numerical
features:intraocular pressure, age, and eye sight as well as 22 binary features such as swollen eye,
headache, blurred vision and failing visual acuity.The disk and whole images were fed to two
separate CNN while domain knowledge features were fed to a third branch consisting of a
fullyconnected neural network. These three branches were concatenated by a merge layer followed
by two dense layers and a logisticregression classifier. The model benefited from diagnostic
features along with fundus images and attained an accuracy of 91.51% .
15
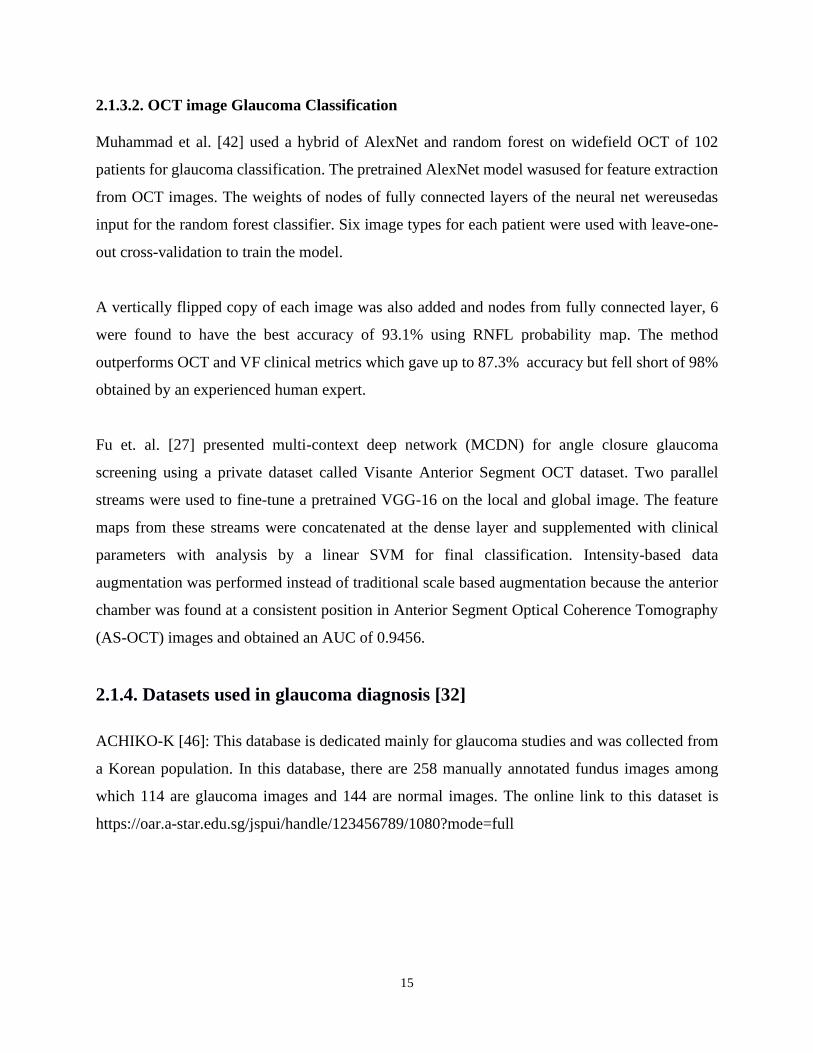
2.1.3.2. OCT image Glaucoma Classification
Muhammad et al. [42] used a hybrid of AlexNet and random forest on widefield OCT of 102
patients for glaucoma classification. The pretrained AlexNet model wasused for feature extraction
from OCT images. The weights of nodes of fully connected layers of the neural net wereusedas
input for the random forest classifier. Six image types for each patient were used with leave-one-
out cross-validation to train the model.
A vertically flipped copy of each image was also added and nodes from fully connected layer, 6
were found to have the best accuracy of 93.1% using RNFL probability map. The method
outperforms OCT and VF clinical metrics which gave up to 87.3% accuracy but fell short of 98%
obtained by an experienced human expert.
Fu et. al. [27] presented multi-context deep network (MCDN) for angle closure glaucoma
screening using a private dataset called Visante Anterior Segment OCT dataset. Two parallel
streams were used to fine-tune a pretrained VGG-16 on the local and global image. The feature
maps from these streams were concatenated at the dense layer and supplemented with clinical
parameters with analysis by a linear SVM for final classification. Intensity-based data
augmentation was performed instead of traditional scale based augmentation because the anterior
chamber was found at a consistent position in Anterior Segment Optical Coherence Tomography
(AS-OCT) images and obtained an AUC of 0.9456.
2.1.4. Datasets used in glaucoma diagnosis [32]
ACHIKO-K [46]: This database is dedicated mainly for glaucoma studies and was collected from
a Korean population. In this database, there are 258 manually annotated fundus images among
which 114 are glaucoma images and 144 are normal images. The online link to this dataset is
https://oar.a-star.edu.sg/jspui/handle/123456789/1080?mode=full
16
DRIONS-DB [47]: This database consists of 110 color fundus images. Miguel Servet Hospital,
Zaragossa Spain developed this dataset for optic nerve head segmentation. Among all the patients
23.1% had chronic glaucoma and 76.9% of them had eye hypertension. This dataset can be found
at http://www.ia.uned.es/~ejcarmona/DRIONS-DB.html
HRF [48]: This public database contains 15 images of healthy patients, 15 images of patients with
DR and 15 images of glaucomatous patients captured with Canon CR-1 fundus camera with a 45
FOV. Expert segmentations are provided for each image. This can be found publicly at
https://www5.cs.fau.de/research/data/fundus-images/
SEED [49]: This database originated from a study performed by the Singapore Epidemiology of
Eye Diseases. This dataset has 235 fundus images among which 43 are glaucoma images, 192 are
normal images. This is not available online for public use. Singapore Chinese Eye Study (SCES)
and Singapore Indian Eye Study (SINDI) databasesalso came out fromthissamestudy.
ORIGA [50]: ORIGA stands for Online Retinal Image dataset for Glaucoma Analysis, and
itconsists of 650 retinal fundus images. The Singapore Eye Research Institute conducted the
project and data werecollectedfrom the Singapore Malay Eye Study or SiMES over a three year
period of 2004-2007. This dataset is not currently available online
RIGA [51]: RIGA is a public dataset and stands for Retinal Images for Glaucoma Analysis. This
dataset mainly consists of retinal fundus images of glaucoma patients. The RIGA dataset was
developed by concatenating images from MESSIDOR, and images obtained from Magrabi Eye
Centre, Riyadh and Bin Rashid Ophthalmic Centre, Riyadh. There are a total of 760 retinal fundus
images in the database.
This can be found at https://deepblua.lib.umich.edu/data/concern/generic_works/3b591905z
REFUGE [52]: This datasetis part of the retinal fundus glaucoma challenge organized by Medical
Image Computing and Computer Assisted Intervention 2018 meeting held in Spain. This dataset
has 1200 annotated fundus Images. Recently this competition also included images for AMD. This
can befound at https://refuge.grand-challenge.org/
17
2.2. Age-Related Macular Degeneration
2.2.1. Methods and Materials
AMD is an eye disease that primarily affects the elderly. It is considered as an irreversible chronic
pathology [53] and the leading cause of vision loss in people over 50 in developed countries [54].
The AMD is frequently diagnosed using a fundus image which aims to detect degenerative lesions
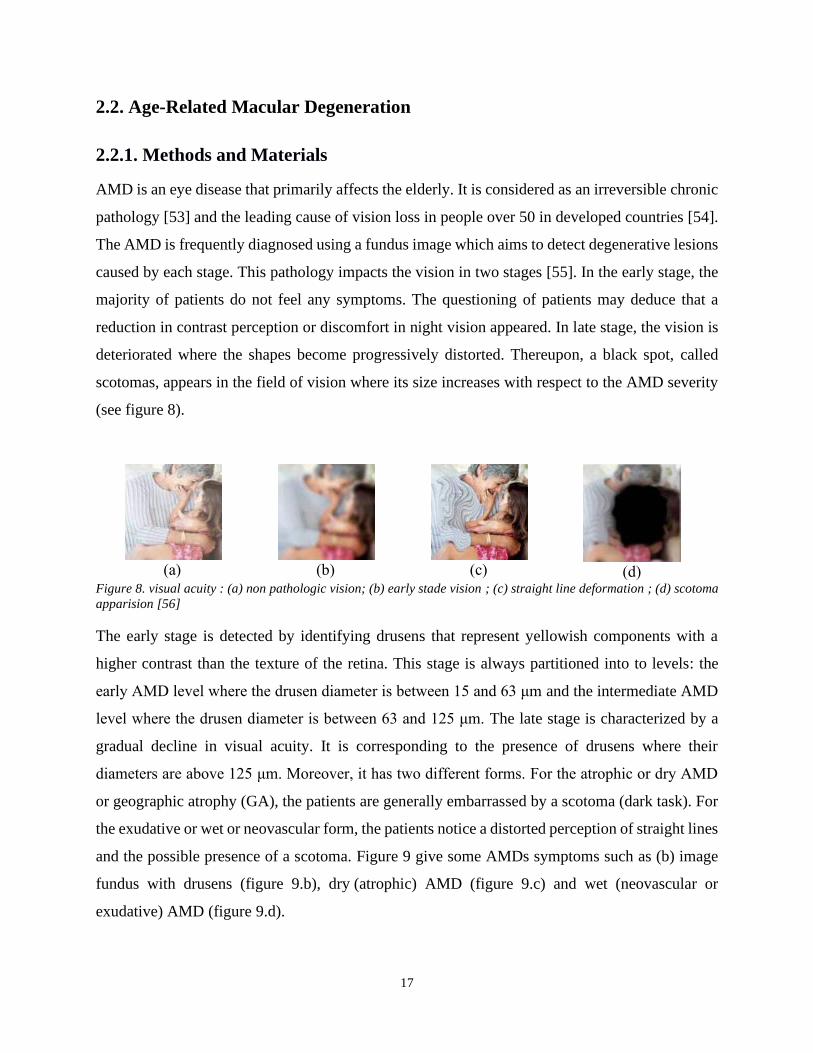
caused by each stage. This pathology impacts the vision in two stages [55]. In the early stage, the
majority of patients do not feel any symptoms. The questioning of patients may deduce that a
reduction in contrast perception or discomfort in night vision appeared. In late stage, the vision is
deteriorated where the shapes become progressively distorted. Thereupon, a black spot, called
scotomas, appears in the field of vision where its size increases with respect to the AMD severity
(see figure 8).
(a)
(b)
(c)
(d)
Figure 8. visual acuity : (a) non pathologic vision; (b) early stade vision ; (c) straight line deformation ; (d) scotoma
apparision [56]
The early stage is detected by identifying drusens that represent yellowish components with a
higher contrast than the texture of the retina. This stage is always partitioned into to levels: the
early AMD level where the drusen diameter is between 15 and 63 μm and the intermediate AMD
level where the drusen diameter is between 63 and 125 μm. The late stage is characterized by a
gradual decline in visual acuity. It is corresponding to the presence of drusens where their
diameters are above 125 μm. Moreover, it has two different forms. For the atrophic or dry AMD
or geographic atrophy (GA), the patients are generally embarrassed by a scotoma (dark task). For
the exudative or wet or neovascular form, the patients notice a distorted perception of straight lines
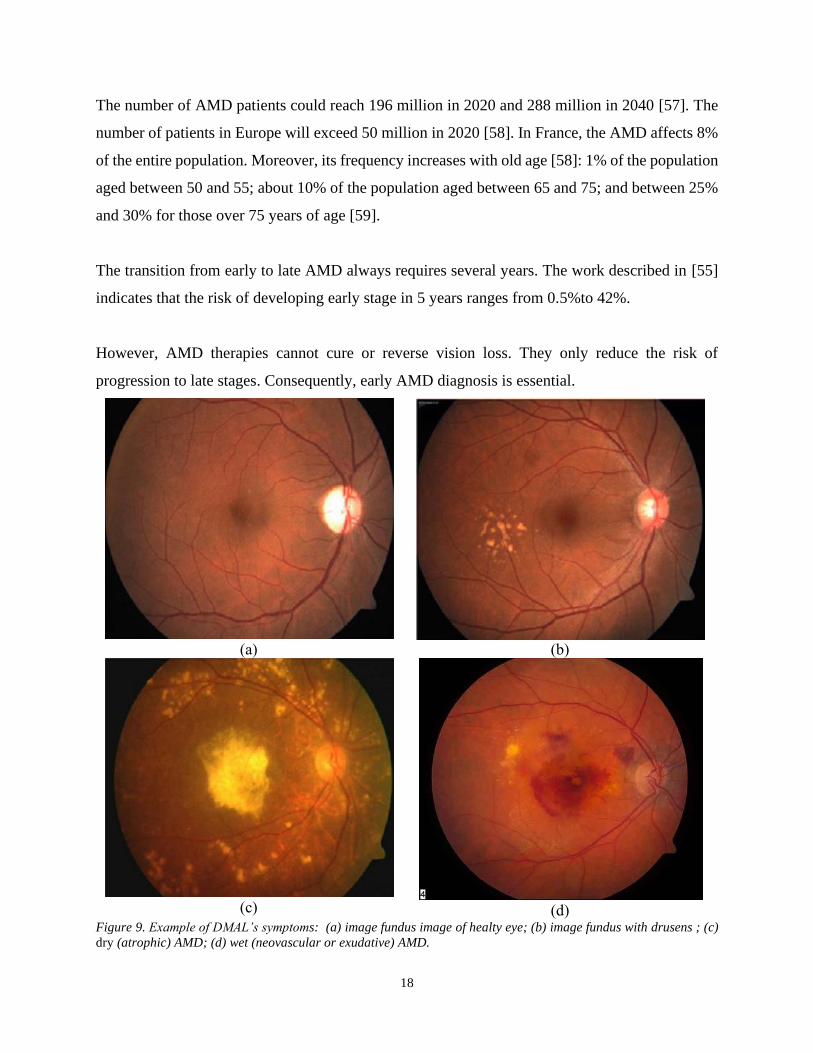
and the possible presence of a scotoma. Figure 9 give some AMDs symptoms such as (b) image
fundus with drusens (figure 9.b), dry (atrophic) AMD (figure 9.c) and wet (neovascular or
exudative) AMD (figure 9.d).
18
The number of AMD patients could reach 196 million in 2020 and 288 million in 2040 [57]. The
number of patients in Europe will exceed 50 million in 2020 [58]. In France, the AMD affects 8%
of the entire population. Moreover, its frequency increases with old age [58]: 1% of the population
aged between 50 and 55; about 10% of the population aged between 65 and 75; and between 25%
and 30% for those over 75 years of age [59].
The transition from early to late AMD always requires several years. The work described in [55]
indicates that the risk of developing early stage in 5 years ranges from 0.5%to 42%.
However, AMD therapies cannot cure or reverse vision loss. They only reduce the risk of
progression to late stages. Consequently, early AMD diagnosis is essential.
(a)
(b)
(c)
(d)
Figure 9. Example of DMAL’s symptoms: (a) image fundus image of healty eye; (b) image fundus with drusens ; (c)
dry (atrophic) AMD; (d) wet (neovascular or exudative) AMD.
19
The World Health Organization reports that 8 million people have a severe blindness due to the
AMD. The number of patients is expected to increase to 1.5 times over the next ten years [54, 57,
58]. In France, nearly 1 million people over 50-year-old suffer from vision problems caused by
AMD, with an increase of 3000 new cases of blindness each year [56]. In the international context,
following the study carried out in [58], prevalence statistics of AMD in France are similar to those
of industrialized countries such as the other European countries or the United States.
The treatment of early stage involves using Omega 3-based dietary supplements. For the late form,
only wet AMD can be treated. The therapy is based on intravitreal injections which represents a
considerable charge for medical management systems. Automatic approaches for diagnosing
AMD using fundus image have been proposed in several research work. These approaches consist
of locating the macula and then analyzing its texture [60, 61, 62]. There are two categories of work
according to the result of the diagnosis. The first is to determine the stage of AMD [63, 64]. The
second category consists of segmenting the drusens caused by AMD [65, 66].
Several studies have been provided similar performances compared to those of ophthalmologists.
We deduce that some works are based on deep learning which are distinguished by their higher
performances compared to previous methods.
2.2.2. Deep-Learning-based methods for AMD detection and grading
The work described in [67] proposes a 2-class classification method to diagnose AMD at an early
stagebased on fourteen-layer deep Convolutional Neural Network (CNN). The network is
composed by seven convolution layers, four max-pooling layers, and three fully-connected layers.
The training was performed using the softmax activation function, the backpropagation « Adam »
algorithm, and run during 60 epochs. The input image was resized to 180 × 180 and then
augmented four times by respectivelly flipped to the left, flipped downwards, flipped to the left
then downwards.
The evaluation is performed using a private dataset composed by 1110 fundus images which are
split into 402 healthy, 583 with ealry, intermediate and dry AMD and 125 with wet AMD.The
method validation is performed using two strategies.
20
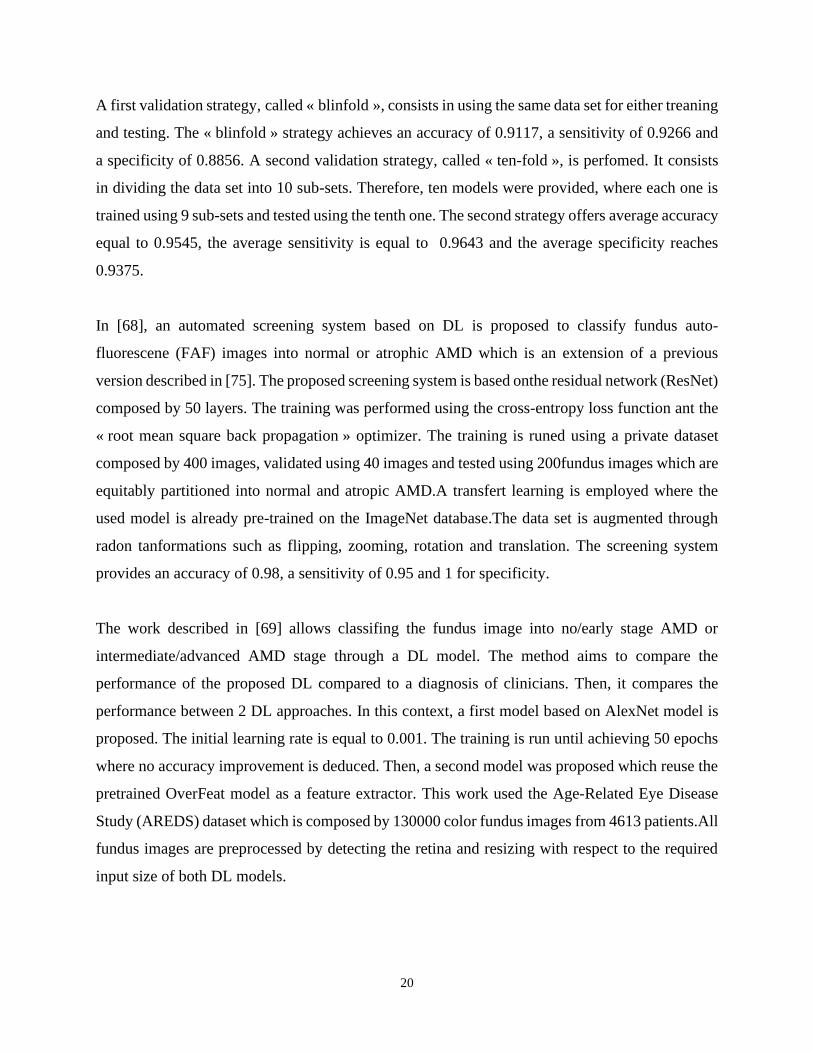
A first validation strategy, called « blinfold », consists in using the same data set for either treaning
and testing. The « blinfold » strategy achieves an accuracy of 0.9117, a sensitivity of 0.9266 and
a specificity of 0.8856. A second validation strategy, called « ten-fold », is perfomed. It consists
in dividing the data set into 10 sub-sets. Therefore, ten models were provided, where each one is
trained using 9 sub-sets and tested using the tenth one. The second strategy offers average accuracy
equal to 0.9545, the average sensitivity is equal to 0.9643 and the average specificity reaches
0.9375.
In [68], an automated screening system based on DL is proposed to classify fundus auto-
fluorescene (FAF) images into normal or atrophic AMD which is an extension of a previous
version described in [75]. The proposed screening system is based onthe residual network (ResNet)
composed by 50 layers. The training was performed using the cross-entropy loss function ant the
« root mean square back propagation » optimizer. The training is runed using a private dataset
composed by 400 images, validated using 40 images and tested using 200fundus images which are
equitably partitioned into normal and atropic AMD.A transfert learning is employed where the
used model is already pre-trained on the ImageNet database.The data set is augmented through
radon tanformations such as flipping, zooming, rotation and translation. The screening system
provides an accuracy of 0.98, a sensitivity of 0.95 and 1 for specificity.
The work described in [69] allows classifing the fundus image into no/early stage AMD or
intermediate/advanced AMD stage through a DL model. The method aims to compare the
performance of the proposed DL compared to a diagnosis of clinicians. Then, it compares the
performance between 2 DL approaches. In this context, a first model based on AlexNet model is
proposed. The initial learning rate is equal to 0.001. The training is run until achieving 50 epochs
where no accuracy improvement is deduced. Then, a second model was proposed which reuse the
pretrained OverFeat model as a feature extractor. This work used the Age-Related Eye Disease
Study (AREDS) dataset which is composed by 130000 color fundus images from 4613 patients.All
fundus images are preprocessed by detecting the retina and resizing with respect to the required
input size of both DL models.
21
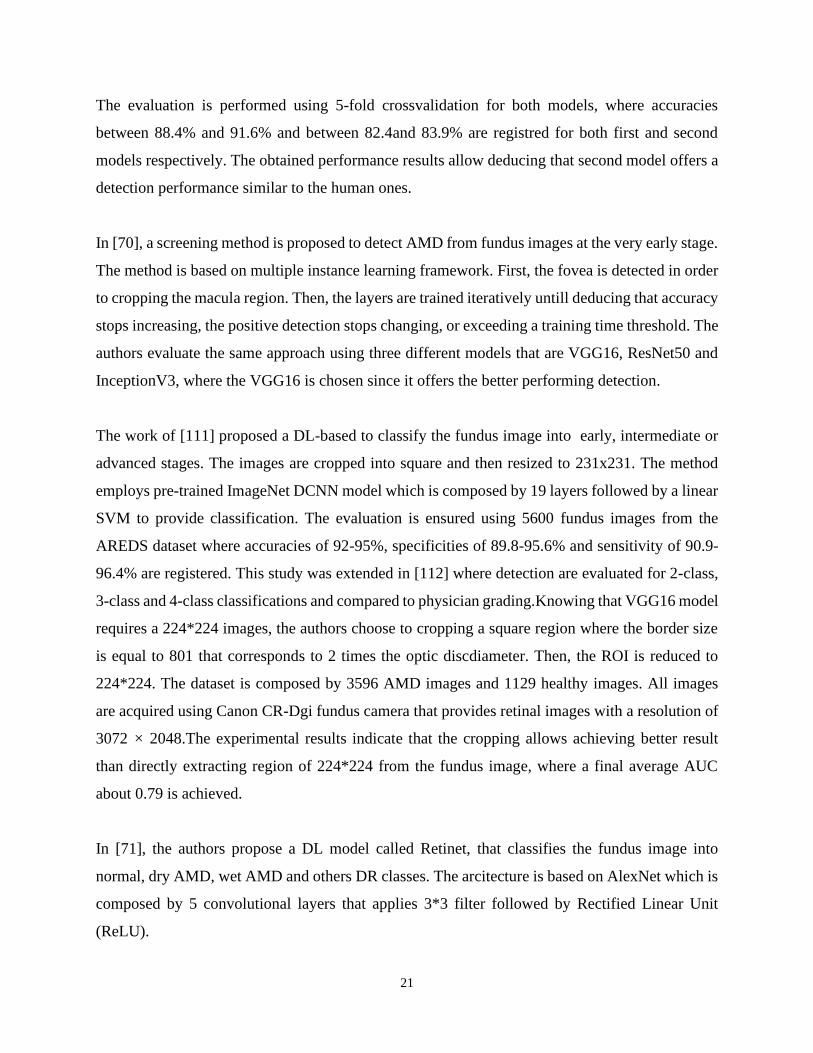
The evaluation is performed using 5-fold crossvalidation for both models, where accuracies
between 88.4% and 91.6% and between 82.4and 83.9% are registred for both first and second
models respectively. The obtained performance results allow deducing that second model offers a
detection performance similar to the human ones.
In [70], a screening method is proposed to detect AMD from fundus images at the very early stage.
The method is based on multiple instance learning framework. First, the fovea is detected in order
to cropping the macula region. Then, the layers are trained iteratively untill deducing that accuracy
stops increasing, the positive detection stops changing, or exceeding a training time threshold. The
authors evaluate the same approach using three different models that are VGG16, ResNet50 and
InceptionV3, where the VGG16 is chosen since it offers the better performing detection.
The work of [111] proposed a DL-based to classify the fundus image into early, intermediate or
advanced stages. The images are cropped into square and then resized to 231x231. The method
employs pre-trained ImageNet DCNN model which is composed by 19 layers followed by a linear
SVM to provide classification. The evaluation is ensured using 5600 fundus images from the
AREDS dataset where accuracies of 92-95%, specificities of 89.8-95.6% and sensitivity of 90.9-
96.4% are registered. This study was extended in [112] where detection are evaluated for 2-class,
3-class and 4-class classifications and compared to physician grading.Knowing that VGG16 model
requires a 224*224 images, the authors choose to cropping a square region where the border size
is equal to 801 that corresponds to 2 times the optic discdiameter. Then, the ROI is reduced to
224*224. The dataset is composed by 3596 AMD images and 1129 healthy images. All images
are acquired using Canon CR-Dgi fundus camera that provides retinal images with a resolution of
3072 × 2048.The experimental results indicate that the cropping allows achieving better result
than directly extracting region of 224*224 from the fundus image, where a final average AUC
about 0.79 is achieved.
In [71], the authors propose a DL model called Retinet, that classifies the fundus image into
normal, dry AMD, wet AMD and others DR classes. The arcitecture is based on AlexNet which is
composed by 5 convolutional layers that applies 3*3 filter followed by Rectified Linear Unit
(ReLU).
22
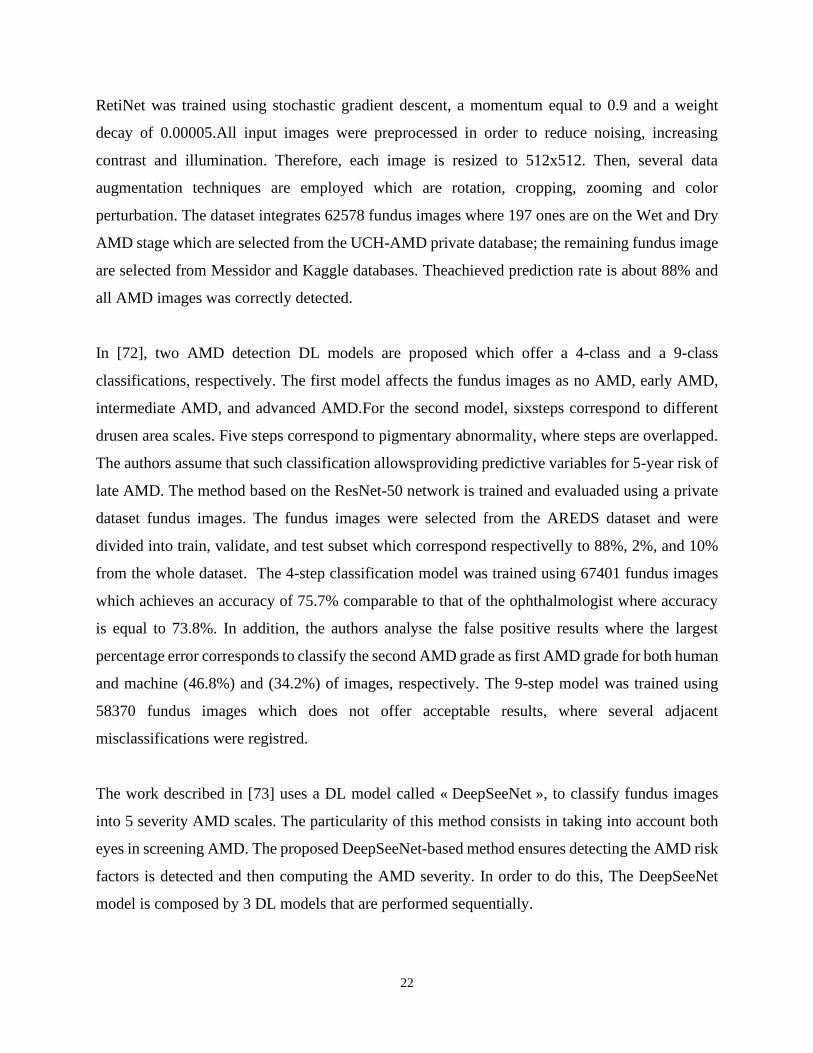
RetiNet was trained using stochastic gradient descent, a momentum equal to 0.9 and a weight
decay of 0.00005.All input images were preprocessed in order to reduce noising, increasing
contrast and illumination. Therefore, each image is resized to 512x512. Then, several data
augmentation techniques are employed which are rotation, cropping, zooming and color
perturbation. The dataset integrates 62578 fundus images where 197 ones are on the Wet and Dry
AMD stage which are selected from the UCH-AMD private database; the remaining fundus image
are selected from Messidor and Kaggle databases. Theachieved prediction rate is about 88% and
all AMD images was correctly detected.
In [72], two AMD detection DL models are proposed which offer a 4-class and a 9-class
classifications, respectively. The first model affects the fundus images as no AMD, early AMD,
intermediate AMD, and advanced AMD.For the second model, sixsteps correspond to different
drusen area scales. Five steps correspond to pigmentary abnormality, where steps are overlapped.
The authors assume that such classification allowsproviding predictive variables for 5-year risk of
late AMD. The method based on the ResNet-50 network is trained and evaluaded using a private
dataset fundus images. The fundus images were selected from the AREDS dataset and were
divided into train, validate, and test subset which correspond respectivelly to 88%, 2%, and 10%
from the whole dataset. The 4-step classification model was trained using 67401 fundus images
which achieves an accuracy of 75.7% comparable to that of the ophthalmologist where accuracy
is equal to 73.8%. In addition, the authors analyse the false positive results where the largest
percentage error corresponds to classify the second AMD grade as first AMD grade for both human
and machine (46.8%) and (34.2%) of images, respectively. The 9-step model was trained using
58370 fundus images which does not offer acceptable results, where several adjacent
misclassifications were registred.
The work described in [73] uses a DL model called « DeepSeeNet », to classify fundus images
into 5 severity AMD scales. The particularity of this method consists in taking into account both
eyes in screening AMD. The proposed DeepSeeNet-based method ensures detecting the AMD risk
factors is detected and then computing the AMD severity. In order to do this, The DeepSeeNet
model is composed by 3 DL models that are performed sequentially.
23
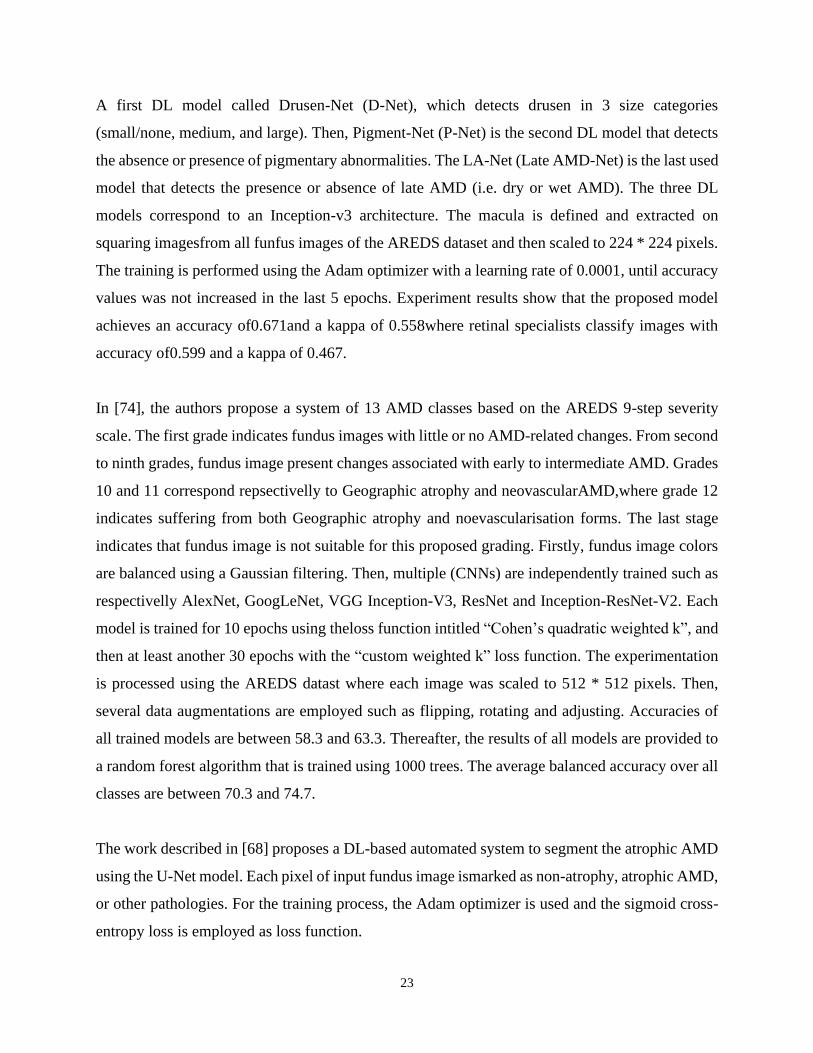
A first DL model called Drusen-Net (D-Net), which detects drusen in 3 size categories
(small/none, medium, and large). Then, Pigment-Net (P-Net) is the second DL model that detects
the absence or presence of pigmentary abnormalities. The LA-Net (Late AMD-Net) is the last used
model that detects the presence or absence of late AMD (i.e. dry or wet AMD). The three DL
models correspond to an Inception-v3 architecture. The macula is defined and extracted on
squaring imagesfrom all funfus images of the AREDS dataset and then scaled to 224 * 224 pixels.
The training is performed using the Adam optimizer with a learning rate of 0.0001, until accuracy
values was not increased in the last 5 epochs. Experiment results show that the proposed model
achieves an accuracy of0.671and a kappa of 0.558where retinal specialists classify images with
accuracy of0.599 and a kappa of 0.467.
In [74], the authors propose a system of 13 AMD classes based on the AREDS 9-step severity
scale. The first grade indicates fundus images with little or no AMD-related changes. From second
to ninth grades, fundus image present changes associated with early to intermediate AMD. Grades
10 and 11 correspond repsectivelly to Geographic atrophy and neovascularAMD,where grade 12
indicates suffering from both Geographic atrophy and noevascularisation forms. The last stage
indicates that fundus image is not suitable for this proposed grading. Firstly, fundus image colors
are balanced using a Gaussian filtering. Then, multiple (CNNs) are independently trained such as
respectivelly AlexNet, GoogLeNet, VGG Inception-V3, ResNet and Inception-ResNet-V2. Each
model is trained for 10 epochs using theloss function intitled “Cohen’s quadratic weighted k”, and
then at least another 30 epochs with the “custom weighted k” loss function. The experimentation
is processed using the AREDS datast where each image was scaled to 512 * 512 pixels. Then,
several data augmentations are employed such as flipping, rotating and adjusting. Accuracies of
all trained models are between 58.3 and 63.3. Thereafter, the results of all models are provided to
a random forest algorithm that is trained using 1000 trees. The average balanced accuracy over all
classes are between 70.3 and 74.7.
The work described in [68] proposes a DL-based automated system to segment the atrophic AMD
using the U-Net model. Each pixel of input fundus image ismarked as non-atrophy, atrophic AMD,
or other pathologies. For the training process, the Adam optimizer is used and the sigmoid cross-
entropy loss is employed as loss function.
24
The evaluation consists at computing the DICE similarity coefficient (DSC) and the OR between
AUTomatic (AUT) and MaNuaL (MNL) segmentation where equation are indicated as follows in
equations 1 and 2.
DSC( AUT, MNL ) = 2(AUT Ո MNL ) / (AUT + MNL) (1)
OR (AUT , MNL) = (AUT Ո MNL) / (AUT U MNL) (2)
Where the provided DSC is equal to 0.94 ± 0.04, the OR is equal to 0.89 ± 0.06and the area
difference ratio is 0.07 ± 0.31.
2.3. Diabetic Retinopathy
2.3.1. Methods and Materials
DR is one of the leading diseases of visual impairments which is one of the complications of
diabetes [1]. DR is a microvascular complication of diabetes, providing morphological changes
and abnormalities in the fundus. These changes concern mainly the microaneurysms (MAs),
exudates (EXs, Hard and Soft Exudates), blood vessels such as the abnormal growth of the blood
vessels, hemorrhages (HMs), macula interretinal micro vascular abnormalities (IRMA). The
appearance of MAs and hard exudates are the earlier signs of DR. DR is a 5-point scale. The scale
one is no apparent retinopathy, mild nonproliferative DR (NPDR) is the second one, and moderate
NPDR, severe NPDR, and proliferative DR (PDR) are third, fourth and fifth scale respectively.
PDR occurs when the new abnormal vascular blood vessels appear in different regions of fundus.
Thus, in terms of classification we have five-stage disease severity for DR. Three stages involve
the low risk. The fourth stage corresponds to a severe nonproliferative retinopathy. The fifth one
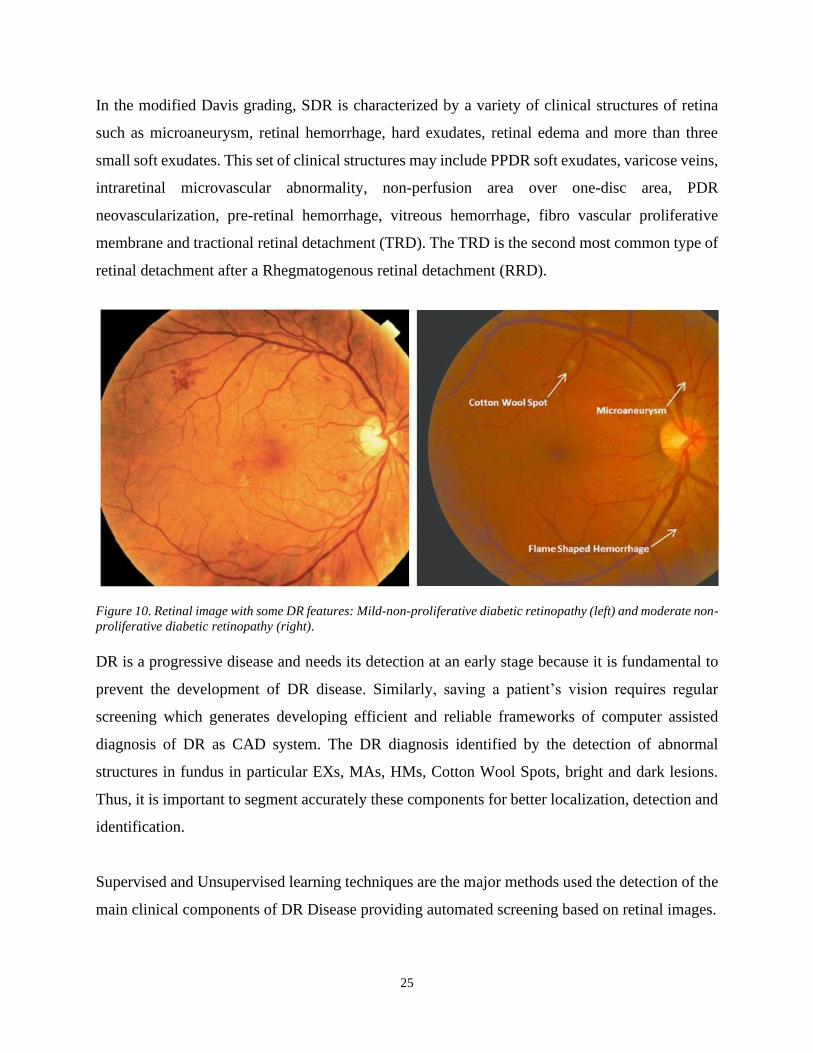
defines a proliferative retinopathy stage. Figure 10 shows retinal image with some DR features
like NPDR stage (figure 10 left) and moderate NPDR stage (figure 10 right).
Modified Davis grading [76] including Simple, Pre-Proliferate DR and PDR is also used in some
works for DR classification.
25
In the modified Davis grading, SDR is characterized by a variety of clinical structures of retina
such as microaneurysm, retinal hemorrhage, hard exudates, retinal edema and more than three
small soft exudates. This set of clinical structures may include PPDR soft exudates, varicose veins,
intraretinal microvascular abnormality, non-perfusion area over one-disc area, PDR
neovascularization, pre-retinal hemorrhage, vitreous hemorrhage, fibro vascular proliferative
membrane and tractional retinal detachment (TRD). The TRD is the second most common type of
retinal detachment after a Rhegmatogenous retinal detachment (RRD).
Figure 10. Retinal image with some DR features: Mild-non-proliferative diabetic retinopathy (left) and moderate non-
proliferative diabetic retinopathy (right).
DR is a progressive disease and needs its detection at an early stage because it is fundamental to
prevent the development of DR disease. Similarly, saving a patient’s vision requires regular
screening which generates developing efficient and reliable frameworks of computer assisted
diagnosis of DR as CAD system. The DR diagnosis identified by the detection of abnormal
structures in fundus in particular EXs, MAs, HMs, Cotton Wool Spots, bright and dark lesions.
Thus, it is important to segment accurately these components for better localization, detection and
identification.
Supervised and Unsupervised learning techniques are the major methods used the detection of the
main clinical components of DR Disease providing automated screening based on retinal images.
26
These techniques of feature extraction for clustering and classification require a following
preprocessing stage involving different steps such as contrast adjustment, average filtering,
adaptive histogram equalization, median filtering, etc.
Recently, there are some works for DR diagnosis at image level based on DL. The comparative
study of performances between DL methods and previous traditional methods shows that DL
approaches achieve significantly better performance.
2.3.2. Deep-Learning based methods for DR detection and grading
Harry Pratt et al. [77] described a method based upon a network with CNN architecture and data
augmentation. The proposed method can identify the main features of DR disease like micro-
aneurysms, exudates and hemorrhages. The classification provides 5 grades such as No DR, Mild
DR, Moderate DR, Severe DR and Proliferative DR. Data augmentation was used throughout
training to improve its localisation ability. The CNN was initialized with Gaussian initialization
reducing the initial training time. The proposed uses a cross-entropy function as loss function. The
final trained CNN network trained on Kaggle dataset achieved 75%, 95% and 30% for accuracy,
specificity and sensitivity respectively.
In [78] the proposed deep learning method aims localization of the discriminative and visual
interpretable feature of DR. This method is achieved by adding the regression activation map
(RAM) of an input image. The RAM concept is inspired by [79]. Two CNN networks were
proposed, Net-5 and Net-4 that have different units of convolutional (Conv) and pooling
(MaxPool) layers and each layer has different filters, strides and size. A global averaging pooling
(GAP) layer is used to connect the last convolutional layer and the output layer. As data
augmentation, image transformations are used like flipping, rotation, translation, stretching, and
color augmentation. For initialization and pre-training, the orthogonal initialisation is used to
initialize weights and biases. For both Net-4 and Net-5 stetting and without feature blending, the
achieved Kappa scores is around 0.70 for 256 pixel images, 0.80 for 512 pixel images and 0.81 for
768 pixel images from the Kaggle dataset.
27
In [80] a modified fully randomly initialized GoogLeNet deep learning neural network is proposed.
The modified GoogLeNet deep convolutional neural network was trained with 9443, 45° posterior
pole color fundus photographs using manual modified Davis grading. The PABAK to modified
Davis grading was 0.64 and accuracy is equal to 81%. The PABAK to real prognosis grading was
0.37 and accuracy is equal to 96%). One of the benefits of the proposed method is that currently
useless single-field fundus photographs. This method can be used for disease staging of DR
retinopathy and screening of fundus photographs.
In [81] a DCNN approach is proposes explored for the automatic classification of DR disease from
color fundus image. Data augmentation is applied to artificially enlarge the used datasets including
some transformation like rotation from 0° to 360°, randomly shearing with angle between -15° and
15), flipping, rescaling with scale factor between 1/1.6 and 1.6) and translation with shift between
-10 and 10 pixels. The used CNN architecture consists of multiple layers like convolution layers
(two 3x3 convolution, 32 filter, two 3x3 convolution 64 filter, two 3x3 convolution 128 filter and
two 3x3 convolution 256 filter). Each two convolution layers are followed by a 2x2 max-pooling
layer. To train the CNN, a dataset including 800 labeled images is used and 200 images are used
to evaluate the performance of the trained CNN. The classification step uses the CNN and GBM
(i.e. Gradient Boosting trees-based Machine). The experimental results indicate the following
classification accuracies like 89.4% for Hard exudates, 88.7% for Red lesions, 86.2% for
microaneurysmes and 79.1% for Blood vessel detection.
In [82] a new method for the explanation of DL classification models is proposed. This method is
based on the distribution of scores. These scores are extracted from the last layer among the input
pixels of the analyzed image. The EyePACS dataset is used (https://www.kaggle.com/c/diabetic-
retinopathy-detection). The DR interpretable classifier is designed by applying the proposed
model. The obtained results reach more than 90% of sensitivity and specificity thus providing the
detection of more severe cases of Diabetic Retinopathy. The proposed model aims to classify DR
disease into the five severity levels. This method gives for every class, other characteristics such
as the score importance pixel maps, allowing ophthalmologists the possibility of both diagnosis
deduction and interpreting the results of the classification.
28
The proposed model requires a reduced number of model parameters enables involving the also
use of this model in low resources devices, like Smartphones.
In [83] an automated DR identification and grading system (DeepDR) detects the presence and
severity of DR from fundus images via transfer learning and ensemble learning. A preprocessing
step is applied to remove the invalid areas of black space, to downsize all images to a uniform size
in accordance with the input requirements of specific models and to improve local contrast and
enhance edge definition in each image region. For this purpose, histogram equalization (HE) and
adaptive HE are used. The proposed CNN architecture includes a feature extractor and classifier.
Feature extractor is based on a pre-training model that was initialized via transfer learning. The
classifier made predictions on the extracted features. For a feature extractor part ResNet50 and
InceptionV3, and DenseNets are used aiming to reduce gradient disappearance. The classifier is
designed as customized standard deep neural network (SDNN). The first layer of the SDNN is a
Goal Average Poling (GAP) laye. The second one is a fully connected layer and contains 2048
hidden neurons. To achieve the nonlinearity in the SDNN, ReLU layers are applied to the output
of all inner fully connected layers, except the output layer. Kappa, Precision, Sensivity, receiver
operating characteristic curve with AUC, F1-score and Youden’s index (Youden’s index =
Sensitivity + Specificity - 1) are used as metrics to evaluate the performance of the evaluation of
the proposed DL based CNN Network. Kappa > 0.8 indicates excellent consistency. The proposed
identification model performed with a sensitivity of 97.5%, a specificity of 97.7% and an accuracy
of 97.7%. The grading model achieved sensitivity of 98.1%, a specificity of 98.9% and an accuracy
of 96.5%.
In [84] a hybrid method for diagnosing DR is proposed including both image processing and DL
approach. Image processing algorithms such as histogram equalization and the contrast limited
adaptive histogram equalization were applied to enhance the image quality. The DR diagnosis is
performed by the classification based on DL and CNN. The MESSIDOR dataset is used and the
obtained performance measures are 97% for accuracy, 94% for sensitivity, 98% for specificity
98%, 94% for precision, 94% for FScore and 95% for Geometric Mean.
29
In [85] DL method is presented and the image set collected and graded. The DL method was trained
using the Inception version 4 model architecture and a large dataset of more than 1.6 million retinal
fundus images, then tuned on a set of 2000 images that had adjudicated labels agreed on by 3 retina
specialists as a reference standard. A comparison of the DR disease distribution determined by the
retina specialist panel (reference standard) and the algorithm’s grading shows approximately 23%
of the images showed mild or worse NPDR according to the reference standard. Overall, the model
showed a 5-class accuracy of 88.4%, with an accuracy of 96.9% for images with no DR and 57.9%
for images with mild or worse NPDR.
In [86] the proposed framework based upon CNN network using VGGnet model have been trained
with back propagation NN, Deep Neural Network (DNN) and Convolutional Neural Network
(CNN). This framework seeks to identify the key antecedents of DR and is able to quantify the
main features including, in addition fluid drip into different classes. This framework includes the
following steps: Extracted the statistical features such average, median, standard deviation,
skewness, root mean square error, mean absolute deviation quartiles, minimum, maximum and
threshold level (step 1). Step 2 as preprocessing one includes resizing, median filter, morphological
processing, edge detection for feature extraction and binary image conversion. To tackle some
feature loss during the resizing or filtering, a Fuzzy C-Means function is applied. A statistical data
processing with Feed Forward Neural Network as step 3 and image classification with FNN
(Forward Neural Network and DNN (Deep Neural Network models, performing CNN based on
VGG16 model as step 4 and step 5 respectively. The last step (step 6) provides a comparison result
taking from step 3, step 4 and step 6 as performance and accuracy with testing image set. The
accuracy percentages of proposed DNN model for both training and testing are 89.6, 86.3.
In [87] a Multi-Cell Multi-Task Convolutional Neural Networks (MCNN) is proposed. This
architecture is based on a Multi-Task learning strategy which predicts the label with both
classification and regression. The MCNN architecture consists of Inception-Resnet-v2 module,
Multi-Cell architecture module and Multi-Task Learning module. The Kaggle dataset is used to
evaluate the proposed architecture. The Experimental results achieve a quadratic weighted Kappa
of 0.841.
30
In [88] the proposed network model is based on Transfer learning on pretrained GoogLeNet and
AlexNet models from ImageNet. It achieved a sensitivity of 95%. The AlexNet and GoogLeNet
architectures are trained and tested as 2-ary, 3-ary and 4-ary classification models. The Transfer
learning on pretrained GoogLeNet and AlexNet models from ImageNet improved peak test set
accuracies to 74.5%, 68.8%, and 57.2% on 2-ary, 3-ary, and 4-ary classification models
respectively. The proposed network uses convolutional layer L2 regularization to reduce model
overfitting. The cross-entropy function is used to compute error loss. The Xavier method (see for
example: https://www.deeplearning.ai/ai-notes/initialization/) provides the weights initialization.
AlexNet, VGG16 and GoogLeNet models were trained on the binary-labeled as normal or mild vs
moderate to end stage. Kaggle dataset is used to evaluate the performance of the proposed CNNs.
The GoogLeNet model is more efficient and achieved a sensitivity of 95% and specificity of 96%.
The sensitivity of the no DR and severe DR classes were 98% and 93% respectively. However,
the sensitivity for the mild class was only 7%. The 3-ary classifier gives sensitivities for no DR
and severe DR of 85% and 75% respectively and 29% for mild class sensitivity.
In [89] a DR interpretable image classification model was described. This model is used for grading
the level of the DR. The EyePACS dataset is used to get a training set which is composed of 35,126
images and the test set 53,576. The QWK metric [25] was close to the reported by human experts.
The test set uses a unique DL model without ensembling. A Receptive field (RF is widespread
model of sensory neurons describing the best-fitting linear transformation from the stimulus to the
neural response) score distribution model is proposed. RF distributes the output score into the
previous layers. The proposed CNN has 391,325 parameters, dispatched in 17 layers. The feature
extractor is the first of layers and the classifier is the second group. The feature extraction has 7
blocks of 2 layers. Every layer is a stack of a 3 × 3 convolution with stride 1 ×1 and padding 1 ×
1. Every layer is followed by batch normalization and a ReLU activation function. A 2 × 2 max-
pooling operation of stride 2 ×2 is applied between every block. After the 7 blocks of feature
extraction, the RF of the network has grown till reaching 637 ×637, corresponding approximately
to the input size. The classification phase uses a 2 ×2 convolution. To get a final 64 feature, a 4 ×4
average-pooling is used to reduce the dimensionality vector. These features are linearly combined
and the output scores of every class are obtained.
31
A SoftMax function allows the conversion of scores to probabilities. The feature extractor has 16
filters in the first block. The second block has 32 filters. The other blocks include 64 filters. The
model is trained for 300 epochs. The QWK value are reached 0.814 on the validation set and 0.801
on the testing set. The testing set contains 10.000 images. A linear classifier is used to combine
the features of both eyes. Using the Messidor-2 dataset, the obtained prediction performance is
91.1% and 90.8% for sensitivity and specificity respectively. The used model has 391. 325 model
parameters and 17 for model depth. A proposed DR interpretable classifier, achieved more than
90% of sensitivity and specificity and allow it to detect more severe cases of DR disease.
2.3. 3. Dataset used DR diagnosis
The publicly available datasets used are Kaggle dataset, DRIVE dataset, STARE dataset,
EyePACS dataset and MESSIDOR dataset.
In [83] macula-centred retinal fundus images were taken from the Sichuan Academy of Medical
Sciences and Sichuan Provincial Peoples Hospital. The original data comprising 13.767 images of
1872 patients were collected from three sources: ophthalmology, endocrinology and physical
examination centres view were captured per eye.
In [86] the data sets we have used are FUNDUS images of human retina having pixels over
2000×3000. The dataset downloaded from website kaggle.com, dataset having over 35000 images
for training and 15000 images for testing.
In [87] the dataset used is Kaggle. The retinal images were provided by EyePACS, which is a free
platform for retinopathy screening. The dataset consists of 35126 training images, 10906 validate
images and 42670 test images.
In [88] Experimental studies were conducted using two primary datasets. The Kaggle dataset
contains 35,000 retinal images with 5-class labels such as normal, mild, moderate, severe, end
stage.
32
The second used dataset is Messidor-1 dataset that has 1,200 color fundus images with 4-class
labels. In addition, two fundoscope image datasets are used to train an automated classifier for this
study.
2.4 Cataract
2.4.1 Methods and Materials
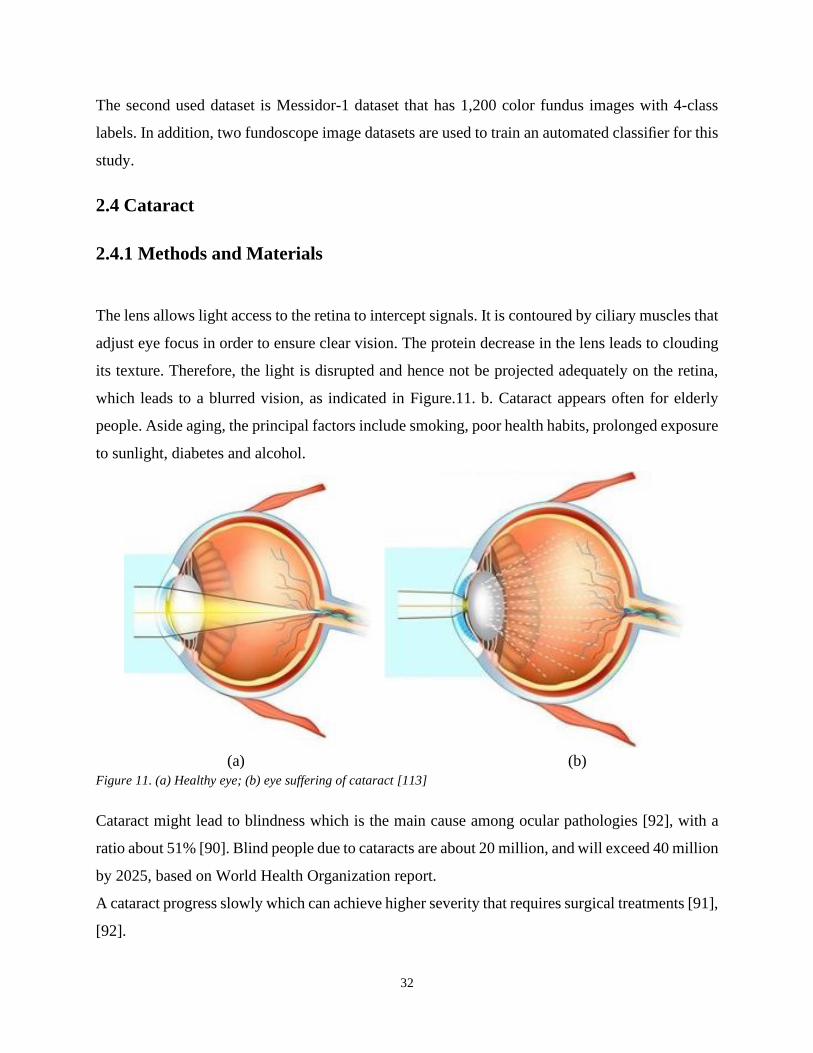
The lens allows light access to the retina to intercept signals. It is contoured by ciliary muscles that
adjust eye focus in order to ensure clear vision. The protein decrease in the lens leads to clouding
its texture. Therefore, the light is disrupted and hence not be projected adequately on the retina,
which leads to a blurred vision, as indicated in Figure.11. b. Cataract appears often for elderly
people. Aside aging, the principal factors include smoking, poor health habits, prolonged exposure
to sunlight, diabetes and alcohol.
(a) (b)
Figure 11. (a) Healthy eye; (b) eye suffering of cataract [113]
Cataract might lead to blindness which is the main cause among ocular pathologies [92], with a
ratio about 51% [90]. Blind people due to cataracts are about 20 million, and will exceed 40 million
by 2025, based on World Health Organization report.
A cataract progress slowly which can achieve higher severity that requires surgical treatments [91],
[92].
33
The cataract is graded to four classes: healthy, Mild, Moderate and Severe. Mild class can be
treated through enhancing health habits, stop smoking and using wearing sunglasses. Therefore,
early detection is higher recommended to assist patients. However, lack of ophthalmologists
avoids ensure periodic diagnosis [91]. The cataract can be detected through four main methods
that are light-focus method, iris image projection, slit lamp examination and transillumination
ophthalmoscopy [92]. Those methods are costly and time-consuming. Therefore, this develops the
necessity to propose a computer-aided diagnosis for cataract detection [90]. In this context, several
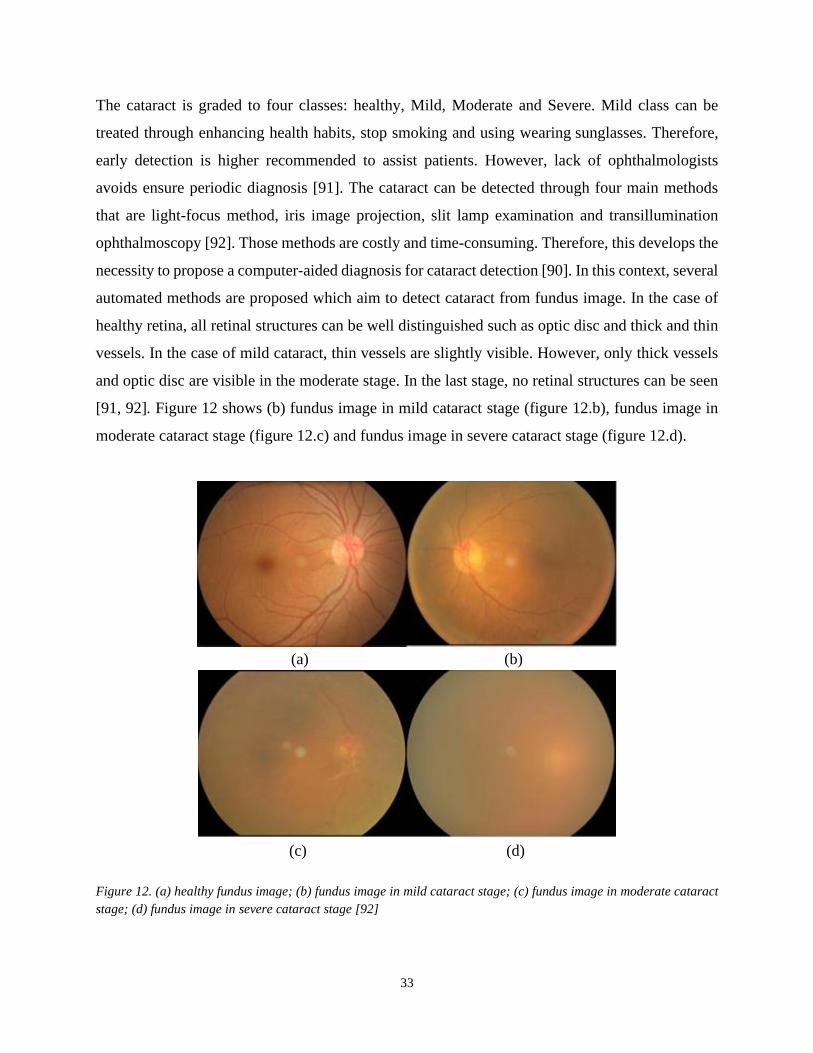
automated methods are proposed which aim to detect cataract from fundus image. In the case of
healthy retina, all retinal structures can be well distinguished such as optic disc and thick and thin
vessels. In the case of mild cataract, thin vessels are slightly visible. However, only thick vessels
and optic disc are visible in the moderate stage. In the last stage, no retinal structures can be seen
[91, 92]. Figure 12 shows (b) fundus image in mild cataract stage (figure 12.b), fundus image in
moderate cataract stage (figure 12.c) and fundus image in severe cataract stage (figure 12.d).
(a) (b)
(c) (d)
Figure 12. (a) healthy fundus image; (b) fundus image in mild cataract stage; (c) fundus image in moderate cataract
stage; (d) fundus image in severe cataract stage [92]
34
2.4.2 Deep-Learning based methods for Cataract detection and grading
The method proposed in [92] offers an automated method for cataract detection and grading using
DCNN. The fundus images are resized uniformly, and the uneven illumination is eliminating, and
the green channels are extracted. Thereafter, the method employed a DCNN with five
convolutional layers; three are fully connected layers and a four-way SoftMax which provide the
fundus image cataract grading. A private dataset is used which is composed by 3269 images
without cataract disease and 2351 healthy ones, which regarded into 4 classes. The proposed
method achieves an accuracy of 93.52% to detect the cataract and an accuracy of 86.69% for
providing the cataract stage grading.
In [90], the authors propose a computer-aided automatic method for cataract detection where
fundus images are classified into four stages which normal, mild, moderate, and severe. After
extracting the green channel, only fundus images with a good quality are conserved. This step is
performed using the Naturalness Image Quality Evaluator (NIQE) and the Perception based Image
Quality Evaluator (PIQE) that generates a score related to the image quality. The fundus images
where scores surpass a specific threshold are taking into account. Thereafter, the features are
extracted using Alex Net model which is pre-trained using ImageNet database. This model is
composed by five convolutional layers followed by three fully connected layers. The features are
provided to a classifier that is determinate experimentally. The authors proceed to compare several
classifiers which are linear SVM, kernel SVM, K-nearest neighbour, Naive Bayes, decision tree,
LDA and SoftMax, where linear SVM allows achieving the higher classification accuracy.
The dataset is collected from several public such as HRF, STARE, DIARETDB0, E-opt,
MESSIDOR, DRIVE and DRIONS-DB, where 200 fundus images are chosen for each cataract
grade. Based on experimental result, the method achieves an accuracy of 100% when used for two
class (normal vs. cataract) classification. In the case of Four class classification, an average
accuracy of 92.91 % is achieved and accuracy per stage are respectivelly100% for normal, 93.33%
for middle, 88.33% for moderate, 90% for severe cataract. The experiment shows each
misclassification consists in grading the image as neighborhood cataract classes.
35
The work described in [93] and [94] propose an automated system for grading the severity of
nuclear cataracts based on convolutional-recursive neural networks (CRNN). First, the lens
structure is partitioned into anterior cortex, nucleus, and posterior cortex. Thereafter, the three
sections are resized where anterior cortex and posterior cortex are scaled in square shapes, where
width is the half of the nucleus one. The resizing is done while preserving the same lens structure
dimension. Then, anterior section is removed, and the nucleus is divided into three overlapped
sections. Afterwards, the grading category is used to learn local features from each section.
Thereafter, local patches from each section are randomly extracted and merged into the same
group. Those features are provided to a convolutional layer of the CNN. Hence, image contrasts
are normalized, and average pooling is applied. Then, N random RNNs are performed to extract
N vectors of higher order features. Finally, those vectors are injected into support vector regression
(SVR) to provide the final grading result. This method is evaluated using the ACHIKO-NC dataset
that contains 5378 images. Each image is graduated from 0.1 to 5.0, which is defined using the
Wisconsin protocol. Four metrics are computed to evaluate the method that are the integral
agreement ratio (R0), the ratio of decimal grading errors≤ 0.5 (Re0.5), the ratio of integral grading
errors≤ 1.0(Re1.0), and the mean absolute error (ε), which values are respectively 0.704 ±0.016,
0.881 ±0.019, 0.990 ±0.004 and 0.307 ±0.019.
In [91], a grading cataract severity method of fundus image is proposed. The method models the
four-class classification problem into three adjacent two-class classification problems. After
delimiting the retina, an improved version of the “Haar wavelet filter” is applied to the fundus
image in order to decompose it into Approximate Components (ACs). Those ACs should be
classified through three optimal thresholds that correspond to the three two-class classifiers. The
authors proposed to define them through on « mean square error » loss function of the BP-net
model, where those values are generated when DL model provides a higher accuracy classification.
The evaluation is performed using a private dataset composed by 1355 retinal images. The
experiment shows that two-class classification and four-class classification achieve respectively
accuracies about 94.83% and 85.98%.
36
3. Deep Learning-bases Smartphone for detection of retinal abnormalities
3.1 Smartphone Captured fundus image evaluation
Nowadays, the design of the CAD-based Smartphone for detection of retina abnormalities is
growing. Several works are interested to the quality of fundus image captured by Smartphone,
with respect to the clinical employment. The work described in [95] describes an experimentation
that evaluates the D-EYE lens captured fundus images with respect to the direct ophthalmoscope
ones.
In [96], ophthalmologists deduced that Smartphone captured fundus images are readable with an
average between 86% and 100%, and have an accepted quality in 93%-100%.
Jin et al. [97] were summarized a qualitative comparison study between portable and tabletop
fundus camera by grading 400 fundus images in each category. The ophthalmologists assign
excellent overall quality about 63% and 70.75% and inadequate quality about 4.75% and 3.25%
respectively for portable and tabletop camera.
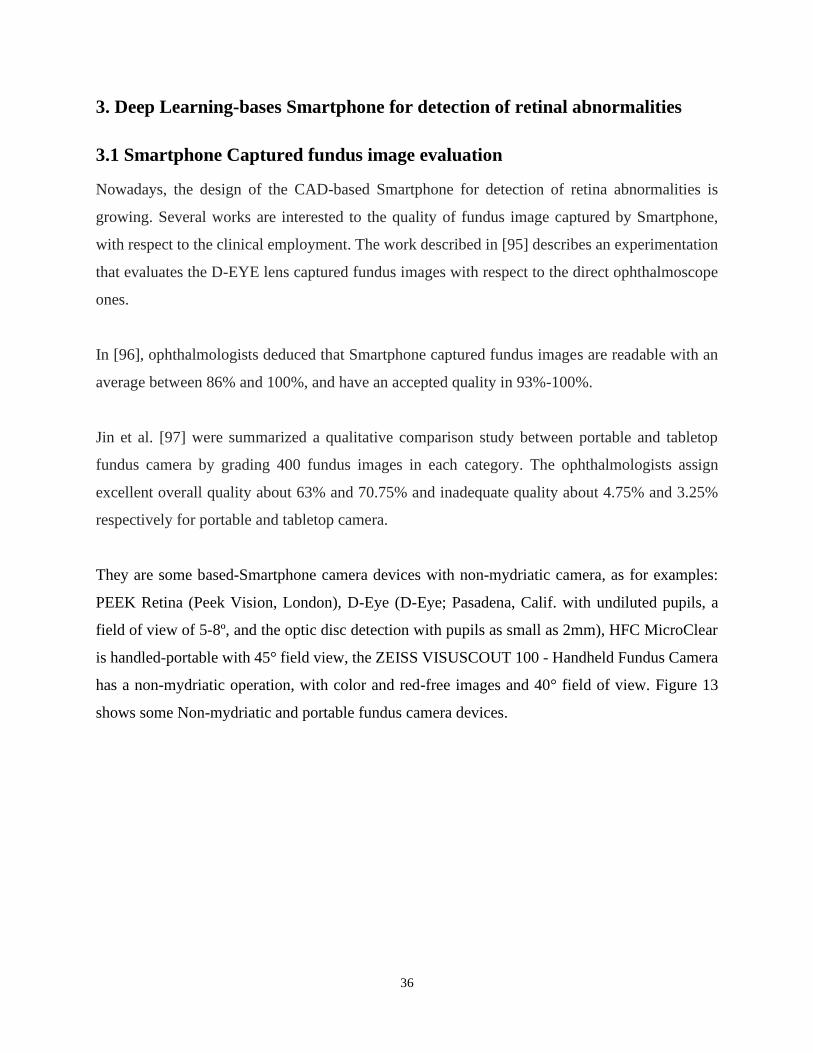
They are some based-Smartphone camera devices with non-mydriatic camera, as for examples:
PEEK Retina (Peek Vision, London), D-Eye (D-Eye; Pasadena, Calif. with undiluted pupils, a
field of view of 5-8º, and the optic disc detection with pupils as small as 2mm), HFC MicroClear
is handled-portable with 45° field view, the ZEISS VISUSCOUT 100 - Handheld Fundus Camera
has a non-mydriatic operation, with color and red-free images and 40° field of view. Figure 13
shows some Non-mydriatic and portable fundus camera devices.
37
Figure 13. Some Non-mydriatic and portable fundus camera devices: a) Horus DEC 200 Hand Held Fundus Camera
(https://www.bibonline.co.uk/) with 40° manual focus portable fundus camera); b) ZEISS VISUSCOUT 100 -
Handheld Fundus Camera (https://www.zeiss.com/); c) Volk iNview -iPhone Fundus Camera
(https://www.foresightintl.com/) and d) The D-EYE Retinal Camera (https://www.d-eyecare.com/).
Other works have been proposed for screening and diagnosis of ocular diseases. In [98] a screening
tool is given. This tool is able to identify patients with Diabetic Retinopathy. The D.EYE device
is used.
Russo et al. [99] aim to calculate the Vertical Cup-to-Disc Ratio value. For the experimental
results, a Smartphone ophthalmoscopy equipped with D-EYE lens and slit-lamp biomicroscopy
were used and the obtained Kappa is equal to 0.63.
Thomas et al. [100] propose a Tele-glaucoma providing a specificity of 79% and a sensibility of
83%.
In [101] the DR detection uses Smartphone fundus photography. This work shows that both non-
mydriatic fundus photography and Smartphone are able to detect DR. The non-mydriatic one is
more sensitive.
A. Elloumi et al. [102] and [103] propose a Smartphone based method for Optic Nerve Head
detection from fundus images captured by the D. EYE lens. The STARE and DRIVE databases
are used and the obtained results are 96% and 100% detection rates on STARE and DRIVE
Datasets respectively.
38
The average execution times are 2s on STARE dataset and 1.3s on DRIVE database. The proposed
image processing pipeline in order to detect and enhance the retina area and detect the Optic Nerve
Head in Smartphone less than 1 second.
The table 1 shows the characteristics and performance of ocular diseases detection using from
Smartphone and fundus image that we have identified in some related works.
Table 1. Some related work based-Smartphone for ocular disease detection
Works Pathologies Fundus
image
number
Performance - Evaluation Capture
device
Toy et al [98] moderate non-
proliferative
&Worse diabetic
retinopathy
100 91% sensitivity
99% specificity
95% positive predictive
value
98% negative predictive
value.
Paxos
Scope
Russo et al. [99] Vertical Cup-to-
Disc
Ratio (glaucoma)
107 s 95% sensitivity
95% specificity
63 % Kappa (k)
D-EYE
Rajalakshmi et
al. [104]
DR
--- 92.7 % sensitivity
98.4 % specificity
Kappa ( ĸ) = 0.90
(FOP)
camera
Muiesan et al.
[105]
hemorrages
exudates
papiledema
104 Hemorrages: 0.795
Exudates: 0.822 – 0.878
Papiledema: 0.815 – 0.804
D-Eye
Thomas et al.
[100]
Glaucoma --- 83% sensitivity
79% specificity
3.2 Deep-Learning based method of ocular pathology detection from
Smartphone-captured fundus image
It is only recently that an interest is focused on the design of CAD systems based on DL and using
Smartphone for detection of retinal abnormalities. However, there is very little published work.
The following works [106, 107, 108] illustrate using DL on Smartphone for screening and
diagnosis of ocular pathologies.
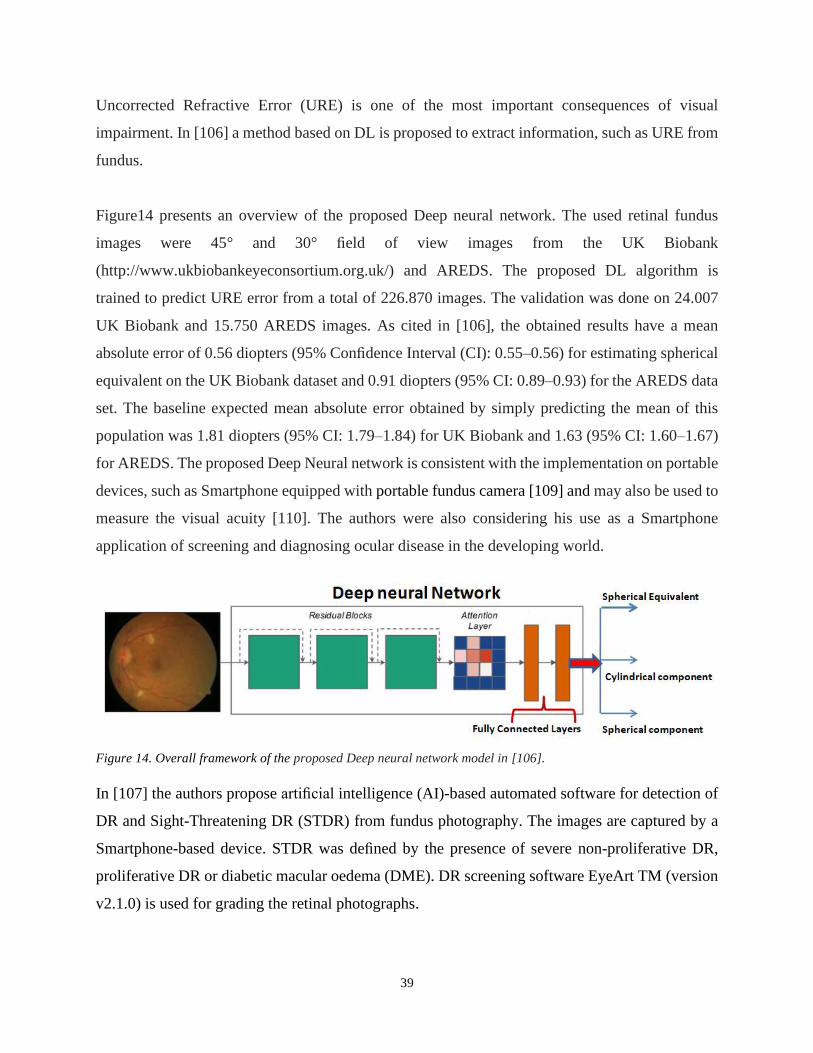
39
Uncorrected Refractive Error (URE) is one of the most important consequences of visual
impairment. In [106] a method based on DL is proposed to extract information, such as URE from
fundus.
Figure14 presents an overview of the proposed Deep neural network. The used retinal fundus
images were 45° and 30° field of view images from the UK Biobank
(http://www.ukbiobankeyeconsortium.org.uk/) and AREDS. The proposed DL algorithm is
trained to predict URE error from a total of 226.870 images. The validation was done on 24.007
UK Biobank and 15.750 AREDS images. As cited in [106], the obtained results have a mean
absolute error of 0.56 diopters (95% Confidence Interval (CI): 0.55–0.56) for estimating spherical
equivalent on the UK Biobank dataset and 0.91 diopters (95% CI: 0.89–0.93) for the AREDS data
set. The baseline expected mean absolute error obtained by simply predicting the mean of this
population was 1.81 diopters (95% CI: 1.79–1.84) for UK Biobank and 1.63 (95% CI: 1.60–1.67)
for AREDS. The proposed Deep Neural network is consistent with the implementation on portable
devices, such as Smartphone equipped with portable fundus camera [109] and may also be used to
measure the visual acuity [110]. The authors were also considering his use as a Smartphone
application of screening and diagnosing ocular disease in the developing world.
Figure 14. Overall framework of the proposed Deep neural network model in [106].
In [107] the authors propose artificial intelligence (AI)-based automated software for detection of
DR and Sight-Threatening DR (STDR) from fundus photography. The images are captured by a
Smartphone-based device. STDR was defined by the presence of severe non-proliferative DR,
proliferative DR or diabetic macular oedema (DME). DR screening software EyeArt TM (version
v2.1.0) is used for grading the retinal photographs.
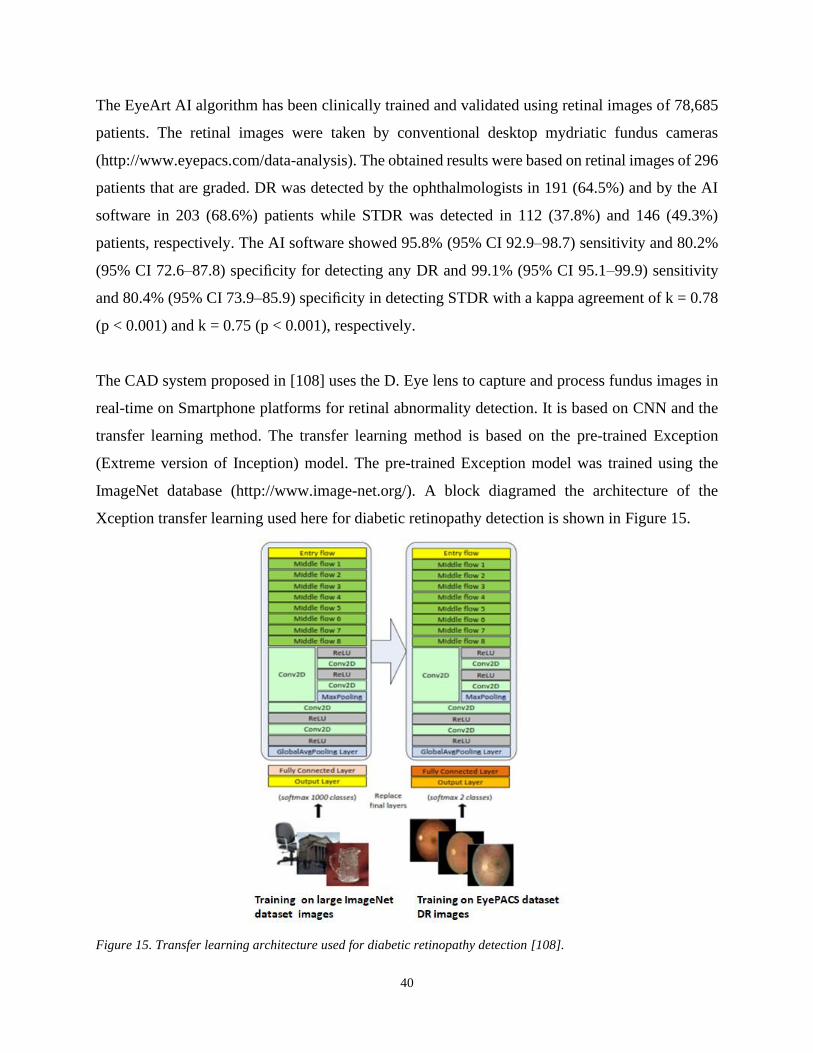
40
The EyeArt AI algorithm has been clinically trained and validated using retinal images of 78,685
patients. The retinal images were taken by conventional desktop mydriatic fundus cameras
(http://www.eyepacs.com/data-analysis). The obtained results were based on retinal images of 296
patients that are graded. DR was detected by the ophthalmologists in 191 (64.5%) and by the AI
software in 203 (68.6%) patients while STDR was detected in 112 (37.8%) and 146 (49.3%)
patients, respectively. The AI software showed 95.8% (95% CI 92.9–98.7) sensitivity and 80.2%
(95% CI 72.6–87.8) specificity for detecting any DR and 99.1% (95% CI 95.1–99.9) sensitivity
and 80.4% (95% CI 73.9–85.9) specificity in detecting STDR with a kappa agreement of k = 0.78
(p < 0.001) and k = 0.75 (p < 0.001), respectively.
The CAD system proposed in [108] uses the D. Eye lens to capture and process fundus images in
real-time on Smartphone platforms for retinal abnormality detection. It is based on CNN and the
transfer learning method. The transfer learning method is based on the pre-trained Exception
(Extreme version of Inception) model. The pre-trained Exception model was trained using the
ImageNet database (http://www.image-net.org/). A block diagramed the architecture of the
Xception transfer learning used here for diabetic retinopathy detection is shown in Figure 15.
Figure 15. Transfer learning architecture used for diabetic retinopathy detection [108].
41
The real-time results reported in this work are based on the iPhone 7/ iPhone XR iOS Smartphone
and Pixel 2/ Pixel 3Android Smartphone. In the iOS version of the developed app, 30 frames get
captured per second and two detection decisions are made per second. The DR CNN model was
trained and tested on the retina images from the EyePACS dataset corresponding to no diabetic
retinopathy (label 0), and the severe diabetic retinopathy (labels 3 and 4). 23354 retina images
were used for training and 4037 images selected at random were considered for testing. The overall
accuracy of the diabetic retinopathy detection was found to be 94.6%.
4. Discussion
Glaucoma, AMD, DR and Cataract constitute the main retinal diseases. Unless early screening,
these diseases lead always to severe damage on visual acuity and may be irreversible. The
automated methods based on image analysis for ocular diseases diagnosis from both fundus and
OCT images have been explored extensively. This category of methods is generally based on two
main stages: image processing techniques (segmentation, feature extraction, and detection of
retinal vessels and lesions) and ocular diseases classification and screening. Sometimes pre-
processing and post-processing stages can be required. The performance evaluation of this
category of methods (called in the literature “traditional methods”) is done on different public
and/or private datasets, using the labels provided by experts for each fundus image of the database.
Different performance metrics like accuracy (ACC), sensitivity and specificity are used to measure
and evaluate the performance of the proposed methods.
Nowadays, DL and CNN have shown their abilities in different health domains including
ophthalmology [16]. DL and CNN can identify, localize, quantify and analyze pathological
features and ocular diseases and their performance keeps growing. In this chapter, we tried to
address different kinds of applications of deep learning methodologies in ophthalmic diagnosis.
So, the most severe ocular diseases are considered. Then, we focused on existing methods of earlier
screening and diagnosis of these diseases.
42
An overview of CNN Deep Learning Networks based approaches was provided. Traditionally
glaucoma is diagnosed by measuring the intraocular pressure (IOP) with a tonometer and rating
an abnormal high-pressure rate. Otherwise, glaucoma can be diagnosed within the assessment of
the ONH by extracting indicators such as the Cup-to-Disc Ratio (CDR) [28], the Inferior Superior
Nasal Temporal (ISNT) rule [29], the RNFL thickness [30], parapapillary atrophy [31] or ONH
hemorrhages [30].In the last decade, deep learning has been extensively applied for ophthalmic
diagnostics achieving good results on various fundus and OCT datasets. Optic Disc, Cup and
Nerve Head Segmentation is an important step for automatic cropping of the region of interest for
further processing [32].
Fundus image present a mainly element to detect and grade AMD, where several DL-based
methods are proposed. Based in this bibliographic study, the methods aiming for grading the
fundus image into the standard 4-class classification (no AMD, early AMD, intermediate AMD,
and advanced AMD) or into a reduced version of the 4-class classification (no/early vs
intermediate/advanced) and achieve a higher acceptable performance detection, which can be
employed in clinical context. However, works aiming for grading in large-class classification are
failed to perform acceptable grading. Furthermore, we distinguish a lack of works aiming for
segmenting drusens lesions where the achieved performances are not sufficient, which present a
good challenge for future studies.
The appearance of microaneurysms (MAs) and hard exudates are the earlier signs of DR. In terms
of classification we have five-stage disease severity for DR including three stages of low risk, a
fourth stage of severe nonproliferative retinopathy, and a fifth stage of proliferative retinopathy.
Recently, there are some works for DR diagnosis at image level based on DL comparing the
performance between DL method and previous traditional methods and showing that DL learning
achieves significantly better performance in DR diagnosis.
The cataract can be detected through four main methods that are light-focus method, iris image
projection, slit lamp examination and transillumination ophthalmoscopy [92]. Those methods are
costly and time-consuming. Therefore, this develops the necessity to propose a computer-aided
diagnosis for cataract detection [90].
43
It can be noticed that in most of the cases deep learning methods outperformed traditional
methodologies.
Recently, some works are interested to the quality of fundus image captured by Smartphone with
respect to the clinical employment and then an interest is focused on the design of CAD systems-
based DL using Smartphone for detection of retinal abnormalities. However, until now they still
very little published work. In the context of ophthalmic diagnosis this can be an important direction
for future research.
5. Conclusion
Throughout the study that we have carried out on part automated methods based on image analysis
for eye diseases and other part deep learning-based AI in ocular diseases diagnosis, we note that
there is an active effort to create and develop methods to automate screening of retinal diseases.
Many CAD systems for ocular diseases have been developed and are widely used. It was also
noted that the automated methods based on image analysis for ocular diseases diagnosis from both
fundus and OCT images have been explored extensively.
However, the performance evaluation of this category of methods is done using a variety of public
and/or private datasets. These datasets are ACHIKO-K, DRIONS-DB, HRF, SEED, ORIGA,
RIGA, REFUGE (for Glaucoma), Kaggle dataset, DRIVE dataset, STARE dataset, EyePACS
dataset, DIARETDB0, DIARETDB1, and MESSIDOR dataset (for DR disease), AREDS (for
AMD) and other datasets such as E-ophta, MESSIDOR, DRIONS-DB. Several datasets contain
fundus images where labels are provided by experts for each fundus image of the database, such
as DR lesion existence in the DIARETDB0 dataset, or glaucoma disease detection in HRF dataset.
However, in opposite cases, authors are required to provide labels for fundus images, where
approaches are not described or not carried to ensure a performing labelling or grading.
These previous methods under-perform due to variations in image properties and quality resulting
from the use of varying capture devices and the robustness and accuracy of the used approaches
for ROI detection and segmentation of the retinal structures.
44
For all these reasons, DL and CNNs have shown their abilities in different heath domains including
ophthalmology. DL and CNNs are able to identify, localize, quantify and analyze pathological
features in fundus images.
We have discussed over 100 papers in CAD systems for ocular diseases that focus on the use of
CNN Deep Learning Networks in detection of retinal abnormalities using retinal images.
We focused on earlier screening and diagnosis of glaucoma, age-related macular degeneration, and
diabetic retinopathy and cataract diseases.
In particular, we will report the related works based on Hybrid and fully methods. The hybrid
method employs both image processing for preprocessing and post processing steps and deep
learning for feature segmentation and classification with CNN Deep Learning Networks. In fully
method, CNN Deep Learning Networks is used for both feature extraction and classification from
the input directly. Two types of retinal imaging modalities will be considered, Optical Coherence
Tomography and fundus camera for capturing fundus images as inputs for the Computer-Aided
Diagnosis System based upon CNN Deep Learning network.
This variety of works and methods show that we have achieved excellent reults in terms of
classification and grading accuracy of ocular diseases. From this review, we can note the following
works. Zhixi et al. [43] used the Inception-v3 architecture obtaining an accuracy of 98.6%
Glaucoma classification. In [68], an automated screening system based on Deep Learning is
proposed to classify fundus autofluorescene images into normal or atrophic age-related macular
degeneration. The proposed screening system is based onthe residual network. The screening
system provides an accuracy of 0.98, a sensitivity of 0.95 and 1 for specificity. In [83], an
automated diabetic retinopathy identification and grading system detects the presence and severity
of diabetic retinopathy from fundus images via transfer learning and ensemble learning. The
proposed identification model performed with a sensitivity of 97.5%, a specificity of 97.7% and
an accuracy of 97.7%. The grading model achieved sensitivity of 98.1%, a specificity of 98.9%
and an accuracy of 96.5%. In [91], a grading cataract severity method of fundus image is proposed,
and the experiment shows that two-class classification and four-class classification achieve
respectively accuracies about 94.83% and 85.98%.
45
It is only very recently that an interest is focused on the design of CAD systems based upon Deep
learning and using Smartphone platform for detection of retinal abnormalities. The CAD system
proposed in [108] uses the D. Eye lens to capture and process fundus images in real-time on
Smartphone platforms for retinal abnormality detection. It is based on convolutional neural
network and the transfer learning method. The transfer learning method based on the pre-trained
Exception (Extreme version of Inception) model. The pre-trained Xception model was trained
using the ImageNet database. The overall accuracy of the diabetic retinopathy detection was found
to be 94.6%.
References
1. Seth R Flaxman, Rupert R A Bourne, Serge Resnikoff, Peter Ackland, Tasanee
Braithwaite, Maria V Cicinelli, Aditi Das, Jost B Jonas, Jill Keeffe, John H Kempen, Janet Leasher,
HansLimburg, Kovin Naidoo, Konrad Pesudovs, Alex Silvester, Gretchen A Stevens, Nina
Tahhan, Tien Y Wong, Hugh R Taylor. Global causes of blindness and distance vision
impairment1990–2020: a systematic review and meta-analysis. Lancet Glob Health 2017; 5:
e1221–34published Online October 11, 2017. http://dx.doi.org/10.1016/S2214-109X (17)30393-
5
2. Bourne, R.R.; Stevens, G.A.; White, R.A.; Smith, J.L.; Flaxman, S.R.; Price, H.; Jonas,
J.B.; Keffer, J.; Leasher, J.; Naidoo, K.; et al. Vision Loss Expert Group. Causes of vision loss
worldwide, 1990–2010: A systematic analysis. Lancet Glob. Health 2013, 1, e339–e349.
3. Wong, T.Y.; Su, X.; Li, X.; Cheung, C.M.; Klein, R.; Cheng, C.Y.; Wong, T.Y. Global
prevalence of age-related macular degeneration and disease burden projection for 2020 and 2040:
A systematic review and meta-analysis. Lancet Glob. Health 2014, 2, e106–e116.
4. Jonas, J.B.; Aung, T.; Bourne, R.R.; Bron, A.M.; Ritch, R.; Panda-Jonas, S. Glaucoma.
Lancet 2017, 390, 2183–2193.
5. Wong, T.Y.; Cheung, C.M.; Larsen, M.; Sharma, S.; Simo, R. Diabetic retinopathy. Global
Estimates on the Number of People Blind or Visually Impaired by these major eye diseases. Nat.
Rev. Dis. Primers 2016, 17, 16012.
46
6. Zhou Zhang, Ruchir Srivastava, Huiying Liu, Xiangyu Chen, Lixin Duan, Damon Wing
Kee Wong, Chee Keong Kwoh, Tien Yin Wong, Jiang Liu. A survey on computer aided diagnosis
for ocular diseases. BMC Medical Informatics and Decision Making2014, 14:80
7. Manivannan A., Kirkpatrick J. N. P., Sharp P.F., Forrester J. V. Novel approach towards
colour imaging using scanning laser ophthalmoscope. Br. J. Ophthalmol. 82(4), 342-345 (1998).
10. 1135/bjo. 82.4.342.
8. Hermann B, Fernandez EJ, Unterhubner A, Sattmann H, Fercher AF, Drexler W, Prieto
PM, Artal P. Adaptative-optics ultrahigh-resolution optical tomography. Opt Let 2004: 29:2142-
2144.
9. Del Hoog, E., Schwiegerling, J. Fundus camera systems: a comparative analysis. Appl.
Opt. 48(2): 221-228 (2009).
10. R Michael D. Abràmoff, Mona K. Garvin, Milan Sonka. Retinal Imaging and Image
Analysis, IEEE Rev Biomed Eng. 2010 January 1; 3: 169–208.
doi:10.1109/RBME.2010.2084567.
11. Narasimha-Iyer H, Can A, Roysam B, Stewart C, Tanenbaum H, Majerovics A, Singh H:
Robust detection and classification of longitudinal changes in color retinal fundus images for
monitoring diabetic retinopathy IEEE Trans Biomed Eng 2006, 53(6):1084–1098.
12. Rüdiger Bock, Jörg Meier, Georg Michelson, László G. Nyúl, Joachim Hornegger.
Classifying Glaucoma with Image-Based Features from Fundus Photographs. Proceedings of the
29th DAGM conference on Pattern recognition. Pages 355-364. Heidelberg, Germany, September
12 -14, 2007.
13. A. Mvoulana, R. Kachouri, M. Akil. Fully Automated Method for Glaucoma Screening
using robust Optic Nerve Head detection and unsupervised segmentation-based Cup-to-Disc Ratio
computation in Retinal Fundus Images. Accepted in Computerized Medical Imaging and Graphics
journal. July 2019.
14. Muthu Rama Krishnan Mokihi. Rajendra Acharyaa, Hamido Fujitad , Joel E.W. Koha, Jen
Hong Tana , Chua Kuang Chuaa , Sulatha V. Bhandarye , Kevin Noronhaf , Augustinus Laudeg,
Louis Tongh. Automated Detection of Age-Related Macular Degeneration using Empirical Mode
Decomposition. In Knowledge-Based Systems 89:654–668· September 2015.
DOI: 10.1016/j.knosys.2015.09.012
47
15. Huang W, Chan KL, Li H, Lim JH, Liu J, Wong TY: A computer assisted method for
nuclear cataract grading from slit-lamp images using ranking. IEEE Trans Med Imaging 2011,
30(1):94–107.
16. Ursula Schmidt-Erfurth, Amir Sadeghipour, Bianca S. Gerendas, Sebastian M. Waldstein,
Hrvoje Bogunovic. Artificial intelligence in retina. Progress in Retinal and Eye Research 67(2018)
1–29
17. Quigley, H. A. and Broman, A. T. (2006). The number of people with glaucoma worldwide
in 2010 and 2020. British journal of ophthalmology, 90(3):262-267.
18. Costagliola, C., Dell'Omo, R., Romano, M., Zeppa, L., and Parmeggiani, F. (2009a).
Pharmacotherapy of intraocular pressure: part ii. Parasympathomimetic, sympathomimetic and
sympatholytics. Expert Op in Pharmacother, 10(17):2859-2870.
19. http ://www.ch-libourne.fr/offres-de-soins/pratiques-professionnelles/glaucome/
20. MT Nicolela, JR Vianna. Optic Nerve: Clinical Examination, in Pearls of Glaucoma
Management. Springer, Berlin, Heidelberg. Pages 17-26, 2016.
21. Bourne, R. R. (2007). Papille optique et glaucome. Revue de Santé Oculaire
Communautaire, 4(3):8-9.
22. Tham, Y.-C., Li, X., Wong, T. Y., Quigley, H. A., Aung, T., and Cheng, C.-Y. (2014).
Global prevalence of glaucoma and projections of glaucomaburdenthrough2040: a systematic
review and meta-analysis. Ophthalmology, 121(11):2081-2090.
23. World Health Organization, 2006. Vision 2020. The Right to Sight. Global Initiative for
the Elimination of Avoidable Blindness. WHO Press
24. S Liu, SL Graham, A Schulz, M Kalloniatis, B Zangerl, W Cai, Y Gao, B Chua, H Arvind,
J Grigg, et al. A deep learning-based algorithm identifies glaucomatous discs using monoscopic
fundus photographs. Ophthalmology Glaucoma, 1(1):15-22, 2018.
25. Tunnel vision: the economic impact of primary open angle glaucoma.
26. Graham Mowatt; Jennifer M. Burr; Jonathan A. Cook; M. A. Rehman Siddiqui; Craig
Ramsay; Cynthia Fraser; Augusto Azuara-Blanco; Jonathan J. Deeks. Screening Tests for
Detecting Open-Angle Glaucoma: Systematic Review and Meta-analysis. In Investigative
Ophthalmology & Visual Science, December 2008, Vol. 49, No. 12.
48
27. Fu, Huazhu; Xu, Yanwu; Lin, Stephen; Wong, Damon Wing Kee; Mani, Baskaran;
Mahesh, Meenakshi; Aung, Tin; Liu, Jiang. Multi-Context Deep Network for Angle-Closure
Glaucoma Screening in Anterior Segment OCT. Médical Image Computing and Computer
Assisted Intervention (MICCAI) 2018. ArXiv :1809.03239
28. Shen, S. Y., Wong, T. Y., Foster, P. J., Loo, J.-L., Rosman, M., Loon, S.-C., Wong, W. L.,
Saw, S.-M., and Aung, T. (2008). The prevalence and types of glaucoma in Malay people: the
Singapore Malay eye study. Investigative ophthalmology&visual science, 49(9):3846-3851.
29. Thakkar, K., Chauhan, K., Sudhalkar, A., Gulati, R., and Ophthalmologist, M. (2017).
Detection of glaucoma from retinal fundus images by analysing isnt measurement and features of
optic cup and blood vessels. Int. J. Eng. Technol. Sci. Res. IJETSR, 4(7):2394-3386.
30. Fingeret, M., Medeiros, F. A., Susanna Jr, R., and Weinreb, R. N. (2005). Five rules to
evaluate the optic disc and retinal nerve fiber layer for glaucoma. Optometry-Journal of the
American Optometric Association, 76(11):661-668.
31. Jonas, J. B., Fernandez, M. C., and Naumann, G. O. H. (1992). Glaucomatous Parapapillary
Atrophy: Occurrence and Correlations. JAMA Ophthalmology, 110(2):214-222.
32. Soorya Sengupta, Amitojdeep Singh, Henry A. Leopold, Tanmay Gulati, Vasudevan
Lakshminarayanan. Ophthalmic Diagnosis and Deep Learning - A Survey. Computer Vision and
Pattern Recognition 1812.07101 (2018).
33. Z. Feng, J. Yang, L. Yao, Y. Qipao, Q. Yu, X. Xu. Deep retinal image segmentation: A
fcn-based architecture with short and long skip connections for retinal image segmentation (2017)
713-722.
34. L. Fang, D. Cunefare, C. Wang, R. Guymer, S. Li, S. Farsiu, Automatic segmentation of
nine retinal layer boundaries in oct images of non-exudative amd patients using deep learning and
graph search, Biomedical optics express 8 (5) (2017) 2732-2744.
35. M. Pekala, N. Joshi, D. Freund, N. Bressler, D. DeBuc, P. Burlina, Deep learning based
retinal oct segmentation, arXivpreprintarXiv:1801.09749.
36. Zilly, Julian; Buhmann, Joachim M; Mahapatra, Dwarikanath. Glaucoma detection using
entropy sampling and ensemble learning for automatic optic cup and disc segmentation.
Computerized Medical Imaging and Graphics 55 (2017) 28–41
49
37. S Liu, SL Graham, A Schulz, M Kalloniatis, B Zangerl, W Cai, Y Gao, B Chua, H Arvind,
J Grigg, et al. A deep learning-based algorithm Identifies glaucomatous discs using monoscopic
fundus photographs. Ophthalmology Glaucoma, 1(1):15-22, 2018.
38. X. Chen, Y. Xu, S. Yan, D. Wong, T. Wong, J. Liu, Automatic feature learning for
glaucoma detection based on deep learning (Oct 2015).URL
https://link.springer.com/chapter/10.1007/978-3-319-24574-4_80
39. Y. Chai, H. Liu, J. Xu, Glaucoma diagnosis based on both hidden features and domain
knowledge through deep learning models. Knowledge-Based Systems. doi:
10.1016/j.knosys.2018.07.043.
40. H. Fu, J. Cheng, Y. Xu, C. Zhang, D. Wong, J. Liu, X. Cao, Disc aware ensemble network
for glaucoma screening from fundus image, IEEE Transactions on Medical Imaging.
41. A. Chakravarty, J. Siv Swamy, A deep learning based joint segmentation and classification
framework for glaucoma assessment in retinal colour fundus images,
arXivpreprintarXiv:1808.01355.
42. H. Muhammad, T. Fuchs, N. De Coir, C. De Moraes, D. Blumberg, J. Liebmann, R. Ritch,
D. Hood, Hybrid deep learning on single wide-field optical coherence tomography scans
accurately classifies glaucoma suspects, Journal of glaucoma 26 (12) (2017) 1086-1094.
43. L Hexi, Y He, S Keel, W Meng, RT Chang, and M He. Efficacy of a deep learning system
for detecting glaucomatous optic neuropathy based on colour fundus photographs.
Ophthalmology, 125(8):1199-1206, Aug 2018.
44. G. C. Chan, R. Kemble, H. Muller, S. Shah, T. Tang, F. Meriaudeau, Fusing results of
several deep learning architectures for automatic classification of normal and diabetic macular
edema in optical coherence tomography, in: 2018 40th Annual International Conference of the
IEEE37Engineering in Medicine and Biology Society (EMBC), IEEE, 2018, pp. 670-673.
45. H. Fu, Y. Xu, D. Wong, J. Liu, Retinal vessel segmentation via deep learning network and
fully-connected conditional random fields, in: Biomedical Imaging (ISBI), 2016 IEEE 13th
International Symposium on, IEEE, 2016, pp. 698-701.
46. Y. Guo, Y. Liu, A. Oerlemans, S. Lao, S. Wu, M. S. Lew, Deep learning for visual
understanding: A review, Neurocomputing 187 (2016) 27-48.
50
47. M. Niemeijer, B. Van G, M. Cree, A. Mizutani, G. Quellec, C. Sanchez, B. Zhang, R.
Hornero, M. Lamard, C. Muramatsu, et al., Retinopathy online challenge: automatic detection of
microaneurysms in digital colour fundus photographs, IEEE transactions on medical imaging 29
(1) (2010) 185-195.
48. T. Clemons, E. Chew, S. Bressler, W. McAbee, Age-related eye disease study research, g.
national eye institute visual function questionnaire in the age-related eye disease study (areds):
Areds report no. 10, Arch Ophthalmol 121 (2) (2003) 211-7.
49. F. Fumiko, S. Alay_on, J. Sanchez, J. Sigut, M. Gonzalez-Hernandez, Rim-one: An open
retinal image database for optic nerve evaluation, in: 2011 24th international symposium on
computer-based medical systems (CBMS), IEEE, 2011, pp. 1-6.
50. R. Rasti, H. Rabbani, A. Mehridehnavi, F. Hajizadeh, Macular oct classification using a
multi-scale convolutional neural network ensemble, IEEE transactions on medical imaging 37 (4)
(2018) 1024-1034.
51. M. Jahromi, R. K, H. Rabbani, A. Dehnavi, A. Peyman, F. Hajizadeh, M. Ommani. An
automatic algorithm for segmentation of the boundaries of corneal layers in optical coherence
tomography images using Gaussian mixture model, Journal of medical signals and sensors 4 (3).
(2014) 171.
52. J. Lowell, A. Hunter, D. Steel, A. Basu, R. Ryder, E. Fletcher, L. Kennedy, et al., Optic
nerve head segmentation, Medical Imaging, IEEE Transactions on 23 (2) (2004) 256-264.
53. Mookie M.R.K., Acharya U.R., Fujita H., Koh J.E.W., Tan J.H., Chua C.K.,Bhandary S.V.,
Noronha K., Laude A., Tong L., "Automated detection of age-related macular degeneration using
empirical mode decomposition", Knowledge-Based Systems, vol.89, p654–668(2015), DOI:
https://doi.org/10.1016/j.knosys.2015.09.012
54. Kanagasingam Y., Bhuiyan A., Abràmoff MD., Smith RT., Goldschmidt L., Wong T.Y.,
"Progress on retinal image analysis for age related macular degeneration", Progress in Retinal and
Eye Research; 38:20-42(2014). doi: 10.1016/j.preteyeres.2013.10.002
55. Haute Autorité de Santé (France), " Dégénérescence maculaire liée à l’âge : prise en charge
diagnostique et thérapeutique Méthode (Recommandations pour la pratique clinique), (2012), doi
: https://www.hassante.fr/portail/jcms/c_1051619/fr/degenerescence-maculaire-liee-a-l-age-
prise-en-charge-diagnostiqueet-therapeutique
51
56. Association DMLA and Association Retina France, " Dégénérescence maculaire liée à
l’âge : Quels sont les symptômes potentiellement évocateurs”, (2008), doi :
http://www.dmlainfo.fr/modules/DigiOne.DMLA/Client/Books/en-savoir-plus-sur-la-
dmla/files/mobile/index.html#6
57. Mookiah M.R.K., Acharya U.R., Fujita H., Koh J.E.W., Tan J.H., Noronha K., Bhandary
S.V., Chua C.K., Lim C.M., Laude A., Tong L., "Local configuration pattern features for age-
related macular degeneration characterization and classification", Computers in Biology and
Medicine, vol.63, p208-218(2015), doi:https://doi.org/10.1016/j.compbiomed.2015.05.019
58. Wong W.L., X., Li X., Cheung C.M., Klein R., Cheng C.Y., Wong T.Y., " Global
prevalence of age-related macular degeneration and disease burden projection for 2020 and 2040:
a systematic review and meta-analysis", Alancet Global Health, p106-116 (2014),
doi: 10.1016/S2214-109X(13)70145-1
59. Sennlaub F., "Dégénérescence maculaire liée à l’âge (DMLA)", doi:
https://www.inserm.fr/information-en-sante/dossiers-information/degenerescence-maculaire-liee-
agedmla
60. García-Floriano A., Ferreira-Santiago A., Camacho-Nieto O., Yáñez-Márquez C., "A
machine learning approach to medical image classification: Detectingage-related macular
degeneration in fundus images", Computers and Electrical Engineering, vol.75, p218-229(2019),
doi: https://doi.org/10.1016/j.compeleceng.2017.11.008
61. Horta A., Joshi N., Pekala M., Pacheco K.D., Kong J., Bressler N., Freund D.E., Burlina
P., " A Hybrid Approach for Incorporating Deep Visual Features and Side Channel Information
withApplications to AMD Detection", the 16th IEEE International Conference on Machine
Learning and Applications, (2017), doi: https://doi.org/10.1109/ICMLA.2017.00-75
62. Rushkoff D.B., Lamin A., Oakley J.D., Dubis A.M., Sivaprasad S., " Deep Learning for
Prediction of AMD Progression: A Pilot Study", Retina, vol. 12, 712-722, (2015), doughty://sci-
hub.tw/10.1167/iovs.18-25325
63. Mookie M.R.K., Acharya U.R., Koh J.E.W., Chandran V., Chua C.K., Tan J.H., Lim C.M.,
Ng E.Y.K.,Noronha K., Tong L., Laude A., "Automated diagnosis of Age-related Macular
Degeneration using greyscale features from digital fundus images", Computers in Biology and
Medicine, vol. 53, p55–64.(2014), doi:https://doi.org/10.1016/j.compbiomed.2014.07.015
52
64. Burlina P., Pacheco K.D., Joshi N., Freund D.E., Bressler N.M., "Comparing Humans and
Deep Learning Performance for Grading AMD: A Study in Using Universal Deep Features and
Transfer Learning for Automated AMD Analysis”, Computers in Biology and Medicine, vol. 82,
p80-86. (2017), doi: http://sci-hub.tw/10.1016/j.compbiomed.2017.01.018
65. Mittal D. and Kumari K., “Automated detection and segmentation of drusen in retinal
fundus images”, Computers and Electrical Engineering, vol. 47, p82-95, (2015),
delights://doi.org/10.1016/j.compeleceng.2015.08.014
66. Ren X., Zheng Y., Zhao Y., Luo C., Wang H., Lian J., He Y.,"Drusen Segmentation from
Retinal Images via Supervised Feature Learning ", IEEE ACCESS, p2952-2961, (2018), doi:
https://doi.org/10.1109/ACCESS.2017.2786271
67. Tan J.H., Bhandary S.V., Sivaprasad S., Hagiwara Y., Bagchi A., Raghavendra U., Rao
A.K., Raju B., Shetty N.S., Gertych A., Chua K.C., Acharya U.R., “Age-related Macular
Degeneration detection using deep convolutional neural network”, Future GenerationComputer
Systems, vol. 87, 127–135, (2018), doi: https://doi.org/10.1016/j.future.2018.05.001
68. Wang Z., Sadda S.V.R., Hu Z., “Deep learning for automated screening and semantic
segmentation of age-related and juvenile atrophic macular degeneration”, Proc. SPIE 10950,
Medical Imaging 2019: ComputerAided Diagnosis, 109501Q, (2019); doi: 10.1117/12.2511538
69. Burlina P.M., Joshi N., Pekala M., Pacheco K.D., Freund D.E., Bressler N.M., “Automated
Grading of Age-Related Macular Degeneration from Colour Fundus Images Using Deep
Convolutional Neural Networks”, JAMA Ophthalmol, 135:11, 1170-1176, (2017), doi: http://sci-
hub.tw/10.1001/jamaophthalmol.2017.3782
70. Liu H., Wong D.W.K., Fu H., Xu Y., Liu J., “DeepAMD: Detect Early Age-Related
Macular Degeneration by Applying Deep Learning in a Multiple Instance Learning Framework”,
ACCV 2018, LNCS 11365, pp. 625–640, (2019), doi : https://doi.org/10.1007/978-3-030-20873-
8 _40
71. Ghebrechristos H.E., Alaghband G., Huang R.Y., “Retinet-Features extractor for learning
patterns of diabetic retinopathy and Age-Related Macular Degeneration from Publicly available
Datasets”, international conference on computational science and computational intelligence,
(2017), doi:10.1109/CSCI.2017.286
53
72. Burlina P.M., Joshi N., Pacheco K.D., Freund D.E., Kong J., Bressler N.M., “Use of Deep
Learning for De tailed Severity Charac terization and Estimation of 5-Year Risk Among Patients
with Age-Related Macular Degeneration”, JAMA Ophthalmology (2018),
doi:10.1001/jamaophthalmol.2018.4118
73. Peng Y., Dharssi S., Chen Q., Keenan T.D., Agrón E., Wong W.T., Chew E.Y., Lu Z.,
“DeepSeeNet: A Deep Learning Model for Automated Classification of Patient-based Age-related
Macular Degeneration Severity from Colour Fundus Photographs”, American Academy of
Ophthalmology, ISSN 0161-6420/18, doi://doi.org/10.1016/j.ophtha.2018.11.015
74. Grassmann F., Mengelkamp J., Brandl C., Harsch S., Zimmermann M.E., Linkohr B.,
Peters A., Heid I.M., Palm C., Weber B.H.F., “A Deep Learning Algorithm for Prediction of Age-
Related Eye Disease StudySeverity Scale for Age-Related Macular Degeneration from Color
Fundus Photography”, American A cademy of Ophthalm ology, ISSN 0161-6420/18, doi:
https://doi.org/10.1016/j.ophtha.2018.02.037
75. Z. Hu, Z. Wang, S. Sadda, “Automated segmentation of geographic atrophy using deep
convolutional neural networks”, Proceedings Volume 10575, SPIE Medical Imaging 2018:
Computer Aided Diagnosis, 1057511 (2018), doi: 10.1117/12.2287001
10.1001/jamaophthalmol.2017.3782
76. Wilkinson CP, Ferris FL, Klein RE, Lee PP, Agardh CD, Davis M, Dills D, Kampik
A, Pararajasegaram R, Verdaguer JT. Proposed international clinical diabetic retinopathy and
diabetic macular enema disease severity scales. Ophthalmology. 2003 Sep;110(9):1677-82.
77. Harry Pratt, Frans Coenen, Deborah M Broadbent, Simon P Harding, Yalin Zheng.
Convolutional Neural Networks for Diabetic Retinopathy. International Conference on Medical
Imaging Understanding and Analysis 2016, MIUA 2016, 6-8 July 2016, Loughborough, UK
78. Zhuang Wang, Jianbo Yang. Diabetic Retinopathy Detection via Deep Convolutional
Networks for Discriminative Localization and Visual Explanation. Computer Vision and Pattern
Recognition, 2017.
79. Bole Zhou, Aditya Khosla, Agata Lapedriza, Aude Oliva, Antonio Torralba. Learning
Deep Features for Discriminative Localization. Computer Vision and Pattern Recognition.
December. 2016. arXiv: 1512.041150.

54
80. M. D. Abramoff, Y. Lou, A. Erginay, W. Clarida, R. Amelon, J. C. Folk, and M. Niemeijer.
Improved automated detection of diabetic retinopathy on a publicly available dataset through
integration of deep learning. Investigative ophthalmology & visual science, 57(13):5200–5206,
2016.
81. Hidenori Takahashi, Hironobu Tampo, Yusuke Arai, Yuji Inoue, Hidetoshi Kawashima.
Applying artificial intelligence to disease staging: Deep learning for improved staging of diabetic
retinopathy. PLOS ONE | https://doi.org/10.1371/journal.pone.0179790 June 22, 2017
82. Kele Xu, Dawei Feng, Haibo Mi. Deep Convolutional Neural Network-Based Early
Automated Detection of Diabetic Retinopathy Using Fundus Image. Molecules 2017, 22, 2054;
doi: 10.3390/molecules22122054
83. Jordi de la Torre, Aida Valls, Domenec Puig. A deep learning interpretable classifier for
diabetic retinopathy disease grading. Neurocomputing ( IF 4.072 ) Pub Date : 2019-04-24 ,
DOI: 10.1016/j.neucom.2018.07.102
84. Wei Zhang, Jie Zhong, Shijun Yang, Zhentao Gao, Junjie Hu, Yuanyuan Chen, Zhang Yi
Automated identification and grading system of diabetic retinopathy using deep neural networks.
Knowledge-Based Systems 175 (2019) 12–25
85. D. Jude Hemanth, Omer Depreciable, UtkuKose. An enhanced diabetic retinopathy
detection and classification approach using deep convolutional neural network. Neural Computing
and Applications https://doi.org/10.1007/s00521-018-03974-0. Received: 25 September 2018 /
Accepted: 20 December 2018. Springer-Verlag London Ltd., part of Springer Nature 2019
86. Rory Sayres, Naama Hammel, Derek Wu, Jesse Smith, Ankur Taly, Ehsan Rahimy,
Jonathan Krause, Shawn Xu, Scott Barb, Arjun B. Sood, Katy Blumer, Arunachalam
Narayanaswamy, Anthony Joseph, Greg S. Corrado, David Coz, Zahra Rastegar, Michael
Shumski, Lily Peng, Dale R. Webster. Using a Deep Learning Algorithm and Integrated Gradients
Explanation to Assist Grading for Diabetic Retinopathy. Ophthalmology 2019; 126:552-564 ª
2018 by the American Academy of Ophthalmology. This is an open access article under the CC
BY-NC-ND license (http://creativecommons.org/licenses/by-nc-nd/4.0/).
87. Sivaji Dutta, Bonthala CS Manideep, Syed Muzamil Basha, Ronnie D. Caytiles, N. Ch. S.
N. Iyengar. Classification of Diabetic Retinopathy Images by Using Deep Learning Models.
International Journal of Grid and Distributed Computing Vol. 11, No. 1 (2018), pp.89-106
http://dx.doi.org/10.14257/ijgdc.2018.11.1.09
55
88. Kang Zhou, Zaiwang Gu, Wen Liu, Weixin Luo, Jun Cheng, Shenghua Gao, Jiang Liu.
Multi-Cell Multi-Task Convolutional Neural Networks for Diabetic Retinopathy Grading.
89. Jordi de la Torre, Aida Valls, Domenec Puig. A deep learning interpretable classifier for
diabetic retinopathy disease grading. Neurocomputing,
https://doi.org/10.1016/j.neucom.2018.07.102
90. Pratap T.L., Kokil P.K., “Computer-aided diagnosis of cataract using deep transfer
learning”, Biomedical Signal Processing and Control, vol.53, 101533, (2019), doi:
https://doi.org/10.1016/j.bspc.2019.04.010
91. Cao L., Li H., Zhang Y., Zhang L., Xu L., “Hierarchical method for cataract grading based
on retinal images using improved Haar wavelet”, Information Fusion, vol. 53, 196–208, (2020),
doi: https://doi.org/10.1016/j.inffus.2019.06.022
92. Zhang L., Li J., Zhang I., Han H., Liu B., Yang J., Wang Q., “Automatic Cataract Detection
And Grading Using Deep Convolutional Neural Network”, 2017 IEEE 14th International
Conference on Networking, Sensing and Control (ICNSC), (2017), Calabria, Italy, doi:
https://doi.org/10.1109/ICNSC.2017.8000068
93. Gao X., Lin S., Wong T.Y., “Automatic Feature Learning to Grade Nuclear Cataracts
Based on Deep Learning”, in Proc. ACCV, (2014).
94. Gao X., Lin S., Wong T.Y., “Automatic Feature Learning to Grade Nuclear Cataracts
Based on Deep Learning”, IEEE Transactions on Biomedical Engineering, Volume: 62 , Issue: 11 ,
Nov. 2015, doi : 10.1109/TBME.2015.2444389
95. Amy Ruomei Wu, Samiksha Fouzdar-Jain, Donny W. Suh, « Comparison Study of
Funduscopic Examination Using a Smartphone-Based Digital Ophthalmoscope and the Direct
Ophthalmoscope », Journal of Pediatric Ophthalmology & Strabismus, Vol. 55, No. 3, 2018.
96. Mehrdad Mohammadpour, Zahra Heidari, Masoud Mirghorbani, Hassan Hashemi,
« Smartphones, tele-ophthalmology, and VISION 2020 », Int J Ophthalmol, 2017, Vol. 10, No.
12.doi: 10.18240/ijo.2017.12.19
97. Kai Jin, Haitong Lu, ZhaoanSu, Chuming Cheng, Juan Ye and Dahong Qian,
« Telemedicine screening of retinal diseases with a handheld portable non-mydriatic fundus
camera », BMC Ophthalmology (2017) 17:89, DOI 10.1186/s12886-017-0484-5
56
98. Brian C. Toy, David J. Myung, Lingmin He, Carolyn K. Pan, Robert T. Chang, Alison
Polkinhorne, Douglas Merrell, Doug Foster, MarkS. Blumenkranz. Smartphone-Based Dilated
Fundus Photography and Near Visual Acuity Testing as Inexpensive Screening Tools to Detect
Referral Warranted Diabetic Eye Disease. In RETINA 36(5):1, the journal of retinal and vitreaous
diseases. 2016.
99. Andrea Russo, William Mapham, Raffaele Turano, Ciro Costagliola, Francesco
Morescalchi, NicoloScaroni, and Francesco Semeraro, « Comparison of Smartphone
Ophthalmoscopy with Slit Lamp Biomicroscopy for Grading Vertical Cup-to-Disc Ratio », J
Glaucoma, Volume 25, Number 9, September 2016.doi: 10.1097/IJG.0000000000000499.
100. Thomas SM, Jeyaraman MM, Hodge WG, Hutnik C, Costella J, Malvankar-Mehta MS.
The effectiveness of teleglaucoma versus inpatient examination for glaucoma screening: a
systematic review and meta-analysis. PLoS One 2014;9(12): e113779
101. Martha E. Ryan, Ramachandran Rajalakshmi, VijayaraghavanPrathiba, Ranjit Mohan
Anjana, Harish Ranjani, K.M. Venkat Narayan, Timothy W. Olsen, Viswanathan Mohan, Laura
A. Ward, Michael J. Lynn, Andrew M. Hendrick, « Comparison Among Methods of Retinopathy
Assessment (CAMRA) Study », Ophthalmology, 2015 Oct;122(10):2038-
43. doi: 10.1016/j.ophtha.2015.06.011.
102. Y. Elloumi, M. Akil, N. Kehtarnavaz. A Computational Efficient Retina Detection and
Enhancement Image Processing Pipeline for Smartphone-Captured Fundus Images. Journal of
Multimedia Information System.
103. Y. Elloumi, M. Akil, N. Kehtarnavaz. A mobile computer aided system for optic nerve
head detection", Computer Methods and Programs in Biomedicine (CMPB), Vol. 162, August
2018, pages 139-148, DOI : https://doi.org/10.1016/j.cmpb.2018.05.004
104. Ramachandran Rajalakshmi, Subramanian Arulmalar, Manoharan Usha, Vijayaraghavan
Prathiba, Khaji Syed Kareemuddin, Ranjit Mohan Anjana, Viswanathan
105. Mohan, « Validation of Smartphone Based Retinal Photography for Diabetic Retinopathy
Screening », PLoS ONE 10(9): e0138285. doi: 10.1371/journal.pone.0138285
57
106. M. Lorenza Muiesan, Massimo Salvetti, Anna Paini, Michela Riviera, Clara Pintossi, Fabio
Bertacchini, Efrem Colonetti, Claudia Agabiti-Rosei, Maurizio Poli, Francesco Semeraro,Enrico
Agabiti-Rosei, and Andrea Russo, « Ocular fundus photography with a Smartphone device inacute
hypertension », Journal of Hypertension 2017, 35:1660–1665, Volume 35 Number 8 August
2017.doi: 10.1097/HJH.0000000000001354.
107. Avinash V. Varadarajan, Reena Chopra, RyanPoplin, Pearse A. Keane, Katy Blumer, Greg
S. Corrado, Christof Angermueller, Lily Peng, Joe Ledsam, Dale R. Webster. Deep Learning for
Predicting Refractive Error From Retinal Fundus Images. IOVS, June 2018, Vol. 59, No. 7, 2862
108. Ramachandran Rajalakshmi, Radhakrishnan Subashini, Ranjit Mohan Anjana,
Viswanathan Mohan. Automated diabetic retinopathy detection in Smartphone-based fundus
photography using artificial intelligence. Eye (2018) 32:1138–144https://doi.org/10.1038/s41433-
018-0064-9.
109. Haoran Wei; Abhishek Sehgal; Nasser Kehtarnavaz. A deep learning-based Smartphone
app for real-time detection of retinal abnormalities in fundus images. Proc. SPIE 10996, Real-
Time Image Processing and Deep Learning 2019, 1099602 (14 May 2019);
doi:10.1117/12.2516665
110. Bolster NM, Giardini ME, Livingstone IAT, Bastawrous A. How the Smartphone is driving
the eye-health imaging revolution. Expert Rev Ophthalmology. 2014; 9:475–485.
111. Basitarsus A, Rono HK, Livingstone IAT, et al. Development and validation of a
Smartphone-based visual acuity test (peek acuity) for clinical practice and community-based field
work. JAMA Ophthalmology. 2015; 133:930–937.
112. P. Burkina, D. E. Freund, N. Joshi, Y. Wolfson, N. M. Bressler, “Detection of Age-related
of macular degeneration via Deep Learning”, 2016 IEEE 13th International Symposium on
Biomedical Imaging (ISBI)(2016), 184 – 188, DOI:10.1109/ISBI.2016.7493240
113. P. Burlina, D. E. Freund, N. Joshi, Y. Wolfson, N. M. Bressler, “Comparing Humans and
Deep Learning Performance for Grading AMD: A Study in Using Universal Deep Features and
Transfer Learning for Automated AMD Analysis”, Computer in Biology and Medicine, Volume
82, 1 March 2017, Pages 80-86, DOI: https://doi.org/10.1016/j.compbiomed.2017.01.018