detection of oil pollution on sea ice with airborne
TRANSCRIPT
8/6/2019 Detection of Oil Pollution on Sea Ice With Airborne
http://slidepdf.com/reader/full/detection-of-oil-pollution-on-sea-ice-with-airborne 1/4
Detection of oil pollution on sea ice with airborne
and spaceborne spectrometer
Jaan Praks1, Miia Eskelinen1, Jouni Pulliainen1, Timo Pyhalahti2, Martti Hallikainen1
1Laboratory of Space Technology, Helsinki University of Technology
P.O. Box 3000, 02015 Finland2Finnish Environment Institute
P.O. Box 140,00251 Finland
ABSTRACT
In this work we demonstrate the feasibility of imaging
spectrometer for the detection of oil spills on sea ice. We
show that optical spectrometer images can be used as an
alternative for oil spill mapping in winter when SAR-based
detection algorithms fail due to ice. By comparing high-
resolution airborne spectrometer image to satellite images,
we evaluate the usability of MODIS and Landsat imagesfor oil pollution detection on ice and discuss the limitations,
set by image resolution and spectral band availability. We
evaluate here several spectral indices and discuss the results.
We propose simple algorithms for oil detection on ice. Our
study strongly suggests that an imaging spectrometer suits
very well to oil detection on sea ice. However usability of
satellite instruments like MODIS have serious limitations set
by the image resolution and band selection. Landsat ETM
has significantly better resolution and it is therefore more
suitable for most typical, small-scale pollution detection, but
its imaging frequency does not meet the monitoring demands.
I. INTRODUCTIONBaltic Sea is a unique ecosystem with original flora and
fauna. It is highly vulnerable to pollution, as its water change
with the Atlantic Ocean is limited and the sea itself is very
shallow. At the same time the Baltic Sea is an important
shipping route for the surrounding countries. This creates a
risk of pollution.
Small-scale oil pollution is one of most frequent problems
in the Baltic Sea. To avoid port waste taxes, some ships wash
their tanks on open sea and pump oily waste water directly to
the sea. This action is illegal, but due to insufficient monitoring
system, it happens frequently. Also the risk of large-scale oil
pollution catastrophe increases substantially during the coming
years as oil shipping volumes on the Baltic Sea increasewith new oil terminals. Rough sea, storms and difficult ice
conditions can damage tankers resulting in oil leakage to the
sea.
Remote sensing techniques are clearly in the position to
provide tools for monitor the sea better and combat with illegal
pollution. It has been shown in the early 1970’s [1] that radar
is an efficient tool for detection oil slicks on open water. SAR
can be used with good resolution from space regardless of
weather conditions as it sees through cloud cover. Today, fully
Fig. 1. MODIS image of Gulf of Finland 22. April 2003. Image size 100×100 km. The polluted area is marked by rectangle. R= band 1, G= band 2,B= (band 1 - band 2).
automated systems for oil spill detection from satellite imageshave been developed [2]. SAR is very sensitive to the surface
roughness and therefore can detect smooth oil film on the
surface of the water. However, on very rough surfaces like ice
and brash ice, oil detection with SAR is difficult. Here optical
instruments have an advantage over SAR. On optical images,
dark oil on white ice can be easily detected. Cold winter days
are often sunny allowing the use of optical sensors. However,
biggest risk for oil pollution occurs during bad weather and
rough sea, when optical instruments cannot be used. Therefore
the optical spectrometers are suitable mostly for pollution area
mapping after a disaster.
I I . MATERIAL
A relatively large oil pollution on sea ice was discovered
on 20 April 2003 in Gulf of Finland in the outskirts of
Helsinki. Pollution consisted of several smaller spills mainly
on ice and mixed with brash ice. A cleaning ship was sent to
clean the area on 21 April. The cleaning work was finished
on 23 April, when having cleaned approximately 2.5 km2
area. We acquired an airborne spectrometer (AISA) image
of the area on 22 April 2003 between 12:06 - 12:32 local
time. Imaging weather was cloudless and the sea was calm.

8/6/2019 Detection of Oil Pollution on Sea Ice With Airborne
http://slidepdf.com/reader/full/detection-of-oil-pollution-on-sea-ice-with-airborne 2/4
Fig. 2. Fragment of the airborne spectrometer image mosaic from contami-nated area.
400 450 500 550 600 650 700 750 800 850 900 9500
0.05
0.1
0.15
0.2
0.25
0.3
0.35
0.4
0.45
Wavelength (nm)
R e f l e c t a n c e
Clean iceClean waterClean brash iceContaminated ice
Fig. 3. Measuresd sample reflectance spectra for ice, water, brash ice and oilcontaminated ice. Yellow bars indicate Landsat ETM bands and green barsindicate MODIS bands in visible-NIR region.
The spectrometer image covered a 6 km2 area with a spatial
resolution of 1m by 1m. The image area covered contaminated
ice, contaminated ice brash ice, clean ice and clean water. The
image had 25 narrow spectral bands between 440 nm - 890 nm.
We calibrated airborne spectrometer images radiometrically
and made a mosaic. Radiance and reflectance at the sensor
level were calculated (for reflectance calculation, an upward-
looking sensor was used). Part of the image mosaic is shown
in Fig. 2. A cloud-free MODIS image of the target area was
available for 19, 20, 22 and 23 April. The MODIS image and
the polluted area are shown in Fig. 1. Landsat-7 ETM image
was available for 23 April 2003. All the material was geo-
referenced to Finnish coordinate system.
III. OIL RECOGNITION FROM THE IMAGES
A. Airborne spectrometer
From the airborne spectrometer image we collected sample
spectra for clean water, clean ice, clean brash ice, partly
contaminated brash ice, partly contaminated ice and fully
contaminated ice. Some of the collected reflectance spectra are
presented in Fig. 3. Fig. 3 shows that oil contaminated ice has
spectra characterized by high reflectance in the near-infrared.
As a contrast, clean open water, clean ice and clean brash ice
have always lower near-infrared (NIR) reflectance than green
reflectance. As it can be noticed, higher reflectance in NIR
region than in green spectral region, is characteristic only to
oil contamination. By using this spectral feature, a very simple
but effective classification algorithm can be created to detect
oil contamination on ice. If reflectance in the green band is
lower than reflectance in the near infrared band, the image
pixel contains oil contaminated ice, else pixel contain either
clean ice or clean water.RNIR > Rgreen⇒ OilRNIR < Rgreen⇒ Not oil
(1)
We found that for oil detection from airborne spectrometer
image reflectance at 842 nm and 552 nm are suitable and pro-
duce rather robust oil contamination estimate. The presented
algorithm does not depend on the general reflectance level of
ice. By applying Eq 1 to the spectrometer image sample in
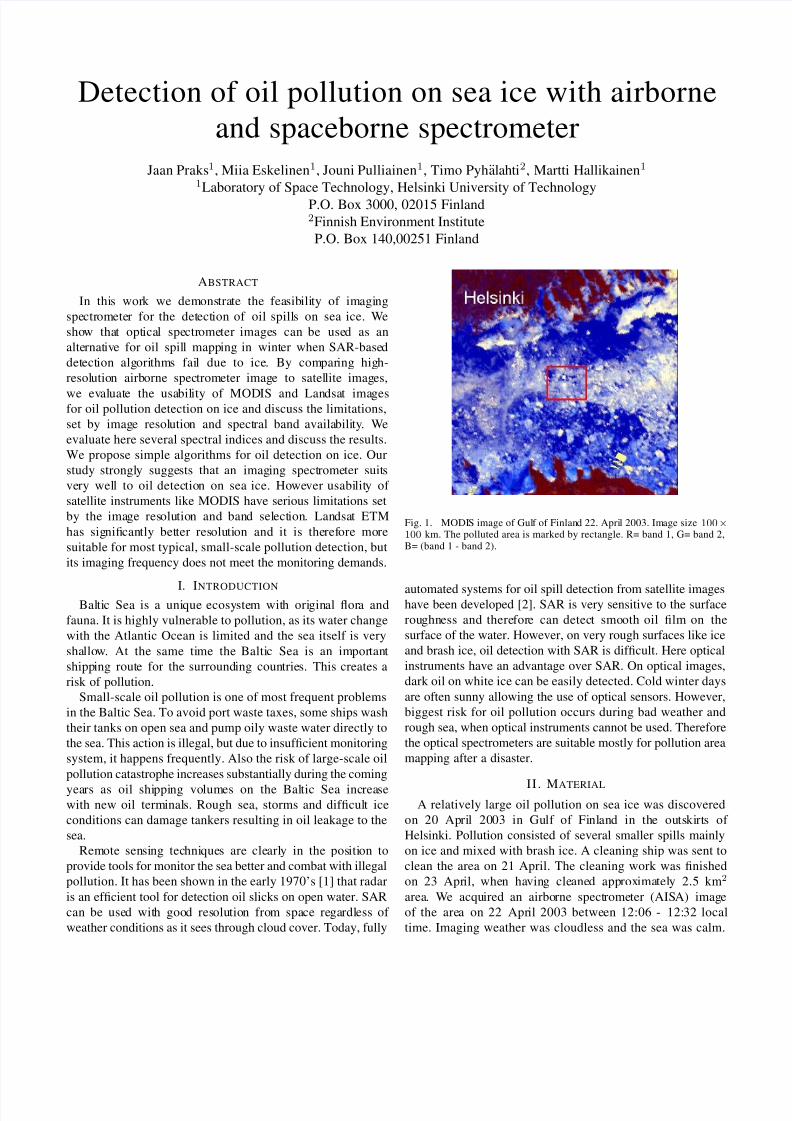
Fig. 4A, we get oil mask shown in Fig. 4B. White represents
oil contaminated ice and black is non-contaminated ice orwater. Comparison of images in Fig. 4A and Fig. 4B, that
the algorithm can find even small areas of contaminated ice
with high accuracy.
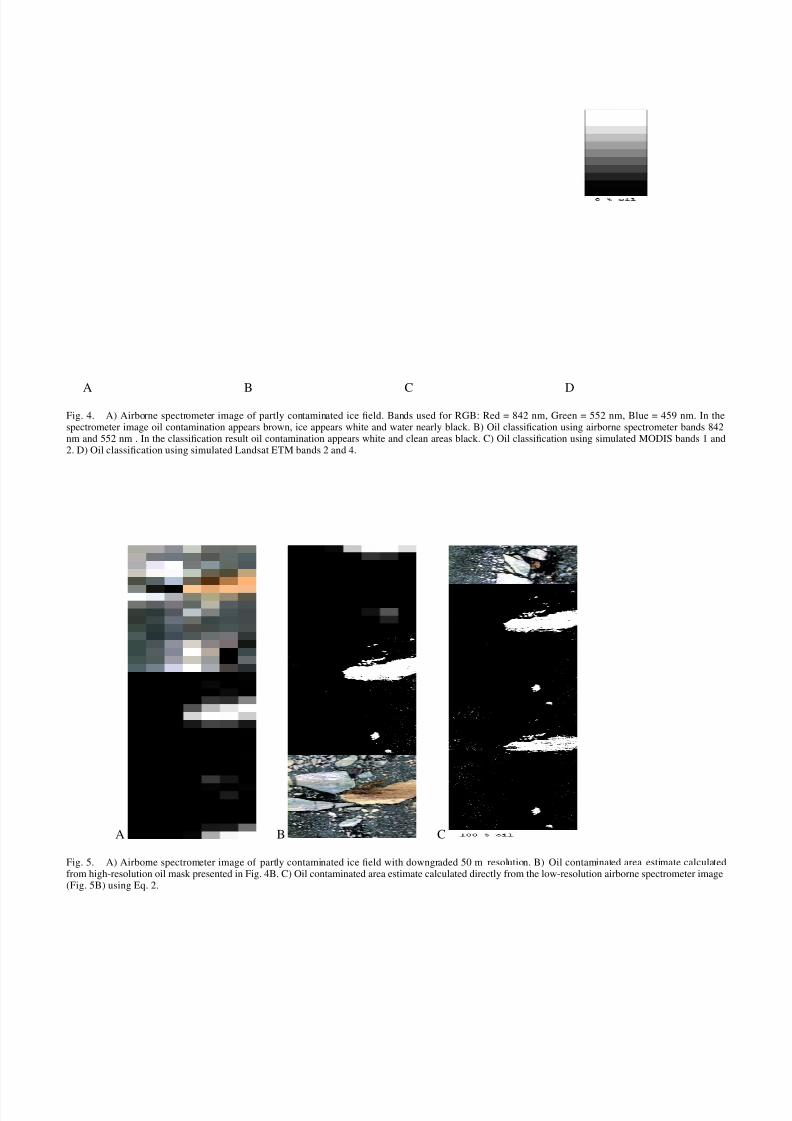
For satellite images with lower resolution, sub-pixel detec-
tion is important issue. We show here that at least for airborne
spectrometer images, spectral index (RNIR−Rgreen) can be
used to calculate oil contaminated ice area in sub-pixel level.
We studied sensitivity of the parameter to oil contamination
by using a simple spectral mixture model, where water, ice
and oil spectra are mixed according to area. Model simulation
shows that this simple difference spectral index can be used
to estimate the contaminated area well for both, clean ice -
contaminated ice and clean water - contaminated ice situation.To test the usability of this index, we have used a simulated
low-resolution dataset based on the airborne spectrometer
image. The resolution of the original image in Fig. 4A was
downgraded to 50 m by using cubic convolution. The resulting
low-resolution image is shown in Fig. 5A. By using the same
technique, also the resolution of the oil mask, shown in Fig.
4B, was lowered to 50 m. The resulting the low-resolution
oil mask is shown in Fig. 5B. A pixel value of low-resolution
oil mask represents directly oil contaminated area contribution
from pixel area. To show the usability of the presented spectral
index, the low-resolution oil mask was calculated also directly
from the low-resolution airborne spectrometer image by using
the following equation,
Areaoil = A ((R842 −R552) + B), (2)
where A = 1250 and B = 0.04. All negative values are
classified to clean ice or clean water and all positive values
give directly the fraction of the contaminated area inside
pixel (from 1% to 100%). Unfortunately, given constants
apply probably only for our samples and are sensitive to
reflectance calibration accuracy. The classification result in
8/6/2019 Detection of Oil Pollution on Sea Ice With Airborne
http://slidepdf.com/reader/full/detection-of-oil-pollution-on-sea-ice-with-airborne 3/4
A B C D
Fig. 4. A) Airborne spectrometer image of partly contaminated ice field. Bands used for RGB: Red = 842 nm, Green = 552 nm, Blue = 459 nm. In thespectrometer image oil contamination appears brown, ice appears white and water nearly black. B) Oil classification using airborne spectrometer bands 842nm and 552 nm . In the classification result oil contamination appears white and clean areas black. C) Oil classification using simulated MODIS bands 1 and2. D) Oil classification using simulated Landsat ETM bands 2 and 4.
A B C
Fig. 5. A) Airborne spectrometer image of partly contaminated ice field with downgraded 50 m resolution. B) Oil contaminated area estimate calculatedfrom high-resolution oil mask presented in Fig. 4B. C) Oil contaminated area estimate calculated directly from the low-resolution airborne spectrometer image(Fig. 5B) using Eq. 2.

8/6/2019 Detection of Oil Pollution on Sea Ice With Airborne
http://slidepdf.com/reader/full/detection-of-oil-pollution-on-sea-ice-with-airborne 4/4
Fig. 5C shows that the oil areas, estimated from the high-
resolution images, and low-resolution image are very similar.
Also (RNIR/Rgreen) could be used.
B. MODIS
The satellite based MODIS spectrometer is one of the
most interesting instruments for operative spectral monitoring
applications because its frequent coverage, good availability
and cheap image price. Unfortunately, the MODIS has ground
resolution only 250 m or more and its spectral band selection is
limited. Most interesting for our study are the high resolution
bands 1 (620-670 nm) and 2 (841-876 nm). Also bands 3-7 in
visible and infrared (IR) region with 500 m are interesting. To
study the MODIS usability for oil spill monitoring, we first
simulated the MODIS spectral configuration on the airborne
spectrometer images of oil contaminated ice. First, we applied
Eq 1 to the simulated MODIS spectral bands 1 and 2. Instead
of the green and NIR bands, we had to use here red and NIR
bands 1 and 2. As a result, we got oil mask shown in Fig.
4C. As it can be seen, bands 1 and 2 don’t provide same
sensitivity and robustness as green-NIR combination, but the
oil contamination can still be mapped. By using MODIS bands
2 and 4 we could have more sensitivity, but different ground
resolution of the bands cause difficulties. Next we applied the
algorithm to MODIS scenes taken on 19, 20, 22 and 23 April.
Although algorithm detects well islands and land, we could not
find any oil on the images in the known contaminated region.
This is probably due to poor ground resolution compared to oil
spill size. Contaminated areas were rather small, only tens of
meters wide and also spread to larger area. Oil spill detectable
with MODIS instrument should be rather hundreds of meters
in diameter. Using the band ratio based indices (RNIR/Rred)gave us very similar results.
C. Landsat ETM
The Landsat ETM instrument has much better ground
resolution than MODIS, 30 m. In the visible-NIR region it
has four spectral bands. For our study, ETM bands 2 (520-
600 nm) and 4 (760-900 nm) suite best.
First we studied airborne spectrometer images of oil spill
with simulated Landsat ETM spectral configuration. We ap-
plied Eq 1 to the simulated ETM spectral bands 2 and 4. As
a result, we got oil mask shown in Fig. 4D. By comparing
oil masks calculated from narrow airborne bands and from
wider Landsat bands, we can see that both perform equally
well. The Landsat ETM spectral configuration suits well for
oil mapping on ice. Next we applied the same algorithm to
Landsat ETM scene acquired 23 April. As for the MODIS
image, algorithm detects well islands and land, but we could
not find oil traces on contaminated region. Most obvious
reason for that is that most of the oil has been already cleaned
by 23. April. Remaining contamination was marginal and
apparently substantially smaller than Landsat ETM ground
resolution.
IV. CONCLUSIONS
Our study strongly suggests that an imaging spectrometer
suits very well to oil detection on sea ice, where SAR based oil
detection algorithms fail. Usability of satellite instruments like
MODIS have serious limitations set by the image resolution
and spectral band placement. For the larger scale disaster
mapping MODIS should suit well. The Landsat ETM has good
enough resolution for most typical, small-scale pollution detec-
tion. However, the Landsat imaging frequency does not meet
the needs of monitoring applications. Several algorithms for oil
detection on sea ice was proposed and evaluated. Algorithms
can produce oil contaminated sea ice area estimates for low-
resolution satellite images. However, contaminated area should
be at least 50% of the image resolution cell to be detected.
Proposed methods suit for operative oil contamination moni-
toring from airborne and spaceborne spectrometer images in
winter.
REFERENCES
[1] K. Krishen. Detection of oil spills using a 13.3-GHz radar scatterometer. J. Geophys. Res., 78(2):1952–1953, 1973.
[2] H. S. Storvik G. Solberg R. Volden E. Solberg, A. Automatic detectionof oil spills in ERS SAR images. IEEE Transactions on Geoscience and
Remote Sensing, 37(4):1916–1924, July 1999.