detecting weak signals by internet-based environmental
TRANSCRIPT
Detecting Weak Signals by Internet-Based
Environmental Scanning
by
Nasim Tabatabaei
A thesis
presented to the University of Waterloo
in fulfillment of the
thesis requirement for the degree of
Master of Applied Science
in
Management Sciences
Waterloo, Ontario, Canada, 2011
©Nasim Tabatabaei 2011

ii
AUTHOR'S DECLARATION
I hereby declare that I am the sole author of this thesis. This is a true copy of the thesis,
including any required final revisions, as accepted by my examiners.
I understand that my thesis may be made electronically available to the public.

iii
Abstract
Firms in highly dynamic environments focusing on innovation in their products and services,
often encounter elevated amounts of uncertainty regarding the future direction of technological
change. Finding reliable and imbedded information enhances a firm’s ability to tackle new markets
and take advantage of possible hidden opportunities. To reduce uncertainty, obtain hidden knowledge,
and gain competitive advantage, environmental scanning, which is one of the main components of
foresight, is recommended by scholars of strategic management. The process of detecting weak
signals for shedding light what one authority calls “blurry future zones” (Day & Schoemaker, 2005,
p.1) has currently been receiving attention in environmental scanning studies. Some studies
emphasize the importance of the subject; yet they offer few practical methodologies for actual cases.
To help address this gap, this research introduces a new approach for detecting weak signals during
Internet-based environmental scanning by applying the Cluto toolkit (see Section 4.7) plus using
human judgment. This novel methodology is applied to the application of Micro Tiles, a recent
innovative product of a digital display company located in Ontario, Canada, Christie Digital
Company.
In the conduct of this exploratory research, about 40,000 HTML pages were retrieved from
the Internet in a search during 2009. To extract weak signals information from the retrieved
unstructured texts, documents were grouped into a number of clusters by the CLUTO software. Two
subject matter experts compared and evaluated the cluster results for the purpose of finding
potentially relevant information in regard to the company’s strategic intent. Analyzing the clusters,
the experts reduced the number of clustered documents from the original corpus into smaller sets with
the goal of finding more relevant and unexpected documents (weak signals). The relevancy and
expectedness of information in documents were two measurements as related to weak signals. The
trends of the study indicate that as anticipated both experts found more unexpected documents in the
smaller sets rather than the larger ones. Moreover, regarding one expert’s analysis, the smaller sets
contain documents that are more relevant to the domain of interest. Overall, according to one expert,
documents existing in the smaller sets display more weak signals.
This emerging methodology offers a practical procedure to apply web-based information in
the development of a company’s environmental scanning procedures. Using this methodology,
managers can employ both computer tools and human sense-making methods to detect potential weak
signals and reduce certain biases in the detection process.
Keywords: environmental scanning, foresight, weak signals, document clustering, CLUTO

iv
Acknowledgements
I would like to express my humble gratitude to my supervisor, Paul Guild, whose
encouragement, support, and advice throughout my research work enabled me to develop an
understanding of the subject. In every step of this exploratory study, he explained his precious advice
and novel ideas clearly leading me through the final stages of the thesis. I am especially thankful for
his help throughout my thesis-writing period, and his advices for every wording of the thesis.
I also feel fortunately to have benefited from the expertise and support of my co-supervisor,
Doug Sparkes, in all aspects of the study. His directions, precious advices and efforts were valuable
and helpful in every stages of the thesis. Without his thoughtful ideas, it was impossible for me to
write this thesis.
I would also like to thank professor Clifford Blake, and professor OlgaVechtomova as my
thesis readers. Their experience in the subject broadened my perspective on the thesis. Their
comments on my thesis helped me to modify some aspects of the study.
Lastly, I would like to thank my research group member, Julio Noriega, for his endless,
humble and precious guidance from the early stages of the thesis.

v
Dedication
This thesis is dedicated to my father, who supported me in all aspects of my life, and to my
mother, for her motivation and encouragement.

vi
Table of Contents
AUTHOR'S DECLARATION ............................................................................................................... ii Abstract .................................................................................................................................................. iii Acknowledgements ................................................................................................................................ iv Dedication .............................................................................................................................................. iv Table of Contents .................................................................................................................................... v List of Figures ........................................................................................................................................ ix List of Tables .......................................................................................................................................... x Chapter 1 Introduction ............................................................................................................................ 1 Chapter 2 Literature Review ................................................................................................................... 5
2.1 Strategic Management .................................................................................................................. 6 2.2 Technology Foresight ................................................................................................................... 6 2.3 Environmental Scanning ............................................................................................................... 9
2.3.1 The Modes of Environmental Scanning .............................................................................. 11 2.3.2 Types of Environmental Scanning ....................................................................................... 12 2.3.3 Internet as an Environmental Scanning Tool ....................................................................... 13
2.4 Weak Signals .............................................................................................................................. 14 2.4.1 The Importance of Weak Signals Detection ........................................................................ 15 2.4.2 Role of the Internet in Weak Signals Detection .................................................................. 16
2.5 Web Mining and Web Information ............................................................................................. 16 2.5.1 Web Mining ......................................................................................................................... 17 2.5.2 Types of Web Mining .......................................................................................................... 17 2.5.3 Web Text Mining ................................................................................................................. 17 2.5.4 Definition of Data Mining ................................................................................................... 18 2.5.5 Differences Between Data Mining and Text Mining .......................................................... 18 2.5.6 The Process of Knowledge Discovery in Text .................................................................... 19
2.6 Document Clustering .................................................................................................................. 19 2.6.1 Forms of Document Clustering ........................................................................................... 20 2.6.2 Divisive Clustering .............................................................................................................. 20 2.6.3 Agglomerative Clustering .................................................................................................... 20 2.6.4 K-means Algorithm ............................................................................................................. 21 2.6.5 Vector Space Model ............................................................................................................ 21 2.6.6 Similarity Measurements ..................................................................................................... 22

vii
2.6.7 Bisecting K-means ............................................................................................................... 23 2.6.8 Clustering Performance ........................................................................................................ 23 2.6.9 Pre-Processing ...................................................................................................................... 23
Chapter 3 Propositions .......................................................................................................................... 25 Chapter 4 Methodology ......................................................................................................................... 29
4.1 Research Design .......................................................................................................................... 29 4.2 Queries ........................................................................................................................................ 30 4.3 Samples ....................................................................................................................................... 30 4.4 Analyzing Phase .......................................................................................................................... 31 4.5 Pre-processing Phase ................................................................................................................... 32 4.6 Doc2mat File ............................................................................................................................... 32 4.7 CLUTO ....................................................................................................................................... 33 4.8 Clustering Algorithm Parameters ................................................................................................ 34 4.9 CLUTO Input .............................................................................................................................. 34 4.10 CLUTO Output ......................................................................................................................... 35 4.11 Cluster Numbers ........................................................................................................................ 35 4.12 Cluster Algorithm ...................................................................................................................... 35 4.13 Cluster Criterion Functions ....................................................................................................... 36 4.14 Procedure ................................................................................................................................... 36 4.15 Judgment Procedure .................................................................................................................. 37
Chapter 5 Results .................................................................................................................................. 41 5.1 Descriptions of CLUTO Results - First Iteration ........................................................................ 41 5.2 Dropped Clusters by the Experts - First Iteration ....................................................................... 45 5.3 Remaining Documents – First Iteration ...................................................................................... 46 5.4 CLUTO Results - Second Iteration ............................................................................................. 46 5.5 Dropped Clusters by the Experts – Second Iteration .................................................................. 47 5.6 Remaining Documents - Second Iteration .................................................................................. 47 5.7 CLUTO Results - Third Iteration ................................................................................................ 48 5.8 Dropped Clusters by the Experts - Third Iteration ...................................................................... 49 5.9 Remaining Documents - Third Iteration ..................................................................................... 49 5.10 Statistical Analysis .................................................................................................................... 50 5.11 Summary of the Experts Judgments .......................................................................................... 50 5.12 Judgments’ Frequencies ............................................................................................................ 51

viii
5.13 Regarding Expert 2 Judgments ................................................................................................. 57 5.14 Regarding Both Experts’ Judgments ........................................................................................ 58
Chapter 6 Discussion and Conclusions ................................................................................................. 60 6.1 Limitations .................................................................................................................................. 62 6.2 Future Research .......................................................................................................................... 63
Appendix A : Micro Tiles ..................................................................................................................... 65 Appendix B : DEVONagent ................................................................................................................. 67 Appendix C : DEVONthink .................................................................................................................. 68 Appendix D : The Mathematical Definition of CLUTO’s Clustering Criterion Functions ................. 69 Appendix E : Forty-eight Queries Suggested by the Experts ............................................................... 70 Appendix F : Python Code for Removing the Clusters ........................................................................ 72 Appendix G : Keyword Description for Boolean Search ..................................................................... 73 Appendix H : Merging Scripts .............................................................................................................. 74 Appendix I : Convert HTML Pages to Plain Text Files ....................................................................... 75 Appendix J : Judgment Form for Evaluating the Web Pages ............................................................... 76 Appendix K : Sample A of the Web Pages ........................................................................................... 77 Appendix L : Sample B of the Web Pages ........................................................................................... 78 References ............................................................................................................................................. 79

ix
List of Figures
Figure 1: Literature Review Framework ................................................................................................. 5 Figure 2: A Successful Foresight Process ............................................................................................... 9 Figure 3: The Relation Between an Organization and Business Environment ..................................... 10 Figure 4: KDD Process ......................................................................................................................... 19 Figure 5: Close of Direct Interaction With Search Engine ................................................................... 31 Figure 6: Methodology .......................................................................................................................... 34 Figure 7: The Number of Documents Remaining After Each Reduction ............................................. 37 Figure 8: Document Reduction Flow Chart .......................................................................................... 38 Figure 9: Experts Judgments Procedure ................................................................................................ 40 Figure 10: Expert 2 Judgment for Relevancy of the Documents .......................................................... 53 Figure 11: Expert 1 Judgment for Relevancy of the Documents .......................................................... 53 Figure 12: Expert 2 Judgment for Expectedness of the Documents ..................................................... 54 Figure 13: Expert 1 Judgments for Expectedness of the Documents .................................................... 54 Figure 14a: A Unit of Micro Tile .......................................................................................................... 65 Figure 15b: An Example of a Micro Tile Display ................................................................................. 66 Figure 16a: Dimensions of Micro Tiles ................................................................................................. 66 Figure 17c: Micro Tiles Easy Wall Installation and Services ............................................................... 66

x
List of Tables
Table 1: Evolution of the Strategic Management System ...................................................................... 7 Table 2: Summary of Differences Between Forecasting and Foresight ................................................. 8 Table 3: Summary of CLUTO Output - First Iteration ......................................................................... 42 Table 4: CLUTO’s Report Regarding the Applied Method ................................................................. 43 Table 5: Part of CLUTO's Statistical Report ........................................................................................ 44 Table 6: Experts' Suggestions Regarding Removal of Clusters - First Iteration .................................. 45 Table 7: Remaining Documents - First Iteration .................................................................................. 46 Table 8: Summary of CLUTO Output - Second Iteration .................................................................... 46 Table 9: Experts' Suggestions Regarding Removal of Clusters - Second Iteration .............................. 47 Table 10: Remaining Documents - Second Iteration ............................................................................ 47 Table 11: Summary of CLUTO Output - Third Iteration ..................................................................... 48 Table 12: Experts' Suggestions Regarding Removal of Clusters - Third Iteration ............................... 49 Table 13: Remaining Documents - Third Iteration ............................................................................... 50 Table 14: Random Numbers Generated by Excel ................................................................................ 50 Table 15: Comparisons of the Experts’ Judgments With the Actual Database .................................... 51 Table 16: Summary of the Experts’ Judgments .................................................................................... 51 Table 17: Cross Tabulation Table for Relevancy of the Small, Medium, Large Datasets ................... 52 Table 18: Cross Tabulation Table for Expectedness of the Small, Medium, Large Datasets .............. 52 Table 19: Statistical Analysis for Comparing Two Judgments ............................................................ 55 Table 20: Kruskal-Wallis Test for Comparison of the Three Datasets ................................................ 57 Table 21: The P-values of Fisher Exact Test for Contingency Table Between Paired Variables ........ 58 Table 22: The P-values of Fisher Exact Test for Contingency Table Between Paired Variables ....... 59

1
Chapter 1
Introduction
Firms in highly dynamic environments focusing on innovation in their products and services
often encounter problems relating to rapid change and increasing discontinuities. There have been
various historical examples in which firms could not “sense and respond” (Haeckel, 2004, p.1) to
future changes, and therefore lost significant revenue. As Day and Schomakher (2005) discussed,
between 2001 and 2004, Mattel lost 20 percent of its worldwide share because of failing to recognize
the rapid maturing of preteen girls and their preference for dolls that look like their older siblings and
ideal pop stars rather than three-to-five-year-old children.
Due to environmental uncertainty, managers frequently have difficulties shaping companies’
strategies, and are thus unable to deal with strategic surprises (Schwarz, 2005). The major
responsibilities of today’s managers are to make decisions and to formulate and implement strategies
(Schwarz, 2009). In the domain of strategic management, a key effective strategic formulation and
means of comprehending future changes is to conduct environmental scanning (Abebe, Angriawan, &
Tran, 2010). The concept of environmental scanning was first introduced by Aguilar in 1966 “as the
acquisition and use of information about events, trends, and relationships in an organization’s external
environment, the knowledge of which assisted management in planning the organization’s future
course of action” (Aguilar, 1967; Choo & Auster, 1993; Choo, 2001, p.1). Various scholars have
studied the effects of environmental scanning on the performance of firms. Decker, Wagner, and
Scholz (2005) stated that, there is a strong relationship between environmental scanning and business
success. Environmental scanning has also been linked to improvement in organizational performance
(Choo, 1993).
One of the important fundamentals of conducting environmental scanning is detecting weak
signals of change. The weak signal concept was introduced by Igor Ansoff in 1975 to overcome the
problems of long-range planning. Weak signals are defined as “warnings (external or internal), events
and developments, which are still too incomplete to permit an accurate estimation of their impacts
and/or to determine their full-fledged responses” (Ansoff, 1982, p. 12). Detecting weak signals
enables firms to respond rapidly to environmental changes. By probing weak signals, firms are able to
be vigilant in avoiding possible surprises, and may be heedful of any signs of change, future threats,
and opportunities. An organization must scan the environment frequently to identify any signals of

2
change and carry out planning and actions in response to that change as early as possible (Ansoff,
1984, 1975). Weak signals detection will find future problem areas and opportunities. Nonetheless,
four questions still remain: How can firms detect early warning signs of coming changes? How can
they convert environmental threats into opportunities? Is there a support tool that can help managers
detect blind spots? Is there a way to find appropriate information for improved decision-making?
In a survey of high-tech French companies, Blanco and Lesca1 (1997) found that weak
signals detection was a major problem encountered by managers, and concluded that the use of
support tools would be helpful. Schwarz (2005) studied why implementation of weak signals in
German corporations failed, and discovered that the problems related to a:
Lack of participation of potential future users in the implementation phase, a lack of joint
understanding of the nature of trends, differing and unrevealed requirements of trends by
various interested parties, a broad misconception of the weak signals concept and trends, an
excessively heavy reliance on alleged hard data, a lack of interaction among users, and finally a
missing link to the strategic functions in an organization. (p. 22)
In strategic management literature, certain researchers have proposed practical methods for detecting
weak signals. Decker et al. (2005) performed a study to detect weak signals by conducting an
environmental scanning on the Internet, but his approach was limited to only 50 documents.
Similarly, Uskali (2005) tried to find weak signals in the financial news of one Finish daily
newspaper. Although Uskali argued that there were weak signals in the journalistic texts, he was
unable to propose a systematic approach for future research.
The role of the Internet in weak signals detection is significant. The World Wide Web is
considered a useful tool for detecting weak signals in environmental scanning processes (Decker et
al., 2005). External environmental information such as customer market, business, research institute,
journal article, politic, and technology is shown on the web, before its effects are observed in the real
world. Although the World Wide Web is a considerable source of information, observing significant
amounts of data on the Internet consumes much time and effort, which ultimately cannot be
accomplished by an ordinary person (Decker et al., 2005). As a result, the purpose of this research is
to propose a model for detecting weak signals of change during Internet-based environmental
scanning. The specific aim is to find public web pages containing weak signals related to the topic of
interest. This research sought information related to the potential applications of Micro Tiles for

3
digital media in theatre production. Micro Tiles is a recent innovative product of the Christie Digital
Company (see Appendix A). About 40,000 web pages related to the application of Micro Tiles were
retrieved from the Internet in 2009 for the purpose of finding weak signals in the corpus. The
relevancy and expectedness of documents were two measurements applied for defining weak signals;
that is, the more relevant and unexpected the document, the more it tended to be a weak signal. To
narrow the amount of retrieved information (from 40,000 webpages), methodological document
reduction was performed with both computer (CLUTO) and human judgment. CLUTO is a software
package applied for clustering huge numbers of documents. Two subject matter experts compared and
evaluated the cluster results for the purpose of finding any possible weak signals in regard to the
company’s strategic intent. Applying this method, the number of documents was reduced in three
iterations--from 38,030 to 12,789 to 7,718 and finally to 1,510 documents. To test the following
propositions, 40 sample web pages from the 38,030 text corpus (the large sample), 40 sample web
pages from the 7,718 text corpus (the medium sample), and 40 sample web pages from the 1,510 text
corpus (the small sample) were chosen randomly. These arbitrary samples were then shown to the
two experts who have specialized knowledge of Christie Micro Tiles and digital media for theater
production. The experts were asked to judge each web page in terms of relevancy and expectedness.
The experts (1 and 2) evaluated the documents independently, without any communication during the
procedure. Subsequently, the following propositions were expressed:
P1: After data reduction with CLUTO, human judgment can determine whether a randomly
drawn sample of documents comes from small, medium or large datasets.
P2: There is a relationship between data reduction and the perceived relevancy of the
documents (the smaller the dataset, the higher is the relevancy of the documents in the
dataset).
P3: There is a relationship between data reduction and the perceived expectedness of the
documents (the smaller the dataset, the higher is the unexpectedness of the documents in the
dataset).
P4: The ratio of relevant to irrelevant documents in the small dataset is greater than that in the
medium one.
P5: The ratio of relevant to irrelevant documents in the medium dataset is greater than that in
the large one.

4
P6: The ratio of unexpected to expected documents in the small dataset is greater than that in
the medium one.
P7: The ratio of unexpected to expected documents in the medium dataset is greater than that
in the large one.
After the evaluation by the judges, results indicated the following: according to Expert 2, the
distribution of relevant documents was not the same across the three databases. For the small
dataset the distribution of relevant documents was greater than that for the medium one, and
for the medium dataset, the distribution was greater than that for the large one, which
supported the propositions. According to Expert 1, the distribution of relevant documents was
the same across the three databases, which did not support the propositions. According to
both experts, the distribution of unexpected documents was not the same across the different
databases. For the small dataset the distribution of unexpected documents was greater than
that for the medium one and for the medium dataset, it was greater than that for the large one,
which again supported the propositions.
Although this exploratory study is limited to the involvement of just two experts and
one dataset, these trends suggest that the proposed model could be applied for detecting weak
signals of change in organizations. This research indicates that the proposed model reduced
the documents to the subset that contained more unexpected information, and implies that
environmental scanning on the Internet can be a useful tool for detecting weak signals of
future changes and should be adopted by firms that depend on their innovative capability.
The rest of the paper is organized as follows. Chapter 2 describes the academic
literature related to strategic management, foresight, environmental scanning, weak signals,
document clustering, and web mining. In Chapter 3, a hypothetical model is constructed to
test the feasibility of detecting weak signals in large document corpus. Experimental
procedures of a case study then were tested in Chapter 4. In Chapter 5, the results of the
analysis were presented. Finally, Chapter 6 summaries the key trends and offers some
suggestions for future research.

5
Chapter 2 Literature Review
The research question examined in the thesis is to better understand a business problem that
can be solved by computer science tools. The literature review consists of two parts. The first part
deals with the necessity of detecting weak signals toward “corporate foresight” (Rohrbeck, 2011, p.1),
with the ultimate goal of enhancing the strategic perspective of the firm, while the second part
introduces the main document-clustering algorithms. This chapter describes academic literature
within the following areas: strategic management, foresight, environmental scanning, weak signals
analysis, and web mining (Figure 1).
Figure 1: Literature Review Framework
Strategic Management
Analyzing External
Environment
Foresight
Environmental Scanning
Weak Signals Analysis
Web Mining

6
2.1 Strategic Management
Strategic management is a relatively new field of study and suffers from a lack of consensus
in terms of an exact definition. The concept originated for the most part in the middle of the 1960s
and early 1970s from various managerial perspectives (Pettigrew, Thomas, & Whittington, 2002).
Alfred Chandler realized the importance of looking at long-term perspectives in future studies and
emphasized the combination of different management areas (Chandler, 1962). Philip Selznick
suggested combining organizational internal factors with external ones and introduced SWOT
analysis to find strengths, weaknesses, opportunities, and threats to organizations (Selznick, 1957).
Igor Ansoff revolutionized the strategic management concept by defining the concept of “weak
signals” for the early detection of changes in the environment, and emphasized the use of continuous
scanning to have real time strategic vision (Ansoff, 1975). Ansoff introduced the concept of “strategic
issue management” as a way of responding to highly turbulent environments and summarized the
evolutionary phases of five modern management systems with their purposes, strengths and
limiations (Table 1). While debate still exists regarding a precise definition of strategic management,
the stance adopted in this paper mirrors that of Igor Ansoff as well as the following implicit
consensual definition by Nag, Hambrick, and Chen: “The field of strategic management deals with
the major intended and emergent initiatives taken by general managers on behalf of owners, involving
utilization of resources, to enhance the performance of firms in their external environment” (Nag et
al., 2007, p. 944).
2.2 Technology Foresight
In order to have a better strategic view of the firm and to survive in an increasingly
competitive environment, foresight processes have been widely recommended by most strategic
management scholars (Voros, 2003; Rohrbeck, 2011). Horton stated that “foresight is the process of
developing a range of views of possible ways in which the future could develop, and understanding
these ways sufficiently well to be able to decide what decisions can be taken today to create the best
possible tomorrow” (Horton, 1999, p. 1).
As Cuhls (2003) mentioned, the terms foresight and forecast have been used interchangeably
in most studies, even though there are remarkable differences between the two concepts.

7
In forecasting, only one possible option for the future is defined, as if there is only one present and
thus only one future. Today, the study of the future not only tries to predict the future, but also takes
an active role in shaping the future. Instead of having only one possible option for the future, in
foresight studies, different potential futures are assessed.
Table 1: Evolution of the Strategic Management System
Control
Long-
range
planning
Strategic
planning
Strategic
management
Strategic issue
management
Surprise
management
Purpose
Control
deviation
and
manage
complexity
Anticipate
growth
and
manage
complexity
Change
strategic
thrusts
Change
strategic
thrusts and
change
strategic
capability
Prevent strategic
surprises and
respond to
threats/opportunities
Minimize
surprise
damage
Basic
assumption
The past
repeats
itself
Past trends
continue
into the
future
New trends
and
discontinuities
Expect
resistance
New thrusts
demand, new
capabilities
Discontinuities are
faster than response
Strategic
surprises will
occur
Limiting
assumption
Change is
slower
than the
response
The future
will be like
the past
Past strengths
apply to
future thrusts
and strategic
change is
welcome
The future is
predictable
Future trends are
acceptable
Future trends
are
acceptable
Note. Adopted from Ansoff (1980, p. 13)
Typically, one option is selected, and the meaning of that option is interpreted for the current
situation. In this case, the organization could define how to change current strategies in order to reach
that option. Therefore, foresight is a flexible procedure with more open research questions being
shaped during the planning process. It is highly dependent on the opinions of experts and is generally
Periodic Real time

8
more qualitative than quantitative (Cuhls, 2003). The major differences between foresight and
forecasting are outlined in Table 2.
Table 2: Summary of Differences Between Forecasting and Foresight
Foresight Forecast
Basic points, needs, and research questions are still open
and looked for as part of the foresight process
Basic points, topics and research questions must be clarified
in advance
More qualitative than quantitative More quantitative than qualitative
Looks for ‘information’ about the future and for
networking, makes use of the distributed intelligence
Questions regarding what the future in the selected area
might look like
Brings people together for discussions about the future
and for networking, and makes use of the distributed
intelligence
More result-oriented, can also be performed by individual
people or in single studies (depends on methodology)
Criteria for assessments and preparation for decisions Not necessarily assessments, different options and choices
or the preparation for decisions
Communication about the future as an objective Describes future options; results more important than the
communication aspects
Long-, medium- and short-term orientation with
implications for today
The major points are long-, medium- and short-term
orientation as well as the path into the future
Finds out if there is consensus on themes No information about consensus necessary
Experts and other participants, very dependent on
opinions
Mainly ‘experts’ and/or strict methodologies, less
dependent on opinions
Note. Adopted from Cuhls (2003)
Horton (1999) defined three phases in the foresight process: inputs, foresight, and outputs or
actions. The first phase consists of collecting information from sources such as experts, publications,
reports, personal, or business networks. To gather information, Horton (1999) suggested various
methods, including environmental scanning, the Delphi method, and informal conversations. The
second phase consists of two categories: translation and interpretation. Translation involves
converting information summarized in phase one into the format that is comprehensible by the
organization. In this phase, the jargon and irrelevant information should be eliminated and the

9
essentials should be presented in the organization’s language. Interpretation is the crucial realm of the
foresight process and basically answers the question of “so what?” and recognizes what all the
information means for the organization. Interpretation consists of evaluating the retrieved knowledge
and testing various possible futures in the context of the organization. Using a third party in the
interpretation process is essential for identifying ambiguities, creative thinking, and posing questions
challenge managers perception. The third phase conveys the generated results in an appropriate
format to managers who have the authority to take actions in the organizations. The typical formats
are reports, seminars, informal networks, or roadmaps (Voros, 2003). A more detailed framework of
the foresight process is shown in Figure 2.
This research has been conducted with the aim of gaining technological foresight for strategic
management within the specified company. To reach this goal, environmental scanning procedures,
which are the main methods of providing input for the foresight process, have been applied. In the
next chapter, these environmental scanning procedures are briefly discussed.
Figure 2: A Successful Foresight Process
Note. Adopted from Horton (1999)
2.3 Environmental Scanning
As mentioned in Section 2.2, performing environmental scanning provides input for foresight
processes. In this section, the relation between organization and environment is defined. The
definition and modes of environmental scanning are then explained.
Government
Networks
Experts
Literature
Customers
Research
Suppliers
Surveys
Universities
Activities
Skills
People
Tools
Workshops
Reports
Networks
Phase One: Inputs
Phase Two: Foresight
Phase Three: Outputs
and Actions
Knowledge Understanding

10
Many scholars have been trying to understand the relation between organizations and the
environment. Kahalas (1977) was a pioneer in connecting system theory with organizational theory.
Subsequently, many scholars have viewed organizations as open systems that continuously exchange
inputs and outputs with the environment (Kahalas, 1977; Choo, 1995). To better understand the
relationship between organizations and the environment, Liu (1998) refered to Porter’s view of an
organization and presented clearly the interaction between the organization and the environment, as
shown in Figure 3 (Porter, 1985, 1991).
Figure 3: The Relation Between an Organization and Business Environment
Note. Adopted from Liu (1998)
As defined in Figure 3, the environment provides the input for the organization, including
resources, labor, capital, raw material, and energy. The environment also defines the potential market,
imposes constraints, and provides information for the strategy processes of the organization. This
environmental information is the main consideration of this study. Simultaneously, the organization
also affects the environment by producing scarce products and giving services. In the open system
view of the organization, the environment affects and is affected by the organization in a “continuous
interactive process” (Liu, 1998, p. 296). This environmental information is the key element of the
environmental scanning process, and the basic concept of this research. The environmental scanning
concept was first introduced by Aguilar (1967) and is now understood to be “the acquisition and use
of information about events, trends, and relationships in an organization’s external environment. The
knowledge of this assists management in planning the organization’s future course of action (Aguilar,
Business Environment
Social Forces
Natural Forces
Industrial and
Competitive Forces
Organization
Structure
Strategy
Resource
Process
Culture
Performance
Inputs
Resources
Demands
Constraints
Information
Products and Services
Influence on the Environment
Outputs

11
1967; Choo & Auster, 1993; Choo, 2001, p. 1). This process of gathering and analyzing information
from a company’s external environment includes social, regulatory, technological, political,
economic, and industrial areas.
Organizations scan the environment in order to reduce “chances of being blind-sided in the
marketplace, avoid possible surprises, identify threats and opportunities, gain competitive advantage,
and improve long- and short- term planning” (Albright, 2004, p. 40; Choo, 2001, p. 1).
In the last couple of decades, scholars have studied the effects of environmental scanning on
organizational strategy and performance. Choo and Auster (1993) and Daft, Sourmunen, and Parkes
(1988) found that managers who perceive greater environmental uncertainty tend to do more
scanning. Based on evidences from literature, Choo (2001) concluded that environmental scanning is
linked to improved organizational performance. In a recent survey of 84 Southern Nigerian
companies, Olamadea, Oyebisib, Egbetokuna, and Adebowa (2011) found that the basic objectives of
environmental scanning for 94 percent of organizations were to reduce uncertainty, test the
appropriateness of actions already taken, and update existing knowledge. Monitoring and analyzing
the environment helps the firm to find technological and market opportunities and therefore can
increase the ability of firms to enter new domains (Daft et al., 1988). Danneels (2008) discovered that
environmental scanning positively influences the ability of a firm to build new competencies by
building the basis for managing discontinuous change. Zahra and George (2002) stated that
“absorptive capacity is the ability of the firm to recognize the value of, acquire, assimilate, and apply
knowledge from external sources” (p. 186). This capacity can be increased by environmental
scanning processes (Cohen & Levinthal, 1989). Environmental scanning brings information from
various sources into the firm, which increases the knowledge of the firm and helps employees to find
new opportunities (Damanpour, 1991). However, scanning not only enhances the organizational
performance, but also increases the level of communication among employees. Consequently,
according to Choo (2001), scanning has impact on four areas of the organizations: communication of
shared vision, strategic planning, management, and future orientations.
2.3.1 The Modes of Environmental Scanning
Organizations gather information about their environment by various channels, including
personal relationships with colleagues and knowledge experts, trade and professional literature, and
by participating in professional and trade activities (Danneels, 2008).

12
Daft and Weick (1984) stated that depending on managers’ beliefs, organizations interpret the
environment in two diverse ways: first is the analyzability of the external environment, and second is
“the extent to which an organization intrudes into the environment to understand it” (Daft & Weick,
1984, p 288). Since organizations may vary in their beliefs toward analyzability and the degree of
intrusiveness into the environment, four patterns of environmental scanning have been defined:
undirected viewing, conditioned viewing, enacting and searching (Daft & Weick, 1984; Augilar,
1967).
Undirected viewing is the form of scanning by which companies perceive the environment as
un-analyzable and therefore seek information without any specific purpose. This kind of scanning is
casual, with managers finding information through their personal contacts and sometimes by chance.
Another form of scanning is conditioned viewing, by which organizations perceive the environment
as analyzable but are unable to perform active searching; in this kind of scanning organizations rely
on their initial documentation, reports, and publications that have grown over time, and because in
some periods they found that this information was useful to them, they now are conditioned to use it.
Enacting is the form of scanning by which an organization perceives the environment to be un-
analyzable, yet intrudes into the environment to affect it. In this form of scanning, organizations
experiment and test the environment and modify their traditional beliefs about the environment. In
this mode, organizations want to create the potential market instead of finding the market demands.
The final form of scanning is discovering which takes place when the organization perceives the
environment to be analyzable and actively tries to collect information from the environment. In this
form of scanning, managers purposefully seek information about a specific issue (Daft & Weick,
1984; Aguilar, 1967).
This thesis considers the last two forms of scanning (enacting and discovering) to be the
target forms of scanning.
2.3.2 Types of Environmental Scanning
There are various means of scanning the environment. The use of a specific information
source by managers is often related to its accessibility (Choo, 1993). Managers perform
environmental scanning via face-to-face interaction and telephone communication. They may also
perform impersonal environmental scanning by reading newspapers, magazines, company reports,
television broadcasts and online databases. Research has found that executives’ external networks and

13
personal contacts are the main sources for obtaining information (Aguilar, 1967; Daft et al.,1988).
However, these forms of scanning are less than systematic and may lead managers to make wrong
decisions. Nowadays, using the Internet to acquire information from companies’ environments has
become dominant.
2.3.3 Internet as an Environmental Scanning Tool
The Internet continues to be an exciting information source for many companies. The
acquisition of vast amounts of information available on the Internet has grown dramatically. By using
the Internet for environmental scanning, organizations can get diverse information free of charge.
Studies have assessed the impact of using Internet sources on varying organizational aspects. Teo and
Choo (2001) found that the Internet has a positive impact on the quality of competitive intelligence
information and ultimately on organizational strategic benefits. Perry, Taylor, and Doerfel (2003)
examined how organizations integrate the Internet in crisis situations and found that it can help
organizations with conducting better environmental scans and finds much more useful information
than they obtain from traditional sources, thus aiding in preparation for possible crises. Alallak (2010)
described the Internet as a useful marketing tool, one which helps organizations to collect information
from customers for better and faster customer value. Although the market environment has strategic
importance for organizations, environmental scans on the Internet should not be restricted to the
market environment (Tan, Teo, Tan, & Wei, 1998; Decker, Wagner, & Scholz, 2005). For example,
organizations should scan their customers and their competitors in order to understand what their
customers want and what their competitors offer.
Decker et al. (2005) noted that trends in political, social, technological, and other trends are
on the Internet before their consequences become clear to the public. However, managers typically
avoid performing systematic environmental scans because, in their opinion, the process might be too
complex or the organization might encounter information overload. Nevertheless, it is argued that
using the Internet in overall business strategies and competitive markets, companies may increase
revenues, reduce their costs, and promote managerial effectiveness (Teo & Choo, 2001). Therefore,
organizations that frequently carry out environmental scanning on the Internet are likely to be better
at responding to environmental changes (Tan et al., 1998).
The aforementioned reasons found in the literature were the main incentives to conduct an
Internet-based environmental scanning procedure.

14
2.4 Weak Signals
Ansoff (1975) introduced a concept called weak signals for preventing long-range-planning
or strategic-planning problems (Kuosa, 2010; Ilmola & Kuusi, 2006). Ansoff (1982) defined weak
signals as “warnings (external or internal), events and developments, which are still too incomplete to
permit an accurate estimation of their impact and/or to determine their full-fledged responses” (p. 12).
According to Ansoff (1975), for a firm to be able to respond rapidly to uncertain environment, it
should be prepared ahead of time to respond to any signs of information about possible threats and
opportunities; if the firm waits until the information becomes adequate enough for all to respond, it
may encounter the crisis. On the other hand, if it accepts vague information, the information may not
be complete enough to support strategic planning. To overcome this problem, the organization must
scan the environment frequently to identify any signal of change and make feasible plans and actions
as early as possible (Ansoff, 1984; 1975).
Ansoff (1975) categorized information into two groups: strong signals and weak signals.
Weak signals can become clearer and strengthen over time to become strong signals or they might
vanish. Ansoff (1984) introduced three filter mechansims that organizations may apply to make sense
of weak signals. According to Rossel (2009), organizations may transform the flow of perceived
signals into knowledge by using the following filters:
1) An observation filter (or surveillance filter) defines the area for observing and collecting
data and includes methods of information acquisition.
2) A cognitive filter (also called a mentality filter) defines the area for evaluating the
information that is passed from the first stage and is relevant to the firm.
3) A power filter is applied when the managers, players, or decision makers of the
organization come together to determine and analyze information that is passed from the last
two stages.
In other words, the filters outline three steps in detecting weak signals. These steps include
the selection of the data, the sources of information, the domain in which weak signals should be
defined, and in the interpretation phase, how managers or experts should make sense of the signals.
Although Ansoff’s weak signals theory has contributed to the development of the strategic
management field, other researchers have also focused on this issue in recent decades. Ilmola and

15
Kuusi mentioned that the “weak signals approach is experiencing a renaissance in strategic planning”
(Ilmola & Kuusi, 2006, p. 908). Still, there are major problems related to the description,
interpretation, and detection of weak signals. No specific procedure, definition, and practical example
related to this concept exists in the literature (Hiltunen, 2008). Uskali (2005) offered different
definitions of weak signals in the literature such as “a sign, which is slight in present dimensions but
huge in terms of its virtual consequence”, and “a factor for change hardly perceptible at present, but
which will constitute a strong trend in the future” (p. 4). Hiltunen (2008) also provided other names
for weak signals, including wild cards, seeds of change, emerging issues, and early indicators.
Although the role of weak signals has been emphasized in futures studies, their detection does
not guarantee success. Use of weak signals depends mainly on the observer’s mindset and hence is
more subjective than objective; therefore, weak signals will not exist without a receiver’s attention
(Hiltunen, 2008). Decker et al. (2005) stated that “a challenge in weak signals detection results from
the fact that the originators of fragmented information are probably outsiders to the organization in
question, and even to the industry under consideration” (p. 191). Moreover, the receivers, managers in
organizations, are biased and they tend to observe strong signals rather than weak ones (Decker et al.,
2005; Blanco & Lesca, 1997; Hiltunen, 2008).
In a survey of high-tech French companies, Blanco and Lesca1 (1997) found that weak
signals detection was a major problem encountered by managers and that the use of a support tool
would be helpful. Moreover, although weak signals may be recognized in organizations, managers
may not act on such signals because they do not wish to cope with potential consequences; therefore,
they may be more ready to disregard the information (Blanco & Lescal, 1997).
2.4.1 The Importance of Weak Signals Detection
According to Reger, the following are the main reasons for paying attention to early
indication of future changes in technological developments/trends:
“1-Increasing speed of innovation and product life cycles
2-Globalization of markets and technology
3-Growing R&D expenditures to come to a new product or process and the risk of
misdirected spending

16
4- Diffusion of new technologies developed in certain branches into other ones and the
fusion of different technologies” (Reger, 2001, p. 533).
2.4.2 Role of the Internet in Weak Signals Detection
Day and Schoemaker (2005) have suggested that firms monitor blogs, chatrooms and
websites when collecting information from customers and complainers and, in this way, develop
better peripherial vision. Managers should also pay attention to employees’ suggestions, lost-sales
reports, and postmorterms on contracts won by competitors to find useful information. The World
Wide Web is considered to be a valuable tool for detecting weak signals in environmental scanning
processes (Decker et al., 2005). Information about the external environment including, customers
markets, businesses, research institutes, journal articles, politics, and technology is available on the
web long before its effects are observed in the real world. However, the huge amount of information
on the public web is hazy and noisy, and it consumes time to find the right information through
regular search engines such as Google or AltaVista (Decker et al., 2005).
Therefore, in this research, environmental scanning of the public web was considered to be
the main method for detecting weak signals. To analyze the information on the web, web mining, text
mining and document clustering techniques were applied; the following sections of the literature
review include a general clarification of web mining and knowledge discovery methods from the web.
2.5 Web Mining and Web Information
With the huge amount of information available online, the World Wide Web is one of the
largest sources from which organizations can gain useful information from customers, competitors,
and the external business environment, and from which to gain perspective for business decision-
making (Purandre, 2008). The fact that the web is popular, dynamic, huge, and convenient causes the
problem of information overload, which makes it difficult to find relevant information and to create
new knowledge out of the available information (Kosala & Blockeel, 2000; Kobayashi & Takeda,
2000). To find relevant information, a user can put the particular query into the desired search
engines, and the query response is a list of web pages that are similar to the user’s topic. However, the
retrieved results often have two key problems: low precision and low recall. Precision refers to the
portion of retrieved documents that are relevant. Recall refers to the portion of relevant documents
that are retrieved. Low precision is the user’s inability to find the relevant information from the
retrieved documents and low recall is the user’s inability to retrieve all the relevant documents.

17
Fortunately, web mining techniques can be used to help solve the above problems (Kosala &
Blockeel, 2000).
2.5.1 Web Mining
Web mining is the “use of data mining techniques to automatically discover and extract
information from Web documents services” (Kosala & Blockeel, 2000, p. 2). It overlaps heavily with
information retrieval, machine learning, statistics, pattern recognition, and data mining (Chakrabarti,
2003).
2.5.2 Types of Web Mining
It has been shown that web mining can be divided into three types (Purandre, 2008):
• Web Usage Mining
This is the process of understanding usage history on the Internet such as how many
times the link has been observed, which web pages users have seen or what people
have done after leaving a particular pages.
• Web Structure Mining
To understand the similarity between sites, web structure mining is used to analyze
the nodes and connections among websites and discover and make patterns from the
structure of the webpages based on the hyperlinks within them.
• Web Content Mining
This is the process of finding useful information from unstructured text files, audio
files, images, videos and hyperlinks on the web. Web text mining is one of the most
popular research areas of web content mining and overlaps with information
retrieval. This research addresses web text mining.
2.5.3 Web Text Mining
Text mining, a relatively new research area, is a particular form of data mining (Zanasi,
2002). It is the process of extracting information from large collections of unstructured text
documents. More than 80 percent of information is stored in text; therefore, text-mining techniques
are extremely beneficial for business purposes (Gupta & Lehal, 2009). With an enormous amount of

18
information available on the web, text mining is growing rapidly and has been given wide attention.
Web text mining includes mining, extraction, and integration of useful data, information, and
knowledge from web page contents (Castellano, Mastronardi, & Tarricone, 2007). Although text
mining and data mining have differences, their basics are similar. In the following sections the
definition of data mining is first addressed. Following this, the differences between data mining and
text mining are described.
2.5.4 Definition of Data Mining
Fayyad, Piatetsky-Shapiro, and Smyth (1996) defined Knowledge Discovery in Databases
(KDD) as the “nontrivial process of identifying valid, novel, potentially useful, and ultimately
understandable patterns in data” (p. 2). From their point of view, KDD is the overall process of
discovering useful information from data, while “data mining is a step in the KDD process that
consists of applying data analysis and discovery algorithms that, under acceptable computational
efficiency limitations, produce a particular enumeration of patterns (or models) over the data” (p. 41).
The KDD process typically contains the following steps: data selection, pre-processing,
transformation, data mining, and interpretation of results (Fayyad et al., 1996).
Data selection is the process of selecting the database to be analyzed. Pre-possessing includes
data cleaning and removing noise from data. Transformation is reducing data and finding useful
features related to the goal of the project. The next step is finding the appropriate data mining rules
such as classification or clustering, and the last step is interpreting the detected patterns by data
mining processes or visualization of the extracted pattern (Fayyad et al., 1996). The KDD process is
shown in Figure 4.
2.5.5 Differences Between Data Mining and Text Mining
Data mining methods require relational databases, highly structured formats for data, and
extensive data preparation. Text mining methods aim at discovering knowledge from unstructured
data such as e-mails, full-text documents and HTML files (Gupta & Lehal, 2009). Since a text mining
process is relatively similar to a data mining process, Fayyad’s (1996) steps of the KDD process are
applicable to text mining. In this research, KDD steps were applied for extracting knowledge from
HTML files.

19
Figure 4: KDD Process
Note. Adopted from Fayyad et al. (1996)
2.5.6 The Process of Knowledge Discovery in Text
Document collection: Like data selection in KDD steps, this is the process of selecting and
collecting documents that are required to be analyzed (Fan, Wallace, & Rich, 2006).
Preprocessing: This is the process of transforming documents into the appropriate format for
analyzing. This step varies depending on the purpose of analysis and the characteristics of the
documents (Fan et al., 2006).
Text mining: This concerns using different algorithms to extract information from the text.
Text mining includes various techniques such as feature extraction, clustering,
summarization, text categorization, text association, or information visualization (Choudhary,
Oluikpe, Harding, & Carrillo, 2009). In this study, document clustering is used for text
mining purposes.
2.6 Document Clustering
Document clustering is one of the most applicable methods of text mining and used to group
large amounts of documents into a number of clusters. During clustering, documents are partitioned
into disjoint subsets of clusters so that the documents in each cluster are similar to one another, and
the documents of each cluster are very different from those of other clusters (Vidhye & Aghila,
2010). In clustering, a document set is based on unsupervised data, which means that no training set is

20
required; hence, there is no clear objective of a perfect clustering method (Croft, Metzler, & Trevor,
2010).
2.6.1 Forms of Document Clustering
Generally, two types of clustering algorithms have been found: hierarchical and partitional.
Hierarchical approaches produce clusters in a nested sequence of partitions. Therefore, the result of
hierarchical clustering can be displayed as a tree, called a dendogram. Dendograms can show the
merging splitting process (Steinbach, Karypis, & Kumar, 2000). In partitional clustering, a desired
number of clusters are initially defined. Each object is assigned to one cluster until the appropriate
objective function is optimized.
The differences between these methods relate to the performance of their objective functions.
In both methods, an algorithm begins with the initial number of clusters and then tries to improve the
clustering performance by changing the relevant objective function (Croft et al., 2010).
There are generally two types of algorithms for each clustering type, and they are briefly
explained in the following sections.
Hierarchical Clustering
2.6.2 Divisive Clustering
Divisive clustering is a top-down approach, which begins with a whole set of documents as a
single set of clusters. It then partitions documents into two or more clusters until it reaches a total of
K clusters (Croft et al., 2010)
2.6.3 Agglomerative Clustering
Agglomerative clustering is a bottom-up approach, which begins with each document as a
separate cluster. It then joins two or more clusters to form a new cluster until there are a total of K
clusters (Croft et al., 2010).

21
Partitional Clustering
2.6.4 K-means Algorithm
In the K-means algorithm, the number of clusters at the beginning and at the end does not
change. Therefore, the clustering algorithm starts and ends with K clusters. In every single iteration,
each document is either kept in the same cluster or assigned to a different cluster until the K clusters
are reached. It has been found that partitional clustering algorithms, of which the classical example is
K-means, perform better for large document datasets because of their low computational requirements
(Cutting, Pederson, Karger, & Turkey, 1992; Steinbach et al., 2000). Due to the large document
dataset, in this study, the K-means algorithms associated with the application software are used. The
following steps illustrate the logic behind the K-means clustering.
1- Select K points as the initial centroids
2- Assign all points to the closest centroid
3- Recompute the centroid of each cluster
4- Repeat steps 2 and 3 until the K clusters are reached.
2.6.5 Vector Space Model
In most clustering algorithms, documents are represented using a term frequency-inverse
document frequency (tf-idf) vector-space model (Salton, 1989). A vector space model is an algebraic
way of representing text documents in a matrix format for automatic indexing. In a vector space
model, a set of n documents with m terms is represented as n×m term document matrix. Terms are
defined as a set of documents’ words. Each document corpus contains distinct words and each
dimension relates to a separate term. Each document ! is represented as a vector ! in the term-space.
Q is the set of corpus words.
Usually each document is represented by its weight factors. The weight factor is used to
represent a document in a mathematical format based on the frequency of the words occurring in a
document and the length of the document. Therefore a tf-idf (term frequency-inverse document
frequency) is used as a statistical weight measurement.
€
d j = (w1. j ,w2. j ,w3. j ,...,wm. j )q = (w1,q,w2,q,...,wm,q )

22
!!" = !"!"×!"#!!
where
!!" = weight of term !! in document !!
!"!" = frequency of term !! in document !!
! = number of documents in collection
! = number of documents where term !! occurs at least once
By using the above equation for finding documents’ term weights, each document vector is
normalized by its unit length.
2.6.6 Similarity Measurements
A critical goal in document clustering is locating the similarities between documents. There
are two main approaches for finding document similarities: the first method discovers the distance
between documents, called the Euclidean distance. The second method calculates the cosine function
between documents (Zhao & Karypis, 2004). Finding the cosine similarities between documents is
more common, and computes the cosine of angles between the vectors of documents (Andrews &
Fox, 2007). In this study, the cosine similarity between documents was used, as explained in the
methodology section. The following equation is utilized to find the cosine measure between the
documents:
cos !!,!! = (!!,!!)!! . !!
where
dot is the vector dot product and
is the length of the document
In K-means clustering, the centroid of the documents in each cluster must be calculated.
According to Steinbach et al. (2000), using the mean as the centroid for computing the documents in a
K-means algorithm is easier than using the median, although calculating median is also acceptable. In
a K-means algorithm, the following equation is used to find the centroid of a set of documents (!):
Where
is the set of documents €
c =1S
dd∈S∑
€
S

23
d represents each document
Calculating the cosine similarity between the cluster centroid and a document is similar to
calculating the average similarities between the document and all other documents in the cluster.
Therefore, the following equations are used in the K-means algorithm to discover the similarity
between two centroid vectors and between the documents in a centroid vector (Steinbach et al., 2000).
cos !, ! = (!,!)! !
cos !!, !! = (!!,!!)!! !!
2.6.7 Bisecting K-means
A bisecting K-means algorithm initially splits the documents into two clusters and then
further splits the documents from one of the clusters until the K clusters are reached.
2.6.8 Clustering Performance
Clustering evaluation is another challenging issue in document clustering. There has been
little agreement among scholars on the best clustering algorithm (Andrews & Fox, 2007). Generally,
research has been shown that a hierarchical algorithm produces better results but takes more time and
space. It is often not practical for large document collections. A K-means algorithm has been
demonstrated to reach the optimum solution faster, and so is more practical for large document
collections but produces lower quality results (Steinbach, et al. 2000; Chakrabarti, 2003). Steinbach,
et al. (2000) found that a bisecting K-means could produce clusters that perform better than those
produced by regular K-means and those produced by agglomerative hierarchical clustering
techniques. K-means is a simple clustering algorithm that runs quickly but is sensitive to its initial
seed; however a bisecting K-means algorithm can overcome this problem. Based on the above
information from the literature, K-means and bisecting K-means algorithms were used in this study.
2.6.9 Pre-Processing
Pre-processing is used to reform a dataset into a format that is appropriate for clustering. Pre-
processing steps take a text file as an input and give tokens (terms) as an output. In this way the text is
ready for building a vector space model (Andrews & Fox, 2007). Pre-processing contains several
steps:

24
Term Filtering: This includes removing punctuation and characters that will not give useful
information.
Tokenization: This “splits sentences into individual tokens, typically words. More sophisticated
methods, drawn from the field of Natural Language Processing (NLP), parse the grammatical
structure of the text to pick out significant terms or chunks (sequences of words), such as noun
phrases” (Andrews & Fox, 2007, p. 6).
Stemming: This is the process of reducing words to their root forms. For example, “constructing”,
“construction” and “constructed” are all similar to the stem “construct”. There are several stemming
algorithms. For example, Porter’s stemming algorithm is a standard one that is used in this study.
Stop Word Removal: “Stop words” are typical words that carry less important meaning than
keywords. For example, “a”, “an”, “the” are common stop words.
Pruning: Some words in documents occur rarely, although they might convey important messages.
In pruning, these words are removed based on a pre-defined threshold (Andrews & Fox, 2007).
In this study, the pre-processing steps were used. The details are discussed further in the
methodology section.

25
Chapter 3
Propositions
The importance of detecting weak signals by conducting systematic environmental scanning
has been discussed in Section 2.4.1. In highly uncertain environments, accessing reliable and
imbedded information will enhance a company’s capabilities to tackle new markets and take
advantage of possible hidden opportunities. Consequently, it is increasingly important for innovative
firms to find new information and detect weak signals of change because, as Vasudeva and Anand
(2011) argued, ground-breaking firms often encounter high amounts of uncertainty regarding the
future direction of technological change (as cited in Henderson & Clark, 1990; Tushman & Anderson,
1986).
Innovation is a critical step in the performance capabilities of firms, enabling the ability to
cope with a turbulent environment and gain competitive advantage (Zhaou & Wu, 2010). When
surrounded by a dynamic environment and restricted to only internal organizational knowledge, it can
be challenging for managers to make sense of the future market for their products.
Scholars have suggested that the required knowledge for innovative firms mostly exists
outside of a firm’s technical expertise (Vasudeva & Anand, 2011); hence, it would be advantageous
for managers in highly changeable environments to have so called “peripheral vision” (Day &
Schoemaker, 2005). The greatest challenge faced by companies in developing their peripheral vision
is detecting weak signals, which stands for the “blurry zone at the edge of the organization’s vision”
(Day & Schoemaker, 2005, p. 1). One hypothetical approach is to guide the firm toward the seeking
of new, reliable, and external information which could enhance absorptive capacity and ultimately
increase innovation capability (Vasudeva & Anand, 2011). Absorptive capacity is the “ability of the
firm to recognize the value of the new information, assimilate it, and apply it to the commercial end”
(Cohen & Levinthal, 1990). This ability is a critical driver, implying that for a firm to be inovative, it
must build a robust level of prior related knowledge. According to the authors, this prior knowledge
refers to an awareness of scientific or technological improvements in the field. Cohen and Levinthal
(2009) pointed out that building absorptive capacity depends upon individuals’ absorptive capacity
and the transformation of knowledge between individuals and subunits of the organization. The
authors explained that some sort of overlap between indivudals’ knowledge enhances effective
communication, while diversity of knowledge is needed because varied problem solving abilities,

26
learning skills, and mindsets will yield innovation and allow indivuals to make “novel linkages and
connotations” (Cohen & Levinthal, 1990 , p. 131).
The model proposed in this study explores the possibility of detecting weak signals of
technological change by conducting environmental scanning of the public web, and then performing
data reduction using clustering techniques (CLUTO) along with human judgment. Just as with a proof
of concept, the aim was to investigate the feasibility of the proposed model and some indication of its
potential for future research and practical application. Specifically, our probe was of a use case
related to the application of Micro Tiles, a recent innovative product of the Christie Digital
Company—in applications of digital media for theatre production.
“A proof of concept initiative supports feasibility studies that test an idea to mitigate the risk
of further research investments” (Ontario Centres of Excellence, 2011, para. 1). Such studies involve
a limited number of projects (case studies) with specific subjects and are intended to encourage
further work pursuing a particular line of testing. If a study is intended to establish a new line of
theory, it should make clear what that new theory is, how it relates to existing theories and evidence,
why the new theory is needed, and what the intended applications of the theory are. Accordingly, this
study was intended to establish a new line of product use, to develop novel approaches, and to
perform the trial run on a use case (the application of Micro Tiles) and thereby to gauge the viability
of pursuing further research on related topics.
Another significant factor in the research was the selection of experts who were involved
during the study. A dictionary defines experts as those “having, involving, or displaying special skill
or knowledge derived from training or experience” (Merriam-Webster, 2011). According to Ericson
and Lehmann (1996), it takes approximately ten years for an individual to attain expert performance
and involves different variables, including deliberate practices, parental influence, motivation,
coach/teacher role, feedback, age of initiation of the skills, and performance. Deliberate practice plays
a key role in Ericson’s definition of expertise and involves many hours of intense practice of tasks or
activities. Studies have shown that experts are domain specific, implying that experts in specific areas
accumulate knowledge over a long time and that being expert in one specific area does not
necessarily guarantee superior performance in other areas. Armstrong (2005) shed light on the
definition and characteristics of experts by reviewing literature and derived several characteristics of
experts that distinguish them from non-experts, including superior performance in a specific domain,
pattern recognition ability in the domain of expertise, rapid problem solving, broader perspective in
problem solving, and ability to monitor, adjust and correct their performances.

27
The above definition and characteristics were fundamental to the selection of experts in the
technical aspects and applications of Micro Tiles. Our several assessments found only two available
and suitable experts. The chosen experts were knowledgeable in the digital media area, possessed
more than twenty years of experience in the domain, were involved in the exploration of applications
for Micro Tiles, but were not employees of the Christie Digital Company.
Furthermore, this study uses the World Wide Web to conduct environmental scanning and
gain preliminary information related to detecting weak signals, as described in Section 2.4.2. The
challenges of weak signals were therefore related to the facts that a) a weak signal has no exact
definition, 2) labeling a sign or information as a weak signal is subjective rather than objective;
hence, it is hard to find a robust measurement tool, and 3) the estimated timeline of a signal occurring
is not clear. In other words, are interpreters looking for a potential signal that will occur two, or four,
or ten years from now, or has the signal just occurred? Or was it stored in the report and website and
then interpreted? Moreover, interpreters of weak signals are constrained by time and effort; therefore,
it is impossible to fully test the accuracy of their detections in real-time.
Day and Schoemaker (2005) stated that “Looking at everything means looking at nothing”
(p. 3). In the huge dataset of approximately 40,000 web pages involved in this study, it was difficult
to find potential signals. To find the proverbial needle in the haystack and narrow down the retrieved
amount of information, it was decided to perform a methodical document reduction with computer
(CLUTO) and human judgment. This was done by assuming that the ratio of relevant to irrelevant and
unexpected to expected documents in the smallest set was greater than the ratio in the largest one.
The relevancy and expectedness of information in documents were two measurements as
related to weak signals. Weak signals detection is mostly dependent on the mindset of the observer or
the interpreters. Time, relevancy, expectedness, and observer’s mindset were used as dependent
variables for finding any sign of a weak signal, considering the fact that the variables do not have
equal weights in the assessment. Formulating this concept, we have
W(x) = W (R(x), E(x), T)
R(x) = R (O, T)
E(x) = E (O, T)
where

28
W: Weak Signal, R: Relevancy, E: Expectedness, T: Time, O: Observer’s mindset, x: One potential
sign
If there is a signal in the environment at any moment, labeling it as a weak signal depends on
whether or not the sign is relevant and unexpected to the domain of use. The relevancy and
expectedness depends upon the mindset of the observer and the moment in which they interpret the
sign. The expectedness is negatively associated with the weak signals, which means that the more
unexpected the sign, the more it tends to be a weak signal.
In this study, having more relevant and unexpected documents in the smallest set was
expected. Therefore, the following propositions were expressed:
P1: After data reduction with CLUTO, human judgment can determine whether a randomly
drawn sample of documents comes from small, medium or large datasets.
P2: There is a relationship between data reduction and the perceived relevancy of the
documents (the smaller the dataset, the higher is the relevancy of the documents in the
dataset).
P3: There is a relationship between data reduction and the perceived expectedness of the
documents (the smaller the dataset, the higher is the unexpectedness of the documents in the
dataset).
P4: The ratio of relevant to irrelevant documents in the small dataset is greater than that in the
medium one.
P5: The ratio of relevant to irrelevant documents in the medium dataset is greater than that in
the large one.
P6: The ratio of unexpected to expected documents in the small dataset is greater than that in
the medium one.
P7: The ratio of unexpected to expected documents in the medium dataset is greater than that
in the large one.
To test the propositions, data concerning a project related to the application of Micro Tiles (Appendix
A) in digital media in theatre production were applied.
29
Chapter 4
Methodology
This chapter discusses the approaches used in this research. The first section outlines the
study’s design, and the second section explains the procedure of the study. Real digital media data
were used for testing the propositions. The following sections explain the processes of research
design and gathering data. A brief description of Micro Tiles is also provided in Appendix A.
4.1 Research Design
In July 2009, a research team met at the Lower Ossington Theatre in Toronto, Canada to
introduce Micro Tiles to potential users, specifically to theatre professionals, before its introduction
into the general marketplace.
Members included University of Waterloo researchers, a team of Christie Digital Company
employees, representatives of professional theatre companies and faculty theatre members of the
Universities of Toronto, York, Waterloo, Ryerson, and Brock, and the colleges of Humber and
Sheridan.
The aim of the July 2009 meeting was to find information related to the potential applications
of Micro Tiles for digital media in theatre production. Evidence was gathered through face-to-face
interviews, written surveys, and reparatory grid interviews, and generally focused on “how this
particular technology might extend the industry’s artistic vision and business plans” (Hauck, J.
Goodwin, D. Goodwin, Guild, & Sparkes, 2011, p. 2). One specific aspect of the meeting was to
formulate queries, which could be used subsequently in the search engine to provide potential
information to help achieve the aforementioned goals.To formulate the queries, a team of eight
experts were asked: what combination of keywords in the World Wide Web would likely lead to the
relevant information for the use of Micro Tiles for digital media in theatre production. The selection
of keywords happened before the Ossington event—they were elicited from a set of experts who were
at a workshop held at University of Waterloo to look at the tiles and design the production that was
shown at that event.
Each member of eight experts was asked to write four queries, with each query containing
two to five key words separated by Boolean arguments. These requirements are evident in the form
entitled “Keyword Descriptions for Boolean Search” as shown in Appendix G. On the first round, 32

30
queries were introduced and after revision, for clarification, 48 were finally selected. Definitions of
Boolean operators are provided in Appendix B.
4.2 Queries
Searching for relevant information on the public web can be an overwhelming task for many
users. Historically, various web search strategies have been used in order to retrieve appropriate
information from web pages. Holscher and Strube (2000) proposed a diagram (Figure 5) which
depicted actions directly involved in search engine interactions. According to the authors, experts
changed their search engines, changed existing queries, and requested additional result pages if they
did not find relevant documents. Another popular web search strategy is Boolean search (Ford,
Miller, & Moss, 2002). Holscher and Strube (2000) found that web experts made use of advanced
search options, such as Boolean search and phrase search much more frequently than did average
users.
After the proposed 48 queries were written, they were then entered into DEVONagent (Mac
search engine software). It was chosen because of “its abilty to handle the Boolean operators and also
features the number of operators such as NEAR or BEFORE that are only found on high-end
databases” (DEVONtechnologies, 2011, p. 80). DEVONagent’s unique features and its advantages
over regular search engines such as, Google, Yahoo, and AltaVista, are illustrated in Appendix B.
Each query was run separately by first copying the queries from the log document and then
pasting them into DEVONagent. DEVONthink (Appendix C) finally stored and organized the
retrieved web pages. Any duplicated documents were removed by DEVONthink (Castillo, 2009).
4.3 Samples
This study used samples of web pages that were retrieved through a systematic search
procedure in 2009. All steps, including selecting search engine, queries, and pre-processing
procedures, are discussed in this chapter.

31
Figure 5: Close of Direct Interaction With Search Engine
Note. Adopted from Holscher & Strube (2000)
4.4 Analyzing Phase
The stored web pages in DEVONthink must be analyzed in order to find relevant information
and detect weak signals.
Document clustering methods (Section 2.6) were applied to find groups of similar documents.
From these groups, expected and irrelevant documents were removed, while unexpected, and relevent
documents were kept. Accordingly, the clustering toolkit (CLUTO) was used to conduct the
clustering function. CLUTO’s unique features and its applications are provided in Section 4.7.
In addition, as described in Section 2.6.9, pre-processing steps were performed prior to the
clustering phase in order to convert the web pages format into one that was appropriate for the
clustering software. The steps involved for pre-processing the documents are explained in Section
4.5.
Search /Launch search engine
Select documents from results
Examine documents
Examine the pages of results
Submit query / Get results
Generate + Select search terms
Formulate query
Browsing

32
4.5 Pre-processing Phase
Only textual information in web pages was considered in this study; hence, each HTML web
page was converted into plain text file with the DEVONthink functionality of striping HTML tags. A
script was then used to remove line breaks and aggregate all separate text files into one file, in which
each line of the file represented one document. The same steps were also performed to aggregate the
URLS.
For aggregating the documents, a scripting language (Apple script) and the following
command lines were used, as evidenced in Appendix H. Apple script was applied to merge text files
at the beginning; however, after merging several text documents, the merging process decelerated.
Hence, the following command line was used for the remainder of the merging:
CAT f1.txt f2.txt f3.txt > f4.txt
The next steps in pre-processing the documents were removing the stop-words, stemming,
and creating the vector space matrix (Section 2.6.5), which is the most common document
representation model used in text mining. This process was completed with Doc2mat file (Section
4.6).
4.6 Doc2mat File
Doc2mat file is a Perl script that converts a set of documents into the vector space matrix
made compatible with CLUTO’s clustering algorithm. The synopsis is
Doc2mat [options] doc-file mat-file
“Doc-file” stores the documents using one document at each line format. Therefore, the total
number of documents in the document-term matrix is equal to the number of rows in the file doc-file.
“Mat-file” stores the generated CLUTO compatible mat file, as well as the file-stem for the label file
if it is applicable.
Doc2mat does word stemming (Porter’s stemming algorithm (Porter, 1980)), stop-word
elimination, and the tokenization process
“The Doc2mat algorithm begins by replacing all non-alphanumeric characters with spaces.
Following this, the white-space characters are used to break up the line into tokens. Each of these

33
tokens is then checked against the stop-list, and if they are not there they get stemmed. The
tokenization and stemming process may be slightly different in relation to various options in Perl
script” (Karypis, 2003, “Doc2mat”).
Operating the Doc2mat file, the CLUTO’s inputs (including the vector space matrix and
ClabelFile) were produced. Tokenization approaches are defined in Section 2.6.9. The entire
methodology process is also depicted in Figure 6.
• All words were stemmed
• Stop words were eliminated
• Words consisting of numbers were retained
• Words containing fewer than three letters were removed
• The remaining words were stemmed using the Porter-stemming algorithm (Porter, 1980).
4.7 CLUTO
Karypis (2002) defines CLUTO as “a software package for clustering low and high
dimensional datasets and for analyzing the characteristics of various clusters” (p. 4). It uses various
clustering methods based on partitional, agglomerative, and graph-partitioning algorithms. CLUTO
calculates objective functions relating to certain criterion function, and optimizes (minimizes or
maximizes) particular clustering criterion functions that are defined at the beginning of the clustering
procedure. CLUTO uses seven criterion functions that can be applied both for partitional and
agglomerative clusterings.
CLUTO has the capability of comparing relations between documents within clusters and
among different clusters. It has been observed that CLUTO can perform effectively on high
dimensional datasets in terms of the number of documents and number of dimensions: “Moreover,
since most high-dimensional datasets are very sparse, CLUTO directly takes into account this scarcity
and requires memory that is roughly linear on the input size” (Karypis, 2002, p. 4).
CLUTO analyzes and clusters with its “stand-alone” programs Vcluster and Scluster
(Karypis, 2002, p. 6). Vcluster receives a vector space matrix as an input, while Scluster receives a
similarity matrix (or graphs) between documents as an input. Vcluster and Scluster are performed by
placing the following lines in the command-line:

34
Vcluster [optional parameters] MatrixFile NClusters
Scluster [optional parameters] GraphFile Nclusters
The matrix file is the vector space matrix (2.6.5). The Nclusters are the number of clusters
known a priori.
Figure 6: Methodology
4.8 Clustering Algorithm Parameters
In CLUTO, multiple optional parameters specify the behavior of different clusters. In general,
clusters can be grouped into three categories. The first category controls different aspects of the
clustering algorithm; the second category controls the type of analysis, and the third category controls
the visualization of the clusters (Karypis, 2002).
4.9 CLUTO Input
CLUTO takes a vector matrix file and an optional column label (clabelfile) and classifies
labels of the documents. The column label is the file that stores the label for each column of the
vector space matrix. In document clustering, the columns of the vector space matrix are the terms
produced from documents. Therefore, if the total terms of the matrix are n, the column label file has
exactly n lines.

35
4.10 CLUTO Output
Regarding clustering results, CLUTO can produce two kinds of output. The first kind covers
the clustering results with various measurements, while the second kind generates hierarchical trees if
the related option has already been defined in the command line.
4.11 Cluster Numbers
In K-means algorithms, clustering numbers should be defined a priori, making these the most
challenging part of the clustering method. Zhao and Karypis (2004) pointed out that no ideal
clustering numbers are suggested by the literature and that the best clustering numbers should be
found by the user through various experiments. The performance of a criterion function depends on
the degree of obtaining balanced clusters and the degree in which they can operate effectively with
different clustering tightnesses (Zhao & Karypis, 2004). For the purpose of this research, through
various experiments and due to our large dataset, it was decided to use the number of clusters that
resulted in no cluster exceeding 10 percentage of the overall document count (Figure 8).
4.12 Cluster Algorithm
Zhao and Karypis (2002) evaluated agglomerative and partitional algorithms and found that
for large document datasets, partitional clustering algorithms performed better than agglomerative
ones with low computational requirements.
CLUTO has 18 different optional parameters. Using these parameters, CLUTO finds the
appropriate clustering solution. For example, one of the options is –clmethod. The –clmethod
parameter defines the document clustering method. –clmethod consists of six different optional
methods for clustering documents. In this research, the rbr and direct methods have been used, as
described in the following:
Rbr: In this method, a vector space matrix is at first clustered into two parts. One part is
selected and bisected further until the ideal K clusters are found. In the end, the overall solution is
“globally optimized” (Karypis, 2002, p. 8).
Direct: In this method, CLUTO initially clusters the whole document into the ideal K
clusters. This method is usually slower than the rbr method; however, for cluster numbers less than

36
20, it achieves superior results. Increasing K, the repeated bisection method performs better than
direct clustering (Karypis, 2002).
4.13 Cluster Criterion Functions
There are seven different clustering criterion finctions that define the optimization formula
for clustering methods. For the mathematical definition of CLUTO’s clustering criterion functions
refer to Appendix D.
Differing criterion functions can lead to completely different results (Karypis, 2002). I2 and
H2 produce very good clustering solutions (Karypis, 2002). Zhao and Karypis (2004) evaluated the
performance of different criterion functions for partitional clustering algorithms and found that I2
performs better than the I1 criterion function. However, the selection of appropriate criterion
functions depends mainly on the application area. Therefore, it might be useful to perform
experimentation before selecting one criteria function (Karypis, 2002). Hence, for the current
database and with regards to Karypis (2002) suggestion, both H2 and I2 were used as the criteria
functions and shown to the experts for interpretation. Since there were only slight differences in the
interpretation results, I2 was used as a default criterion function.
4.14 Procedure
The procedure essentially aimed at moving the documents from the original corpus to a
subset that contains more relevant and unexpected documents to the domain of use. Relevancy and
expectedness were two measurements used for defining weak signals. In addition, the choices of
CLUTO’s options were based on the reasons provided in Sections 4.11, 4.12, and 4.13. However,
certain choices such as the selection of appropriate number of clusters were based on the experts’
judgments as explained in the following.
It was decided to begin with 10 as an initial number of clusters since the target cluster size
was 10% of the documents. If any cluster size exceeded 10 percent of the overall documents, then one
was added to the number of clusters, and they were clustered again. This process was continued until
all cluster sizes were less than 10 percent of the overall documents (Figure 8).
The CLUTO clustering results were reviewed by two experts to select the clusters that were
not relevant for Christie Digital’s preliminary goal, and that were not useful in detecting weak signals.
During the procedure, each expert used individual and independent judgment. Only the clusters

37
chosen by both experts to be dropped were finally removed from the document corpus. The
corresponding documents and URLs were then removed from the document set, and the clustering
process was performed again. This process continued in three iterations, which significantly reduced
the number of documents. The number of documents remaining after each reduction is shown in
Figure 7. The scripting language Python was used for selecting and removing the documents from the
document corpus (see Appendix F).
Based on the experts’ judgments, dropping and clustering iterations were stopped after three
repetitions. The original set contained 38,030 documents, the second set contained 12,789 documents,
the third set contained 7,718 documents, and the last set contained 1,510 documents. Three iterations
were judged to be necessary for data reduction, yet sufficient for detecting weak signals.
Figure 7: The Number of Documents Remaining After Each Reduction
4.15 Judgment Procedure
Due to the impracticality of evaluating each document separately, it was decided to gather 40 random
samples from each set of the 38,030, 7,718, and 1,510 document sets in order to test the propositions.
Basically, the aim was to collect samples from the large (38,030), medium (7,718) and small (1,510)
datasets, and then compare the yielded results by checking the relevancy and expectedness of the
documents. We could thus discover whether the smallest document set had more relevant and less
expected documents.

38
Figure 8: Document Reduction Flow Chart

39
To conduct the procedure, each set of 40 samples was categorized into four groups of ten samples;
therefore, 120 sample web pages were placed into 12 anonymous folders with each folder containing
10 web pages. Unique identification codes were assigned to each web page in the database (e.g., 1, 2,
3,etc.), and alphabetical codes were assigned to each folder of 10 web pages (e.g., A, B, C, etc.).
These codes were chosen to prevent the experts from understanding the original sources of each
document. The experts were then given a form (Appendix J), and were asked to judge the
corresponding document set (38,030, 7,718, and 1,500) regarding each group of 10 documents and
classify each web page in terms of relevancy and expectedness. The experts evaluated the documents
independently, without any communication during the procedure (Figure 9).
As can be seen in Appendix J, the form captured the expert’s name, the alphabetical set
number, and the date that the evaluation was conducted. In the table (Appendix J), each document
number refers to each web page. The experts had to choose whether the website’s information was
clearly relevant, maybe relevant or irrelevant, using the definition of relevancy provided below the
table, or whether it was clearly unexpected, somewhat unexpected, or expected in terms of the
application expectedness definition. For “clearly relevant” and “clearly unexpected” documents,
associated probability was defined to be more than 70 percent. For “maybe relevant” and “somewhat
unexpected” documents, probability was between 30 and 70 percent, and for “irrelevant” and
“unexpected” documents, the probability was defined to be less than 30 percent. Finally, responses
were converted into 80, 50, and 20 scales, in which 80 stood for relevant/expected, 50 for maybe
relevant/somewhat unexpected, and 20 for irrelevant/clearly unexpected documents.
Having consistency in document sets, relevancy, and expectedness were defined as follows:
• Technical Relevance for Firm’s Product Management:
How likely is the Christie Digital product management team to find the information relevant
to Micro Tiles?
• Application Expectedness for Theatre Professionals:
How likely is the UW creative/theatre production team to be inspired by the novel or unique
application of Micro Tiles?
The information provided by the experts was then analyzed by statistical software (SPSS).
Chapter 5 reports the results of the clustering by CLUTO and statistical analysis of human judgments.

40
Figure 9: Experts Judgments Procedure

41
Chapter 5
Results
This chapter provides the results of the study. The first part explains CLUTO’s results in
different iterations of the data reduction, and the second part describes the sampling results and the
relevant statistical analysis for testing the propositions. Appendix E displays the set of 48 queries and
the corresponding number of search results provided by the DEVONagent search engine.
5.1 Descriptions of CLUTO Results - First Iteration
Table 3 displays the summary of CLUTO results at the first iteration. The number of
documents is 38,030, and the number of clusters is 25.
Table 4 indicates part of the Vcluster output of CLUTO for the first iteration. As can be seen
in the table, the first part of the CLUTO’s report describes the optional parameters used in the
clustering. From this table it is clear that CLUTO prints information about the matrix such as its
name, number of rows (number of documents), number of columns (number of tokens), and number
of non-zeros in the matrix. Next, CLUTO reports on the options used to find the clustering.
For the first iteration, the followings parameters were applied:
• CLMethod: Due to the small number of clusters, the direct method was used (see Section
4.12).
• CRfun: The I2 criteria function was used (see Section 4.13).
• SimFun: The similarity between the documents was computed by using the cosine function
of their vectors (see Section 2.6.6).
• Number of clusters: The desired number of clusters was reached at 25 (see Section 4.11)
• RowModel: This parameter selects the model to scale the various columns of each row. In
this study, the columns of each row in the matrix were not scaled.
• Col Model: The columns of the matrix were labeled according to inverse-document-
frequency (IDF) (see Section 2.6.5). • GrModel: This is related to graph-partitioning based algorithm and was not applied here.

42
Table 3: Summary of CLUTO Output - First Iteration
Cluster Number
Internal Similarity
External Similarity Size Descriptive Words
0 0.504 0.010 406 Meetup, green, organ, environ, inappropri
1 0.278 0.018 419 syndic , digg , newslink , myyahoo, 2008
2 0.258 0.018 426 publish, volum, ingentaconnect, ingenta author
3 0.188 0.013 317 fhwa , highwai , transport , feder , trail
4 0.172 0.006 796 und, der , die , ein, von
5 0.176 0.017 1431 led , displai , inquiri , sell, outdoor
6 0.14 0.012 658 hair, laser, skin, treatment , remov
7 0.143 0.021 998 signag , digit , network, kiosk , retail
8 0.127 0.022 983 patent , inventor, usernam , apparatu ,password
9 0.109 0.020 1150 projector, dlp , cinema , christi , digit
10 0.092 0.009 874 hled , str , nky , vyhledat, zboz
11 0.099 0.016 752 monitor , multi , request, multipl, uv
12 0.089 0.014 1112 mobil , pda , accessori , batteri , gp
13 0.095 0.022 1468 bnet , manag, tag, result, window
14 0.086 0.014 3544 laser , beam, optic, engrav, photon
15 0.079 0.014 1538 theatr, plai, ticket , actor, stage
16 0.058 0.017 2339 energi , climat , environment , warm , environ
17 0.046 0.013 3019 environment, environ , water, australia , wast
18 0.051 0.019 2218 camera , dvd , digit, soni, video
19 0.051 0.019 2082 displai , lcd, panel , monitor , www
20 0.04 0.018 2712 art , artist , student , music, cultur
21 0.034 0.013 1288 perform, vehicl , car, clock, brake
22 0.029 0.01 1153 ieee, sql, code, bibtex, cocoa
23 0.031 0.014 1959 wikipedia , answer, edit , dictionari,articl
24 0.032 0.019 3557 ol , technolog , comput , displai, comp
Note. Number of documents: 38,030, number of clusters: 25

43
Table 4: CLUTO’s Report Regarding the Applied Method
Vcluster (CLUTO 2.1.2) Copyright 2001-06, Regents of the University of Minnesota
Matrix information ----------------------------------
Name: final09.mat , #Rows: 38030, #Columns: 699159, # NonZeros: 15287034
Options ------------------------------------------------
CLMethod=Direct, CRfun= I2, SimFun= Cosine, #Clusters: 25
RowModel=None, ColModel=IDF, GrModel=SY-DIR, NNbrs=40
CSType=Best, Ntrials=10, Niter=10
• CStype: This parameter defined the method to be used for selecting the next cluster to be
bisected by CLUTO’s repeated-bisecting algorithms. CStype has two options: “LARGE” and
“BEST”. “LARGE” chooses the largest cluster to be bisected further, and “BEST” chooses
the cluster that gained better value of the clustering criterion function to be bisected further.
In this study, the “BEST” option is used.
• Niter: In each clustering step, CLUTO clusters documents in different iterations until it
reaches the appropriate clustering solution. Niter option defines the maximum number of
“refinement iterations” that CLUTO uses to find the appropriate clustering solution. The
default value is 10. The appropriate range is between five and 20 (Karypis, 2002, p. 15).
• Ntrials: By default, the value was 10, indicating that CLUTO computed 10 different
clustering solutions. Each solution had a different set of seed objects. Among these solutions,
CLUTO selects the clustering solution that had the best value of the criterion function
(Karypis, 2002).
• NNBr: This was the parameter related to a graph-partitioning based algorithm. The default
value was 40. Because no graph-partitioning algorithm was applied in this study, the
parameter remained as the default value.

44
Table 5: Part of CLUTO's Statistical Report
25-way clustering: !2 = 1.00! + 004 37199 !" 38030
Cid Size ISim ISdev Esim ESdev
0 406 +0.504 +0.083 +0.010 +0.003
1 419 +0.278 +0.118 +0.018 +0.003
Descriptive & Discriminating Features
Descriptive: meetup 93.1%, green 0.2%, organ 0.2%, envion 0.2%, inappropri 0.1%
Discriminating: meetup 51.5%, laser 2.9%, display 1.0%, led 0.7%, digit 0.7%
Table 5 displays part of CLUTO’s statistical report. The first line of the report relates to the
value of the I2 criterion functions.
“The column labeled “size” relates to the number of documents belonging to each cluster.
The column labeled “ISim” displays the average internal similarity of each cluster, and the columns
labeled “ISdev” display the standard deviation of average internal similarities. The column labeled
“ESim” displays the average similarities of the documents of each cluster and the rest of the
documents (external similarities), and the “ESdev” shows the standard deviation of the average of
external similarities. For example, 0.504 in Table 5 indicates that the average internal similarity
between the documents in cluster number 0 is 0.504.
For our textual analysis, the –showfeatures option was also applied. This feature displays the
set of words (columns of the vector space matrix) that best describes the similarities of the documents
within each cluster and the set of words that best describes the differences between each cluster and
the rest of the documents. There is a percentage number beside each word, which describes the
percentages within cluster similarity that the corresponding word could explain. For discriminating
among words, the percentage number indicates the percentage of differences that the particular word
could explain regarding the cluster and the rest of the documents. Therefore, there is a large overlap
between the descriptive and discriminative features. The words are also listed in decreasing
descriptive and discriminative order. The default number of words that could be displayed is five;
however, with the –nfeatures parameter, the number of observed words could be changed” (Karypis,
2002, p. 19).

45
Table 6: Experts' Suggestions Regarding Removal of Clusters - First Iteration
Cluster Number
Expert 1 Suggested Themes
Expert 1 Judgment
Expert 2 Suggested Themes
Expert 2 Judgment
0 Environment Dropped Meeting/conferences Dropped
1 New sites Dropped New sites Dropped
2 Database Dropped Publishing Dropped
3 Transportation Dropped Transportation Dropped
4 German Dropped German Dropped
5 Ecommerce Dropped Retailing Dropped
6 Cosmetic Dropped Health/medical Dropped
7 Signage Kept Signage Kept
8 Patent Database Dropped Patents Dropped
9 Suppliers Kept Suppliers Dropped
10 Unknown Dropped Unknown Dropped
11 Multi-Monitors Kept Multi-monitors Kept
12 Ecommerce/Mobile Dropped Mobile Dropped
13 Network Software Dropped Software Dropped
14 Engraving Dropped Lasers Dropped
15 Theater sites Dropped Theater Kept
16 Environment Dropped Energy/Environment Dropped
17 Environment Dropped Environment Dropped
18 Ecommerce Dropped Photography Dropped
19 Display Kept Display Kept
20 Art Kept Art Kept
21 Automotive Dropped Automotive Dropped
22 Database Dropped Engineering/data Dropped
23 Database Dropped Wiki/reference Dropped
24 Theater Kept Theater Kept Note. Number of documents: 38030, number of clusters: 25
5.2 Dropped Clusters by the Experts - First Iteration
Table 6 indicates the clusters dropped by the two experts. Next to each cluster the
corresponding themes provided by each expert are shown. In general, the cluster themes that were
neither perceived as facilitators in detecting the weak signals nor reaching the goal described in the
Chapter 3 were removed from the corpus. The dropped clusters are bolded.

46
5.3 Remaining Documents – First Iteration
The following table outlines the total number of documents that were clustered by CLUTO,
the number of documents dropped by experts, and the number of remaining documents. The total
number of documents that CLUTO could cluster was less than the original number of 38,030 because
in almost every clustering, CLUTO could not assign some documents to any clusters.
Table 7: Remaining Documents - First Iteration
Iteration 1 Total documents 37,199 Dropped documents 24,410 Remaining documents 12,789
5.4 CLUTO Results - Second Iteration
CLUTO’s parameters in the second iteration were similar to the first one. The number of
clusters was 17, and the total number of documents clustered was 12,789 (Table 8).
Table 8: Summary of CLUTO Output - Second Iteration
Cluster Number
Internal Similarity
External Similarity Size Descriptive words
0 0.608 0.005 158 Request, uv, cooki, server, header
1 0.245 0.02 282 Ol, cdt, amol, light, diplai
2 0.141 0.023 437 Monitor, multi, multipl, compu, screen
3 0.120 0.023 895 Signag, digit, network, kiosk, retail
4 0.119 0.022 813 Prjector, dlp, lamp, project, lumen
5 0.116 0.022 374 Cinema, Christi, imax, barco, projector
6 0.108 0.021 227 Wearable, nomad, comput, gesturetek, xybernaut
7 0.069 0.017 501 Film, min, vote, Egyptian, cinematheque
8 0.067 0.016 1234 Theatr, plai, ticket, stage, actor
9 0.063 0.022 976 Art, artisit, culture, danc, perform
10 0.06 0.022 1002 Lcd, display, tft, plasma, monitor
11 0.054 0.020 742 Display, www, com, print, zibb
12 0.044 0.019 777 Brail, intel, window, comput, keyboard
13 0.042 0.021 1102 Student, univers, disable, research, scienc
14 0.040 0.021 977 Control, designlin, system, equip, sensor
15 0.035 0.021 1187 Busi, market, company, announc, indstri
16 0.035 0.021 1105 Comment, post, 2008, blog, game Note. Number of documents: 12,789, number of clusters: 17
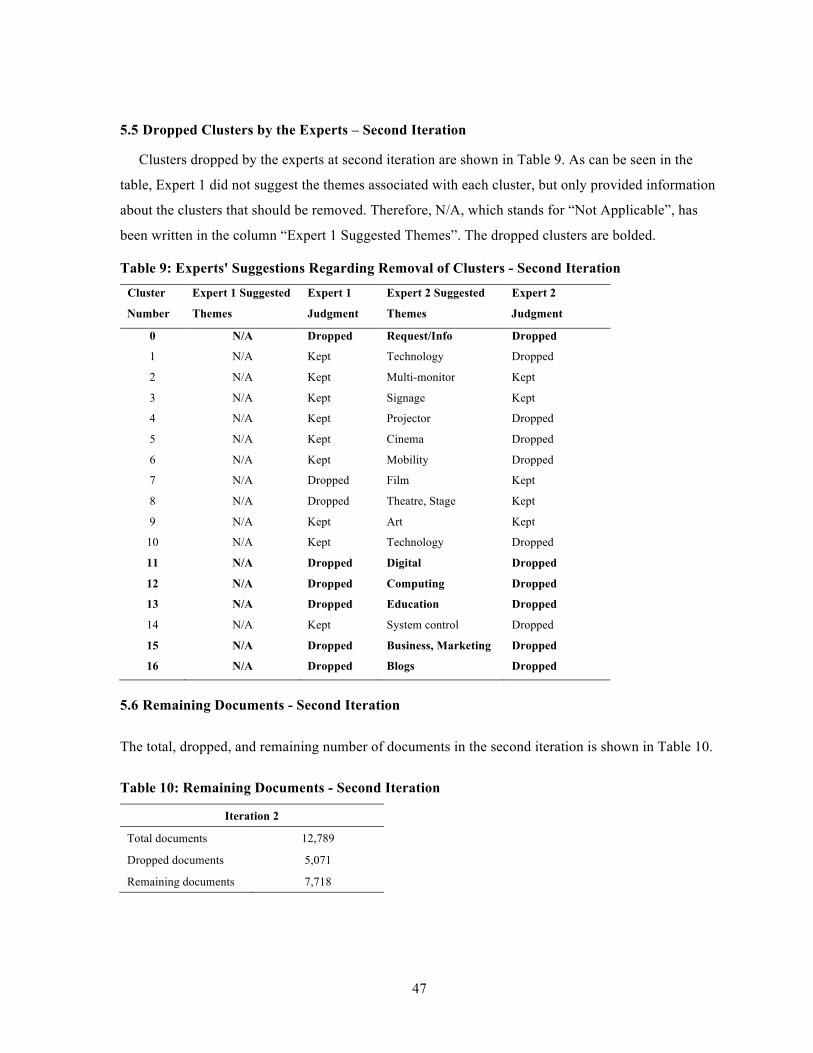
47
5.5 Dropped Clusters by the Experts – Second Iteration
Clusters dropped by the experts at second iteration are shown in Table 9. As can be seen in the
table, Expert 1 did not suggest the themes associated with each cluster, but only provided information
about the clusters that should be removed. Therefore, N/A, which stands for “Not Applicable”, has
been written in the column “Expert 1 Suggested Themes”. The dropped clusters are bolded.
Table 9: Experts' Suggestions Regarding Removal of Clusters - Second Iteration
Cluster
Number
Expert 1 Suggested
Themes
Expert 1
Judgment
Expert 2 Suggested
Themes
Expert 2
Judgment
0 N/A Dropped Request/Info Dropped
1 N/A Kept Technology Dropped
2 N/A Kept Multi-monitor Kept
3 N/A Kept Signage Kept
4 N/A Kept Projector Dropped
5 N/A Kept Cinema Dropped
6 N/A Kept Mobility Dropped
7 N/A Dropped Film Kept
8 N/A Dropped Theatre, Stage Kept
9 N/A Kept Art Kept
10 N/A Kept Technology Dropped
11 N/A Dropped Digital Dropped
12 N/A Dropped Computing Dropped
13 N/A Dropped Education Dropped
14 N/A Kept System control Dropped
15 N/A Dropped Business, Marketing Dropped
16 N/A Dropped Blogs Dropped
5.6 Remaining Documents - Second Iteration
The total, dropped, and remaining number of documents in the second iteration is shown in Table 10.
Table 10: Remaining Documents - Second Iteration
Iteration 2
Total documents 12,789
Dropped documents 5,071
Remaining documents 7,718

48
5.7 CLUTO Results - Third Iteration
In the third iteration, the same clustering algorithm was initially used; however, the results
were not satisfactory, and the experts could not make-sense of them. Thus, we changed the CLUTO’s
algorithm method. As described in Section 4.12, direct method does not perform well for cluster
number more than 20; therefore, instead of direct method, rbr method was applied. The CLUTO’s
results in the third iteration are shown in Table 11.
Table 11: Summary of CLUTO Output - Third Iteration
Cluster Number
Internal Similarity
External Similarity Size Descriptive words
0 0.383 0.025 97 Christi, projector, roadster, cinema
1 0.242 0.021 277 Ol, Cdt,amol,light,displai
2 0.237 0.021 96 Designlin,nomad,technlin,europ
3 0.193 0.026 287 Monitor, multi, multipl, compu, dual
4 0.191 0.031 186 Signag, kiosk, digit, gesturetek,self
5 0.166 0.024 109 Imax, theater, movi, regal, cinema
6 0.140 0.023 172 Wearabl, comput, xybernaut, devic,cloth
7 0.130 0.029 225 Dlp, projector, rear, project, dpi
8 0.126 0.027 213 Cinema, barco, digit, scroll, projector
9 0.120 0.027 565 Projector, dlp, lumen, lamp, project
10 0.112 0.020 270 Min, film, Egyptian, cinematheque
11 0.112 0.027 693 Signag, digit, network, content, player
12 0.099 0.019 133 Kmv,minicom, rgb,consol, switch
13 0.095 0.016 195 Vote, prison, quatermass, drama, episod
14 0.092 0.023 223 Touch, planner, touachscreen, display, lcd
15 0.090 0.023 188 Multi, wall, screen, monitor,displaylink
16 0.085 0.024 487 Art, artist, culture, creative, exhibit
17 0.076 0.024 482 Theatr, stage, art, bai, actor
18 0.078 0.027 372 Plasma, display, lcd, crt, crystal
19 0.073 0.024 430 Lcd, tft, display, Toshiba, panel
20 0.061 0.017 715 Theatr, plai, ticket, London, shakespear
21 0.057 0.024 541 Art, danc, music, perform, artist
22 0.048 0.023 762 Control, equip, system, sensor, embed Note. Number of documents: 7718, number of clusters: 23

49
5.8 Dropped Clusters by the Experts - Third Iteration
Table 12 shows the clusters dropped by the two experts after the number of documents was
reduced to 7,718. The dropped documents are bolded.
Table 12: Experts' Suggestions Regarding Removal of Clusters - Third Iteration
Cluster Number
Expert 1 Suggested Themes
Expert 1 Judgment
Expert 2 Suggested Themes
Expert 2 Judgment
0 Christie Dropped Vendor Specific Dropped
1 Display tech Dropped Technology Dropped
2 Exhibits Dropped Technology Dropped
3 Computer monitors Dropped Components Dropped
4 Signage Dropped Signage Dropped
5 Imax Dropped Imax Dropped
6 Wearable electronics Dropped Wearable Computers Dropped
7 Projectors Dropped Projection video Dropped
8 Movie theater Dropped Cinema projection Dropped
9 Projectors Dropped Projection technology Dropped
10 Movies Dropped Tech Spec Dropped
11 Signage Dropped Digital Signage Dropped
12 Unknown Dropped Technology Dropped
13 Movie Dropped Prison voting Dropped
14 Other displays Dropped Touch Screens Dropped
15 Computer monitors Dropped Multi wall projection Dropped
16 Art Kept Digital Art Kept
17 Theatre Kept Theatre Stage Kept
18 Displays Dropped Technology Dropped
19 Displays Dropped Technology Dropped
20 Tickets Dropped Theatre Signage Dropped
21 Art Kept Performance arts Kept
22 Control Dropped Control Systems Dropped Note. Number of documents: 7718, number of clusters: 23
5.9 Remaining Documents - Third Iteration
The total, dropped and remaining number of documents in the third iteration is shown in
Table 13.

50
Table 13: Remaining Documents - Third Iteration
Iteration 3
Total documents 7,718
Dropped documents 6,208 Remaining documents 1,510
The experts suggested stopping the clustering processes for the following reason: After three
iterations, the number of documents was reduced significantly, and irrelevant information, as intended
initially, was removed from the document corpus. Additional dropping eliminated the valuable and
necessary information. For these reasons, the clustering procedure was stopped.
5.10 Statistical Analysis
For obtaining 120 samples from three databases, random numbers were generated by Excel
and are shown in Table 14. As can be seen in the table, for each document corpus (38030, 7718,
1510), 40 random samples were generated. As explained in Section 4.15, each set of 40 samples was
categorized into four groups of ten samples; therefore, 120 sample web pages were placed into 12
anonymous folders with each folder containing 10 web pages.
Table 14: Random Numbers Generated by Excel
38030 documents 7718 documents 1510 documents
Number 1 2 3 4 1 2 3 4 1 2 3 4
1 27609 35340 12519 28022 1708 5392 308 2899 460 1292 621 1407
2 28972 1228 13669 21394 4562 4106 906 6840 507 1133 761 1392
3 36059 25878 20808 17287 1215 322 2943 5049 1441 1341 933 1223
4 6705 24395 32457 19378 19 4539 6197 6873 982 22 1395 1318
5 11601 37501 18135 10029 3165 5484 3561 467 748 1279 454 689
6 15253 19074 4157 4323 5755 6142 7009 7021 343 1163 1281 726
7 16821 718 5701 35353 4518 754 7162 5004 740 766 1413 759
8 8696 532 343 22739 3554 3611 4192 5707 681 1180 116 766
9 20355 28026 14444 19683 5438 2681 4956 6407 1123 1509 735 1422
10 22499 20770 608 21808 4454 359 535 7258 1213 47 723 695
5.11 Summary of the Experts Judgments
The information provided from the forms completed by the experts (Appendix J) was
analyzed by SPSS. Experts’ judgments regarding the recognition of the original sources of the

51
samples are provided in Table 15. From this table, it is clear that Expert 1 judgment was 100 percent
correct, and Expert 2 recognition was 87.5 percent correct.
Table 15: Comparisons of the Experts’ Judgments With the Actual Database
Expert 1 Expert 2 Actual Database
Small Small Small
Medium Medium Medium
Large Large Large
Small Small Small
Large Medium Large
Large Large Large
Small Small Small
Medium Medium Medium
Large Medium Large
Small Small Small
Medium Medium Medium
Large Large Large
5.12 Judgments’ Frequencies
In Table 16, the experts’ judgments are shown in terms of relevancy and expectedness of the
documents.
Table 16: Summary of the Experts’ Judgments
Expert 1 Frequency
Expert 1 Percentage
Expert 2 Frequency
Expert 2 Percentage
Relevant 2 1.7% 14 11.7%
Maybe Relevant 14 11.7% 18 15%
Irrelevant 104 86.7% 88 73.3%
Total 120 100% 120 100%
Clearly Unexpected 7 5.8% 10 8.3%
Somewhat Expected 32 26.7% 18 15%
Expected 81 67.5% 92 76.7%
Total 120 100% 120 100%
As can be seen, Expert 2 found more relevant documents than Expert 1 in the 120 samples.
However, both experts found roughly the same results regarding the expectedness of the documents.

52
The validation of the author’s judgment is analyzed in the following sections. Tables 17 and 18
indicate the cross tabulation tables of both experts depicting each of the three datasets in terms of
relevancy and expectedness of the documents. For example, the first number in the first row and first
column of Table 17 shows that, in a small dataset, both experts found 14 “Irrelevant” documents. The
fifth number in the first row of that table also shows that, in medium dataset, Expert 2 found three
“Irrelevant” documents; while Expert 1 found three “Maybe Relevant” documents.
Table 17: Cross Tabulation Table for Relevancy of the Small, Medium, Large Datasets
Table 18: Cross Tabulation Table for Expectedness of the Small, Medium, Large Datasets
The bar chart diagrams (Figures 10, 11, 12, and 13) represent the experts’ judgments in terms
of the relevancy and expectedness of the datasets. As can be seen in Figure 10, according to Expert 2,
the relevancy of the documents for the small dataset was more than that of the medium dataset and
the relevancy of the medium dataset was more than that of the large dataset. In contrast, according to
Expert 1 only two websites were completely relevant in the whole set (Figure 11). However, in terms
of expectedness, both diagrams yielded roughly the same results (Figure 12, Figure 13).
Expert 1
Expert 2
Irrelevant Maybe Relevant Relevant
Small Medium Large Small Medium Large Small Medium Large
Irrelevant 14 31 34 0 3 4 N/A N/A 2
Maybe Relevant 12 4 N/A 1 1 N/A N/A N/A N/A
Relevant 9 0 N/A 4 1 N/A N/A N/A N/A
Expert 1
Expert 2
Unexpected Somewhat Unexpected Expected
Small Medium Large Small Medium Large Small Medium Large
Unexpected 3 N/A N/A 7 N/A 4 0 N/A 2
Somewhat Unexpected 3 N/A N/A 6 3 N/A N/A 1 N/A
Expected 1 N/A N/A 6 5 5 9 31 35

53
Figure 10: Expert 2 Judgment for Relevancy of the Documents
Figure 11: Expert 1 Judgment for Relevancy of the Documents

54
Figure 12: Expert 2 Judgment for Expectedness of the Documents
Figure 13: Expert 1 Judgments for Expectedness of the Documents

55
An aim was to explore possible disparities between the judgments in terms of relevancy and
expectedness of the documents between the whole set (120 samples) and each of the three databases
(i.e., small, medium, large). Since the applied scale was in ordinal measurement, and the normality of
the dataset was not presumed, the Wilcoxon-ranked test was performed. The Wilcoxon test is an
alternative test for paired t-tests and is used when the paired t-test assumptions are violated. It can be
used when the population cannot be assumed to be normal or when the data are in the ordinal scale.
Table 19: Statistical Analysis for Comparing Two Judgments
Relevancy Expectedness
Small Medium Large Overall Small Medium Large Overall
Z Wilcoxon value: 2* vs. 1* 4.54 0.707 2.271 3.233 2 1.663 2.236 1.333
Two tailed P-value: 2* vs. 1* 0.000 0.48 0.023 0.001 0.841 0.103 0.025 0.182
Mean 2 49.25 25.25 20 31.5 54.5 77 80 70.5
Mean 1 23.75 23.75 26 24.5 55.25 74 76.25 68.5
Spearman’s Correlation 2 vs. 1 0.379 0.285 N/A 0.171 0.453 0.458 N/A 0.582
Kappa
P Correlation value 1 vs. 2 0.016 0.074 N/A 0.062 0.003 0.003 N/A 0.000
Correlation 2 vs. actual N/A N/A N/A 0.875 N/A N/A N/A 0.875
Correlation 1 vs. actual N/A N/A N/A 1 N/A N/A N/A 1
Note. Correlation significant at the 0.01 level (2-tailed); *2 stands for Expert 2, and 1 stands for Expert 1; Confidence Interval = 95%; N/A means that the statistical analysis could not be performed because at least one variable was constant, or the variable was not chosen.
The results and the P-values of the analysis are shown in Table 19. Prior to that, the paired t-
test was also applied, and the yielded results were compared with Wilcoxon test results. Both results
were relatively similar, possibly because the number of samples was 40 for each database, and based
on central limit theory the population can be assumed to be normally distributed. In Table 19, the
means of the Expert 1 judgment and Expert 2 judgment for the presented variables are also provided.
It is clear that the degree of relevancy and expectedness indicated by Expert 2 was greater than that of
Expert 1, which means that Expert 2 found more relevant and less unexpected documents in the
whole 120 samples than Expert 1.
Inter-rater reliability counts the degree of agreement between judges. In Table 19, an analysis
was performed to define the amount of consensuses in the ratings given by the two judges. Due to the

56
ordinal nature of our data, Spearman’s rho (a non-parametric test) correlation was used for finding the
correlation between the paired datasets. Spearman correlation is used when the variables are not
assumed to be normally distributed and yet are assumed to be ordinal. Kappa statistic could not be
used in this case because the rating scale had natural ordering (e.g., clearly relevant, maybe relevant,
irrelevant). In terms of relevancy, there was slight agreement between the experts, r (120) = 0.171,
p > 0.01; however, in terms of expectedness, the two judges were significantly correlated with each
other r (120) = 0.582, P < 0.01.
As can be seen in the last two rows of Table 19, Expert 1 recognized the original database
sources of all the samples correctly, r (120) = 1, while the correlation of Expert 2 judgment with the
original dataset was 0.875.
To test whether the distribution of relevant documents between different datasets is the same,
the Krusal-Wallis test (the non-parametric alternative of one way ANOVA), was applied for the
following reasons:
• The nature of our data was non-parametric.
• The comparison included three independent groups (datasets).
• The comparison included three sets of scores (i.e. relevancy, maybe relevant, irrelevant)
that came from different groups.
• The provided data was ordinal.
The results of the analysis are shown in Table 20. The following results are yielded from
Table 20.
Regarding Expert 2, the distribution of relevant documents is not the same across the three
databases. For the small dataset it is greater than that of the medium one, and for the medium dataset
it is greater than that of the large one.
Regarding Expert 1, the distribution of relevant documents is the same across the three
databases.
Regarding both experts, the distribution of unexpected documents is not the same across the
three databases. For the small dataset it is greater than that of the medium one, and for the medium
dataset it is greater than that of the large one.

57
Cross tabulation analysis was also performed to analyze the experts’ judgments in terms of
the relevancy and expectedness of the each of the three databases. Chi-square test of independence
was also achieved initially to compute the statistical significance of the cross-tabulation table (3×3),
and to determine whether there is a significant relationship between the data reduction and relevancy
of the documents, or whether there is a significant relationship between data reduction and having
more unexpected documents.
Table 20: Kruskal-Wallis Test for Comparison of the Three Datasets
Chi-Square
Significance
Level (P-value)
Relevancy Expert 1 0.223 0.894
Expert 2 48.089 0.000
Expectedness Expert 1 31.806 0.000
Expert 2 46.939 0.000 Note. Degree of freedom: 2, significance level: 0.05
For any Chi-Square test, the data must satisfy the following two assumptions:
• The sample must be randomly selected from the population.
• The sample size, n, must be large enough so that the expected count in each cell is greater
than or equal to five.
Regarding our dataset, the second assumption was violated; therefore, for each pair of the
dataset the contingency table (2 ×2) was provided as an alternative for Chi-Square test. The P-values
of the analysis for testing the relevancy of the documents are shown in Table 21. For some values,
Fisher’s Exact test was not applicable because the associated expert’s judgment was constant. Thus,
there was no difference in one of the categorical variables and, therefore, it was impossible to perform
Fisher’s statistical analysis. In both tables, the P-values of the bolded numbers are less than 0.05
(significance level), which indicates a significant association between the variables. To be precise, the
following results could be derived from Table 21.
5.13 Regarding Expert 2 Judgments
The number of relevant documents was not equally distributed between the pair databases.
• The ratio of maybe relevant/irrelevant documents in the small dataset was significantly larger
than that in the medium one.

58
• The ratio of relevant/irrelevant documents in the small dataset was significantly larger than
that in the medium one.
• The ratio of maybe relevant/irrelevant documents in the small dataset was significantly larger
than that in the large one.
• The ratio of relevant/irrelevant document in the small dataset was significantly larger than
that in the large one.
For the other values (P > 0.05), there was no significant relationship between the variables.
Table 21: The P-values of Fisher Exact Test for Contingency Table Between Paired Variables
Pairwise Datasets Relevancy
Variables Expert 1 Expert 2
Small vs. Medium
R* vs. M* N/A 0.355
M vs. I* 1 0.001 R vs. I N/A 0.000
Small vs. Large R vs. M 0.455 N/A
M vs. I 1 0.000
R vs. I 0.493 0.000
Medium vs. Lar ge R vs. M 0.455 N/A M vs. I 1 0.052 R vs. I 0.493 0.467
Note. * R stands for Relevant, M for Maybe Relevant and I for Irrelevant documents, N/A means no statistical analysis was provided because at least one expert’s judgment was constant. Degree of freedom=1, significance level: 0.05
In addition, in terms of expectedness, the following results are derived from Table 22.
5.14 Regarding Both Experts’ Judgments
• The ratio of somewhat unexpected/expected documents in the small dataset was significantly
larger than that in the medium one.
• The ratio of unexpected/expected documents in the small dataset was significantly larger than
that in the medium one.
• The ratio of somewhat unexpected/expected documents in the small dataset was significantly
larger than that in the large one.

59
Table 22: The P-values of Fisher Exact Test for Contingency Table Between Paired Variables
Pairwise Datasets Expectedness
Variables Expert 1 Expert 2
Small vs. Medium Ex vs. SE 0.003 0.000 SE vs. UE 0.16 0.533 Ex vs. UE 0.001 0.000
Small vs. Large Ex vs. SE 0.000 0.000 SE vs. UE 0.562 N/A Ex vs. UE 0.001 0.000
Medium vs. Large Ex vs. SE 0.378 0.116
SE vs. UE N/A N/A
Ex vs. UE N/A N/A Note. * Ex stands for Expected, SE for Somewhat Expected and UE for Unexpected documents, N/A means no statistical analysis was provided because at least one expert’s judgment was constant. Degree of freedom=1, significance level: 0.05
60
Chapter 6
Discussion and Conclusions
The purpose of this exploratory study is to find a potential method for detecting weak signals
by using Internet-based environmental scanning in a domain of interest. The aim was to investigate
the feasibility of the proposed model and some indication of its potential for future research and
practical application. Specifically, the study proposed to locate weak signals of information about the
application of Micro Tiles, a recent innovative product of the Christie Digital Company, from the
World Wide Web. The degree of relevancy and expectedness of the documents were two
measurements defined for evaluating weak signals. In an effort to reduce the information retrieved
from the Internet and detect weak signals, clustering techniques was used to reduce the available data
and CLUTO was the analysis package.
The initial information retrieved from the Internet was reduced in three iterations; that
reduction yielded three subsets of documents: small, medium, and large. Obtaining 40 random
samples from each of the three databases, the author asked the two experts to judge on the degree of
relevancy and expectedness of the documents in each subset. Based on the opinions of Expert 2, the
small dataset contained more relevant and unexpected documents than the medium one did, and the
medium dataset contained more relevant and unexpected documents than the large (original) set did.
Findings by Expert 2 supported the preliminary propositions, indicating that applying the proposed
model makes it possible to find weak signals from document corpus. Similarly, in terms of
expectedness, according to Expert 2, the small dataset had more unexpected documents than that for
the two others, thus supporting the proposition.
In addition, when 40 random and anonymous samples of documents in groups of ten, from
each of the three small, medium, and large datasets were presented; Expert 1 was 100% correct and
Expert 2 was 87.5% correct for guessing from which corpus the samples were drawn.
In contrast, in terms of relevancy, the findings by Expert 1 do not imply that the smallest set
contained more relevant documents. Regarding Expert 1 judgment, only two “clearly relevant”
documents existed in the large dataset.
Possible reasons for this discrepancy are:
• The threshold differences set by the experts because the relevancy threshold for
Expert 1 was clearly higher than the relevancy threshold of Expert 2.

61
• Perspective differences could have existed between the two experts for assessing the
documents. One expert had an engineering background and evaluated the relevancy
of the documents in terms of their possible contribution to design new Micro Tiles,
while the other expert had a product management perspective and was interested in
information that deployed the application of Micro Tiles.
• The two experts assessed the documents independently. For more consistent
evaluation, it may be beneficial to have group meetings among experts. In this way,
judges could justify and adjust their reasons based on mutual opinions and consensus.
• According to Cohen and Levinthal (1990), although overlapping individual ideas is
beneficial, new knowledge originates from the diversity of knowledge within
individuals. Therefore, using judges with different expertise, despite their being
inconsistent, would enhance the absorptive capacity of the firm.
The trends of this study suggest that the proposed model successfully reduced the documents
into the smallest set that contained more unexpected results. These trends are appealing as they offer a
cost-effective way of conducting environmental scanning on the Internet. Information on the Internet
is free of charge and the applied software is open source; therefore, organizations can access and
make sense of the hidden information easily and earlier than their competitors. In addition, this
systematic approach aligns perfectly with the huge number of documents in a timely manner, and
applies easily in any environment. It can be used to overcome the problems of weak signals detection
in environmental scanning processes introduced by Ansoff (1975) because it is a way of moving from
the traditional point of view of strategic management to a more modern one as displayed in Table 1.
Complying with Ansoff’s real time strategic view of a firm (1980), this method aims at preventing
strategic surprises, minimizing surprise damage and responding to threats and opportunities ahead of
time.
The experimental process of the method also aligns with the basic essentials of the foresight
process introduced by Cuhls (2003). Being dependent on the opinions of the experts, communicating
about the future, being flexible in shaping the future, comprising both qualitative and quantitative
procedures, and bringing people together for discussion about the future are the main rationales of
labeling this method as foresight. In addition, this method incorporates with three phases of the
foresight process defined by Horton (1999), including inputs, foresight, and outputs (Section 2.2).
The Internet was applied to provide the input and the clustering toolkit (CLUTO) was used for
converting retrieved information from the Internet into the format comprehensible to the experts

62
(Translation). The experts, who were not employees of the Christie Digital Company, were involved
in the project to interpret the results and make sense of them (Interpretation). The obtained knowledge
could further be presented to the managers of Christie Digital Company in various formats, including
presentations, reports, or roadmaps (Output).
Environmental scanning on the Internet not only enhances the peripheral vision of a firm, but
also increases a firm’s absorptive capacity by amplifying its knowledge acquisition. Knowledge
acquisition “refers to the firm’s routines and processes that allow it to analyze, process, interpret and
understand the information obtained from external sources” (Zahra & George, 2002, p. 189). This
external information brings diversity of knowledge to a firm and intensifies its cumulative absorptive
capacity, ultimately enabling the firm to assimilate and exploit new knowledge whenever it is
required. As Zahra and George indicated in 2002, the attributes of knowledge acquisition capability
are intensity, speed, and direction. A firm’s knowledge acquisition ability associates significantly
with the intensity and the speed of acquiring the required knowledge. As organizations are restricted
by internal resources, acquiring knowledge and the learning process is slower than usual, thus it might
take several years to build robust absorptive capacity. In addition, because the direction of acquiring
knowledge is complex and heterogeneous, firms should have individuals with diverse backgrounds
and varied expertise to successfully utilize external technologies.
6.1 Limitations
• The trends of this study are restricted by the mindsets of two experts. More consistent
results could certainly be obtained by having multiple experts with varied expertise and
knowledge in digital media and theatre production. Assessing the documents through
commonality in a group meeting would improve the degree of communication. Similarly,
the article by Talke (2007) clearly explained that a corporate mindset is an essential
element affecting innovative activities of a firm; he indicated that proactive, analytical,
aggressive and risk averse management actions are positively associated with a new
product performance toward market and technology perspective.
• A second limitation of the study involves the number of samples chosen from each
dataset. The analysis of the experts was based on only 40 samples. Obviously, for more
accurate results, it would have been better to examine more samples.
• A third limitation of the study is related to the selection of clustering algorithms and the
number of clusters. While the algorithm and the number of clusters was logically chosen,
better clustering results might be obtained through alternative methods. All steps

63
involved in the clustering process, including term filtering, tokenization, stemming, and
stop word removal affected the clustering results; thus, changing these steps could
modify the results. Moreover, in the K-means algorithm, the clustering number has to be
defined a priori. Because no ideal clustering number is defined in the literature, selection
of the proper clustering number is a challenge; hence, the alternative numbers might also
improve the results.
• Judging based on the analysis of one software product is another limitation of the study.
Although CLUTO has performed well with our huge number of documents, alternative
software might yield different results. It is worth mentioning that, initially, other text
mining software was tested; however most of them did not perform well with large
document collections, and could not offer clustering solutions.
6.2 Future Research
Three possible areas could be explored in future research including:
• Proposing powerful theoretical models to describe weak signals, their advantages, and
problems could guide strategic managers toward better insights about their peripheral
vision. Still weak signals theory suffers from lack of a precise definition in the literature
(see Section 2.4), and proposing a robust model that clearly defines its elements and
applications would be useful.
• As discussed in the methodology section, we entered the queries into the search engine in
year 2009. Information on the Internet is changing constantly; we can therefore enter the
queries into the search engine at special intervals and thus compare the results. For
example, one possible way is to put the queries into the search engine each year and
compare different years’ results to determine whether the same results will be obtained in
subsequent years or not. Selecting another search engine and applying the method for
another innovative product could also lead us to alternative results.
• In addition, alternative practical methods to detect weak signals by Internet-based
environmental scanning or any other systematic procedure could help organizations take
advantage of hidden opportunities and avoid future surprises. Although the importance of
detecting weak signals is emphasized in literature, few practical methodologies for its
detection were suggested. Further research into the developing and commercializing of a
robust tool for detecting weak signals in a real time is advised. Such a tool would detect

64
weak signals in real-time from huge amounts of data, including, blogs, complainers and
competitor’s boards, and websites.
The following method proposed by Day and Schoemaker (2002), however, may be applied by
organizations to clarify whether they need to utilize a tool for detecting weak signals or not.
However, we still emphasize the need for future studies to find a support tool for detecting
weak signals.
Day and Schoemaker (2002) proposed a peripheral vision tool that assist managers to
calculate their existing capability and need for peripheral vision, and hence help them to
locate their organizations in quadrants as vulnerable, vigilant, focused, and neurotic.
According to the authors, a vulnerable organization has low capability and high need for
peripheral vision. A vigilant organization has high capability and high need for peripheral
vision. A focused organization has low capability and low need for peripheral vision, and a
neurotic organization has high capability and low need for peripheral vision. Only a
vulnerable organization should actively enhance its peripheral vision and detect weak signals.
For other types of organizations, different kinds of strategies should be applied. Thus, we
recommend that managers use this tool for calculating their organization’s capability and
need for peripheral visions, and find whether the organization is vulnerable, vigilant, focused
or neurotic. Simultaneously, future study proposing a robust tool to detect weak signals is
recommended.

65
Appendix A: Micro Tiles
Christie Digital is a global visual technology company that provides a range of display
technologies and solutions for various application areas including cinema, business environments,
control rooms, and other high demanding organizations (Christie, 2011).
Currently, Christie Digital designs and delivers innovative display products known as Micro
Tiles to its market. Micro Tiles are small display units that are composed of modular 306 408
(16"×12") dimensions and weigh only 20 lb (9.4 kg). Micro Tiles lock together quickly and easily to
build a large display unit; hence, this flexibility allows a product to be built in just about any
environment. Due to Digital Light Processing (DLP) technologies, Christie’s Micro Tiles offer colour
ranges which are superior to the those of usual Liquid Crystal Display (LCD) and plasma
technologies. With Micro Tiles, audiences are able to perceive high resolution images in various
positions regardless of whether they sit away from, close to or at an angle to the display. Each Micro
Tile has a sensor inside which enables the detection of another unit, and thus the size and layout of
the displayed image is arranged in terms of its whole size. Micro Tiles have high resolution and low
servicing and maintainance costs; thus, each Micro Tile can be replaced or removed in less than 15
minutes from the front without shutting down the whole display. In addition, the radio frequency
remote control can be managed via the menu command on the displays from a distance of up to 100
metres. Micro Tiles can be applied in diverse places such as hotels, public spaces, museums, sporting
events, live theatres, and other areas requiring display solutions (Christie Micro Tiles, 2010).
Figure 14a: A Unit of Micro Tile
.
!

66
Figure 15b: An Example of a Micro Tile Display
Figure 16a: Dimensions of Micro Tiles
Figure 17c: Micro Tiles Easy Wall Installation and Services
Note.a Adopted from (Christie Micro Tiles, 2010). bAdopted from (Josiah, 2009). CAdopted from (Christie Digital System,
2011)

67
Appendix B: DEVONagent
DEVONagent provides a clean Mac-like user interface for finding information in the public
web with the use of more than 130 plug-ins for popular search engines, databases, and search tools.
As it performs its search, DEVONagent identifies pages that have broken, are out of date, or are
related to advertisements, and then filters these out before displaying the search results. Its unique
high-end Boolean search operators allow AND, OR, BEFORE, NEAR, NEXT, AFTER as well as
parentheses and wildcards to make search results more accurate. DEVONagent downloads each page
instead of displaying only the link. Searching with DEVONagent usually takes longer than searching
with regular search engine tools; however, ultimately the reader saves time by not needing to go
through every page and filter manually. DEVONagent assists the user in finding, collecting, and
organizing information while tightly integrating it with DEVONthink (Appendix C) for building an
organized archive of web pages (DEVONtechnologies, 2011).
As mentioned in the DEVONagent manual (DEVONtechnologies, 2011), there are several
appealing reasons for using DEVONagent:
• Getting improved search results
• Spending less time on searching for relevant results
• Searching more specifically
• Archiving searching and continuing at a later time
• Working effectively with Apple script and DEVONthink
Boolean Operators
• Syntax: Term 1 BOOLEAN OPERATORS Term 2
• AND: contains term 1 and term 2
• OR: contains term 1 or term 2
• NOT: does not contain term
• AFTER: term 1 occurs after term 2
• BEFORE: term1 occurs before term 2

68
Appendix C: DEVONthink
DEVONthink is based on a powerful artificial intelligence architecture that helps users to
find, store, organize, edit, analyze, and archive the documents on a Mac. It is a good option for
handling huge collections of data, since with only a few simple clicks it assists the user to gain a
broader view of the files and discover the relationship between them. DEVONthink Pro “allows user
to pull the signal out of an ocean of noise, and creates elegance, perspective, and order, out of
information overload” (DEVONtechnologies, 2011, p. 8).

69
Appendix D: The Mathematical Definition of CLUTO’s Clustering Criterion Functions
Criterion Function Optimization Function
!!
!!
!!
!!
!!!
ℋ!
ℋ!
Note. Adopted from (Karypis, 2002, p. 10). is “ the total number of clusters. is the total objects to be clustered, the
set of objects assigned to the ith cluster, is the number of objects in the ith cluster, and represent two objects, and
is the similarity between two objects” (Karypis, 2002, p. 10).
( )1 ,
1 ( , )i
k
i u v Si
maximize sim v un= ∈
∑ ∑
( )1 ,
,i
k
i u v S
maximize sim v u= ∈∑ ∑
( )
( ),
1,
,
,i
i
ku S v S
ii
u v S
sim v uminimize n
sim v u∈ ∈
=∈
∑∑
∑
( )( )
,
1 ,
,
,i
i
ku S v S
i u v S
sim v uminimize
sim v u∈ ∈
= ∈
∑∑ ∑
( )( )
,2
1 ,
,
,i
i
ku S v S
ii u v S
sim v uminimize n
sim v u∈ ∈
= ∈
∑∑ ∑
1
1
maximize TE
2
1
minimize TEk S iS
in v u( , )sim v u

70
Appendix E: Forty-eight Queries Suggested by the Experts
No Query Number of Documents
1 modular AND projector OR video BEFORE display 3075
2 adaptive BEFORE theatrical OR theatre BEFORE set OR environment 9427
3 adaptive BEFORE optics BEFORE video AND projector AND display 58
4 adaptive OR modular AND video BEFORE technology 646
5 adaptive OR modular AND display BEFORE technology 759
6 laser AND projection 1275
7 digital AND media AND performance AND projection AND led 158
8 digital AND theatre AND live AND lcd 247
9 drama AND innovation AND performance AND technology AND display 92
10 display AND technology NOT cinema NOT television 2616
11 telemetric AND theatre AND digital 188
12 tile AND led AND display AND video NOT television 172
13 lcd AND laser AND video AND display AND theatre 120
14 presence AND resolution AND experience AFTER digital AND projection 140
15 laser OR oled OR foled AND modular AND digital display 139
16 wearable AND display AND digital NOT ubiquitous AND computing 707
17 telepresence AND modular AND mobile AND scalable NOT corporate 52
18 advert* AND techno* AND screen NOT billboard 63
19 architect AND screens AND projection AND digital NOT animation 109
20 drama AND digital arts NOT animation AND laser AND projection 51
21 drama AND projection OR experiment OR laser 5017
22 digital AND display AND indoor 788
23 digital BEFORE display AND theatre OR performance 2500
24 performing BEFORE arts AND digital AND innovation 326
25 digital AND interaction AND public AND performance 620
26 projection AND theatre AND performance AND movie AND TV 96

71
Forty-eight Queries Suggested by the Experts – Continued
No Query Number of Documents
27 installation AND performance AND art AND theatre AND stage 251
28 intermedial AND technology AND projection AND led AND display 20
29 virtual AND scenary AND lighting AND projection AND surface 6
30 multi AND screen AND display 1358
31 realtime AND network AND display 271
32 lambda AND display AND wall AND visualization 84
33 digital AND signage AND network AND control 1037
34 digital AND signage AND array AND control 346
35 modular AND (projectOR OR video) BEFORE display 403
36 adaptive BEFORE (theatrical OR theatre) BEFORE (set OR environment) 19
37 (adaptive BEFORE optics) BEFORE (video AND projectOR AND display) 6
38 (adaptive OR modular) AND (video BEFORE technology) 669
39 (adaptive OR modular) AND (display BEFORE technology) 535
40 (presence OR experience) after digital AND projection 547
41 resolution AFTER digital AND projection 673
42 (laser OR oled OR foled) AND modular AND "digital display" 73
43 wearable AND display AND digital AND (computing NOT ubiquitous) 661
44 advert and techno and screen not billboard 43
45 (drama and "digital arts" not animation) and laser and projection 29
46 drama and (projection or experiment or laser) 237
47 (digital before display) and (theatre or performance) 1101
48 (performing before arts) and digital and innovation 220

72
Appendix F: Python Code for Removing the Clusters
This is the Python code for removing the clusters used in the methodology procedure. When
each expert suggested removing some clusters, this code was applied to find the documents included
in those clusters. The documents and the related URLs were removed by the following code.
import sys
inputFile = file("2009D2-17-url")
outputFile = file("ndocs", "w")
inputClusterNums = file("2009D2-17.mat.clustering.23")
outputClusterNums = file("nnums", "w")
clustersToBeRemoved = {}
for i in xrange(1, len(sys.argv)):
clustersToBeRemoved[sys.argv[i]] = True
for line in inputClusterNums:
numCluster = line.strip()
doc = inputFile.readline()
doc = doc.strip()
if(numCluster not in clustersToBeRemoved):
outputClusterNums.write(numCluster + "\n")
outputFile.write(doc+"\n")
outputClusterNums.close()
outputFile.close()

73
Appendix G: Keyword Description for Boolean Search
OR NOT AND BEFORE AFTER
OR NOT AND BEFORE AFTER
OR NOT AND BEFORE AFTER
OR NOT AND BEFORE AFTER
OR NOT AND BEFORE AFTER
OR NOT AND BEFORE AFTER
OR NOT AND BEFORE AFTER
OR NOT AND BEFORE AFTER
OR NOT AND BEFORE AFTER
OR NOT AND BEFORE AFTER
OR NOT AND BEFORE AFTER
OR NOT AND BEFORE AFTER
OR NOT AND BEFORE AFTER
OR NOT AND BEFORE AFTER
OR NOT AND BEFORE AFTER
OR NOT AND BEFORE AFTER
NAME: KEYWORD DESCRIPTION FOR BOOLEAN SEARCH

74
Appendix H: Merging Scripts
Having plain text files of 48 queries, this code was applied to aggregate all plain text files
into one text file. This code was also applied for aggregating the URLs of the web pages.
set file1Path to "Macintosh HD:Users:nasimtabatabaei:Desktop:Result2010:Q1_text" set file2Path to "Macintosh HD:Users:nasimtabatabaei:Desktop:Result2010:Q2_text" set file3Path to "Macintosh HD:Users:nasimtabatabaei:Desktop:Result2010:Q3_text" set file4Path to "Macintosh HD:Users:nasimtabatabaei:Desktop:Result2010:Q4_text" set file5Path to "Macintosh HD:Users:nasimtabatabaei:Desktop:Result2010:Q5_text" set file6Path to "Macintosh HD:Users:nasimtabatabaei:Desktop:Result2010:Q6_text" set file7Path to "Macintosh HD:Users:nasimtabatabaei:Desktop:Result2010:Q7_text" set file8Path to "Macintosh HD:Users:nasimtabatabaei:Desktop:Result2010:M7_text"
set file1Text to read file file1Path set file2Text to read file file2Path set file3Text to read file file3Path set file4Text to read file file4Path set file5Text to read file file5Path set file6Text to read file file6Path set file7Text to read file file7Path
set finalText to file1Text & return & file2Text & return & file3Text & return & file4Text & return & file5Text & return & file6Text & return & file7Text
writeTo(finalText, file8Path, false, string) on writeTo(this_data, target_file, append_data, mode) -- append_data is true or false, mode is string
etc. (no quotes around either) try set target_file to target_file as Unicode text if target_file does not contain ":" then set target_file to POSIX file target_file as
Unicode text set the open_target_file to open for access file target_file with write permission if append_data is false then set eof of the open_target_file to 0 write this_data to the open_target_file starting at eof as mode close access the open_target_file return true on error try close access file open_target_file end try return false end try end writeTo
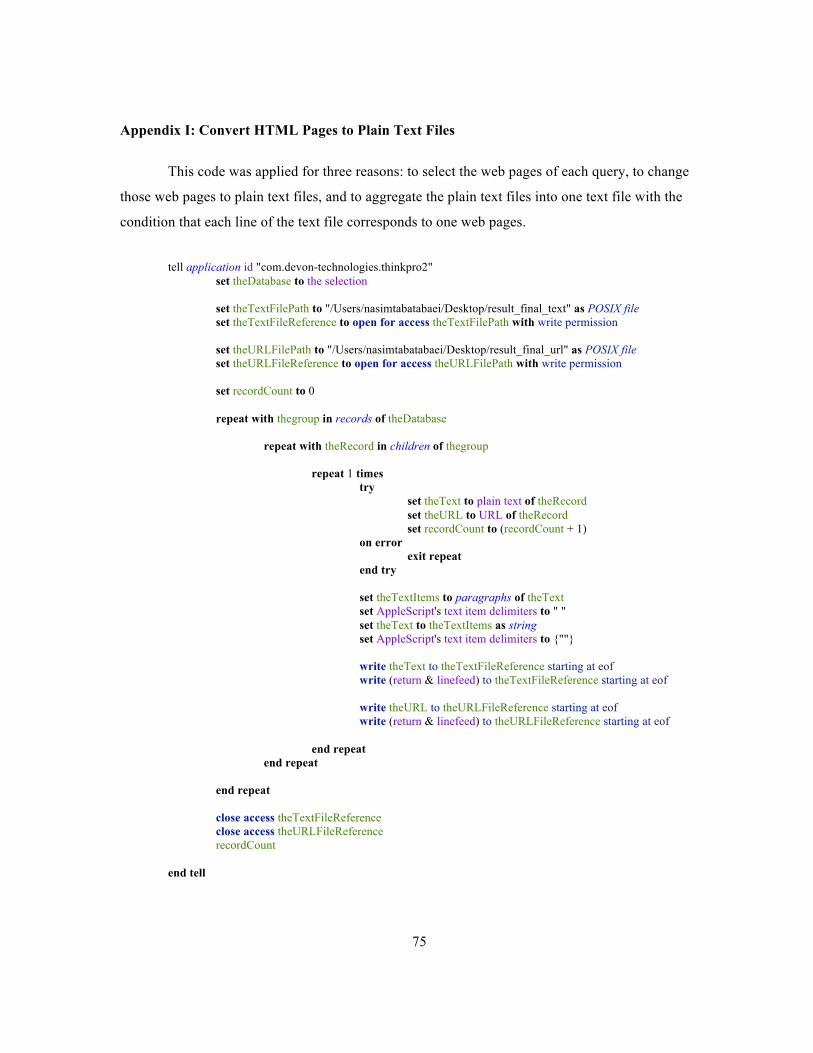
75
Appendix I: Convert HTML Pages to Plain Text Files
This code was applied for three reasons: to select the web pages of each query, to change
those web pages to plain text files, and to aggregate the plain text files into one text file with the
condition that each line of the text file corresponds to one web pages.
tell application id "com.devon-technologies.thinkpro2" set theDatabase to the selection set theTextFilePath to "/Users/nasimtabatabaei/Desktop/result_final_text" as POSIX file set theTextFileReference to open for access theTextFilePath with write permission set theURLFilePath to "/Users/nasimtabatabaei/Desktop/result_final_url" as POSIX file set theURLFileReference to open for access theURLFilePath with write permission set recordCount to 0 repeat with thegroup in records of theDatabase repeat with theRecord in children of thegroup repeat 1 times try set theText to plain text of theRecord set theURL to URL of theRecord set recordCount to (recordCount + 1) on error exit repeat end try set theTextItems to paragraphs of theText set AppleScript's text item delimiters to " " set theText to theTextItems as string set AppleScript's text item delimiters to {""} write theText to theTextFileReference starting at eof write (return & linefeed) to theTextFileReference starting at eof write theURL to theURLFileReference starting at eof write (return & linefeed) to theURLFileReference starting at eof end repeat end repeat end repeat close access theTextFileReference close access theURLFileReference recordCount end tell

76
Appendix J: Judgment Form for Evaluating the Web Pages
Technical Relevance for firm’s product management: Application Expectancy for theatre professionals:
• How likely is the Christie Digital product management • How likely is the UW creative / theatre production
team to find the information relevant to Micro Tiles? team to find the information inspires the novel or
unique application of Micro Tiles?
This set belongs to Smallest/ Medium/Largest dataset.
• Smallest: 1500 documents [_] • Medium: 7718 documents [_] • Largest: 38030 documents [_]
Document
Number
Clearly
Relevant
(p=>70%)
Maybe
Relevant
(p=70-‐30%)
Irrelevant
(p=<30%)
Document
Number
Clearly
Unexpected
(p=<30%)
Somewhat
Unexpected
(p=30-‐70%)
Expected
(p=>70%)
1 1
2 2
3 3
4 4
5 5
6 6
7 7
8 8
9 9
10 10
Total Total
Examiner’s name: Set Number: Date:

77
Appendix K: Sample A of the Web Pages
The following document is one sample of the web page that was evaluated by the experts. The
following is the experts’ judgments:
Expert 2 judgment: “Clearly Relevant”, “Clearly Unexpected”
Expert 1 judgment: “Irrelevant”, “Clearly Unexpected”

78
Appendix L: Sample B of the Web Pages
The following document is one sample of the web page that was evaluated by the experts. The
following is the experts’ judgments:
Expert 2 judgment: “Maybe Relevant”, “Somewhat Unexpected”
Expert 1 judgment: “Clearly Relevant”, “Somewhat unexpected”

79
References
Abebe, M., Angriawan, A., & Tran, H. (2010). Chief executive external network ties and
environmental scanning activities: An empirical examination. Strategic Management Review,
4(1), 30-43.
Aguilar, F. J. (1967). Scanning the business environment. New York: MacMillan.
Alallak, B. (2010). Evaluating the adoption and use of Internet-based marketing Information systems
to improve marketing intelligence. International Journal of Marketing Studies, 2(2), 87-101.
Albright, K. S. (2004). Environmental scanning: Radar for success. Information Management
Journal, 38(3), 38-45.
Andrews, N., & Fox, E. (2007). Recent developments in document clustering. Technical Reoprt,
Virginia Tech, Computer Science, Blacksburg.
Ansoff, I. H. (1965). Corporate strategy. New York: McGraw Hill.
Ansoff, I. H. (1975). Managing strategic surprise by response to weak signals. California
Management Review, 18(2), 21-33.
Ansoff, I. H. (1980). Strategic issue management. Strategic Management Journal, 1(2), 131-148.
Ansoff, I. H. (1982). Strategic response in turbulent environments. Working paper.
Ansoff, I. H. (1984). Implanting strategic management. New Jersey: Prentice Hall International.
Blanco, S., & Lesca, H. (1997). Environmental Scanning : Designing a collective learning process to
track down weak signals. Presentation in Actes de la 3e Conferénce de l’AIS Amérique
(Association for Information Systems), Indianapolis, USA.
Castellano, M., Mastronardi, G. A., & Tarricone, G. (2007). A web text mining flexible architecture.
International Journal of Computer Science and Engineering, 1(4), 252-259.
Castillo, R. A. (2009). Christie Digital final report. Waterloo, Ontario.
Chakrabarti, S. (2003). Mining the web: Discovering knowledge from hypertext data. San Francisco:
Morgan Kaufman Publisher.
Chandler, A. (1962). Strategy and structure: Chapters in the history of industrial enterprise. New
York: Doubleday.
Choo, C. W. (1993). Environmental Scanning: Acquisition and use of information by chief executive
officers in the Canadian Telecommunication Industry (Doctoral dissertation). Retrieved from
http://choo.fis.utoronto.ca/fis/respub/choo.diss.pdf
80
Choo, C. W. (2001). Environmental scanning as information seeking and organizational learning.
Retrieved August 11, 2011, from http://choo.fis.utoronto.ca/fis/respub/chooimreader.pdf
Choo, C. W., & Auster, E. (1993). Environmental scanning: Acquisition and use of information by
managers. Annual Review of Information Science and Technology, 28, 279-314.
Choudhary, A., Oluikpe, P., Harding, J., & Carrillo, P. (2009). The needs and benefits of text mining
applications on post-project reviews. Computers in Industry, 728-740.
Christie Digital System. (2010). Christie Micro Tiles: The new digital canvas. Retrieved July 27,
2011, from Christie Micro Tiles:
http://www.microtiles.co.uk/downloads/MicroTilesBrochure_Nov112009.pdf
Christie Digital system. (2011). About Christie. Retrieved July 28, 2011, from Christie Digital
Company: http://www.christiedigital.com:80/en-us/about-christie/Pages/default.aspx
Christie Digital System. (2011). Christie MicroTiles Display Wall System. Retrieved August 14,
2011, from http://www.christiedigital.com/en-us/digital-
signage/products/microtiles/pages/microtiles-digital-signage-video-wall.aspx
Coffman, B. B. (1997). Weak Signal Research: Part I-V: Evolution and growth of the weak signal to
maturity. Retrieved August 14, 2011, from
http://www.mgtaylor.com/mgtaylor/jotm/winter97/wsrmatur.htm
Cohen, W. M., & Levinthal, D. A. (1989). Innovation and learning: The two faces of R&D. The
Economic Jounral, 99(397), 569-596.
Croft, W. B., Metzler, D., & Trevor, S. (2010). Search Engines: Information retrieval in practice.
Boston: Pearson.
Cuhls, K. (2003). From forecasting to foresight processes: New participative foresight activities in
Germany. Journal of forecasting, 22(2-3), 93-111.
Cutting , D. R., Karger, D. R., Pedersen, J. O., & Turkey, J. W. (1993). A cluster based approach to
browsing of very large document collections. Conference on research and development in
information retrieval (pp. 318-329). Pittsburg: Association for Computing Machinery.
Daft, R. L., & Weick, K. E. (1984). Toward a model of organizations as interpretation systems.
Academy of Management Review, 9(2), 284-295.
Daft, R. L., Sormunen, J., & Parks, D. (1988). Chief executive scanning, environmental
characteristics, and company performance: An empirical study. Strategic Management
Journal, 9(2), 123-139.

81
Damanpour, F. (1991). Organizational innovation: a meta analysis of effects of determinants and
moderators. Academy of Management Journal, 34(3), 555-590.
Danneels, E. (2008). Organizational antecedents of second order competences. Strategic Management
Journal, 519-543.
Day, G. S., & Schoemaker, P. J. (2005). Scanning the periphery. Harvard Business Review, 1(12),
135-149.
Decker, R., Wagner, R., & Scholz, S. W. (2005). An internet-based approach to environmental
scnaning in marketing planning. Marketing Intelligence & Planning, 23(2), 189-200.
DEVONtechnologies. (2011). DEVONagent PRO version 3.0 manual. Retrieved August 14, 2011,
from http://www.devon-
technologies.com/files/documentation/DEVONagent%20Manual%20(screen).pdf
DEVONtechnologies. (2011). DEVONthink PRO version 2.0.9 manual. Retrieved August 14, 2011,
from http://www.devon-
technologies.com/files/documentation/DEVONthink%20Pro%20Manual%20(print).pdf
Ericson, K. A., & Lehmann, A. C. (1996). Expert and exceptional performance: Evidence of maximal
adaption to task constraints. Annual Review of Psychology, 273-305.
Fan, W., Wallace, L., Rich, S., & Zhang, Z. (2006). Tapping the power of text mining.
Communcation of The ACM, 49(9), 76-82.
Fayyad, U., Piatetsky-Shapiro, G., & Smyth, p. (1996). From data mining to knowledge discovery in
databases. American Association for Artificial Intelligence, 17(3), 37-54.
Ford, N., Miller, D., & Moss, N. (2002). Web search strategies and retrieval effectivenes: An
empirical study. Documentation, 58(1), 30-48.
Gupta, V., & Lehal, G. S. (2009). A survey of text Mining techniques and applications. Emerging
Technologies in Web Intelligence, 1(1), 60-76.
Haeckel, S. (2004). Peripheral vision: Sensing and acting on weak signals making meaning out of
apparent noise: The need for a new managerial framework. Long Range Planning, 37, 181-
189.
Hauck, G., Goodwin, J. T., Goodwin, D., Guild, P., & Sparkes, D. (2011). Seeding a lead: Exploring
the live theatre industry's reception of a pre-market Canadian display technology.
Henderson, R. M., & Clark, K. B. (1990). Architectural innovation: The reconfiguration of existing
product technologies and the failure of established firms. Administrative Science Quarterly,
35(1), 9-30.

82
Hiltunen, E. (2008). The future sign and its three dimensions. 40(3), 247-26.
Holscher, C., & Strube, G. (2000). Web search behavior of Internet experts and newbies. Computer
Networks, 33, 337-346.
Horton, A. (1999). A simple guide to sucessful foresight. The Journal of Future Studies, 1(1), 5-9.
Ilmola, L., & Kuusi, O. (2006). Filters of weak signals hinder foresight: Monitoring weak signals
efficiently in corporate decision-making. Futures, 38, 908-924.
Josiah. (2009, November 30). MicroTiles video walls. Retrieved August 14, 2011, from
http://touch.schematic.com/2009/11/microtiles-video-walls/
Kahalas, H. (1977). Long range planning: An open system view. Long Range Planning, 10(5), 78-82.
Karypis, G. (2002). CLUTO: A clustering toolkit. University of Minnesota, Department of Computer
Science and Engineering, Minnesota.
Karypis, G. (n.d.). Doc2mat. Retrieved August 14, 2011, from
http://glaros.dtc.umn.edu/gkhome/files/fs/sw/cluto/doc2mat.html
Kobayashi, M., & Takeda, K. (2000). Information retrieval on the web. Association for Computing
Machinery , 32(2), 144.
Kosala, R., & Blockeel, H. (2000). Web research: A survey. ACM SIGKDD Explorations Newsletter,
2(1).
Kuosa, T. (2010). Futures signals sense-making framework (FSSF): A start-up tool to analyse and
categorise weak signals, wild cards, drivers, trends and other types of information. Futures,
42(1), 42-48.
Liu, S. (1998). Strategic scanning and interpretation revisiting: Foundations for a software agent
support system. Industrial Management & Data Systems, 98(7), 295-312.
Loseiwic, P., Oard, D. W., & Kostoff, R. N. (2000). Textual data mining to support science and
technology management. Journal of Intelligence information Systems, 15, 99-119.
Merriam-Webster dictionary. (n.d.). Merriam-Webster dictionary. Retrieved September 16, 2011,
from Merriam-Webster dictionary: http://www.merriam-webster.com/dictionary/expert
Nag, R., Hambrick, D. C., & Chen, M.-J. (2007). What is startegic management, really? Inductive
derivation of a consensus definition of the field. Strategic Management Journal, 28, 935-955.
Olamadea, O. O., Oyebisib, T. O., Egbetokuna, A. A., & Adebowa, B. (2011). Environmental
scanning strategy of manufacturing companies in southwestern Nigeria. Technology Analysis
and Strategic Management, 23(4), 367-381.

83
Ontario Centres of Excellence. (n.d.). Proof of concept. Retrieved September 16, 2011, from Ontario
Centres of Excellence: http://www.oce-ontario.org/pages/rproof.aspx
Perry, D. C., Taylor, M., & Doerfe, M. L. (2003). Internet-based communication in crisis
management. Management Communication Quartely, 17(2), 206-232.
Pettigrew, A. M., Thomas, H., & Whittington, R. (2002). Handbook of strategy and management.
London: SAGE Publications Inc.
Porter, M. (1980). An algorithm for suffix stripping. Program, 14(3), 130-137.
Porter, M. E. (1985). Comptetive advanatge: Creating and sustaining superior performance. New
York: The Free Press.
Porter, M. E. (1991). Towards a dynamic theory of strategy. Strategic Management Journal, 12(S2),
95-117.
Purandre, P. (2008). Web mining: A key to improve business on web. IADIS European Conference
Data Mining, (pp. 155-159).
Reger, G. (2001). Technology foresight in companies: From an indicator to a network and process
perspective. 13(4), 533-553.
Rohrbeck, R. (2011). Corporate foresight: Towards a maturity model for the future orientation of a
firm series. Ohio: Physica-Verlag HD.
Rossel, P. (2009). Weak signals as a flexible framing space for enhanced management and decision-
making. Technology Analysis & Strategic Management, 21(3), 307-320.
Schwarz, J. O. (2005). Pitfalls in implementing a strategic early warning system. Future Studies, 7(4),
22-31.
Schwarz, J. O. (2009). Business wargaming: Developing foresight within a strategic simulation.
Technology Analysis & Strategic Management, 21(3), 291-305.
Selznick, P. (1957). Leadership in administration: A sociological interpretation. Los Angeles:
University of California Press.
Steinbach, M., Karypis, G., & Kumar, V. (2000). A comparison of document clustering techniques.
Minnesota: Department of Computer Science and Engineering.
Talke, K. (2007). Corporate mindset of innovating firms: Influence on new product performance. 24,
76-91.
Tan, S. S., Teo, H. H., Tan, B. C., & Wei, K. K. (1998). Environmental scanning on the Internet.
International conference on information systems, conference 19, (pp. 76-87).

84
Teo, T. S., & Choo, W. Y. (2001). Assessing the impact of using Internet for competitive intelligence.
Information & Management, 39(1), 67-83.
Tushman, M. L., & Anderson, P. (1986). Technological discontinuities and organizational
environments. Administrative Science Quarterly, 31(3), 439-465.
Uskali, T. (2005, August 30). Paying attention to weak signals: The key concept for innovation
journalism. 2(11), p. 19.
Vasudeva, G., & Anand, J. (2011). Unpacking absorptive capacity: A study of knowledge utilization
from alliance portfolios. The Academy of Management Journal, 54(3), 611-623.
Vidhya, K. A., & Aghila.G. (2010). Text mining process, techniques and tools : An overview.
International Journal of Information Technology and Knowledge Management, 2(2), 613-
622.
Voros, J. (2003). A generic foresight process. Foresight, 5(3), 10-21.
Zahra, S., & George, G. (2002). Absorptive capacity: A review reconceptualization and extension.
Academy of Management Review, 27(2), 185-203.
Zanasi, A. (2002). Text Mining: Competitive and customer intelligence in real business cases.
IntEmpres Conference Proceeding. LaHabana.
Zhao, Y., & Karypis, G. (2002). Evaluation of hierarchical clustering algorithms for document
datasets. Technical Report, 02-022, Department of Computer Science, Minnesota.
Zhao, Y., & Karypis, G. (2004). Empirical and theorical comparisons of selected criterion functions
for document clustering. Machine Learning, 55(3), 311-331.