detecting selection from dna sequence polymorphism data n. galtier cnrs umr 5171 – génome,...
TRANSCRIPT
DETECTING SELECTION FROM DNA SEQUENCEPOLYMORPHISM DATA
N. GALTIERCNRS UMR 5171 – Génome, Populations, Interactions, Adaptation
Université Montpellier 2, France
Atelier INSERM – La Londe Les Maures – Mai 2004
SEQUENCE POLYMORPHISM DATA
population(species)
SEQUENCE POLYMORPHISM DATA
population(species)
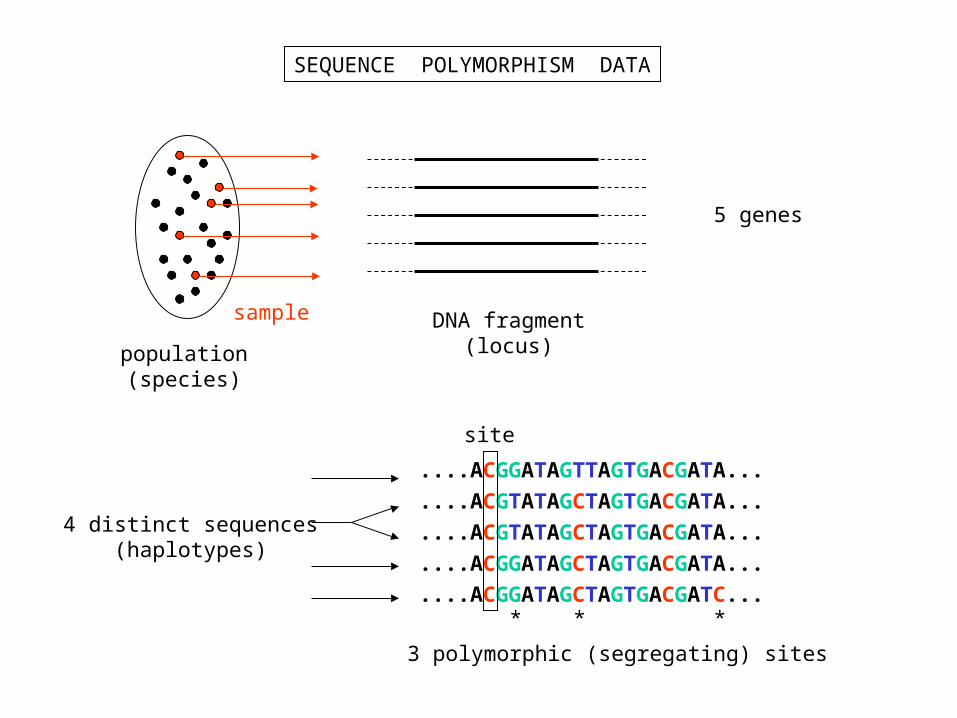
sample
5 genes
DNA fragment(locus)
....ACGGATAGTTAGTGACGATA...
....ACGTATAGCTAGTGACGATA...
....ACGTATAGCTAGTGACGATA...
....ACGGATAGCTAGTGACGATA...
....ACGGATAGCTAGTGACGATC...
site
* * *
3 polymorphic (segregating) sites
4 distinct sequences(haplotypes)
SEQUENCE POLYMORPHISM DATA
population(species)
sample
5 genes
DNA fragment(locus)
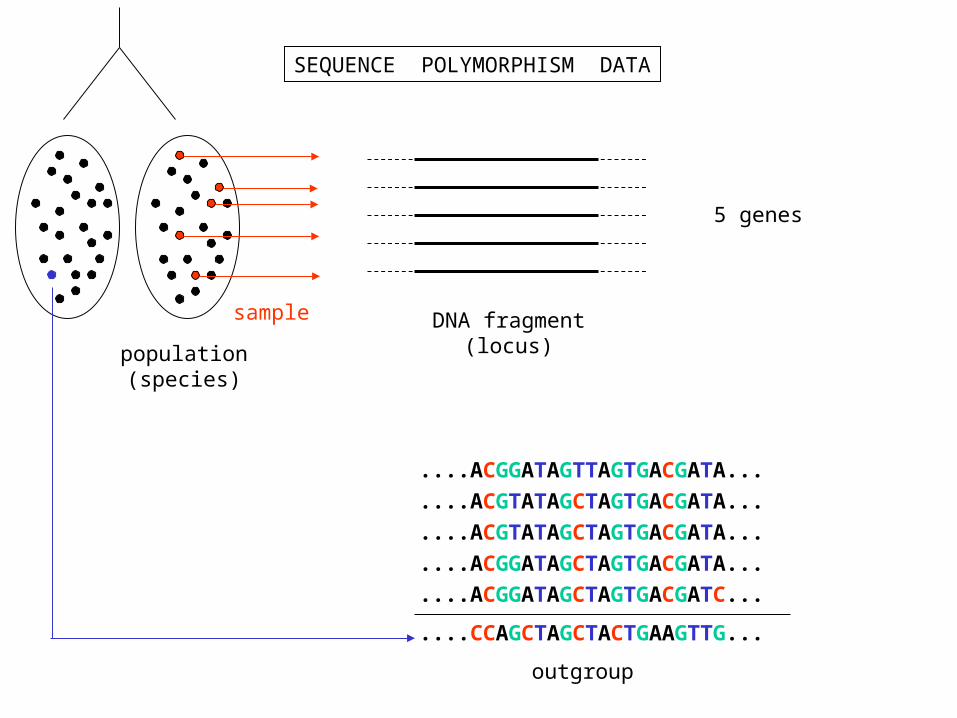
....ACGGATAGTTAGTGACGATA...
....ACGTATAGCTAGTGACGATA...
....ACGTATAGCTAGTGACGATA...
....ACGGATAGCTAGTGACGATA...
....ACGGATAGCTAGTGACGATC...
....CCAGCTAGCTACTGAAGTTG...
outgroup
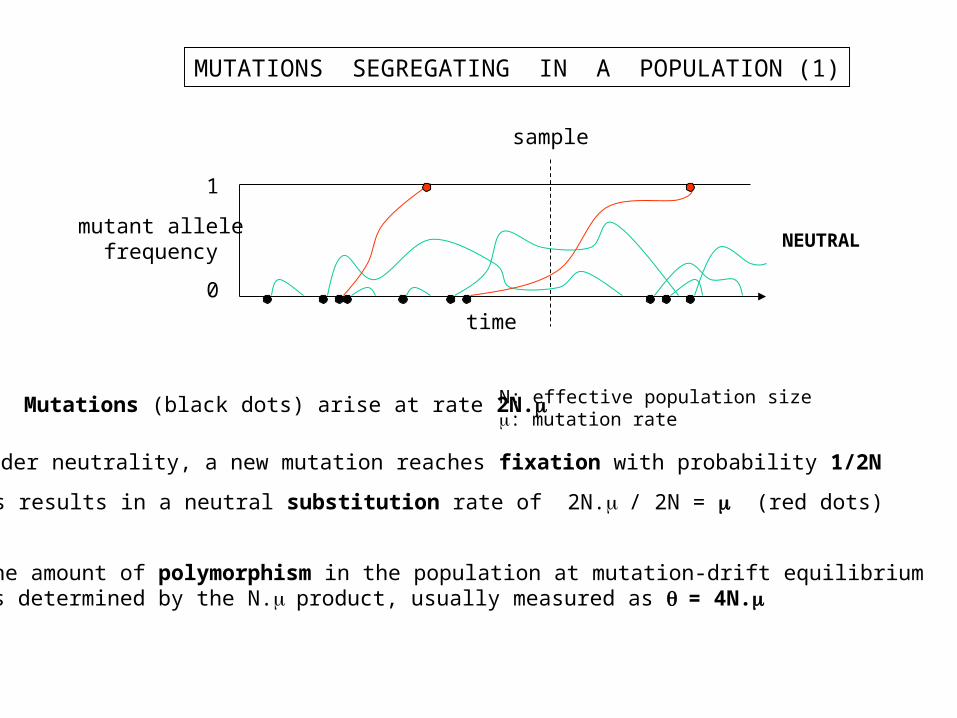
MUTATIONS SEGREGATING IN A POPULATION (1)
0
1
mutant allelefrequency
time
NEUTRAL
sample
Mutations (black dots) arise at rate 2N.
Under neutrality, a new mutation reaches fixation with probability 1/2N
This results in a neutral substitution rate of 2N./ 2N = (red dots)
N: effective population size: mutation rate
The amount of polymorphism in the population at mutation-drift equilibriumis determined by the N.product, usually measured as = 4N.
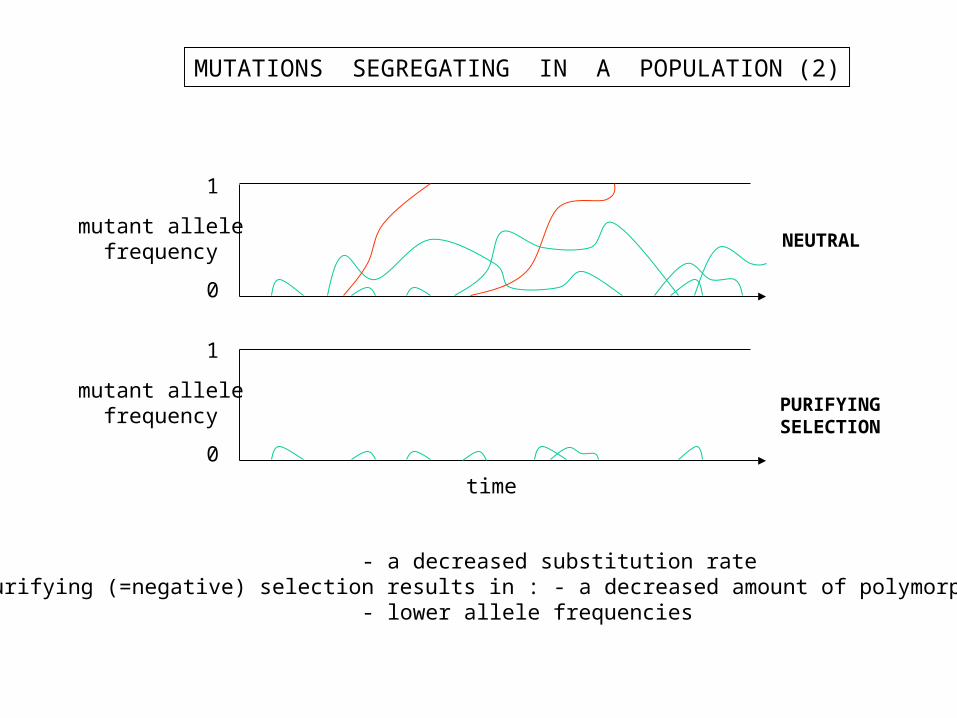
MUTATIONS SEGREGATING IN A POPULATION (2)
0
1
mutant allelefrequency
NEUTRAL
0
1
mutant allelefrequency
time
PURIFYINGSELECTION
- a decreased substitution ratePurifying (=negative) selection results in : - a decreased amount of polymorphism
- lower allele frequencies
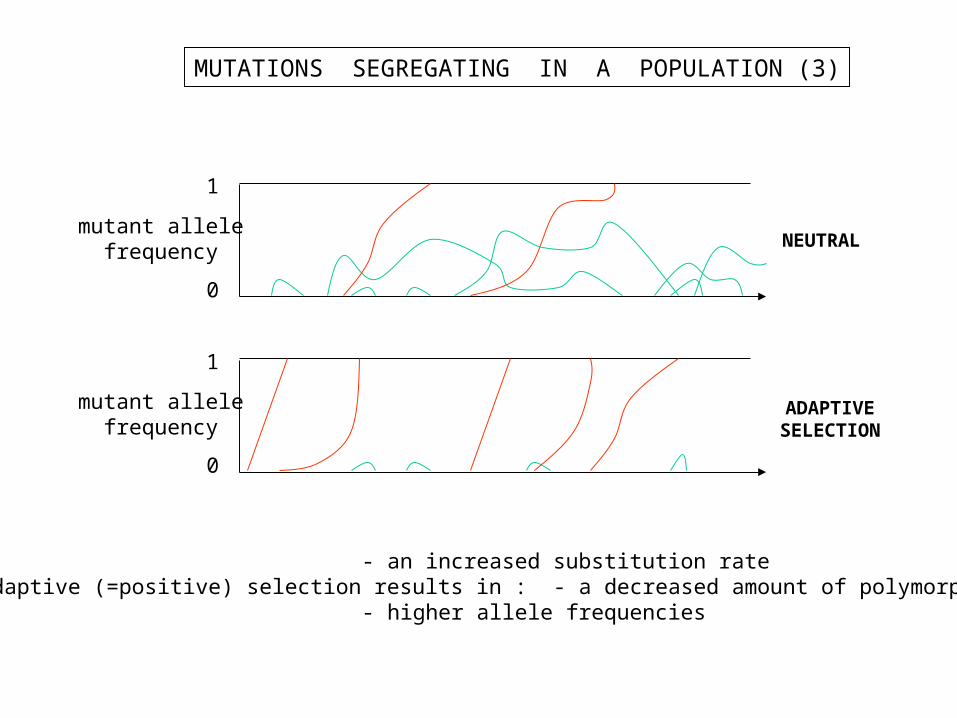
MUTATIONS SEGREGATING IN A POPULATION (3)
0
1
mutant allelefrequency
NEUTRAL
0
1
mutant allelefrequency
ADAPTIVESELECTION
- an increased substitution rateAdaptive (=positive) selection results in : - a decreased amount of polymorphism
- higher allele frequencies
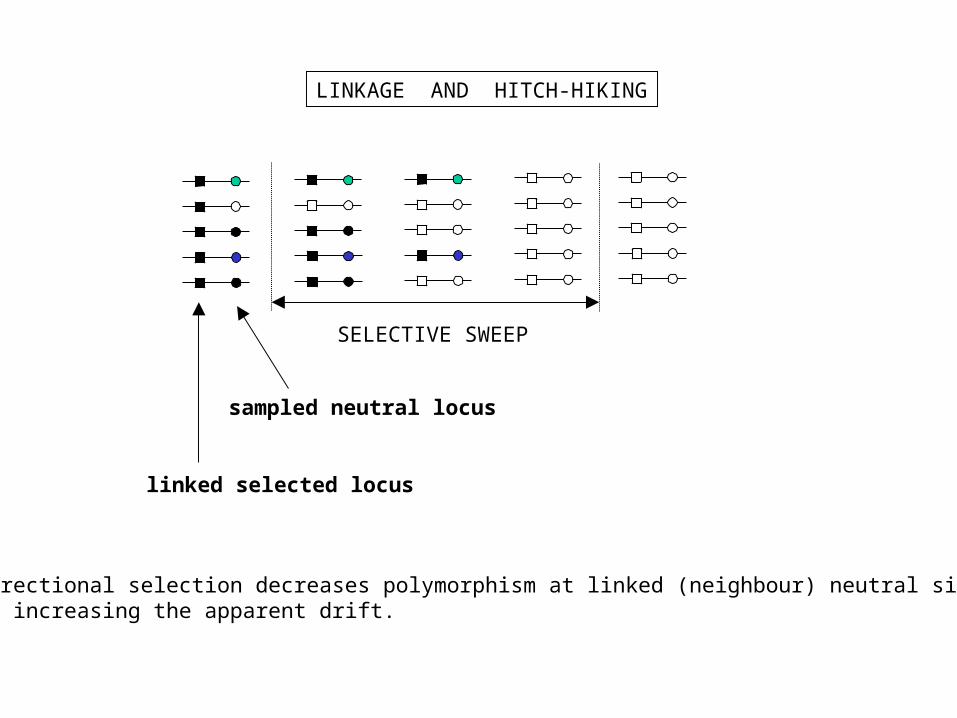
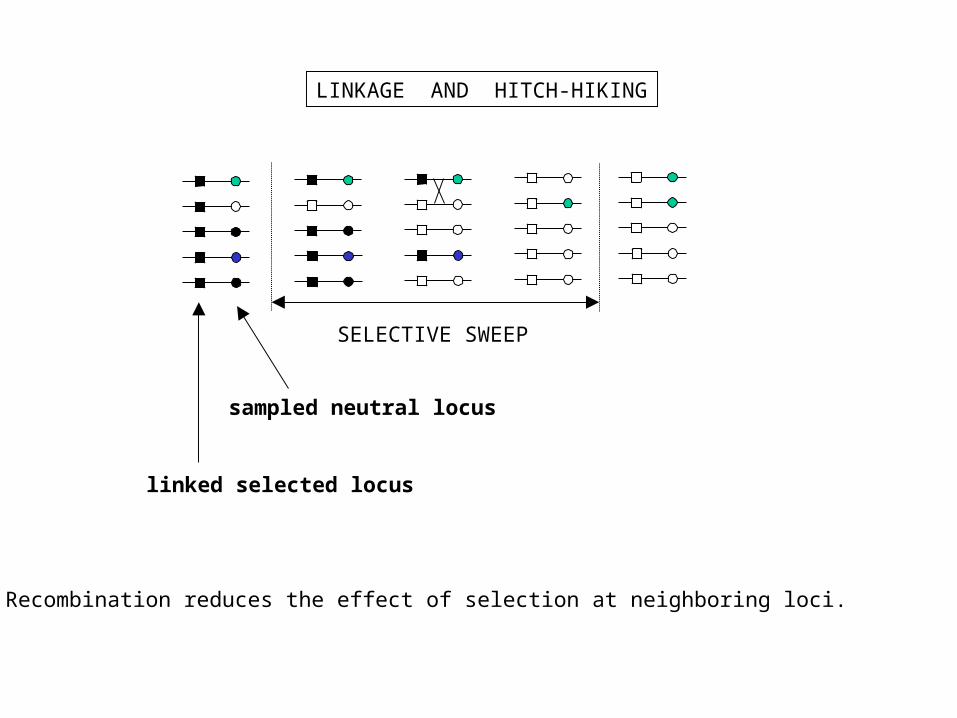
LINKAGE AND HITCH-HIKING
Directional selection decreases polymorphism at linked (neighbour) neutral sites by increasing the apparent drift.
SELECTIVE SWEEP
sampled neutral locus
linked selected locus
LINKAGE AND HITCH-HIKING
SELECTIVE SWEEP
sampled neutral locus
linked selected locus
Recombination reduces the effect of selection at neighboring loci.
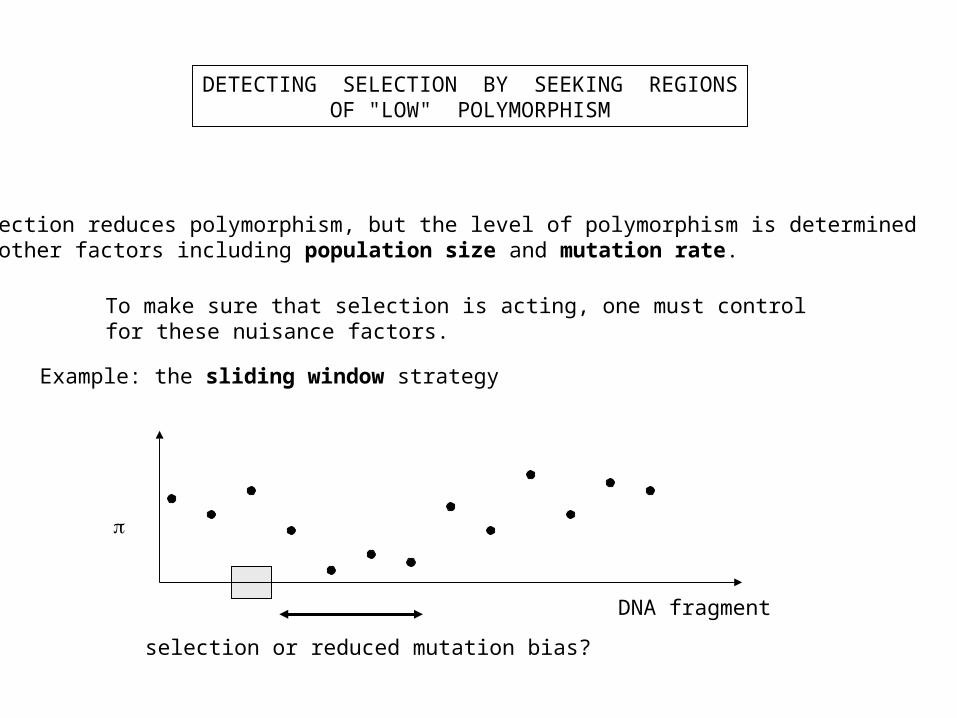
DETECTING SELECTION BY SEEKING REGIONSOF "LOW" POLYMORPHISM
Selection reduces polymorphism, but the level of polymorphism is determinedby other factors including population size and mutation rate.
To make sure that selection is acting, one must control for these nuisance factors.
Example: the sliding window strategy
selection or reduced mutation bias?
DNA fragment
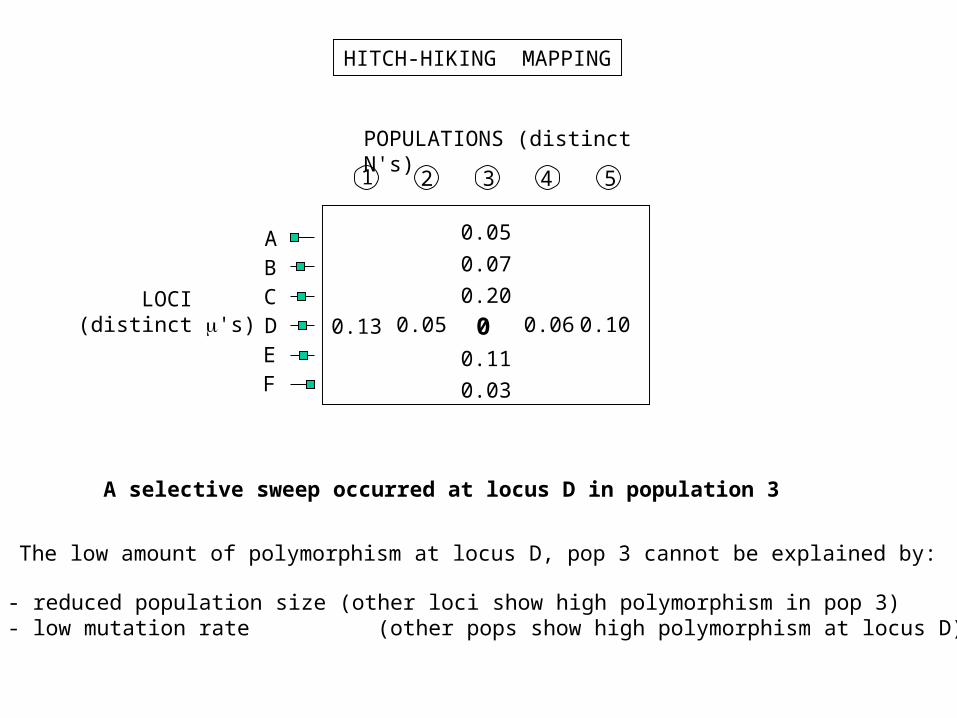
HITCH-HIKING MAPPING
POPULATIONS (distinct N's)
LOCI(distinct 's)
0.05
0.07
0.20
00.11
0.03
0.13 0.05 0.06 0.10
ABCDEF
1 2 3 4 5
A selective sweep occurred at locus D in population 3
- reduced population size (other loci show high polymorphism in pop 3) - low mutation rate (other pops show high polymorphism at locus D)
The low amount of polymorphism at locus D, pop 3 cannot be explained by:
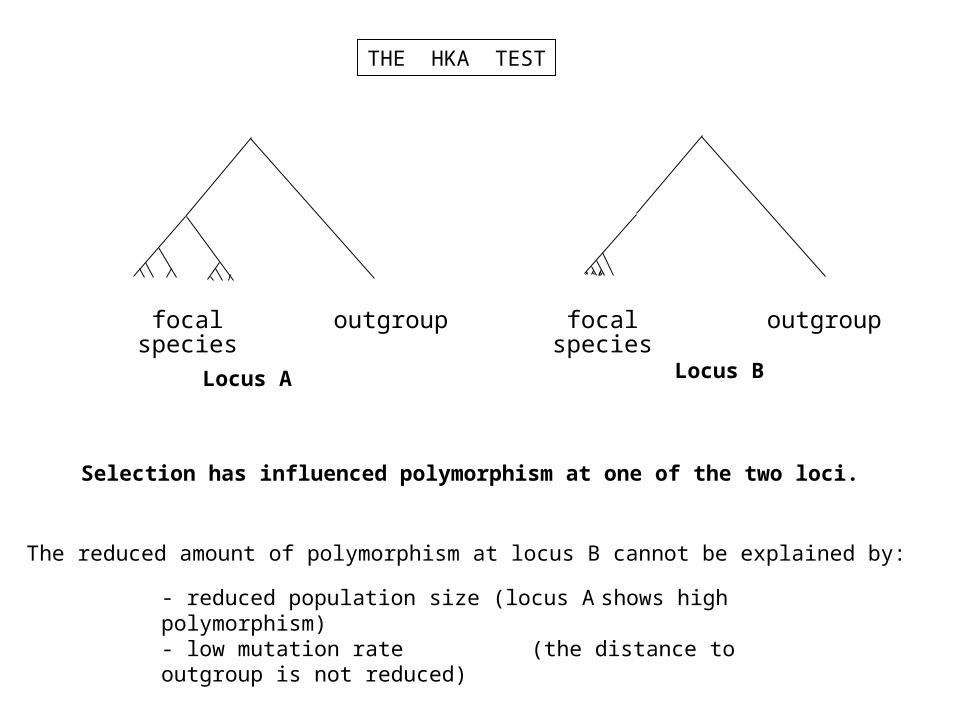
THE HKA TEST
Locus A Locus B
focal species outgroup focal species outgroup
Selection has influenced polymorphism at one of the two loci.
- reduced population size (locus A shows high polymorphism) - low mutation rate (the distance to outgroup is not reduced)
The reduced amount of polymorphism at locus B cannot be explained by:
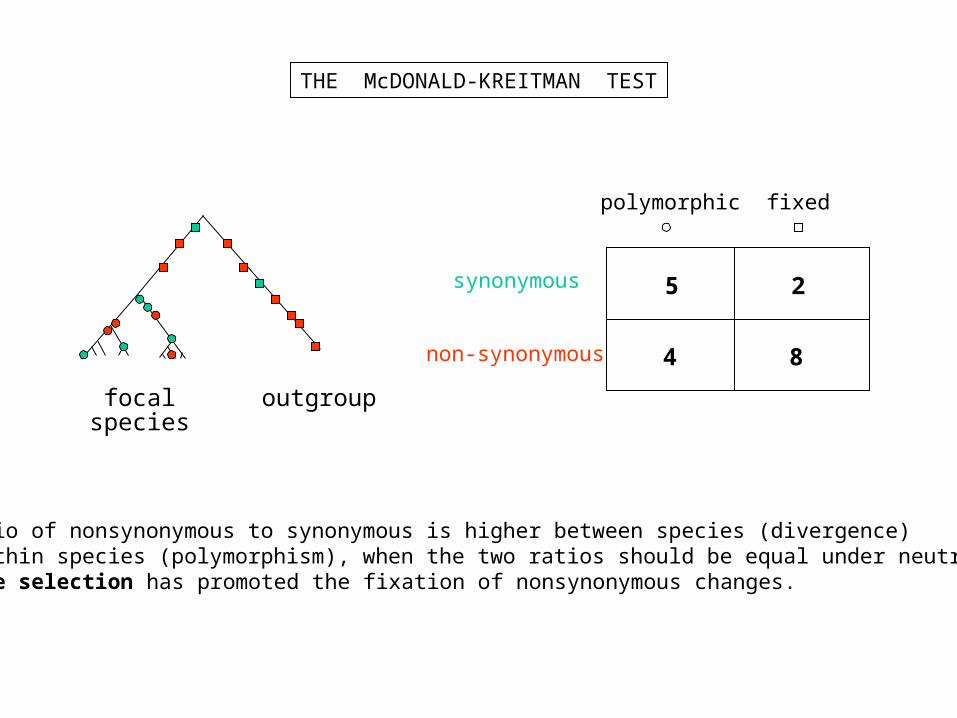
THE McDONALD-KREITMAN TEST
focal species outgroup
synonymous
non-synonymous
polymorphic fixed
5
4
2
8
The ratio of nonsynonymous to synonymous is higher between species (divergence) than within species (polymorphism), when the two ratios should be equal under neutrality: positive selection has promoted the fixation of nonsynonymous changes.
.
..
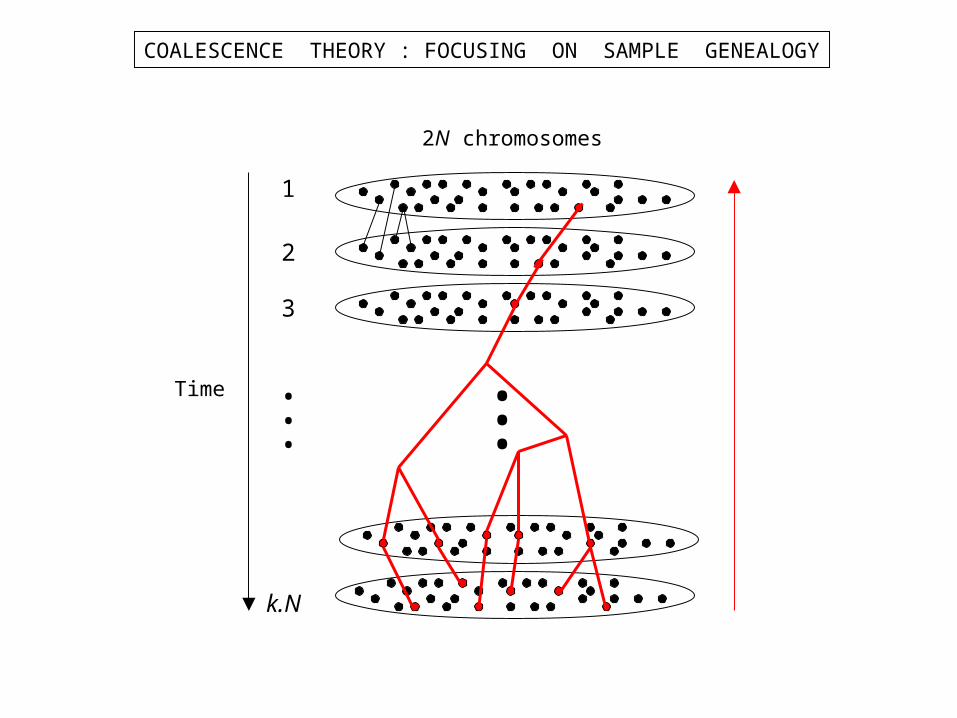
1
2
3
k.N
.
..Time
2N chromosomes
COALESCENCE THEORY : FOCUSING ON SAMPLE GENEALOGY
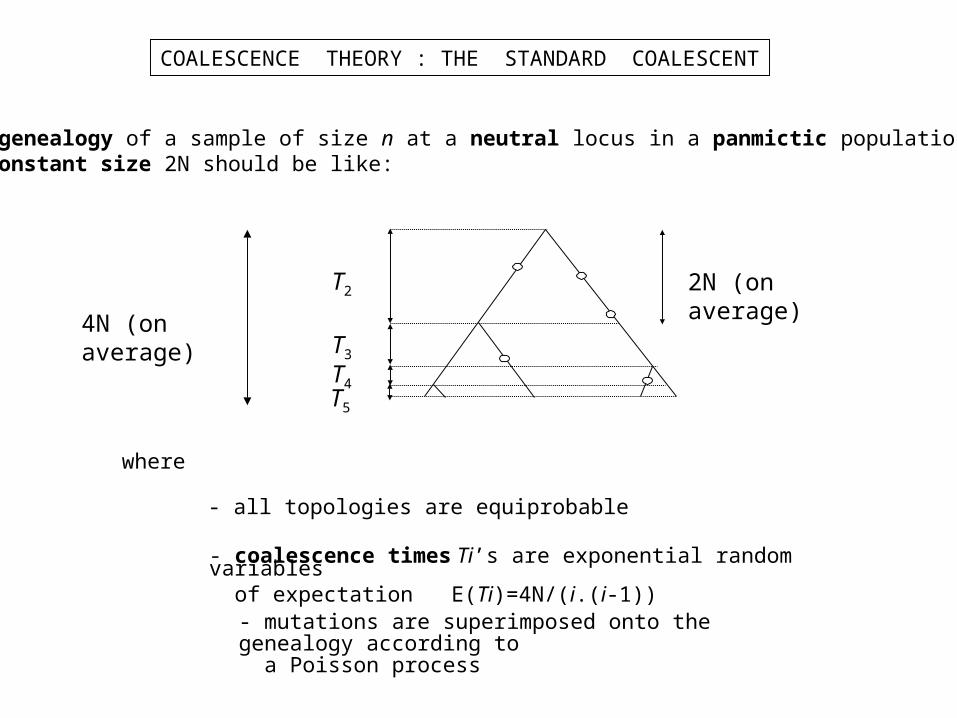
COALESCENCE THEORY : THE STANDARD COALESCENT
T2
T3
T4T5
4N (on average)
2N (on average)
The genealogy of a sample of size n at a neutral locus in a panmictic population of constant size 2N should be like:
- all topologies are equiprobable
- mutations are superimposed onto the genealogy according to a Poisson process
where
- coalescence times Ti’s are exponential random variables of expectation E(Ti)=4N/(i.(i-1))
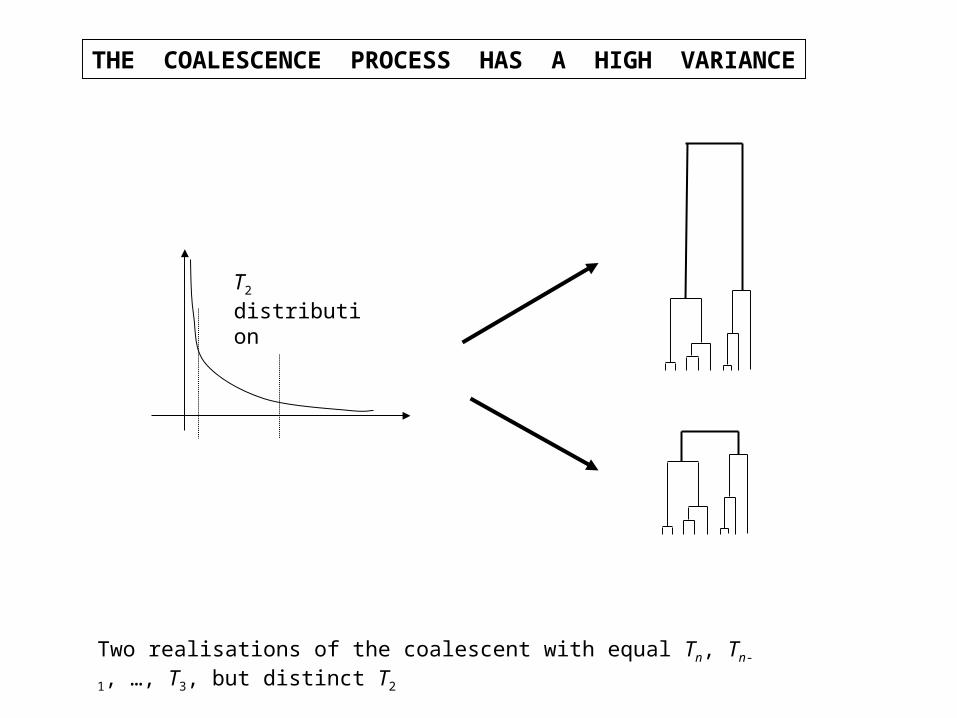
T2 distribution
Two realisations of the coalescent with equal Tn, Tn-1, …, T3, but distinct T2
THE COALESCENCE PROCESS HAS A HIGH VARIANCE
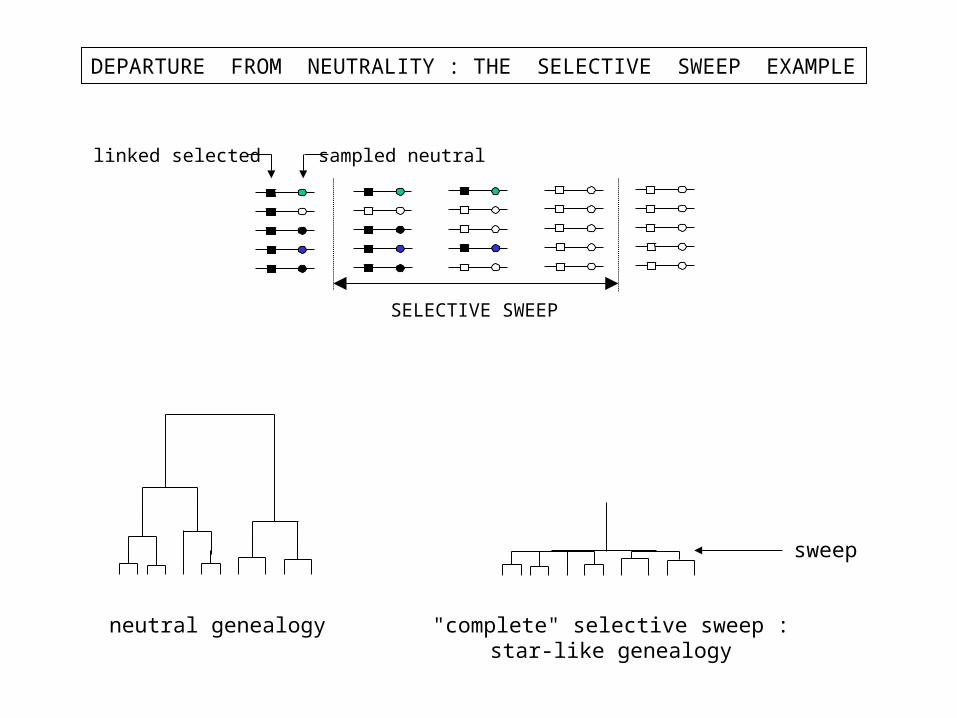
DEPARTURE FROM NEUTRALITY : THE SELECTIVE SWEEP EXAMPLE
SELECTIVE SWEEP
sampled neutrallinked selected
neutral genealogy
sweep
"complete" selective sweep :star-like genealogy
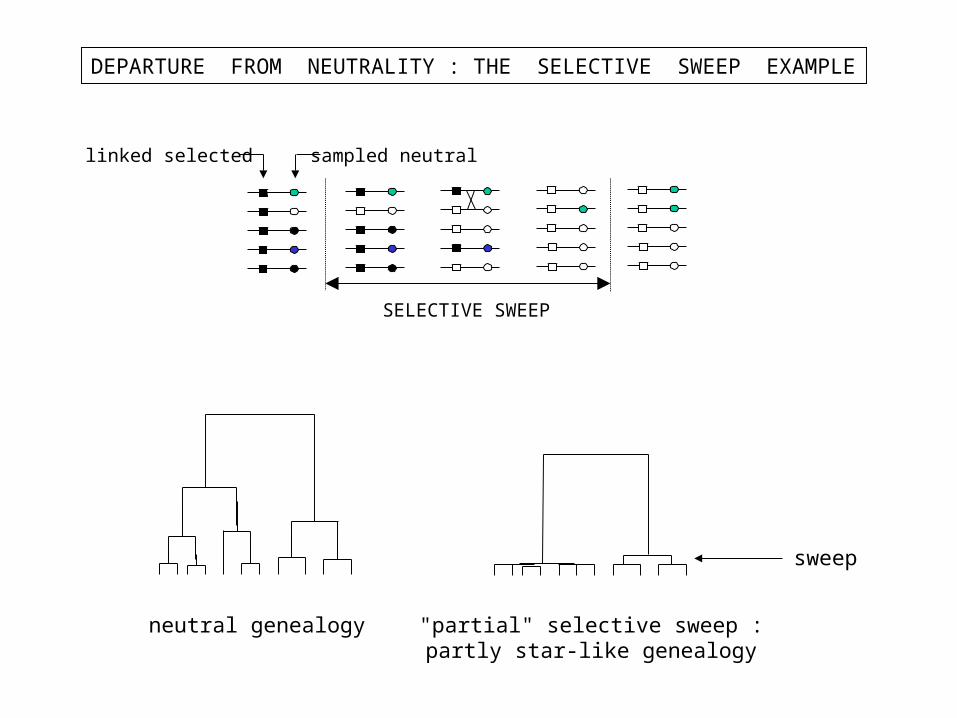
DEPARTURE FROM NEUTRALITY : THE SELECTIVE SWEEP EXAMPLE
SELECTIVE SWEEP
sampled neutrallinked selected
neutral genealogy "partial" selective sweep :partly star-like genealogy
sweep
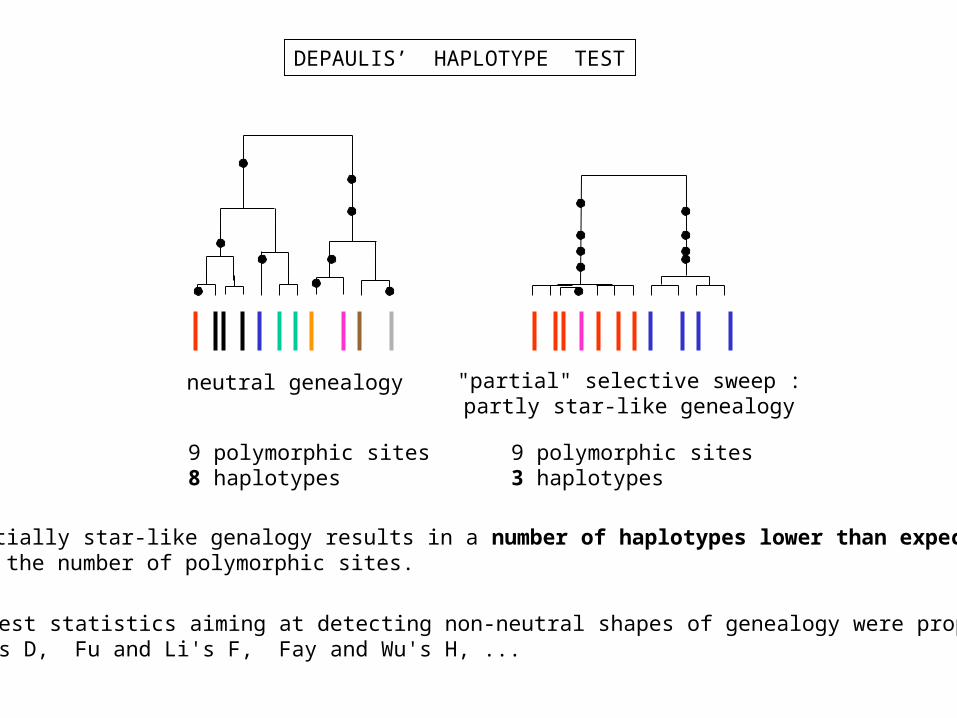
DEPAULIS’ HAPLOTYPE TEST
neutral genealogy "partial" selective sweep :partly star-like genealogy
9 polymorphic sites8 haplotypes
9 polymorphic sites3 haplotypes
A partially star-like genalogy results in a number of haplotypes lower than expectedgiven the number of polymorphic sites.
Other test statistics aiming at detecting non-neutral shapes of genealogy were proposed:Tajima's D, Fu and Li's F, Fay and Wu's H, ...
DEMOGRAPHY vs SELECTION
Detecting a departure from the standard coalescent means that at least one of its assumptions are wrong. Neutrality, unfortunately, is only one of them.
Demographic effects (departure from the constant-population size assumption)can distort genealogies in a way very similar to selection.
A bottleneck (sudden decrease of population size, followed by a restaurationof the former size), for example, has consequences highly similar to that ofa selective sweep.
To distinguish: multi-locus analysis.Demography impacts the whole genome, while selection is locus-specific.
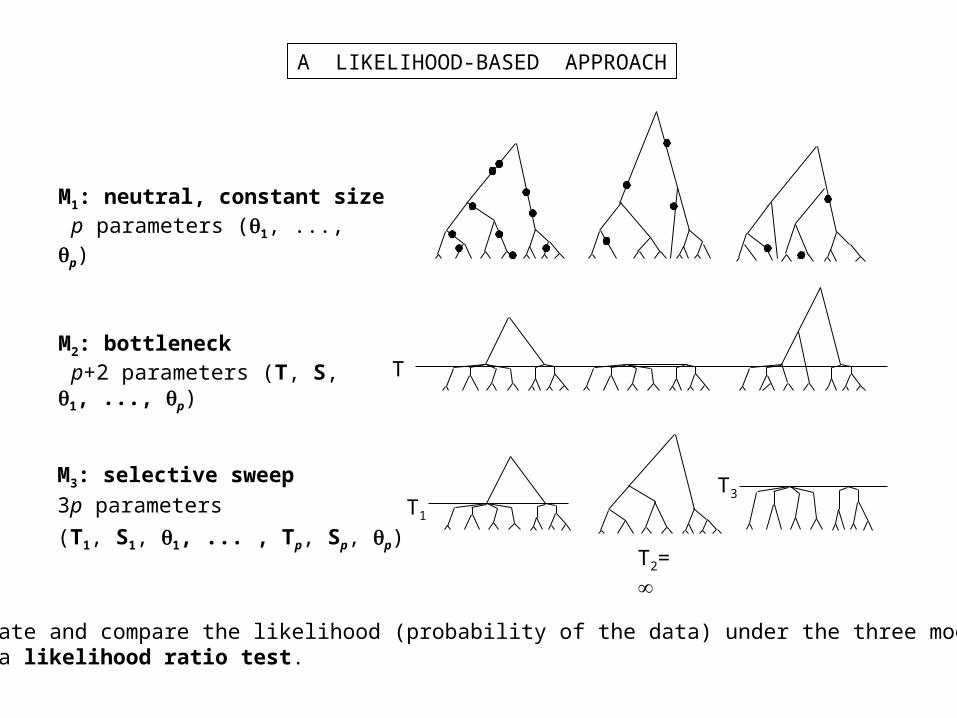
A LIKELIHOOD-BASED APPROACH
M1: neutral, constant size p parameters (1, ..., p)
M2: bottleneck p+2 parameters (T, S, 1, ..., p)
M3: selective sweep
3p parameters
(T1, S1, 1, ... , Tp, Sp, p)
T
T1
T2=
T3
Calculate and compare the likelihood (probability of the data) under the three modelsusing a likelihood ratio test.
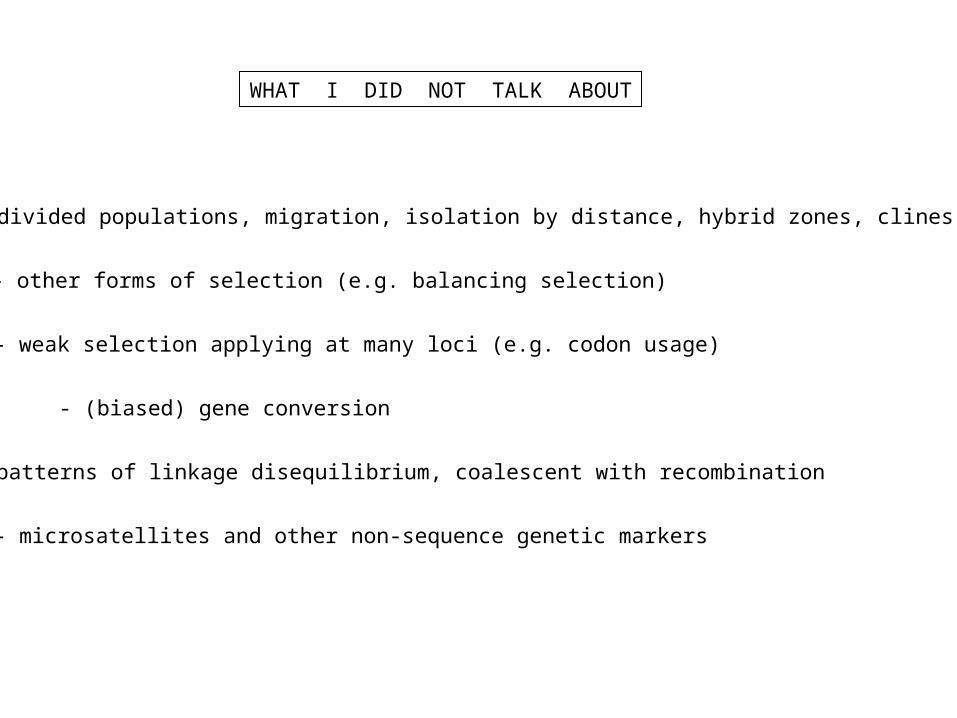
WHAT I DID NOT TALK ABOUT
- subdivided populations, migration, isolation by distance, hybrid zones, clines
- other forms of selection (e.g. balancing selection)
- weak selection applying at many loci (e.g. codon usage)
- (biased) gene conversion
- patterns of linkage disequilibrium, coalescent with recombination
- microsatellites and other non-sequence genetic markers