detailed stock report - higher school of economics · carter's, inc. (carter's) is a...
TRANSCRIPT

Last Close118.95 (USD)2018 January 17NEW YORK Exchange
Avg Daily Vol499,200
52-Week High119.66
Trailing PE22.9
Annual Div1.48
ROE32.6%
LTG Forecast10.3%
1-Mo Return5.4%
Market Cap5.6B
52-Week Low77.94
Forward PE19.1
Dividend Yield1.3%
Annual Rev3.3B
Inst Own>100%
3-Mo Return29.3%
AVERAGE SCORE
POSITIVE OUTLOOK: CRI's current score of 9places it within the top 15% of stocks scored.
Score Averages
Specialty Retailers Group: 5.8 Mid Market Cap: 6.2Retailers Sector: 5.9 S&P 500 Index: 6.9
Positive
Neutral
Negative
Average Score Trend (4-Week Moving Avg)
2015-01 2016-01 2017-01 2018-01
Peers -6M -3M -1M -1W Current 1Y Trend
AEO 6 6 9 9 9
CRI 7 8 9 9 9
URBN 4 6 10 10 9
KORS 7 10 8 8 8
FL 6 5 7 6 6
HIGHLIGHTS THOMSON REUTERS I/B/E/S MEAN- The score for Carter's Inc has been on a positive trend from 6
to 9 over the past 8 weeks.
- The recent change in the Average Score was primarily due toan improvement in the Earnings and Insider Tradingcomponent scores.
Buy Mean recommendation from all analysts coveringthe company on a standardized 5-point scale.12 Analysts
Sell Reduce Hold Buy StrongBuy
PRICE AND VOLUME CHARTS1-Year Return: 35.0% 5-Year Return: 99.4%
BUSINESS SUMMARYCarter's, Inc. (Carter's) is a marketer of apparel for babies and young children in the United States and Canada. The Company owns two brand namesin the children's apparel industry, Carter's and OshKosh B'gosh (OshKosh). The Company operates through five segments: Carter's Retail, Carter'sWholesale, OshKosh Retail, OshKosh Wholesale and International. Its International segment includes company-operated retail stores and onlineWebsites, wholesale operations, and royalty income from its international licensees. It markets products for consumers, and offer various productcategories, including baby, sleepwear, play clothes, and related accessories. Its multi-channel international business model - retail stores, online andwholesale - enables it to reach a range of consumers around the world. As of December 31, 2016, its channels included approximately 18,000wholesale locations, 792 stores in the United States, 164 stores in Canada, and its Canadian and the United States Websites.
CARTER'S INC (CRI-N)Retailers / Specialty Retailers / Apparel Retailers
STOCKREPORTS+DETAILED STOCK REPORT
Report Date: 2018 January 18
Page 1 of 12© 2017 Thomson Reuters. All rights reserved.

INDICATOR COMPONENTS
The AVERAGE SCORE combines the quantitative analysis of six widely-used investment decision making tools: Earnings,Fundamental, Relative Valuation, Risk, Price Momentum and Insider Trading. A simple average of the underlying component ratings isnormally distributed to rank stocks on a 1-10 scale (10 being awarded to the most favorable). These factors may be evaluated differentlyusing alternative methodologies and the importance of individual factors varies across industries, market capitalization and investmentstyles. Additional criteria should always be used to evaluate a stock.
Earnings Fundamental Relative Valuation Risk Price Momentum Insider Trading
OPTIMIZED SCORE
Historically, companies with an optimized scoreof 7 have tended to moderately outperform themarket over the following 12-month period.
As an alternative approach to equally weighting each of the six factors, independentresearch firm, Verus Analytics, conducted a backtest to empirically determine theoptimal factor blend. Results and weighting vary across four different marketcapitalization categories. For large cap stocks, price momentum and insider tradinghistorically provided the most explanatory power among the six factors and areweighted heavily in the current optimized score. Among the small cap universe, theearnings and fundamental factors joined with insider trading and price momentum toexplain returns.
PEER ANALYSIS Currency in USD
PRICE MOMENTUM VALUATION FUNDAMENTAL ANALYSTS
AverageScore Ticker
Price(2018-01-17)
1-MoReturn
3-MoReturn
1-YrReturn
MarketCap
TrailingPE
ForwardPE
DividendYield
NetMargin
LTGForecast
I/B/E/SMean
# ofAnalysts
9 ROST 81.30 7.0% 28.6% 21.1% 31.9B 26.0 21.6 0.8% 8.9% 10.0% Buy 25
4 LB 48.95 -15.8% 17.9% -19.9% 14.0B 14.9 15.2 4.9% 7.7% 7.8% Hold 29
7 GPS 33.26 -0.9% 25.3% 37.7% 13.2B 15.3 14.7 2.8% 5.6% 7.2% Hold 26
8 KORS 64.63 4.8% 31.9% 48.4% 9.9B 18.0 16.4 -- 12.7% 1.8% Hold 28
6 FL 48.07 5.3% 55.0% -31.1% 5.8B 12.1 11.4 2.6% 6.8% 1.3% Buy 20
9 CRI 118.95 5.4% 29.3% 35.0% 5.6B 22.9 19.1 1.2% 7.6% 10.3% Buy 12
9 URBN 33.77 3.0% 44.7% 25.3% 3.8B 22.5 18.2 -- 4.8% 10.7% Hold 24
9 AEO 17.74 1.8% 38.5% 16.0% 3.3B 19.3 13.5 2.8% 4.5% 1.6% Hold 19
3 GES 17.51 7.8% 8.3% 36.4% 1.4B 64.9 24.3 5.1% -0.1% -- Hold 5
6 ANF 18.86 12.9% 44.5% 56.5% 1.3B 314.3 67.6 4.2% -0.5% 18.0% Hold 16
9 BKE 19.95 -12.1% 27.5% -8.3% 1.0B 11.5 11.9 5.0% 9.2% -- Hold 3
7.2 Average 45.73 1.7% 31.9% 19.7% 8.3B 49.2 21.3 3.3% 6.1% 7.6% Hold 18.8
PEER COMPANIESROST Ross Stores Inc URBN Urban Outfitters IncLB L Brands Inc AEO American Eagle Outfitters IncGPS Gap Inc GES Guess? IncKORS Michael Kors Holdings ANF Abercrombie & Fitch CoFL Foot Locker Inc BKE Buckle Inc
CARTER'S INC (CRI-N)Retailers / Specialty Retailers / Apparel Retailers
STOCKREPORTS+DETAILED STOCK REPORT
Report Date: 2018 January 18
Page 2 of 12© 2017 Thomson Reuters. All rights reserved.

EARNINGS
POSITIVE OUTLOOK: Strong earnings withrecent analyst upgrades or a history ofsurpassing consensus estimates.
Currency in USD
Earnings Score Averages
Specialty Retailers Group: 6.0 Mid Market Cap: 6.0Retailers Sector: 6.1 S&P 500 Index: 6.6
Positive
Neutral
Negative
Earnings Score Trend (4-Week Moving Avg)
2015-01 2016-01 2017-01 2018-01
Peers -6M -3M -1M -1W Current 1Y Trend
AEO 3 7 10 10 10
KORS 7 10 10 10 10
CRI 8 6 9 9 9
FL 4 4 5 4 7
URBN 1 2 10 10 6
EARNINGS INDICATORSEarnings Surprises
(33.3% weight)Estimate Revisions
(33.3% weight)Recommendation Changes
(33.3% weight)
CRIKORS
AEOURBN
FL
AEO
FLKORSCRIURBN
KORSAEOFLURBN
CRI
Last 4 Quarters Last 4 Weeks Last 120 Days
# Positive Surprises (> 2%) 4 # Up Revisions 2 # Broker Upgrades 0# Negative Surprises (< -2%) 0 # Down Revisions 2 # Broker Downgrades 0# In-Line Surprises (within 2%) 0 Avg Up Revisions 16.7%Avg Surprise 9.6% Avg Down Revisions -16.7%
HIGHLIGHTS PRICE TARGET- Carter's Inc currently has an Earnings Rating of 9, which is significantly
more bullish than the Apparel Retailers industry average of 6.6.
- Over the past 90 days, the consensus price target for CRI hasincreased notably from 103.00 to 123.00, a gain of 19.4%.
- CRI's current quarter consensus estimate has remained relativelyunchanged over the past 90 days at 2.19. Estimates within its industryhave moved an average of 1.0% during the same time period.
The chart indicates where analysts predict the stock price will be withinthe next 12 months, as compared to the current price.
140
133
126
119
112
105Current Price
(USD)Price Target
118.95 MEAN
HIGH
LOW
12-Month Price Target
Mean (USD) 123.00High 133.00Low 105.00Target vs. Current 3.4%# of Analysts 10
CARTER'S INC (CRI-N)Retailers / Specialty Retailers / Apparel Retailers
STOCKREPORTS+DETAILED STOCK REPORT
Report Date: 2018 January 18
Page 3 of 12© 2017 Thomson Reuters. All rights reserved.

EARNINGS PER SHARE
Earnings per share (EPS) is calculatedby dividing a company's earnings by thenumber of shares outstanding. Analyststend to interpret a pattern of increasingearnings as a sign of strength and flator falling earnings as a sign ofweakness.
The charts provide a comparisonbetween a company's actual andestimated EPS, including the high andlow forecasts.
5.000
4.000
3.000
2.000
1.000
0.00016-12 17-03 17-06 17-09 17-12 18-03
Actuals Estimates
1.790
0.970 0.790
1.700
MEANHIGH
LOW
Quarterly 17-12 18-03Mean 2.191 1.166High 2.240 1.270Low 2.149 1.080# of Analysts 12 7
9.000
8.000
7.000
6.000
5.000
4.0002015 2016 2017 2018
Actuals Estimates
4.6105.140
MEAN
HIGH
LOW
Annual 2017 2018Mean 5.630 6.496High 5.700 7.470Low 5.600 6.140# of Analysts 12 12
MEAN ESTIMATE TREND ANALYST RECOMMENDATIONSQ
17-12Q
18-03Y
2017Y
2018Price
TargetCurrent 2.191 1.166 5.630 6.496 123.0030 Days Ago 2.181 1.125 5.621 6.304 111.0090 Days Ago 2.220 1.085 5.609 6.185 103.00% Change (90 Days) -1.3% 7.5% 0.4% 5.0% 19.4%
Current Fiscal Year End: 17-12Next Expected Report Date: 2018-02-21
Thomson Reuters I/B/E/S Mean: Buy (12 Analysts)
Strong Buy
Buy
Hold
Reduce
Sell
4
4
4
0
0
EARNINGS SURPRISESComparing a company's actual earnings to the mean expectation ofanalysts results in a difference referred to as a 'positive' or 'negative'surprise. Research has shown that when a company reports asurprise, it is often followed by more of the same surprise type.
Surprise Detail (Last 6 Periods)
SurpriseType
AnnounceDate
Period EndDate
ActualEPS
MeanEPS
Surprise(%)
Positive 2017-10-26 2017-09-30 1.700 1.652 2.9%Positive 2017-07-27 2017-06-30 0.790 0.701 12.7%Positive 2017-04-27 2017-03-31 0.970 0.839 15.6%Positive 2017-02-23 2016-12-31 1.790 1.673 7.0%Negative 2016-10-27 2016-09-30 1.610 1.672 -3.7%Positive 2016-07-27 2016-06-30 0.720 0.664 8.4%
Surprise Summary (Last 12 Quarters)
Surprise Type Amount PercentPositive Quarters (> 2%) 11 91.7%Negative Quarters (< -2%) 1 8.3%In-Line Quarters (within 2%) 0 --
ANNUAL REVENUEA pattern of increasing sales inconjunction with a rising EPS mayinfluence a buy recommendation, whileflat or falling sales and falteringearnings may explain a sellrecommendation. A rising EPS with flator falling sales may result fromincreased cost efficiency and margins,rather than market expansion. Thischart shows the sales forecast trend ofall analysts and the highest and lowestprojections for the current and nextfiscal year.
4.0B
3.8B
3.6B
3.4B
3.2B
3.0B2016 2017 2018
Actuals Estimates
3.2B
MEANHIGH
LOW
2017 2018Mean 3.4B 3.6BHigh 3.4B 3.6BLow 3.4B 3.5BForecasted Growth 6.3% 12.3%# of Analysts 10 10
CARTER'S INC (CRI-N)Retailers / Specialty Retailers / Apparel Retailers
STOCKREPORTS+DETAILED STOCK REPORT
Report Date: 2018 January 18
Page 4 of 12© 2017 Thomson Reuters. All rights reserved.

FUNDAMENTAL
POSITIVE OUTLOOK: Strong fundamentalssuch as high profit margins, low debt levels, orgrowing dividends.
Fundamental Score Averages
Specialty Retailers Group: 5.7 Mid Market Cap: 6.2Retailers Sector: 5.6 S&P 500 Index: 6.0
Positive
Neutral
Negative
Fundamental Score Trend
Q1 Q2 Q3 Q4 Q1 Q2 Q3 Q4 Q1 Q2 Q3 Q42015 2016 2017
PeersQ1
2017Q2
2017Q3
2017Q4
2017 Current 3Y Trend
FL 10 9 9 8 10
AEO 9 9 9 9 9
URBN 9 9 9 9 9
CRI 9 9 9 9 8
KORS 6 5 6 4 8
FUNDAMENTAL INDICATORSProfitability(25% weight)
Debt(25% weight)
Earnings Quality(25% weight)
Dividend(25% weight)
CRI
KORSAEOFLURBN
FLKORSURBN
AEOCRI
AEOURBN
FLCRIKORS
FLAEO
CRI
KORSURBN
Revenue Growth 5.6%For year over yearending 2017-09Gross Margin 44.7%For latest 12 monthsending 2017-09Return On Equity 32.6%For interim periodending 2017-09Net Margin 7.6%For latest 12 monthsending 2017-09
Current Ratio 3.2For interim periodending 2017-09Debt-to-Capital 42.4%For annual periodending 2016-12Interest Funding 9.4%For interim periodending 2017-04Interest Coverage 16.3For interim periodending 2017-09
Oper. Cash Yield 46.8%For latest 12 monthsending 2017-09Accruals -2.3%For latest 12 monthsending 2016-12Days Sales In Inv. 102.5For annual periodending 2016-12Days Sales In Rec. 23.4For annual periodending 2016-12
Dividend Growth 19.0%For year over yearending 2017-09Dividend Payout 28.8%For latest 12 monthsending 2017-09Dividend Coverage 5.2For annual periodending 2016-12Current Div. Yield 1.3%For latest 12 monthsending 2018-01
HIGHLIGHTS- Carter's Inc currently has a Fundamental Rating of 8. The average
Fundamental Rating for its Apparel Retailers industry is 6.4 and theS&P 500 index average is 5.9.
- CRI's net margin of 7.6% is substantially above the Apparel Retailersindustry average of 3.1%.
- CRI's current ratio of 3.2 is substantially above the Apparel Retailersindustry average of 2.1.
- CRI's operating cash yield of 46.8% is substantially below the ApparelRetailers industry average of 125.6%.
- Of the 40 firms within the Apparel Retailers industry, Carter's Inc isamong 22 companies that pay a dividend. The stock's dividend yieldis currently 1.3%.
CARTER'S INC (CRI-N)Retailers / Specialty Retailers / Apparel Retailers
STOCKREPORTS+DETAILED STOCK REPORT
Report Date: 2018 January 18
Page 5 of 12© 2017 Thomson Reuters. All rights reserved.

RELATIVE VALUATION
NEUTRAL OUTLOOK: Multiples relatively in-linewith the market.
Relative Valuation Score Averages
Specialty Retailers Group: 6.3 Mid Market Cap: 5.1Retailers Sector: 6.2 S&P 500 Index: 5.2
Positive
Neutral
Negative
Relative Valuation Score Trend (4-Week Moving Avg)
2015-01 2016-01 2017-01 2018-01
Peers -6M -3M -1M -1W Current 1Y Trend
FL 10 10 5 5 5
URBN 8 6 5 5 5
AEO 10 5 4 4 4
CRI 7 7 5 4 4
KORS 10 10 4 3 3
RELATIVE VALUATION INDICATORSForward PEG
(50% weight)Trailing PE(25% weight)
Forward PE(25% weight)
URBNCRI
AEOFLKORS
FLKORS
AEOCRIURBN
FLAEO
KORSCRIURBN
Forward PEG 2.1
5-Yr Average 1.3
Rel. to 5-Yr Avg. 61% Premium
S&P 500 Index 1.5
Rel. to S&P 500 43% Premium
Trailing PE 22.9
5-Yr Average 23.0
Rel. to 5-Yr Avg. 0.3% Discount
S&P 500 Index 26.5
Rel. to S&P 500 14% Discount
Forward PE 19.1
5-Yr Average 18.4
Rel. to 5-Yr Avg. 4% Premium
S&P 500 Index 19.5
Rel. to S&P 500 2% Discount
HIGHLIGHTS- Carter's Inc currently has a Relative Valuation Rating of 4 which is
significantly below the S&P 500 index average rating of 5.2.- CRI's 2.1 Forward PEG is currently at the high end of its 5-year range
(lowest 0.9 to highest 2.1).
- CRI's Trailing P/E of 22.9 represents a 0.3% Discount to its 5-yearaverage of 23.0.
- CRI's Forward P/E of 19.1 represents a 4% Premium to its 5-yearaverage of 18.4.
CARTER'S INC (CRI-N)Retailers / Specialty Retailers / Apparel Retailers
STOCKREPORTS+DETAILED STOCK REPORT
Report Date: 2018 January 18
Page 6 of 12© 2017 Thomson Reuters. All rights reserved.

PRICE TO SALESThe most recent week's close price divided by the revenue per share.
Price to Sales: 1.75-Year Average: 1.6
S&P 500 Index Average: 2.2Apparel Retailers Industry Average: 1.1
1.11.21.31.41.51.61.71.81.92.02.1
20172016201520142013
5-Yr Average
TRAILING PEThe most recent week's close price divided by the sum of the four mostrecently reported quarterly earnings.
Trailing PE: 22.95-Year Average: 23.0
S&P 500 Index Average: 26.5Apparel Retailers Industry Average: 26.6
1618202224262830323436
20172016201520142013
5-Yr Average
FORWARD PEThe most recent week's close price divided by the sum of the fourupcoming quarterly consensus estimates.
Forward PE: 19.15-Year Average: 18.4
S&P 500 Index Average: 19.5Apparel Retailers Industry Average: 17.2
1415161718192021222324
20172016201520142013
5-Yr Average
FORWARD PEGThe Forward P/E divided by the five-year forecasted growth rate.
Forward PEG: 2.15-Year Average: 1.3
S&P 500 Index Average: 1.5Apparel Retailers Industry Average: 1.8
0.81.01.21.41.61.82.02.22.42.62.8
20172016201520142013
5-Yr Average
CARTER'S INC (CRI-N)Retailers / Specialty Retailers / Apparel Retailers
STOCKREPORTS+DETAILED STOCK REPORT
Report Date: 2018 January 18
Page 7 of 12© 2017 Thomson Reuters. All rights reserved.

RISK
POSITIVE OUTLOOK: Consistent returnpatterns (low volatility).
Risk Score Averages
Specialty Retailers Group: 4.7 Mid Market Cap: 7.0Retailers Sector: 4.9 S&P 500 Index: 8.5
Positive
Neutral
Negative
Risk Score Trend (4-Week Moving Avg)
2015-01 2016-01 2017-01 2018-01
Peers -6M -3M -1M -1W Current 1Y Trend
CRI 9 9 8 8 8
AEO 6 6 6 6 6
URBN 4 5 6 6 6
KORS 3 3 5 5 5
FL 5 3 4 3 3
RISK INDICATORSMagnitude of Returns
(25% weight)Volatility
(25% weight)Beta (1-year)(25% weight)
Correlation(25% weight)
CRI
URBNAEOKORS
FL
CRI
KORSURBNAEOFL
AEOCRI
KORSURBNFL
AEO
URBNCRIFLKORS
Daily Returns (Last 90 Days)Best 4.4%Worst -2.1%Monthly Returns (Last 60 Months)Best 15.8%Worst -10.7%
Standard DeviationLast 90 Days 1.01Last 60 Months 6.31Intra-Day Swing (Last 90 Days)Average 1.8%Largest 4.7%
Beta vs. S&P 500 0.78Positive Days Only 0.36Negative Days Only 0.62Beta vs. Group 0.63Positive Days Only 0.43Negative Days Only 0.67
Correlation vs. S&P 500Last 90 Days 9%Last 60 Months 17%Correlation vs. GroupLast 90 Days 47%Last 60 Months 45%
HIGHLIGHTS- Carter's Inc currently has a Risk Rating of 8 while the S&P 500
index has an average rating of 8.5.- On days when the market is up, CRI shares tend to lag the
S&P 500 index. However, on days when the market is down,the shares generally decrease less than the index.
- In both short-term and long-term periods, CRI has shown lowcorrelation (>= -0.1 and < 0.2%) with the S&P 500 index. Thus,this stock would provide high levels of diversification to aportfolio similar to the broader market.
- Over the last 90 days, CRI shares have been less volatile thanthe overall market, as the stock's daily price has fluctuated lessthan 91% of S&P 500 index firms.
RISK ANALYSISLast 90 Days Last 60 Months
Peers
BestDaily
Return
WorstDaily
Return
#Days
Up
#Days
Down
LargestIntra-Day
Swing
BestMonthlyReturn
WorstMonthlyReturn
CRI 4.4% -2.1% 44 18 4.7% 15.8% -10.7%
AEO 6.9% -4.9% 34 27 6.6% 34.0% -25.6%
FL 28.2% -5.2% 32 29 8.5% 42.4% -25.3%
KORS 14.7% -2.1% 37 23 6.0% 42.0% -25.6%
URBN 5.5% -4.1% 39 23 7.1% 26.9% -21.7%
S&P 500 1.0% -0.6% 35 26 1.7% 8.3% -6.3%
CARTER'S INC (CRI-N)Retailers / Specialty Retailers / Apparel Retailers
STOCKREPORTS+DETAILED STOCK REPORT
Report Date: 2018 January 18
Page 8 of 12© 2017 Thomson Reuters. All rights reserved.
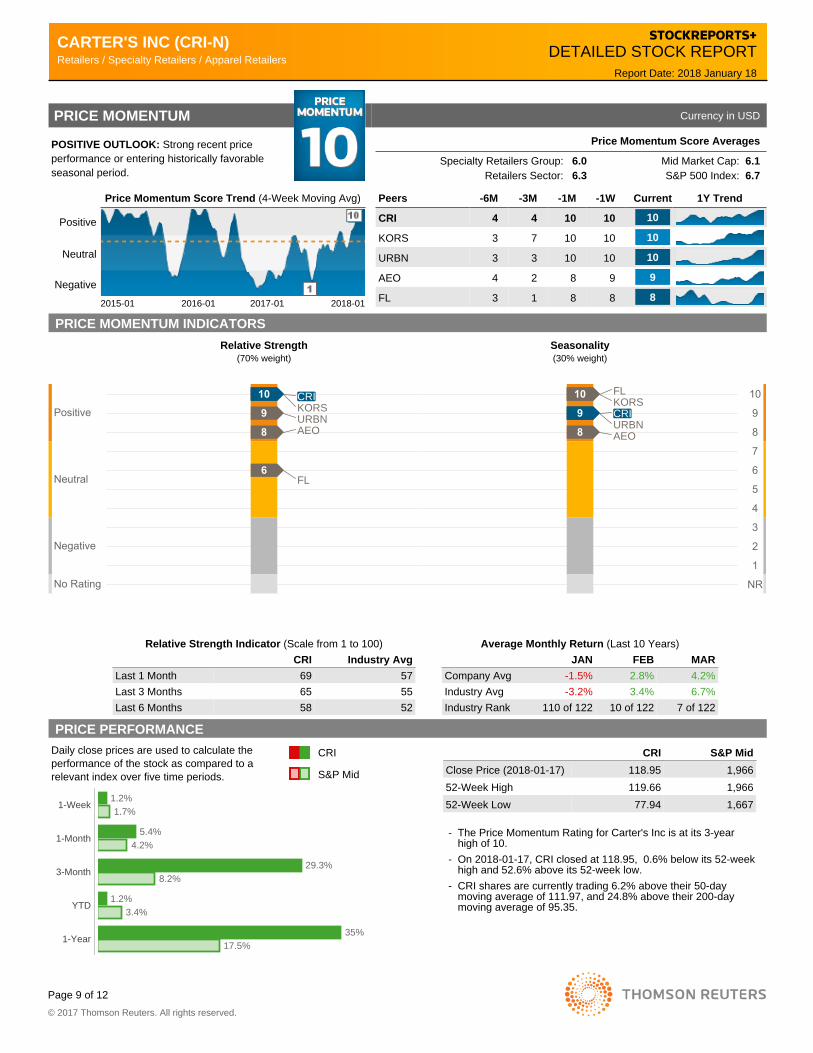
PRICE MOMENTUM
POSITIVE OUTLOOK: Strong recent priceperformance or entering historically favorableseasonal period.
Currency in USD
Price Momentum Score Averages
Specialty Retailers Group: 6.0 Mid Market Cap: 6.1Retailers Sector: 6.3 S&P 500 Index: 6.7
Positive
Neutral
Negative
Price Momentum Score Trend (4-Week Moving Avg)
2015-01 2016-01 2017-01 2018-01
Peers -6M -3M -1M -1W Current 1Y Trend
CRI 4 4 10 10 10
KORS 3 7 10 10 10
URBN 3 3 10 10 10
AEO 4 2 8 9 9
FL 3 1 8 8 8
PRICE MOMENTUM INDICATORSRelative Strength
(70% weight)Seasonality(30% weight)
CRIKORSURBNAEO
FL
FLKORSCRIURBNAEO
Relative Strength Indicator (Scale from 1 to 100)CRI Industry Avg
Last 1 Month 69 57Last 3 Months 65 55Last 6 Months 58 52
Average Monthly Return (Last 10 Years)JAN FEB MAR
Company Avg -1.5% 2.8% 4.2%Industry Avg -3.2% 3.4% 6.7%Industry Rank 110 of 122 10 of 122 7 of 122
PRICE PERFORMANCEDaily close prices are used to calculate theperformance of the stock as compared to arelevant index over five time periods.
CRI
S&P Mid
1-Week
1-Month
3-Month
YTD
1-Year
1.2%1.7%
5.4%4.2%
29.3%8.2%
1.2%3.4%
35%17.5%
CRI S&P MidClose Price (2018-01-17) 118.95 1,96652-Week High 119.66 1,96652-Week Low 77.94 1,667
- The Price Momentum Rating for Carter's Inc is at its 3-yearhigh of 10.
- On 2018-01-17, CRI closed at 118.95, 0.6% below its 52-weekhigh and 52.6% above its 52-week low.
- CRI shares are currently trading 6.2% above their 50-daymoving average of 111.97, and 24.8% above their 200-daymoving average of 95.35.
CARTER'S INC (CRI-N)Retailers / Specialty Retailers / Apparel Retailers
STOCKREPORTS+DETAILED STOCK REPORT
Report Date: 2018 January 18
Page 9 of 12© 2017 Thomson Reuters. All rights reserved.

INSIDER TRADING
NEGATIVE OUTLOOK: Recent or longer-termtrend of selling by company insiders.
Currency in USD
Insider Trading Score Averages
Specialty Retailers Group: 5.2 Mid Market Cap: 4.3Retailers Sector: 5.0 S&P 500 Index: 3.9
Positive
Neutral
Negative
Insider Trading Score Trend (4-Week Moving Avg)
2015-01 2016-01 2017-01 2018-01
Peers -6M -3M -1M -1W Current 1Y Trend
URBN 8 8 8 8 8
AEO 8 4 5 5 5
KORS 8 8 3 4 4
FL 4 5 5 5 3
CRI 4 5 1 2 2
INSIDER TRADING INDICATORSShort-Term Insider
(70% weight)Long-Term Insider
(30% weight)
FLKORS
CRI
AEOURBN
KORSURBN
AEO
CRIFL
Most Recent Buys and Sells (Last 90 Days)Insider Name Role Tran Date Tran Type SharesFoglesong, William Greg O 2018-01-02 S 6,000D Emilio, Julie O 2017-12-01 S 3,000Casey, Michael Dennis CEO 2017-11-20 - 2017-11-27 S 53,047
Insider Summary (Last 6 Months)Total Shares Acquired 120,095Total Shares Disposed 156,634Net Shares -36,539Sector Average -197,293
HIGHLIGHTS- Carter's Inc currently has an Insider Trading Rating of 2, which is
significantly more bearish than both the Apparel Retailers industryaverage of 5.64 and the Specialty Retailers industry group average of5.23.
- Since the beginning of the current quarter, sales by Carter's Incexecutives have totaled $707,880. Over the past five years, theaverage sell total for Q1 has been $2,299,187.
MONTHLY BUYS AND SELLS
0
F M A M J J A S O N D J
BUYS
SELLS
10
10
20
20
$ Market Value (Millions)
Excludesderivativeand optionexercises
TOP INSTITUTIONAL HOLDERS
Institution NameInst.Type
%O/S
SharesHeld
ReportedDate
The Vanguard Group Inc Inv Mgmt 8.1% 3.81M 2017-09-30BlackRock Institutional Inv Mgmt 7.7% 3.63M 2017-09-30Janus Henderson Investors Inv Mgmt 7.2% 3.41M 2017-09-30Lazard Asset Management Inv Mgmt 6.6% 3.10M 2017-09-30Wellington Management Inv Mgmt 4.1% 1.92M 2017-09-30
Updated daily as of 2018-01-18
TOP EXECUTIVE HOLDERS
Insider Name RoleDirect
Shares ValueReportedDate
Casey, Michael Dennis CEO 0.36M 40.5M 2017-11-27Lynch, Brian J. P 69,965 7.90M 2017-02-23Fulton, Paul D 68,016 7.68M 2017-11-09Pulver, David D 54,331 6.13M 2017-05-24Whiddon, Thomas E D 52,849 5.97M 2017-08-04
Updated monthly as of 2017-12-17
CARTER'S INC (CRI-N)Retailers / Specialty Retailers / Apparel Retailers
STOCKREPORTS+DETAILED STOCK REPORT
Report Date: 2018 January 18
Page 10 of 12© 2017 Thomson Reuters. All rights reserved.

DETAILED STOCK REPORT TIPS The Thomson Reuters Stock Report is a comprehensive, company-specific analysis that includes a proprietary Stock Rating along with underlying component indicators and supportive data elements. The report is updated daily, although some of the data elements and the ratings are updated weekly. Average Score The Average Score combines a quantitative analysis of six widely-used investment decision making tools - Earnings, Fundamental, Relative Valuation, Risk, Price Momentum, and Insider Trading. First, a simple average of the six underlying component ratings is calculated. Then, a normal distribution is used to rank each stock across the market on a scale of 1 to 10, with 10 being most favorable. A score of 8 to 10 is considered positive, 4 to 7 is neutral, and 1 to 3 is negative. These six factors may be evaluated differently using alternative methodologies, and the importance of individual factors varies across groups, market capitalization and investment styles. Additional criteria should always be used to evaluate a stock. A company must have sufficient data available for at least four of the six component indicators in order to receive an overall Average Score. Approximately 85% of the stocks within the coverage universe meet the criteria to generate a score. Optimized Score As an alternative to the average score, the Stock Report includes an Optimized Score generated by independent research firm, Verus Analytics. It uses the same six component ratings, but rather than equally weighting each of the factors, the weighting varies by market capitalization of the underlying security based on backtesting research. These scores are also updated weekly and distributed normally on a 1 to 10 scale, with 10 being best. The variable size is assigned monthly by ranking the market capitalization and assigning the appropriate category as follows:
Large - Top 5.55% Mid - Next 13.87% Small - Next 34.68% Micro - Remaining 45.9%
Indicator Components The six indicators that comprise the stock rating are displayed. Like the stock rating, the component rating scale is 1 to 10, with 10 being best. A company will receive an ‘NR’ for No Rating if the required data elements or criteria are not met. A detailed section for each component is included in the report. Indicator Trends Within each component section, historical score trends are displayed, typically using a 4-week moving average over a timeframe of the past three years. The dotted orange line indicates the average of the scores over those three years. The most recent occurrences of the best and worst scores are also displayed on the chart in grey boxes to put the current score into historical context. Next to the trend chart for the company, current score averages are included, along with peer company comparisons of values from 6 months ago, 3 months ago, 1 month ago, the most recent value from 1 week ago, and the current score. The four closest industry peers are presented based on similar market capitalization.
Peer Analysis ● The Thomson Reuters Business Classification (TRBC) system is used for
industry comparisons. It is designed to track and display the primary business of a corporation by grouping together correlated companies that offer products and services into similar end markets. The system includes 10 Economic Sectors, 28 Business Sectors, 54 Industry Groups, and 136 Industries.
● The Peer Analysis section of the report compares the company to its ten closest peers. The peers are selected from the industry based on similar market capitalization. The peer listing may have fewer than ten companies if there are fewer than ten companies classified within that industry.
Highlights The Thomson Reuters proprietary automated text-generation system creates highlights summarizing the most noteworthy data. The bullets will vary by company and will change from week to week as different criteria are met. Earnings The Earnings Rating is based on a combination of three factors: earnings surprises, estimate revisions, and recommendation changes. Each factor is equally weighted. Then, equal deciles are used to rank each stock across the market on a scale of 1 to 10, with 10 being most favorable. A stock needs to have at least two of the three earnings factors in order to receive a score.
● Earnings Surprises - The number of positive and negative surprises within the last 4 quarters.
● Estimate Revisions - The number of up and down revisions and the average percentage change of those revisions within a 4 week period.
● Recommendation Changes - The number of broker upgrades and downgrades in the last 120 days.
Price Target The price target is based on the predictions of analysts covering the stock and shows the high, low and mean price expected within the next 12 months. Earnings Per Share The quarterly and annual earnings per share are presented when available, along with the mean, high and low. Quarterly data is displayed for the past 4 quarters (actual) and the next 2 quarters (estimated). Annual data is displayed for the past 2 years (actual) and the next 2 years (estimated). Mean Estimate Trend The mean estimates show how the consensus has changed over the past 30 days and 90 days for the upcoming two quarters and two years. The percentage change is calculated for the company as a means for comparison by measuring the difference between the current consensus estimate and that of 90 days ago. Analyst Recommendations The I/B/E/S Mean is the average recommendation of all analysts covering the stock, as provided by Thomson Reuters I/B/E/S (Institutional Brokers Estimate System). The recommendations are presented on a five-point standardized scale: strong buy, buy, hold, reduce, and sell. Earnings Surprises ● The surprise summary includes the total number of quarters (and percentage) in
the past 12 quarters in which earnings surprises were positive, negative, or in-line. In order to be recognized as a positive or negative surprise, the percent must be greater than 2% above or 2% below the consensus, respectively.
● The surprise detail section includes a listing of the company's quarterly earnings reported for the most recent 6 quarters. The consensus analyst estimate is provided to determine if the actual earnings report represented a positive surprise, negative surprise, or in-line result.
Fundamental The Fundamental Rating is based on a combination of four factors: profitability, debt, earnings quality, and dividend. Companies that do not pay a dividend are not penalized. Each factor is equally weighted. Then, equal deciles are used to rank each stock across the market on a scale of 1 to 10, with 10 being most favorable. A stock needs to have at least two of the four fundamental factors present for a given fiscal quarter in order to receive a score. ● Profitability is comprised of four data elements.
- Revenue Growth: (Net Sales – Previous Net Sales) / Previous Net Sales - Gross Margin: Gross Profit / Net Sales - Return on Equity: Net Income / Total Equity - Net Margin: Net Profit / Net Sales
● Debt is comprised of four data elements. - Current Ratio: Current Assets / Current Liabilities - Debt-to-Capital: Total Debt / Total Capital - Interest Funding: (Interest Expense on Debt + Preferred Cash Dividends) /
Funds from Operations - Interest Coverage: Earnings before Interest and Taxes / (Interest Expense on
Debt + Preferred Cash Dividends) ● Earnings Quality is comprised of four data elements.
- Operating Cash Yield: (Operating Cash Flow – Net Income) / Net Income - Accruals: (Net Income – Operating Cash Flow – Investing Cash Flow) /
Average Net Operating Assets - Days Sales in Inventory: 365 / (Cost of Goods Sold / Inventory) - Days Sales in Receivables: 365 / (Net Sales / Receivables)
● Dividend is comprised of four data elements. The company must have a current dividend yield. - Dividend Growth Rate: (Dividends per Share – Previous Dividends per Share)
/ Previous Dividends per Share - Dividend Payout: Dividends per Share / Earnings per Share - Dividend Coverage: Funds from Operations / Cash Dividends - Dividend Yield: Annual Dividends per Share / Current Market Price per Share
Indicator Trend The fundamental indicator trend displays quarterly scores over the past three years. The best and worst scores over that timeframe can be easily determined from the values shown on the chart for each quarter.
CARTER'S INC (CRI-N)Retailers / Specialty Retailers / Apparel Retailers
STOCKREPORTS+DETAILED STOCK REPORT
Report Date: 2018 January 18
Page 11 of 12© 2017 Thomson Reuters. All rights reserved.

Relative Valuation The Relative Valuation Rating is based on a combination of three factors: Forward PEG (50% weight), Trailing P/E (25% weight), and Forward P/E (25% weight). After the weightings are considered to combine individual factors, equal deciles are used to rank each stock across the market on a scale of 1 to 10, with 10 being most favorable. These common valuation metrics are evaluated against the overall market, the index, and the company's own historic 5-year averages. A stock needs to have at least one of the three relative valuation factors in order to receive a score. ● Trailing P/E: Close Price / Most Recent 4 Quarters of Earnings ● Forward P/E: Close Price/ Upcoming 4 Quarters of Earnings ● Forward PEG: Forward P/E / Long-Term Forecasted Growth Rate Valuation Averages Negative values are excluded when calculating the averages. A maximum value of 100 is placed on Trailing P/E and Forward P/E, a maximum value of 5 is placed on Forward PEG, and a maximum value of 20 is placed on Price to Sales when calculating the averages. Higher values are rounded down to the maximum for the averages. Valuation Multiples The valuation multiples provide the Trailing P/E, Forward P/E, Forward PEG, and Price to Sales for the company and the S&P 500 index average. In addition, a comparison of the current company’s values to its 5-year average and an industry average are presented. A discount occurs when the company’s ratio is valued more favorably (lower) than that to which it is compared. Risk The Risk Rating displays stocks on a scale of 1 to 10 with 10 being awarded to the least risky stocks. It is derived by looking at a series of long-term (5-year) and short-term (90-day) stock performance measures including volatility, magnitude of returns, beta, and correlation. Each factor is equally weighted. Then, equal deciles are used to rank each stock across the market. A stock needs to have at least two of the four risk factors in order to receive a score. ● Magnitude of Returns – The best / worst daily returns in the past 90 days and the
best / worst monthly returns in the past 60 months. ● Volatility – The standard deviation of the stock price over the last 90 days and
last 60 months, along with the average and largest intra-day stock swing. ● Beta – Measures the tendency of a security’s returns to respond to swings in the
market, based on the beta of the company versus the relevant index. ● Correlation – Determines how closely the returns of the stock and the relevant
index move together, measured over the last 90 days and last 60 months. Risk Analysis Price analysis for the company and the S&P 500 is provided over two time periods. Daily analysis is provided for the last 90 days, whereas monthly statistics are used for the last 60 months. Price Momentum The Price Momentum Rating is based on a combination of two technical performance factors: relative strength (70% weight) and seasonality (30% weight). After the weightings are considered to combine individual factors, equal deciles are used to rank each stock across the market on a scale of 1 to 10, with 10 being most favorable. A stock needs to have data for the relative strength factor in order to receive a score. ● Relative Strength – The relative strength of the company for the last 1 month, 3
months, and 6 months on a scale of 1 to 100. ● Seasonality – The average monthly return (price performance) for the current
month and next 2 months for the company and industry, over the past 10 years. A lower industry rank indicates a higher return.
Price Performance Daily close prices are used to calculate the price performance of the stock. The performance of the S&P 500 is also displayed as a means of comparison. Insider Trading The Insider Trading Rating is based on short-term (70% weight) and long-term (30% weight) legal insider trading behavior. After the weightings are considered to combine individual factors, a function similar to a normal distribution is used to rank each stock across the market on a scale of 1 to 10, with 10 being most favorable. A stock needs to have at least one of the two insider trading factors in order to receive a score. ● Short-Term Insider – Uses insider buy and sell transactions within the past 90
days. This factor is based on the Thomson Reuters quantitative insider trading model that considers the insider's role, consensus, number of shares, market capitalization of the company, and the historic stock performance following trades by the given insider.
● Long-Term Insider – Looks at buying, selling and option exercise decisions over the past six months relative to other stocks within the same business sector. The net shares are presented alongside the business sector average as a means of comparison.
Monthly Buys and Sells The total market value of open-market buying and selling is displayed by month in the chart for easy comparison. Transactions by trusts and corporations are excluded, along with buys greater than $10 million and sales greater than $50 million. Transactions for the exercise of derivatives and option exercises are excluded from the totals. Institutional Holders The top five institutional holders of the company are listed in descending order, based on their total share holdings. Possible values for the institution type include Brokerage, Funds, Inv Mgmt, or Strategic. Executive Holders The top five executive insiders of the company are listed in descending order, based on their total direct common share holdings (options are not considered). Indirect holdings are excluded, as the owner may not actually have investment discretion over these shares. This table is updated monthly. Insiders who have not filed any transactions or holdings over the past two years are excluded as this may indicate that the individual is no longer associated with the company. Additionally, direct shares held must be greater than 1,000 to be considered. Insider Roles These role codes may appear in the data for recent insider buys and sells or top executive holders:
AF - Affiliate IA - Investment Advisor AI - Affiliate of Advisor MC - Member of Committee B - Beneficial Owner MD - Managing Director C - Controller O - Officer CB - Chairman OB - Officer / Beneficial Owner CEO - Chief Executive Officer OD - Officer / Director CFO - Chief Financial Officer OE - Other Executive CI - Chief Investment Officer OS - Officer of Subsidiary CO - Chief Operating Officer OT - Officer / Treasurer CT - Chief Technology Officer OX - Divisional Officer D - Director P - President DO - Director / Beneficial Owner R - Retired DS - Indirect Shareholder S - Secretary EC - Member of Exec Committee SH - Shareholder EVP - Exec Vice President SVP - Senior Vice President FO - Former T - Trustee GC - General Counsel UT - Unknown GP - General Partner VC - Vice Chairman H - Officer / Director / Owner VP - Vice President
DISCLAIMER © 2017 Thomson Reuters. Republication or redistribution of Thomson Reuters content, including by framing or similar means, is prohibited without the prior written consent of Thomson Reuters. All information in this report is assumed to be accurate to the best of our ability. Thomson Reuters is not liable for any errors or delays in Thomson Reuters content, or for any actions taken in reliance on such content. Any forward-looking statements included in the Thomson Reuters content are based on certain assumptions and are subject to a number of risks and uncertainties that could cause actual results to differ materially from current expectations. There is no assurance that any forward-looking statements will materialize. The content in this Thomson Reuters report does not constitute investment advice or a recommendation to buy or sell securities of any kind. Past performance is not a guarantee of future results. Investors should consider this report as only a single factor when making an investment decision.
CARTER'S INC (CRI-N)Retailers / Specialty Retailers / Apparel Retailers
STOCKREPORTS+DETAILED STOCK REPORT
Report Date: 2018 January 18
Page 12 of 12© 2017 Thomson Reuters. All rights reserved.