design simulation and evaluation of photovoltaic …docs.neu.edu.tr/library/6687245295.pdf ·...
TRANSCRIPT

i
DESIGN SIMULATION AND EVALUATION OF
PHOTOVOLTAIC PLANT
A THESIS SUBMITTED TO THE GRADUATE
SCHOOL OF APPLIED SCIENCES
OF
NEAR EAST UNIVERSITY
BY
UWINEZA LAETITIA
In Partial Fulfillment of the Requirements for
the Degree of Master of Science
in
Electrical Electronics Engineering
NICOSIA, 2018

ii
Laetitia UWINEZA: DESIGN SIMULATION AND EVALUATION OF
PHOTOVOLTAIC POWER PLANT
Approval of Director of Graduate School of
Applied Sciences
Prof. Dr. Nadire ÇAVUŞ
We certify this thesis is satisfactory for the award of the degree of Masters of Science in
Electrical and Electronics Engineering
Examining Committee in Charge:
Prof. Dr. Mehrdad Tarafdar HAGH Supervisor, Department of Electrical and
Electronics Engineering, NEU
Prof. Dr. Seyed Hossein HOSSEINI Department of Electrical and Electronics
Engineering, TABRIZU
Assist. Prof. Dr. Lida EbrahimVAFAEİ Department of Mechanical Engineering, NEU

iii
I hereby declare that all information in this document has been obtained and presented in
accordance with academic rules and ethical conduct. I also declare that I have fully cited and
referenced all material and results that are not original to this work, as required by these rules
and conduct.
Name, Last name:
Signature:
Date:

iv
ACKNOWLEGMENTS
I take this opportunity to express my sincere appreciation to my supervisor Prof. Mehrdad
Tarafdar Hagh for his guidance and encouragement throughout the course of this thesis and
also the staffs of Electrical Electronics Engineering department Near East University,
especially my adviser, Dr. Sartan Kaymak and the Head of Department Prof. Dr. Bülent
Bilgehan.
To my parents Mukashyaka Dorothee, Kaburame Janvier and my brother Muhawenimana
Jean de DIEU, whose constant prayers, love, support, and guidance have been my source of
strength and inspiration throughout these years, words alone can‟t express how grateful I am
for the support you gave me.

v
To my parents…

vi
ABSTRACT
Electric energy production using renewable energy sources (RES) has seen an upscale in
recent years because of the numerous advantages of RES; non pollutant, raw materials are
free, environmentally friendly and cost efficient. To maximize production and efficiency,
types of RES are correlated to geographical locations with abundance of such types of
resources.
The goal of this thesis is to design, simulate and evaluate photovoltaic power plant in Rwanda
using PVsyst software and the load estimation for the two communities based on the average
primary load profile of each categories . According meteorological data, Rwanda has one of
the best solar irradiation data in Eastern Africa. Using solar irradiation map, a suitable location
is chosen for our plant, calculation of PV arrays and arrangements (series or parallel) are done
to determine the right number of panels, to maximize ac power production, and highly
efficient inverters are selected. The design data is used for simulation to determine the annual
energy production. The simulation will be done for three scenarios; fixed panels, single axis
tracking and two axis tracking systems.
Keywords: Design; simulation; evaluation; load estimation; photovoltaic.
vii
ÖZET
yenilenebilir enerji kaynakları (YEK) kullanarak elektrik enerjisi üretimi nedeniyle YEK
sayısız avantajları, son yıllarda bir lüks gördü; sigara kirletici, hammadde çevre dostu ve
düşük maliyetli, özgürdür. üretimini ve verimliliğini maksimize etmek için, RES türleri
kaynaklarının bu tür türlerinin bolluğu ile coğrafi konumlara ilişkilidir. Bu tezin amacı,
tasarım simüle ve PVsyst yazılım ve her kategoriden ortalama birincil yük profiline göre iki
toplum için yük tahmini ullanarak Ruanda fotovoltaik enerji santralini . Meteorolojik verilere
göre, Ruanda, uygun bir konum bizim bitki için güneş ışınlama harita kullanarak Doğu
Afrika'da en iyi güneş ışınlama verilerinin birini seçilir etti, PV dizisi ve düzenlemelere (seri
veya paralel) hesaplanması AC güç üretimini maksimize etmek için, paneller hemen sayısını
belirlemek için yapılır ve yüksek verimli çeviriciler seçilir. tasarım verilerini yıllık enerji
üretimini belirlemek için simülasyon için kullanılır. simülasyon üç senaryo için
yapılacaktır; Sabit panel, tek eksenli izleme ve iki eksenli izleme sistemleri. Seçilen sitesinde
aylık ortalama güneş radyasyonu ve PV sistem bileşenlerinin özellikleri hakkında bilgiler
farklı internet siteleri tarafından sağlanacaktır, PVGIS Afrika, farklı kitaplar, bilimsel
araştırma makaleleri, dergilerin (Fotovoltaik Coğrafi Bilgi Sistemi). tasarım verilerini yıllık
enerji üretimini belirlemek için simülasyon için kullanılır. simülasyon üç senaryo için
yapılacaktır; Sabit panel, tek eksenli izleme ve iki eksenli izleme sistemleri. Seçilen sitesinde
aylık ortalama güneş radyasyonu ve PV sistem bileşenlerinin özellikleri hakkında bilgiler
farklı internet siteleri tarafından sağlanacaktır, PVGIS Afrika, farklı kitaplar, bilimsel
araştırma makaleleri, dergilerin (Fotovoltaik Coğrafi Bilgi Sistemi).
Anahtar Kelimeler: Tasarım; simülasyon; değerlendirme ;ve yük tahmini;fotovoltaik.

viii
TABLES OF CONTENTS
ACKNOWLEDGEMENT ........................................................................................................... i
ABSTRACT ............................................................................................................................... iii
ÖZET ........................................................................................................................................... iv
LIST OF TABLES ....................................................................................................................... x
LIST OF FIGURES .................................................................................................................... ix
LIST OF ABREVIATIONS ....................................................................................................... xi
CHAPTER 1: INTRODUCTION
1.1 Introduction .......................................................................................................................... 1
1.2 Thesis Problem .................................................................................................................... 3
1.3 The Aim of the Thesis ........................................................................................................... 3
1.4 The Importance of Thesis .................................................................................................... 4
1.5 Limitation of Study .............................................................................................................. 4
1.6 Overview of the Thesis ......................................................................................................... 4
CHAPTER 2 : SOLAR ENERGY AND ITS APPLICATIONS
2.1 Solar Energy.......................................................................................................................... 5
2.2 Brief History of Solar Energy ............................................................................................... 6
2.3 Solar Photovoltaic Systems................................................................................................... 7
2.4 Types of PV Cells ................................................................................................................. 8
2.4.1 Monocrystalline silicon panel ........................................................................................ 8
2.4.2 Polycrystalline silicon panel.......................................................................................... 9
2.4.3 Thin film silicon ............................................................................................................ 9
2.5 Photovoltaic System Component ........................................................................................ 10
2.5.1 Photovoltaic module/panel ........................................................................................... 11
2.5.2 Charge Controller ......................................................................................................... 11
2.5.3 Storage unit/Batteries ................................................................................................... 11
2.6 Types of PV system ............................................................................................................ 11
2.6.1 Standalone PV system .................................................................................................. 12
2.6.2 Grid-connected PV system ........................................................................................... 12

ix
2.6 .3 Hybrid PV systems ...................................................................................................... 13
2.7 PVcell Equivalent Circuit ................................................................................................... 13
2.7.1 PV module connection ................................................................................................. 14
2.7.2 Concentrated solar power ............................................................................................. 14
2.7.3 Parabolic trough ........................................................................................................... 14
2.7.4 Linear fresnel ................................................................................................................ 15
2.7.5 Solar tower technology ................................................................................................. 16
2.7.6 Stirling dish technology ............................................................................................... 17
CHAPTER 3: GRID CONNECTION AND OFF-GRID CONNECTION
3.1 Grid Connection ................................................................................................................. 19
3.2 Single Phase H-bridge Inverter ........................................................................................... 20
3.3 Three Phase H-bridge Inverter ............................................................................................ 21
3.4 Reactive Power Compensation ........................................................................................... 22
3.5 Photovoltaic Substation ...................................................................................................... 23
3.6 Off-Grid Connection ........................................................................................................... 24
3.7 Power Quality in Off-grid Systems..................................................................................... 24
3.8 Energy Storage Systems ..................................................................................................... 25
CHAPTER 4: DESIGN OF PV POWER PLANT
4.1 PV Power Plants ................................................................................................................. 28
4.2 Kirehe District ..................................................................................................................... 28
4.3 Load Estimation .................................................................................................................. 29
4.4.1 PV panel/module .......................................................................................................... 38
4.4.2 Energy required from the PV panels ............................................................................ 38
4.4.3 Inverter Selection/String .............................................................................................. 39
4.3 Plant Area............................................................................................................................ 40
4.4 Pv Module Circuit ............................................................................................................... 40
CHAPTER 5 : PVSYST SIMULATION
5.1 PVsyst Software .................................................................................................................. 41
5.1.1 Site location .................................................................................................................. 42

x
5.1.2 Orientation .................................................................................................................... 42
5.1.3 Horizon ......................................................................................................................... 42
5.1.4 Detailed losses .............................................................................................................. 43
5.1.5 System sizing : visual tools ......................................................................................... 43
5.1.6 Near shading ................................................................................................................. 44
5.1.7 System .......................................................................................................................... 45
5.2 Simulation and Results ....................................................................................................... 46
5.2.1 Normalized production (per installed kWp) ................................................................. 46
5.2.2 Performance Ratio ........................................................................................................ 47
5.2.3 New simulation variant ................................................................................................ 48
5.2.4 Loss Diagram ............................................................................................................... 49
5.3 Tracking System ................................................................................................................ 54
5.4 Economic Analysis ............................................................................................................ 60
5.4.1 Initial cost ..................................................................................................................... 61
5.4.2 Payback period ............................................................................................................ 63
CHAPTER 6 : CONCLUSION
REFERENCES ........................................................................................................................... 67
APPENDICES :........................................................................................................................... 72
APPENDIX 1 : Fixed system ...................................................................................................... 73
APPENDIX 2 : Tracking system ................................................................................................. 76
APPENDIX 3 : Economic analysis ............................................................................................. 90

xi
LIST OF TABLES
Table 1.1 : Electric power capacity in Rwanda ............................................................................ 4
Table 3.1 : Switching table for single phase full h-bridge inverter ............................................. 23
Table 4.1 : Solar radiation data ................................................................................................... 31
Table 4.2 : Community 1 ............................................................................................................. 34
Table 4.3 : Community 2 ............................................................................................................. 35
Table 4.4 : Upper class family ..................................................................................................... 35
Table 4.5 : Medium class family ................................................................................................ 36
Table 4.6 : Administration post ................................................................................................... 37
Table 4.7 : Lower class family .................................................................................................... 37
Table 4.8 : Commercial/community purposes ............................................................................. 38
Table 4.9 : Medical center ........................................................................................................... 38
Table 4.10 : Primary school ......................................................................................................... 39
Table 4.11 : School ...................................................................................................................... 39
Table 4.12 : Community church .................................................................................................. 40
Table 4.13 : Small manufacturing unit ........................................................................................ 40
Table 4.14 : Average daily load profile ...................................................................................... 41
Table 5.1 : Balances and main results ......................................................................................... 54
Table 5.2 : Detailed system .......................................................................................................... 56
Table 5.3 : Balances and main result for tracking system ........................................................... 59
Table 5.4 : Detailed system losses for tracking system ............................................................... 60
Table 5.5 : Table of economic gloss ............................................................................................ 60

xii
LIST OF FIGURES
Figure 2.1 : Global horizontal radiation of Rwanda ................................................................... 10
Figure 2.2 : Typical PV Cell ....................................................................................................... 11
Figure 2.3 : Monocrystalline silicon panel ................................................................................. 12
Figure 2.4 : Polycrystalline silicon Panel . .................................................................................. 12
Figure 2.5 : Thin film silicon Panel ............................................................................................ 13
Figure 2.6 : Photovoltaic component ........................................................................................... 13
Figure 2.7 : PVtandalone PV systems ........................................................................................ 15
Figure 2.8 : Pv cell equivalent circuit ......................................................................................... 16
Figure 2.9 : Parabolic trough ...................................................................................................... 18
Figure 2.10 : Linear Fresnel reflector ......................................................................................... 19
Figure 2.11: Solar tower technology .......................................................................................... 20
Figure2. 12 : Stirling dish technology ........................................................................................ 21
Figure 3.1 : Single Phase H-bridge Inverter ............................................................................... 23
Figure 3.2 : Three Phase full H-bridge inverter .......................................................................... 25
Figure 3.3 : NR Electric‟s SVC system ..................................................................................... 26
Figure 3.4 : Microgrid layouts ................................................................................................... 28
Figure 3.5 : MW PV Plant in Tau, American Island (solar City) ............................................... 30
Figure 3.6 : 6MWh Powerpack storage unite (solar City) ........................................................... 31
Figure 4.1 : Google map picture of Kirehe sector. ...................................................................... 35
Figure 4.2 : Average daily loads .................................................................................................. 43
Figure 5.1 : Flowchart of PVsyst . ............................................................................................... 45
Figure 5.2 : Horizon line drawings for Kirehe ............................................................................ 49
Figure 5.3 : Proposed site for Kirehe power plant. ...................................................................... 51
Figure 5.3 : Proposed site for Kirehe power plant. ...................................................................... 51
Figure 5.4 : Simplified diagram of simulation ............................................................................ 52
Figure 5.5 :Nominal power 1301kWp (Normalized productions) .............................................. 53
Figure 5.6 : Performance ratio ..................................................................................................... 54

xiii
Figure 5.7 : Loss diagram ............................................................................................................ 56
Figure 5.8 : Normalized productions for tracking system ........................................................... 59
Figure 5.9 : Performance ratio for tracking system ..................................................................... 59
Figure 5.10 : Loss diagram for tracking system .......................................................................... 61

xiv
LIST OF ABREVIATIONS
AC: Alternating current
CSP: Concentrated solar power
DC: Direct current
DPVP: Distpachable photovoltaic plants
DVD: Digital versatile disk
GTO: Gate turn off thyristors
LFS: Line focusing systems
LVRT: Low voltage ride through
MPPT: Maximum power point tracking
MW : Megawatt
PFS: Point focusing systems
RPC: Reactive power compensation
SCADA: Supervisory control and data acquisition
SEGS: Solar electric generating system
STATCOM:Static synchronous compensator
SVC: Static volt ampere reactive compensation
THD: Total harmonic distortion

1
CHAPTER 1
INTRODUCTION
1.1 Introduction
Energy is the principal catalyst required in the socio-economic development of every nation
and as such, the lack of this useful commodity can severely hinder its successful development.
They are various forms and sources of energy but electric power or energy is the most critical
form of energy required as a radical stimulus for rapid socio-economic development of a
nation. Some of the methods (not limited to) of generating electric power are by the use of
generators, electrochemistry, photovoltaic effects etc. The most common method of generating
electric power in Africa is hydroelectric power stations and thermal power plants.
Rwanda is located in central and east Africa and is bordered by Tanzania, Burundi,
Democratic Republic of the Congo and Uganda. Rwanda is found in the area described as the
region of African Great lakes. The west and east demography‟s are mostly mountains and
savannas respectively; also there are numerous lakes in the country. The population of
Rwanda is young and mostly located in rural settings. The capital city of Rwanda is Kigali and
the country occupies an area of 26,340Km2 with geographical co-ordinates 1.9403° S,
29.8739° E. The national population as at 2016 was 11,917,508. The rural population at as the
same time was 70% of the national population. The gross domestic product and gross domestic
product per capita are $8,376,048,904.58 and $702.84 respectively ( Landi et al .,2013).
Rwanda being a third world country in Africa is faced with the challenge of providing cheap,
reliable and a well-distributed network of electric power across urban and rural areas of the
country. The state of electric power infrastructure is not the best as such a lot needs to be done
urgently to improve the generation, transmission and distribution of electric power in Rwanda.
There have been numerous government policies and programs to rapidly expand the installed
capacity from 45MW of electric energy in 2006 to 563MW by 2018. 70% of the national
population should have access to electric power, a plan the government hopes to achieve by
2018 (Nzeyimana , 2003). As part of government‟ s efforts to increase installed capacity

2
from 45MW to 563MW by 2018, the rate of expansion has seen a rapid increase between the
last five years. Between February and December of 2015, the Rwanda‟s electric power
generation capacity increased from 153MW to 186MW with national peak demand at
105MW( Irechukwu et al., 2017), The generation capacity as at January 2017 is 208MW(
Irechukwu et al., 2017) .
Table1.1 shows the various generating components which constitute the installed capacity of
electric power in Rwanda. Hydroelectric power provides most of the Rwanda‟s electricity
whilst solar energy provides less than 6% of electric power ( Werner et al.,2011)
Table 1.1: Electric power capacity in Rwanda (Werner et al . ,2011)
Name Year Installed Capacity MW
Hydro Power
Ntaruka Power Station 1959 11.5
Mukungwa Power Station 1982 12
Mukungwa II Power Station 2010 2.5
Nyabarongo I power station 2014 28
Rukarara hydroelectric 2010 9.5
Rusizi I Hydroelectric 1958 30
Rusizi II Hydroelectric 1989 44
Total 137.5
Thermal Power
Kivuwatt Power station 2015 25
Kibuye Power Plant 1 2012 3.5
Gishoma Thermal Power 2016 15
Total 43.5
Renewable energy (Solar)
Ngoma Solar Power Station 2.4
Rwamagana Solar Power Stat. 2015 8.5
Total 10.9

3
1.1 Thesis Problem
Rwanda just like any other third world country faces the enormous challenge of providing
electricity to every citizen no matter their location in the country. Statistically 70% of
Rwanda‟s population is of rural setting and these types of communities create problems of the
increased cost of transmission and transmission losses.
The national population of Rwanda is 11.92 million (2016) with only 19.80% of the
population having access to electricity which means that roughly 10 million of the population
do not have access to electric power. The rate of urban electrification is 67% but the rate of
rural electrification is an abysmal 5% (Landi et al., 2013).The electric power sector of Rwanda
is bedeviled with two principal problems;
a. Short fall in generation i.e. demand far exceeds supply
b. Reduced or poor rural coverage
As part of government‟s goal of increasing access to electricity, the enormous advantage of
solar energy such as non-pollutant, readily available, environmentally friendly and ease of
installation can be efficiently tapped to help achieve this goal. As such, this research work
seeks answers to the potential of building photovoltaic power plant in the district of Kirehe.
1.2 The Aim of Thesis
The main objective of this thesis is a proposal which seeks to help reduce the electric power
deficit of Rwanda thereby increasing socio-economic development of the country. This will be
achieved by designing, simulation and evaluation of a photovoltaic power plant using PVsyst
software.
Undoubtedly, the use PVsyst software as a tool for solar photovoltaic power plant simulation
can be considered a good choice because of its extensive application in research works by
academia and photovoltaic industry players. The proposed photovoltaic plant will be situated
at Kirehe district, Eastern Province; this is because of the favorable weather conditions for
solar photovoltaic park installation

4
1.3 The Importance of Thesis
The importance of this thesis is to provide an engineering based proposal to help address the
deficit in electricity generation in Rwanda. The proposal seeks to provide an advantageous
methodology of electric power generation; photovoltaic power plant. When this proposal is
implemented, cheap efficient and reliable electric power will be provided to millions of
household in Rwanda. This method of electric power generation has several advantages such
as:
a. Non pollutant
b. Cost of fuel is eliminated
c. Cost effective maintenance
d. Variety of location for installation
e. Reduced electricity tariffs
f. Payback period is much less-than plant life span
1.4 Limitation of Study
Even though this research was conducted with outermost care, the possibilities of
shortcomings and limitations are unavoidable. First and foremost the research was conducted
using PVsyst software hence the ability to control the research is limited to the structure of the
software. Also the data used is limited to a specific period of not more than 15 years and the
data sourcing methodology is satellite -based not ground- based instruments. The performance
and efficiency of modules and other components are manufacturer-related problems as such
can seriously limit our research. The output of our research is heavily dependent on the
weather hence a serious limitation.
1.5 Overview of the Thesis
This thesis is categorized into five chapters:
Chapter 1: Introduction This chapter is made of introduction, Thesis Problem, The aim of
Thesis, The important of Thesis and overview of the thesis.
Chapter 2: Solar energy and its application

5
Explanation of solar energy, history of solar energy, isolation, Photovoltaic system and
concentrated solar power are made in this section, also advantages of solar energy is
mentioned
Chapter 3: On-grid and off-grid systems Photovoltaic Power Plant Design
Chapter 4: Photovoltaic Power Plant Design
Chapter 5: PV power plant simulation using PVsyst
Chapter 6: Conclusion and recommendation

6
CHAPTER 2
SOLAR ENERGY AND ITS APPLICATION
2.1 Solar Energy
The Sun is considered to be a black body which produces and radiates enormous amount of
energy into the solar system at a speed of 3.0 x 10⁸m/s
2 i.e. the speed of light. Solar energy is
produced by a method called nuclear fusion where hydrogen gas is converted into helium gas
at very high temperatures of between 106
to 156 0
C (Nzeyimana ,2003). In an hour, 4.3 x 10²⁰
J of solar energy reaches the earth‟s atmosphere; this amount of energy is enough to support
the energy requirements of planet earth up to a year. Solar energy is naturally produced and
replenished; thus making solar energy part of renewable energy sources.
In the solar system, planets rotate around the sun and as such, half of the earth is without
sunlight at specific times of the year. Solar energy reaches the universe in electromagnetic
waves. These waves are differentiated by their spectrum which is the length of the frequency
of the waves. The length or range of spectrum determines the magnitude of energy it
possesses; Spectrum with shorter wavelength has more energy than spectrums with a longer
wavelength. On the earth‟s surface, only wavelengths ranging from 0.29µm to 2.3µm can be
detected (Van Niekerk and Hall ,2013). When the solar energy reaches the earth‟s
atmosphere, the majority are bounced backed into space, green plants absorb some for
photosynthesis, solar energy helps in evaporation of water bodies resulting in rainfall, whilst
the remaining is unutilized. The unutilized solar energy is enough to provide energy to sustain
the ever-increasing energy demands of the world. This can be achieved main by using smart
energy harvesting methods and also efficient utilization of energy. Global radiation is the
sun‟s radiation which reaches the earth‟s atmosphere. It is composed of three parts known as
Direct (beam) radiation, diffuse radiation and Albedo radiation. Figure 1.2 shows the global
horizontal radiation of Rwanda.
2.2 Brief History of Solar Energy
The background of solar energy can be traced to the inception of the solar system. Energy
derived from the sun has been applied to various relevant forms by mankind and nature such

7
as photosynthesis, drying, preserving, illumination, and fire etc. Various researches and
studies were carried out in the 18th
century to convert solar energy into electricity; notable
among them was the discovery in 1839 by Alexander Becquerel, also Charles Greeley Abbott,
a French scientist developed the steam engine powered by solar energy ( Nzeyimana, 2003).
The technology of converting solar energy into electric power by means of photovoltaic panels
was birthed at Bell Laboratories in 1954 by the following scientist D.M. Chapin, C.S. Fuller
and G.L. Pearson.
2.3 Solar collectors
Solar collectors are devices which absorb the sun‟s radiations (energy) and converts it into
other forms of energy e.g. electricity. Also, solar collectors can be described as the
methodology of solar energy harvesting. A typical example is the traditional solar water
heater technology found in most homes in Cyprus; which is still being used today but with a
touch modernization. The various photovoltaic power systems can be considered as solar
collectors.

8
Figure 2.1: Global horizontal radiation of Rwanda (Nzeyimana, 2003 )
2.4 Solar Photovoltaic Systems
The word Photovoltaic can be broken down into two parts; photo and voltaic which means
light and voltage respectively. Photovoltaic signifies electric voltage caused by sunlight. The
photovoltaic system is the conversion of solar energy into electrical energy by using
semiconductor cells. Crystalline silicon (SC) is used to manufacture photovoltaic cells from
semiconductor materials. CS has numerous advantages such as durable, reliable, noise-free
and fuel free material to produce electricity. PV cells have a lifespan of 30 years plus
(Goodrich et al ., 2012). Residential.PV cells are formed by the combination of P-type and N-
type semiconductor materials separated by junction called p-n junction. Research into
photovoltaic technology started over on hundred years ago. Selenium was the first element
that has the ability to convert solar into electricity. A scientist Charles Fritts developed the first
Selenium based solar electric cell (Goodrich et., 2012).

9
Figure2.2: Typical PV Cell (Goodrich et al.,2012)
2.5 Types of PV Cells
They are 3 basic types of solar PV cells. Silicon found commonly from sand is the main
material used in making PV cells. PV cells manufactured from silicon materials can be are
arranged into three categories.
2.5.1 Monocrystalline silicon panel
It is the most effective and commonly utilized commercial solar PV cells because of its
powerful conversion efficiency of 15%. It requires a small area to produce much power when
compared to other cells. Its power production magnitude is four times that of thin film cell
having the same cell area and under same weather conditions. Also, it has a longer life span of
between 25 – 30 years but has the disadvantage of being much expensive (Goodrich et
al.,2012).
Figure2.3: Monocrystalline silicon panel (Guda and Aliyu ,2015)

10
2.5.2 Polycrystalline silicon Panel
Polycrystalline silicon cells have other names such as poly-Si or polysilicon, multicrystalline.
It has a lower efficiency of 13%, cheaper to manufacture when compared to monocrystalline.
It requires more space for less power production. Polycrystalline silicon cell produces 130W
of electric power using an area of m2 and 1000W/m
2 of solar irradiance. It has a shorter life
cycle of 20 – 25 years.
Figure 2.4: Polycrystalline silicon Panel( Guda and Aliyu 2015)
2.5.3 Thin film silicon
The thin film silicon cells are considered to be the subsequent batch of PV cells. It requires
less material for its production and consumes less power. Thin film cells are cheaper when
liken to crystalline cells. Typical efficiency is about 7% making it the least efficient. It can
function perfectly well at lower irradiance, thin film silicon are made from non-crystalline
silicon.
Figure 2.5: Thin film silicon Panel (Guda and Aliyu, 2015)

11
2.6 Photovoltaic System Component
Depending on the type of photovoltaic system or design requirements, a number of
components are connected together to constitute PV system. These components are panels,
charge controller, inverter, and storage unit (battery). Solar water pumps designed for
irrigation purposes not require inverters because the pump uses direct current (dc) power.
Also, commercial or grid-connected PV system will require other components such
transformers etc. The above-mentioned components are applicable to standalone PV systems
which provide electric power for homes and small offices.
Figure 2.6: Photovoltaic component(Guda and Aliyu, 2015)
2.6.1 Photovoltaic module/panel
The photovoltaic panel is the main device which converts solar irradiance into electric power.
The panel is formed by connecting a number of PV cells together. An array is formed when
modules are connected either in series, parallel or a combination of series and parallel; these
connections are done depending on the required output characteristics. PV systems are usually
worked at multiples 12 volts (Guda and Aliyu, 2015).
2.6.2 Charge Controller
The charge controller (also known as voltage regulator) is the intermediary device between the
panels and other PV system components such storage unit and inverter. Its purpose is to

12
control the power flow between these components thereby protecting them. The basic function
of a charge controller is to regulate battery voltage.
2.6.3 Inverter
The power produced by the panels is DC, therefore the inverter changes direct current (DC) to
alternating current (AC) making it suitable to be used by most home appliances.
2.6.4 Storage unit/Batteries
The storage unit is composed of batteries; its function is to store excess electric power. These
batteries are classified as deep cycle batteries; they are able to withstand continues charging
and discharging. They are different from car/vehicle batteries
2.7 Types of PV System
Photovoltaic systems are classified according to construction type and function or purpose of
the installation. Basically, there are three types of photovoltaic systems; standalone, grid-
connected and hybrid PV systems. There are other types of PV system such direct PV system
which does not have any an inverter to convert dc power to ac power.
2.7.1 Standalone PV System
Standalone photovoltaic systems can be categorized into two groups; DC standalone or AC
standalone or DC/AC standalone system. Basically, standalone systems are not connected to
the utility or grid. Components of standalone systems are modules, charge controllers, storage
unit, and inverter. Standalone systems are the most common type of PV systems around the
world; they are mostly installed in homes and small business/office premises. Countries
having good PV regulations are turning most standalone systems into the grid-connect system.
The metering system is connected to by the home and grid, and excess power from the PV
system is sold to the utility provider and increase of power demand exceeds production, power
is sourced from the utility.

13
Figure 2.7: standalone PV systems ( El-Dein et al .,2013)
2.7.2 Grid-connected PV system
The grid-connected can be a standalone system which is connected to the grid or large or
medium scale photovoltaic plants called PV power plants. These plants are usually mega-watts
installation and cover large hectares of land. PV power plants have other components such as
power condition units which shape (frequency and power quality issues) the power into the
desirable state before connecting to the grid (Azoumah et al ., 2010).
2.7.3 Hybrid PV systems
The hybrid PV systems is a combination of PV systems and other forms of energy producing
units such as diesel or gas generators, wind turbines and hydro plants. The purpose of these
other units is to complement the PV system during unfavorable weather conditions and most at
night.
2.8 PV Cell Equivalent Circuits
Figure 8 shows the simplest equivalent representation of the solar cell. The circuit consists of a
current source Iph parallel to a diode D and shunt resistance Rsh, all together connected to a
series resistance Rs. The current source is an ideal source which provides current proportional
to solar flux which it is revealed to.

14
Figure 2.8: Pv cell equivalent circuit (El-Dein et al .,2013)
2.8.1 PV module connection
There are three ways of connecting photovoltaic modules; series, parallel and combination of
series and parallel connection. Each of the connecting methods depends on specific array
output requirements. Connecting modules in series increases the voltage but maintain current
whilest connecting in parallel maintains voltage but increases the current. Parallels and series
combination depends on several factors such as array power output, the capacity of inverters
and power conditioning components etc ( El-Dein et al. , 2013).
2.8.2 Concentrated Solar Power
The technology of concentrated solar energy can be traced as far back as 200 BC; Archimedes
used curved to converge the sun‟s radiation to a point. This idea was used to start fires.
Diocels who was a Greek mathematician explained the parabolic trough‟s optical property in
2nd
century BC. In 1746, Comte de Buffon outlined Heliostat design development. In 1878,
Augustin Mouchot, at the universal exhibition in Paris, displayed a dish propelled by steam
engine system. A much better breakthrough in CSP technological research occurred in Egypt
in 1913 when Frank Schuman successfully built parabolic trough powered pumping system.
But the actual CSP industry started in 1980s in California in U.S.A; 354MW of nine SEGS
(Solar Electric Generating System) were built during these periods and still functioning today (
Lovegrove , 2012).
Concentrated solar power is based on the principle of concentrating solar radiation to a
specific point where heat from the sun‟s radiation is used to power steam turbine to produce
electricity. Mirrors or lenses are used in focusing the sun‟s radiation. There is a similar
technology called concentrated photovoltaic but in this case, multi-junction solar cells are used

15
to produce electric power; both technologies are similar in the sense that solar radiation is
concentrated to a point ( El-Dein et al., 2013). CSP is renewable energy thus prevent the
destructive effects of using fossil fuels and nuclear reactions for electric power generation.
CSP has the advantage of being able to produce power in the absence of solar radiation when
fitted with thermal storage system; this added benefit seriously increases the capacity factor
when liken to photovoltaic systems. CSP technology can be categorized into two groups; line-
focusing systems (LFS) and Point-focusing systems (PFS). LFS is made up Fresnel plants and
parabolic trough; they have single axis tracking network whilst PFS is made up of the solar
tower and solar dish plants which uses double axis tracking system ( Lovegrove , 2012)
2.8.3 Parabolic trough
The parabolic trough technology is composed of mirrors or lenses designed into parabolic
shapes. At the center of the parabolic-formed mirror is a tube equal in length to the mirror.
The tube contains fluid which absorbs solar energy (thermal) and transports it to the steam
turbine for power generation or storage unit. Basically parabolic trough technology is made of
the thermal receiver, solar collector (lenses, mirror or highly published surface), and storage
unit and generator system. Figure 10 shows the parabolic-shaped mirrors with tubes containing
thermal receivers. Because of rotation of the earth, the sun‟s position is not stationary thus
parabolic trough system are incorporated with solar tracking system to maximize efficiency at
all times of the day. Synthetic oil, molten salt or water/steam is used as the heat receiver and
choice depends on plant design requirements ( Lovegrove, 2012).

16
Figure 2.9: Parabolic Trough ( Lovegrove, 2012)
2.8.4 Linear fresnel
The linear Fresnel technology and method of operation is similar to the parabolic technology;
the difference being that the linear Fresnel uses flat mirrors or slightly curved mirrors (mostly
at the edges) and also the tube containing the thermal receiver is elevated to a good height and
the inverted. Figure 9 shows the linear Fresnel technology. It has the benefit of requiring small
land area and also being relatively cheap when compared to parabolic trough technology
(Jacobson and Delucchi ,2011).
Figure2.10: Linear Fresnel reflector(Jacobson and Delucchi,2011)

17
2.8.5 Solar tower technology
The solar tower technology is also known as the central receiver. It has five principal
components; Heliostats, thermal storage, heat and exchange, receiver and controls. Heliostats
(an array of mirrors) concentrate the sun‟s energy onto a central receiver located on the
pinnacle of a tower of appreciable height. The central receiver can be referred to as an
interface between the source of energy (sun) and the generation unit; it transfer heat from the
sun to the generator. The heat absorbed by the receiver is used to convert water into steam to
propel steam generators. Molten salt acts thermal storage unit. Figure 2.11 illustrates the
central receiver technology.
Figure 2.11: Solar tower technology( Lovegrove,2012)
2.8.6 Stirling dish technology
The Stirling dish technology combines parabolic trough and solar tower technologies. The
physical structure of the Stirling dish resembles satellite receiver. The main components of the
Stirling dish are: a collector, receiver, and an engine. Mirrors are shaped into a satellite dish
and the receiver and engine are placed as shown in Figure 2.12. The collector (mirror)

18
concentrates the sun‟s energy onto the receiver which transfers the energy to the engine.
Advantages of the Stirling technology are:
The close proximity of the engine to the receiver reduces heat loss during heat transfer.
Due to its small generation capacity, Stirling dish can be employed as distributed
generations
It can be used in regions with water difficulties because it employs dry cooling
technology (Azoumah et al., 2010).
Figure2.12: Stirling dish technology (Azoumah et al.,2010)

19
CHAPTER 3
GRID CONNECTION AND OFF-GRID CONNECTION
3.1 Grid Connection
An electric grid is a system of interconnected network which is used in supplying electric
power to the consumer i.e. from the point of generation to distribution. It‟s made up of
consumer, generating stations, substations, and different levels of magnitude of voltage
transmission lines; from mega-volts to volts (Kaplan et al . ,2009) . Grid connection or grid-
tied photovoltaic power plants has increased tremendously over recent years. PV systems
together with other renewable energy sources have become visible contributors in electricity
generation and distribution (Wang and XU, 2010).This is as a result of harmful effects of
fossil fuels such as greenhouse gas emission causing global warming to environment. PV
energy is clean, reliable and a non-pollutant as such most developed countries have stated or
are already investing heavily in photovoltaic systems and other forms of renewable energy.
Most African countries are yet to take full advantage of PV system even though the weather
conditions favorable supports photovoltaic systems.
Grid connections of photovoltaic systems can be categorized into two sections; transmission
level connection and distribution level connection. In the transmission level connection, a
centralized PV park usually with power in mega-watts (MW) is properly conditioned with
suitable devices such as inverters, transformers etc. before connecting to the grid, most
transmission level connections are done from commercial PV farms. Photovoltaic power
plants with capacity beyond 5 kWp are called DPVP (Dispatchable photovoltaic plants); they
are so-called because they can easily regulate output power at the behest of the grid operator
(Wang and XU , 2010) .In the distribution level connection, either standalone PV systems or
small scale commercial PV systems are tied to the grid after suitable conditioning has been
done; rooftop PV systems can also be connected to the grid in countries having proper grid
codes, regulations/regulators or standards. The difference between transmission level
connection and distribution level connections is that the latter tends to produce grid related

20
constraints such power quality issues (Li et al., 2012 ).Three phase photovoltaic systems can
be connected to the grid at transmission and distribution levels whilst single phase
photovoltaic systems can only be connected to the grid at the distribution level. Grid
connection of photovoltaic systems is heavily dependent on one principal component called
inverter; other peripheral devices such as transformers, protection units etc. are used as well.
The inverter is a power electronic device which changes direct current (dc) to alternating
current (ac). The inverter is made up semiconductor switches; transistors (IGBT, MOSFET
BJT etc.), diodes, thyristors, gate turn-off thyristors (GTO), Triode, passive and active
elements, appropriate circuitry and a control mechanism. There are several types of inverters;
conventional inverters, matrix converters, etc. prominent among the types is the multilevel
inverter which is made up of two types; symmetrical and asymmetrical. Multilevel inverter is
the connection of a number of H-bridge (single or three phases) to produce several levels of
voltage at the output. The goal of most multilevel inverter designers is to produce several
number of dc levels at the output of an inverter using limited number switches and dc sources.
The multilevel inverter has seen rapid application over the years because of its numerous
advantages. Single phase H-bridge inverter circuit is shown in Figure 3.1 and three phase
inverter is shown in Figure 3.2.
3.2 Single Phase H-bridge Inverter
Single phase H-bridge inverter can be categorized into two groups; Single phase half H-bridge
inverter and Single phase full H-bridge inverter. The single phase full H-bridge inverter is
shown in Figure 3.1. It‟s made up of four transistor switches connected anti-parallel with a
single diode each, the purpose of the diode is to provide alternative path for current flow. The
switching topology for the single phase H-bridge inverter is shown in Table 3.1.

21
Figure 3.1: Single Phase H-bridge Inverter (Kaplan et al., 2009).
Table 3.1: Table for Single Phase full H-bridge Inverter (Kaplan et al., 2009)
Switches
State S1 S2 S3 S4 Output voltage Vo
1 1 1 0 0 Vo
2 0 0 1 1 -Vo
3 1 0 1 0 0
4 0 1 0 1 0
3.3 Three Phase H-bridge Inverter
The three phase H-bridge inverter is made up of two types; half bridge and full bridge inverter.
Three phase full bridge inverter is shown in Figure 3.2. It‟s made up of six transistor switches
connected anti-parallel with a single diode each, the purpose of the diode is to provide
alternative path for current flow. Two switches are connected in series and three of such series
connection is connected in parallel. The switching topology for the three phase H-bridge
inverter depends on the firing angle. Basically the principle of operation of the three phase
inverter is that only one switch can be on amongst the series connection for duration of time.
Example Q1 and Q2 cannot be on at the same time neither can Q3 and Q4 be on at the same
time, also all three switches at the upper (Q1, Q2, Q3) level or lower (Q2, Q4, Q6) cannot on or
off at the same time.
vo

22
Figure 3.2: Three Phase Full H-bridge Inverter (Kaplan et al., 2009)
The inverter used in photovoltaic systems is an essential device which has multiple functions
such voltage inverting, grid connection, power quality monitoring. This is inverter is also
referred to as PV inverter. The PV inverter monitors the condition of the photovoltaic array
and its own operating status to enhance grid connection. The control setup furnishes
Supervisory control and data acquisition (SCADA) with the following; (MPPT) maximum
power point tracking supervision, smooth connection to grid, (LVRT) low voltage ride
through, Island mode, dynamic volt-ampere reactive supervision. The PV inverter has
protective systems which insulate the switches from irregular current stress (di/dt) and voltage
stress (dv/dt) by instantly obstructing triggering pulse.
3.4 Reactive Power Compensation
Photovoltaic energy is heavily dependent on modules and inverter type weather conditions at
the location of the plant. Due to these reasons the output of photovoltaic systems can vary
swiftly with changes in weather. The large and rapid fluctuation can affect the balance and
safety of electrical grid as reactive power compensation (RPC) is needed to solve this problem.
RPC method boosts power quality and also limits space consumption. Several field proven
RPC methodologies such as static synchronous compensator (STATCOM ), static volt-ampere
reactive compensation (SVC) will help in power factor compensation, harmonic elimination,
voltage imbalance, over and under voltage ( Kaplan et al., 2009).

23
Figure 3.3: NR Electric‟s SVC system (Yan et al., 2014)
3.5 Photovoltaic Substation
A new substation called Photovoltaic Digital Step-Up Substation has been proposed by NR
Electric; this substation has been tested in the field using over 250 substations and has proven
to very useful and efficient when compared to the conventional substation. Photovoltaic digital
step-up substation is applied to small and medium scale solar parks for electric power grid
integration. Photovoltaic digital step-up substation is made up of intelligent primary devices
and a network of secondary devices. Fiber-optic is used as a medium for data acquisition and
sharing amongst intelligent equipment. The fiber-optic used is of IEC 61850 conventions.
Phase monitoring devices can be sited in the photovoltaic power system to analyze and
monitor the dynamic response of the system; this will be achieved in real time. The output of
the PV system is greatly dependent on input fuel (sunlight); this fuel is a natural occurring
substance and as such the quantity is really not known. Photovoltaic power prediction is an
important factor to be considered in grid-tied PV system; this will help in monitoring and
stabilizing the power grid. Also power stability control network can be installed to help
mitigate against transient stability, load flow and voltage stability (Yan et al., 2014).

24
3.6 Off-Grid Connection
Off-grid systems offers the possibility to usher in vast amount of electric power produced
mainly from renewable energy sources such wind and solar which will greatly to help in
curbing depletion of ozone layer and as such constitute healthy environmental practices. This
will also lead to economic growth in mainly under-deprived and under-developed countries.
An off-grid system or network can be defined as self-sustaining power producing network
devoid of the conversional utility. A combination of hydro, wind or solar are the basic fuel
used in electric power generation of off-grid system. A hybrid system of RES and diesel
generators are used to produce power in emergency situations due to disruption in weather
conditions. An off-grid system should meet the following conditions:
a. An independent system devoid of external reliance
b. Efficient production and consumption system
c. Availability of energy storage system (ESS)
d. Use mostly renewable energy sources
e. Management of active side
f. Ability to serve new types of load( Kubalik et al.,2014)
Off-grid and grid-tied photovoltaic power plants are similar but with a few differences being;
after power is produced at the PV array, its converted to ac power then connected to the utility
in the case of grid-tied PV systems. In the case of off-grid PV systems, photovoltaic array
power is stored in energy storage systems or supplied to the consumer via microgrids. Off-grid
PV systems is a very broad and controversial area because of the factors to be considered
when describing off-grid photovoltaic systems. Off-grid systems are mainly homes,
institutions or communities which are not connected to the main power utility of a country,
this mainly due to cost of extending grid infrastructure, location or terrain and economic status
of the country. In communities where the main/national grid is not extended to, a microgrid
can be developed to power reliable power for the community.

25
A microgrid grid a distinct electric energy grid made up of distributed generations and energy
storage systems.Microgrids are either grid connected or islanded mode.Distributed generations
are small to medium size electric power generation units which are usually fueled by
renewable energy sources.
Figure 3.4: Microgrid layouts ( Disfani, 2015)
3.7 Power Quality in Off-grid Systems
Power quality which is also known as electric power quality can best be described using the
following parameters in electrical systems; waveform, frequency and voltage. Power quality
can be said to be acceptable if the power flow is consistent and falls within the authorize scope
of voltage, waveform and frequency. Therefore the power supplied to a consumer at point of
load connection should be in compatible with load power characteristics. Any interruption in
these parameters renders the quality of power poor which can have devastating effect on load
rendering loads to malfunction and leading to financial loses (Saini and Kapoor, 2012). The
power quality of an electrical system is dependent on a number of factors such as; duration of
supply i.e. short or long term, harmonics distortions, voltage variations and transients.
Harmonics distortion is the deformation of voltage or current waveforms in electrical systems
caused by the introduction of harmonics by the use power electronic converters and non-linear
loads. The effects of harmonics in electrical systems are power factor reduction, flickering,

26
over heating of electrical, early breakdown of transformers and uninterrupted power supplies,
system capacity reduction due to overheating, electrical fires, damage to sensitive loads,
frequent circuit breaker triggering. Total harmonic distortion is also known as THD is the
overall harmonics present in an electrical system. The total harmonic distortion of an electrical
systems expressed in voltage terms is a ratio of the square root sum of rms voltage of
individual components to fundamental rms voltage (Hojabri and Toudeshki, 2013).
THD= √
(3.1)
Where
V1 = rms voltage fundamental component
V3 = rms voltage of third component
Vn = rms voltage of the nth
component
Expressing the total harmonic distortion in percentage terms will give us:
THD=
√
x 100 % ( 3.2)
3.8 Energy Storage Systems
The efficient harnessing of renewable energy sources such solar energy is greatly dependent
on the ability to store produced power. The output power of a PV system depends heavily on
weather conditions and as such power supply can vary at any given time. To be able to
efficiently supply the required power and also efficiently utilize produced power, energy
storage systems are required for off-grid photovoltaic systems. In case of our research, the
required energy storage system is the type called large scale energy storage systems or grid
energy storage. Several energy storage systems have been developed and are being used to
store energy either in small to medium and large scales. Some examples of energy storage
systems are:
27
a. Compressed Air
b. Liquid Air
c. Batteries
d. Flywheel
e. Hydrogen
f. Power to gas
g. Pumped water
h. Super conducting magnetic energy
i. Molten salt
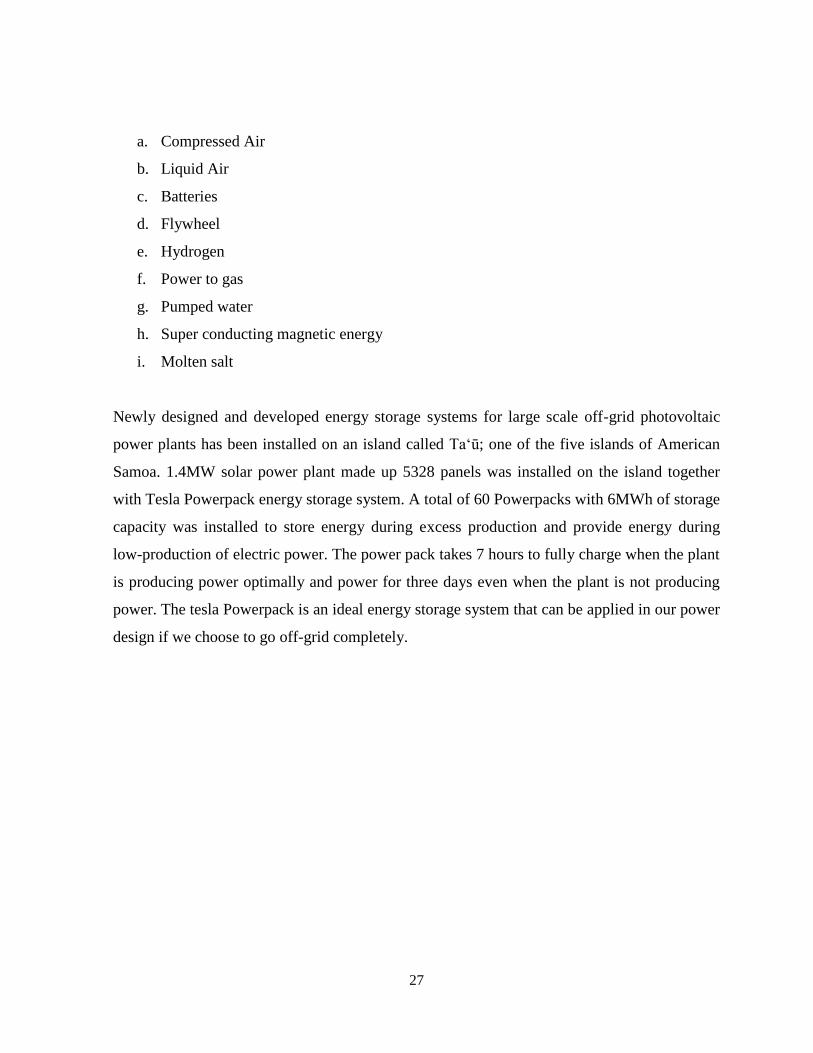
Newly designed and developed energy storage systems for large scale off-grid photovoltaic
power plants has been installed on an island called Ta„ū; one of the five islands of American
Samoa. 1.4MW solar power plant made up 5328 panels was installed on the island together
with Tesla Powerpack energy storage system. A total of 60 Powerpacks with 6MWh of storage
capacity was installed to store energy during excess production and provide energy during
low-production of electric power. The power pack takes 7 hours to fully charge when the plant
is producing power optimally and power for three days even when the plant is not producing
power. The tesla Powerpack is an ideal energy storage system that can be applied in our power
design if we choose to go off-grid completely.

28
Figure 3.5: MW PV Plant in Tau, American Island (solar City) (Hojabri and Toudeshki, 2013)
Figure 3.6: 6MWh Power pack storage unite (solar City) (Hojabri and Toudeshki, 2013)

29
CHAPTER 4
DESIGN OF PHOTOVOLTAIC POWER PLANT
4.1 PV Power Plants
A power plant is an industrial installation used for electric power generation. Power plants also
known as generating stations, powerhouse, generating plants, power stations uses a number of
generators to produce electric power, mechanical energy is converted into electrical power by
means of rotating parts in the generators.
PV power plants on the other hand do not use generators but use solar photovoltaic modules to
produce electric power. PV power plants also called solar parks are made up of thousands of
PV modules, used to develop photovoltaic systems to produce large scale power either for grid
integration or islanded mode. PV power plants produce electricity by converting solar energy
directly into electricity via solar cells. The nameplate capacity of photovoltaic power plants
differs from countries to countries. These variations are MWp (megawatt-peak) which refers
the Dc power produced at the array, MWAC is the ac power produced at inverter output and
finally MVA known as mega volts-amperes ( Landi et al., 2013).
The efficient performance of photovoltaic systems depends on several factors such weather
conditions (ambient and cell temperatures), the type of PV modules and inverters, the
efficiency and STC conditions of PV modules and inverters etc. PV power plant design is
heavily dependent on the nameplate capacity of the module, and inverter efficiency and
weather conditions at location.

30
4.2 Kirehe District
The district of Kirehe is located in the Eastern Province of Rwanda. It‟s made up of 12 sectors;
Gahara, Gatore, Kigarama, Nyarubuye, Nyamugari, Nasho, Mushikiri, Musaza, Mpanga,
Mahama, Kirehe, and Kigina. Kirehe district has sufficient solar radiation to support the
construction of photovoltaic power plants. Data sourced from National Aeronautical and
Space Administration (NASA) website using geographical coordinates; longitude 30.654878
and latitude -2.280087 shows average (22-year period; Jul 1983 - Jun 2005) monthly global
horizontal radiation of 5kWh/m2/day and peak sun hours of approximately 5 hours per day.
The warmest annual average temperature found in Kirehe district is 22.4oC at longitude of
30.2E and latitude of 2.2S (Werner et al., 2011).Table 4.1, shows an aerial view of Kirehe
community accessed from Google maps.
Table 4.1: Solar radiation (Werner et al.,2011)
Month Air
temperature
°C
Daily solar
radiation
horizontal
kWh/m2/d
Wind
speed
m/s
Cooling degree-days
°C-d
January 23.8 5.67 3.6 424
February 24.4 5.91 3.7 404
March 23.1 5.45 3.7 409
April 22.2 5.25 3.6 365
May 21.9 5.17 3.5 373
June 22.2 4.86 3.5 368
July 22.6 4.73 3.5 391
August 22.2 4.81 3.5 379
September 21.5 4.98 3.6 349
October 21.2 4.57 3.6 350
November 21.2 4.63 3.5 350
December 22.2 5.16 3.4 381
Annual 22.4 5.10 3.6 4533

31
4.3. Load Estimation
Electric load consumption varies with time, consumer type and location of consumer. Thus all
electric power suppliers should factor in the variation of load during load estimation. Efficient
load estimation of a community can be done by using previous consumer bills (load
information) over a period of time say one year and secondly collating data of gadgets a
consumer has. The latter methodology is applied in communities without grid connections or
newly developing communities. Load information is a data which shows how a community or
a consumer uses electric power by the hour, day, month and year. There are several ways of
formulating load data according to the specifications of the applicant. The main factors for
load data descriptions are dimension (amperes, Kilovolts, cos ɸ), system location, time and
class of customer (residential, services, industry). The constant availability of electric power
and the cost of electric power are two important factors which determines the consumption
patterns of customers. The electric load demand of communities in Kirehe is segmented into
four broad categories:
• Household/domestic sector which includes (lighting, TV, Radio, fridge etc.)
• Commercial loads (flour milling machine, mini shops, unisex hair dressing saloons
etc.)
• Community load which consists of (elementary school lighting, desktop computer,
printer)
• Health clinic which includes (vaccine refrigerator, communication radio, television,
microscope, computer and printer, DVD player, lighting systems).
The results of electric load estimation for the two communities under study in Kirehe are
shown in Tables 4.2 and 4.3 respectively. These are the chosen communities where electric
power will be provided by means of photovoltaic power plants. The estimated power for the
two communities are 500kW for community 1 and 302.232kW for community2, thus
0.802232MW (802.232kW) in total. Table 4.2 and Table 4.3 are made up of the categories of

32
electric load consumers which constitute the communities under study. Each community is
made up of the following categories; Upper class, middle class, lower class, Commercial,
Administration post, Medical center, Primary school, Secondary school, Church, Small
manufacturing. Tables 4.4 up to Table 4.13 are samples of each category providing detailed
explanation of how electric load estimation for the two communities was achieved.
Figure 4.1: Google map picture of Kirehe sector

33
Table 4.2 : Community 1
Table 4.3: Community 2
Categories Number
Of
households
Required
Power
kW
Total Power
(KW)
Power used
Per Day
Kwh/day
Total Power
Kwh/day
Upper Class 60 3.225 195.3 16.690 1001.4
Medium Class 30 2.368 71.04 14.75 442.5
Lower Class 80 0.064 5.12 0.6 48
Commercial 2 2.336 4.672 49.62 99.24
Administration 1 0.585 0.585 3.87 3.87
Medical center 1 1.125 1.125 17.5 17.5
Primary school 1 2.73 2.73 12.36 12.36
Secondary school 2 6.46 12.92 41.2 82.4
Church 1 0.58 0.58 1.91 1.91
Small manufacturing 2 4.08 8.16 29.310 58.62
Total 180 302.232 KW 1767.8
Categories Number
Of
households
Required
Power
kW
Total
Power
(KW)
Power used Per
Day
Kwh/day
Total Power
Kwh/day
Upper Class 100 3.255 325.5 16.69 1669
Medium Class 50 2.386 118.4 14.75 737.5
Lower Class 100 0.064 6.4 0.6 60
Commercial 5 2.336 11.6 49.620 248.1
Administration 1 0.585 0.585 3.870 3.870
Medical center 2 1.125 2.25 17.5 35
Primary school 2 2.730 5.46 12.36 24.72
Secondary school 2 6.460 12.94 41.2 82.4
Church 3 0.58 1.74 1.91 5.73
Small manufacturing 5 4.08 20.4 29.310 146.55
Total 270 500 KW 3012.87

34
Table 4.4: Upper class family
Appliances No.in
use
Power(W) Total
Power(w)
Hrs/day Wh/days Hour/day
Lamps 10 11 110 5 550 05:00-06:00 18:00-22
Mobiles 5 5 25 2 50 05:00-07:00
Radio 2 10 20 12 240 05:00-17:00
TV 1 120 120 3 360 18:00-21:00
DVD 1 30 30 3 90 18:00-21:00
Computer 2 100 200 2 400 17:00-19:00
Refrigerator 1 500 500 24 12000 00:00-24:00
Iron 1 1000 1000 1 1000 09:00-10:00
Water pumps 1 500 500 1 500 08:00-09:00
AC 1 750 750 3 1500 13:00-15:00
Total 3255 watts 16690
Table 4.5: Medium class family
Appliances No in use
power
Power(w) Total
power
(w)
Hrs/day Wh/days Hours /days
Lamps 8 11 88 5 440 05:00-06:00 18:00-22:00
Mobiles 4 5 20 2 40 05:00-07:00
Radio 1 10 10 12 120 05:00-17:00
TV 1 120 120 3 360 18:00-21:00
DVD player 1 30 30 3 90 18:00-21:00
Computer 1 100 100 2 200 17:00-19:00
Refrigerator 1 500 500 24 12000 00:00-24:00
Iron 1 1000 1000 1 1000 09:00-10:00
Water pumps 1 500 500 1 500 08:00-09:00
Total 2368 W 14750

35
Table 4.6: Administration post
Appliances No in use Power(w) Total power(W) Hrs/day Wh/day Hours/day
Lamps 10 11 110 2 220 17:00-19:00
Mobiles 5 5 25 2 50 07:00-09:00
Television 1 120 120 8 960 09:00-17:00
DVD player 1 30 30 8 240 09:00-17:00
Computer 3 100 300 8 2400 09:00-17:00
Total 585 W 3870
Table 4.7: Lower class family
Appliance No in use Power(w) Total power Hrs/day Wh/days Hours/day
Lamps 4 11 44 5 440 05:00-06:00 18:00-22:00
Mobiles 2 5 10 2 40 05:00-07:00
Radio 1 10 10 12 120 05:00-17:00
Total 64 W 600
Table 4.8: Commercial/community purposes
Appliances No in use power Total power Hrs/day Wh/day Hours/day
Lamps 6 11 66 5 330 05:00-06:00 18:00-22:00
Mobiles 2 5 10 2 20 05:00-07:00
Radio 1 10 10 12 120 05:00-017:00
TV 1 120 120 3 360 19:00-22:00
DVD player 1 30 30 3 90 19:00-22:00
Computer 1 100 100 7 700 08:00-17:00
00:00-24:00 Refrigerator 2 1000 2000 24 48000
Total 2336 W 49620

36
Table 4.9: Medical center
Appliances No in use power Total power Hrs/day Wh/days Hours/days
Lamps 10 11 110 15 1650 08:00-23:00
Mobiles 5 5 25 2 50 05:00-07:00
TV 1 120 120 8 960 09:00-17:00
DVD player 1 30 30 8 240 09:00-17:00
Computer 3 100 300 8 2400 09:00-17:00
Microscopes 2 20 40 5 200 09:00-14:00
Refrigerator 1 500 500 24 12000 00:00-24:00
Total 1125 W 17500
Table4.10: Primary school
Appliances No in use Power Total power Hrs/day Wh/days Hours/days
Lamps 30 11 330 2 660 17:00-19:00
Mobiles 50 5 250 2 500 12:00-14:00
TV 1 120 120 8 960 18:00-20:00
DVD player 1 30 30 8 240 09:00-17:00
Computer 20 100 2000 5 10000 09:00-14:00
Total 2730 W 12360
Table 4.11: Secondary school
Appliances No in use Power Total power Hrs/day Wh/days Hours/day
Lamps 50 11 550 5 2750 05:00-06:00 18:00-22:00
TV 1 120 120 3 360 19:00-22:00
DVD player 1 30 30 3 90 19:00-22:00
Computer 50 100 5000 7 35000 09:00-15:00
Water pumps 1 500 500 4 2000 06:00-10:00
Total 1 500 6400 W 4 41220 06:00-10:00

37
Table 4.12: Community church
Appliances No in use Power Total power Hrs/day Wh/day Hours/day
Lamps 20 11 220 3 660 17:00-20:00
Mobiles 2 5 10 4 200 12:00-16:00
TV 1 120 120 3 360 19:00-21:00
DVD player 1 30 30 3 90 19:00-21:00
Computer 2 100 200 3 600 09:00-14:00
Total 580 W 1910
Table 4.13 : Small manufacturing unit
Appliances No in use Power Total power Hrs/day Wh/day Hours/day
Lamps 5 11 55 4 220 08:00-21:00
Mobiles 3 5 15 4 60 12:00-16:00
3- phase motors 1 3000 3000 8 24000 08:00-21:00
1-phase motors 1 1000 1000 5 5000 08:00-21:00
Radio 1 10 10 3 30 15:00-18:00
Total 4080 W 29310
4.3.1 Average daily load profile
The maximum electricity load of the community occurs from 19:00 hour till 22:00 hour this is
due to most of the families would expect to be at home enjoying radio and television besides
night light use and some small manufacturing will be working during that time and
commercial.

38
Figure 4.2: Average daily loads
4.4 PV Power Plant Design
Sun power or energy is the fuel used in producing electricity by means of photovoltaic
systems. Energy from the sun comes in two forms; heat and light. Solar thermal technologies
use the heat aspect of sun‟s energy to produce power whilst solar PV technologies use the light
(photons) from the sun in producing power. The power consumption demand for the two
communities derived after load estimation is 802.232kW/day. From engineering perspective,
it‟s not right to produce the exact quantity of power required by a consumer/community thus
we will design 1MW PV power plant; excess power produced will be injected into the grid.
Consumption of power will increase when power is constantly available and affordable.
Increase in economic activities will also lead to increase in power consumption thus the need
to design 1MW plant.
4.4.1 PV panel/module
Samsung PV-MBA1BG250 (250W) monocrystalline silicon solar panel is proposed for the
construction of 1MW PV power plant and also used for simulation in PVsyst software. The
datasheet specifications of PV-MBA1BG250 are: STC and PTC power ratings of 250W and
225.7W respectively. Open circuit voltage Voc is 37.8V, short circuit current Isc is 8.68A,
maximum point current and voltage (Imp, Vmp) are 8.15A and 30.7V respectively, Nominal
operating cell temperature is 450C, made of 60 cells, area is 1644mm (length) x 992mm
0
5000
10000
15000
20000
25000
1 3 5 7 9 11 13 15 17 19 21 23 25
POWER (KW)
TIME( Hour)

39
(width), weight is 20.2kg and efficiency is 15.33% with 5 years guaranty and 90% and 80%
efficiency guaranty for 10 and 20 years respectively.
The following steps will help us to accurately design the required PV power plant of 1MW
capacity.
4.4.2 Energy required from the PV panels
Pdc,STC =
=1.33 Mw (4.1)
Conversion efficiency: 75 % estimate the impacts of temperature, inverter efficiency, module
mismatch, and dirt to come up with conversion efficiency from dc to ac.
Pdc(STC): is the dc power of the array obtained by simply adding the individual module
ratings under standard test conditions.
Pac: AC power.
Capacity of PV panel total WP = P (MW) / (h/day of “peak sun”) (4.2)
Capacity of PV panel total WP =1.3MWh /5(h/day)= 0.26MWp
The number of PV modules needed =
(4.3)
The number of PV panels needed = 1.3MW / 250W=5200 modules
Energy (kWh/year) = Pac (kW) * (h/day of “peak sun”) * 365 days (4.4)
Energy (kWh/year) =1.3MW * 5 h/day * 365days
Energy (kWh/year) = 2.3725GW/year
4.4.2 Inverter selection/string
Sunny tripower 15000TL inverter is what we selected for our design. Sunny tripower
15000TL is manufactured by System Mess Anlagentechnik, SMA Solar Technology AG

40
(Germany). Sunny tripower 15000TL has the following technical information for the dc input
side: maximum dc power is 15340W, maximum input voltage 1000V, maximum power point
voltage range is 360V-800V, rated input voltage 600V; minimum input voltage 150V,
maximum input current is 40A/12.5A. For the ac output side; European efficiency and
maximum efficiency are 97.8% and 98.2% respectively, rated power is 15000W at 230V 50Hz
frequency, nominal AC voltage at different variations: 220/380V or 230/400 and 240/415V.
Inverter size =
= 1.3MW (4.5)
Number of inverter =
(4.6)
Number of inverter =
86.66 inverters≈87 inverters
Number of modules in series =
(4.7)
Number of modules in series =
= 15 modules
Size of an array is 15 Modules which are in series 4 of such array are connected in parallel to
produce one string of inverter.
Total No. of Arrays in the solar field =
(4.8)
Total No. of Arrays in the solar field =
=325Arrays
The selected inverter must be large enough to handle the total amount of watts peak
requirement, the inverter size should be 25%–30% bigger than total watts requirement. Per the
technical information of the our chosen inverter, the field connection of modules to the
inverter is as follows; 15 panels having voltage of 30.7V and current of 8.15A are connected
in series to produce 460.5V voltage and 8.15A current. Four of such array connections are

41
connected in parallel to produce a voltage of 460.5V and current of 32.6A, this produces one
string of connection for one inverter. Per the module-inverter calculations, a total of 87
inverters will be required to efficiently convert dc power to ac power. There are different types
of inverters for various purposes. Examples are micro-inverters, string inverters and central
inverters. To determine the best inverter type for a specific application, several factors such as
cost, type of PV system; grid connection, standalone, hybrid etc. needs to be evaluated.
Considering cost, ease of installation and efficiency, 3-phase string inverters are the best
practical option.
4.3 Plant Area
A total of 5200 panels/modules are used in the design of our photovoltaic power plant. Each
module has an area of 1.631m2 (1644mm x992mm) therefor the total generating area of the
plant is 8480.41m2 whilst the total area the plant will be bigger than the generating area of the
plant. The generating area of the plant is an important factor in determining the amount of
energy to be produced and also analyzing the performance of the plant.
Table 4.15 : Photovoltaic module circuit
Types Sizes
Photovoltaic modules 250 w
Number of PV modules 5200 modules
Sunny tripower 15000TL 15000 w
Number of inverters 87 inverters
Number of modules in series 15 modules
Size of an array 15 modules
Total number of arrays in solar field 325 arrays
Module area 1.631m2
Land required for PV modules 8480.41m2

42
CHAPTER 5
PVSYST SIMULATION
5.1 PVsyst Software
The simulation aspect of our research is divided into two parts; simulation for fixed module
orientation and simulation for tracking system composed of east-west tracking, this is achieved
by using PVsyst software. PVsyst 6.6.8 edition is used. André Mermoud, a graduate (1971) of
university of Geneva in Switzerland is the author and founder of PVsyst software and PVsyst
SA respectively. PVsyst is made up of four sections; preliminary design, project design,
databases and tools. In the project design section, there are four subsections or systems; grid-
connected, standalone, pumping and dc grid. The grid connected subsection is our area of
concern because the desire of our project is to design grid connected photovoltaic. Using
satellite based meteorological data by NASA, simulation will be done to determine the yearly
energy output for the two case scenarios; the flowchart for simulation is shown in Figure 5.1.
Figure 5.1: Flowchart of PVsyst system programing

43
5.1.1 Site Location
The proposed PV power plant will be sited at Kirehe which is in the Eastern Province of
Rwanda. Kirehe district has sufficient solar radiation to support the construction of
photovoltaic power plants. Data sourced from National Aeronautical and Space
Administration (NASA) website using geographical coordinates; longitude 30.654878 and
latitude -2.280087 shows average (22-year period; Jul 1983 - Jun 2005) monthly global
horizontal radiation of 5kWh/m2/day and peak sun hours of approximately 5 hours per day.
The warmest annual average temperature found in Kirehe district is 22.4oC at longitude of
30.2E and latitude of 2.2S.
5.1.2 Orientation
According to weather and landscape terrain of Kirehe, the photovoltaic panels will be inclined
at an angle of 300 to south at fixed position. This angle of orientation is as a result of previous
research works; the optimal absorption of irradiance is at its peak at this angle and as such
maximum power is produced at the array output.
5.1.3 Horizon
The horizon line drawing for Kirehe is shown in Figure 5.2; it‟s a graph of sun‟s height versus
azimuth angle. There‟s a correlation between the suns height at specific hours of the day and
the azimuth angle. The geographical site details of Kirehe are: longitude of 30.2E and latitude
of 2.2S altitude 111m and albedo 0.20.

44
Figure 5.2: Horizon line drawings for Kirehe
5.1.4 Detailed losses
Experimental and simulation research by PVsyst over the years has led to standard values for
detailed losses in photovoltaic power plants. These standard values can be changed according
to the designer‟s specifications. Factors that affect losses in PV systems are: thermal loss
factor, ohmic losses, module quality and mismatch, soiling loss, IAM Losses, Ageing etc.
PVsyst set standard losses are used for our simulation.
5.1.5 System sizing : visual tools
For our simulation design, 1300kWp nominal power composed 5200 modules with an area of
8480.41m2 and 86 group of SMA inverters are used. The proposed panels and inverters that
we want to use in construction Kirehe power plant is selected for simulation. The data
provided below is generated by PVsyst; no shading was defined because the landscape of the
location of the plant is made up of more shrubs and grasses.
1. Orientation parameters
Field type: Fixed Tilted Plane
Plane tilt/azimuth = 30° / 0°
2. Compatibility between System defintions
Full system orientation tilt/azim = 30° / 0°
1 sub-array PNom = 1301 kWp, modules area = 8489 m²

45
No Shading field defined
3. System parameters
Sub-array #1 PV Array
PV modules: 347 strings of 15 modules in series, 5205 total
Pnom = 250 Wp Pnom array = 1301 kWp, Area = 8489 m²
Inverters (15.0 kWac) 87 MPPT Main inputs, Total 1
4. Shading scene parameters
No shading scene defined
5.1.6 Near shading
Kirehe PV power plant is not affected by any shading type; there are no buildings, tress or
mountains to cast shadow/shade onto the panels at certain time periods of the day. The
landscape is lowland with little shrubs. Figure 5.3 shows the satellite imagery for Kirehe.
Figure 5.3: Proposed Site for Kirehe Power Plant

46
5.1.7 System
The system feature in PVsyst allows you to design your PV power plant according your
specifications. Detailed information of desired output power, type of module to use;
manufacturer and output power Wp, type of inverter according to manufacturer and size,
shading effects, inverter sizing, economic analysis, etc. should be entered into system.
According to the load estimations made in the previous chapter, 1.3MW photovoltaic power
plant needs to be built in Kirehe. The plant will be made up of 5200 modules. The module
selected for simulation is Samsung PV-MBA1BG250: STC and PTC power ratings of 250W
and 225.7W respectively. Open circuit voltage Voc is 37.8V, short circuit current Isc is 8.68A,
maximum point current and voltage (Imp, Vmp) are 8.15A and 30.7V respectively, Nominal
operating cell temperature is 450C, made of 60 cells, area is 1644mm (length) x 992mm
(width). A simplified diagram showing the building blocks of the systems in PVsyst is shown
below. The „user E needed‟ in the diagram refers to the energy used by plant; lighting, data
acquisitions and peripheral needs.
Figure 5.4: simplified diagram of simulation
5.2 Simulation and Results
As stated in the beginning of chapter 5, the simulation is done for two case scenarios; fixed
module orientation and tracking system orientation. Detailed report is presented for both cases;
these reports are located in the appendix of our thesis. In the report a number of parameters are
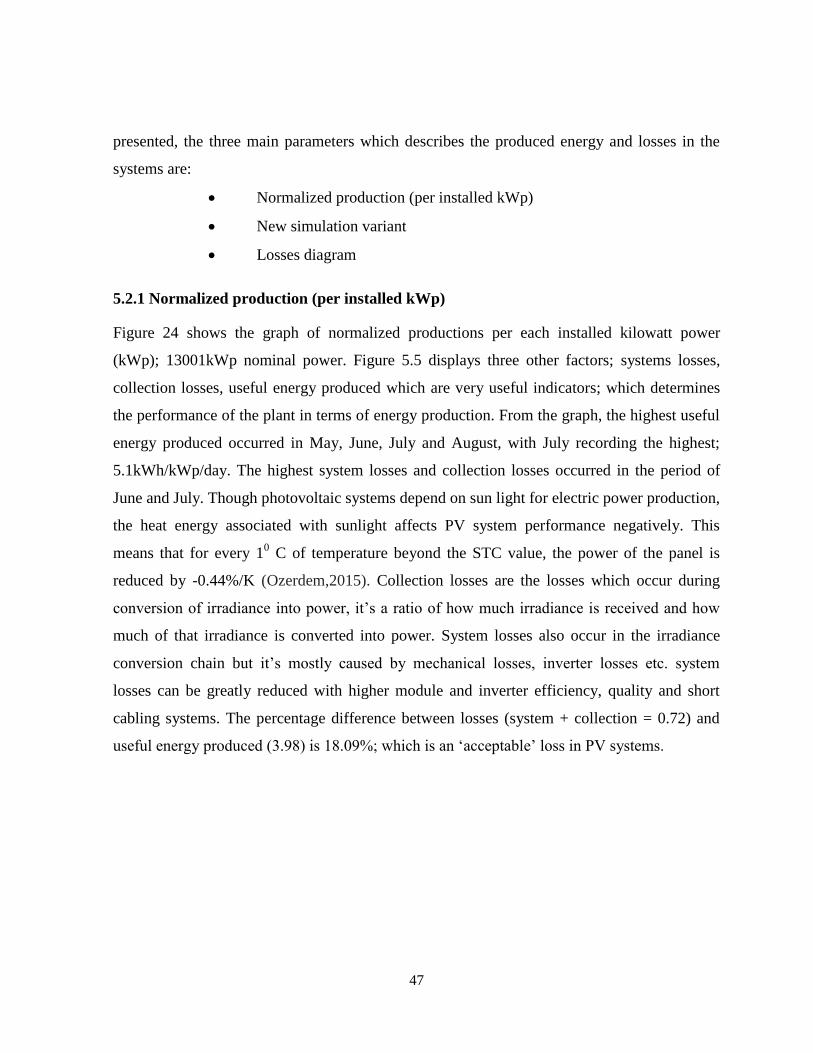
47
presented, the three main parameters which describes the produced energy and losses in the
systems are:
Normalized production (per installed kWp)
New simulation variant
Losses diagram
5.2.1 Normalized production (per installed kWp)
Figure 24 shows the graph of normalized productions per each installed kilowatt power
(kWp); 13001kWp nominal power. Figure 5.5 displays three other factors; systems losses,
collection losses, useful energy produced which are very useful indicators; which determines
the performance of the plant in terms of energy production. From the graph, the highest useful
energy produced occurred in May, June, July and August, with July recording the highest;
5.1kWh/kWp/day. The highest system losses and collection losses occurred in the period of
June and July. Though photovoltaic systems depend on sun light for electric power production,
the heat energy associated with sunlight affects PV system performance negatively. This
means that for every 10 C of temperature beyond the STC value, the power of the panel is
reduced by -0.44%/K (Ozerdem,2015). Collection losses are the losses which occur during
conversion of irradiance into power, it‟s a ratio of how much irradiance is received and how
much of that irradiance is converted into power. System losses also occur in the irradiance
conversion chain but it‟s mostly caused by mechanical losses, inverter losses etc. system
losses can be greatly reduced with higher module and inverter efficiency, quality and short
cabling systems. The percentage difference between losses (system + collection = 0.72) and
useful energy produced (3.98) is 18.09%; which is an „acceptable‟ loss in PV systems.

48
Figure 5.5: Nominal power 1301kWp (Normalized productions)
5.2.2 Performance ratio
The performance ratio is a quantity which is defined as the ratio of effective energy produced
at the array output with respect to energy produce by an ideal PV system under the same
conditions. Usually standard test conditions (STC) are used with the same amount of
irradiance incident on „global plane‟. The performance ratio of PV systems comprises of
system and array losses. Array losses are wiring, mismatch, module quality, shading effects,
photovoltaic conversion rate, IAM. From Figure 5.6, the overall performance ratio of our
system is 84%; there wasn‟t much difference in the monthly performance even though the
system and collection losses for June and July were considerable high.

49
Figure 5.6: Performance ratio
5.2.3 New simulation variant
Balances and main results of our simulation for Kirehe PV power plant is shown in Table 16.
From the table, maximum monthly energy production occurred in July; 211856kWh and least
occurred in December; 120194Wh. The yearly effective energy produced at the array output
(EArray) is 1938963kWh. However it should be noted that EArray is dc power. After
converting the dc power to ac power, then we have E-Grid, energy connected to the grid.
Yearly energy connected to the grid is 1892338kWh. The difference between E-Array and E-
Grid determines the efficiency of the inverter (97.6%). The graph of daily energy production is
given in the appendix of the thesis, from January to December.

50
Table 5.1: Balances and main results
GlobHor
kWh/m2
DiffHor
kWh/m2
T Amb
0C
GlobInc
kWh/m2
GlobEff
kWh/m2
EArray
kWh
E_Grid
kWh
PR
January 154.7 73.03 21.28 116.7 111.0 130856 127597 0.840
February 136.4 68.81 22.19 112.9 108.0 125946 122856 0.836
March 152.9 70.41 22.11 139.3 134.4 155327 151455 0.835
April 146.0 71.79 20.81 145.6 141.1 164146 160176 0.846
May 159.1 69.11 20.49 174.8 170.2 197879 193189 0.849
June 158.7 61.46 19.48 180.7 176.5 204408 199478 0.849
July 165.2 63.22 19.19 186.3 181.9 211856 206791 0.853
August 165.3 74.14 19.55 172.1 167.5 195642 191029 0.853
September 148.6 82.10 20.03 140.6 135.7 159858 156158 0.854
October 155.0 77.97 21.01 132.1 126.7 148733 145165 0.845
November 136.8 82.36 20.42 108.9 103.9 124117 121207 0.855
December 142.5 77.59 21.18 106.6 101.3 120194 117238 0.845
Year 1821.2 871.99 201.64 1716.6 1658.2 1938962 1892339 10.16
Legends:
GlobHor - Horizontal global irradiation
DiffHor – Horizontal diffuse irradiation
T Amb- Ambient Temperature
GlobInc - Global incident in collector Plane
EArray- Effective energy at array output
E_Grid - Energy injected into grid
PR – Performance ratio
5.2.4 Loss diagram
The loss diagram for Kirehe PV power plant is illustrated in Figure 5.7. The loss diagram is
the sum of various losses that occur right form irradiance conversion to grid connection of
produced energy. Losses which makes up the loss diagram can be categorized intro three
groups; conversion and module losses, conductor and accessories losses and finally inverter

51
losses. From Figure 26 the yearly energy produced at STC is 2159MWh, but „real‟ power
injected into the grid is 1892MWh yearly; this represents 12.37% total loss in the PV power
plant.
Figure 5.7: Loss diagram
Table5.2 ,represents detailed system losses on monthly basis. The sum of the various losses
(ModQual, MisLoss, OhmLoss, EArMPP and InvLoss) is 2047050kWh. This does not mean
2047050kWh is a „loss‟, this is because the fuel; irradiance for PV systems is free, also
ModQual represent module quality loss and it illustrates the percentage of irradiance that can
be converted to electric power. Although increasing the efficiency of modules will greatly
reduce MdQual losses, thus reducing total losses in the plant.

52
Table 5.2: Detailed System Losses
ModQual
KWh
MisLoss
KWh
OhmLoss
KWh
EArrMPP
KWh
InvLoss
KWh
January 134 1466 977 130856 3259
February 129 1412 1042 125947 3091
March 1602 1745 1522 155336 3881
April 1694 1845 1688 164197 4021
May 2044 2226 2176 197959 4770
June 2114 2302 2435 204562 5084
July 2190 2384 2453 211931 5140
August 2020 2200 2109 195719 4689
September 1647 1794 1443 159865 3708
October 1532 1668 1277 148733 3568
November 1276 1390 848 124117 2910
December 1236 1346 808 120194 2957
Year 20000 21780 18778 1939415 47077
Legends:
ModQual- Module quality losses
MisLoss- Module mismatch loss
OhmLoss- Ohmic wiring loss
InvLoss- Inverter Loss
EArrMPP- Array energy at maximum power point
5.3 Tracking System
Solar tracking system is an improvement on fixed module orientation, the goal of all types of
tracking systems is to maximum energy production by being in 900 alignment with the sun at
all times of the day. Basically there are two types of tracking system in PV power plants;
single axis and double axes tracking systems. Under these two basic types of tracking systems;
there are a number of different types of tracking system by virtue of geographical tracking
examples, East -west tracking, North - south tracking, vertical or horizontal tracking etc.

53
Adding tracking systems to the design of the plant will increase energy production but will
also add extra cost to the plant. Examples of solar PV tracking power plants are 105MW plant
in Punjab, India and 206MW single axis tracking system in California USA. The various
figures and tables represents simulation results for incorporating two axes tracking system
East – West frame to the design of Kirehe photovoltaic power plant. The same result
parameters obtained for the fixed angle orientation is also acquired for the two axes tracking
system, analysis of the two systems will determine difference in levels of energy production
between the two systems and economic feasibility. The results parameters are;
Normalized production
Performance ration
Balances and main results table
Loss diagram
Detailed system losses
Figure 5.7: Normalized productions for tracking system

54
Figure 5.8: Performance ratio for tracking system
Table 5.3: Balances and main result for tracking system
GlobHor
KWh/m2
DiffHor
KWh/m2
T Amb
0C
GlobInc
KWh/m2
GlobEff
KWh/m2
EArray
KWh
E_Grid
KWh
PR
January 154.7 73.03 21.28 187.1 183.5 209686 204539 0.840
February 136.4 68.81 22.19 165.3 162.5 183810 179269 0.833
March 152.9 70.41 22.11 190.4 187.4 210595 205272 0.828
April 146.0 71.79 20.81 183.2 180.4 205551 200474 0.841
May 159.1 69.11 20.49 216.2 213.8 244981 239075 0.847
June 158.7 61.46 19.48 215.7 213.1 242594 236590 0.843
July 165.2 63.22 19.19 224.5 221.7 254185 247956 0.849
August 165.3 74.14 19.55 210.7 207.6 238624 232884 0.849
September 148.6 82.10 20.03 182.6 179.3 207388 202484 0.852
October 155.0 77.97 21.01 186.7 183.4 209821 204740 0.843
November 136.8 82.36 20.42 156.9 153.4 179527 175365 0.859
December 142.5 77.59 21.18 167.5 163.7 189986 185465 0.851
Year 1821.1 871.99 20.64 2287.4 2249.5 2576747 2514113 0.845

55
Table 5.4: Detailed System Losses for tracking system
ModQual
KWh
MisLoss
KWh
OhmLoss
KWh
EArrMPP
KWh
InvLoss
KWh
January 1711 1863 1477 166021 3940.371
February 1593 1734 1516 154417 3717.678
March 1840 2004 1929 178240 4387.992
April 1951 2124 2190 188786 4681.403
May 2483 2704 3113 239997 5981.896
June 2488 2710 3365 240276 6312.009
July 2598 2829 3390 250943 6309.119
August 2355 2564 2806 227736 5544.633
September 1838 2001 1746 178181 4116.760
October 1851 2016 1805 179403 4202.462
November 1496 1626 1126 145367 3293.328
December 1524 1660 1149 148097 3415.456
Year 23726 25838 25611 2297465 55903.106
Legends:
ModQual- Module quality losses
MisLoss- Module mismatch loss
OhmLoss- Ohmic wiring loss
InvLoss- Inverter Loss
EArrMPP- Array energy at maximum power point

56
Figure 5.9: Loss diagram for tracking system

57
5.4 Economic Analysis
PV systems are often considered as a clean energy solution which is friendly to environment
,however ,on the other hand ,PV systems are also valuable in financial issues .With effective
design and operation , PV system may pay back its investment and have further profit .Some
PV systems have lower cost than other type of generations. To decide the cost and value of a
PV system ,an economic analysis is conducted by designers.
5.4.1 Initial cost
Financial costs include initial costs ,maintenance costs ,repair costs and replacement
costs.Initial cost involves the stage of design ,engineering ,devices and installation of the PV
system .The prices of equipment are obtained from manufacturer or sellers. The different cost
between a system that is installed by self and a system that requires professional installation
of the devices .Then the total cost is thought to be the total cost to be initial cost at the
beginning of life of the system .
Table5.5: Economic gloss
Economic parameters Fixed system Tracking system
Module cost 910 000€ 910 000€
Support cost 832 000€ 832 000€
Dual axis tracking motor and wiring 0 € 733 915.5 €
Inverter and wiring 260 000€ 260 000€
Transport and mounting 641 269€ 641 269€
Investment cost 2 643 269 € 3 143 184 €
Annuities 212 103 €/yr 252 217.2162 €/yr
Maintenance cost 34 201€/yr 34 201€/yr
Total yearly cost 246 304€/yr 286 904€/yr
Energy cost 0.13 €/yr 0.13 €/yr
Payback period 11 years 10 years

58
PVsyst software give access to define the installation cost and operation cost of PV power
plant for grid connected only ,this value in table for grid connected ,we got it through from
PVsyst simulation and we set lifetime to be 20 years of the system .
Based on the information given by the above Table .the approximated cost for the PV system
size of 5200 modules of Samsung PV-MBA1BG250 in PVSYST is 91 000 euros , and the
support cost of module in PVSYST it give me 832 000 euros. The cost of 87 inverter Sunny
tripower 15 000TL and its installation in PVSYST software is 260 000 euros ,Transport and
mounting cost in PVsyst is 641 269 euros then the PVsyst software add the cost of modules
91000 euros plus the support cost of 832 000 plus cost of inverter and its installation 260
000 euros and the transport and mounting cost 6 412 269 euros the total summation of this
cost it is the total investments which is equal to 2 643 269 euros .We set that If government
of Rwanda take the loan for investment of 2 643 269 euros which is going to be paid in 20
years with rate of 5% each year it will supposed to pay 212 103 euros /yr as it was calculated
by PVsyst
By my manual calculation also annuities is equal :
A=
( 5.1)
A=
212 103 euros/yr
r :Rate of period
n:Duration
PV :Present value
The PVsyst provide maintenance cost of 34 201 euros /yr, The total yearly cost is equal to
annuities of 212 103 euros/yr plus maintenance cost of 34 201 euros/yr will be equal to 246
304 euros/yr.The analysis in PVsyst software is based on the current system cost that are used
in Rwanda . We set the energy cost in PVsyst to be 0.13euros/Kwh as it is in Rwanda ,The
yearly energy of fixed system in PVSYST is 1918 000Kwh/yr .

59
For tracking system we assumed the some cost value to be the same as it is for fixed system
,module cost is 910 000 euros, support cost is 832000 euros ,inverter and wiring cost is
260000 euros transport and amounting cost is 641 269 euros but I added the cost of dual axis
solar tracking system , it has the following characteristics (https://www.amazon.com/ECO-
WORTHY-Dual-Solar-Tracking-System/dp/B00JYAIS9W Retrieved 21 April 2018).
Complete solar tracking kits: 12V 6" & 12" Linear Actuator & Remote Controller &
Mounting Accessories. Linear Actuator: 12V motor has gearbox and is rated to hold up
to 330 lbs. when not moving. An all-metal housing and is water-resistant and sealed
against dust for rugged durability.
Dual axis controller: control dual axis linear actuator to make the solar panel to follow
the Sunlight, keep the solar panel always face the sunlight. Smart weather detector,
Material: Mounting pole is made from galvanized iron tube .Mounting arms are all
made from Aluminum
Perfect tracking mounting kit for solar panel system, improve solar power efficiency.
The cost of one dual axis solar tracking system is $499.00 & FREE Shipping and I changed it
in euro it is 423.25 euro in that cost they will provide the cable and other components . One
dual axis solar tracking system can hold approximately three modules
(https://www.amazon.com/ECO-WORTHY-Dual-Solar-Tracking-System/dp/B00JYAIS9W
Retrieved 21 April 2018). The total modules is 5200 modules ,We will need 1734 dual axis
solar tracking by taking 5200 modules divide by three , the total cost is equal 423.25 euros
times 1734 modules ,the cost of dual axis solar tracking will be 73 3915.5 euros , then I sum
up the total cost ,I get investment cost of 3 143 184 € .
A =
252 217. 2162 €/yr

60
we assumed that the maintenance cost will be the same as it is for fixed system because
there is the advancement in technology and reliability in electronics and mechanics ,the
maintenance cost is 34 201€/yr .
Total yearly cost =maintenance cost +annuities (5.2)
Total yearly cost =34 201€/yr+252 217.2162 €/yr=286 418.216 €/yr
The energy cost is 0.13€/kwh as it is in Rwanda. The yearly energy production of tracking
system from PVsyst Software it is 2 514 113 Kwh/yr.
5.4.2 Payback period
The payback period of a plant is the duration or time for which the plant is able to generate
revenue from production to the meet the cost of installation. Economic analysis from PVsyst
puts the cost of the plant at 2 643 269 million euros. To determine the payback period of the
plant, the price the consumer pays for 1kWh of power will be used to determine revenue
generation pattern of the plant. Analysis of yearly revenue generation and cost of the plant will
ascertain the payback period of the plant. However I choose 20 years lifespan .
Revenue of fixed system per year = yearly energy * cost of energy (5.3)
Revenue of fixed system per year =1918000Kwh/yr *0.13€ /kwh=249340€
Revenue of tracking system per year=2514113Kwh/yr*0.13€/kwh=326834€
The payback period for fixed system=
(5.4)
= 11 years
The payback period for tracking system =
= 10 years
This payback period it excludes maintenance cost and other cost incurred during operation
of the plant.

61
As the result the tracking system is best option because it can increase the amount of
electricity generated by photovoltaic modules even though it is expensive because of extra
cost of tracking motor but you can get profit in short period than fixed system you can be able
to payback the investment in short time than fixed system .

62
CHAPTER 6
CONCLUSION
6.1 Conclusion
Solar energy continues to play very important role in the generation and distribution of clean,
affordable, sustainable and environmentally friendly electric power. Comparing photovoltaic
system to other solar energy based technology make PV systems the most promising
technology for electric power generation. This is because it cheap and does not require very
cumbersome installation processes.
Rwanda just like any other third world country faces the enormous challenge of providing
electricity to every citizen no matter their location in the country and economic status. The
national population of Rwanda is 11.92 million (2016) with only 19.80% of the population
having access to electricity which means that roughly 10 million of the population do not have
access to electric power.
The main objective of this thesis is a proposal which seeks to increase electric power supply
and at same time reduce the huge electric power deficit of Rwanda thereby increasing socio-
economic development of the country. This will be achieved by designing, simulation and
evaluation of a 1.3MW photovoltaic power plant using PVsyst software. The research was
segmented into two parts; load estimation of the communities where power is to be provided
and simulation using PVsyst.
Simulation results acquired for the proposed Kirehe PV power plant puts the yearly grid
connected power at 1892338kWh for fixed module orientation and 2514113kWh for tracking
systems; this represents 28.2211% increase which is very significant amount of power in PV
systems. Performance ratio of 85% for both cases and losses of 12.37% -15.29 % are good
indicators of PV power plants under optimal operations. Undoubtedly, the use PVsyst software
as a tool for solar photovoltaic power plant simulation can be considered a good choice
because of its extensive application in research works by academia and photovoltaic industry

63
players. From the various simulation results obtained for the two case scenarios (fixed module
and tracking system) of our research, we can conclude that technically and economically, the
construction of PV power plant at Kirehe is feasible and poses no danger to the environment.

64
REFERENCES
Azoumah, Y., Ramdé, E. W., Tapsoba, G., & Thiam, S. (2010). Siting guidelines for
concentrating solar power plants in the Sahel: Case study of Burkina Faso. Solar
Energy, 84(8), 1545-1553.
Conde Peña, P. (2016). Business Cases for Microgrids in Africa: An Application Study
for An Application Study for Rukara, Rwanda .
Connolly, D., Lund, H., Mathiesen, B. V., & Leahy, M. (2010). A review of computer
tools for analysing the integration of renewable energy into various energy
systems. Applied energy, 87(4), 1059-1.
Disfani, V. R. (2015). Optimization and control for microgrid and power electronic
converters.University of South Florida.
El-Dein, M. S., Kazerani, M., & Salama, M. M. A. (2013). Optimal photovoltaic array
Energy, 84(8), 1545-1553.
Goodrich, A ., James, T., & Woodhouse, M. (2012). Residential, commercial, and
utility-scale photovoltaic (PV) system prices in the United States: current drivers
and cost-reduction opportunities (No. NREL/TP-6A20-53347). National
Renewable Energy Laboratory (NREL).
Guda, H. A., & Aliyu, U. O. (2015). Design of Stand-Alone Photovoltaic System for a
Residence in Bauchi. International of Engineering and Technology,5(1),34.
Hojabri, M., & Toudeshki, A. (2013). Power quality consideration for off-grid
renewable energy systems. Energy and Power Engineering, 5(05), 377.
Irechukwu, M. N., Ijumba, N., & Singirankabo, Y. (2017, November). Assessment of
electricity and electricity standby supply systems on university of Rwanda
campuses.In Electro-Technology for National Development (NIGERCON), 2017
IEEE 3rd
International Conference on (pp. 1090-1099). IEEE.
Jacobson, M. Z., & Delucchi, M. A. (2011). Providing all global energy with wind,
water, and solar power, Part I: Technologies, energy resources, quantities and
areas of infrastructure, and materials. Energy policy, 39(3), 1154-1169.

65
Jamasb, T., & Pollitt, M. (2005). Electricity market reform in the European Union:
review of progress toward liberalization & integration. The Energy Journal, 11-
41.
Kaplan, S. M., Sissine, F., & Net, T. (2009). Smart Grid: Modernizing electric power
transmission and distribution; Energy independence, Storage and security;
Energy independence and security act of 2007 (EISA); Improving electrical grid
efficiency, communication, reliability, and resiliency; integrating new and
renewable energy sources. The Capitol Net Inc.
Kubalik, P., Misak, S., Stuchly, J., Vramba, J., & Uher, M. (2014, May). Suitable energy
storage in Off-Grid systems. In Environment and Electrical Engineering
(EEEIC), 201414th International Conference on (pp. 345-349). IEEE.
Landi, M., Sovacool, B. K., & Eidsness, J.(2013)Cooking with gas: policy lessons from
Rwanda's National Domestic Biogas Program(NDBP). Energy for sustainable
Development 17(4), 347-356.
Li, J. X., Zheng, J. H., Zhu, S. Z., Wang, X. Y., & Shu, L. (2012, September). Study on
impact of grid connection of distributed photovoltaic system on distribution
network peak-valley difference considering photovoltaic volatility. In Electricity
Distribution(CICED), 2012 China International Conference on (pp. 1-4). IEEE.
Lovegrove, K. (2012). Introduction to concentrating solar power (CSP)
technology.In Concentrating Solar Power Technology (pp. 3-15).
Nzeyimana, L. (2003). Rusumo dam-social challenge in Kagera River Basin: Participate
the affected people.
Ozerdem, O. C., Tackie, S., & Biricik, S. (2015, November). Performance evaluation of
Serhatkoy (1.2 MW) PV power plant. In Electrical and Electronics
Engineering(ELECO), 2015 9th International Conference on (pp. 398-402).
IEEE.
Saini, M. K., & Kapoor, R. (2012). Classification of power quality events–a
review. International Journal of Electrical Power & Energy Systems, 43(1), 11-
19.

66
Tiwari, G. N., & Dubey, S. (2009). Fundamentals of photovoltaic modules and their
applications. Royal Society of Chemistry.
Van Niekerk, S., & Hall, D. (2013). Overview of energy in Africa. PSIRU-PSI Africa
http://www. psiru. org/reports/overview-energy-africa.
WANG, Y. B., & XU, H. H. (2010). Research of capacity limit of grid-connected
photovoltaic power station the basis of chance-constrained
programming. Proceedings of the CSEE, 22, 006.
Werner, C., Breyer, C., Gerlach, A., & Adelmann, P. (2011, June). Global overview on
cumulative installed photovolatic power. In a presentation to the Second Small
PV Applications. Ulm, Germany (pp. 6-7).
Yan, Y., Xiang, L., & Dianfeng, W. (2014). Integrated Solutions for Photovoltaic
Grid Connection: Increasing the Reliability of Solar Power. IEEE Power and
Energy Magazine, 12(2), 84-91.

67
APPENDICES

i
APPENDIX 1
FIXED SYSTEM

ii

iii

iv
APPENDIX 2
TRACKING SYSTEM

v

vi

vii
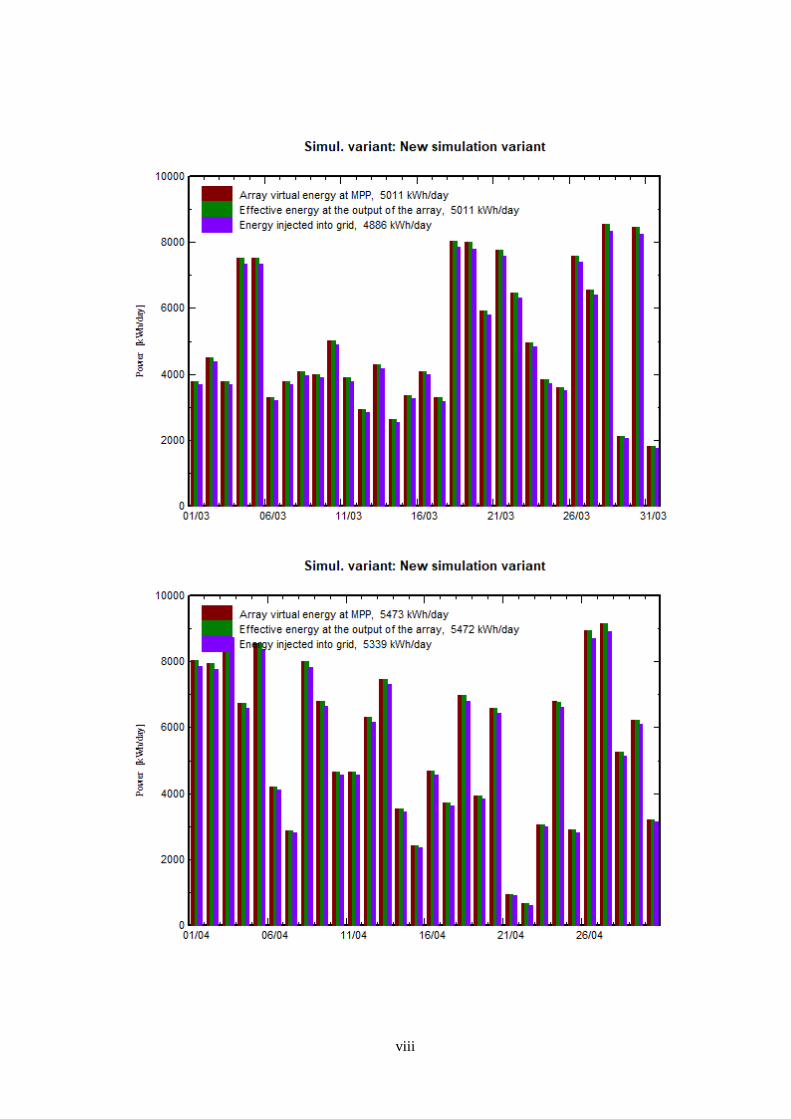
viii

ix

x

xi

xii

xiii
APPENDIX 3
ECONOMIC ANALYSIS

xiv