design of in-building wireless networks deployments using...
TRANSCRIPT

Design of in-building wireless networks deployments using evolutionary algorithms
Mariano Molina-Garciaa'*, Jaime Calle-Sáncheza, Carlos González-Merinoa, Alfonso Fernández-Duránb and José I.Alonsoa
Department of Signal, Systems and Radio communications, E.T.S.I. Telecomunicación, Technical University of Madrid, Av. Ciudad Universitaria, Madrid, Spain Alcatel-Lucent Spain, Maria Tubau, Madrid, Spain
Abstract. In this article, a novel approach to deal with the design of in-building wireless networks deployments is proposed. This approach known as MOQZEA (Multiobjective Quality Zone Based Evolutionary Algorithm) is a hybrid evolutionary algorithm adapted to use a novel fitness function, based on the definition of quality zones for the different objective functions considered. This approach is conceived to solve wireless network design problems without previous information of the required number of transmitters, considering simultaneously a high number of objective functions and optimizing multiple configuration parameters of the transmitters.
Keywords: Evolutionary algorithms, metaheuristics, optimization, wireless networks
1. Introduction
Metaheuristics based on Evolutionary Algorithms (EA) have been widely considered to solve extremely complex optimization problems, due to their capabilities to explore the solution space extensively and its ability to escape from local maximums. Regarding that fact, EAs has been used for complex optimization problems in research fields as diverse as antenna design [5], 3D modeling [3], classification of radar targets [4], identification of textiles [6], design of anti earthquake systems [8], construction of image filters [25], coordination of traffic signals [26], optimization of processes in projects [10] or design of steel structures [28] or civil infrastructures [29].
Among the design and optimization problems which can be faced using EAs, the design of wireless network deployments must be highlighted. Real-world design problems in large scenarios, where a high number
* Corresponding author: Mariano Molina-García, Department of Signal, Systems and Radiocommunications, E.T.S.I. Telecomunicación, Technical University of Madrid, Av. Ciudad Universitaria,30, 7,8040 Madrid, Spain. E-ma.il: igna.rio(»gmr.ssr.iipm.p,s.
of transmitters must be deployed and many configuration parameters in each transmitter must be selected, are extremely complex optimization problems. Consequently, researchers have considered the use of EAs to deal with this kind of problems. The use of evolutionary algorithms in the design of wireless networks, im pose several challenges. In real world design problems, estimate the number of transmitters required to fulfill the quality requirements specified by the designer is a very difficult task. Hence, if EAs are considered to solve wireless network design problems, mechanisms to overcome this problem must be developed.
Besides that, in the design of wireless deployments, several objective functions (OF's) must be optimized simultaneously. This OF's must include both cost and quality objectives, as quality constraints must be ful filled whereas costs are reduced as much as possible. In wireless networks deployments, independently, on the technology considered, quality requirements related to the average signal strength or to the coverage accord ing to signal strength and interference levels must be always satisfied. Apart from that, the traffic processed by each base deployed must be balanced, in order to avoid service, problems due, to congestion of same

M. Molina-García et al. / Design of in-huilding wireless networks deployments using evolutionary algorithms
bases, whereas other bases are under-used. Moreover, some other technology-specific requirements could be considered, as the overlapping area of different bases or the PCS/PCI collision and confusion in 3G and LTE deployments. These quality requirements can be especially difficult to fulfill in indoor scenarios, where many low power transmitters can be deployed in a small area. The complexity can be even increased if the in-building deployments are conceived to supply indoor positioning services, where other quality requirements must be fulfilled, as the simultaneous coverage of multiple transmitters in each location of the deployment scenario. Therefore, EA's developed to solve wireless network design problems must guarantee the ability to optimize simultaneously many OFs, including conflicting objectives as cost and quality objectives.
In the design of wireless networks using EA's, the more simple approaches take only into account quality objectives, assuming a known number of bases. Regarding indoor scenarios, in [1,17] base placement is obtained considering signal strength, coverage and rate and only coverage respectively. In [2], location of bases and antenna sectorization is selected in order to optimize coverage and interference. In [20], base placement and transmitted power are chosen to optimize, coverage, overlap and balance of 3G femtocells. With respect to outdoor deployments, in [14,32], base station placement is calculated in order to optimize the coverage. Unfortunately, as it was stated before, it is impossible to assess accurately the number of transmitters required a-priori, and, therefore, this approach is not suitable in real world design problems in complex scenarios.
More advanced approaches don't assume a constant number of transmitters, and aim to optimize simultaneously cost and quality objectives by combining them in a weighted sum. Many works have applied this approach in the design of wireless networks. In [7,13, 24], the number and the location of the bases are selected combining cost and coverage in a weighted sum. In [11], the number, the location, the frequency channels and the transmitted power of GSM bases are selected using as fitness function a weighted sum of area and traffic covered, usage of channels and costs. In [18] the number and the location of AP's in a WLAN indoor design are selected combining cost, signal strength and traffic coverage in a weighted sum. Although this approach is capable of dealing with the simultaneous optimization of conflicting objectives as cost and quality objectives, its main drawback is that the, relative,
weights among cost and quality objectives predefine a quality-cost tradeoff which conditions the obtained solutions.
Finally, approaches based on Pareto fronts have been considered. Previous researches have shown that Pareto-based approaches are adequate to deal with conflicting objectives as cost and quality OF's without assuming a quality-cost tradeoff, as they treat objectives independently. In [15], number of bases, position, transmitted power, antenna height and tilt are selected, maximizing coverage and minimizing cost. In [19], number and position of bases are obtained, optimizing cost, coverage and interference. In [27] the capabilities of different Pareto-front based EA's to obtain the number and position of transmitters optimizing cost and coverage are tested.
In [30], the proposed algorithm searches for the optimal, number, position and types of transmitters by considering cost, coverage, capacity and overlap. In [31] number, position of bases and frequency assignment are selected are obtained whereas costs and interference ratio are optimized. The main setback of the use of Pareto front is the high number of quality based OF's which must be considered in the design of real wireless network deployments, as it was stated previously. Pareto-based approaches are not suitable if many OF's are required to be optimized simultaneously, due to the deterioration of the search ability, and the dimensionality and the impossibility of the visualization of the Pareto front.
Therefore, due to the challenges associated with the use of EA's to deal with real world wireless network design problems, a different approach is required. This approach must be able to solve design problems without any a priori knowledge of the number of transmitters required to fulfill the quality constraints defined by the designer. Besides that, this approach must be able to deal with a high number of objective functions, including cost and quality objectives. Finally, the approach used to design in-building wireless networks in complex scenarios must be capable of optimizing multiple parameters simultaneously, leading to a single best solution.
In this article, a novel approach to deal with the design of in-building wireless networks in complex scenarios is proposed. The procedure developed is based on a hybrid evolutionary algorithm, known as MO-QZEA (Multiobjective Quality Zone Based Evolutionary Algorithm). This EA uses a novel fitness function to assess the goodness of the individuals. This novel fitness function is based on the definition of quality zones for the different objective functions considered
M. Molina-Garda et al. / Design of in-building wireless networks deployments using evolutionary algorithms 1
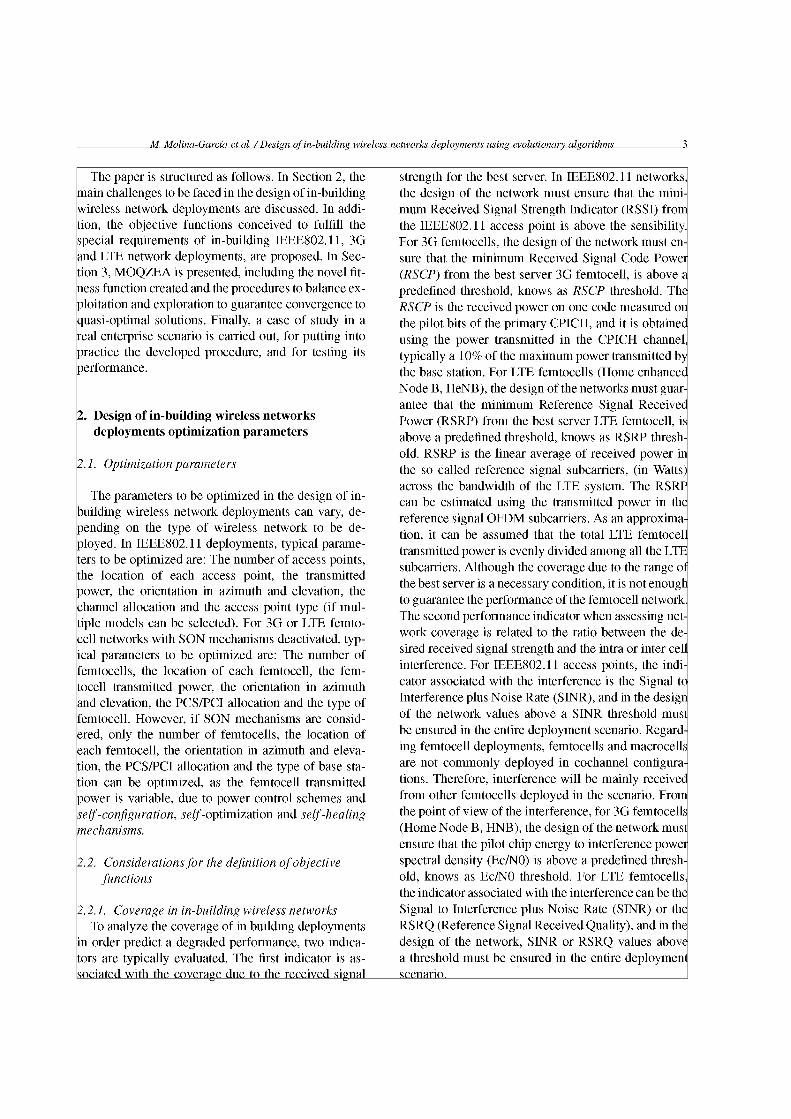
The paper is structured as follows. In Section 2, the main challenges to be faced in the design of in-building wireless network deployments are discussed. In addition, the objective functions conceived to fulfill the special requirements of in-building IEEE802.il, 3G and LTE network deployments, are proposed. In Section 3, MOQZEA is presented, including the novel fitness function created and the procedures to balance exploitation and exploration to guarantee convergence to quasi-optimal solutions. Finally, a case of study in a real enterprise scenario is carried out, for putting into practice the developed procedure, and for testing its performance.
2. Design of in-building wireless networks deployments optimization parameters
2.1. Optimization parameters
The parameters to be optimized in the design of in-building wireless network deployments can vary, depending on the type of wireless network to be deployed. In IEEE802.11 deployments, typical parameters to be optimized are: The number of access points, the location of each access point, the transmitted power, the orientation in azimuth and elevation, the channel allocation and the access point type (if multiple models can be selected). For 3G or LTE femto-cell networks with SON mechanisms deactivated, typical parameters to be optimized are: The number of femtocells, the location of each femtocell, the fem-tocell transmitted power, the orientation in azimuth and elevation, the PCS/PCI allocation and the type of femtocell. However, if SON mechanisms are considered, only the number of femtocells, the location of each femtocell, the orientation in azimuth and elevation, the PCS/PCI allocation and the type of base station can be optimized, as the femtocell transmitted power is variable, due to power control schemes and self-configuration, ^//-optimization and self-healing mechanisms.
2.2. Considerations for the definition of objective functions
2.2.1. Coverage in in-building wireless networks To analyze the coverage of in building deployments
in order predict a degraded performance, two indicators are typically evaluated. The first indicator is associated with the, coverage, due, to the, received signal
strength for the best server. In IEEE802.11 networks, the design of the network must ensure that the minimum Received Signal Strength Indicator (RSSI) from the IEEE802.11 access point is above the sensibility. For 3G femtocells, the design of the network must ensure that the minimum Received Signal Code Power (RSCP) from the best server 3G femtocell, is above a predefined threshold, knows as RSCP threshold. The RSCP is the received power on one code measured on the pilot bits of the primary CPICH, and it is obtained using the power transmitted in the CPICH channel, typically a 10% of the maximum power transmitted by the base station. For LTE femtocells (Home enhanced Node B, HeNB), the design of the networks must guarantee that the minimum Reference Signal Received Power (RSRP) from the best server LTE femtocell, is above a predefined threshold, knows as RSRP threshold. RSRP is the linear average of received power in the so called reference signal subcarriers, (in Watts) across the bandwidth of the LTE system. The RSRP can be estimated using the transmitted power in the reference signal OFDM subcarriers. As an approximation, it can be assumed that the total LTE femtocell transmitted power is evenly divided among all the LTE subcarriers. Although the coverage due to the range of the best server is a necessary condition, it is not enough to guarantee the performance of the femtocell network. The second performance indicator when assessing network coverage is related to the ratio between the desired received signal strength and the intra or inter cell interference. For IEEE802.il access points, the indicator associated with the interference is the Signal to Interference plus Noise Rate (SINR), and in the design of the network values above a SINR threshold must be ensured in the entire deployment scenario. Regarding femtocell deployments, femtocells and macrocells are not commonly deployed in cochannel configurations. Therefore, interference will be mainly received from other femtocells deployed in the scenario. From the point of view of the interference, for 3G femtocells (Home Node B, HNB), the design of the network must ensure that the pilot chip energy to interference power spectral density (Ec/NO) is above a predefined threshold, knows as Ec/NO threshold. For LTE femtocells, the indicator associated with the interference can be the Signal to Interference plus Noise Rate (SINR) or the RSRQ (Reference Signal Received Quality), and in the design of the network, SINR or RSRQ values above a threshold must be ensured in the entire deployment scenario

4, M. Molina-Garda et al. / Design of in-building wireless networks deployments using evolutionary algorithms
2.2.2. Acquisition of signal strength simultaneously from multiple sources for in-building networks oriented to supply positioning services
In-building wireless network deployments are conceived to provide benefits related to indoor coverage, throughput, quality of service, radio resource optimization and infrastructure cost savings. However, in addition to the improvement of indoor mobile coverage and performance, new added value services such as the Location Based Services (LBS) can be offered in enterprise scenarios to enhance the return of investment. The major performance metrics for indoor positioning systems are the accuracy and the precision in estimating a position. The location accuracy is usually defined as the error distance deviated from the actual position, while a location precision is reported in percentages of position information that are within the distance of accuracy. In the fingerprint-based positioning systems, the location fingerprints are collected by performing a site-survey of the received signal strength from multiple transmitters. RSSI must be acquired for IEEE802.11 access points, RSCP must be acquired for 3G femtocells whereas RSRP values are stored for LTE femtocells. Specific applications for acquiring and reporting signal strength values from both the server transmitter and their neighbors must be implemented. The user position is estimated in the online phase by means of pattern matching algorithms, which compare the stored location fingerprints with the real-time received signal strength reported by the user. The precision and accuracy of positioning results are affected notably depending on the number of simultaneously sensed and measured transmitters. On one hand, whenever the number of bases simultaneously covering a zone is lower than 3, the precision will be reduced. On the other hand, it has been proved that the performance is not improved for more than 5 transmitters [12].
Therefore, to design wireless networks oriented to supply positioning services, a minimum number of transmitters covering each zone of the scenario must be guaranteed. However, there is a tradeoff between this minimum number of bases covering each scenario zone, and the co-channel interference levels. Thus, the number of deployed transmitters for fulfilling simultaneous coverage requirements must be minimized, in order to avoid an unnecessary increase of the interference. Moreover, the increase of the number of deployed transmitters in wireless networks oriented to provide LBS services, lead to an increase of the deployments costs. The number of transmitters deployed to provide positioning services is typically multiplied by a factor from 2 to 3, depending on the scenario and
2.2.3. PSC/PCI allocation in femtocell deployments The fingerprint based positioning techniques exploit
the dependency between the spatial location and the stored received power patterns to estimate the user position using real time measurements provide by the user mobile equipment. Under this scope, the tuple formed by RSSI, RSCP or RSRP values measured from each measurable femtocell and the scenario points where they are measured (training points), must form univocal pairs. Otherwise, neither the deterministic techniques, nor the probabilistic ones, will be able to perform a proper comparison.
However, for femtocell deployments, this fingerprint technique requirement may not be fulfilled. For enhancing the comprehension of this problem in femtocell networks, it is necessary to describe the 3G and the LTE network devices identification mechanisms. In the LTE air interface, the Physical Layer Cell Identity (PCI) is used for cell identification and channel synchronization. Besides, the network operators provide a Cell IDentity (Cell-ID) that is a global and unique signature used to identify the cell from an Operation and Management (OAM) plane perspective. The users camped within a cell, can measure RSRP levels from server HeNB and from detected HeNB neighbors, and employ both the PCI identifier and the CID to distinguish between HeNB's. The server HeNB is only identified by the CID, while the neighbors reported information, is composed only by the PCI, according to current 3GPP standards. Therefore, the PCI is the only mechanism for the univocal differentiation of the RSRP measurements received from HeNB's neighbors. From a fingerprint technique perspective, it is required that all the measurable HeNB's in a training point have different PCIs.
For 3G femtocells, the situation is similar. In 3G deployments, the server HNB is only identified by the Cell ID, while the neighbours reported information, is composed only by the Primary Scrambling Code (PSC), according to current 3GPP standards. The requirements is the same as in LTE networks, all measurable HNBs must have different PSCs.
According to the LTE standard specifications, there are only 504 different PCIs available. In 3G networks, the PSC is chosen from a total of 512 available codes. Moreover, it is possible that the pool of PCIs/PSCs assigned to each type of femtocell, may be limited by the network operator, due to the fact that both identifiers are shared between macrocells and femtocells. Clearly, this limited number of PSCs and PCIs can lead to a PSC/PCI allocation conflict in large enterprise deployments the, maximum transmitted power of the, bases

M. Molina-Garda et al. / Design of in-building wireless networks deployments using evolutionary algorithms Í
i;.NL I !' -I 1 Hl-INB 2-PCI1
PCI COLLISION
PCI CONFUSION
Fig. 1. PCI collision and confusion.
PSC/PCI allocation conflicts [16,23] can be divided in two different problems, as presented in Fig. 1. The first one is known as PSC/PCI collision, and consists of the allocation of the same PSC/PCI to two different femtocells within a common coverage area. The second one, known as PSC/PCI confusion, occurs when a cell has two or more neighboring cells with the same PSC/PCI allocated.
PSC/PCI collision affects both the online and the offline phases of location based fingerprint technique. Since there are at least two or more femtocells with the same PSC/PCI covering the same area, it is impossible to univocally associate femtocell and PSC/PCI. Therefore, this conflict prevents the unique association between the received signal strength measurement and its correspondent femtocell. Thus, the reliability and accuracy of fingerprint based location systems is dramatically lowered.
Unlike collision, confusion does not affect the offline phase, since in the location fingerprint database generation, the training points coordinates are known, and therefore, the system can discard the neighboring cell which is not covering the training point. However, in the online phase, where the position is unknown, femtocells can't be discarded and, therefore, performance will be affected. Therefore, PCS/PCI planning to overcome collision and confusion is essential to use femtocell networks to provide positioning services.
2.2.4. In-building deployments with self organizing networks mechanisms
The 3GPP standardization organism has defined the required measurements, procedures and open inter-
faces to automate network operation, administration and maintenance functions lowering costs and increasing the mobile network performance. These elements altogether form the standardized SON framework, and their functionalities can be separated in three main areas: self-configuration, self-optimization and self-healing [9]. Self-optimization functionalities are conceived to optimize performance by adjusting network parameters, whereas self-healing functionalities are responsible for malfunction detection, network recovery and healing or compensating coverage and capacity losses.
Undoubtedly, these functionalities enhance the network performance, but they also may affect the performance of wireless networks oriented to provide LBS, since these functionalities modify the femtocell transmitted power. Unfortunately, pattern matching algorithms, as fingerprint ones, are very dependent on the stability of the configuration parameters of the femtocell network, as transmitted power variations...If the femtocell transmitted power is modified by SON mechanisms in a real time basis, the fingerprint algorithm will compare the real-time signal strength values with the patterns stored in the database, which were measured in different network conditions. As a consequence, pattern matching will fail. Besides, the stability of network operation, has a great impact on LBS performance. Whenever the pattern matching algorithm has not been informed of a femtocell shutdown, the user will be localized in areas where there is not coverage from this femtocell, drastically lowering the LBS reliability.
However, for the power modification case, the SON mechanisms may also help in the partial overcome of challenges they have provoked. Besides, in the shutdown case, the SON mechanisms may enhance the lowered LBS performance. The consecution of these objectives, imposes the establishment of a communication mechanism between the SON functionalities and the fingerprint based localization system.
The information provided by SON mechanisms, related to any modification in the femtocell transmitted power or femtocell failures must be used to update stored values in the fingerprint calibration database. However, although the collaborative process between SON subsystem and the indoor localization subsystem can minimize the impact of unexpected changes in the network infrastructure or operation conditions, degradations in robustness and accuracy may occur. On one hand, if a femtocell is offline, there is an information loss for pattern matching, which may turn into a rednc-

(L M. Molina-Garda et al. / Design of in-building wireless networks deployments using evolutionary algorithms
tion in the systems accuracy. To overcome this situation, the design process of the network can set a redundant coverage from more than 3 HeNB's in each training point. However, this fact will lead to an increase of the femtocell density, and therefore, the PCS/PCI pool must be enlarged to avoid performance degradation associated with PCS/PCI confusion and collision.
On the other hand, whenever the femtocell radiated power is varied according to SON mechanisms, the coverage area of each femtocell is modified. Under this scope, fingerprint positioning constraints, as simultaneous coverage of multiple femtocells or PCS/PCI collision and confusion avoidance, can be unfulfilled. Hence, possible variations of the femtocell transmitted power must be taken into account in the design process to fulfill fingerprint-based LBS requirements.
2.3. Objective functions for in-building wireless network deployments
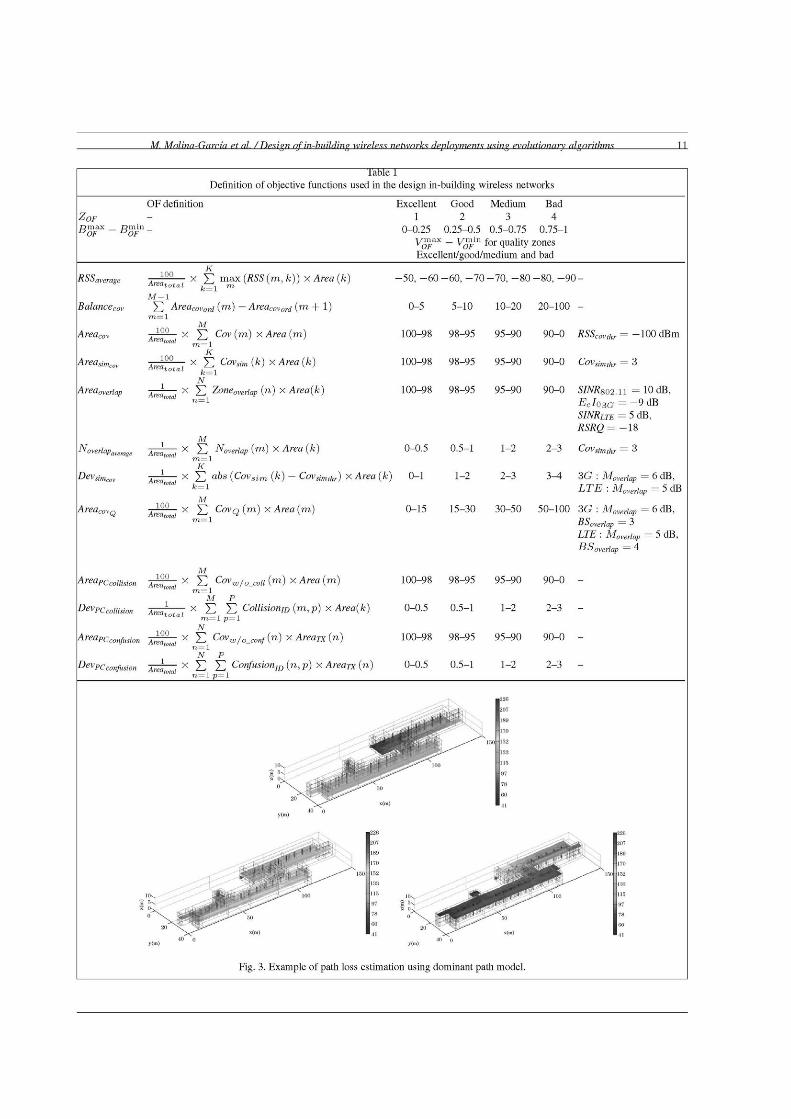
According to the considerations previously commented for the design of in-building wireless networks oriented to provide mobile and positioning services, some objective functions have been defined. A complete definition of these objective functions to be used in MOQZEA is presented in Table 1. Some of the considered objective functions are:
- Average Received Signal Strength (RSSaverage). This objective function is used to improve the evolution in early stages of the evolutionary algorithm. It evaluates the average value of RSS in the deployment scenario. RSS states for RSSI for IEEE802.il, RSCP for 3G femtocells and RSRP for LTE femtocells. Areatotai is the total area of the deployment scenario, RSS (m, k) is the power received from the femtocell m in the reference point k and Area (k) is the area characterized by the reference point k, and K the number of reference points.
- Balance of load {Balance COv)'- This objective function is used to improve the evolution in early stages of the evolutionary algorithm. It evaluates the differences among the areas where each base is considered as best server in the deployment scenario. AreaCOVord (m) is the percentage of the total deployment area where the base m can be considered as the best server and M the total number of bases deployed. AreaCOVord is a matrix with the percentages of area covered by each transmitter sorted in descending order
- Area with Coverage for Signal Strength Requirement (Areacov): This objective function includes a quality constraint of the indoor deployment. It evaluates the area of the enterprise scenario covered by abase. Cov (m) is 1 if RSS (n, m) is equal or greater than a power threshold RSSC0Vthr for any base station n deployed, and 0 otherwise.
- Area with Simultaneous Coverage of Multiple Transmitters {Areasimcov). This objective function includes a quality constraint of the indoor deployment. This objective function evaluates the area of the enterprise scenario with simultaneous coverage of the minimum number of bases required to use fingerprint based positioning techniques. Covsim (k)is 1 if the number of transmitters covering the reference point k is equal or greater than Covsimthr, which is the number of transmitters specified to consider simultaneous coverage (typically 3), and 0 otherwise.
- Deviation of number of transmitters with simultaneous coverage {Devsimcov). This objective function is used to improve the evolution in early stages of the evolutionary algorithm. It evaluates the difference between the required number of transmitters to simultaneously cover a reference point and the average number of bases covering that point using the solution represented by the individual. Covsim (k) is the number of bases simultaneously covering reference point k.
- Area with Coverage for Quality Indicator Requirement {Areacovq): This objective function includes a quality constraint of the indoor deployment. It evaluates the area of the enterprise scenario covered by a transmitter. CovQ(m) is 1 if Q(n, m) is equal or greater than a quality threshold Qcovthr Q(n,m) is SINR for IEEE802.il, Ec/10 for 3G femtocell networks and SINR for LTE femtocell networks.
- Area with Overlapping Bases (Areaoveriap). This objective function includes a quality constraint of a enterprise femtocell network. It evaluates the area with overlapping bases. Zoneoveriap (m) is 1 if I\overlap (m) is superior to a threshold of maximum number of overlapping bases BSoveriap.
- Mean Number of Overlapping Bases {Noverlapavem ) • This objective function is used to improve the evolution in early stages of the genetic algorithm. N0veriaP (m) is the number of bases overlapping in test point m. A base n is considered as overlapping base if the received power in test point m differs from the received

M. Molina-Garda et al. / Design of in-building wireless networks deployments using evolutionary algorithms 1
power from the best server n' in less than a margin threshold Moveriap.
- Area without PSC(3G)/PCI(LTE) Collision {Are ape collision)- This objective function includes a quality constraint of a enterprise femtocell network. It is conceived to avoid PCI collision. Covw/ocou (m) is 1 if there are not two or more femtocells using the same PSC/PCI covering the test point k and 0 otherwise
- Deviation of Number of PCS(3G)/PCI(LTE) producing collision (Devpccoiimon)'- This objective function is used to improve the evolution in early stages of the evolutionary algorithm. Collision^ (m,p) is 1 if the PCS/PCI p is used by any base which is causing PCS/PCI collision in reference point m and 0 otherwise. P is the total number of PCS/PCI of the pool available.
- Area without PCS(3G)/PCI(LTE) Confusion (Areapcconjusion)'- This objective function includes a quality constraint of a enterprise femtocell network. It is conceived to avoid PCI confusion. Covw/O_confusion (n) is 1 if there are not two or more bases using the same PCS/PCI covering any test point where base m is considered as best server, and 0 otherwise. Areass (n) is the area where base m is considered best server.
- Deviation of Number of PCS(3G)/PCI(LTE) producing Confusion (Pevpcconfusion): This objective function is used to improve the evolution in early stages of the evolutionary algorithm. ConfusionID (n, p) is 1 if the PCS/PCI p is used by any base which is causing PCS/PCI confusion in the area Areass (n) where base station m is considered as best server.
If SON mechanisms are activated in the femtocell network, worst cases must be assessed for each objective function. Therefore, in this case, the femtocell transmitted power is considered to be the maximum power for objective functions related to PSC/PCI collision and confusion, whereas minimum transmitted power is considered for coverage objective functions. Otherwise, if Self Organizing SON mechanisms are not activated in the femtocell network, the femtocell transmitted power can be optimized. Consequently, the femtocell transmitted power will be the one defined in the individuals by the variable transmitted power of the
3. MOQZEA: Multiobjective quality zone based hybrid EA to design wireless networks
The proposed procedure to design in-building wireless networks in complex scenarios is based on a hybrid evolutionary algorithm, known as MOQZEA (Multiobjective Quality Zone Based Evolutionary Algorithm). The summary of the MOQZEA algorithm proposed in this paper is given below:
1) Generate population of size N with individuals using from 1 to M transmitters.
2) Evaluate quality zone based fitness function 3) Adaptive configuration of MOQZEA.
- Scaling of fitness values. - Selection of procedures for neighbourhood
search (NS), elitism, crossover and mutation procedures
4) Select individuals for neighbourhood search (NS) procedure.
5) Perform neighbourhood search procedure to exploit best solutions.
6) Evaluation of stopping criteria. If stopping criteria is fulfilled, stop. Else, go to step 6.
7) Evaluation of required number of transmitters using quality of the solutions. - If increase the number of transmitters is re
quired, create individuals with one more transmitter.
- Else, go to step 7.
8) Select individuals for elitism, crossover and mutation.
9) Generation of new population using elitism, crossover and mutation and go to step 2.
3.1. Generation of population
A population of binary encoded chromosomes or individuals is generated, dividing the structure of the chromosome of each individual into bases, and each base into variables to be optimized. Typical variables to be optimized in wireless network deployments have been presented in previous sections. The number of bits used to encode an individual depends on the number of bases used in the solution associated with the individual and the bits required to encode each variable. The range of values that each optimization parameter can adopt determines the number of bits used to encode each variable. To generate the initial population, a range of base stations is defined, as well as the number NI of individuals created with the same number of

&. M. Molina-Garda et al. / Design of in-building wireless networks deployments using evolutionary algorithms
3.2. Evaluation of fitness
In MOQZEA, the fitness FT for an individual is obtained as the sum of the values calculated for its cost-quality fitness and its normalized quality fitness. For that purpose, a characterization of objective functions (OF) using quality zones, as presented in Table 1, is required. For each OF, four quality zones are defined in order to classify solutions. The cost-quality fitness FCQ is calculated using both the cost and the quality, as presented in Eqs (1) and (2). C is the cost of the individual, Cmin (j) and Cm a x (j) are the minimum and maximum cost, obtained using the minimum and maximum number of transmitters considered in iteration j and the minimum and maximum costs of the type of transmitters which can be selected. N0F is the number of objective functions defined and w (OF) is the weight for the objective function OF. Z0F (VOF) represents the quality zone that contains the value VOF- An individual can be only considered better than other individual if it represents a solution in an equal or better quality zone, independently on the cost of the solution.
FCQ = {C- Cmin (j) + 1) + (Qz - NQF) (1)
x (Cmax(j)-Cmin(j) + 1)
Qz NQF
N0Fx Y, W (0 J F) X ZOF (y0¿ OF=í
(2)
The normalized quality fitness FNQ is obtained using quality objective, as presented in Eqs (3) and (4). FNQ varies from 0 to 1. VOF is the value obtained from evaluating the individual for objective function OF. V¿fn (Z) and V^ a x (Z) are the maximum and minimum values for the quality zone Z0F (VOF) which includes the V0F value. B™x (Z) and B™n (Z) are the maximum and minimum bounds for the Z0F (VOF) quality zone. The normalized quality fitness is conceived to guarantee the evolution of the population to better solutions in the same quality zone.
NOF
FNQ= J2 W ( O Í 1 ) x Vp ( y ° F ) <3> OF=\
VF (VOF) = V™n (Z)
VOF — BQP (Z) B ^ (Z) - B™? (Z)
(4)
x(VoTx(Z) V¿Fin (Z))
3.3. Adaptive configuration of MOQZEA
3.3.L Scaling of fitness values Evolutionary algorithms need to keep a balance be
tween exploring the solution space and exploiting the best solutions. This balance is especially complex in the design of wireless networks, due to the fact that the number of transmitters required to fulfill quality requirements is unknown. Therefore, mechanisms in volved in keeping this balance must ensure that indi viduals representing solutions using different number of transmitters are correctly explored. For that purpose fitness values are scaled according to the number of iterations without finding a new best individual. If a new best individual has been found in a recent iteration, the fitness values are modified trying to keep unaltered in the population the proportion of individuals using different number of transmitters. On the other hand, when the iterations without improving the best solution in crease, the scaling prioritizes best individuals to pro mote their exploitation. Therefore, the scaled values PS (i,j) of individual i in iteration j are obtained us ing Eq. (5).
PS(i,j) = e(i,j) (5)
Iternbi x NI2 (i,j) + Iterconv x NI2 (i, 1)
ItercomxNI(i,l)xNI(i,j)
e (i, j) is the scaled value of the fitness using typical fitness scaling procedures (shift linear scaling, ranking scaling, proportional scaling or elitist scaling). NI (i, 1 and NI (i, j) is the number of individuals with the same number of transmitters as individual i in the initial population and in iteration j respectively. Iternbi is the number of iterations without a new best individual and Iterconv is the number of iterations without new best in dividual used as stopping criteria.
3.3.2. Selection of procedures for Neighbourhood Search (NS), elitism, crossover and mutation procedures
- Elitism: In the early stages of MOQZEA it is probable that individuals will represent low quality solutions, independently of the number of transmitters. Therefore, if typical elitism meth ods are used, the individuals selected in early it erations will always be characterized by a low number of transmitters. In addition, individuals using a high number of bases, which could lead to obtain optimized solutions, will be lost. Fur-thermore, at more, advanced stages of the, FA,

M. Molina-Garda et al. / Design of in-building wireless networks deployments using evolutionary algorithms .fi
best individuals in terms of quality objectives (which could lead to obtain optimized solutions) but placed in the same quality zone as individuals representing cheaper network configurations will never be selected. To overcome evolution problems, three elitism procedures are used:
- Quality Elitism: Selection of individuals using FNQ-
- Typical Elitism: Selection of best individuals using FT.
- Network Configuration Elitism: Selection of best individuals of each network configuration (same number of transmitters) using FT.
It is recommended to adapt the elitism used in MOQZEA depending on the parameter Iternbi. If a new best individual has been found recently, network configuration elitism must be used to promote exploration. As Iternbi increases, a combination of the proposed elitism procedures must be considered. Finally, when Iternbi is close to Iterconv, typical elitism procedures can be selected, to promote the exploitation of best solutions.
- Crossover: Crossover procedures generate new individuals using several individuals of the population, known as parents. Parents are selected using typical EA selection procedures (uniform, tournament, D'Hont, rests or roulette). In the design of wireless networks, the number of required femtocells is unknown, and therefore, parents with different lengths shall be selected. Thus, first of all, one of the parents must be chosen to define the length of the new individual, and, after that, the point or points to perform the crossover must be selected. As in the proposed procedure, an individual is created from a predefined structure with variables and bases, crossover methods to keep the parent structure are proposed:
* Variable crossover: The parent which introduces its value into the new individual is selected for each variable.
* Base crossover: The parent which introduces its value into the new individual is selected for each transmitter.
It is recommended to adapt the crossover used in MOQZEA depending on Iternbi. For small values of Iternbi, typical crossover approaches as single point, multiple point of disperse crossover can be used to promote exploration. As Iternbi increases, variable crossover must be considered. Finally, when Iternbi is close to Iterconv, base crossover can be selected to promote the exploitation of best solutions
- Mutation: Individuals for mutation are selected using typical selection procedures. Mutation mechanisms create new individuals by modifying the structure on a bit by bit basis, deciding whether a bit value changes according to a mutation rate parameter. It is recommended to vary the mutation rate proportionally to Iternbi to modify the pres sure of MOQZEA. Low rates can be considered in early stages and higher rates when Iternbi is close 10 ixerconv.
- Neighbourhood Search: The individuals included in the NS procedure are selected using the elitism procedures previously presented, and the variable or variables considered to be optimized are de fined. Then, NS is applied using two different ap proaches.
* Random NS: This technique analyzes similar individuals by muting the positions of the bi nary chain which corresponds to the optimiza tion parameter for a base. The values of binary chain are modified using a decreasing mutation rate from the least to the most significant bit. Once the binary chain has been modified, the fitness value of the original individual and the new individual is compared, to check if the new individuals outperforms the original one. The procedure continues until all the base sta tions included in the individual have been con sidered.
* Deterministic NS: This technique carries out a post-processing of the selected individuals. For each base station, the values which can be considered as neighbours for the optimization parameter are extracted depending on the se lected exploitation parameter (Close locations for bases, similar transmitted power values, etc.). Then, the value of the optimization parameters for a base is replaced by each neighbour value, and the fitness value of the original individual and the new individuals are compared, to check if any of the new individuals outperforms the original one. The procedure continues until all the base stations included in the individual have been considered.
It is recommended to adapt the NS procedures used in MOQZEA depending on Iternbi. For small values of Iternbi random techniques must be selected. As Iternb
increases, more time consuming techniques, as the deterministic neighborhood approach, can be considered in order to promote the exploitation of the best solutions Furthermore, both the number of individuals in-

in. M. Molina-Garda et al. / Design of in-building wireless networks deployments using evolutionary algorithms
v [ i n ) 40 0
Fig. 2. Enterprise scenario, possible locations of HeNB's and RP's to evaluate objective functions.
eluded in the NS procedures and the number of neighbors (if deterministic approach is selected.) are recommended to be increased as Iternbi increases.
3.4. Evaluation of required number of transmitters using quality of the solutions
The evaluation procedure of the required number of transmitters uses the quality zones to assess if the population is evolving properly to areas considered as zones of excellent solutions. This procedure is carried out in the iterations when Iternbi divided NTeva¡ is an integer value. NTeva¡ must be defined as a divisor of Iterconv. If the procedure is initiated, the quality threshold EQthr(j) corresponding to excellent solutions in the iteration j is estimated, using Eq. (6).
EQthr (J) = Cmax (j) ~ Cmin (j) + 1 (6)
This threshold value is compared with the FCQ value of the best individual. If FCQ > Qthr, the new population is adapted, generating individuals increasing the maximum number of base stations used to create individuals in the previous iteration.
4. Case of study: Design of heNB's deployment to provide mobile and positioning services using MOQZEA
In this section, the performance of the proposed ap-proach for the, automatic design of in-bnilding wireless
networks is evaluated by means of a case of study. This case of study consists of the design of a LTE femtocell deployment in a real enterprise building. This scenario is presented in Fig. 2. In that figure, possible locations of HeNB's (red dots) and the test-points to evaluate the objective functions (blue dots) are presented as well. The locations where a HeNB can be located are defined using a regular 2 meters grid, whereas the test-points are obtained using an irregular morphological sampling scheme [22].
With regard to indoor propagation, a procedure as the one presented in [21] has been put into practice, to characterize path losses introduced by the different obstacles and materials, and to select the best indoor propagation model to assess the RSRP. Collected mea surements and simulated data have been compared us ing a developed software tool for indoor path loss mod els characterization. An example of path loss assess ment using a dominant path model (the model which best fit the propagation performance in the reference scenario), is presented in Fig. 3 for a HeNB located in the first floor. This HeNB is represented by a red circle. Regarding the design of the HeNB networks oriented to provide positioning services, two different cases are analyzed. The first case assumes that SON mechanisms are not activated in the HeNB network In this case, the transmitted power of each HeNB is decided by the network designer, and it can't be modified by the SON mechanisms. The evolution along the evolutionary al gorithm of each specific objective function is presented in Fig 5. Besides that, some indicators associated with
M. Molina-Garría et al. /Design nfin-huilding wireless networks deployments using evolutionary algorithms
ZoF n m a x n m i n
OF OF
Rooaverage
Balancecov
Areacov
A reasimcov
A rea0verlap
N0verlapavemge
L)evsimcov
AreaCovQ
AreaPC collision
Devpc C0msi0n
A reap c confusion
UevpQconfusion
\
Table 1 Definition of objective functions used in the design in-building wireless networks
OF definition
-
K 1 0 0 v , v ^ m n - Z P f f f r n hW " \r"i(h\
, A / j IIJ.cL.A_ 1 A ü ü {''''i i» ) ) A / 1 / C C Í 1 i t 1 zozal i -. ffh
M - l
J2 AreaCOvord (m) ~ AreaCOvord (m + 1) m = l
M
, 1 0 ° x V Cov (m) x Area (m) Areawtal m _ ^
K 1 0 0 . , v ^ / - „ , (i.\ v- /\r„n(i„\
Area* t , ¿~> L-ovsim \K) x Area [K) k = l
N
Area ¿-^ Zj°neoverlap \ r i ) * /\rea{K) 0 a n = l
M -1- s • \ AT . / /i-i-i \ s / A .--i,-i / k \
A r e a . x Z , ^ o v e r f a i , ( m j x Area (ft J w m ' m = 1
1 *, V ^ „ ! , „ i T i v (h\ Civ \ " i „ „ , X 2_^i a u b \^-ovsim {"•) ,-ovsimthr) x
fc=l
M 1 0 0 . , v ^ / - „ , . /T r ,~i v, / i r „ „ / T r , ~ i
¿ r e c w x 2 - C o v Q \m) x A r e a l m J
m = l
M
A r e a t a / X ^ C o V « < / o _ C 0 « ( m ) x A i " e « ( T O )
M P 1 v , \ ~ ^ V ^ /^nlll™ m* Í r^-. r^,\ \S A *.„
Area ¿—< ¿—< K-oulslonID y'1^ P) X / i r e ' i ° a m = l p = l
TV ±UU s , \ /^*r i i ' i n 1 v ' 'I rfn-r-i- I n 1
A r e c w x Z , L 0 v w / o _ c o n / ( n j XAreaTx(n)
N P 1 v v ^ v ^ r ^ « i .^.'-r^ / ^ ~^\ v /t .-~~
Area ¡ A-, 2-, {~onJuslonID \n> P) x AreaT! n = l p = l
i '"
., -' ioN ! •
^ 5 \ " ^ - - < ^ ^ H N I k
o''\x Í^ÜH 2 0 ^ N ^ ' ^ ^ ^ ; Í ^
40 o y(m)
<g^^¿¿^fK 1 1 ' ''"-
^ ^^^^SÉB^^g^ •" J ' ' ^ L - J ' . ! '"- ^ ^ ^ " ^
*§¡Wmx¿\ ^ ^ ^ iox JÉ^^MM^ ^ ^ ^ m ¡
"x • ' ! ^ - ^ ^ " ^ ° ^ \ . : * - ' ' ^ ^ ^ 5 ^ 5 0
2 0 ^ ^ ^ ^ ^ ^ ^ > < - ^ ^ x(m)
40 n y(m)
Area (fc)
i(fc)
f ( « )
^ g á É S I ffijflfl
^ S^SIfflk
^ ^ 50
x(m)
1
150
i22i;
207
189
170
17,2
l ü . ' i
1 1 ">
97
7*
60
11
Excellent Good Medium 1 2 3
0-0.25 0.25-0.5 0.5-0.75 T / m a x l / m i n f .,. vOF vOF 1 U 1 quality
Bad 4
0.75-1 zones
Excellent/good/medium and bad
- 5 0 , - 6 0 - 6 0 , - 7 0 - 7 0 , - 8 0
0-5 5-10 10-20
100-98 98-95 95-90
100-98 98-95 95-90
100-98 98-95 95-90
0-0.5 0.5-1
0-1 1-2
1-2
2-3
0-15 15-30 30-50
100-98 98-95 95-90
0-0.5 0.5-1 1-2
100-98 98-95 95-90
0-0.5 0.5-1
-~, , -ÍSíllSiíÉÍK .^¡•HPxxN
iBBBB^^ ~\J H | g ^ ^ ^ 150
W^^^^ 100
'--'"'"'"''i ^~x^^^%
I O N ^ - ' ; ' > ' ^ - - - ' ^ ^ M
" ' ' ^X '^^W^^^\^^* 20"X[ > ^ ^
40 o y(m)
Fig. 3. Example of path loss estimation using dominant path i
1-2
220
207
ISO
170
I.-.2
120
115
07
78
0(1
11
- í t íá ~¿¡£$Mm
~.id£á¿ H ^ T ^
^50
x(m)
nodel.
- 8 0 , - 9 0 -
20-100
90-0
90-0
90-0
2-3
3^1
50-100
90-0
2-3
90-0
2-3
.. - T Í í Ü
> i ^ í ^^ 100
-
RSSCov,hr= - 1 0 0 dBm
^OV simthr = ^
SINRso2.il = 1 0 d B , S c / o 3 G = - 9 d B S/A^ire = 5 dB, RSRQ= - 1 8
^OV simthr = ^
3 G : Move r fa i , = 6 dB, L T S : Mo v e r f a i , = 5 dB
3 G : Moveriap = 6 dB,
"^overlap — *
LIE : MoVerlap = 5 d B ,
¿3^ overlap — ^
-
-
-
-
aa> Rt\Ni
\ J ^ ^ 150
226
207
189
170
,52
133
L15
97
7»
60
41

12 M. Molina-Garda et al. / Design of in-building wireless networks deployments using evolutionary algorithms
Table 2 Configuration parameters of the evolutionary algorithm and optimization parameters
Parameter Configuration values Parameter Configuration values
HeNB position HeNB RS Tx power Antenna type HeNB models PCI pool
RP's to test OF's Range of HNB's Stopping criteria
2145 possible locations 3dBmto-20dBm Omnidirectional 1 model/cost 1 unit 3 to 17 PCTs
1089 test points 3-35 HeNB's 25 Iterations without improvement
Adaptive balance Max mutation rate Max number of neighbors Population size Individuals by elitism
Individuals by crossover Individuals by mutation Max number of exploitation individuals
Yes 0.3 10 1000 25 (global/fine/HeNB depending phase) 70% 30% 25 (overall/fine/HeNB/ Probabilistic depending phase)
Table 3 Weights w(OF) for the objective functions considered to design a HeNB's deployment to provide mobile and positioning services
OF RSRPa- Areasi Desvd Balancec,
w(OF) OF w(OF)
0.05 AreaPCl collision
0.20
0.40 Deviation^! collision 0.025
0.05 Area fCl confusion
0.20
0.05 Deviationpciconfusion
0.025
the objective functions for the best solution are presented for each reference point. Thus, the Fig. 6 to Fig. 8 presents RSRP and SINR values in the deployment scenario, as well as the number of HeNB with simultaneous coverage in each location. The second case consists of the design of the HeNB Network assuming that SON mechanisms are activated. Thus, the transmitted power of each HeNB can be modified in real time by the SON mechanisms. The whole range of configurable transmitted femtocell power must be considered when evaluating the fulfillment of mobile and positioning services requirements. As self organizing networks mechanisms are activated, worst cases must be assessed for each objective function. Therefore, in this second case, the parameters to be optimized are the number of HeNB's, the location of the HeNB's and the PCI assigned to each HeNB.
In order to achieve the HeNB network design goals, fulfillment of QoS requirements while reducing as much as possible the cost investments, the evolutionary algorithm with multistep figure of merit evaluation presented in previous sections is used. General configuration parameters of the genetic algorithm are presented in Table 2. The requirements associated with the provision of mobile services are: Coverage due to best server RSRP and coverage due to SINR, ratio between desired signal and interference from other transmitters. Regarding positioning services, the multi-HeNB deployment have to guarantee simultaneous coverage of at least three HeNB in the whole scenario. In addition to that, due to the limited number of PCI's which can be allocated, the design has to guarantee that PCI's are, allocated avoiding both PCT collision and PCT con-
fusion. The objective functions presented in previous sections are also used in this requirement assessment process. The definition of the quality zones and the thresholds used are presented in Table 1, and their weights are presented in Table 3.
4.1. Design of enterprise heNB networks without SON mechanisms
4.1.1. PCI pool dimensioning First of all, an analysis of the number of PCI's re
quired for a HeNB network oriented to provide mo bile and positioning services in the reference scenario is presented. The complexity of this problem in these deployments is very high, due to the need of simultaneous coverage of several HeNB's to use positioning algorithms based on fingerprint. Therefore, the pool of PCI's must be enlarged, compared to networks oriented to provide only mobile services. By means of this previous analysis, an estimation of the minimum number of PCI's required to avoid PCI collision and confusion can be obtained. This number is expected to be very dependent on the number of HeNB's deployed, and, thus, on the dimensions of the scenario. For the evaluation of PCIs pool size, the number of available PCI's in the pool of PCI's is varied from 3 up to 17. The design of the HeNB network using the evolutionary al gorithm proposed has been carried out considering this constraint.
In Table 4, results obtained for the objective func tions using different pools of PCI's are presented. Re suits without SON mechanisms show that a minimum pool of 6 PCT's is required to avoid PCT collision and

M. Molina-Garda et al. / Design of in-building wireless networks deployments using evolutionary algorithms 11
OF
KjKraverage
Areasjmcov
L)eSv'simcov
Balancecov
Arearci collision
Results obtained for the different OF
Deviation pacollision
Areapciconfmior
Deviation PCIconfusion
AreasiNR cov
3 PCI
-73.06 99.70 0.77
8.030 88.47 0.15
32.17 1.71
92.52
4 PCI
-72.39 99.75
1 8.08
98.35 0.02
39.14 1.49
95.63
Table 4 s for different PCI
5 PCI
-72.48 99.59
0.73 7.46
98.68 0.01
68.99 0.56
98.39
pool sizes
PCI
-73.34 99.55
0.79 6.28
99.12 0.01 100
0.07 100
if SON mechanisms are not considered
7 PCI
-70.00 99.73
1.21 7.36 100
0 100
0 100
8 PCI
-70.16 99.78
1.31 8.32 100
0 100
0 100
9 PCI
-70.00 99.97
1.09 6.40 100
0 100
0 100
10 PCI
-69.99 99.95
0.99 6.57 100
0 100
0 100
Table 5 OF values for 30 realizations of the proposed evolutionary algorithm and best solution obtained if SON mechanisms are not considered
Best solution Objective function Minimum Maximum Average Deviation 15 HeNB's Cost best solution: 15 HeNB's power transmitted (dBm) [-1,3,3,3,3,3,3,3,3,3,3,-1,3,2,-3] Allocated PCFs [2,4,4,5,4,5,6,1,6,2,2,3,1,3,3]
RSRPa
Areasim Desvsi
Balancea
-74.06 96.64
0.41
3.47
-72.46 98.95
0.59
7.06
-73.44 97.49
0.48
5.82
0.86 1.28 0.1
2.04
Areapci Coiiision
Deviation pa collision Areapci confusion
Deviation pci confusion
AreasiNR COV
96.06 0.06 100
0.01 100
99.82 0.21 100
0.04 100
98.12 0.14 100
0.02 100
1.91 0.08
0 0.02
0
Fig. 4. Location of HeNBÁt's, HeNB RS transmitted power and PCI allocation for the best solution.

14, M. Mnlinn.-Garr.rn et at / Dp.xi.gn of in-huildinp wireless networks deployments using evolutionary algorithms
r V ^ - ^
200 300 Iterations
~
= ' ) • < >
o .1 0,1
0.5
_
VA-^*^
i. c i
O
S ' a .2 s
! M
3 . '•
i
r
W- i
" " • • •
10
Iterations
, , 2 » 300
•
400 60
25
21
8
10-
5
1
Fig. 5. Evolution of objective functions along the evolutionary algorithm for the best design solution.
PCI confusion in this specific scenario, whereas the simultaneous coverage of at least 3 HeNB's is guaranteed. The mean number of HeNB 's to be deployed if SON mechanisms are not activated is around 15. For 6 PCFs average values of the areas of the deployment scenario without PCI collision and PCI confusion are 99.12% and 100% respectively, whereas the area with simultaneous coverage is 99.55%. In smaller PCI pools (from 3 to 5 PCF s) is impossible to guarantee simultaneously coverage and PCI collision and confusion avoidance. For bigger PCT pools (from 7 to 17), perfor-
mance is not improved compared to 6 PCFs, and there fore, a limited and scarce resource as available PCFs, are wasted.
4.1.2. Results for the design In this case of study, the deployment of up to 30
HeNB's is considered in 2145 possible locations for HeNB's, a selectable and non-modifiable HeNB RS Tx Power from 3 to —20 dBm is configurable and a pool of 6 PCFs is available. The results presented in this section correspond to the optimization of the nnm
M Mnlinn-Gnrrm et al /Design nf in-huilding wireless networks deplnyments using evnlutinnary nlgnrithms IS
y(m)
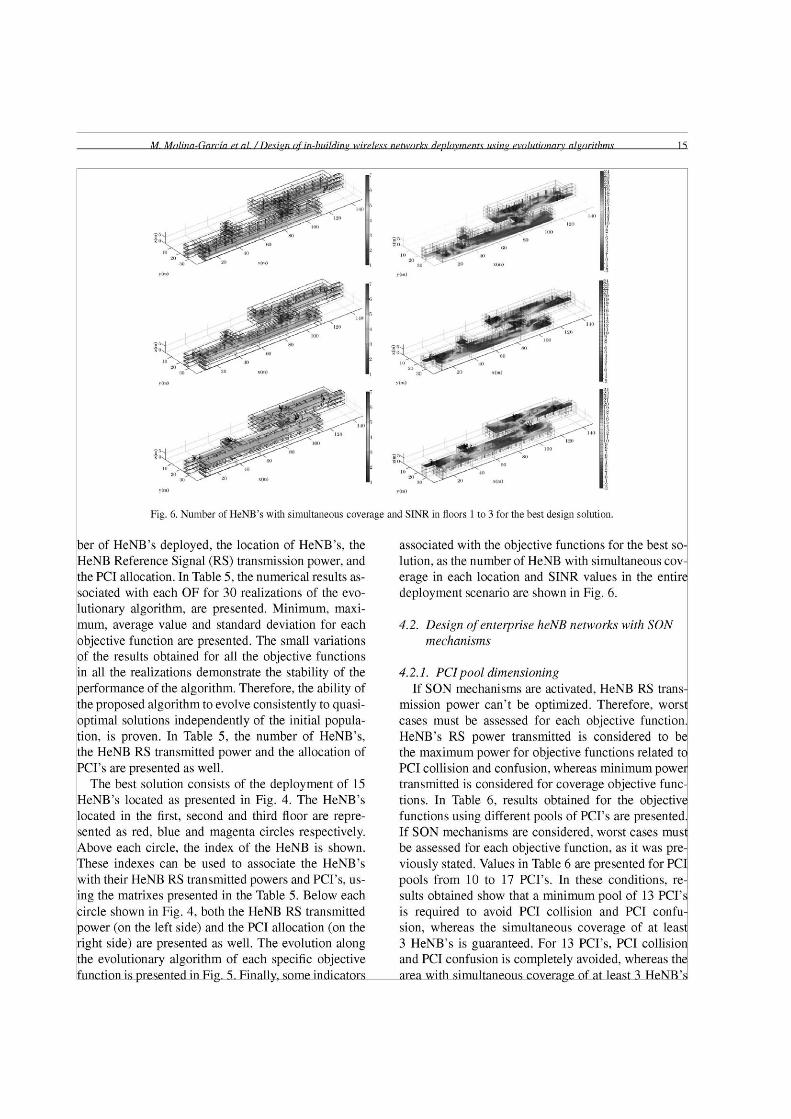
Fig. 6. Number of HeNB's with simultaneous coveragi
ber of HeNB's deployed, the location of HeNB's, the HeNB Reference Signal (RS) transmission power, and the PCI allocation. In Table 5, the numerical results associated with each OF for 30 realizations of the evolutionary algorithm, are presented. Minimum, maximum, average value and standard deviation for each objective function are presented. The small variations of the results obtained for all the objective functions in all the realizations demonstrate the stability of the performance of the algorithm. Therefore, the ability of the proposed algorithm to evolve consistently to quasi-optimal solutions independently of the initial population, is proven. In Table 5, the number of HeNB's, the HeNB RS transmitted power and the allocation of PCI's are presented as well.
The best solution consists of the deployment of 15 HeNB's located as presented in Fig. 4. The HeNB's located in the first, second and third floor are represented as red, blue and magenta circles respectively. Above each circle, the index of the HeNB is shown. These indexes can be used to associate the HeNB's with their HeNB RS transmitted powers and PCI's, using the matrixes presented in the Table 5. Below each circle shown in Fig. 4, both the HeNB RS transmitted power (on the left side) and the PCI allocation (on the right side) are presented as well. The evolution along the evolutionary algorithm of each specific objective function is presented in Fig. 5. Finally, some indicators
y(m)
and SINR in floors 1 to 3 for the best design solution.
associated with the objective functions for the best solution, as the number of HeNB with simultaneous coverage in each location and SINR values in the entire deployment scenario are shown in Fig. 6.
4.2. Design of enterprise heNB networks with SON mechanisms
4.2.1. PCI pool dimensioning If SON mechanisms are activated, HeNB RS trans
mission power can't be optimized. Therefore, worst cases must be assessed for each objective function. HeNB's RS power transmitted is considered to be the maximum power for objective functions related to PCI collision and confusion, whereas minimum power transmitted is considered for coverage objective functions. In Table 6, results obtained for the objective functions using different pools of PCI's are presented. If SON mechanisms are considered, worst cases must be assessed for each objective function, as it was previously stated. Values in Table 6 are presented for PCI pools from 10 to 17 PCI's. In these conditions, results obtained show that a minimum pool of 13 PCI's is required to avoid PCI collision and PCI confusion, whereas the simultaneous coverage of at least 3 HeNB's is guaranteed. For 13 PCI's, PCI collision and PCI confusion is completely avoided, whereas the area with simultaneous coverage of at least 3 HeNB's

Results obtained for the different OF'
Objective function
K^K* average
Aveüsimcov
L)6SVsimcQV
Balance cov
Deviationpri „.. Areapciconfmion
Deviation pa confmion
AreaSINRcov
10 PCI
-88.03 90.51
0.53 10.96
100 0
47.59 1.65
89. 16
11 PCI
-87.08 95.42 0.74
10.48 99.93
0 67.59 0.75
93.11
fable 6 s for different PCI pool sizes
12 PCI
-88.365 96.95 0.76
13.01 99.74
0 69.67 0.553 94.32
13 PCI
-85.96 98.06 0.47 8.86 100
0 100
0 99.24
if SON mechanisms are
14 PCI
-89.44 98.13 0.49 9.66 100
0 100
0 99.30
15 PCI
-86.59 98.72
0.49 7.93 100
0 100
0 99.41
considered
16 PCI
-88.08 98.57 0.46
11.49 100
0 100
0 99.35
17 PCI
-88.02 98.63 0.46 9.64 100
0 100
0 99.17
Table 7 OF values for 30 realizations of the proposed evolutionary algorithm and best solution obtained if SON mechanisms are considered
Best solution Objective function Minimum Maximum Average Deviation 29 HeNB's Cost best solution: 29 HeNB's power transmitted (dBm) SON mechanisms activated Allocated PCFs [12,3,1,2,7,1,5,6,5,7,2,3,8,8, 10,11,1,4,9,6,13,12,4,9,11,11,2,10,9]
Ao7\/Javer.
Areas¡m
Desvsim
Balancec
-87.98 98.0 0.41
7.75
-83.85 98.3 0.52
9.23
-86.02 98.11 0.47
8.84
1.30 0.01 0.03
0.72
Deviationpri ... . Areapciconfmion
Deviationpciconfmion
AreaSINRcov
100 0
100 0
98.75
100 0
100 0
99.24
100 0
100 0
99.04
0 0 0 0
0.02
y (mi
B fo-2 Jb 10
8 t ^•iBR~]| i luuLliwmra-i,4gi^
n ^ tío
Fig. 7. Location of HeNB's, HeNB RS transmitted power and PCI allocation for the best solution.

M. Molina-Garría et al. /Design nf in-huildinp wireless networks deployments using evolutionary ahnrithms 11
Fig. 8. Number of HeNB's with simultaneous coveragi
is around 98%. In smaller PCI pools (from 3 to 12 PCI's) is not possible to guarantee simultaneously coverage and PCI collision and confusion avoidance, and performance is not improved for bigger PCI pools. In this case, the average number of HeNB's estimated by the evolutionary algorithm to be deployed is around 29. The increase of HeNB density provoke that for the worst PCI collision and confusion situation (HeNB RS power transmitted 3 dBm), more HeNB's will cover the same areas. Therefore, more PCI's will be needed to avoid PCI interference. As PCI's are a scarce resource, the deactivation of SON mechanisms can be recommendable in HeNB networks oriented to provide fingerprint-based positioning services. Otherwise, the pool of PCI's available for femtocell must be increased.
4.2.2. Results for the design From now on, the results presented correspond to the
optimization of the number of HeNB's deployed, the location of HeNB's and the PCI allocation for the scenario presented in Fig. 2, considering that SON mechanisms are activated. In this case of study, the deployment of up to 35 HeNB's is considered in 2145 pos-sible locations for HeNB's The HeNB RS transmitted
and SINR in floors 1 to 3 for the best design solution.
power is modifiable by SON mechanisms and a pool of 13 PCI's is available. In Table 7, the numerical results associated with each objective function for 30 realizations of the evolutionary are presented. The best solution consists of the deployment of 29 HeNB's located as presented in Fig. 7. The increase of the number of HeNB's required is related to the reduction of the HeNB coverage in the worst case for coverage objective functions (HeNB RS power transmitted —20 dBm). Finally, the Fig. 8 presents the number of HeNB with simultaneous coverage and SINR values, in each location of the deployment scenario.
5. Conclusions
In this article, a novel approach to the design of in-building wireless networks deployments using evolutionary algorithms is proposed. The procedure developed is based on a hybrid evolutionary algorithm, known as MOQZEA (Multiobjective Quality Zone Based Evolutionary Algorithm). This EA uses a novel fitness function founded on the definition of quality zones for the different OF's considered.
The novel proposed approach is able to solve wire-less design problems without any a priori knowledge of

18. M. Molina-Garda et al. / Design of in-building wireless networks deployments using evolutionary algorithms
the number of transmitters required to fulfill the quality constraints defined by the designer. Besides that, MO-QZEA can deal with a high number of objective functions, including conflicting cost and quality objectives, and is capable of optimizing multiple configuration parameters of the transmitters simultaneously, leading to a single best solution.
Acknowledgment
The authors are thankful to the support of the Spanish Ministry of Science and Innovation within the projects IPT-2011-1272-430000, IPT-2011-1034-37000 and TEC2011-28683 projects.
References
[1] M.D. Adickes, R.E. Billo, B.A. Norman, S. Banerjee, B.O. Nnaji and J. Rajgopal, Optimization of indoor wireless communication network layouts, HE Transactions 34 (2002), 823-836.
[2] F. Aguado-Agelet, A. Várela, L. Alvarez-Vazquez, J. Hernando and A. Formella, Optimization methods for optimal transmitter locations in a mobile wireless system, Vehicular Technology, IEEE Transactions on 51(6) (2002), 1316-1321.
[3] B.R. Campomanes-Alvareza, O. Cordón and S. Damasa, Evolutionary multi-objective optimization for mesh simplification of 3D open models, Integrated Computer-Aided Engineering 20(4) (2013), 375-390.
[4] L. Carro-Calvo, S. Salcedo-Sanz, R. Gil-Pita, A. Portilla-Figueras and M. Rosa-Zurera, An evolutionary multiclass algorithm for automatic classification of high range resolution radar targets, Integrated Computer-aided Engineering 16(1) (2009), 51-60.
[5] T. Chabuk, J. Reggia, J. Lohn and D. Linden, Causally-guided evolutionary optimization and its application to antenna array design, Integrated Computer-aided Engineering 19(2) (2012), 111-124.
[6] C. Fuggini, E. Chatzi, D. Zangani and T.B. Messervey, Combining genetic algorithm with a meso-scale approach for system identification of a smart polymeric textile, Computer-Aided Civil and Infrastructure Engineering 28(3) (2013), 227-245.
[7] J.K. Han, B.S. Park, Y.S. Choi and H.K. Park, Genetic approach with a new representation for base station placement in mobile communications, in Vehicular Technology Conference, 2001. VTC2001 Fall, IEEE VTS 54th 4 (2001), 2703-2707.
[8] F. Hejazi, I. Toloue, J. Noorzaei and M.S. Jaafar, Optimization of earthquake energy dissipation system by genetic algorithm, Computer-Aided Civil and Infrastructure Engineering 28(10) (2013), 796-810.
[9] H. Holma and A. Toskala, LTE for UMTS: Evolution to LTE-Advanced 2 n d Edition, John Wiley & Sons, Ltd, 2011, pp. 237-244.
[10] F.Y. Hsiao, S.S. Wang, WC. Wang, C.P Wen and WD. Yu, Neuro-fuzzy cost estimation model enhanced by fast messy penetic algorithms for semiconductor hookun construction
Computer-Aided Civil and Infrastructure Engineering 27(10) (2012), 764-781.
[11] X. Huang, U. Behr and W. Wiesbeck, Automatic base station placement and dimensioning for mobile network planning, in: Vehicular Technology Conference 2000, IEEE VTS-Fall VTC 2000 52nd 4 (2000), 1544-1549.
[12] K. Kaemarungsi and P. Krishnamurthy, Modeling of indoor positioning systems based on location fingerprinting, 23tl
Annual Joint Conference of the IEEE Computer and Comma nications Societies 2 (March 2004), 1012-1022.
[13] B. Krisnamachari and S. Weicker, Experimental analysis of local search algorithms for optimal base station location, International Conference on Evolutionary Computing for Computer, Communication, Control and Power (ECCAP 2000).
[14] R.M. Krzanowski and J. Raper, Hybrid genetic algorithm for transmitter location in wireless networks, Computers, Environment and Urban Systems 23(5) (1999), 359-382.
[15] N. Lakshminarasimman, S. Baskar, A. Alphones and M.W. Iruthayarajan, Evolutionary multiobjective optimization of cellular base station locations using modified NSGA-II, Wireless Networks 17(3) (2011), 597-609.
[16] P. Lee, J. Jeong, N. Saxena and J. Shin, Dynamic reservation scheme of physical cell identity for 3GPP LTE femtocell systems, Journal of Information Processing Systems 5(4) (December 2009).
[17] K. Lieska, E. Laitinen and J. Lahteenmaki, Radio coverage optimization with genetic algorithms, in: Personal, Indoor and Mobile Radio Communications, 1998 The 9th IEEE International Symposium on 1 (1998), 318-322.
[18] A. McGibney, M. Klepal and D. Pesch, User demand based WLAN design and optimisation, in: Vehicular Technology Conference, VTC2007-Spring, IEEE 65th, (2007), 1101-1105.
[19] H. Meunier, E.-G. Talbi and P. Reininger, A multiobjective genetic algorithm for radio network optimization, in: In Pro ceedings of the 2000 Congress on Evolutionary Computation. IEEE Press (2000), 317-324.
[20] L. Mohjazi, M. Al-Qutayri, H. Barada and K. Poon, Femtocell coverage optimization using genetic algorithm, in: Telecom World (ITU WT), 2011 Technical Symposium at ITU (2011), 159-164.
[21] M. Molina-Garcia, J. Calle-Sánchez, A. Fernandez-Duran and J.I. Alonso, Enhanced in-building fingerprint positioning us ing femtocell networks, Bell Labs Technical Journal, Special Issue: Next-Generation Wireless Technologies 18(2) (September 2013), 195-211.
[22] M. Molina-Garcia, A. Fernandez-Duran and J.I. Alonso, Morphological sampling scheme for analysis and optimization of wireless indoor environments, Communications Letters, IEEE 14(7) (July 2010), 635-637.
[23] J. Oppolzer and R. Bestak, Physical cell identifier assignment in dense home evolved NodeB deployment, 6th International Conference on Next Generation Mobile Applications, Services and Technologies 12-14 (September 2012), 170-174.
[24] B.-S. Park, J.-G. Yook and H.-K. Park, The determination of base station placement and transmit power in an inhomoge-neous traffic distribution for radio network planning, in: Vehicular Technology Conference Proceedings VTC 2002-Fall, 2002 IEEE56th' 4 (2002), 2051-2055.
[25] E.C. Pedrino, V.O. Roda, E.R.R. Kato, J.H. Saito, M.L Tronco, R.H. Tsunaki, O. Morandin and M.C. Nicoletti, A genetic programming based system for the automatic construction of image filters, Integrated Computer-Aided Engineering 20(3) (2013), 275-287.

M. Molina-Garda et al. / Design of in-building wireless networks deployments using evolutionary algorithms 12
[26] R. Putha, R. Quadrifoglio and E. Zechman, Comparing ant colony optimization and genetic algorithm approaches for solving traffic signal coordination under oversaturation conditions, Computer-Aided Civil and Infrastructure Engineering 27(1) (2012), 14-28.
[27] L. Raisanen and R.M. Whitaker, Comparison and evaluation of multiple objective genetic algorithms for the antenna placement problem, Mob Netw Appl 10 (2005), 79-88.
[28] K. Sarma and H. Adeli, Fuzzy genetic algorithm for optimization of steel structures, Journal of Structural Engineering, ASCE 126(5) (2000), 596-604.
[29] L. Sgambi, K. Gkoumas and F. Bontempi, Genetic algorithms for the dependability assurance in the design of a long span suspension bridge, Computer-Aided Civil and Infrastructure
Engineering 27(9) (2012), 655-675. [30] C.-K. Ting, C.-N. Lee, H.-C. Chang and J.-S. Wu, Wire
less heterogeneous transmitter placement using multiobjec-tive variable-length genetic algorithm, Systems, Man, and Cybernetics, Part B: Cybernetics, IEEE Transactions on 39(4) (2009), 945-958.
[31] N. Weicker, G. Szabo, K. Weicker and P. Widmayer, Evolutionary multiobjective optimization for base station transmitter placement with frequency assignment, Evolutionary Computation, IEEE Transactions on 7(2) (2003), 189-203.
[32] J. Yang, J. Zhang, M. Aydin and J. Wu, A novel programming model and optimisation algorithms for WCDMA networks, in: Vehicular Technology Conference, 2007 VTC20O7-Spring. IEEE65th (2007), 1182-1187.