design of balanced cantilever bridge - coe.or.th · analysis and design of balanced cantilever...
TRANSCRIPT
Analysis and design of balanced cantilever prestressed box girder bridge considering constructions stages and creep redistribution
Assoc. Prof. Dr. Amorn Pimanmas
Sirindhorn International Institute of Technology Thammasat University
1. Introduction The cantilevering construction method is recommended for medium to long span bridges (span length from 60 to 150 m) The major advantage of this method is the elimination of scaffolding which is difficult or impossible to erect, such as over deep valleys or wide rivers. In this method, the bridge is built by a succession of segments symmetrically cantilevering in both directions from the pier. The segments may be cast-in place by means of formwork traveler or pre-fabricated and lifted to place with appropriate lifting device. The previous segment carries the load of the next segment. Each segment is connected to the previous ones by means of pre-stressing cables at the top fiber. In this method, the structure will be cantilever for a short term during construction and becomes continuous in the long term. As a result, the analysis and design of the structure must follow the construction stages. Dead load of the bridge girder shall be carried by the cantilevering structure during construction while the superimposed dead load as well as traffic shall be carried in the continuous state after the completion of the bridge. Moreover, the redistribution of dead load moments due to creep must be considered since it can significantly affect the moment pattern. The effect of creep is also significant during construction especially for long bridge where the construction may take years to finish. The deflection due to creep is not negligible and must be accurately predicted for preparing the camber of the bridge. In this report, the authors are mainly concerned with the structural analysis and design of balanced cantilever bridge considering construction stages and effect of creep redistribution. 2. Description of bridge, construction procedures and design criteria 2.1 General layout of the bridge The example bridge to be design is assumed to cross a rather wide river as shown in Fig. 1. It shall consist of six traffic lanes. The superstructure consists of two parallel box girders. Each box girder has its own supporting pier. The cross section of the box girder is shown in Fig. 2. The entire top slab width of each box is 10.8 m. The width of the bottom slab is 5.5 m. The height is 4.07 m at the pier head and 3 m at the mid-span. Since the river must serve the navigational purpose, no scaffolding is allowed. The balanced cantilevering method is therefore adopted for construction. The final bridge structure consists of four continuous spans, two side spans and two main spans as shown in Fig. 1. The side spans are
1
สภาวศิวกร

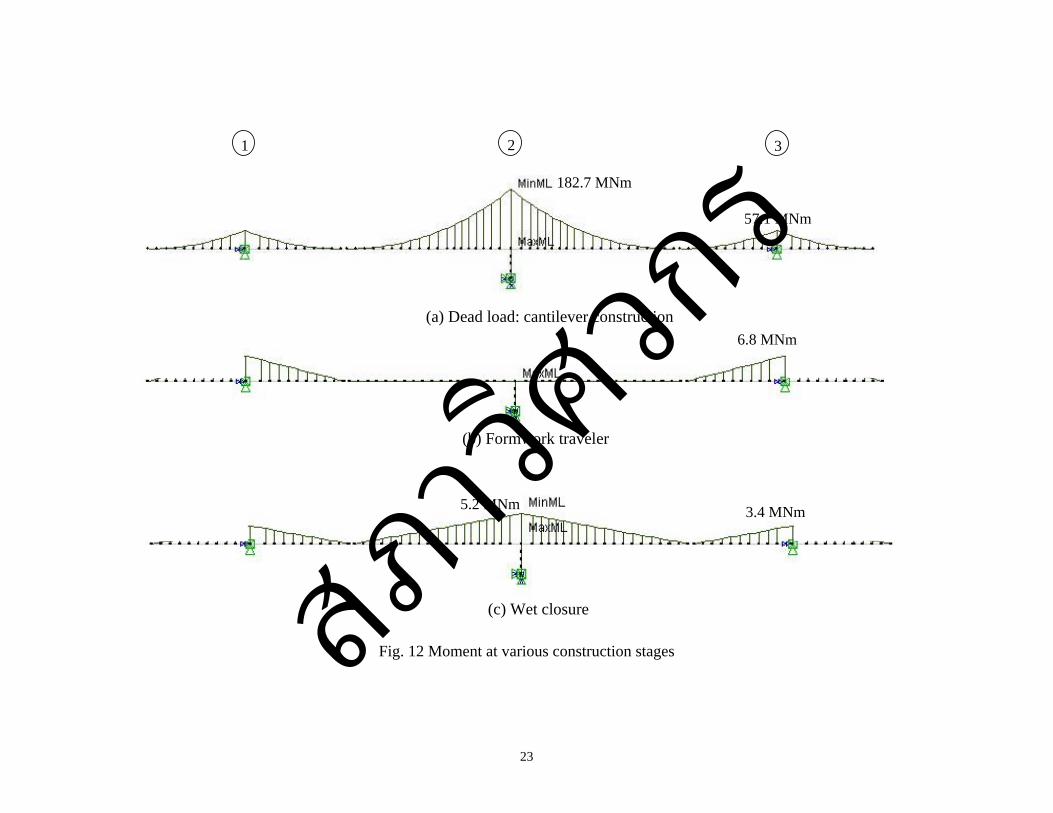
47.0 m long and the main spans are 73.0 m long. The bridge is supported on bearings on pier 2 and 4 and cast integrally with pier 3. Since the bridge cannot be constructed in the complete form from the beginning due to its large scale and no scaffolding is allowed in the river due to navigational purpose. The pattern of internal actions such as moment and shear forces cannot be obtained from the analysis of the complete structures. The design actions must be associated with the construction procedures and proper consideration of creep effect must be taken into account. The superstructure shall be analyzed and designed in both longitudinal and transverse directions. Both prestressing and ordinary deformed bars shall be used in both directions. 2.2 Construction method The construction method of this bridge is shown in Fig. 3. The pier head will be cast on scaffolding first over pier axes 1, 2 and 3. Then, the bridge shall be constructed in balanced cantilevering from pier 1, 2 and 3 as shown in Fig. 3a. Pier axis 2 consists of 17 cast-in place segments on each side of the pier. Pier axes 1 and 3 consist of 9 cast –in place segments on each side of the pier. On the two sides of the river banks, the 20 m abutment span is cast on temporary scaffolding, which is remained until the side and main cantilevers are connected. During construction, piers 1 and 3 must be fixed to the superstructure otherwise unbalanced moment will lead to the instability. This temporary fixity can be achieved by means of vertical prestressing and must be indicated on the drawings for construction. During construction, the structure is in the cantilevering state with the bending moment pattern as shown in Fig. 3a. It is seen that this bending moment mainly results from the dead load of the superstructure and formwork traveler. The moment is thus negative throughout the span and highest over the pier and zero at the tip of the cantilever. After the construction of balanced cantilever is completed, the side and main cantilevers are connected to each other by 1.5 m closure pour. The moment due to formwork traveler supported on the side spans is shown in Fig. 3b. The dead weight of the fresh closure pour also generates moment in the side and main cantilevers as shown in Fig. 3c. At this state, the form traveler is supported on cantilevers on both sides in order to assure the same tip deflection of the joining cantilevers. As a result, each cantilever is assumed to take half of the weight of fresh pour. After the side and main cantilevers are connected, the form travelers are removed from the bridge. At this state, the closure pour becomes hardened. So the moment pattern due to the removal of formwork traveler is shown in Fig. 3d. Then the bridge is connected to the 20.0 m abutment span via a closure pour of 1.5 m length. After the closure pour hardens, bottom tendons are prestressed. At this stage, the 20 m abut span is still supported on the temporary scaffolding. The secondary moment due to prestressing is shown in Fig. 3e. It should be noted that during cantilevering construction, there is no secondary moment due to top tendons since the cantilever is statically determinate system. After bottom prestressing, the temporary scaffolding is removed. The structure is in the complete continuous form. The weight of 20 m abutment span and closure pour is then transferred to the continuous structure. The moment pattern generated at this stage is shown in Fig. 3f. Any load
2
สภาวศิวกร

applied after this, for example the superimposed dead load including asphalt pavement and barrier, traffic loads and other live loads shall be applied to the continuous structure. Just after the completion of structure, the effect of dead load cantilever moment is locked in the structure. In the long time, this moment will be redistributed due to the time-dependent creep effect. As a result, the negative moment at the pier is usually reduced and the positive moment at the mid-span increased. The creep effect on this moment redistribution shall be considered in the design too. It should be also noted that the segments are assumed to be simultaneously cast on each side of the pier. If the alternate casting is implemented, the pier must be checked for unbalanced moment. The design of the bridge will follow the AASHTO 1996 and ACI318-99 for load specification and member design. Since the redistribution of moment due to creep effect shall be considered in the analysis, the Norwegian Concrete Structure Design rules (NS3473E) which provides the creep factor as the function of time is adopted. Note that the creep equation specified in Norwegian code gives the same result as CEB-FIP code. 2.3 Computer model The computer model of the full bridge is shown in Fig. 4a. The computer model for the main cantilever (pier 2) and side cantilevers (piers 1 and 3) is shown in Fig. 4b. The bridge superstructure (box girder) and the pier are modeled by 2-node one-dimensional frame element. Each segment of the cantilever is modeled by a frame element. The whole structure consists of 104 frame elements. The properties of the frame are defined with respect to the local axis as shown in the Fig. 4. Since the cross-section varies along the element length, the average cross sectional area and the moment of inertia are calculated at the middle section of the element. The calculation of cross sectional area (A) and moment of inertia IN and IL is based on the entire cross section while the calculation of moment of inertia IM is based on the torsional section as shown in Fig. 5. It should be noted that in the final structure, the pier 2 is to be fixedly connected to the superstructure so it is modeled using frame element to obtain the relative stiffness between pier and superstructure. On the contrary, the superstructure will be supported on bearings on piers 1 and 3, hence no moment is transferred to the pier, consequently, hinge supports are used to model the piers. The uncracked stiffness is used for superstructure since pre-stressing effect results in almost uncracked state. But half of the uncracked stiffness is used for the pier to represent the cracked condition. 2.4 Loads The loads to be considered include 1. Dead weight of the bridge. The unit weight of concrete used is 25.5 kN/m3. The internal action due to dead weight shall be computed following the construction stages mentioned before.
3
สภาวศิวกร

2. Superimposed dead load. The superimposed dead load includes asphalt pavement with the unit weight of 24 kN/m3 and barrier. This load is applied to the complete structure. 3. Traffic load. The traffic load is to represent the weight of moving trucks with impact. In AASHTO 1996, this load consists of the American truck (HS20-44) load and the lane load as shown in Fig. 6a and 6b, respectively. Normally, for span less than 30 m, truck load shall be the governing case. But for longer span, the lane load shall govern the design. In case of the example bridge, the length of main and side spans is 73 and 47 m, respectively. Consequently, only the lane load shall be considered in the design. The AASHTO lane load is supposed to represent a line of trucks. As shown in Fig. 6b, it consists of uniform load (w) of 9.53 kN/m, a concentrated load (PM) 82.0 kN for moment calculation and a concentrated load (PV) of 116.0 kN for shear calculation. These loads are assumed to occupy a 3.05 m width or one traffic lane. These loads shall be multiplied by number of lanes, which is 3 for each box girder in case of the problem concerned. A reduction factor of 0.9 can be used if the number of lanes is greater than or equal to three. The traffic load shall be increased due to the impact of moving vehicles. The impact factor is, according to AASHTO, computed as, I = 15.24/(L + 38) ≤ 0.3 1 where L is the span length. For the main span, L = 73 m, the impact factor is calculated to be 0.14 and for the side span, L = 47 m, the impact factor is 0.18. The traffic load shall be applied to the complete structure. The load must be placed on the span to obtain the maximum effect of moments at mid-span and over support and shear as shown in Fig. 7 and Fig. 8. As for torsion, since the bridge is straight, the torsion shall mainly result if the traffic load is placed eccentric to the box centerline as shown in Fig. 9. In this case, the torsion is maximum when the lane loads occupy two lanes as shown. The effect of the above loads shall be combined according to the load factors specified by the codes. It is noted that other loads such as wind loads, longitudinal forces, overturning forces, centrifugal forces and so on are not relevant in the design of superstructure. Hence, they are omitted in the analysis of superstructure. 2.5 Materials The specified compressive strength of concrete at 28 days is 35 MPa. The strength at transfer of prestress is 30 MPa. The ordinary deformed reinforcement has the nominal yield strength of 400 MPa. A prestressing steel is low relaxation seven wire strand grade 270 ASTM. Each longitudinal tendon consists of 12 strands. Each transverse tendon consists of 3 strands. Each strand has the diameter of 15.2 mm with the area of 140 mm2. The ultimate strength of pre-stressing steel is 1860 MPa. The ultimate force of each tendon is therefore 3.12 MN for longitudinal tendon and 0.78 MN for transverse tendon. The initial jacking stress is 70% of the ultimate strength. 2.6 Prestressing Layout
4
สภาวศิวกร

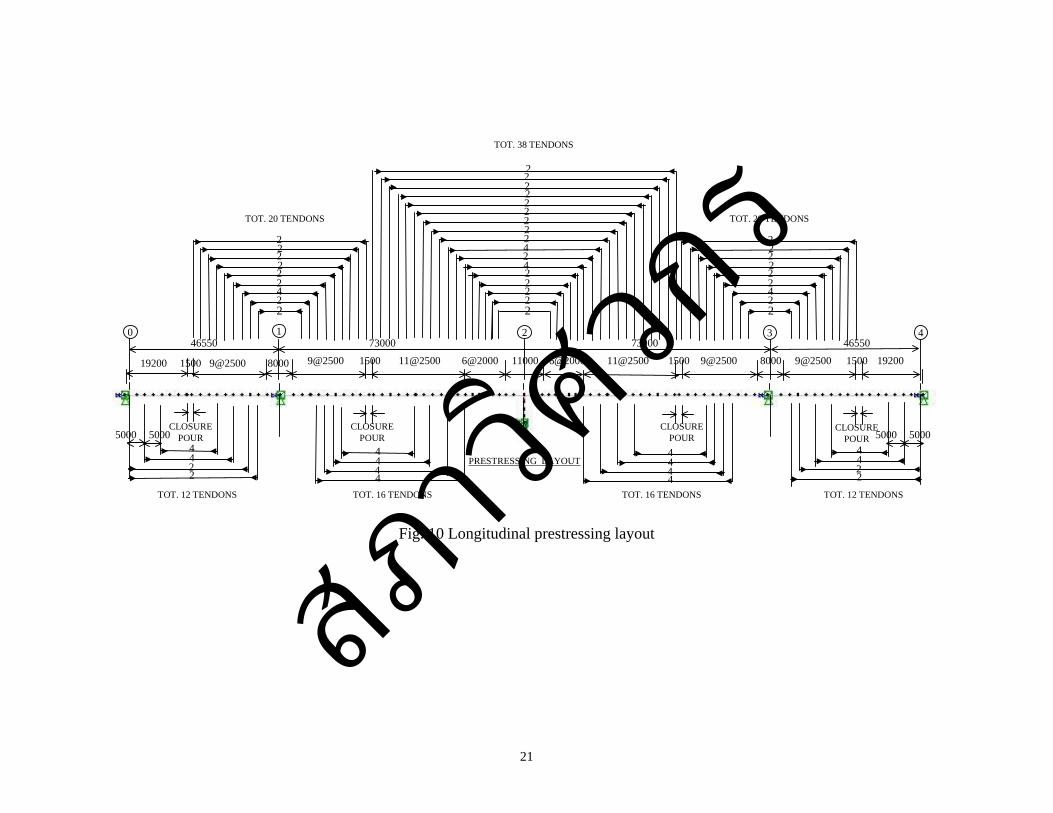
From the preliminary design together with practical experience, the layout of longitudinal prestressing is obtained as shown in Fig. 10. Any tendon longer than 30 m is to be stressed from both sides. For shorter tendons, the prestresssing can be done from one side only. In this case, the prestressing should be alternated on each side of the pier. The top prestressing consists of 38 tendons over the pier 2 and 20 tendon each over piers 1 and 3. The bottom prestressing consists of 16 tendons each in span 1-2 and 2-3 and 12 tendons each in span 0-1 and 3-4. The transverse pre-stressing is shown in Fig. 11. The tendons are spaced at 0.5 mm apart. 3. Effect of creep on long term moment redistribution As mentioned, the creep will redistribute the dead load moment from that at just the bridge completion to the long-term state. As a result, the long-term design moment is usually between the values at the bridge completion and the long-term state. In the simple calculation, the dead load moment to be designed can be estimated using the simple formula as, M = 0.22 MD + 0.78 M∝ 2 Where MD is the dead load moment considering the stages of construction at the time of bridge completion and M∝ is the dead load moment if the dead load is assumed to apply on the final continuous structure. The above equation approximately takes into account the effect of creep. A better equation can be obtained considering that the creep depends on several factors such as relative humidity (RH), concrete composition (water/cement ratio), cross-sectional geometry and time duration, age of concrete when first loaded. The better form of equation 1 can be written as, M = e-φ MD + (1-e-φ) M∝ 3 A creep factor φ(t, t0) shown in the above equation is defined as, εCR = (σc/Ec) • φ(t, t0) 4 where σc is the total concrete stress, Ec is the elastic modulus of concrete and φ(t, t0) is the creep factor. The variables t and t0 are time and time when concrete is first loaded, respectively. In the design of this bridge, the creep factor provided in Norwegian code NS3473E is used. It is noted the Norwegian code gives the same results as the CEB-FIP 1990 model code. Based on Norwegian code, the creep factor can be calculated from the following formulas, φ(t, t0) = φ0 β1 β2 βc (t-t0) 5Where φ0 = 1 + (1-RH/100) / (0.08 h0)1/3 6β1 = 8.3 / (3 + fc
0.5) 7β2 = 2.4 / (0.1 + t0
0.18) 8βc (t-t0) = {(t-t0)/( βh + t – t0)}0.3 9βh = 1.5 {1+0.00012(RH/50)18} h0 + 250 ≤ 1500 10
5
สภาวศิวกร

Where t is the age of concrete in days, t0 is the age of concrete at loading, RH is the relative humidity measured in percent, h0 is the effective cross-sectional depth measured in mm and defined as, h0 = 2 Ac / U 11 The creep factor during the time t1 to t2 can be computed as, Δφ(t2, t1) = φ0 β1 β2 Δβc (t2-t1) 12Where Δβc (t2-t1) = {(t2-t0)/( βh + t2 – t0)}0.3 - {(t1-t0)/( βh + t1 – t0)}0.3 13 Where Ac is the area of concrete cross section and U is the length of the perimeter exposed to evaporation (in case of a box section, half of the internal perimeters should be included). The above equations may be applicable to plain concrete. For reinforced section, the reinforcing bars may restrain the creep deformation, hence a factor 0.8 is applied to the calculated creep factor. In the calculation of long term creep factor, a period of ten years (3650 days) is considered sufficient. It is noted that only the partial creep factor relevant to the calculation of moment redistribution is the creep factor in the period of concrete age at time of connection to long term (10 years). Since each segment is cast at different times and each segment also has variable cross section, the partial creep factor will not be the same. The segment cast before will have smaller partial creep factor than that cast after. Table 1 shows partial creep factors used in the analysis. In the table, t0 is the age of concrete at the time of prestressing. It is assumed to be 2 days. Segment 17 is the first segment casted nearest to the pier. Segment 0 is the closure segment linking with the side cantilever. Table 1 Partial creep factors used for calculation of moment redistribution due to creep effect.
Casted segment
t0 days
t1 days
t2 days
h0 (mm)
Δφ(t2, t1)
17 2 53 3650 502 1.032 16 2 50 3650 494 1.045 15 2 47 3650 488 1.058 14 2 44 3650 488 1.071 13 2 41 3650 475 1.087 12 2 38 3650 475 1.102 11 2 35 3650 475 1.118 10 2 32 3650 456 1.138 9 2 29 3650 456 1.156 8 2 26 3650 456 1.177 7 2 23 3650 431 1.203 6 2 20 3650 431 1.228 5 2 17 3650 431 1.256 4 2 14 3650 408 1.294 3 2 11 3650 408 1.334 2 2 8 3650 376 1.395 1 2 5 3650 376 1.471 0 2 2 3650 376 1.800
6
สภาวศิวกร

4. Longitudinal analysis and design of bridge super-structure The longitudinal analysis and design of bridge superstructure consists of three parts, namely, 1. the service limit state, 2. flexural strength (ultimate limit state) and 3. shear and torsion. 4.1 Service limit state This check is to assure that during service the stresses occurring in the superstructure must be within allowable limits, which according to AASHTO 1996, are set as follows, (a) At construction stage (transfer of prestressing) fac = 0.55 fci 14fat = 0.625 (fci)0.5 15 (b) At service working stage fac = 0.6 (fc)0.5 16fat = 0.5 (fc)0.5 17 Where fac is the allowable compressive strength, fat is the allowable tensile strength, fci is strength of concrete at transfer and fc is the strength of concrete at 28 days. The short term prestress loss consists of elastic shortening, anchorage wedge draw-in and friction loss. The long-term prestress loss consists of the above-mentioned short-term loss plus creep, shrinkage and relaxation loss. Based on the calculation, it is found that the short-term loss is less than 10% and the long-term loss is less than 20%. Hence, the stress in prestressing tendon is assumed to be 90% and 80% of initial jacking stress for short and long-term, respectively. The check of allowable stresses must be done for both construction stages and working stages. At construction stages, the moment is mainly negative due to the dead weight of the bridge and the formwork traveler. It can be computed as follows, MSC = MG1 + MBB 18 Where MSC is the moment at the service construction stage, MG1 is the moment due to dead weight and MBB is the moment due to formwork traveler (bridge builder) weighing 260 kN. As for the working stage, two conditions are considered, the bridge opening stage and the long-term stage. The bridge opening state is defined as the state just after the bridge is connected to each other by means of bottom prestressing. At this stage, the creep redistribution has not yet taken place. The moment can be obtained as follows, MSO = MG1 + ΔMPS + MG2 + ML 19
7
สภาวศิวกร

Where MSO is the moment at the service opening stage, ΔMPS is the secondary moment due to bottom prestressing, MG2 is moment due to superimposed dead load and ML is the moment due to traffic load. It is noted that there is no secondary moment associated with top tendons as top prestressings are applied when the structure is in the statical system, i.e. cantilevering state. In the service long-term stage, the creep redistribution has taken place and the moment due to this must be considered. The moment in the service long-term stage can be computed as, MSL = MG1 + ΔMG1 + ΔMPS + MG2 + ML + MDS 20 Where MSL is the moment at the service long-term state, ΔMG1 is the moment redistribution due to creep and MDS is the moment due to differential settlement of the adjacent piers. It is noted that AASHTO does not particularly specify the moment due to differential settlement, however, the differential settlement of 50 mm is considered in this design since the bridge is rather big and important. As a result of creep, the elastic modulus of concrete is decreased as a function of time. In order to calculate the moment due to differential settlement, the elastic modulus of concrete is reduced for both superstructure and pier by the following formula, E∞ = Ec/(1+φ) 21 Where φ is the long-term creep factor. As mentioned, the calculation of MG1 must follow the construction stages. Hence, it can be computed as follows, MG1 = MGC + MBB + MWC + MBBR + MSCF 22 Where MGC is the moment during cantilevering construction (Fig. 3a), MBB is the moment due to formwork traveler in the cantilever state (for concreting closure) (Fig. 3b), MWC is the moment due to the weight of wet concrete closure (Fig. 3c), MBBR is the moment due to the removal of formwork traveler after closure hardens (Fig. 3d), MSCF is the moment due to 20 m concrete portion cast on temporary scaffolding (Fig. 3f) The dead load moment at various construction stages is shown in Fig. 12. It is noticed that the moment due to creep redistribution is negative all over the span. In effect, this will increase the negative moment at pier and reduce positive moment at midspan. Generally, the effect of creep should result in the decrease in the negative moment over the pier and increase in the positive moment in the span. The opposite tendency may occur in this case if the section is overly prestressed as in this example. It is noted that if the effect of creep redistribution is computed by using simplified equations, equations 2, 3, for example, the opposite creep effect cannot be obtained. So in order to obtain realistic results, the creep factor of each segment must be considered.
8
สภาวศิวกร

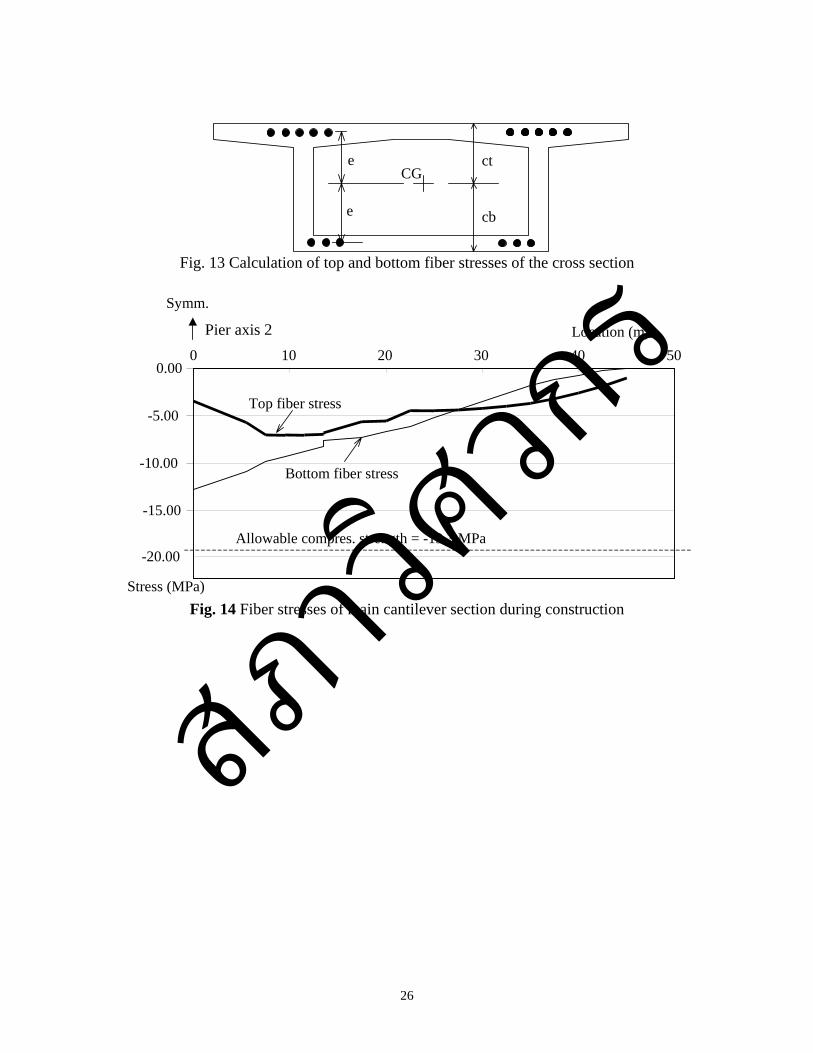
The calculation of flexural stresses at the top and bottom fiber of the cross section can be computed as follows (Fig. 13). ftop = P/Ac + P e ct / I – M ct/I 23fbot = P/Ac - P e cb / I + M cb/I 24 Where e is eccentricity of prestressing tendon, I is the gross moment of inertia. Fig. 14 and Fig. 15 show fiber stresses of the main cantilever sections and side cantilever sections, respectively, during construction. Fig. 16 and Fig. 17 show fiber stresses of the main cantilever sections under minimum negative moment and maximum positive moment, respectively, in the working stage. Fig. 18 and Fig. 19 show fiber stresses of side cantilever sections under minimum negative moment and maximum positive moment, respectively, in the working stage. It is found that the fiber stresses during both construction period and working state are mainly compressive and little tensile stress occur on the cross section. This indicates large prestressing force on the cross section. 4.2 Flexural strength (Ultimate limit state) The design for flexural strength follows the AASHTO 1996 code. The flexural strength of the cross section is assumed to reach when the compressive strain of concrete reaches 0.003. The design moment has to be combined using the AASHTO load factors as follows, (a) At opening state MU = 1.3 {(MG1 + MG2) + 1.67ML} + ΔMPS 25 (b) At long term state MU = 1.3 {(MG1 + ΔMG1 + MG2 + ΔMDS) + 1.67ML} + ΔMPS 26 The stress in pre-stressing steel for calculating the moment capacity can be calculated as, f*
su = fsu {1-(γ*/β1)[(ρ*f′s/f′c) + (dt/d)(ρfsy/f′c)]} 27 The moment capacity can be governed by concrete crushing or yielding of prestressing bars. The AASHTO code gives separate design moment capacity formulas for both cases. Fig. 20 and Fig. 21 show design moment and moment capacity of the main and side cantilever sections, respectively. 4.3 Shear and torsion The design for shear and torsion follows the AASHTO 1996 code. The design shear has to be combined using the AASHTO load factors as follows, (a) At opening state VU = 1.3 {(VG1 + VG2) + 1.67VL} + ΔVPS 28 (b) At long-term state VU = 1.3 {(VG1 + ΔVG1 + VG2 + ΔVDS) + 1.67VL} + ΔVPS 29
9
สภาวศิวกร

The shear capacity of the superstructure is taken by the web and the compression force in bottom slab as follows (see Fig. 22), VU = CU (dz/dx) + z (dCU/dx) 30 Where CU (dz/dx) is the shear taken by bottom slab and z (dCU/dx) is shear taken by webs. For side cantilevers (axes 2 and 4) and the 20 m abutment span cast on temporary scaffolding, the bottom slab has horizontal profile, hence the entire shear force is carried by the webs. According to AASHTO 1996, the shear strength provided by concrete Vc is taken as the lesser of the values Vci or Vcw. The former is associated with flexural-shear crack and the latter with web-shear crack. The shear strength Vci is computed by, Vci = 0.0498 fc
0.5 b′d + Vd + Vi Mcr / Mmax 31 Where Vd is the unfactored shear force due to dead load, Vi and Mmax are factored shear and moment due to externally applied load, Mcr is the moment causing flexural crack. The shear strength Vci need not be less than 0.142 fc0.5 b′d. The effective depth d need not be taken less than 0.8h, where h is the entire height of the section. The shear strength Vcw is computed by Vcw = (0.29 fc
0.5 + 0.3fpc)b′d + Vp 32 Where Vp is the vertical component of effective prestress force at the section and fpc is the effective prestress at centroid of the cross-section. As for torsion design, the ACI318-99 is adopted. According to ACI318-99, the torsion reinforcements are not required if the ultimate design torque is less than cracking torque (TU < φTcr/4). The value of φTcr/4 is given by the following, φTcr/4 = 0.85 [0.083 fc
0.5 (A2cp/pcp) (1 + 3fpc/fc
0.5)0.5 33 Where Acp and pcp are defined as shown in Fig. 23. For this bridge, the maximum design torsion is less than φTcr/4, so the consideration of torsion is not needed. The longitudinal shear at the interface between web and deck slab must be designed as shown in Fig. 24. The shear flow (dT/dx) can be computed based on equilibrium as follows (dT/dx) = V/z 34 Reinforcements are needed at the junction between web and deck slab. The shear-friction concept is used to calculate the reinforcements. As = (dT/dx) / (μφfy) 35
10
สภาวศิวกร

The coefficient of friction (μ) can be taken as 1.4 if the entire box is cast at the same time, and 1.0 if top slab is cast separately from the webs. The longitudinal shear transfer between web and bottom slab must also be considered as shown in Fig. 25. From the figure, we have Va = (CUA – CUB)/2 36 Where CU = 0.85 f′c (b-2tw)x ; if x < t = 0.85 f′c (b-2tw)t ; if x ≥ t 37
Where x is the depth of compression zone. The reinforcement can be designed using the shear-friction concept as above. Fig. 26 and Fig. 27 show design shear and shear capacity of the main and side cantilever sections, respectively. 5. Transverse analysis and design The transverse analysis and design consists of 1. cantilever deck slab, 2. deck slab between webs and 3. design of bottom slabs as shown in Fig. 28. In the design of cantilever deck slab and deck slab between webs, the load consists of dead load, superimposed dead load and traffic. As for traffic, the load of truck wheel plus impact is applied on the slab. The placement of traffic wheels to obtain maximum effect is done using influence surface of elastic plates as shown in Figs. 29-31. In these figures, the cross sign is the location of truck wheel. For cantilever transverse slab, the unfactored negative moment (moment at sections A and B in Fig. 28) due to HS20-44 can be computed as (Fig. 29), M = 1/(8π) (72) (10.9 + 8.2) = 54.7 kNm/m 38 For deck slab between webs, partially restrained condition is considered. For hinged condition, the positive moment at mid span (section C in Fig. 28) is obtained as (Fig. 30) MH = 1/(8π) (72) (0.2 + 0.86 + 0.6 + 0.86 + 7.5 + 1.77 +0.27/4 + 0.8/4 + 0.6/4 ) = 35.0 kNm/m
39
For fixed condition, the positive moment at mid span (section C in Fig. 28) is obtained as (Fig. 31) MH = 1/(8π) (72) (0.1 + 0.1 + 5.5 + 0.40 + 0.1/4 ) = 17.6 kNm/m
40
The average positive moment between fixed and hinge conditions is used to design positive reinforcement for section C.
11
สภาวศิวกร

6. References 1. Standard Specifications for Highway Bridges (AASHTO 1996) 2. CEB-FIP model code 1990 3. Norwegian Standard, Concrete structures Design rules NS3473E 4. J. Mathivat, The cantilever construction of prestressed concrete bridges, A Wiley-Interscience
Publication, 1979 5. ACI COMMITTEE 318, Building Code Requirements for Structural Concrete and
Commentary (1999), American Concrete Institute, Farmington Hills, Michigan 6. A. Pucher, Influence surface of elastic plates, Springer-Verlag 1977 7. W. Podlny and J.M. Muller, Construction and design of prestressed concrete segmental
bridges, John Wiley and Sons, 1982
12
สภาวศิวกร

60.00 CL 60.00 CL
7.80 CL
7.80 CL
MSL 0.00
47.00 47.0073.0073.00 CL EXP JOINT
CL EXP JOINT
60.00 CL 60.00 CL
7.80 CL
7.80 CL
MSL 0.00
47.00 47.0073.0073.00 CL EXP JOINT
CL EXP JOINT
1 2 30 4
Fig. 1. Bridge profile and layout
2650 2650550010800
5400 5400
R250 R250
4119
4200
2919
3000
25020
0
36022
0
400
250
250
1.5%1.5%
Fig. 2 Cross section of box girder superstructure
13
สภาวิศ
วกร

1 2 3
(a) Balanced cantilevering construction
(b) Form traveler on side cantilever for casting closure segment
1 2 31 2 3
1 2 31 2 3
(c) Dead weight of wet closure segment
Fig. 3 Construction stages
14
สภาวิศ
วกร

1 2 31 2 3
(d) Removal of bridge builder
(e) Secondary moment due to bottom prestressing
(f) After releasing temp. scaffolding, weight of abutment span is supported by continuous structure
Fig. 3 Construction stages
1 2 30 4
Temp. Scaffolding
20.05 20.05
1 2 30 4
20.05 20.05
1 2 30 4
15
สภาวิศ
วกร

16
Fig. 4 computer model
Full bridge –computer model
1 2 30 4
2
Main cantilever – computer model
1
3
Side cantilever – computer model
NL
M
สภาวิศ
วกร

N
L
M
For calculating IL and IN For calculating IM
Fig. 5 Geometrical section used for calculating moment of inertia
0.1W
0.1W
0.4W
0.4W
0.2W 0.8W
0.8W
4.2 m 4.2 – 9.0 m
HS20-44 36 kN 144 kN 144 kN
0.4W
0.4W0.1W
0.1W
0.4W
0.4W
0.2W 0.8W
0.8W
4.2 m 4.2 – 9.0 m
HS20-44 36 kN 144 kN 144 kN
0.4W
0.4W
Fig. 6a Standard AASHTO truck load
17
สภาวศิวกร

18
Fig. 6b Standard AASHTO lane load
Fig. 9 Torsion is caused by eccentric of lane load on girder
w = 9.53 kN/m
P = 82.0 kN (for moment calculation)= 116.0 kN (for shear calculation)
0.9 m 3.0 m
สภาวศิวกร

Load cases to obtain maximum positive moment
Load cases to obtain maximum negative moment over pier 1, 3
0.4L 0.4L
0.5L
Load cases to obtain maximum negative moment over pier 2
0.4L 0.4L
1 2 30 4
Fig. 7 Load cases to obtain maximum moment (positive span moment and negative support moments)
19
สภาวิศ
วกร

Load case to obtain maximum shear at abutment
Load case to obtain maximum shear at pier 1
1 2 30 4
Load case to obtain maximum shear at pier 2
Fig. 8 Load cases to obtain maximum shear
20
สภาวิศ
วกร
0 1 2 3 4
PRESTRESSING LAYOUT
TOT. 16 TENDONS TOT. 16 TENDONSTOT. 12 TENDONS TOT. 12 TENDONS
TOT. 20 TENDONS TOT. 20 TENDONS
TOT. 38 TENDONS
2224
22222
2224
22222
2222
2224
4
2
2
2
2
22
22
22
44
44
44
44
44
22
44
5000 5000 5000 5000CLOSURE
POURCLOSURE
POURCLOSURE
POURCLOSURE
POUR
19200 1500 9@2500 8000 9@2500 1500 11@2500 6@2000 11000 6@2000 1920015009@250080009@2500150011@2500
46550 4655073000 73000
Fig. 10 Longitudinal prestressing layout
21
สภ
าวิศวก
ร

22
Fig. 11 Transverse prestressing layout
TRANSVERSE TENDON @ 0.50 m
CL
BRIDGE
สภาวศิวกร
182.7 MNm
57.1 MNm
6.8 MNm
5.2 MNm 3.4 MNm
(a) Dead load: cantilever construction
(b) Formwork traveler
(c) Wet closure
1 2 3
Fig. 12 Moment at various construction stages
23
สภาวิศ
วกร

(d) Removal of formwork traveler
4.3 MNm
-2.9 MNm
17.74 MNm
-7.27 MNm
34.5 MNm
(e) 20 m abutment span cast on scaffolding
(f) Bottom prestressing
1 2 30 4
Fig. 12 Moment at various construction stages
24
สภาวิศ
วกร

-3.14 MNm
(h) Creep redistribution
(g) Superimposed dead load (Asphalt pavement, barrier etc.)
1 2 30 4
Fig. 12 Moment at various stages
25
สภ
าวิศวก
ร
CGct
cb
e
e
Fig. 13 Calculation of top and bottom fiber stresses of the cross section
-15.00
-10.00
-5.00
0.000 10 20 30 40 50
-20.00Allowable compres. strength = -19.3 MPa
Top fiber stress
Bottom fiber stress
Pier axis 2 Location (m)
Symm.
Stress (MPa) Fig. 14 Fiber stresses of main cantilever section during construction
26
สภาวศิวกร

-15.00
-10.00
-5.00
0.005 10 15 20 25 30
-20.00Allowable compres. strength = -19.3 MPa
Pier axis 1, 3
Symm.
Top fiber stress
Bottom fiber stress
Location (m)
Stress (MPa) Fig. 15 Fiber stresses of side cantilever sections during construction
-20.00
-15.00
-10.00
-5.00
0.00
5.000 10 20 30 40
Allowable compres. strength = -19.3 MPa
50
Top fiber stress
Bottom fiber stress
Pier axis 13
Symm.
Location (m)
Stress (MPa) Fig. 16 Fiber stresses of main cantilever sections under minimum negative moment,
working state
27
สภาวศิวกร

-20.00
-15.00
-10.00
-5.00
0.000 10 20 30 40
Top fiber stress
Bottom fiber stress
50
Allowable compres. strength = -19.3 MPa
Pier axis 13
Symm.
Location (m)
Stress (MPa) -20.00
-15.00
-10.00
-5.00
0.000 10 20 30 40
Top fiber stress
Bottom fiber stress
50
Allowable compres. strength = -19.3 MPa
Pier axis 13
Symm.
Location (m)
Stress (MPa)
Pier axis 13
Symm.
Location (m)
Stress (MPa) Fig. 17 Fiber stresses of main cantilever sections under maximum positive moment, working
state
-20
-15
-10
-5
0 -30 -20 -10 0 10 20 30
Top fiber stress
Bottom fiber stress
Pier axis 1, 3
Allowable compres. strength = -19.3 MPa
Location (m)
Stress (MPa) -20
-15
-10
-5
0 -30 -20 -10 0 10 20 30
Top fiber stress
Bottom fiber stress
Pier axis 1, 3
Allowable compres. strength = -19.3 MPa
Location (m)
Stress (MPa) Fig. 18 Fiber stresses of side cantilever sections under minimum negative moment, working state
28
สภาวศิวกร

20
15
10
5
0
530 20 10 0 10 20 30
Allowable compres. strength = -19.3 MPa
Pier axis 1, 3 Location (m)
Stress (MPa)
Top fiber stress
Bottom fiber stress
Fig. 19 Fiber stresses of side cantilever sections under maximum positive moment, working state
-500
-400
-300
-200
-100
0
100
200
0 10 20 30 40
Pier axis 2Symm.
Negative moment
50
Negative moment capacity
Positive moment
Positive moment capacity
Location (m)Moment (MNm)
Fig. 20 Moment and moment capacity of main cantilever sections, ultimate state
29
สภาวศิวกร

-200
-100
0
100
200
30 20 10 0 10 20 30
Negative moment
Negative moment capacity
Positive moment
Positive moment capacity
Pier axis 1, 3
Location (m)Moment (MNm)
Fig. 21 Moment and moment capacity of side cantilever sections, ultimate state
2
1
Tu
CuVu
Mvu Z
dx
Tu+ dTu
Z +dZ Mvu+ dMvu Vu +dVu
Cu+ dCu
2
1
Tu
CuVu
Mvu Z
dx
Tu+ dTu
Z +dZ Mvu+ dMvu Vu +dVu
Cu+ dCu
Fig. 22 Equilibrium of a segment with inclined bottom slab
Pcp
Acp
Fig. 23 Definition of Acp and pcp
30
สภาวศิวกร

2
1
T
CV
M
dx
T+ dT
M+ dM V+dV
C+ dC
Z
a a
Fig. 24 Longitudinal shear at web/deck slab interface
a a
aa
b
tw tw
tx
a a
aa
b
tw tw
txVa
Va
CUA
CUB
LΔ
VaVa
CUA
CUB
LΔ
Fig. 25 Longitudinal shear at web/bottom slab interface
31
สภาวศิวกร

-5
0
5
10
15
20
25
30
0 10 20 30 40
Vtot
Vc VuVs
50
Pier axis 2
Location (m)Moment (MNm) Fig. 26 Shear and shear capacity of main cantilever sections, ultimate state
0
5
10
15
20
-30 -20 -10 0 10 20 30
Vtot
Vc
Vu
Vs
Pier axis 1, 3
Location (m)Moment (MNm) Fig. 27 Shear and shear capacity of side cantilever sections, ultimate state
32
สภาวศิวกร

33
Fig. 28 Transverse analysis
BA
CANTILEVER PART
2.45 m
0.25
สภาวศิวกร

-11.68
-11
-10
-9-8
-7-6
-5 -4-3
-2
-1-0.5
-0.2 -0.1
-8-7
-6-5
-3-2-1
-0.5-0.2
-0.1
72 kN
2.45
mx
y72 kN
-4
Fig. 29 Moment for cantilever transverse slab
34
สภาวิศ
วกร

72 kN
4.70
mx
y
18 kN
18 kN
18 kN
72 kN
72 kN
72 kN72 kN
1.22
m1.
83m
0.20.4
0.81
23
45
72 kN
667788
0.6
Fig. 30 Moment due to traffic wheel on deck slab between web obtained for hinged condition
35
สภาวิศ
วกร

4.70
mx
y
72 kN
72 kN
72 kN
72 kN
72 kN
72 kN
18 kN
18 kN
18 kN
1.22
m1.
83m
0.1
0.40.60.81
23
5566 44
0.2
Fig. 31 Moment due to traffic wheel on deck slab between web obtained for fixed condition
36
สภาวิศ
วกร