design improvement of pindad mini excavator boom using
TRANSCRIPT
Journal of Mechanical Engineering and Mechatronics
ISSN: 2527-6212, Vol. 5 No. 1, pp. 38-47 © 2020 Pres Univ Press Publication, Indonesia
38
Design Improvement of Pindad Mini Excavator Boom
Using Finite Element Method
Azhari Sastranegara1,a, Zairullah Azhar2,b 1,2Mechanical Engineering Study Program, Faculty of Engineering, President University
Jl. Ki Hajar Dewantara, Jababeka Education Park, Bekasi 17550
[email protected], [email protected]
Abstrak.
Makalah ini menyajikan analisis mini excavator excava 50 dengan fokus pada komponen boom.
Komponen boom adalah komponen yang memiliki beban kerja berat. Bahan yang digunakan dalam
desain yang ada adalah SM490A. Hasil analisis masih tidak aman karena stres yang diijinkan kurang
dari stres kerja. Bahan dalam desain yang ada diganti dengan Hardox 400. Desainnya dinyatakan
aman. Namun, biaya produk telah meningkat karena bahan Hardox 400 lebih mahal daripada
SM490A. Untuk mengurangi biaya produk, diperlukan perbaikan desain untuk mengoptimalkan
penggunaan material. Metode perbaikan desain yang digunakan dalam penelitian ini sesuai dengan
metode optimasi, yaitu ukuran dan optimasi bentuk. Setelah perbaikan desain, untuk memprediksi
berapa lama komponen boom dapat digunakan, prediksi umur kelelahan dihitung menggunakan teori
Goodman.
Kata kunci. Boom, Excavator Mini, Metode Elemen Hingga, Peningkatan Desain, Masa Kelelahan
Abstract. This paper presents the analysis of mini excavator excava 50 with a focus on the boom component.
The boom component is a component that has a heavy workload. The material used in the existing
design is SM490A. The results of the analysis are still not safe because allowable stress is less than
working stress. The material in the existing design was replaced with Hardox 400. The design is
declared safe. However, the costs of the product have increased because Hardox 400 materials are
more expensive than SM490A. To reduce the costs of the product, design improvement is needed to
optimize the use of material. The design improvement method that uses in this study is according the
optimization method, that is sizing and shape optimization. After improvement the design, to predict
how long the boom component can be used, fatigue life prediction is calculated using Goodman’s
theory.
Keywords. Boom, Mini Excavator, Finite Element Method, Design Improvement, Fatigue Life
Introduction
The development of infrastructure in Indonesia recently is growing rapidly, especially road
infrastructure to connect rural areas with urban areas. But in reality, road infrastructure development
still has a few obstacles, especially in rural areas. Difficult mobility is the main obstacle factor,
especially for heavy equipment. The need for small heavy equipment in order to reach remote areas
[1].
To support the acceleration of road infrastructure development in rural areas, one of Indonesia's state-
owned enterprises. That is PT. Pindad (Persero) has innovation in making to make small-scale
excavators called Excava 50. Excava 50 is classified as Mini Excavator, which is a type of heavy
equipment whose function is to complete a variety of light works such as removal of sewerage,
disposing of waste material, soil filling, and other lightwork related to construction. In addition, this
Excava can also be used for various plantation and forestry purposes [2].
In a wide range of engineering projects, the structural design has always been a very interesting and
creative part. Structures should be designed to be able to withstand applied forces (stress constraints)
and not surpass such deformations (displacement constraints). Boom is the main component of the
39
Journal of Mechanical Engineering and Mechatronics 2020
main excavator, heavier, and very critical, so there is a need for improvement and development [3].
Since excava 50 is a new product, there is a need to improve the design. Therefore, the author is
interested in improve the excava 50 design with a focus on analyzing boom components. The results
of this analysis are used as standard structures for boom components.
Methodology
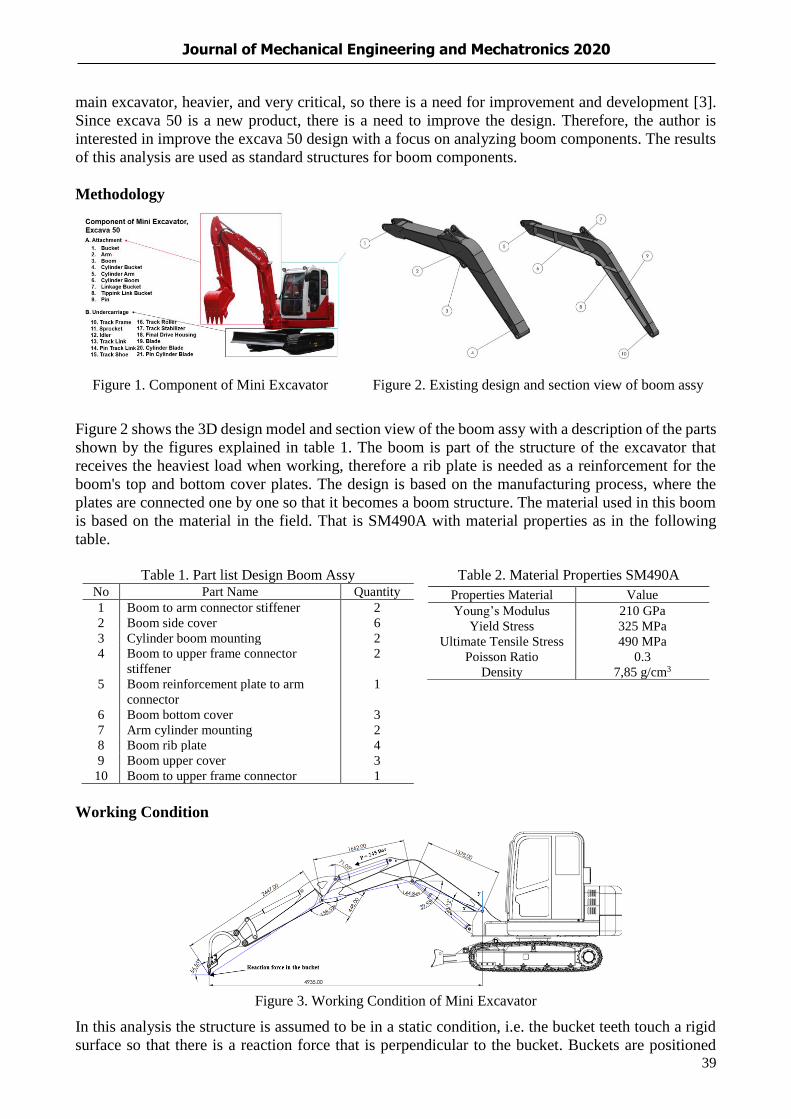
Figure 1. Component of Mini Excavator Figure 2. Existing design and section view of boom assy
Figure 2 shows the 3D design model and section view of the boom assy with a description of the parts
shown by the figures explained in table 1. The boom is part of the structure of the excavator that
receives the heaviest load when working, therefore a rib plate is needed as a reinforcement for the
boom's top and bottom cover plates. The design is based on the manufacturing process, where the
plates are connected one by one so that it becomes a boom structure. The material used in this boom
is based on the material in the field. That is SM490A with material properties as in the following
table.
Table 1. Part list Design Boom Assy Table 2. Material Properties SM490A
No Part Name Quantity
1 Boom to arm connector stiffener 2
2 Boom side cover 6
3 Cylinder boom mounting 2
4 Boom to upper frame connector
stiffener
2
5 Boom reinforcement plate to arm
connector
1
6 Boom bottom cover 3
7 Arm cylinder mounting 2
8 Boom rib plate 4
9 Boom upper cover 3
10 Boom to upper frame connector 1
Properties Material Value
Young’s Modulus 210 GPa
Yield Stress 325 MPa
Ultimate Tensile Stress 490 MPa
Poisson Ratio 0.3
Density 7,85 g/cm3
Working Condition
Figure 3. Working Condition of Mini Excavator
In this analysis the structure is assumed to be in a static condition, i.e. the bucket teeth touch a rigid
surface so that there is a reaction force that is perpendicular to the bucket. Buckets are positioned

40
Journal of Mechanical Engineering and Mechatronics 2020
parallel to the arm. Working pressure on the cylinder arm of 245 bar pushes forward, forcing the arm
to rotate counter-clockwise to the xy plane.
Static Analysis using Free Body Diagram (FBD) and Bucket and Arm Static Force
Figure 4. FBD of Mini Excavator Figure 5. FBD of Bucket and Arm Component
From this figure, there is 1 force that produces 3 reactions. That is the action force on the cylinder
arm (F). When the cylinder arm is active, the arm and bucket will move counter-clockwise. Resulting
in reaction forces on bucket teeth (RA), mounting cylinder arms on the boom (RD) and also mounting
cylinder boom (RE).
Table 3. Force Contained in Bucket and Arm Component
Pin Force (kN)
X Y
RA - 85.91 130.04
RB 160.40 17.56
RC - 147.41 - 50.61
Boom Static Force
Table 4. Force Contained in Bucket and Arm
Component
Pin Force (kN)
X Y
RA - 85.91 130.04
RB 160.40 17.56
RC - 147.41 - 50.61
Figure 6. FBD of Boom Component
Static force in this analysis calculated by considering the summation force must be equal to zero
(∑ 𝐹 = 0)and summation of moment equal to zero (∑ 𝑀 = 0) for equlibrium condition of the bucket,
arm and boom respectively. The negative sign indicates the force acting towards the left on the
horizontal component and downward on the vertical force. by considering the direction of force
obtained in accordance with the FBD.
Finite Element Analysis
Design Boom and Applying the Material
The boom assy mini excavator structure was designed using CAD CATIA V5 Software based on the
actual size and for the material that apply in this design accroding the properties material in existing
design.
41
Journal of Mechanical Engineering and Mechatronics 2020
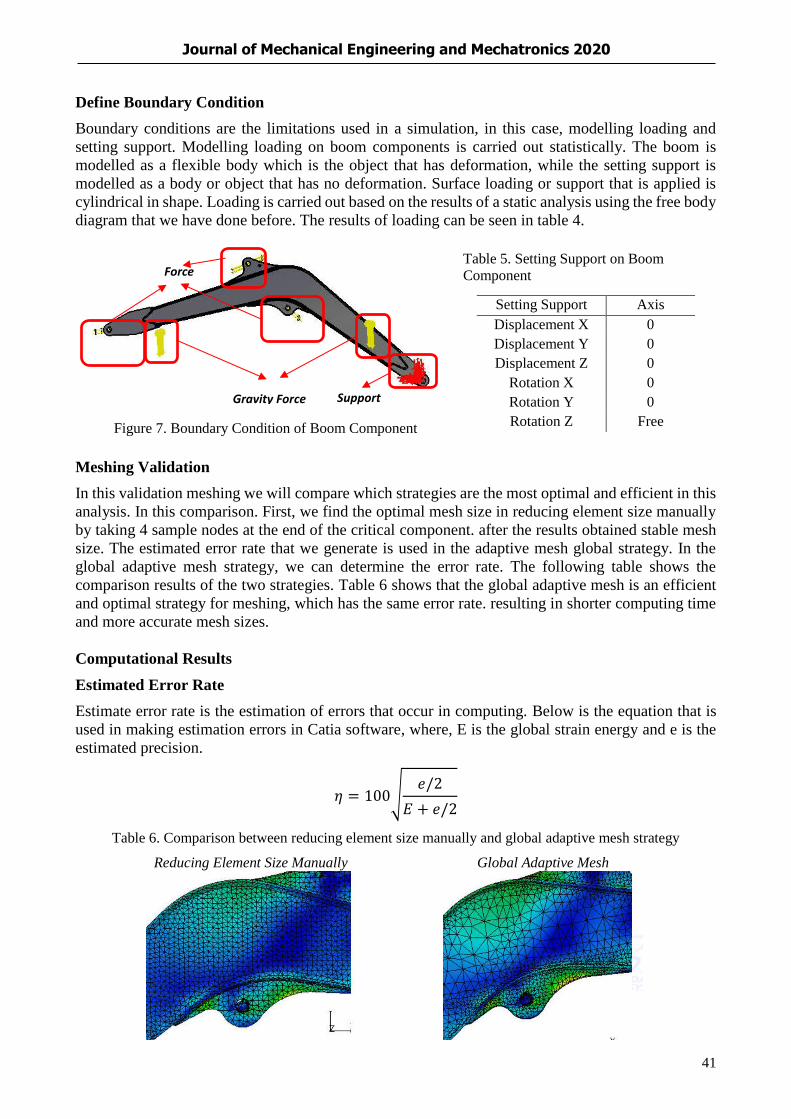
Define Boundary Condition
Boundary conditions are the limitations used in a simulation, in this case, modelling loading and
setting support. Modelling loading on boom components is carried out statistically. The boom is
modelled as a flexible body which is the object that has deformation, while the setting support is
modelled as a body or object that has no deformation. Surface loading or support that is applied is
cylindrical in shape. Loading is carried out based on the results of a static analysis using the free body
diagram that we have done before. The results of loading can be seen in table 4.
Figure 7. Boundary Condition of Boom Component
Table 5. Setting Support on Boom
Component
Setting Support Axis
Displacement X 0
Displacement Y 0
Displacement Z 0
Rotation X 0
Rotation Y 0
Rotation Z Free
Meshing Validation
In this validation meshing we will compare which strategies are the most optimal and efficient in this
analysis. In this comparison. First, we find the optimal mesh size in reducing element size manually
by taking 4 sample nodes at the end of the critical component. after the results obtained stable mesh
size. The estimated error rate that we generate is used in the adaptive mesh global strategy. In the
global adaptive mesh strategy, we can determine the error rate. The following table shows the
comparison results of the two strategies. Table 6 shows that the global adaptive mesh is an efficient
and optimal strategy for meshing, which has the same error rate. resulting in shorter computing time
and more accurate mesh sizes.
Computational Results
Estimated Error Rate
Estimate error rate is the estimation of errors that occur in computing. Below is the equation that is
used in making estimation errors in Catia software, where, E is the global strain energy and e is the
estimated precision.
𝜂 = 100√𝑒/2
𝐸 + 𝑒/2
Table 6. Comparison between reducing element size manually and global adaptive mesh strategy
Reducing Element Size Manually
Global Adaptive Mesh
Force
Support Gravity Force
42
Journal of Mechanical Engineering and Mechatronics 2020
Mesh Size 15 mm
Von Misses Stress
271 MPa
480 second
Error Rate 5.43%
Mesh Size Global Adaptive
Von Misses Stress
230 MPa
280 second
Error Rate 4.63%
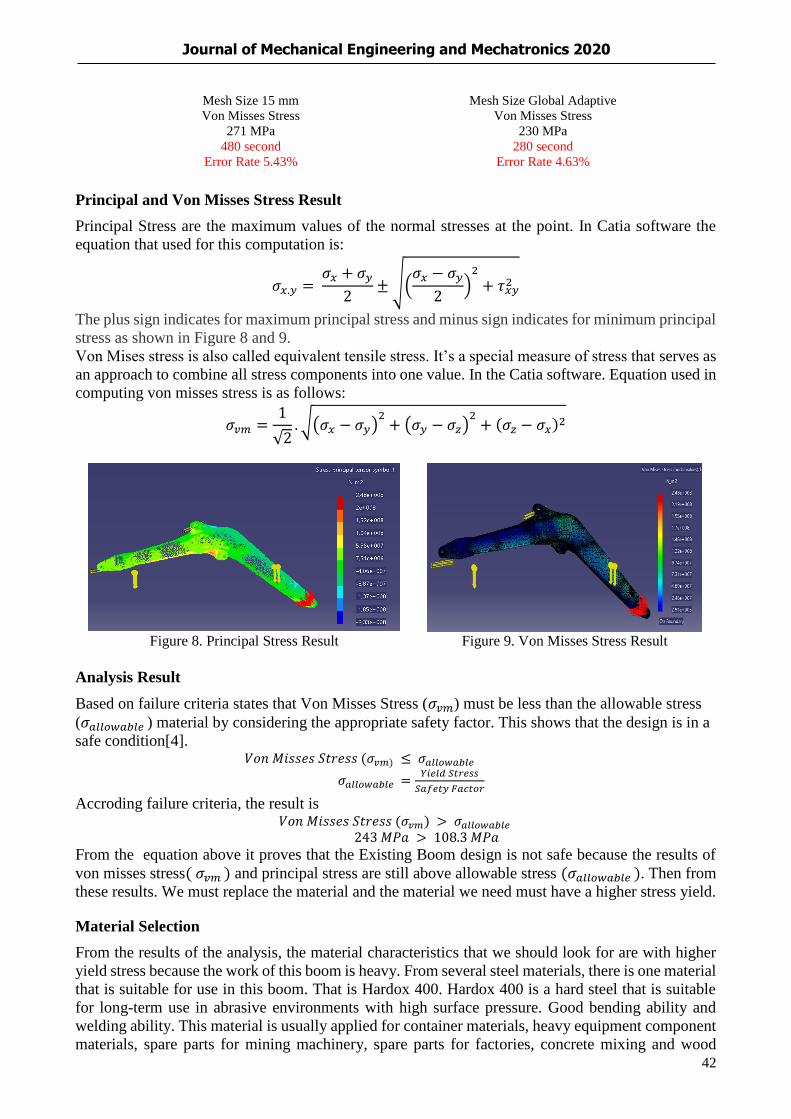
Principal and Von Misses Stress Result
Principal Stress are the maximum values of the normal stresses at the point. In Catia software the
equation that used for this computation is:
𝜎𝑥.𝑦 = 𝜎𝑥 + 𝜎𝑦
2± √(
𝜎𝑥 − 𝜎𝑦
2)
2
+ 𝜏𝑥𝑦2
The plus sign indicates for maximum principal stress and minus sign indicates for minimum principal
stress as shown in Figure 8 and 9.
Von Mises stress is also called equivalent tensile stress. It’s a special measure of stress that serves as
an approach to combine all stress components into one value. In the Catia software. Equation used in
computing von misses stress is as follows:
𝜎𝑣𝑚 =1
√2. √(𝜎𝑥 − 𝜎𝑦)
2+ (𝜎𝑦 − 𝜎𝑧)
2+ (𝜎𝑧 − 𝜎𝑥)2
Figure 8. Principal Stress Result Figure 9. Von Misses Stress Result
Analysis Result
Based on failure criteria states that Von Misses Stress (𝜎𝑣𝑚) must be less than the allowable stress
(𝜎𝑎𝑙𝑙𝑜𝑤𝑎𝑏𝑙𝑒 ) material by considering the appropriate safety factor. This shows that the design is in a
safe condition[4]. 𝑉𝑜𝑛 𝑀𝑖𝑠𝑠𝑒𝑠 𝑆𝑡𝑟𝑒𝑠𝑠 (𝜎𝑣𝑚) ≤ 𝜎𝑎𝑙𝑙𝑜𝑤𝑎𝑏𝑙𝑒
𝜎𝑎𝑙𝑙𝑜𝑤𝑎𝑏𝑙𝑒 =𝑌𝑖𝑒𝑙𝑑 𝑆𝑡𝑟𝑒𝑠𝑠
𝑆𝑎𝑓𝑒𝑡𝑦 𝐹𝑎𝑐𝑡𝑜𝑟
Accroding failure criteria, the result is 𝑉𝑜𝑛 𝑀𝑖𝑠𝑠𝑒𝑠 𝑆𝑡𝑟𝑒𝑠𝑠 (𝜎𝑣𝑚) > 𝜎𝑎𝑙𝑙𝑜𝑤𝑎𝑏𝑙𝑒
243 𝑀𝑃𝑎 > 108.3 𝑀𝑃𝑎
From the equation above it proves that the Existing Boom design is not safe because the results of
von misses stress( 𝜎𝑣𝑚 ) and principal stress are still above allowable stress (𝜎𝑎𝑙𝑙𝑜𝑤𝑎𝑏𝑙𝑒 ). Then from
these results. We must replace the material and the material we need must have a higher stress yield.
Material Selection
From the results of the analysis, the material characteristics that we should look for are with higher
yield stress because the work of this boom is heavy. From several steel materials, there is one material
that is suitable for use in this boom. That is Hardox 400. Hardox 400 is a hard steel that is suitable
for long-term use in abrasive environments with high surface pressure. Good bending ability and
welding ability. This material is usually applied for container materials, heavy equipment component
materials, spare parts for mining machinery, spare parts for factories, concrete mixing and wood

43
Journal of Mechanical Engineering and Mechatronics 2020
processing machinery, mining platform structures[5]. Hardox 400 has the following material
properties.
Table 7. Material Properties Hardox 400
Based on Failure Criteria, the result will be:
𝑉𝑜𝑛 𝑀𝑖𝑠𝑠𝑒𝑠 𝑆𝑡𝑟𝑒𝑠𝑠 (𝜎𝑣𝑚) < 𝜎𝑎𝑙𝑙𝑜𝑤𝑎𝑏𝑙𝑒 243 𝑀𝑃𝑎 < 333.3 𝑀𝑃𝑎
The results of the equations above indicate that the design is safe to use. However, one aspect if we
replace the material in the existing design with new material. Then the product costs will increase
because of the price of new material that is Hardox 400 is more expensive than SM490A. By
considering these aspects, we will carry out design improvement. The aim is to optimize the use of
material so that product costs are reduced.
Design Improvement
Design Improvement is the process of improve the design with the aim is to optimize the use of
material so that product costs are reduced. In the design improvement we use optimization methods.
That is Sizing optimization and shape optimization.
Table 8. Table Modification Thickness of Boom
No Part Name Qty
Modification Thickness
Existing
Design
Improvement
Design
1 Boom to arm
connector stiffener 2 20 16
2 Boom side cover 6 8 6
3 Cylinder boom
mounting 2 18 16
4 Boom to upper frame
connector stiffener 2 10 10
5 Boom reinforcement
to arm connector 1 - -
6 Boom bottom cover 3 8 6
7 Arm cylinder
mounting 2 18 16
8 Boom rib plate 4 6 6
9 Boom upper cover 3 8 6
10 Boom to upper frame
connector 1 26 26
Figure 10. Comparison Between Existing Design
and Improvement Design
Finite Element Analysis Result from Design Improvement
Principal Stress and Von Misses Stress
Figure 11. Principal Stress Result of
Improvement Design Figure 12. Von Misses Stress Result of Improvement
Design
Properties Material Value
Young’s Modulus 210 GPa
Yield Stress 1000 MPa
Ultimate Tensile Stress 1250 MPa
Poisson Ratio 0.29
Density 7.473 g/cm3

44
Journal of Mechanical Engineering and Mechatronics 2020
Analysis Result from Design Improvement
From the analysis using the finite element method in design improvement and by considering the
safety factor of 3 with the aim to minimize the potential failure parts. Then the results of design
optimization can be concluded with the equation [5]:
σ_M/(σ_W ) = Factor of Safety
Data : Yield Strength Material Hardox 400 = 1000 MPa
: Max Von Misses Stress = 285 MPa
: Max Principal Stress = 322 MPa
Based on Von Misses Stress. The results are as follows:
σ_M/(σ_W )= (1000 MPa)/(285 MPa)=3.50
Based on Principal Stress. The result is as follows:
σ_M/(σ_W )= (1000 MPa)/(322 MPa)=3.10
From the results of the two equations above. By maintaining the safety factor 3, the two results
above exceed 3. This proves the design has been declared safe for use.
Fatigue Life Calculation
The purpose for cal is to predict how long the boom component can be used. Fatigue life calculation
data is taken from the analysis of design improvement results with the following data:
Stress Maximum (𝜎𝑚𝑎𝑥 ) is the stress that occurs in the boom mini excavator by being given
a workload based on the static analysis that we have determined (See figure 12).
Stress Minimum (𝜎𝑚𝑖𝑛 ) is the stress that occurs on boom mini excavator when there is no
force on the workload (only gravitational force).
Data Ultimate Tensile Stress of Material Hardox 400 is 1250 MPa
Figure 13. Minimum Stress on Improvement Design
In this fatigue life calculation, we use Goodman's theory. The following is a calculation in
determining fatigue life calculation Mean Stress (𝜎𝑚)
𝜎𝑚 = 𝜎𝑚𝑎𝑥+ 𝜎𝑚𝑖𝑛
2=
285 𝑀𝑃𝑎 + 14.2𝑀𝑃𝑎
2= 149.85 𝑀𝑃𝑎
Alternating Stress (𝜎𝑎)
𝜎𝑎 = 𝜎𝑚𝑎𝑥− 𝜎𝑚𝑖𝑛
2=
285 𝑀𝑃𝑎−14.2 𝑀𝑃𝑎
2= 135.15 𝑀𝑃𝑎
Slope (m)
𝑚 =𝜎𝑎
𝜎𝑚=
135.15 𝑀𝑃𝑎
149.85 𝑀𝑃𝑎 = 0.90
Coordinate (y)
𝑦 = 𝜎𝑒 − 𝑚 . 𝜎𝑚 = 𝑈𝑙𝑡𝑖𝑚𝑎𝑡𝑒 𝑇𝑒𝑛𝑠𝑖𝑙𝑒 𝑆𝑡𝑟𝑒𝑒
2− 𝑚 . 𝜎𝑚
= 625 𝑀𝑃𝑎 − 0.90 . 149.85 𝑀𝑃𝑎 = 490.135 𝑀𝑃𝑎 Margin of Safety (M.S)
45
Journal of Mechanical Engineering and Mechatronics 2020
𝑀. 𝑆 = 𝑦
𝜎𝑎=
483.74 𝑀𝑃𝑎
142.68 𝑀𝑃𝑎= 3.626
Fatigue Life
𝐹𝑎𝑡𝑖𝑔𝑢𝑒 𝐿𝑖𝑓𝑒 = Total life of material in cycles . (1 − (1
M.S))= 7242140 cycles
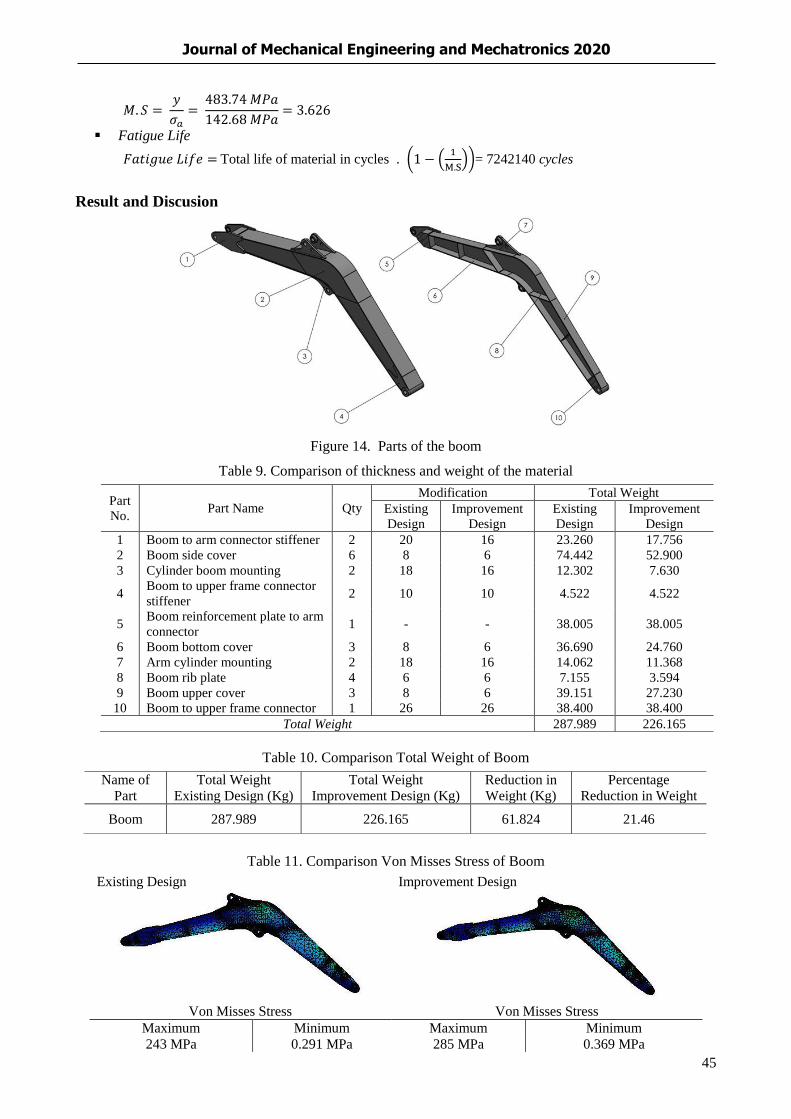
Result and Discusion
Figure 14. Parts of the boom
Table 9. Comparison of thickness and weight of the material
Table 10. Comparison Total Weight of Boom
Table 11. Comparison Von Misses Stress of Boom
Existing Design
Improvement Design
Von Misses Stress Von Misses Stress
Maximum Minimum Maximum Minimum
243 MPa 0.291 MPa 285 MPa 0.369 MPa
Part
No. Part Name Qty
Modification Total Weight
Existing
Design
Improvement
Design
Existing
Design
Improvement
Design
1 Boom to arm connector stiffener 2 20 16 23.260 17.756
2 Boom side cover 6 8 6 74.442 52.900
3 Cylinder boom mounting 2 18 16 12.302 7.630
4 Boom to upper frame connector
stiffener 2 10 10 4.522 4.522
5 Boom reinforcement plate to arm
connector 1 - - 38.005 38.005
6 Boom bottom cover 3 8 6 36.690 24.760
7 Arm cylinder mounting 2 18 16 14.062 11.368
8 Boom rib plate 4 6 6 7.155 3.594
9 Boom upper cover 3 8 6 39.151 27.230
10 Boom to upper frame connector 1 26 26 38.400 38.400
Total Weight 287.989 226.165
Name of
Part
Total Weight
Existing Design (Kg)
Total Weight
Improvement Design (Kg)
Reduction in
Weight (Kg)
Percentage
Reduction in Weight
Boom 287.989 226.165 61.824 21.46
46
Journal of Mechanical Engineering and Mechatronics 2020
Table 12. Increased of Von Misses Stress
Name of Part Maximum Von Mises Stresses Produced (MPA) Increase in
(MPa)
Percentage
Increase Existing Design Improvement Design
Boom 243 MPa 285 MPa 42 MPa 14.7
Table 13. Comparison of Principal Stress of Boom
Existing Design Improvement Design
Principal Stress Principal Stress
Maximum Minimum Maximum Minimum
248 MPa -233MPa 322 MPa - 238 MPa
Table 14. Increased of Principal Stress
Name of Part Maximum Principal Stresses Produced (MPa) Reduction
in (MPa)
Percentage
Reduction Existing Design Improvement Design
Boom 248 MPa 322 MPa 74 MPa 22.98
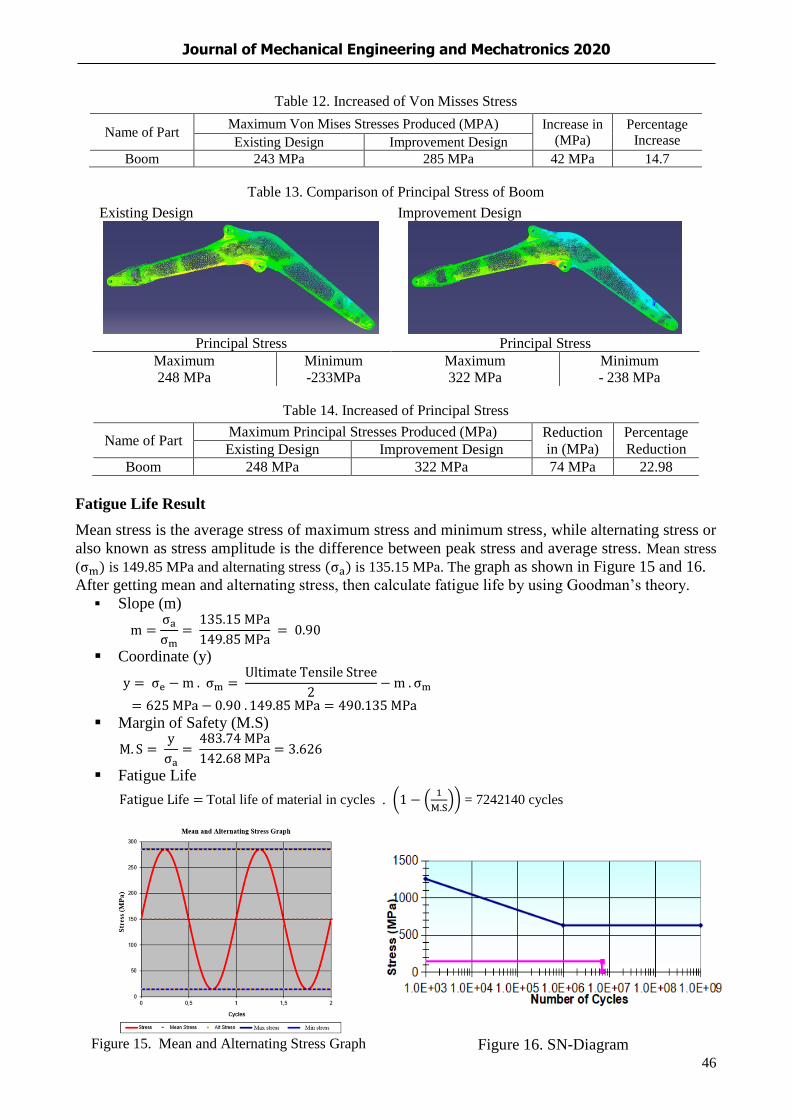
Fatigue Life Result
Mean stress is the average stress of maximum stress and minimum stress, while alternating stress or
also known as stress amplitude is the difference between peak stress and average stress. Mean stress
(σm) is 149.85 MPa and alternating stress (σa) is 135.15 MPa. The graph as shown in Figure 15 and 16.
After getting mean and alternating stress, then calculate fatigue life by using Goodman’s theory.
Slope (m)
m =σa
σm=
135.15 MPa
149.85 MPa = 0.90
Coordinate (y)
y = σe − m . σm = Ultimate Tensile Stree
2− m . σm
= 625 MPa − 0.90 . 149.85 MPa = 490.135 MPa
Margin of Safety (M.S)
M. S = y
σa=
483.74 MPa
142.68 MPa= 3.626
Fatigue Life
Fatigue Life = Total life of material in cycles . (1 − (1
M.S)) = 7242140 cycles
Figure 15. Mean and Alternating Stress Graph Figure 16. SN-Diagram
47
Journal of Mechanical Engineering and Mechatronics 2020
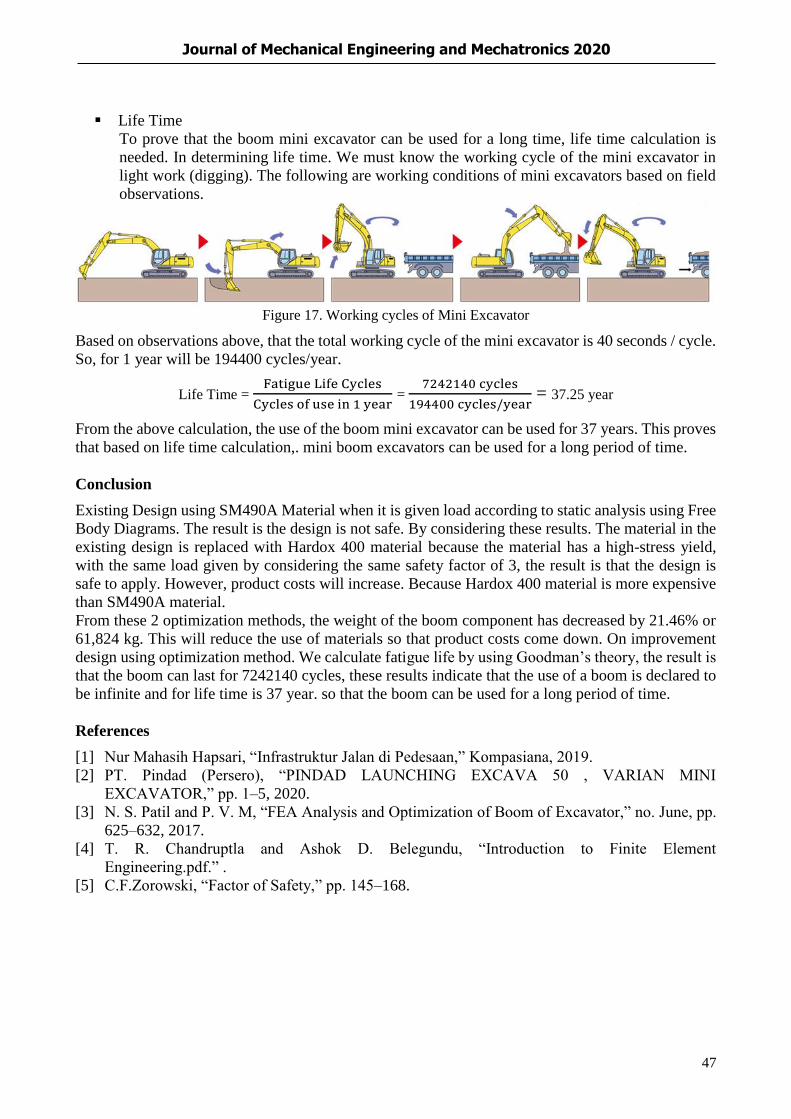
Life Time
To prove that the boom mini excavator can be used for a long time, life time calculation is
needed. In determining life time. We must know the working cycle of the mini excavator in
light work (digging). The following are working conditions of mini excavators based on field
observations.
Figure 17. Working cycles of Mini Excavator
Based on observations above, that the total working cycle of the mini excavator is 40 seconds / cycle.
So, for 1 year will be 194400 cycles/year.
Life Time = Fatigue Life Cycles
Cycles of use in 1 year =
7242140 cycles
194400 cycles/year = 37.25 year
From the above calculation, the use of the boom mini excavator can be used for 37 years. This proves
that based on life time calculation,. mini boom excavators can be used for a long period of time.
Conclusion
Existing Design using SM490A Material when it is given load according to static analysis using Free
Body Diagrams. The result is the design is not safe. By considering these results. The material in the
existing design is replaced with Hardox 400 material because the material has a high-stress yield,
with the same load given by considering the same safety factor of 3, the result is that the design is
safe to apply. However, product costs will increase. Because Hardox 400 material is more expensive
than SM490A material.
From these 2 optimization methods, the weight of the boom component has decreased by 21.46% or
61,824 kg. This will reduce the use of materials so that product costs come down. On improvement
design using optimization method. We calculate fatigue life by using Goodman’s theory, the result is
that the boom can last for 7242140 cycles, these results indicate that the use of a boom is declared to
be infinite and for life time is 37 year. so that the boom can be used for a long period of time.
References
[1] Nur Mahasih Hapsari, “Infrastruktur Jalan di Pedesaan,” Kompasiana, 2019.
[2] PT. Pindad (Persero), “PINDAD LAUNCHING EXCAVA 50 , VARIAN MINI
EXCAVATOR,” pp. 1–5, 2020.
[3] N. S. Patil and P. V. M, “FEA Analysis and Optimization of Boom of Excavator,” no. June, pp.
625–632, 2017.
[4] T. R. Chandruptla and Ashok D. Belegundu, “Introduction to Finite Element
Engineering.pdf.” .
[5] C.F.Zorowski, “Factor of Safety,” pp. 145–168.