design for automated manufacture for composite structures
TRANSCRIPT

CRANFIELD UNIVERSITY
Simon Astwood
Design for Automated Manufacture of Composite Structures
School of Aerospace, Transport and Manufacturing
PhD (Part-time)
Academic Year: 2016 - 2017
Supervisor: Professor Ashutosh Tiwari
July 2017

CRANFIELD UNIVERSITY
School of Aerospace, Transport and Manufacturing
PhD Thesis
Academic Year 2016 - 2017
Simon Astwood
Design for Automated Manufacture of Composite Structures
Supervisor: Professor Ashutosh Tiwari
July 2017
© Cranfield University 2017. All rights reserved. No part of this
publication may be reproduced without the written permission of the
copyright owner.
i
ABSTRACT
New trends in manufacturing highlight the growing use of composite materials to
produce lightweight, high performance structures. This requires the design stage
to account for complex manufacturing constraints, and as industry begins to move
towards automated manufacturing of composites, the more complex
manufacturing constraints can introduce severe limitations to the design space,
reducing the opportunity for designers to optimise a product. To address these
limitations, this research proposes strategies for implementing design for
manufacture specifically accounting for automated manufacture of composite
structures.
As a composite design develops, more detail is added, increasing the design
fidelity. Typically design for manufacturing practices are only applied when the
design fidelity is detailed enough to see individual plies. However, by
implementing design for manufacturing practice at earlier stages of the design,
when the design fidelity is low and design change is easy to implement, the
greatest performance and manufacturing gains can be achieved. This research
aims to develop a design process that uses digital technology to facilitate design
for automated manufacture for composite structures.
This research uses a systematic approach to create a generic design process
and supporting tools, capable of identifying the key manufacturing constraints,
and accounting for them at the earliest possible stages of the design. The
proposed design process uses a strategy to apply design for manufacture using
digital tools, and identifies actions required to enable automated composite
manufacturing. The development of the design process is guided by the capture
of the current industrial design practices.
The proposed process is validated through the design and manufacture of an
industrial demonstration structure, produced using an automated composite
manufacturing process. The results from validation confirm the hypothesis that it
is possible to have a generic design process to support the design for automated
manufacturing of composites components.

ii
Keywords:
Design for manufacture, automated composite manufacture, automated
deposition, DFM, FMEA, carbon fibre, design lifecycle.

iii
ACKNOWLEDGEMENTS
There are many people who have helped me realise this research, and for their
help I am immensely grateful. Firstly Domingo Ruiz and Mark Bowering, my line
managers at Airbus and the NCC who convinced me to start a PhD and made
sure that I had industrial support for the duration. Some of my friends and
colleagues have helped me along the way, notably Windo Hutabarat who was
always ready to encourage ideas, Kiran Krishnamurthy who helped me turn
sketchy concepts into well coded applications, and Ben Hopper, Tony Rudd and
Laura Veldenz who always made time for me to complain about the apparent lack
of design for manufacturing in our industry. My friend and colleague, Pablo
Bermell-Garcia has always been on-hand to challenge me to ask the right
questions, I didn’t realise it at the start, but with 6 years more experience I can
tell that he’s coached me so that I could find my own answers.
My supervisor Ash has always been able to get the best from me, and when I
started this process he was on hand to offer advice and guidance, which has not
only helped me progress through the PhD process, but also help me progress my
career and professional network. I will always be grateful for Ash’s support. In the
times when work commitments have got in the way of the PhD, and I needed help
to manage my workload, I owe thanks to Alison Starr. At a time when I was
convinced that I would have to stop, she made sure the NCC was able to support
me.
Lastly, I’ve relied on the continued support of my wife Jude. As a part-time student
with a full time job, finding time for the research and time with our family has been
at times difficult. Jude has supported me without question, and I’d never have
made it to the end without her, I owe her the most thanks of all.

iv
LIST OF PUBLICATIONS
S. Astwood, K. Krishnamurthy, and A. Tiwari, “A strategy to analyse composite designs to
improve automated production speeds,” Proceedings of the Institution of Mechanical Engineers,
Part B: Journal of Engineering Manufacture, Special Issue Article, pp. 1–8, Jul. 2016. DOI:
10.1177/0954405416660996
G. G. Lozano, A. Tiwari, C. Turner, and S. Astwood, “A review on design for manufacture of
variable stiffness composite laminates,” Proceedings of the Institution of Mechanical Engineers,
Part B: Journal of Engineering Manufacture, vol. 220, no. 6, pp. 981–992, Sep. 2016.
S. Astwood, A. Tiwari, D. Ruiz. “Optimisation of composite designs for automated manufacture”,
National Conference on Manufacturing Research (27th : 2011 : Glasgow Caledonian University),
Advances in manufacturing technology XXV : proceedings of the 9th International Conference
on Manufacturing Research (ICMR2011) : 6th-8th September 2011. [Glasgow Caledonian
University], 2011.
L. Veldenz, M. Di Francesco, S. Astwood, G. Dell, B. Chul Kim, and K. Potter, “Characteristics and
processability of bindered dry fibre material for automated fibre placement,” in ECCM17 - 17th
European Conference on Composite Materials, 2016, pp. 1–8.

v
TABLE OF CONTENTS
ABSTRACT ......................................................................................................... i
ACKNOWLEDGEMENTS................................................................................... iii
LIST OF FIGURES ........................................................................................... viii
LIST OF TABLES ............................................................................................. xiii
LIST OF EQUATIONS ....................................................................................... xv
LIST OF ABBREVIATIONS .............................................................................. xvi
1 INTRODUCTION ............................................................................................. 1
1.1 Research Context ..................................................................................... 1
1.2 Industrial Motivation .................................................................................. 3
1.3 Research aim and objectives .................................................................... 4
1.4 Hypothesis ................................................................................................ 5
1.5 Research approach................................................................................... 5
1.6 Research methodology ............................................................................. 7
1.7 Contribution to knowledge ...................................................................... 10
1.8 Thesis structure ...................................................................................... 12
2 LITERATURE REVIEW ................................................................................. 15
2.1 Survey approach ..................................................................................... 15
2.1.1 Data collection process followed ...................................................... 17
2.1.2 Table of key words used in searches ............................................... 20
2.2 Background ............................................................................................. 20
2.3 Design and manufacture of composites .................................................. 22
2.3.1 Background related to composites ................................................... 23
2.3.2 Review of composite design improvements ..................................... 23
2.3.3 Review of composite manufacturing improvements ......................... 26
2.4 DFM for composite structures ................................................................. 30
2.4.1 Background on DFM for composites ................................................ 30
2.4.2 Review of DFM for composites ........................................................ 30
2.5 Digital tools for DFM ............................................................................... 37
2.6 Systematic design processes ................................................................. 40
2.7 Key trends and research gap .................................................................. 42
2.7.1 Discussion and Assessment ............................................................ 42
2.7.2 Key trends ........................................................................................ 43
2.7.3 Gap analysis .................................................................................... 48
2.8 Concluding remarks ................................................................................ 50
3 CAPTURING CURRENT PRACTICES USING INDUSTRIAL USE CASES . 52
3.1 Introduction ............................................................................................. 52
3.1.1 Conceptual Design ........................................................................... 53
3.1.2 Preliminary Design ........................................................................... 54
3.1.3 Detailed Design ................................................................................ 54
3.1.4 Manufacture ..................................................................................... 55
vi
3.2 Methods followed to evaluate best practice ............................................ 55
3.3 Examples of DFM for composites in the aerospace industry .................. 56
3.3.1 Industrial case 1: Sizing a composite structure ................................ 56
3.3.2 Industrial case 2: Manufacturing analysis ......................................... 64
3.3.3 Industrial case 3: Design evaluation methods .................................. 71
3.4 Concluding remarks ................................................................................ 80
4 STRATEGIES TO APPLY DFM USING DIGITAL TOOLS ............................ 82
4.1 Introduction ............................................................................................. 82
4.1.1 Ply continuity .................................................................................... 82
4.1.2 Manufacturing process speed .......................................................... 83
4.1.3 Added mass ..................................................................................... 83
4.2 Methods followed to apply DFM using digital tools ................................. 83
4.3 Early lifecycle manufacturing evaluation ................................................. 85
4.3.1 Developing a ply continuity representation ....................................... 88
4.3.2 Worked example of ply continuity scoring ........................................ 93
4.4 Validation of the strategy using higher fidelity design data ..................... 95
4.4.1 Validation results .............................................................................. 96
4.5 Validation of the design using physical trials ......................................... 100
4.5.1 Definition of the physical trial coupons ........................................... 100
4.5.2 Comparison of the different methods ............................................. 102
4.6 Concluding remarks .............................................................................. 104
5 DESIGN PROCESS AND SUPPORTING TOOLS FOR DFM ..................... 106
5.1 Introduction ........................................................................................... 106
5.2 Methods followed in this research ......................................................... 106
5.3 Need for systematic design process ..................................................... 108
5.4 Design process flow .............................................................................. 109
5.4.1 Process for conceptual design ....................................................... 112
5.4.2 Process for structural sizing ........................................................... 113
5.4.3 Process for detailed design ............................................................ 115
5.4.4 Process for DFM ............................................................................ 117
5.4.5 Overall FMEA process ................................................................... 122
5.5 Overview of design step examples ....................................................... 126
5.6 Design step for minimum cut length (first example) .............................. 126
5.6.1 Minimum cut length design objective.............................................. 128
5.6.2 Minimum cut length manufacturing objective ................................. 129
5.6.3 Minimum cut length analysis .......................................................... 129
5.6.4 Example minimum cut length panel................................................ 130
5.7 Design step for short fibres (second example) ...................................... 132
5.7.1 Short fibre design objective ............................................................ 133
5.7.2 Short fibres manufacturing objective .............................................. 133
5.7.3 Short fibre analysis ......................................................................... 134
5.8 Design step for high consolidation mitigation (third example) ............... 134

vii
5.8.1 High consolidation design & manufacturing objectives .................. 136
5.8.2 High consolidation analysis ............................................................ 136
5.9 Concluding remarks .............................................................................. 137
6 VALIDATION OF PROPOSED DFM PROCESSES AND TOOLS .............. 139
6.1 Introduction ........................................................................................... 139
6.2 Selection of the use case ...................................................................... 140
6.3 Methods followed in this research ......................................................... 141
6.4 Industrial use case ................................................................................ 142
6.4.1 Material thickness and thickness laws............................................ 145
6.4.2 Minimum cut lengths ...................................................................... 149
6.4.3 Tooling design ................................................................................ 151
6.4.4 Axis system and fibre angles .......................................................... 154
6.4.5 Steering of fibres ............................................................................ 158
6.4.6 Consolidation and gaps .................................................................. 169
6.4.7 Manufactured part .......................................................................... 170
6.5 Concluding remarks .............................................................................. 173
7 DISCUSSION AND CONCLUSIONS .......................................................... 176
7.1 Research achievements ....................................................................... 176
7.1.1 Quality of research process ............................................................ 178
7.1.2 Generality of the research methodology......................................... 180
7.1.3 Applicability of the proposed design process ................................. 181
7.1.4 Achieving the research objectives .................................................. 184
7.2 Novelty .................................................................................................. 186
7.3 Key research limitations ........................................................................ 187
7.4 Future work ........................................................................................... 188
7.5 Conclusions .......................................................................................... 189
REFERENCES ............................................................................................... 193
APPENDICES ................................................................................................ 206
Appendix A Individual design steps evaluated using FMEA method .......... 206

viii
LIST OF FIGURES
Figure 1: Flowchart of research methodology, showing requirements captured from the NCC’s industrial partners ............................................................... 7
Figure 2: Venn diagram showing three initial research aspects for DFM for automated composite manufacture, and the fourth, coloured green, which emerged later in the research .................................................................... 16
Figure 3: AFP machine depositing carbon fibre tapes onto a corner laminate . 19
Figure 4: Schematic of how material is fed through a cutting knife onto a compaction roller in a typical AFP machine ............................................... 19
Figure 5: Airbus vision of the future factory including cobotic assistance and high levels of automation ................................................................................... 22
Figure 6: AFP preform with optimised fibre steering for load transfer around a feature. Corners of laminate exhibit material extensions due to minimum cut length of material, specific to the AFP process. ......................................... 26
Figure 7: Steering analysis in an AFP manufacturing simulation. Degree of steering is indicated by the colour of the fibre path. ................................... 28
Figure 8: Material selections on an early concept aircraft, percentage of total airframe mass ............................................................................................ 53
Figure 9: Schematic of preliminary design sizing process flow ........................ 57
Figure 10: A sample wing sizing table (fishtail plot), with colour coded sample section highlighted in red. Each cell identifies the minimum thickness of material required in mm. ............................................................................ 59
Figure 11: A 3D CAD representation corresponding to the wing sizing table in Figure 10, the area highlighten in red represents the sample illustrated in Figure 12. .................................................................................................. 60
Figure 12: A simplified visualisation of part of the wing sizing data .................. 61
Figure 13: Representation of SS24 and SS53 as neighbouring stacking sequences ................................................................................................. 62
Figure 14: Representation of how SS24 and SS53 merge to create an overlap .................................................................................................................. 63
Figure 15: Visualisation of additional mass added due to mismatched thickness laws ........................................................................................................... 64
Figure 16: Examples of rule 1, Symmetry ........................................................ 65
Figure 17: Examples of rule 2, balanced laminate ............................................ 65
Figure 18: Example showing SS24 and SS53 .................................................. 67
ix
Figure 19: 45 degree and 135 degree plies re-sequenced ............................... 68
Figure 20: 0 and 90 degree plies re-sequenced ............................................... 69
Figure 21: Overlap between SS24 and SS53 reduced by ply re-sequencing ... 70
Figure 22: Example ply shapes with same area but different perimeter values 72
Figure 23: Visualisation of machine motion for 0 degree Ply A ........................ 72
Figure 24: Visualisation of machine motion for 0 degree ply B ......................... 73
Figure 25: Visualisation of the machine velocity for 0 degree, ply A ................. 74
Figure 26: Visualisation of the machine velocity for 0 degree, ply B ................. 74
Figure 27: Visualisation of the machine velocity for 45 degree, ply A ............... 75
Figure 28: Visualisation of the machine velocity for 45 degree, ply B ............... 76
Figure 29: Representation of two ramp features creating a complex geometry 78
Figure 30: Cross section of two ramps, showing ideal ply conformance .......... 79
Figure 31: Roller unable to conform to geometry, leading to inadequate ply consolidation .............................................................................................. 79
Figure 32: Improve ply consolidation, but at half deposition width.................... 80
Figure 33: Translation of 2D array (a) of sizing data to a 3D ply shape model (b) .................................................................................................................. 86
Figure 34: Sample ply representation generated from laminate sizing data ..... 87
Figure 35: Schematic of NCC’s deposition machine motion ............................. 88
Figure 36: Representation of filled and empty cells .......................................... 90
Figure 37: Representation of different horizontal continuity scenarios ............. 91
Figure 38: Representation of different vertical continuity scenarios ................. 92
Figure 39: Example ply continuity calculation ................................................... 93
Figure 40: Visualisation of the AFP program simulation software being run on two different ply shapes, on a curved tool surface representative of a fuselage .................................................................................................................. 95
Figure 41: Graph showing simulated deposition rate, continuity score and complexity score per coupon ..................................................................... 99
Figure 42: Coupon 4, design lifecycle from preliminary design to manufacture ................................................................................................................ 100
Figure 43: Graphic representation of the values from Table 15...................... 103

x
Figure 44: Low fidelity generic design process compared to the higher fidelity detailed design process ........................................................................... 111
Figure 45: Process flow for the conceptual design stage of the design lifecycle ................................................................................................................ 113
Figure 46: Process flow for the structural sizing stage of the design lifecycle 115
Figure 47: Process flow for the detailed design stage of the design lifecycle . 117
Figure 48: Process flow for the first part of the DFM stage of the design lifecycle ................................................................................................................ 119
Figure 49: Process flow for the second part of the DFM stage of the design lifecycle .................................................................................................... 121
Figure 50: Schematic of the Coriolis AFP machine deposition head .............. 127
Figure 51: Examples of minimum cut length additions to diagonal plies ........ 128
Figure 52: An internal pad-up (locally thicker area) changes shape to an octagon due to MCL .............................................................................................. 129
Figure 53: Hole in fat panel - hand-layup solution .......................................... 131
Figure 54: Hole in panel - modified to suit AFP process ................................. 131
Figure 55: Material tension causing the tapes to lift ....................................... 132
Figure 56: Tape extensions around small radius to prevent tape from lifting . 133
Figure 57: Hand laminated dry-fibre preform, infused in 50 minutes .............. 135
Figure 58: AFP deposited dry fibre preform, no gaps between courses/tows, infused in 1 hour 40 minutes .................................................................... 136
Figure 59: Initial concept showing a 90 degree corner laminate with variable thickness .................................................................................................. 140
Figure 60: Schematic showing how the demonstrator can be translated into a 2D array ........................................................................................................ 146
Figure 61: Original use case concept, with hole feature removed .................. 150
Figure 62: Revised concept adjusted for minimum cut length considerations 151
Figure 63: Initial tool design............................................................................ 152
Figure 64: Illustration of tool checks in AFP programming environment ......... 153
Figure 65: Photograph of final layup and cure tool ......................................... 154
Figure 66: Fibre angles transposed onto the cap and flange faces as the designer intended (No coverage for radii) .............................................................. 155

xi
Figure 67: Divergence and convergence of fibres when the effects of the tapered radii are included ..................................................................................... 156
Figure 68: 0 Degree ply coverage showing tow dropping and convergence zone ................................................................................................................ 157
Figure 69: Geometrical features highlighted in purple where geodesic fibre paths are required ............................................................................................. 159
Figure 70: Standard fibre trajectories generated using CADFiber with two sectors ................................................................................................................ 160
Figure 71: Top view of 45 degree ply using standard fibre trajectories .......... 161
Figure 72: Metrology scan of 45 degree ply using standard fibre trajectories. Areas in red show a defect of 1.5mm thickness, and on the left side of the radius a tape can be seen lifting off the tool surface ................................ 162
Figure 73: Defects on radius caused by not using a geodesic fibre trajectory 163
Figure 74: Custom trajectories steered either side of most complex geodesic feature ..................................................................................................... 164
Figure 75: Custom trajectories for upper half of the 45 degree ply (steered either side of geodesic feature) ......................................................................... 165
Figure 76: Custom trajectories for lower half of the 45 degree ply (steered either side of geodesic feature) ......................................................................... 166
Figure 77: Metrology scan of first 45 degree ply using customised fibre trajectories. Gaps between courses can be seen coloured grey or blue. 167
Figure 78: Photograph of 45 degree ply using customised fibre trajectories .. 168
Figure 79: 135 degree ply using custom fibre trajectories .............................. 168
Figure 80: Steered 90 degree fibres with additional gaps on tapered radius .. 170
Figure 81: Photograph of use case demonstrator laid up as a dry fibre AFP laminate ................................................................................................... 172
Figure 82: Photograph of use case demonstrator laid up as a dry fibre AFP laminate ................................................................................................... 173
Figure A-1: Illustration of a typical gap between two surfaces ........................ 207
Figure A-2: Overlap of a surface, causing surface offset failure ..................... 207
Figure A-3: Producibility analysis used to check the location of the rosette and seed point. Areas in red exceed the permitted angular deviation ............ 209
Figure A-4: Table of ply data including location in laminate, material, stagger and orientation ................................................................................................ 215

xii
Figure A-5: Minimum cut length added to diagonal plies ................................ 219
Figure A-6: An internal pad-up (locally thicker area) changes shape to an octagonal profile when minimum cut length is added. This may have been a round or square patch in the original design ............................................ 219
Figure A-7: Comparing a programmed trajectory to the design intent ............ 223
Figure A-8: Steering trials used to establish the steering limit radius for a specific material and AFP machine ...................................................................... 224
Figure A-9: Manufacturing tolerance associated with AFP process causing tow-gap defects .............................................................................................. 226
Figure A-10: Three default options for terminating an AFP course when it is not parallel or perpendicular to the ply boundary ........................................... 227
Figure A-11: Graphic representation of same ply orientation (red) being staggered throughout the laminate .......................................................... 229
Figure A-12: Simulation testing reach of AFP machine for virtual tool. The program generated will only work if the AFP machine can reach the tool when it is datumed in the cell in real-world. ....................................................... 234

xiii
LIST OF TABLES
Table 1: Keywords used in literature searches ................................................. 20
Table 2: General composites research articles ................................................ 21
Table 3: Design and manufacturing of composites articles classified by method and problem ............................................................................................... 29
Table 4: DFM for composites research classified by tool and problem ............ 36
Table 5: Digital tools for DFM classified by tool method and tool objective ...... 40
Table 6: Description of expert support .............................................................. 43
Table 7: Expert questions ................................................................................. 43
Table 8: DFM articles and the span of the design lifecycle they address. Colour coded red for single stage, through to dark green for full lifecycle. ............ 45
Table 9: Digital tools for DFM research, software described and validation method .................................................................................................................. 47
Table 10: Research gap and supporting data .................................................. 50
Table 11: Components of machine time calculation for Ply A vs. Ply B ............ 77
Table 12: Coupon shapes based on 45 degree ply .......................................... 97
Table 13: Simulation results for 4 coupons ...................................................... 98
Table 14: Table showing stages of design for each coupon ........................... 101
Table 15: Results from physical trials compared with simulation and continuity scores ...................................................................................................... 102
Table 16: Experts used for FMEA process ..................................................... 110
Table 17: FMEA for the first 7 design steps.................................................... 122
Table 18: FMEA for design steps 8 to 15 ....................................................... 123
Table 19: FMEA for design steps 16 to 22 ..................................................... 124
Table 20: FMEA for design steps 23 to 28 ..................................................... 125
Table 21: Sub-sections of use case and the steps of the design process they address .................................................................................................... 143
Table 22: Descriptions of how each research step was applied ..................... 144
Table 23: 2D array showing the target material thinesses for the concept ..... 147
Table 24: 2D array showing the target thickness laws for the concept ........... 147
xiv
Table 25: 2D array of new material thicknesses, modified at preliminary design stage ........................................................................................................ 148
Table 26: 2D array of new thickness laws, modified at preliminary design stage ................................................................................................................ 148
Table 27: Influence of the design process on the use case component ......... 171
Table 28: Achievement of research objectives ............................................... 177
Table 29: Validation of the research outcomes .............................................. 180
Table 30: Adoption of research in industry ..................................................... 183
Table 31: Research objectives and descriptions how they have been achieved ................................................................................................................ 184
Table 32: The main research contributions, use cases and associated timescales ................................................................................................................ 185

xv
LIST OF EQUATIONS
Equation 1: Maximum number of adjacent same-orientation plies ................... 66
Equation 2: Ply continuity score for filled cells .................................................. 89
Equation 3: Ply continuity score for empty cells ............................................... 89
Equation 4: Ply continuity score total ................................................................ 89
Equation 5: Formula for two adjacent empty horizontal cells ........................... 91
Equation 6: Formula for two adjacent filled horizontal cells .............................. 91
Equation 7: Formula for different horizontal cell occupancy ............................. 91
Equation 8: Formula for two adjacent empty vertical cells ................................ 92
Equation 9: Formula for two adjacent filled vertical cells .................................. 92
Equation 10: Formula for different vertical cell occupancy ............................... 92
Equation 11: Equation to calculate ply continuity score as a percentage ......... 93
Equation 12: Ply complexity equation ............................................................... 94
Equation 13: Ply evaluation for ply A ................................................................ 94
Equation 14: Ply evaluation for ply B ................................................................ 94

xvi
LIST OF ABBREVIATIONS
AFP Automated Fibre Placement
AR Augmented Reality
ATL Automatic Tape Layer
CAD Computer Aided Design
CFRP Carbon Fibre Reinforced Plastic
DFM Design For Manufacture
DFX Design For X, (where ‘X’ could be any process)
FE Finite Element
FEA Finite Element Analysis
FMEA Failure Mode Effect Analysis
FRP Fibre Reinforced Plastic
GFRP Glass Fibre Reinforced Plastic
HiVol High Volume
KBE Knowledge Based Engineering
MCL Minimum Cut Length
MDO Multi-Disciplinary Optimisation
MDOW Multi-Disciplinary Optimised Wing
mPDA Manufacturing Ply Design Analysis tool
NC Numerical Control
NCC National Composites Centre
NGCW Next Generation Composite Wing
NSGA-II Non-dominated Sorting Genetic Algorithm, version 2
PACKS Parametric Composite Knowledge System
Pre-Preg Pre-Impregnated material, a type of composite material
RTM Resin Transfer Moulding
XWB eXtra Wide Body

1
1 INTRODUCTION
1.1 Research Context
The aerospace industry is looking towards composite materials as a potential
way to reduce aircraft operating cost and improve aircraft performance [1], [2].
The benefits of composite materials such as carbon fibre reinforced plastic
(CFRP) enable designers to engineer structures with low mass, reduced part
count and with greater flexibility to tailor the structural performance of each
composite laminate [3]. However, the use of composite materials for the
manufacture of complex products such as an aircraft primary structure, require
the designer to account for specific material and manufacturing limitations when
the design is created. The design decisions made during aircraft conceptual
design often fail to consider the impact that the decisions have on the
component manufacture [4], and in many cases, when the design objectives
have been set for aircraft performance, many of the solutions produced are
unsuitable for real-world manufacturing [5]. The disconnect between concept
design and manufacturing of composites is so great, that approximately 80% of
the manufacturing costs are fixed based on the design decisions made at the
conceptual design stage for a composite component [6].
The trend of changing from metallic structures to composite structures which
are made using automated methods, together with the knowledge gained by the
author as a result of working for an aerospace research organisation, led to the
identification of some major risks for the future of automated composite
manufacturing.
The first major risk identified is the threat of too many manufacturing-critical
design decisions being made at the early concept stages of the design, without
the consideration for manufacturing. As the design maturity increases, it
becomes increasingly difficult to implement design changes without affecting
component performance or cost [6].
The second risk identified is based on the reliance of digital tools to aid design.
The use of these tools enables designers to optimise or improve the component

2
design with key objectives in mind, but they require user input to utilise
manufacturing intelligence to ensure that manufacturing best practices are
accounted for [7].
A third risk is that the existing methods and tools used by designers are either
biased towards metallic manufacturing processes, or do not adequately
consider composite manufacturing, making them misleading. This results in the
existing tools being too specific for a component or too generic in their approach
[8].
Design for manufacture (DFM) has traditionally been used to describe the
process of considering the manufacturing constraints of a particular production
process when creating the design, to ensure successful, or improved production
of the component. The DFM process requires the manufacturing constraints to
be known at the time that the design is created, and this creates two challenges
for composites which are linked to the identified risks:
Designing for new or novel manufacturing processes: If the design
is using a new or novel manufacturing material or process, and the
manufacturing constraints are not fully understood, how can DFM be
successfully implemented? A systematic approach to evaluating the
manufacturing challenges and then applying the findings to a design is
required.
Best practice for the use of digital tools: If the digital tools used to
create the design are derived for use with a different material or process,
how can they be adapted or used successfully with the new material or
process? A strategy for using digital design tools in the context of DFM
is required.
The research interest in this thesis is to define a design process that will allow
designers to follow a design for manufacture approach to designing composite
structures for automated manufacture, and other novel manufacturing
processes. The focus of this thesis will follow:

3
The best practice for designing for the automated composite
manufacture.
The methodological support needed to adopt a systematic approach for
using digital tools and DFM best practices when designing for automated
composite manufacture.
1.2 Industrial Motivation
Within the aerospace industry the adoption of composite materials has
increased, and aircraft like the Airbus A350 XWB and the Boeing 787
Dreamliner now utilise CFRP for the main wing and fuselage primary structures
[9]. Within Airbus, several research programs focused specifically on the use of
CFRP to achieve aircraft performance improvements and also reductions in
production costs. This thesis was motivated by two Airbus research
programmes in particular:
The Airbus HiVol wing research programme evaluated the effects of high-
volume production of a CFRP wing [10]. The programme designed a CFRP wing
which was manufactured using automated fibre placement (AFP) in a
configuration which combined several primary structures into one single
component, enabling fewer fasteners to be utilised. The research objective was
a design and a manufacturing process that could facilitate a production rate of
80 composite wings per month, while the fastest composite production process
at the time was the A350 XWB, which was targeting a production rate of 26
composite wings per month. The results of HiVol showed that the design was
not able to be produced at the required manufacturing rate, and a number of
design features had to be re-designed just to facilitate the automated
manufacturing process.
The Airbus MDOW programme, Multi-Disciplinary Optimised Wing, was a
research programme with the objective of rapidly creating and then evaluating
aircraft conceptual designs [11]. The programme focused on the theoretical
introduction of a new single-aisle aircraft which would be sold in high numbers
with a large profit margin. The automated composite manufacturing process

4
needed to be modelled in a digital tool that could evaluate the manufacturing
complexity and indicate the manufacturing cost of a conceptual design. The
programme successfully reduced the evaluation of a concept aircraft design
from 4 months to 24 hours, which enabled Airbus to evaluate significantly more
concepts prior to selecting a design configuration for detailed design, and
enabled a number of manufacturing constraints to be applied to aircraft designs
at a conceptual stage in the design lifecycle.
Both research programmes highlighted the role that DFM plays in the
development of a new aircraft design. The MDOW program highlighted how
difficult it is to digitise manufacturing constraints and apply them to a low fidelity
design, which is a real-world challenge for anyone looking to influence the 80%
of manufacturing costs locked at that low-fidelity conceptual design stage. The
HiVol program served as a practical reminder that manufacturing constraints
need to be accounted for if the design is going to be manufactured, and that
manufacturing speed is directly influenced by design features.
In summary, the lessons learned from these two industrially led research
programmes have provided an ideal platform to establish a process for DFM for
automated composite manufacturing, and in parallel have provided sufficient
complexity to highlight some of the barriers faced in industry to adopting DFM
successfully. Because DFM has not adequately been implemented in previous
composite aircraft programmes, there is now a significant interest from
aerospace companies in the methodology of how to exploit DFM successfully
for composite structures. This thesis aims to contribute to this requirement by
building further understanding of the role of automated composite
manufacturing constraints in the DFM research literature.
1.3 Research aim and objectives
The aim of this research is “to develop a generic process that uses digital
technology to facilitate design for automated manufacture for composite
structures”. A list of specific objectives which are required to fulfil this main aim
are:

5
1. Capture the state of the art for DFM of composites using digital
technologies.
2. Capture the current industrial design practices using use cases for
composite structures.
3. Develop strategies for applying DFM best practice through the use of
digital tools.
4. Develop a generic process and supporting tools to systematically apply
DFM for automated composite manufacture.
5. Validate the proposed DFM tool kit using a design use-case described in
section 1.6 “Research Methodology”.
The two industrial research projects identified in section 1.2 would have
benefited from the correct use of digital tools and a more systematic approach
to accounting for manufacturing constraints. The first two objectives will help to
explore the context of the research problem in greater detail, while objectives 3
and 4 aim to provide a better process for engineers to follow to ensure that all
of the relevant DFM questions are asked at the correct stage in the design
lifecycle.
In conjunction, all of the objectives can be combined to demonstrate true DFM
for automated composite manufacture.
1.4 Hypothesis
The achievement of the research objectives will confirm the hypothesis that it is
possible to have a generic design process to support the design for automated
manufacturing of composites components.
1.5 Research approach
The author has researched this topic on a part-time basis while being full-time
employed by a research organisation, specifically tasked with researching the
overall theme of this thesis. The research methodology therefore reflects an
action-research approach, being initiated by industry to address a known
problem, and featuring elements of both participation research and practical
research enabling a solution to be created.

6
In this research, design is fundamentally considered to have a lifecycle, starting
with the formation of an idea, and progressing as the idea develops an identity
in the format of a design, increasing in maturity and fidelity as it develops
towards a physical manufactured product. When the whole lifecycle of a design
is considered, the notion of considering the final manufacturing constraints at
the early stages in its lifecycle, or maturity, while all the design freedom is yet to
be narrowed down, is often considered impractical. Yet failure to properly
account for essential constraints routinely causes unwanted design evolution
later in the design lifecycle and often at great cost. It is therefore important to
consider the validity of any DFM action for a given point in the design lifecycle,
so that it is not being applied infeasibly early, or impractically late in the designs
maturity.
Being able to ensure that an engineer applies DFM best practice at the right
stage in the design lifecycle is challenging. The challenge increases when the
DFM best practice itself is not adequately documented, or the manufacturing
process is novel or not fully understood.
In order to address the challenges around the design lifecycle and the
application of DFM for automated composite manufacture, the research focuses
on three key areas:
Understanding the problem and finding or defining the right DFM best
practice. Linked to objectives 1 and 2.
Establishing where in the lifecycle to get the most value from it, and how
to apply it to the design. Linked to objectives 3 and 4.
Validate the proposed process and quantify the benefits. Linked to
objective 5.
Consequently, it is important to be able to compare the research findings from
published literature with use-cases from industry to evaluate how the research
findings can be industrialised.

7
1.6 Research methodology
The proposed research methodology follows an eight step approach: Problem
description, literature review, research gap analysis, industrial best practice
review, strategy development, use case validation, conclusions and discussion.
Problem Description
Airbus Research Requirements
Literature Review
Research Gap Analysis
Industrial Practice Review
Design Process Development
Use Case Validation
Discussion & Conclusions
BAE Systems industrial practice
Airbus industrial practice
BAE Systems Requirements
Airbus Requirements
GKN Requirements
QinetiQ Requirements
GE Aviation Requirements
Rolls Royce Requirements
Leonardo Helicopters
Requirements
Figure 1: Flowchart of research methodology, showing requirements captured
from the NCC’s industrial partners
Problem description: At this stage the research problem is defined. The
definition focuses on a set of industrially based design challenges that
have manifested in the aircraft design research programmes at Airbus.
Two factors influenced the selection of the problem description. Firstly,
Airbus commissioned this research as an industrially sponsored activity
provided that the problem description was of interest to the business.
Secondly, the UK’s Technology Strategy Board launched two key
collaborative research projects, described in section 1.2, which enabled
the problem description to be aligned with ongoing research
programmes.

8
Literature review: This stage evaluates the published literature
investigated under three main research themes: Design or Manufacture
of composite structures, aiming to identify key design or manufacturing
best practice related to composite structures. This search string was
chosen because existing research focusing solely on design can impact
manufacturing, and research focusing on manufacturing often relates to
the design. The intention of this search was to return articles that may
offer insight into DFM, but without necessarily identifying themselves as
DFM articles. DFM of composite structures was used as the second main
search string, aiming to identify research which specifically targets DFM
principles associated with composites that consider both design and
manufacturing phases of the lifecycle. This search is intended to return
articles that identify themselves as DFM focused rather than the articles
from the first search which made no claim to focus on DFM. The third
main search string was digital tools to support DFM, which identifies
design tools that have been reported in literature as being used for DFM,
albeit not specifically for composite structures. The intention of this
search was to target DFM articles that describe digital tools rather than
DFM articles that describe processes because the industrial
requirements to use DFM dictate the use of digital tools. The articles
returned should therefore incorporate research into the practicalities of
adopting DFM for a digitised design lifecycle. The results from these
research themes are compared to highlight research trends based on the
topics that link to the industrial motivation. The research is conducted by
using several research search tools described in section 2.1.1, and
varying the main search strings to account for alternative spelling and
terminology as described in section 2.1.2.
Research gap analysis: This stage evaluates the information found in
the literature review to highlight evidence of the main research issues,
resulting in the identification of a research gap. The research gap from
literature is then assessed by a group of industrial experts to further
consolidate the research gap identified, and suggest opportunities and

9
priorities for the development of a strategy. A visual way of identifying the
research gap was implemented, using comparative matrices to highlight
what topics each research article covered relative to the research
classifications. This approach was chosen because it quantified the key
trends by counting the relevant articles. The decision to involve industrial
experts was based on a requirement to peer review any key research
conclusions at this stage in the research.
Industrial practice review: In order to capture the methods, tools and
knowledge residing in industry, which have not been published in
literature, the industrial best practice for designing composite structures
for automated production are recorded and discussed. The industrial
practice first had to be identified, and then reported. To enable this,
several use cases were designed based on industrially relevant content
generated in a number of different Airbus research programmes. These
use cases are used to explain and demonstrate key industrial practices
relating to the design and manufacture of composite structures. The use
cases are provided in section 3.3.
Design process development: At this stage, the methods, tools and
decision guidance required to achieve the research aims were
developed. To start with, a systematic approach for analysing the design
steps was required, enabling a uniform and consistent system to query
each design step. The formation of the design guidance was aided by
progressing through the entire design lifecycle, resulting in a detailed
process flow that audits the decisions and manufacturing knowledge
required to successfully implement a DFM approach. During the
development of a generic design process, additional searches of
previously published literature were carried out to identify any useful
approaches for assessing the design lifecycle in a systematic fashion.
This loop back to the literature review is illustrated in Figure 1.
Use case validation: In order to comprehensively test the DFM strategy
and the generic process flow, an industrial use case was created. The
use case embodies the key characteristics of multiple aerospace and

10
automotive composite structures, with features specifically chosen to
highlight the challenges of producing composite structures using
automated technology. The use case component is taken from
conceptual design, through to physical manufacture using an automated
fibre placement machine (AFP), allowing the proposed DFM strategy to
be validated. The use case component design and manufacture was
funded by the National Composites Centre (NCC), as part of a
collaborative research program with a number of OEM and tier 1
aerospace businesses. Each of the businesses was required to propose
geometrical features and manufacturing parameters that represented a
challenge to their business. The helped to ensure that the design features
were industrially relevant, and representative of realistic industrial
challenges. By selecting this use case it is possible to address the
requirements of several leading aerospace businesses. Throughout the
design and manufacture of the use case component and sub-scale trials
the progress was reported to the NCC and the collaborative research
businesses to enable review and feedback to be incorporated.
Discussion & Conclusions: Upon successful validation of the use case,
the conclusions and discussion were reported. This stage discusses the
research key findings and evaluates the quality and applicability of the
results. In these sections, the limitations of the research are discussed
and the next steps for the research suggested,
1.7 Contribution to knowledge
This research describes the process of designing a composite structure so that
automated manufacturing can be utilised, and it proposes a systematic process
that engineers can follow to guide them through the application of DFM when
dealing with a novel manufacturing process. The contribution to knowledge
occurs in two key areas:
1) Capturing and recording industry practice for DFM of composite
structures for automated manufacturing. The process flow and detailed
design steps for creating manufacturable designs has not been

11
sufficiently recorded in published literature. A number of previous
research articles describe DFM for composites specifically around
isolated design activities, or specific manual manufacturing processes,
however these articles do not cumulatively describe all of the DFM design
steps needed to manufacture a composite structure, and existing articles
cannot be combined to describe how to design for an automated
composite production process. This will be the first time that the state of
the art for DFM of composite structures for automated manufacturing has
been recorded.
2) Defining a generic design process for applying DFM to the design
lifecycle when the manufacturing process is not mature. This research
delivers a process which engineers can follow when they are responsible
for creating a design, but do not have sufficient manufacturing knowledge
available to them. The process will prompt them to identify the key
manufacturing constraints sufficiently early in the design lifecycle.
This will be the first time that the application of DFM for automated
composite manufacturing has been recorded in sufficient detail to enable
a generic design process to be described.
As a result, this research enables engineering design teams to:
Identify key manufacturing constraints: by following a systematic
approach to evaluate the manufacturing process relative to the design
steps.
Implement DFM for automated manufacture of composites: by
following the design process flow provided.
Improve the manufacturability of a composite design: by
understanding how the design decisions influence the manufacturing
process.
Digitise tools to improve manufacturability: by quantifying what
constitutes good composite manufacturing and embedding the
knowledge within digital design tools.

12
1.8 Thesis structure
This section summarises each chapter of the thesis to enable the reader to
understand and navigate the document.
Chapter 1: Describes the challenges faced by engineers in industry
aspiring to apply DFM to composite designs which are destined for
automated manufacture. The chapter describes the hypothesis on which
the research is based, the research aims, objectives and approach
required to address these research aims, and also the research
methodology. The chapter concludes with a definition of how the
research is contributing to knowledge.
Chapter 2: Describes the literature survey carried out to establish the
state of the art for composite DFM. The chapter breaks the literature
survey into three main sections, design and manufacturing of
composites, design for manufacture of composite structures, and digital
tools for DFM. The research trends are discussed and the research gap
identified is proposed.
Chapter 3: Describes industrial practice captured by the author while
working on the development of a number of composite aircraft
programmes. The chapter uses industrial use-cases to demonstrate the
design practices for several stages of the design lifecycle specifically
focusing on the sizing of a composite structure, the manufacturing
analysis performed and the design evaluation methods.
Chapter 4: Describes the strategies that can be used to apply DFM using
digital tools. The chapter describes several methods for evaluating a
preliminary design such as generating a ply continuity score and a ply
complexity score. The methods are described using industrial use cases,
and the methods are tested and validated on four sample composite
coupons which are evaluated as preliminary designs, then detail-
designed, manufacturing process simulated and then finally physically
manufactured using an AFP machine. The cycle times of the simulation
and physical manufacture are compared to the design evaluation scores
generated from the preliminary design to validate the approach.

13
Chapter 5: Describes the design process and supporting tools for
applying DFM. The chapter describes how a systematic approach to
control the ambiguity of conflicting design and manufacturing objectives
is required, and proposes the use of a failure mode, effect analysis
approach, FMEA. The proposed design method is described as a
process flow, as a table of discrete design steps and then in detail for
three use cases specific to composite structures being manufactured
using an AFP machine: The first use case example is a flat panel with a
pad-up of increased material thickness surrounding a hole, with the AFP
manufacturing constraint of minimum cut length applied. The second use
case looks at the effects of short fibres on a corner laminate. The third
use case focuses on the manufacturing problems that the AFP process
causes when an area of the laminate is over-consolidated, and how the
design can be adapted to reduce the effects of this problem.
Chapter 6: Describes the use case and validation exercises carried out
to support this thesis. The chapter describes an industrial demonstration
component as a use case. The component is taken through the entire
design lifecycle from a conceptual design through to a physically
manufactured structure using the dry-fibre AFP manufacturing process.
The design process and digital tools described in previous chapters are
used to ensure a design for manufacture approach is adopted for all
stages of the design. At each design stage, the manufacturing
intelligence added by the proposed design process is identified and the
benefits are described.
Chapter 7: Describes the discussion and conclusions based on the
research results. The chapter describes the research achievements,
including research quality, generality and applicability achieved. The key
research limitations are identified, and future work is proposed. The final
section concludes how the original industrial motivations have been
addressed with this research.

14
Chapter 8: Lists the additional information provided in the appendices.
The generic design process described in chapter 5 is broken into each of
the individual steps, which are described in detail as they were evaluated
using the FMEA technique.

15
2 LITERATURE REVIEW
This chapter contains the literature survey which was carried out to understand
the state of the art for composite structure design and manufacturing. The
literature reviewed varied greatly in the degree of application achieved, with
some articles focusing on very narrow segments of the design lifecycle, and
others covering multiple lifecycle stages. Since the challenges described in
section 1.1 appear to propagate in the early stages of the design lifecycle but
manifest in the later stages, special attention was paid to research that spanned
multiple design lifecycle stages.
The literature review has focused on the existing contributions to knowledge in
the field of DFM for automated composite production, and also on the
contributions to knowledge of other research in different domains which could
potentially be applied to DFM for automated composite production.
The literature review is presented as a series of comparisons between the
research theme and the way in which it could potentially be applied to address
the research aims.
This chapter is structured to start with a description of the survey approach used
in section 2.1, a description of the background or theoretical foundations of the
review in section 2.2, then in section 2.3, 2.4 and 2.5 the key research findings
are presented, with an analysis of how these findings influence this research
work. The identification of the research gap is described in section 2.7. The
concluding remarks are addressed in section 2.8.
2.1 Survey approach
The initial research scope was generated by the author based on three risks
that were identified in section 1.1. This led to three areas of initial interest, and
a fourth risk was identified later in the research. These risks are illustrated in
Figure 2:

16
1) Research related to the design or manufacture of composite structures,
2) Research related to DFM processes and,
3) Research into the use of digital tools to aid DFM.
4) Research related to the systematic approach required to evaluate a
design
Figure 2: Venn diagram showing three initial research aspects for DFM for
automated composite manufacture, and the fourth, coloured green, which
emerged later in the research
A fourth area of interest emerged after the initial research scope had been
fulfilled, when a systematic approach was required to apply a DFM approach to
a new composite structure design. This area of interest is described in section
2.6.
Context was required so that the relevance to both the industrial motivation and
research problem could be discussed, and this formed the research background
upon which the research key trends could be established.

17
By analysing the trends in the reviewed research, the research gap analysis
was carried out. This indicated both where further research was required, and
also where existing research could be utilised to help deliver the research
objectives.
The literature searches were carried out predominantly using the Scopus
research search tool, but supplemented with information obtained using Google
Scholar and unpublished research libraries found at Airbus Group and at the
National Composites Centre.
2.1.1 Data collection process followed
The literature search was carried out using two main techniques. Firstly, a
structured literature search was carried out using a variety of external databases
such as Scopus, Science Direct, Sage and Google Scholar. Google web search
was also used to provide press articles relating to industrial tools and processes.
These web based articles were identified by searching for the tools and
processes described in journal and conference articles. The second technique
was less structured, with references and citations made within interesting
papers being investigated as potential sources of relevant material. In addition,
articles that the author uncovered during the course of daily work at Airbus
Group Innovations and the National Composite Centre were included if they
contributed to the research scope.
The search was started by defining a set of keywords which support the
research scope. These keywords were used in the initial phase of the search,
such as “Design for Manufacture of Composites” and “Digital tools for DFM”.
These initial searches returned a large number of results, and to facilitate the
discovery of significant articles, several additional searches were carried out
using combinations of associated keywords.
For instance, a Scopus search for “Design and Manufacture of Composite
Structures” carried out in 2012, returned 1058 articles. Removing the key word
“structures” increased the number of results to 2752. To improve the
significance of the search results a number of search filters were applied.

18
Excluding non-relevant sectors such as medicine and biology, only displaying
conference papers and journal articles, and filtering to only return English
language articles reduced the search to 797 results.
When manually screening the search results, which have already been ordered
by relevance, it became clear that for almost all cases the relevance
deteriorated beyond the point of interest after approximately 400 articles. For
instance, titles that clearly identified a topic that was not of interest, such as
“Stress analysis in ceramic inlays restored premolars” appearing after 200
articles in the results list, could be rejected as too specific without the need to
read the abstract or full paper. Whereas “Object-oriented implementation of an
integrated design and analysis tool for fiber placed structures” by Schueler, K.&
Hale, R. [12], appears relevant to the research scope and the abstract described
a project very similar to an Airbus industrial project initiated in 2012.
Only articles with relevant content were stored and classified in any of the
comparison matrices presented in this thesis. Content which relates to the
automated deposition process and associated design implications is very
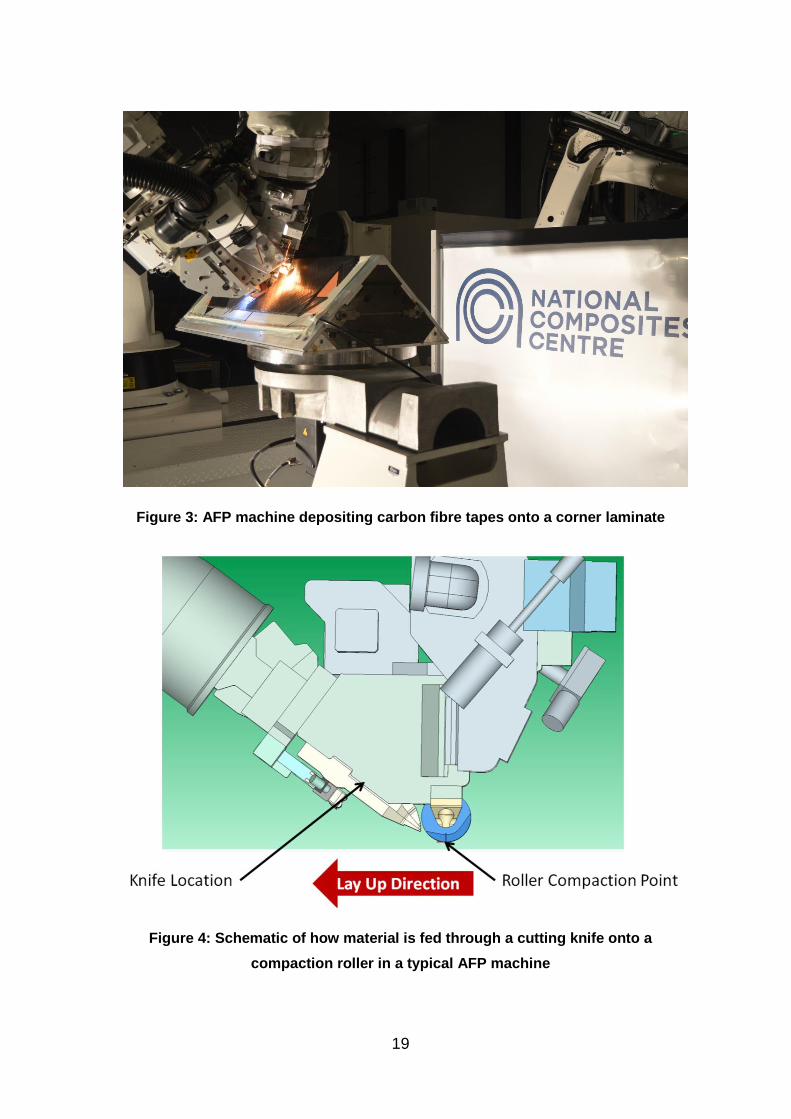
relevant, and an example is illustrated in Figure 3. The automated deposition
process illustrated is automated fibre placement (AFP), and strips of composite
material referred to as tows, are fed onto a comformable compaction roller. The
roller position and behaviour is numerically controlled. The material is delivered
to the compaction roller through a cutting system, enabling the material
deposited to be cut to suit the design. This is illustrated in Figure 4.
19
Figure 3: AFP machine depositing carbon fibre tapes onto a corner laminate
Figure 4: Schematic of how material is fed through a cutting knife onto a
compaction roller in a typical AFP machine

20
2.1.2 Table of key words used in searches
Table 1 presents keywords used in the searches described in sections 2.3, 2.4
& 2.5.
Table 1: Keywords used in literature searches
Keywords
Design and Manufacture of Composites Composite Design, Composite
Manufacturing, Composite Structures,
Carbon Fibre Reinforced Plastic, Fibre
Reinforced Plastic, Glass Fibre Reinforced
Plastic
DFM for Composite Structures Design for Manufacture, DFM, Composite
Structures, Design for X
Digital Tools for DFM Design Software, Multi-Disciplinary
Optimisation, Composite Manufacturing
Constraints, Design Rules
2.2 Background
This section presents a review of the initial background research gathered
before focusing on the more specific topics identified in section 2.1. In the search
for research in the field of composite structural design, a number of articles that
had been commissioned by software vendors were identified. These articles
proposed a market study or case study in which their product was compared to
other available solutions, and typically concluded that their own product was
addressing a niche composite design problem. After initially dismissing these
articles as too biased, and lacking peer review, two interesting points became
evident:
1) The majority of the articles either compared automated composite
manufacturing processes, or compared the application of composites
materials as a design improvement.

21
2) The age of the articles suggests that automated composite production is
the longest running theme, with multi-objective optimisation becoming a
trend in 2009, and the most recent articles describing an industry shift
from metals to composite materials.
These two basic points reinforce the objectives of both the HiVol project and the
MDOW project described in section 1.2, highlighting that the aerospace industry
is moving away from metallic structures in favour of composite materials, and
that both design optimisation and automation are going to be important in future
aircraft designs. The articles are tabulated in Table 2 to highlight the distribution.
Table 2: General composites research articles
Type of
Article
Article Topic
Comparison
of Digital
Tools
Exploitation
of
Optimisation
Application
of
Composite
Materials
Comparison
of
Automated
Processes
Market
Study [13] [14] [15] [16]
[17] [18] [19]
[20] [21]
Case Study [22] [23] [24] [25] [26]
A recent article presented by the Vice President of Research & Technology at
Airbus, Jens Gralfs [27], clearly explains the vision of how Airbus intend to use
automated manufacturing technologies and highly digitised applications to
produce their future aircraft. As part of this presentation, Jens highlights the
trend in manufacturing rate of an aircraft increasing, but the cost decreasing,
enabled by a combination of design for higher rate manufacture, and also the
development of better digital tools and autonomous manufacture. This vision is
illustrated in Figure 5, showing automated mechanical aids, cobot robots who
can work cooperatively with workers and wearable technology.

22
Figure 5: Airbus vision of the future factory including cobotic assistance and
high levels of automation
Further research into the specific fields of design and manufacture of
composites, DFM for composite structures and the digital tools used was
required to identify the state of the art already established. Cumulatively, these
research topics all contribute towards enabling DFM for automated manufacture
of composites. The Venn diagram illustrated in Figure 2 shows these three
research search themes, with the central overlap representing the area of
specific interest.
2.3 Design and manufacture of composites
This section provides the reader with a better understanding of the existing
research which focuses on the design or manufacture of composites, where a

23
potential improvement to the design or manufacturing part of the lifecycle is
described. The nature of the proposed improvements in these articles can be
compared to identify the research trends, whilst also gathering ideas for
managing the improvements.
2.3.1 Background related to composites
Composite materials are not considered to be isotropic like metallic and plastic
materials, and their internal structures can be biased to perform and behave
differently in different directions. From a design perspective, this enables a
designer to exploit the non-isotropic properties to better address the design
intent, but from a manufacturing perspective, the additive way in which the
material is constructed, typically increases the manufacturing complexity. An
example of this is shown in Figure 6 which shows a composite laminate that has
fibres steered around a feature to improve load bearing performance.
The design articles and the manufacturing articles can therefore be separated
into two groups. The design articles address the practicalities of how to exploit
the composite materials to improve the design performance, and the
manufacturing articles address the challenges associated with producing
designs from composite materials.
2.3.2 Review of composite design improvements
The research identified for the topic of composite design improvements fell into
four main themes: Optimising designs for vibration characteristics, optimising a
design to reduce uncertainty, addressing the needs of physical testing to
validate a design, and a more general theme around general design
optimisation which included topics like topology optimisation, structural
optimisation and aerodynamic optimisation.
Optimisation of vibration characteristics: One article was found which
described the benefits of using composites in conjunction with metals to create
hybrid structures [28]. In the article, the benefits of a low-mass machine tool that
damps vibration during the cutting process are described, with the low-mass
and high stiffness qualities being achieved through the application of composite

24
materials. Whilst not strictly related to the aerospace industry, this article drew
some very useful conclusions about the vibration damping characteristics of
composite materials which may need to be considered when designing a
composite structure.
Optimising to reduce design uncertainty: Two interesting articles were found
in this theme, with the first paper proposing the use of a sensitivity analysis of
the design variables and non-design variables to help a designer to build a
robust and optimum design problem [29]. The second interesting article
proposes the allocation of a robustness index to laminate stacking sequences
so that they can be scored and evaluated for damage tolerance [30].
Physical testing to validate designs: One article was found addressing
concerns over the low confidence found in low-cost composite manufacturing
processes. In this article a method for using physical testing to improve
confidence in specific designs is discussed, and the method is validated by
manufacturing a number of demonstration components and physically testing
them destructively to validate failure predictions from a digital toolset [31].
General design optimisation: Most of the design articles were classified under
this theme, with a number of interesting design methods being proposed. In
design sequence order, the first article addresses concept design by creating a
low-computational tool which can be used to down-select design options prior
to investing in evaluation using a high-computational tool [32]. The next article
describes the use of analytical modelling methods to attempt to simplify the
process of designing with the objective of optimising for torsion and bending
loads in a structure [33]. A similar article describes the way in which a composite
structure can be tailored to reflect torsion and bending by steering the composite
fibres to align them with the calculated load paths [34]. Also discussing the
deposition of tailored fibres, the use of a response surface to optimise process
parameters is discussed in an article that focusses on the thermoplastic tow
placement process [35]. In this paper the speed, heat and pressure parameters
for a robotic AFP machine are compared to the quality of the manufactured
component to enable a designer to specify optimised design parameters.

25
Another article related to laminate quality looks at the semi-automated process
of braiding, and discusses the benefits of tailoring the ratio of fibre to resin in the
finished product to suit the structural requirements of the part [36]. The most
interesting article of this collection describes how to carry out a manufacturability
analysis during preliminary design, but increasing the design fidelity to model
the fibre paths for composite tows, rather than assuming blanket ply coverage
as is typical for preliminary designs [12]. The article describes a way to model
tow positions in the design and evaluate them using an FEA package, but the
work only enables the designer to more accurately control the fibre trajectories,
and does not prevent the designer from modelling trajectories that are
impossible to manufacture. Another article which linked preliminary design to an
FEA tool focused on the idea of using a design of experiments methodology to
build a parametric design study, the study would then validate laminate quality
by calculating spring-in distortion using an FEA tool [37]. The final two articles
in this theme address the use of multi-disciplinary optimisation, with one article
reducing cost by the consideration of manufacturing at the same time as design
[38], and the other article looking at using multi-objective optimisation to handle
the conflicting constraints in laminate stacking sequences [39]. Both of these
articles are interesting because they feature concepts that begin to address
manufacturing constraints at a design stage of the product lifecycle.

26
Figure 6: AFP preform with optimised fibre steering for load transfer around a
feature. Corners of laminate exhibit material extensions due to minimum cut
length of material, specific to the AFP process.
2.3.3 Review of composite manufacturing improvements
The research identified for the topic of composite manufacturing improvements
fell into three main areas: Manufacturing process driven design changes,
Implementation of low-cost manufacturing processes, and manufacturing
process simulation.
Manufacturing process driven design changes: One article was found in this
area, and it describes one of the main challenges of this research topic. The
article suggests that the manufacturing process needs to be selected before the
design is finalised so that the advantages and disadvantages of each particular
manufacturing process can be incorporated into the design, preventing the
designer from introducing features that preclude the use of desirable low-cost
manufacturing processes [40].
Implementation of low-cost manufacturing processes: All of the articles
linked to this theme involved the suggestion and evaluation of a substitute
manufacturing process that is perceived to be cheaper to run than the baseline
composite process. The first proposes the use of a very low cost AFP system

27
as an alternative to traditional AFP systems [41], the second proposes the
adoption of a single-shot resin infusion process instead of autoclave curing pre-
preg [42], and the third article suggest the re-design of a component to use of
out-of-autoclave materials instead of traditional pre-preg materials [43].
Manufacturing process simulation: Most of the manufacturing improvement
articles fall into this theme, with a varied selection of manufacturing process
simulations described. For example, the steering analysis of an AFP design is
a form of manufacturing process simulation and is illustrated in Figure 7:
Draping simulation combined with cost estimation [44]. The draping
simulation is carried out using FEA tools, and costing estimated using a
separate tool to create a theoretical cost/mass optimisation framework.
Theoretical modelling of the heating process, cooling process, inter-
laminar bond strength, fibre compaction load and thermal residual stress
[45]. The model of these parameters can be used to aid in the prediction
of component quality for thermoplastic AFP components.
Environmental simulation [46], to model the behaviour of thermoplastic
materials when processed at very high temperatures.
Modelling of draping and consolidation for complex preforms [47] and
also for tow placement [48].
Modelling of variable fibre angles within a laminate [49], to improve
structural performance and model subsequent manufacturing defects.
Simulation of fibre/tow steering [50], but with the addition of co-mingled
fabrics to aid manufacture.
Cost and mass simulation [51], using CAD data to obtain surface
geometry and volumetrically calculating component cost.
The articles described in section 2.3 can be categorised by the methods they
describe, and the problems they claim to address. This is shown in Table 3.

28
Figure 7: Steering analysis in an AFP manufacturing simulation. Degree of
steering is indicated by the colour of the fibre path.
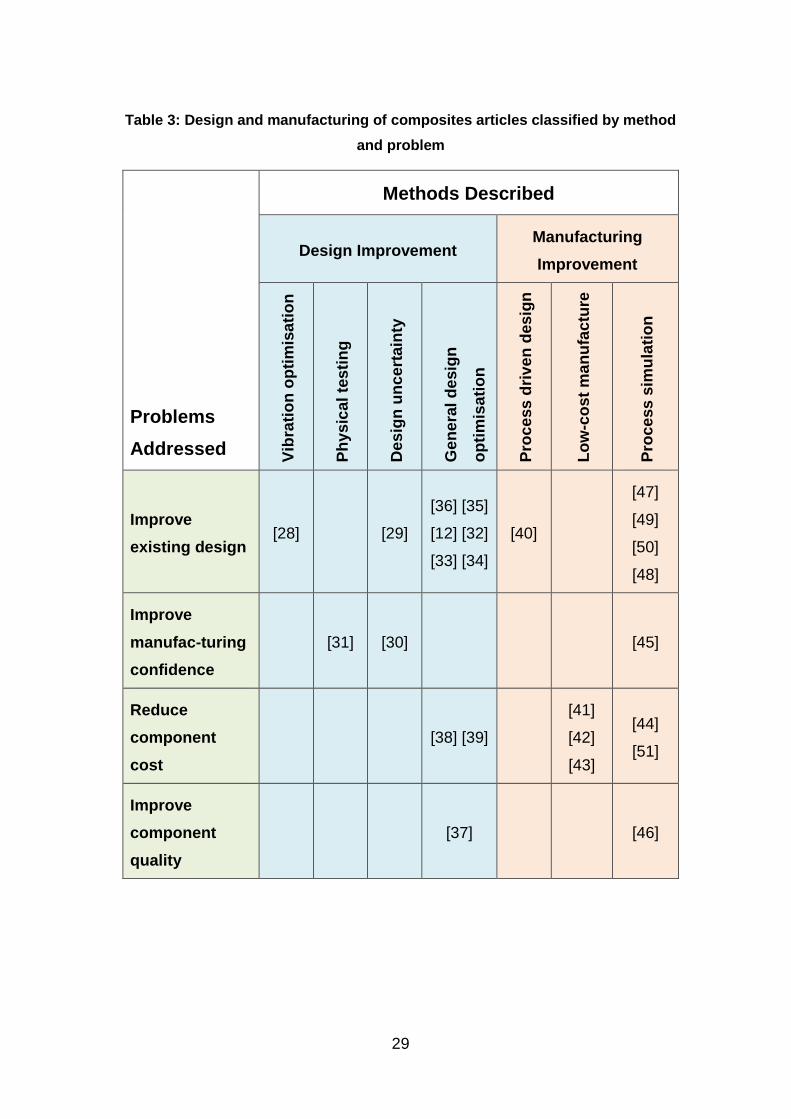
29
Table 3: Design and manufacturing of composites articles classified by method
and problem
Problems
Addressed
Methods Described
Design Improvement Manufacturing
Improvement
Vib
rati
on
op
tim
isa
tio
n
Ph
ys
ica
l te
sti
ng
Des
ign
un
ce
rta
inty
Ge
ne
ral
de
sig
n
op
tim
isa
tio
n
Pro
ce
ss
dri
ve
n d
es
ign
Lo
w-c
os
t m
an
ufa
ctu
re
Pro
ce
ss
sim
ula
tio
n
Improve
existing design [28] [29]
[36] [35]
[12] [32]
[33] [34]
[40]
[47]
[49]
[50]
[48]
Improve
manufac-turing
confidence
[31] [30] [45]
Reduce
component
cost
[38] [39]
[41]
[42]
[43]
[44]
[51]
Improve
component
quality
[37] [46]

30
2.4 DFM for composite structures
This section provides the reader with a better understanding of the existing
research which focuses on DFM for composites. This theme differs from section
2.3 because design-for-manufacture requires manufacturing to be considered
during the design process, whereas the research identified in section 2.3
considers design or manufacturing activities to occur at separate stages in the
design lifecycle.
2.4.1 Background on DFM for composites
Composite materials are manufactured as an additive process, in ply layers.
The design of the plies affects how they are manufactured, and when compared
to subtractive processes such as turning or milling, the constraints that the
manufacturing process and the material behaviour place on the design are
typically more restrictive, and complicated to apply.
Many of the articles found under this theme describe a process or a tool that
either improves an existing design to suit a composite manufacturing process,
or ensures the design can be manufactured from composites when it is created.
2.4.2 Review of DFM for composites
The research articles found under the theme of DFM for composites could all
be differentiated by the stage in the design lifecycle where they are applied, and
the type of problem that each article is attempting to address. Two distinct
groups emerge; articles which describe methods that are applied after the
design has been completed, in order to improve the design for production, and
articles describing an integrated methodology which addresses manufacturing
at the design stage.
Post-design methods: Many of the post-design methods found, rely on a
suitably high fidelity design on which a manufacturing analysis can be based.
These tools require the designer to invest time creating a high fidelity design,
and then retrospectively correct the design to suit the manufacturing process,
essentially re-designing for manufacture.

31
Three interesting articles described the analysis of fibre angles and steering for
a design, requiring the design to have ply-by-ply definitions of fibre orientation.
The manufacturing process can then be simulated and the comparison between
the designed and manufactured fibre orientations can be compared [52]. The
designer could also use the analysis to exploit steering to align to load paths to
achieve a lower mass design [53], or a structurally stronger design [50].
The optimisation of the laminate stacking sequence, the sequence of ply
orientations through the laminate, was described as a method to improve
manufacturing cycle times in the resin transfer moulding (RTM) process [54].
This article described the use of a genetic algorithm to re-sequence the
orientations of plies in a stacking sequence to suit a faster infusion time, albeit
at the sacrifice of structural performance.
The majority of related research articles in this theme describe DFM being
carried out through the use of manufacturing simulation once a design has been
created. The required fidelity of the design varies across the articles.
By capturing the constraints of the manufacturing process in analysis software,
a detailed design can be improved, and future similar designs can be
constrained [55]. Using the RTM process as an example, the manufacturing
process simulation can be used to generate a process performance index,
which can be used to improve future designs [56]. Whereas these two articles
both required a detailed design to carry out the analysis with, but with the results
being applied to aid future designs, several articles described the use of existing
designs to generate design constraints which ensure manufacturing knowledge
is embedded during the design stages. One article describes the generation of
a numerical representation of elements of the manufacturing process, which
relate directly to design parameters [57]. This enabled a basic manufacturing
analysis to be carried out on a preliminary design. Manufacturing cost estimation
as also presented as a function of design variables in order to predict
manufacturing cost at a design level [58]. Whilst both Boeing, with their PACKS
system (Parametric Composite Knowledge System) [59], and Airbus, with their
NGCW programme (Next Generation Composite Wing) [60], described a

32
parametric modelling approach to embedding manufacturing knowledge into
design tools as a way to eliminate design features that might generate high
manufacturing costs.
Design and manufacturing integrated methods: The integrated methods all
enabled the manufacturing constraints to be considered by the design without
the need for a design to be fully detailed first. The methods could be divided into
three different classifications: Multi-objective design considering manufacturing
optimisation, modifications to the design lifecycle, and process interaction and
knowledge exchange.
The multi-objective design and manufacturing optimisation articles offered
alternative exploitations of multi-objective optimisation tools:
The use of a Nelder-Mead method of multi-objective optimisation, applied
to a simultaneous structural and manufacturing optimisation problem
[61], described the optimisation routine and the mathematics in great
detail. However the chosen manufacturing objectives in the simultaneous
optimisation are to minimise the angular difference between plies in the
laminate. This objective reduces cure-distortion of the laminate but has
negligible impact on production cost or cycle time.
A simulation based performance assessment of the RTM process which
calculates a performance index for the process was described [56]. The
index was used as a design score and became an objective in a genetic
algorithm based optimisation to help improve the design for the RTM
process. A similar article describes a genetic algorithm applied to
optimise the gate and vent locations in an RTM component design [62].
The article successfully demonstrated the advantages with reduced cycle
times and lower defect count, however the structural performance of the
component was not an optimisation objective. Alternatively, the design
for manufacturing process flow applied to the problem of converting a
uni-direction material design into a woven RTM design as a means to
reduce production costs [63], enabled both the performance and the
production of the design to be improved. A constraint satisfaction

33
problem solver was used to enable manufacturing constraints to be
factored into the design optimisation process.
The Integration of the manufacturing cost model into the structural
optimisation process for a composite component, providing two
conflicting objective functions – low cost and low mass was discussed.
The multi-objective optimisation problem is built around these objectives
using NSGA-II genetic algorithm [64], and a framework that includes a
parametric CAD model of a wingbox, a cost estimation program and a
finite element model integrated into a solution framework was used to
validate the method.
The reduction in uncertainty allows smaller safety factors to be used in a
design and therefore results in a lighter, less conservative component,
so the laminate ply thickness, ply orientation and fibre volume fractions
can be evaluated with the aim of reducing their manufacturing uncertainty
[65]. The reduction in uncertainty is achieved by coupling an optimisation
system to a probabilistic analysis.
The majority of the integrated design and manufacturing articles were classified
as modifications to the design lifecycle, with most of the research looking at
replacing metallic designs with composites, or providing a general design
improvement. These articles described the following methods:
A mass transit application for replacing metal structures with rectangular,
V and C section thermoplastic elements [66], including detailed analysis
of the proposed manufacturing process and design/laminate down-
selection [67].
Replacement of skeletal metal frames and plywood panels in a mass
transit application with a low cost fibre reinforced thermoplastic.
Optimisation tools to evaluate structural performance enabled a 40%
mass reduction [68].
Lessons learned and existing cost engineering knowledge fed into each
stage of the design life-cycle to aid in the reduction of cost by design [69].
34
Discussion of the relationship between design performance and design
parameters in a design system [70].
DFX terminology defined to include all 'design for x...' principles (like design for
manufacture or design for reliability), however one article [71] proposes the use
of a graph-theoretic approach to account for all DFX impacts for a selection of
different design variables such as material type. This highlights the effect that
the design decision has on different design-for variables, such as cost or mass.
There were six other research articles that described a similar DFM principle,
and these can briefly be summarised as:
The replacement of a metallic aircraft floor beam with a thermoplastic
composite beam by the application of design for manufacturing principles
[72]. The other DFM research articles included:
Design for manufacture process applied to a robotic arm use case in
order to derive a DFM-algorithm [73].
Design for manufacture evaluation of a helicopter tail boom
manufactured using automated fibre placement rather than hand-
laminating [74].
Concurrent product definition and design for manufacture and assembly
techniques applied to a wing-tip device to successfully reduce cost [75].
Interaction between concept design and design for manufacture
formulated and solved using the compromise decision support process
[76], [77].
Research into the process interaction and knowledge exchange between the
design and manufacturing stages of the design lifecycle all address general
design improvements and component quality improvements. These include the
use of a decision support problem approach to consider design, manufacture
and maintenance concurrently in a domain independent tool [78]. And also the
use of an integrated knowledge framework in order to provide quantitative
manufacturing analysis of a composite design [79], focused on the detection
and reduction of the formation of voids during the cure cycle.

35
Another article describes the use of statistical process control to identify and
therefore reduce the risk associated with design decisions for the manufacture
of a composite component [80]. Similarly, the introduction of a knowledge-based
decision-tool into the design optimisation stage is described as a method to
enable DFM to be adopted for a composite design [81].
These research articles can be tabulated in order to identify the type of method
described, and whether it is applied pre or post design, against the type of
problem the method aims to address. This is shown in Table 4.
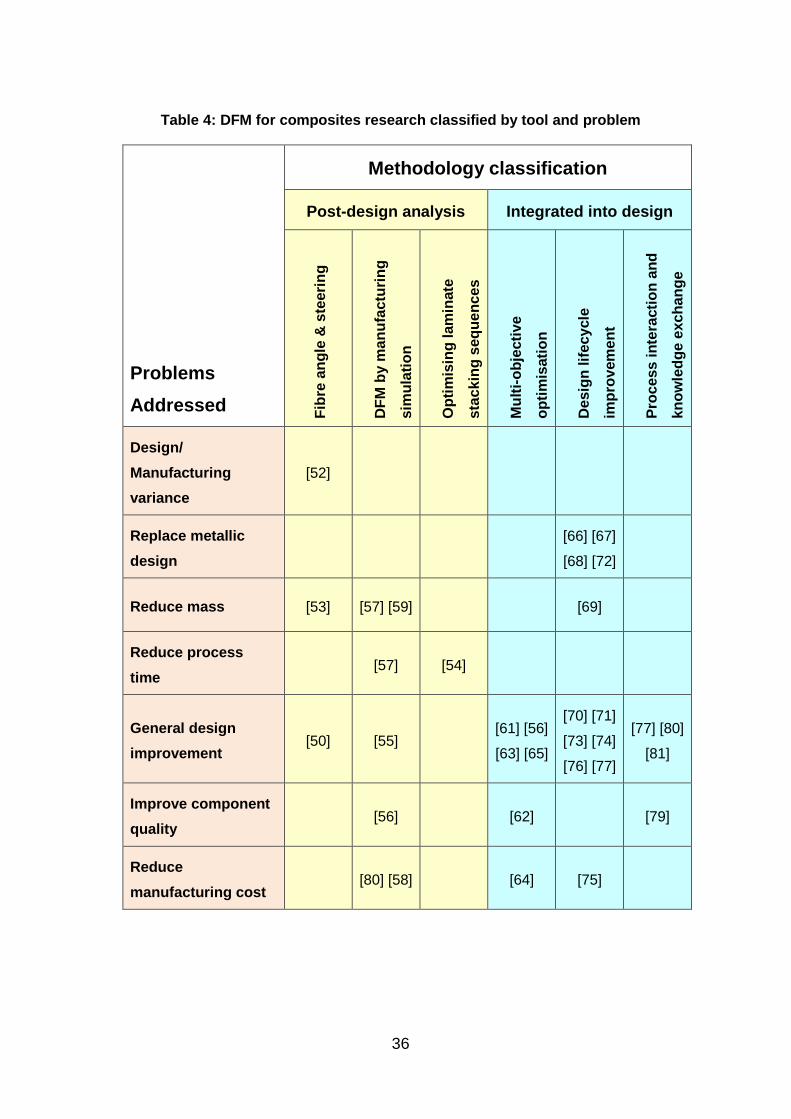
36
Table 4: DFM for composites research classified by tool and problem
Problems
Addressed
Methodology classification
Post-design analysis Integrated into design
Fib
re a
ng
le &
ste
eri
ng
DF
M b
y m
an
ufa
ctu
rin
g
sim
ula
tio
n
Op
tim
isin
g l
am
inate
sta
ck
ing
seq
ue
nc
es
Mu
lti-
ob
jecti
ve
op
tim
isati
on
De
sig
n lif
ecy
cle
imp
rov
em
en
t
Pro
ces
s i
nte
racti
on
an
d
kn
ow
led
ge e
xc
ha
ng
e
Design/
Manufacturing
variance
[52]
Replace metallic
design
[66] [67]
[68] [72]
Reduce mass [53] [57] [59] [69]
Reduce process
time [57] [54]
General design
improvement [50] [55]
[61] [56]
[63] [65]
[70] [71]
[73] [74]
[76] [77]
[77] [80]
[81]
Improve component
quality [56] [62] [79]
Reduce
manufacturing cost [80] [58] [64] [75]
37
2.5 Digital tools for DFM
In this section, the literature related to the digital tools used to support DFM is
reviewed. Whilst the research related to composite design, composite
manufacturing and DFM discuss problems, methods, theories and use cases,
this section describes research that is orientated around specific digital tools
that are used to support DFM. Industrially designed and manufactured
composite components are reliant on robust digital tools that can be reliably
integrated together across the whole design lifecycle.
Background on digital tools for DFM: This theme includes research articles
that describe a digital tool that can be used to support design for manufacture.
Two broad classifications can be used to define the results, with the tool being
classified as either composite manufacturing specific or non-composite
manufacturing specific.
Review of digital tools for DFM, non-composite manufacturing: Some of
the tools described in research that address DFM methodology, but did not
focus specifically on the composite manufacturing constraints. These tools can
be grouped into three distinct categories: Theoretical modelling, manufacturing
knowledge capture and process simulation.
Four research articles that address theoretical modelling took the approach of
building a physics-based model of machine and material characteristics in order
to predict performance and quality [45], and using 2D to 3D model
transformations for fabrics (garment industry not aerospace) using a
spring/mass model [82]. Alternatively, the use of a physics-based theoretical
model could be used to predict crash performance in a composite structure in
order to reduce the degree of physical testing required [83], and research using
the semi-empirical approach to modelling the unknown or unaccounted
composite design parameters that are often ignored by metal-biased design
tools [84].
The research focusing on capturing manufacturing knowledge addressed
different areas of the design lifecycle. In terms of conceptual design and design

38
configuration, the modelling of a decision support problem influencing design,
manufacture and maintenance requirements by described as creating a domain
independent system [76] [77] [78]. Another concept design tool described the
parametrisation of conceptual design variables to allow manufacturing time and
cost to be evaluated for re-design as well as design scenarios [85].
At a detail design stage, the use of a materials database was proposed to define
manufacturing and design performance of materials during the design phase
[15]. Looking at knowledge based engineering, KBE, an article provided a
review of engineering KBE research to help identify the industrial KBE
requirements and opportunities [86].
Several simulation tools were described in literature. The simulation of dry fibre
placement technology, infusion and cure processes was described as a method
to develop knowledge and parameter interactions [87], the digital tool used
generated a lower cost structurally optimised design. In a more performance-
based simulation, the analysis tool LS-DYNA was used to model crash
performance of composite structures [88].
Looking at the manufacturing stage of the design lifecycle, one article described
the simulation of laminate quality with links to non-destructive testing in order to
capture more accurate manufacturing costs [89] at a detailed design stage.
Review of digital tools for DFM, composite manufacturing: Some of the
research articles related to digital tools for DFM describe tools or methodology
focused on features that are composite manufacturing specific, such as fibre
trajectories and fibre angular deviation due to fabric draping. The research can
be categorised as either fibre-path optimisation or draping simulation:
The fibre-path optimisation research utilised three different approaches. Two
articles featured optimisation, surrogate modelling with NSGA-II genetic
algorithm to optimise curvilinear fibre paths for buckling and stiffness [90], and
optimisation and evaluation of lamination parameters against the variable
stiffness parameters or a composite panel design [91]. One tool described was
used to assist the designer improve the generation of fibre paths by developing

39
a streamline analogy to optimise tape course seed points and trajectories, with
the benefits of maximising smoothness and minimising thickness variations [49].
The research related to draping simulation feature the use of a simulation tool
that is able to analyse a design and predict the fibre angle changes in the
composite material after it has been draped into a 3D shape. The first article
describes a two stage approach to simulate fabric draping with an FE tool and
then perform a manufacturing cost/structural weight optimisation to achieve a
higher quality draped component (C-Shaped spar) [44]. The use of kinematic
modelling of composite materials was also proposed as a method to improve
the potential of hand lay-up processes [92].
Draping simulation was also used in conjunction with mathematical modelling
of the subsequent consolidation of the laminate. This toolset aimed to improve
structural performance of a composite laminate [47]. Lastly, a numerical draping
simulation was used to adapt 1980's clothing industry technology to modern
automated composite manufacture where dry fabric is cut and positioned
similarly to automated clothing manufacture [84].
The digital tools described in this section are represented in Table 5, highlighting
the tool method described and the objective of the tools function.

40
Table 5: Digital tools for DFM classified by tool method and tool objective
Tool objective
Tool method
Design focused Manufacturing focused
Th
eo
retica
l
mo
de
lling
Kn
ow
ledg
e
ca
ptu
re
Pro
ce
ss
sim
ula
tion
Fib
re p
ath
op
tim
isation
Dra
pin
g
sim
ula
tion
Improve structural
performance
[49] [90]
[91] [47]
Reduce
manufacturing cost [85] [86] [89] [44] [84]
Manufacturing
process improvement [45] [82] [78] [76] [92]
Reduced component
mass [77]
General design
improvement [83] [93] [15] [87] [88] [94]
2.6 Systematic design processes
When the literature published in the field of DFM for composites is evaluated in
the context of the overall design processes, there is an absence of information
regarding the design processes followed. In one review paper [95], as the
design fidelity increases, the manufacturing complexity also increases at the
detriment of production speeds. The paper also highlights that up to 80% of the
manufacturing cost is committed by the decisions made at the conceptual
design stage. Work carried out by G Gonzalez [96] evaluated the state of the
art for design for manufacture of curvilinear fibre path laminates highlighted that
the design rules did not transcend from design concept to sufficient detail to
manufacture a laminate. This highlights the need for the higher fidelity design
41
rules around detail designing advanced laminate structures enabling them to
progress through the design lifecycle to physical manufacture.
At the NCC there is research being carried out in order to capture AFP design
rules and manufacture a series of demonstration components that exploit
curvilinear fibre paths, including an objective to record the design for
manufacturing requirements as the design evolves.
Very few relevant articles were found relating to the methodology of evaluating
conflicts between composite manufacturing constraints and detail design
requirements, but a number of relevant articles have been published which
describe the way that the functionality or aesthetics of the end product can be
affected and therefore taken into account by upstream design decisions. The
most relevant article looks at the aesthetic and perceived defects in a product
which are often subjectively measured by the end user, and uses a Failure
Modes and Effects Analysis approach to suggest changes in the conceptual
design stage of a product [97]. The article is relevant to this research as it tackles
the challenge of the effect of a design decision being difficult to measure. In the
article the effect is difficult to measure because the analysis is subjectively
carried out by the unknown end-user, and in the composites application, the
effect is difficult to measure due to the lack of historic experience gained and
documented when manufacturing novel designs. Another relevant paper also
suggests process FMEA as a sensible methodology to evaluate a concept
design. The use of functional design analysis diagrams in conjunction with
FMEA is suggested by Michalakoudis et al [98] as a way to augment the FMEA
process with visual representations of the key detrimental interfaces in a design.
This approach can be applied to the case of composite manufacturing
constraints applied to the detailed design stages, highlighting when design
improvements are likely to have a negative impact on the corresponding
manufacturing process steps.

42
2.7 Key trends and research gap
This section describes the trends that can be seen in the published literature,
and discusses how they contribute towards the definition and validation of the
research gap. In order to make sure that meaningful research was found, and
ensure relevance to the research theme, a structured search approach was
used. This started with the research scope, and progressed through to the
identification of research trends and the research gap analysis (presented in
sub-sections 2.7.2 and 2.7.3 respectively). Finally, a discussion of the findings
obtained from the literature survey is presented in sub-section 2.8.
2.7.1 Discussion and Assessment
This section describes how two different approaches were used to assess the
research articles discussed in the literature survey. Firstly, the author provided
initial screening, acting as a subject-matter expert for DFM of composite
structures. This is based on the authors 13 years of experience working in the
aerospace industry, working on projects addressing the introduction and
industrialisation of composites for primary aircraft structures. This experience
ranges from the development of automated production methods for the Airbus
A350 wing, with several patents awarded for new technologies, through to the
multi-disciplinary design optimisation of a composite wing, intended to replace
a current single-aisle metallic aircraft.
In order to assess research articles that fell outside of the authors’ expertise, a
wider group of experts was required. This formed the second assessment
technique. A series of individual discussions were held with other experts
located in industry and academia to establish a better understanding of the state
of the art, and to enable the identification of research gaps arising from the
literature analysis. The group of experts is described in Table 6. The questions
the experts were asked is described in Table 7.

43
Table 6: Description of expert support
Expert ID Area of expertise Location Field Years of
experience
Expert 1 KBE systems supporting
DFM and manufacturing
Industry KBE + DFM 17
Expert 2 Digitisation and
optimisation of
manufacturing processes
Academia MDO + KBE +
Optimisation
13
Expert 3 Manufacturing informatics
and engineering
optimisation
Academia MDO + KBE +
Optimisation
17
Expert 4 CAD application
development and
aerospace optimisation
Industry Design + MDO 13
Table 7: Expert questions
Ref Questions
1 How is the article relevant to DFM for automated composite
manufacture?
2 Does the article lend itself to industrialisation?
3 How credible is the article content?
4 What is the novel aspect to the research in the article?
2.7.2 Key trends
This section describes the assessment of the literature surveyed in sections 2.3,
2.4 & 2.5, and identifies the key trends that emerge when the research articles
are grouped together and classified.
44
Design and manufacture of composites: The 25 research articles reviewed in
this section fell into two fundamental groups, with 13 articles describing an
improvement to a composite design, and 12 articles describing a composite
manufacturing improvement. The classification of these articles is illustrated in
Table 3. The majority of the design improvement articles described a design
improvement achieved by design optimisation, whereas the manufacturing
improvements were divided between improvements to the design and reduction
of component cost. The key trend observed is that design improvement
research is dominated by performance optimisation methods, and
manufacturing improvement research is dominated by process simulation
methods. This can be seen in Table 3.
DFM for composite structures: The 32 research articles reviewed in this
section fall into two groups: 10 articles that required a detailed design before
any manufacturing analysis could be carried out, and 22 articles that integrate
the manufacturing constraints into the stage where the design is created.
The articles can be re-categorised to identify which stages of the design lifecycle
they address. This is shown in Table 8.

45
Table 8: DFM articles and the span of the design lifecycle they address. Colour
coded red for single stage, through to dark green for full lifecycle.
ID
Design Lifecycle
Concept
Design
Preliminary
Design
Structural
Definition Detail Design
Manufacturing
Design
Physical
Manufacture
[52]
[67]
[54]
[68]
[69]
[61]
[70]
[71]
[55]
[57]
[78]
[72]
[56]
[59]
[62]
[53]
[79]
[63]
[73]
[64]
[74]
[75]
[60]
[80]
[81]
[65]
[58]
[76]
[77]
[50]
[95]
Colour Key
1 Stage
2
3
4
5
6 Stages

46
The key trend identified in Table 8 is that few of the articles address the full
design lifecycle and validate their proposals by manufacturing trial. Only one of
the articles addresses all stages of the design lifecycle, taking a conceptual
design through to a physical component [95]. Furthermore, only three of the
articles start with a concept design and develop it as far as a manufacturing
ready design, but these articles did not validate by physical trials. Several
articles did manufacture physical trials to validate their claims, but they all
started with designs that had a medium or high level of fidelity. The majority of
the articles only addressed a narrow section of the design lifecycle. Table 8 is
colour coded based on how far across the design lifecycle the research spans,
with dark green spanning all stages of the design lifecycle and the colours
transitioning to red where the research only covers a single stage of the design
lifecycle.
Digital tools for DFM: The 21 research articles describing digital tools for DFM
were split between 13 articles focusing on the design and 8 articles focusing on
manufacturing. Table 9 lists the articles and the software they describe, plus the
method used to verify the research. Only 7 of the articles verified the
methodologies proposed by physically manufacturing a composite
demonstrator. Many of the other articles describe a method and digital tool that
enables manufacturing knowledge to be integrated into the design to enable
manufacture, but they do not manufacture the design.

47
Table 9: Digital tools for DFM research, software described and validation
method
Article Methodology Software Verification
[90] Yes Matlab Theoretical
[49] Yes Matlab Theoretical
[44] Yes SEER MFG & ABAQUS Curved C-Spar
[45] Yes
[92] Yes MSC Theoretical
[47] Yes
[82] Yes
[76] Yes DSIDES & WIND Theoretical
[77] Yes DSIDES & WIND Theoretical
[78] Yes DSIDES, WIND & INWIND Theoretical
[85] Yes CLIPS Metallic Flange
[15] Yes Composite Star
[91] Yes Matlab Composite Flat Plate
[87] Yes CADFiber & CATFiber Composite Panel
[83] Yes ABAQUS Corrugated Composite
[88] Yes LS-Dyna Composite Cone
[84] Yes
[89] Yes SEER MFG & ABAQUS Composite Cover
[93] Yes Fortran Theoretical
[94] Yes AR Toolkit VR Modelling
[86] Yes
[95] Yes ACES, CATIA, CADFiber Composite Panels

48
Design processes: No literature was found to address the topic of taking a
systematic approach to applying manufacturing constraints to a design. As
highlighted in the work of G Gonzalez [96], the methods of improving the
performance of a structure at the concept design stage is well researched and
documented, but there is little knowledge published to enable higher fidelity
design of advanced laminates when it comes to manufacturing them. At the
NCC a number of projects have been designed and manufactured using fibre
placement technology which needed significant design evolution from the initial
design to the point where they could be successfully manufactured, however
the methodology for applying these design changes has not been recorded or
published, and each designer employs an individual approach. The relevant
research that evaluates other de-risking of downstream design and
manufacturing activities has not yet been applied to a composite laminate
design use-case.
2.7.3 Gap analysis
The trends in the composites literature suggest a research gap in three areas;
a lack of manufacturing constraints being addressed in the early stages of the
design lifecycle, a shortage of research verified with physical use cases, and
the need for methods to design for automated production techniques.
The absence of research articles that address manufacturing constraints in the
early stages of the design lifecycle can be seen in Table 8, but when combined
with the information shown in Table 9, it can be seen that few research methods
exist for a full lifecycle DFM approach. The gap led the author to conclude that
there is the lack of a design process and relevant strategies to use digital
technologies to facilitate design for automated manufacture for composite
structures.
Many of the tools and methods described in the surveyed literature differ from
the tools and methods used in the composites manufacturing industry, and the
assembled research did not adequately describe a DFM method or strategy with
equivalent fidelity to the current industrial practices, and only two of the research
articles used relevant industrial use cases. This led to the creation of the

49
research objective “Capture the current industrial design practices using use
cases for composite structures.”
The research summarised in Table 8 and Table 9 illustrate a lack of published
material both validated by physical trials, and also describing how to best design
for industrial scale automation systems that aren’t readily available to academia.
As an example, the majority of articles that describe a fibre steering
methodology rely on the Matlab digital toolset, however it is common that
industrial fibre placement machines are programmed using CAD data as a
geometry source, and none of the articles described a method for converting
and using the Matlab data in a digital CAD toolset. This led to the creation of the
research objective “Develop strategies for applying DFM best practice through
the use of digital tools.”
A number of the research articles described digital tools which are difficult to
integrate into industrial machinery. For example, several articles described the
use of Matlab to generate design data, however importing the geometry from
Matlab into CAD or machine programming software is complex, and requires
the data to be translated into a format that is supported by these industrial
software packages.
The DFM research reviewed was not specifically targeted at automated
composite deposition processes, and only two articles specifically described
research focused on designing for an automated manufacturing process. These
articles described a greater number of manufacturing constraints over the
conventional composite material constraints which highlights that DFM for
automated production of composites is likely to be more complicated than DFM
for composite materials. This led to the creation of the research objective
“Develop a design process and supporting tools to systematically apply DFM for
automated composite manufacture.”
This analysis led the author to define the hypothesis that it is possible to have a
generic design process to support the design for automated manufacturing of
composites components.

50
2.8 Concluding remarks
The analysis of existing literature provided a basis on which the research
background could be established, and enabled the identification of meaningful
research trends. The research trends helped to validate the research gap, and
positon this research and its contribution to knowledge.
The research gaps are summarised in Table 10 showing the gap identified,
along with the corresponding illustrations and data.
Table 10: Research gap and supporting data
Objective Research Gap Related Material
1 – Capture the state of the
art for DFM of composites
using digital technologies
The lack of manufacturing
constraints being addressed
in the early stages of the
design lifecycle
Section 2.7.2,
Table 8, Table 9
2 – Capture the current
industrial design practices
using use cases for
composite structures
A shortage of research
verified with physical use
cases
Section 2.4,
Section 2.5,
Table 4, Table 5,
Table 8, Table 9
4 – Develop a generic
process and supporting
tools to systematically apply
DFM for automated
composite manufacture
The need for methods to
design for automated
production techniques
Section 2.5,
Table 4, Table 5,
Table 9
The evaluation of the research trends and research gaps led to the conclusion
that there is a need to develop and publish a design process and relevant
strategies to enable the use of digital technologies to facilitate design for
automated manufacture for composite structures. Many of the digital tools
identified support a generic subtractive design process, while the composites

51
manufacturing process is better supported by an additive approach. The
additive approach to DFM was not found in the surveyed literature. This
research gap represents an opportunity to validate the research hypothesis.
Three key conclusions have been drawn from the work described in this chapter:
Composite structures are manufactured using complex processes, some
of which are automated on an industrial scale. These manufacturing
processes require specific considerations to be taken into account at all
stages of their design lifecycle, yet the processes and tools used during
the design do not always account for these considerations, resulting in
the creation of sub-optimal designs.
The design lifecycle increases with fidelity from concept through to
manufacture, however many existing tools can only evaluate
manufacturability from high fidelity design data, so there are opportunities
to find ways to evaluate manufacturability using lower fidelity design data
and therefore integrate with earlier stages of the design lifecycle.
In order to integrate the design for manufacturing approach into the
design stages, the composite manufacturing constraints associated with
the manufacturing process need to be identified at the beginning of the
design lifecycle, this implies that the manufacturing process is identified,
and the process constraints are known. There is an opportunity to
develop a systematic methodology to identify and then account for
manufacturing constraints when the manufacturing process is novel or
has low maturity.
The research aim and objectives described in section 1.3 have been derived
from the research gaps identified in this chapter, and they encompass the three
challenges described in this section. Whilst the surveyed literature has
supported the development of the research aims and objectives, the next
chapter will address the missing industrial practice needed to further validate
the research hypothesis. This is done by analysing the design practices for
composite structures in the context of design and manufacturing in the
aerospace industry.
52
3 CAPTURING CURRENT PRACTICES USING
INDUSTRIAL USE CASES
The purpose of this chapter is to present industrial research related to the
research topic. The industrial studies aim to identify engineering methodologies
which describe the practice used to design composite structures. The studies
were all undertaken by the author whilst working in the aerospace industry, and
are deemed relevant to this PhD thesis on the basis that they address the
different stages of the design lifecycle identified as potential gaps in the
literature survey.
The examples described in this section are taken from the aerospace industry,
and focus on two different aircraft programmes, one moving from concept to
preliminary design and then detailed design, and the second, from preliminary
design into detailed design and then production. The two programmes are
therefore able to represent the development of a composite aircraft structure
through the entire design lifecycle.
3.1 Introduction
The industrial best practice can be split into four discrete themes, which align to
the initial stages of the composite structure design lifecycle. The design starts
its life with very low fidelity as a concept, which fundamentally sets out the layout
of the structure and makes initial technology and material selections. An
example of the distribution of material selected for a concept aircraft are
illustrated in Figure 8.

53
Figure 8: Material selections on an early concept aircraft, percentage of total
airframe mass
The preliminary design stage increases the concept design fidelity and maturity
to a point where an evaluation of the design can be made. It is at this point that
Airbus perform trade studies comparing multiple preliminary designs to select
the most suitable before progressing to the next stage of the lifecycle [99]. Once
the preliminary design is completed, a detailed design is used to further increase
design fidelity and maturity to the point where a physical part can be
manufactured. In the manufacturing stage, process improvements and
manufacturing lessons learned can be identified and fed back into the detail
design to further improve it.
3.1.1 Conceptual Design
The conceptual design stage of the design lifecycle for an aircraft describes the
overall aircraft definition. In this stage the fundamental layout of the aircraft is
considered, such as the main geometry of the wing and location of landing gear
and engines. The concept stage concludes when a set of 3D surfaces that
define the ‘skin’ of the aircraft have been defined.
Composite Materials
50%
Aluminium20%
Titanium15%
Steel10%
Other Materials5%
AIRCRAFT MATERIALS USED (% MASS)

54
The design fidelity at this stage is very low, which makes it difficult to utilise
many of the manufacturing analysis tools which require a much higher design
fidelity to function.
The concept design is typically only used to establish a flight performance
envelope as part of a multi-disciplinary assessment against the aircraft top level
performance objectives. At this stage in the design it is not considered practical
to evaluate manufacturing due to the low maturity of the data.
3.1.2 Preliminary Design
During the preliminary design of the aircraft, the initial surfaces generated at the
concept design stage are structurally sized to suit the load cases from the multi-
disciplinary assessment. It is typical that several worst-case flight manoeuvres
are simulated to generate the maximum load cases that an aircraft structure will
experience during flight, and these loads are calculated with a conservatively
thick structure, defined as a thickness at each node in the loads finite element
model (FEM). The FEM model is analysed for flight loads, and material is
removed from areas with excessive stiffness or strength, before re-iterating the
loads analysis. The loads analysis and adaption of the structural thickness
definitions are re-iterated until the performance and structural definition
converge. The preliminary design concludes when the structural definition
optimisation converges and the 3D surfaces are accompanied by detailed sizing
data.
The process of optimising the structure is very similar to the subtractive process
of machining a metal billet into a final shape, starting with a thickness of material
that is larger than the finished component, and systematically removing material
where it is not required for structural performance. The process focuses on
discrete cells which are processed individually not globally.
3.1.3 Detailed Design
The preliminary design consists of only 3D surfaces and material thickness
definitions, but these need to be converted to a 3D solid model with laminate
definitions. The detailed design process is used to systematically convert the

55
3D surfaces into a series of 3D ply layers based on the material thickness data.
These 3D ply layers are then built up into a 3D solid model of the composite
structure, but with a layer-by-layer definition of each composite ply shape,
boundary and fibre direction.
The process of constructing the detailed laminate design is an additive process,
and is globally addressed rather than focusing on individual cells in the
structure.
Once the detailed laminate design is completed, the laminate stacking
sequences are checked for compliance with manufacturing constraints and
design rules, and then the ply shapes are checked to see if they are compatible
with the manufacturing process.
Each individual ply shape and surface is defined at this design stage, but the
real life direction of the fibres is not established. Each ply only has a target fibre
orientation set.
3.1.4 Manufacture
The detailed design does not have sufficient maturity to be used to create a
manufacturing machine program from. So in the manufacturing stage, each ply
is taken from the detailed design, and the fibre trajectories are generated based
on the target ply orientation specified in the design. In this operation, the
geometry of the surfaces causes the fibres to follow non-linear trajectories, so
the manufactured fibre angles for each ply are represented as a maximum and
minimum deviated angle.
3.2 Methods followed to evaluate best practice
The literature survey described a number of different methodologies to carry out
design activities on composite structures, but these do not correlate with the
routine way in which composite structures are developed in the aerospace
industry. The author was involved in a series of Airbus composite structure
development programmes as an employee of Airbus, and of the National
Composites Centre, and this experience gathered over 13 years has enabled

56
the recording of industrial best practice. The Airbus projects which enable the
author to identify best practice are the MDOW programme [11] and the NGCW
programme [10], where the author was responsible for defining how
manufacturing would be represented in the process for selecting aircraft
concepts, and for detail designing a composite wingbox structure respectively.
Prior to this, the author was responsible for introducing the AFP process to
Airbus UK as part of the development of the A350 aircraft. The NCC project
which enables the author to identify best practice is the 3 year long Dry Fibre
AFP core programme, led by the author on behalf of the NCC tier 1 members.
Each programme was concluded with a lessons learned exercise which
identified any new best practice that was created, and the extracted best
practice was only disseminated amongst the programme participants. The
information described in section 3.3 is based on use cases which enable the
best practice to be described with the added context of the industrial application.
The case studies are validated with worked examples and trial data to
demonstrate a successful conclusion.
3.3 Examples of DFM for composites in the aerospace industry
The following three industrial use cases highlight typical design challenges and
methodologies common in the aerospace industry, enabling the reader to
understand the context of designing for composite manufacture in the
aerospace industry. These use cases were selected from previous research
programmes that had generated new industrial practices relating to these topics.
3.3.1 Industrial case 1: Sizing a composite structure
A preliminary design containing aerodynamic surfaces will undergo a structural
sizing process, where the surfaces are given material thickness values that
enable a structural analysis and optimisation based on flight loads to be
performed. The process flow is illustrated in Figure 9.

57
Sizing Data+
3D Surface
Thickness removed locally by optimiser
Thickness Laws added for each cell
Thickness added to surface globally
Figure 9: Schematic of preliminary design sizing process flow
For an aircraft wing, which is historically manufactured from metal, a subtractive
sizing process is used. This process divides the wing surface into a grid of cells,
split by the stiffening stringers and ribs. A maximum material thickness is applied
globally to the wing, and an optimisation tool is used to systematically reduce
the thickness in each cell until the minimum material required to satisfy the load
cases is left. This subtractive process of sizing replicates the subtractive
process of metal machining, resulting in a preliminary design which does not
significantly increase in mass when the manufacturing constraints of machining
are applied.
The change to composite materials from metals results in the structure being
manufactured using an additive manufacturing process, where material is added
in finite thickness ply layers, with a much larger quantity of manufacturing

58
constraints affecting the design. The risk associated with using the traditional
subtractive sizing process is that the preliminary design that is generated does
not accurately reflect the manufacturing process, and does not adequately
address the manufacturing constraints. This can result in mass being added to
the structure after the structural sizing optimisation stage has concluded, and
the mass added later in the design lifecycle, post optimisation, creates a sub-
optimal design.
The table shown in Figure 10 is a sample sizing table for an aircraft wing. The
vertical cell boundaries represent the wing ribs, and the horizontal cell
boundaries represent the stiffening stringers. The cell values represent the
material thicknesses. A metallic design only requires a single table of material
thicknesses, but a composite design requires the thicknesses and a second
table with the same format containing cells that represent the composite
thickness laws that match the corresponding thicknesses. A thickness law
contains the percentages of each different fibre orientation by thickness. For
example, a thickness law of 40/50/10 for a 10mm thick cell refers to the laminate
in that area consisting of 4mm of 0 degree plies, 5mm of equally paired 45 and
135 degree plies, and 1mm of 90 degree plies.
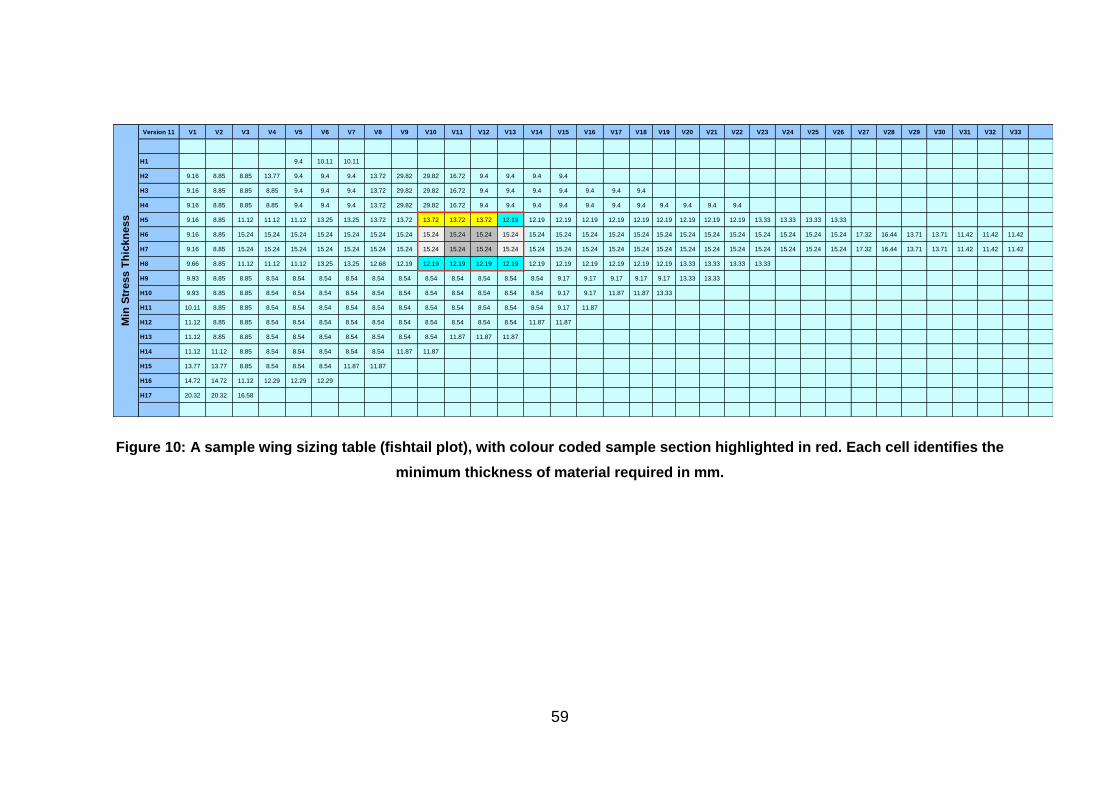
59
Figure 10: A sample wing sizing table (fishtail plot), with colour coded sample section highlighted in red. Each cell identifies the
minimum thickness of material required in mm.
Version 11 V1 V2 V3 V4 V5 V6 V7 V8 V9 V10 V11 V12 V13 V14 V15 V16 V17 V18 V19 V20 V21 V22 V23 V24 V25 V26 V27 V28 V29 V30 V31 V32 V33
H1 9.4 10.11 10.11
H2 9.16 8.85 8.85 13.77 9.4 9.4 9.4 13.72 29.82 29.82 16.72 9.4 9.4 9.4 9.4
H3 9.16 8.85 8.85 8.85 9.4 9.4 9.4 13.72 29.82 29.82 16.72 9.4 9.4 9.4 9.4 9.4 9.4 9.4
H4 9.16 8.85 8.85 8.85 9.4 9.4 9.4 13.72 29.82 29.82 16.72 9.4 9.4 9.4 9.4 9.4 9.4 9.4 9.4 9.4 9.4 9.4
H5 9.16 8.85 11.12 11.12 11.12 13.25 13.25 13.72 13.72 13.72 13.72 13.72 12.19 12.19 12.19 12.19 12.19 12.19 12.19 12.19 12.19 12.19 13.33 13.33 13.33 13.33
H6 9.16 8.85 15.24 15.24 15.24 15.24 15.24 15.24 15.24 15.24 15.24 15.24 15.24 15.24 15.24 15.24 15.24 15.24 15.24 15.24 15.24 15.24 15.24 15.24 15.24 15.24 17.32 16.44 13.71 13.71 11.42 11.42 11.42
H7 9.16 8.85 15.24 15.24 15.24 15.24 15.24 15.24 15.24 15.24 15.24 15.24 15.24 15.24 15.24 15.24 15.24 15.24 15.24 15.24 15.24 15.24 15.24 15.24 15.24 15.24 17.32 16.44 13.71 13.71 11.42 11.42 11.42
H8 9.66 8.85 11.12 11.12 11.12 13.25 13.25 12.68 12.19 12.19 12.19 12.19 12.19 12.19 12.19 12.19 12.19 12.19 12.19 13.33 13.33 13.33 13.33
H9 9.93 8.85 8.85 8.54 8.54 8.54 8.54 8.54 8.54 8.54 8.54 8.54 8.54 8.54 9.17 9.17 9.17 9.17 9.17 13.33 13.33
H10 9.93 8.85 8.85 8.54 8.54 8.54 8.54 8.54 8.54 8.54 8.54 8.54 8.54 8.54 9.17 9.17 11.87 11.87 13.33
H11 10.11 8.85 8.85 8.54 8.54 8.54 8.54 8.54 8.54 8.54 8.54 8.54 8.54 8.54 9.17 11.87
H12 11.12 8.85 8.85 8.54 8.54 8.54 8.54 8.54 8.54 8.54 8.54 8.54 8.54 11.87 11.87
H13 11.12 8.85 8.85 8.54 8.54 8.54 8.54 8.54 8.54 8.54 11.87 11.87 11.87
H14 11.12 11.12 8.85 8.54 8.54 8.54 8.54 8.54 11.87 11.87
H15 13.77 13.77 8.85 8.54 8.54 8.54 11.87 11.87
H16 14.72 14.72 11.12 12.29 12.29 12.29
H17 20.32 20.32 16.58
Min
Str
ess T
hic
kn
ess

60
Figure 11: A 3D CAD representation corresponding to the wing sizing table in Figure 10, the area highlighten in red represents
the sample illustrated in Figure 12.

61
The wing structural sizing data can be transposed onto a 3D CAD model, shown
in Figure 11. There are two adjacent cells in this design which are identified as
having the same thickness, but different thickness laws. These are highlighted in
Red in both Figure 10 and Figure 11. Both adjacent cells require a thickness of
15.24mm, however the thickness law changes from 50/40/10 to 43/47/10 due to
a local change in load-case. To simplify the example, 16 of the cells from the use
case are shown as a uniform representation in Figure 12.
SS14
46/42/13
12.19mm
SS4
44/44/11
13.72mm
SS4
44/44/11
13.72mm
SS4
44/44/11
13.72mm
SS53
50/40/10
15.24mm
SS53
50/40/10
15.24mm
SS24
43/47/10
15.24mm
SS24
43/47/10
15.24mm
SS53
50/40/10
15.24mm
SS53
50/40/10
15.24mm
SS24
43/47/10
15.24mm
SS24
43/47/10
15.24mm
SS14
46/42/13
12.19mm
SS14
46/42/13
12.19mm
SS14
46/42/13
12.19mm
SS14
46/42/13
12.19mm
Figure 12: A simplified visualisation of part of the wing sizing data
The first stacking sequence is referenced as SS24 it consists of 43% 0 Degree /
23.5% 45 Degree / 23.5% 135 Degree / 10% 90 Degree, which is represented as
a ‘43/47/10 thickness law’ due to the balancing of the 45 and 135 plies. The
second stacking sequence is SS53, which has a thickness law of 50/40/10.
SS24 has a sequence of:
(45/-45/0/90/0/-45/45/0/0/0/90/0/-45/45/0/0/-45/45/0/-45/45/0/45/-45/0/0/90/-
45/45/0)S
SS53 has a sequence of:
(45/-45/0/0/45/-45/0/0/0/90/0/0/45/-45/0/0/90/0/0/-45/45/0/-45/45/0/0/90/45/-
45/0)S
The S at the end of the sequence indicates that the sequence must be mirrored.

62
The order of the different ply orientations must be sequenced according to
specific design rules to create a stacking sequence. The stacking sequences for
the two cells is visualised in the cross-sectional representation of Figure 13.
45 Deg135 Deg0 Deg90 Deg
43/47/10
Stacking Sequence 24
50/40/10
Stacking Sequence 53Rib 110.254mm 15.24mm
Figure 13: Representation of SS24 and SS53 as neighbouring stacking
sequences
The different ply orientations in Figure 13 are colour coded, Green for 0, Red for
45, Pink for 135 and blue for 90. Each ply thickness is 0.254mm thick, but only
43 of the 60 plies are continuous from one cell to the next, so the 17 discontinuous
plies must be overlapped to ensure that load is transferred from cell to cell
efficiently. The resulting laminate gains a raised increase in thickness at the cell
boundary, which is shown in Figure 14 as an increase in thickness from 15.24mm
to 18.796mm.

63
45 Deg135 Deg0 Deg90 Deg
43/47/10
Stacking Sequence 24
50/40/10
Stacking Sequence 53Rib 11
0.254mm 15.24mm
18.796mm
Figure 14: Representation of how SS24 and SS53 merge to create an overlap
The requirement to achieve same-orientation ply continuity between
neighbouring cells is a manufacturing constraint which is not represented during
the structural sizing process. By not accounting for the constraint when the cells
are sized individually, the design solution gains mass during detailed design, after
the structural optimisation has completed, resulting in sub-optimal mass being
added. Figure 15 illustrates the 3D representation that was used for structural
optimisation (on the left), and the post-detail design 3D representation (on the
right) with all the additional material added highlighted in red.

64
SS14
46/42/13
12.19mm
SS4
44/44/11
13.72mm
SS4
44/44/11
13.72mm
SS4
44/44/11
13.72mm
SS53
50/40/10
15.24mm
SS53
50/40/10
15.24mm
SS24
43/47/10
15.24mm
SS24
43/47/10
15.24mm
SS53
50/40/10
15.24mm
SS53
50/40/10
15.24mm
SS24
43/47/10
15.24mm
SS24
43/47/10
15.24mm
SS14
46/42/13
12.19mm
SS14
46/42/13
12.19mm
SS14
46/42/13
12.19mm
SS14
46/42/13
12.19mm
Figure 15: Visualisation of additional mass added due to mismatched thickness
laws
Prior to this example, structural sizing processes did not take into consideration
the effects of ply continuity between neighbouring discrete cells. As an output of
this use case, the practice of evaluating each discrete cell relative to its
neighbouring cells was introduced as a measure of manufacturability. This
measure enabled structures to be improved and compared with respect to
manufacturablity.
3.3.2 Industrial case 2: Manufacturing analysis
A detailed design should be created with sufficient fidelity to ensure that all of the
data required to manufacture the component is present. In order to ensure the
correct constraints are accounted for, the thickness law data generated at the
preliminary design stage is converted into a stacking sequence by following
specific composite design rules. The design rules are typically applied cell by cell
to the structure, and then the global design solution is checked.
There are 9 key composite design rules which can be applied to a composite
structure design constructed from uni-direction material:
1. Rule 1: The laminate should be symmetric. A neutral axis can be imagined
at the centre of the laminate, with equal quantities of plies above and below
the neutral axis. The rule requires the ply orientations above the axis to

65
mirror the ply orientations below the axis. If perfect symmetry cannot be
achieved, then non-symmetric plies should be moved as close to the
neutral axis as possible. This is illustrated in Figure 16.
45 Deg135 Deg0 Deg90 Deg
Figure 16: Examples of rule 1, Symmetry
2. Rule 2: The laminate should be balanced. To reduce the effects of an
unbalanced laminate, two of the ply orientations that are perpendicular
must be present in equal quantities, either 45 and 135 or 0 and 90 degree
orientations. This is shown in Figure 17 using a ply design table.
Figure 17: Examples of rule 2, balanced laminate
3. Rule 3: No orientation should constitute less than 8% of the total thickness
of the laminate, or more than 67%. This rule enables the design to
45 45
45 45 135 135
45 45 90 90 90 90
90 90 135 135 45 45
135 135 0 0 0 45
0 0 135 135 45 0
----- 0 ----- 90 ----- -----
0 0 45 45 45 0
135 135 0 0 0 45
90 90 135 135 135 135
45 45 90 90 90 90
45 45 135 135
Good Good 45 45
Acceptable Acceptable
Poor Poor
Neutral
Axis
Orientation
0 10 10 10
45 15 15 12
90 2 10 8
135 15 4 10
Good Good Bad
Quantity of plies

66
withstand the resultant compression load created by the poisson effect in
a laminate. Typically the 0 degree orientation plies are aligned to the
primary load direction and constitute the greatest percentage of the
orientations in the laminate, and the perpendicular 90 degree orientation
plies make up the minimum percentage plies in the laminate.
4. Rule 4: The outer plies should not be the same orientation as the main
load bearing ply direction. This is due to increased likelihood of damage to
the outer plies.
5. Rule 5: Try to avoid grouping plies with the same orientation. A stress
optimised laminate may have a high quantity of plies in a specific
orientation, but these should not be grouped together as this could
increase coupling effects which may lead to stress concentrations inside
the laminate.
6. Rule 6: Do not allow more than 3 plies of the same orientation to be
sequenced next to each other. An equation is used for this rule:
𝑛𝑀𝑎𝑥 = 4 𝑝𝑙𝑖𝑒𝑠 ≈ 1.0𝑚𝑚 𝑡ℎ𝑖𝑐𝑘𝑛𝑒𝑠𝑠
Equation 1: Maximum number of adjacent same-orientation plies
7. Rule 7: To improve buckling performance, place 0 degree orientation plies
as far away from the neutral axis as possible. This is due to the centre of
the laminate not being in tension or compression whilst under a
compressive load.
8. Rule 8: To minimise coupling effects, group 45 and 135 degree plies
together in adjacent pairs, with symmetry around the neutral axis. This rule
reduces laminate distortion.
9. Rule 9: To reduce inter-laminar shear effects, reduce the angle between
the adjacent plies. Some plies may be coupled, such as 45 and 135 degree
plies, so non-coupled orientations like 0 and 90 degree plies should be
distributed with 45 and 135 plies between them to reduce the angle
between the plies from 90 degrees perpendicular to only 45 degrees.

67
These 9 rules contain several contradicting instructions, making it difficult for a
designer to apply them consistently to a design. To highlight this, the same
example used in section 3.3.1 is taken from a preliminary sizing stage to a
detailed design with the rules applied. This is illustrated Figure 18, visually
highlighting the discontinuity of the different orientation plies between two cells
which have the same thickness, same quantity of plies, but different ratios of the
four principle orientations.
45 Deg135 Deg0 Deg90 Deg
43/47/10
Stacking Sequence 24
50/40/10
Stacking Sequence 53Rib 110.254mm 15.24mm
Figure 18: Example showing SS24 and SS53
The designer must now apply the design rules to the stacking sequences using
a strategy that also improves the same-orientation continuity between the
neighbouring cells.
The first five rules are already accounted for when the stacking sequences are
automatically populated from the thickness laws in the CAD package. In this

68
instance CATIA V5 R21 was used to automatically convert the thickness laws
into stacking sequences using the ‘virtual stacking’ tool in the composites grid
workbench.
Rules 5 to 9 encourage the designer to re-sequence plies to suit structural
performance requirements, so a designer will typically implement this in stages.
Initially looking at coupled pairs of 45 and 135 degree plies, two pairs are
identified in stacking sequence 24 and six pairs are identified in stacking
sequence 53. The changes are highlighted in Figure 19 by shading them with
darker colour, and placing a star next to them. Each pair of plies was re-
sequenced to align with a pair of same-orientation plies in the neighbouring cell,
improving the ply continuity. The position of the pair in the overall sequence was
also improved. The result is an increase in continuous plies from 46 to 50 out of
60.
45 Deg135 Deg0 Deg90 Deg
43/47/10
Stacking Sequence 24
50/40/10
Stacking Sequence 53Rib 110.254mm 15.24mm
Figure 19: 45 degree and 135 degree plies re-sequenced
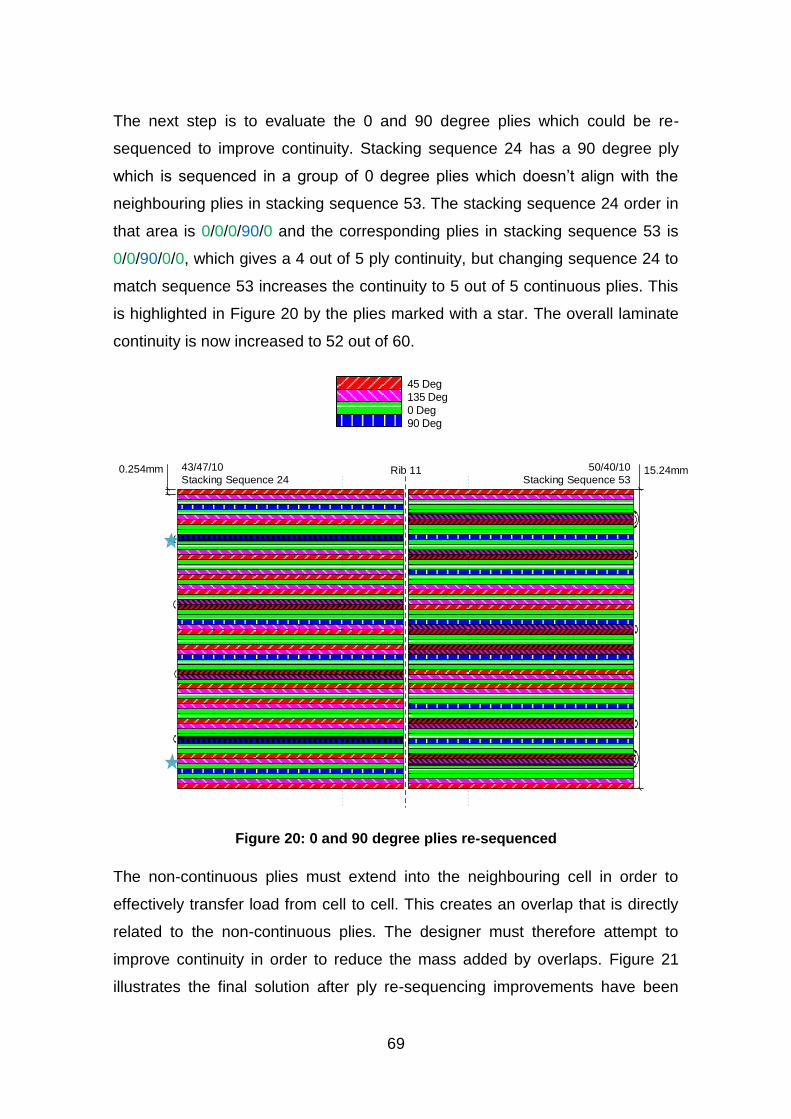
69
The next step is to evaluate the 0 and 90 degree plies which could be re-
sequenced to improve continuity. Stacking sequence 24 has a 90 degree ply
which is sequenced in a group of 0 degree plies which doesn’t align with the
neighbouring plies in stacking sequence 53. The stacking sequence 24 order in
that area is 0/0/0/90/0 and the corresponding plies in stacking sequence 53 is
0/0/90/0/0, which gives a 4 out of 5 ply continuity, but changing sequence 24 to
match sequence 53 increases the continuity to 5 out of 5 continuous plies. This
is highlighted in Figure 20 by the plies marked with a star. The overall laminate
continuity is now increased to 52 out of 60.
45 Deg135 Deg0 Deg90 Deg
43/47/10
Stacking Sequence 24
50/40/10
Stacking Sequence 53Rib 110.254mm 15.24mm
Figure 20: 0 and 90 degree plies re-sequenced
The non-continuous plies must extend into the neighbouring cell in order to
effectively transfer load from cell to cell. This creates an overlap that is directly
related to the non-continuous plies. The designer must therefore attempt to
improve continuity in order to reduce the mass added by overlaps. Figure 21
illustrates the final solution after ply re-sequencing improvements have been

70
made. The overlap before re-sequencing was 18.796mm thick, representing a
3.556mm local increase in thickness. The resequencing activities have reduced
this overall thickness to 16.764mm, which is an overall increase of only 1.524mm.
45 Deg135 Deg0 Deg90 Deg
43/47/10
Stacking Sequence 24
50/40/10
Stacking Sequence 53Rib 1116.764mm 15.24mm
Figure 21: Overlap between SS24 and SS53 reduced by ply re-sequencing
In this use-case, only two adjacent cells have been considered to highlight the
changes made by the designer in a simplified example. In order to apply this
approach to a large composite structure, each individual cell needs to be
compared with up to eight adjacent cells, and a typical wing or fuselage structure
can have anywhere between 120 and 400 individual cells.
The main practices described in this section enable the design rules to be
administered in a way that the effects on the manufacturing process can be
identified, and then changes can be made to the stacking sequences to improve
the manufacturability while still complying with the rules.

71
3.3.3 Industrial case 3: Design evaluation methods
The previous two use cases have identified some of the steps taken by designers
to represent the original design intent whilst also increasing the design fidelity
through the application of design rules, and also attempting to reduce the mass
of the final design solution. Whilst these steps have accounted for the structural
performance of composites, and the specific design rules required to define
laminates, the practicalities of manufacturing the structures on an industrial scale
have not been factored into the design. In order to do this, the layer by layer
topology of the design must be evaluated with consideration given to the
automated deposition systems that accurately place the layers of composite
material on top of each other to build a 3D laminate.
This use case describes two approaches for evaluating the design for suitability
of manufacture, firstly looking at the 2D shape of each ply, and secondly, looking
at the cumulative effect of the ply shapes as a 3D surface.
All automated deposition systems can be described as end effectors which
manipulate composite material, and an NC controlled machine which moves the
end effector around the structure to enable material to be deposited in known
locations, the way that the end effector works and the way that it is moved around
the structure differ from machine to machine, and some technologies also
integrate the motion of the structure into the deposition system. However, all
systems are effected by the shape and profile of the ply that is designed, and a
poorly designed ply can be impossible to manufacture because the profile is too
complex for the end effector to access, or it can be inefficient to manufacture
because the machine motion requires frequent stops, starts, slow movement or
movement where no material is being deposited.
To highlight the effects that ply shapes have on automated deposition cycle times,
two ply shapes with the same area but different ply boundary lengths are
described. Ply A represents a rectangular grid of three by five cells, with an area
of fifteen cells, and a perimeter of sixteen cell edges. Ply B represents a non-
uniform grid with an area of fifteen cells and a perimeter of twenty cells. These
two plies are illustrated in Figure 22.

72
Ply A Ply B
Area = 15sq units
Perimeter = 16 units
Area = 15sq units
Perimeter = 20 units
Figure 22: Example ply shapes with same area but different perimeter values
The perimeter of the ply is important for automated deposition systems because
the systems need to slow down to cut and deposit the beginning and the end of
tape course. The system also needs to turn or reposition after depositing the
course in order to deposit the next course. Both of these functions cause the
deposition system to slow down and operate at a reduced efficiency. Figure 23
illustrates an example machine path for a 0 degree ply A, with each cut and turn
visually highlighted on the schematic.
Figure 23: Visualisation of machine motion for 0 degree Ply A
Number of Cuts: 10
Number of Turns: 4
Link Path: 0 units
Deposition Path: 15 units

73
Figure 24 illustrates an example machine path for a 0 degree ply B, with each cut
and turn visually highlighted on the schematic.
Figure 24: Visualisation of machine motion for 0 degree ply B
By comparison, both ply shapes have the same area and the same number of
boundary cuts and turn-arounds, however ply B requires the machine to travel a
greater distance between the end of one course and the beginning of the next
course. The time when the machine is moving but not depositing material is
referred to as ‘non-productive time’ and this increases the cycle time.
Deposition machines must slow down to perform complex tasks such as cutting
the beginning or end of a course, or negotiating complex geometry. The machine
velocity plays an important part in the efficiency of the production cycle. Reducing
non-productive time improves deposition efficiency, but the machines can still
deposit at sub-optimal speeds if the ply shapes do not allow them to accelerate
to maximum speed before they are forced to decelerate to perform a cut or
complex geometry manoeuvre.
Figure 25 shows a graph of machine velocity plotted against distance travelled
for the 0 degree ply A. The long machine paths where material is deposited allow
the machine to reach maximum velocity, the shorter peaks on the graph represent
the short non-productive moves made to turn and reposition.
Number of Cuts: 10
Number of Turns: 4
Link Path: 8 units
Deposition Path: 15 units

74
Time (s)
Ma
ch
ine V
elo
city (
m/s
) 0Deg – Ply A
1
0.5
0 4020
Figure 25: Visualisation of the machine velocity for 0 degree, ply A
Figure 26 illustrates the machine velocity plotted against distance travelled for the
0 degree ply B. The main difference that can be seen between ply A and ply B is
that the ply B average machine velocity is lower. Frequent short movements
result in the machine being unable to accelerate to full speed between features.
Time (s)
Ma
ch
ine V
elo
city (
m/s
) 0Deg – Ply B
1
0.5
0 3015 45
Figure 26: Visualisation of the machine velocity for 0 degree, ply B

75
The other ply orientations also produce similar results. Figure 27 illustrates a
representation of the machine path for a 45 degree ply A, and Figure 28 illustrates
the machine path representation for the 45 degree ply B.
Number of Cuts: 14
Number of Turns: 6
Link Path: 4 units
Deposition Path: 13 units
Figure 27: Visualisation of the machine velocity for 45 degree, ply A
The 45 degree ply A and B contain more cuts, turn arounds and non-productive
motion for the same area and perimeter of the 0 degree ply versions.
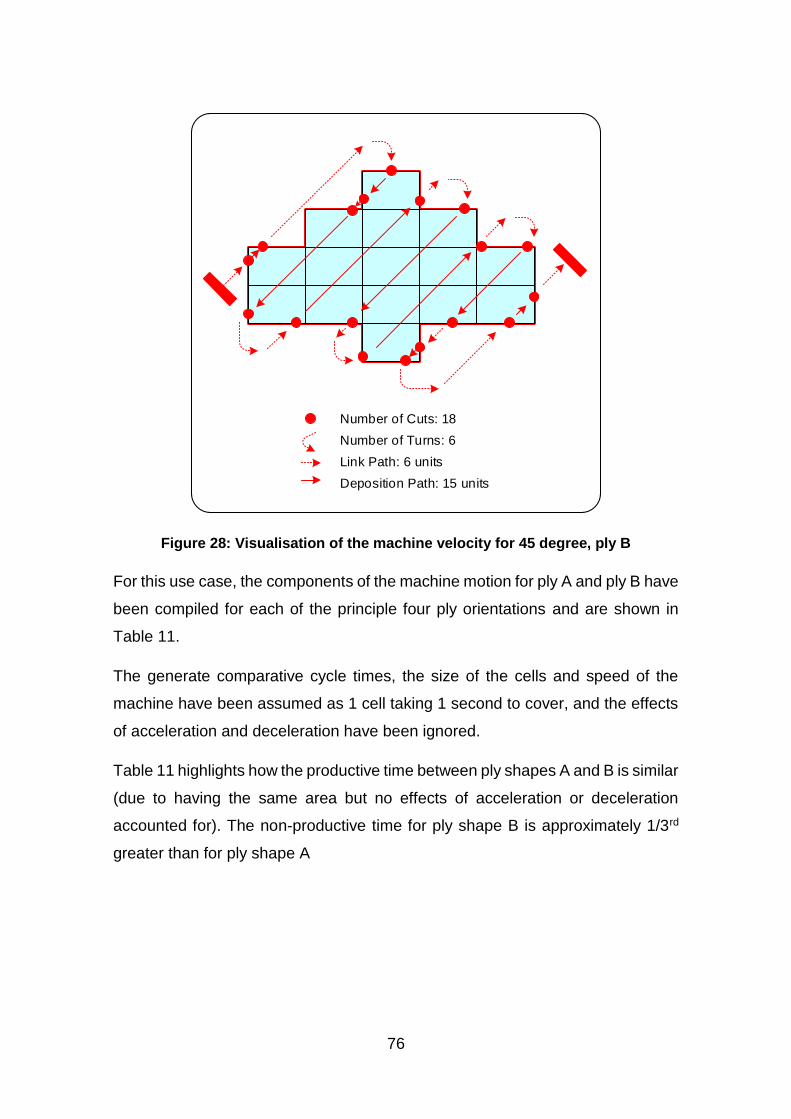
76
Number of Cuts: 18
Number of Turns: 6
Link Path: 6 units
Deposition Path: 15 units
Figure 28: Visualisation of the machine velocity for 45 degree, ply B
For this use case, the components of the machine motion for ply A and ply B have
been compiled for each of the principle four ply orientations and are shown in
Table 11.
The generate comparative cycle times, the size of the cells and speed of the
machine have been assumed as 1 cell taking 1 second to cover, and the effects
of acceleration and deceleration have been ignored.
Table 11 highlights how the productive time between ply shapes A and B is similar
(due to having the same area but no effects of acceleration or deceleration
accounted for). The non-productive time for ply shape B is approximately 1/3rd
greater than for ply shape A
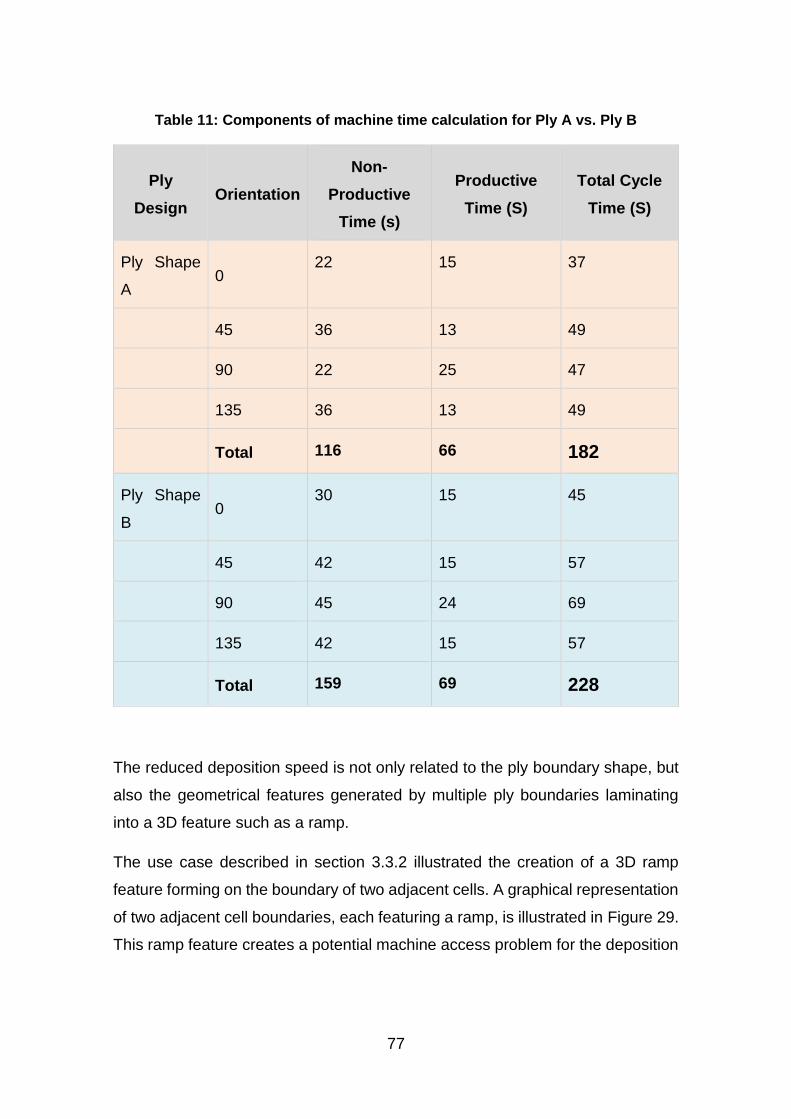
77
Table 11: Components of machine time calculation for Ply A vs. Ply B
Ply
Design Orientation
Non-
Productive
Time (s)
Productive
Time (S)
Total Cycle
Time (S)
Ply Shape
A 0
22 15 37
45 36 13 49
90 22 25 47
135 36 13 49
Total 116 66 182
Ply Shape
B 0
30 15 45
45 42 15 57
90 45 24 69
135 42 15 57
Total 159 69 228
The reduced deposition speed is not only related to the ply boundary shape, but
also the geometrical features generated by multiple ply boundaries laminating
into a 3D feature such as a ramp.
The use case described in section 3.3.2 illustrated the creation of a 3D ramp
feature forming on the boundary of two adjacent cells. A graphical representation
of two adjacent cell boundaries, each featuring a ramp, is illustrated in Figure 29.
This ramp feature creates a potential machine access problem for the deposition
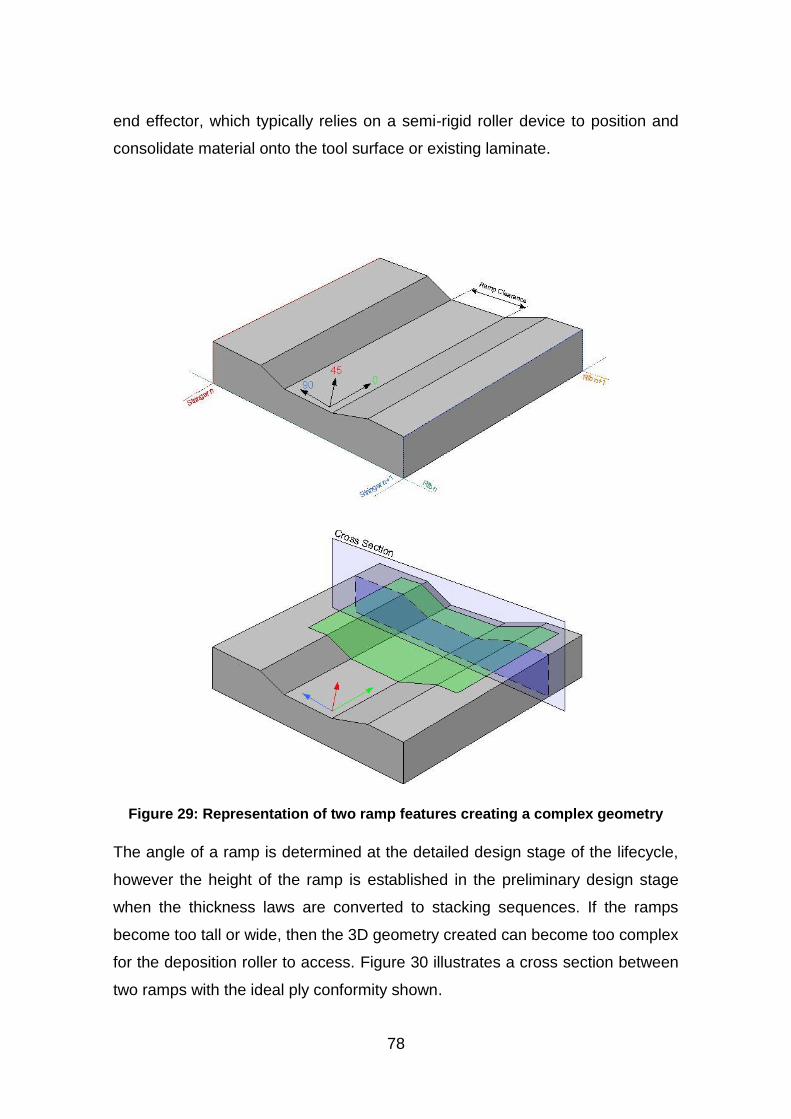
78
end effector, which typically relies on a semi-rigid roller device to position and
consolidate material onto the tool surface or existing laminate.
Figure 29: Representation of two ramp features creating a complex geometry
The angle of a ramp is determined at the detailed design stage of the lifecycle,
however the height of the ramp is established in the preliminary design stage
when the thickness laws are converted to stacking sequences. If the ramps
become too tall or wide, then the 3D geometry created can become too complex
for the deposition roller to access. Figure 30 illustrates a cross section between
two ramps with the ideal ply conformity shown.

79
Figure 30: Cross section of two ramps, showing ideal ply conformance
Figure 31 illustrates how a deposition roller larger than the clearance between
the ramps is unable to conform to the 3D geometry, and the material is not
adequately consolidated causing a manufacturing defect.
Figure 31: Roller unable to conform to geometry, leading to inadequate ply
consolidation
In order to reduce the severity of the defect, in some instances the deposition
roller can be manually reprogrammed during the manufacturing process so that
less material is deposited, and only a fraction of the surface of the roller is used.
Figure 32 illustrates only half of the material being deposited, enabling the roller
to be re-positioned in an orientation that improved material consolidation.

80
Figure 32: Improve ply consolidation, but at half deposition width
The drawback of halving the width of material deposited, is that the time taken to
deposit a full width of material is doubled. The deposition machine must also
reduce deposition speed when geometry is extreme as in this example. This
highlights how the ply boundaries that cause ramp features can also have a
negative effect on the cycle time of the automated deposition process, and in
extreme cases, can prevent the structure from being manufactured due to the
occurrence of unacceptable laminate defects.
This section describes the practice of modelling the effects of deposition machine
motion for each ply shape and fibre orientation. The benefit of this practice is by
enabling designed ply shapes to be changed with respect to the indicated
production speed.
3.4 Concluding remarks
In this chapter, three industrially derived use cases have been described, each
highlighting a different DFM challenge. In section 3.3.1 the methods used to size
the structure locally using a cell-by-cell approach were described and compared
with the global way that ply continuity between individual cells needs to be
evaluated. In section 3.3.2 the composite specific design rules are described, and
the ambiguity of the solution is highlighted by the unstructured methods that each
individual designer uses to apply the same rules to different designs. Finally, in
section 3.3.3 the manufacturing penalties for non-continuous plies are described
81
in the way of 3D ramps and ply boundary edge cuts, both negatively impacting
production cycle times by reducing deposition speed.
The use cases highlight a problem that is apparent at a stage in the design
lifecycle, but triggered by a decision made upstream in an earlier stage of the
design lifecycle. Problems with locally optimised cells in the preliminary design
stage not having adequate ply continuity are caused by a failure to evaluate
structures globally at the conceptual design stage. The same pattern is true for
detailed design, with the poor ply continuity and ramp features being seen at
detailed design, but caused by the absence of ply continuity evaluation tools at
the preliminary design stage.
With hindsight, it is relatively easy to see the source of errors in a high fidelity
design, but when the design fidelity is low, the information available at the time
does not intuitively highlight potential downstream problems to a designer. This
conclusion supports the research aim of building a strategy to apply DFM to a
design specifically using the tools used in early lifecycle stages, and considering
an automated manufacturing process.

82
4 STRATEGIES TO APPLY DFM USING DIGITAL TOOLS
The aim of this chapter is to identify a way in which DFM can be applied using
digital tools. The previous chapter highlighted the need to represent high fidelity
manufacturing constraints at a much earlier stage of the design lifecycle where
the design fidelity is very low, and in this chapter a strategy to achieve this for an
aerospace structure is described using an industrially relevant use-case and
physical validation trials. The research described in this chapter has been
published as a journal article by the author [95].
4.1 Introduction
In section 3.3 the three example use cases described how the shape of each ply
created during the preliminary design stage influenced the ply continuity, the
manufacturing process speed and the additional mass added to the design during
the downstream processes. These three DFM issues become areas to address
at the preliminary design stage.
4.1.1 Ply continuity
During the preliminary design stage, the structure is optimised for material
thickness and distribution of fibre orientations using a local cell by cell approach.
It is only at the detailed design stage that the discrete cells are joined together
and the distribution of the fibre orientations is adjusted to improve continuity [8].
An alternative approach is to perform the ply continuity adjustments during the
preliminary design stage.
The ply continuity requires the ply stacking sequences to be defined, but the
definition of these stacking sequences requires no other input than the thickness
laws already defined and the design rules that were defined in section 3.3.2. A
theory can therefore be tested where automating the generation of stacking
sequences, and improving the ply continuity could be achieved during the
preliminary design stages [95].

83
4.1.2 Manufacturing process speed
The manufacturing process speed is linked to the ply continuity because the ply
boundaries cause the deposition system to slow down to make the cut, and then
where a cut is made inside the overall component perimeter. Multiple cuts that
build up through the laminate in the same area lead to a ramp, which also causes
the deposition system to slow down. The theory that the simulated deposition of
different ply shapes can be evaluated against the degree of ply continuity
between neighbouring cells in the ply definition table can be evaluated with a use-
case example [95].
4.1.3 Added mass
The preliminary design assumes that all plies of different orientation join at the
cell boundaries. However, for the loads to be transferred efficiently between
discontinuous plies in neighbouring cells, they must be extended into the
neighbouring cell as an overlap. The overlaps then need to be extended by
different lengths in order to build up a gradient, and these overlaps add additional
mass to the preliminary design which is not accounted for in the structural
evaluation.
When the design rules are applied to a laminate, it is sometimes necessary to
add in an additional ply to satisfy specific rules such as symmetry. In these cases,
the thickness locally increases, and the thickness law changes, resulting in
increased mass.
4.2 Methods followed to apply DFM using digital tools
A method was defined in this research to describe the strategies to apply DFM
using digital tools. The method was identified by isolating the key process steps
required to manufacture a composite laminate using an AFP machine. When the
objective is to produce a physical component using an AFP machine, then the
previous process steps can be identified.
Prior to manufacturing a part using an AFP machine, the AFP machine requires
a digital program to control the machine motion during material deposition. The

84
program is created using software that allows the programmer to visualise the
machine motion. This digital simulation enables all of the machine motion to be
calculated in a 3D environment from a detailed design, and therefore a simulated
deposition time can be generated for any given component. The digital simulation
is dependent on detailed CAD data though, so a prior step is also required to
perform a manufacturing assessment using the preliminary design data that the
detailed design is based upon.
The low fidelity preliminary design data can be used to indicate the
manufacturability of the component prior to the completion of higher fidelity
detailed design stage and the simulation of the AFP process.
The steps followed in this research are:
1. Identify a method to measure ply continuity in a sizing array. Because
the 3D CAD model will not exist in the early stages of the design lifecycle,
the method must be applied to a cell-by-cell array of ply data. This is
demonstrated using some small ply shape examples. The benefit of
creating a method based on lower fidelity early-lifecycle data is the ability
to evaluate a design for manufacturability prior to incurring further costs to
increase the design fidelity.
2. Test ply continuity measures against a simulated 3D model. The
transition between a sizing array and a 3D model needs to be evaluated
so that the increase in design fidelity can be accounted for. Once the array
of ply data is measured for continuity, the designs must be scaled up to
3D models and evaluated using manufacturing simulation software.
Several ply shape examples with different levels of shape complexity and
ply continuity, but the same area, are used as use-cases.
3. Validate ply continuity measures with the manufacture of physical
parts. The designed use cases are then physically manufactured to
establish real-world cycle times, validating the simulations and the ply
continuity evaluation carried out using only the array of ply shape data
from the preliminary design stage.

85
In summary, small-scale use-cases are described to demonstrate the methods
and tools used to evaluate ply continuity scoring at different stages of the design
lifecycle.
4.3 Early lifecycle manufacturing evaluation
The trends identified in surveyed literature described in section 2.7, and the
industrial practice described in section 3.4, suggested that the earliest that an
estimation of the automated deposition cycle time can be produced is when a
laminate detailed design can be used to run a digital process simulation. The
drawback of using a digital process simulation is the requirement of the digital
tools to run from a detailed laminate CAD model, which is labour intensive to
produce. It is therefore very desirable to be able to perform a lightweight
simulation or estimation of the production process cycle time before any effort is
committed to creating a detailed design of the laminate. The following example
evaluates an opportunity to model the conceptual laminate design as a series of
simplified 2-dimensional arrays, or tables, specific to each layer in the laminate,
and then draw comparison between the area and boundary length of each layer
relative to a detailed design, simulation and physical ply layer manufacture.
Representing the laminate with a simplified 2-dimensional array for each ply has
been adopted because the approximate shapes are very similar to the structural
model of an aircraft structure such as a wing skin or fuselage panel. The sizing
data is stored in a compatible format.
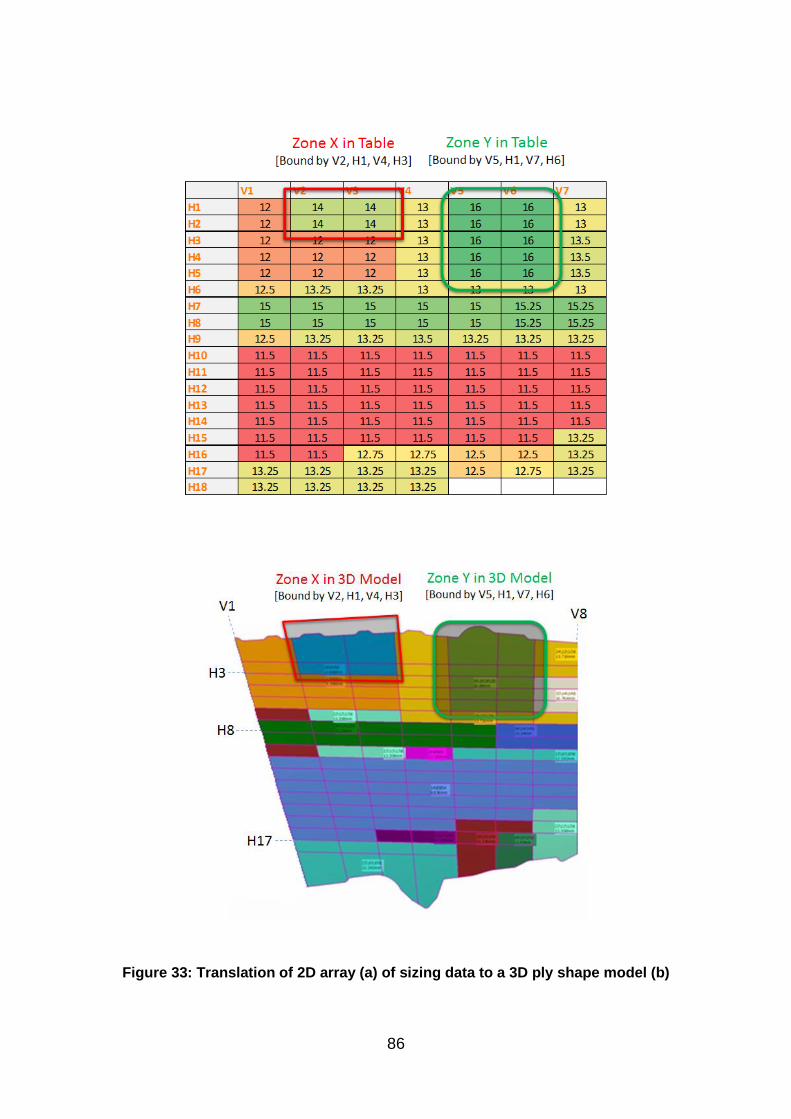
86
Figure 33: Translation of 2D array (a) of sizing data to a 3D ply shape model (b)
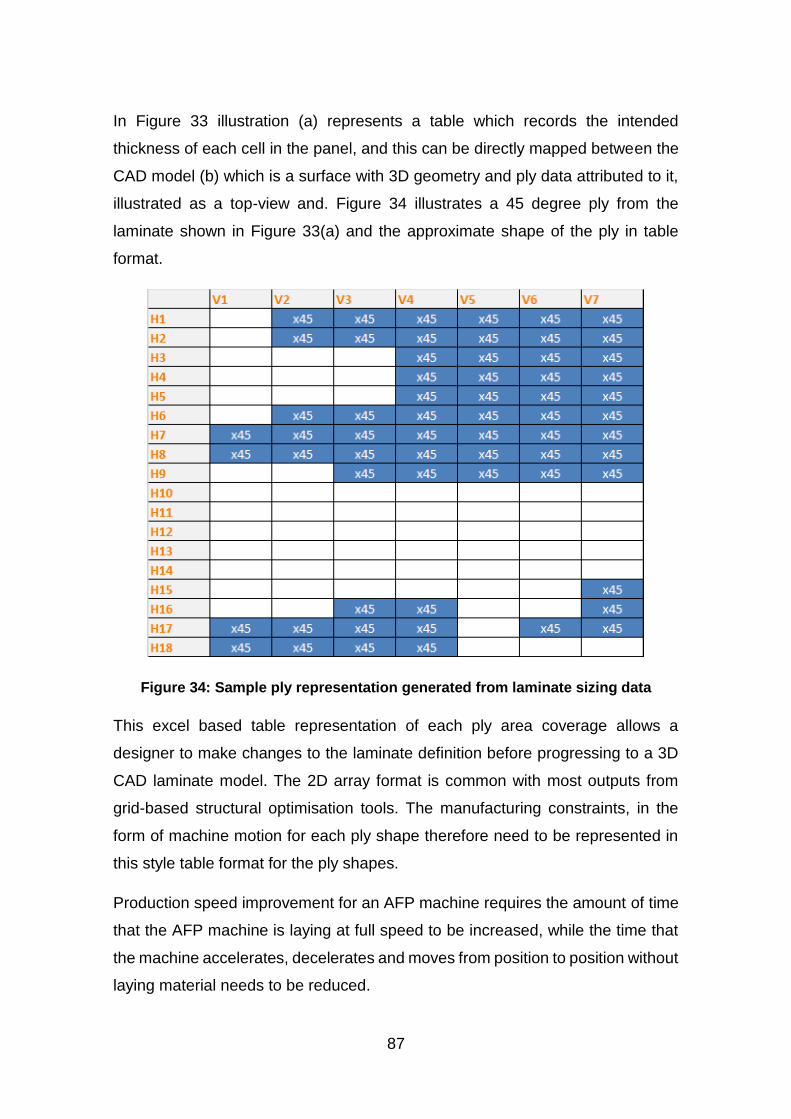
87
In Figure 33 illustration (a) represents a table which records the intended
thickness of each cell in the panel, and this can be directly mapped between the
CAD model (b) which is a surface with 3D geometry and ply data attributed to it,
illustrated as a top-view and. Figure 34 illustrates a 45 degree ply from the
laminate shown in Figure 33(a) and the approximate shape of the ply in table
format.
Figure 34: Sample ply representation generated from laminate sizing data
This excel based table representation of each ply area coverage allows a
designer to make changes to the laminate definition before progressing to a 3D
CAD laminate model. The 2D array format is common with most outputs from
grid-based structural optimisation tools. The manufacturing constraints, in the
form of machine motion for each ply shape therefore need to be represented in
this style table format for the ply shapes.
Production speed improvement for an AFP machine requires the amount of time
that the AFP machine is laying at full speed to be increased, while the time that
the machine accelerates, decelerates and moves from position to position without
laying material needs to be reduced.

88
Roller
Tool Surface
Docking Start Cut Stop
Roller
Approach
150mm
0.5m/s
Docking
160mm
0.1m/s
Laying
[X]mm
1.0m/s
Cutting
100mm
0.2m/s
Run-off
150mm
0.5m/s
Figure 35: Schematic of NCC’s deposition machine motion
The typical machine motion for laying a course of material over flat component is
shown in Figure 35. The machine accelerates along the tool surface until it
approaches the start of the ply, at this point the machine slows down as it feeds
material onto the roller. The machine accelerates up towards maximum
deposition speed. The machine motion then decelerates as it approaches the end
of the ply boundary so that the material can be cut. If the flat component had a
ramp feature in the centre, then the machine would also decelerate to negotiate
the ramp feature at a slower speed.
The deceleration can be directly linked to the ply boundary where the machine
trajectory is slowed down to perform cutting, turning or non-value-add motion
moving to the start of the next course. This suggests that a ply with large surface
area coverage, but a small perimeter boundary will be faster to produce than a
cell with smaller area coverage and a larger ply perimeter, or a fragmented ply
shape with high complexity and high aspect ratio. In these cases, a designer can
improve the manufacturing speed by reducing the amount of distance that an
AFP machine must travel without depositing material, as this is non-value added
in the cycle time.
4.3.1 Developing a ply continuity representation
For each ply in the laminate the fibre direction is identified, and the cells can be
assumed to either contain or not contain material occupancy. By moving through
the cells in the array one-by-one, the comparison of each cell to its neighbouring
cell can establish if a ply boundary is present, or if the cell is continuous with its
neighbouring cells. Looking at each ply as an array and building a score that

89
represents the ratio of number of boundaries by the number of cells occupied by
material allows a designer to create a numerical ply continuity score for each ply
shape generated.
The concept of cell occupancy was established as a result of excel tables being
used to represent ply shapes prior to creating 3D CAD geometry. The size of
each cell was not known until the CAD geometry was defined. At the conceptual
stage of the design lifecycle, the occupancy of the cell relative to its neighbours
could quickly and easily be measured and influenced.
The continuity score is calculated according to the following rules:
1. In a given direction, each cell with the same occupancy will contribute a
score of one to the tally.
𝐶𝐷𝑖𝑟𝑒𝑐𝑡𝑖𝑜𝑛 = 𝑁𝑢𝑚𝑏𝑒𝑟 𝑜𝑓 𝑐𝑒𝑙𝑙𝑠 𝑖𝑛𝑙𝑖𝑛𝑒 × 1
Equation 2: Ply continuity score for filled cells
In a cell-by-cell move in the given direction, any change in the occupancy status
reduces the directional continuity score tally by one.
𝐶𝐶ℎ𝑎𝑛𝑔𝑒𝑠 = 𝐶𝐶ℎ𝑎𝑛𝑔𝑖𝑛𝑔 𝐶𝑒𝑙𝑙𝑠 × −1
Equation 3: Ply continuity score for empty cells
2. The total tally is obtained by multiplying all directional tally.
𝐶𝑇𝑜𝑡𝑎𝑙 = [𝐶𝐷𝑖𝑟𝑒𝑐𝑡𝑖𝑜𝑛 1 + 𝐶𝐶ℎ𝑎𝑛𝑔𝑒𝑠 1] × [𝐶𝐷𝑖𝑟𝑒𝑐𝑡𝑖𝑜𝑛 2 + 𝐶𝐶ℎ𝑎𝑛𝑔𝑒𝑠 2]
Equation 4: Ply continuity score total
This is illustrated in Figure 37 and Figure 38, with a worked example shown in
Figure 39.

90
An approximation error exists because the method does not account for true 3D
ply shapes, only a 2D approximation with no reference to the dimensions of the
cells, which may not be square in the 3D design. There is also a likely error
derived from not being able to predict the behaviour of the machine at each
boundary interface. The method does not distinguish between a machine turning,
cutting or moving at a boundary.
Given a regular arrangement of grids where:
= filled cell
= empty cell
Figure 36: Representation of filled and empty cells
Continuity Scoring is calculated on a ply-by-ply basis, with the cell as the lowest
unit. Cells have occupancy status, they can be filled or empty. Every cell will
have an adjacency (neighbourhood) relationship with other cells.
An adjacency relationship between two cells having the same occupancy
status will contribute positively to the ply-based continuity scoring register.
An adjacency relationship between two cells of differing occupancy status
contributes negatively to the register.

91
For a group of two cells where the ply direction and machine motions is moving
horizontally from left to right (borders that trigger reductions are marked in red).
= two empty adjacent horizontal cells, C Horizontal = 2
𝐶𝐻𝑜𝑟𝑖𝑧𝑜𝑛𝑡𝑎𝑙 = 2𝐼𝑛𝑙𝑖𝑛𝑒 − 0𝐶ℎ𝑎𝑛𝑔𝑒𝑠 = 𝟐
Equation 5: Formula for two adjacent empty horizontal cells
= two filled adjacent horizontal cells, C horizontal = 2
𝐶𝐻𝑜𝑟𝑖𝑧𝑜𝑛𝑡𝑎𝑙 = 2𝐼𝑛𝑙𝑖𝑛𝑒 − 0𝐶ℎ𝑎𝑛𝑔𝑒𝑠 = 𝟐
Equation 6: Formula for two adjacent filled horizontal cells
= two adjacent cells with differing occupancy status, C horizontal = 1
𝐶𝐻𝑜𝑟𝑖𝑧𝑜𝑛𝑡𝑎𝑙 = 2𝐼𝑛𝑙𝑖𝑛𝑒 − 1𝐶ℎ𝑎𝑛𝑔𝑒𝑠 = 𝟏
Equation 7: Formula for different horizontal cell occupancy
Figure 37: Representation of different horizontal continuity scenarios

92
The same rules also apply for vertical adjacency checks, although the ply
direction and therefore the machine motion direction is horizontal, so the vertical
scores are halved.
= two empty adjacent vertical cells, C Vertical = 2
𝐶𝑉𝑒𝑟𝑡𝑖𝑐𝑎𝑙 = 2𝐼𝑛𝑙𝑖𝑛𝑒 − 0𝐶ℎ𝑎𝑛𝑔𝑒𝑠 = 𝟐
Equation 8: Formula for two adjacent empty vertical cells
= two filled adjacent vertical cells, C Vertical = 2
𝐶𝑉𝑒𝑟𝑡𝑖𝑐𝑎𝑙 = 2𝐼𝑛𝑖𝑙𝑖𝑛𝑒 − 0𝐶ℎ𝑎𝑛𝑔𝑒𝑠 = 𝟐
Equation 9: Formula for two adjacent filled vertical cells
= two adjacent vertical cells with different occupancy, C Vertical = 1
𝑪𝑽𝒆𝒓𝒕𝒊𝒄𝒂𝒍 = 𝟐𝑰𝒏𝒍𝒊𝒏𝒆 − 𝟏𝑪𝒉𝒂𝒏𝒈𝒆𝒔 = 𝟏
Equation 10: Formula for different vertical cell occupancy
Figure 38: Representation of different vertical continuity scenarios

93
4.3.2 Worked example of ply continuity scoring
𝐶𝐻𝑜𝑟𝑖𝑧𝑜𝑛𝑡𝑎𝑙 = 4 − 0 − 0 − 0 = 𝟒
𝐶𝐻𝑜𝑟𝑖𝑧𝑜𝑛𝑡𝑎𝑙 = 4 − 1 − 0 − 1 = 𝟐
𝐶𝐻𝑜𝑟𝑖𝑧𝑜𝑛𝑡𝑎𝑙 = 4 − 0 − 0 − 0 = 𝟒
𝐶𝑉𝑒𝑟𝑡𝑖𝑐𝑎𝑙 = 3 − 0 − 0 = 𝟑
𝐶𝑉𝑒𝑟𝑡𝑖𝑐𝑎𝑙 = 3 − 1 − 1 = 𝟏
𝐶𝑉𝑒𝑟𝑡𝑖𝑐𝑎𝑙 = 3 − 1 − 1 = 𝟏
𝐶𝑉𝑒𝑟𝑡𝑖𝑐𝑎𝑙 = 3 − 0 − 0 = 𝟑
𝐶𝑇𝑜𝑡𝑎𝑙 = [4 + 2 + 4] × [3 + 1 + 1 + 3] = 80
Figure 39: Example ply continuity calculation
Figure 39 shows a 12 cell array scoring 80 from a potential 144, so the continuity
score for this shape is 55%.
𝑃𝑙𝑦 𝐶𝑜𝑛𝑡𝑖𝑛𝑢𝑖𝑡𝑦 𝑆𝑐𝑜𝑟𝑒 % =𝐶𝑎𝑙𝑐𝑢𝑙𝑎𝑡𝑒𝑑 𝑠𝑐𝑜𝑟𝑒
𝑀𝑎𝑥𝑖𝑚𝑢𝑚 𝑎𝑣𝑎𝑖𝑙𝑎𝑏𝑙𝑒 𝑠𝑐𝑜𝑟𝑒
Equation 11: Equation to calculate ply continuity score as a percentage
In this example, the indicator of machine deposition speed is a summation of the
ply continuity score for each of the plies in the laminate, represented as a
percentage. An actual time is not calculated, as this method is only appropriate
to compare two designs to establish which option is likely to be faster to
manufacture.
The approach of comparing two very low fidelity concepts enables a direct
comparison to be made between multiple concepts using the same assumptions,
1 2 3 4
5 6 7 8
9 10 11 12

94
but a a very early stage in the design lifecycle prior to any 3D CAD geometry
being created.
The ply continuity score can be easily automated to score sizing data which is
tabulated in an array, but it does not account for real life geometry due to the
absence of any 3D CAD geometry at this early stage of the design lifecycle.
Figure 33 shows the visible difference in size of the cells when data is translated
from the table of uniform cells to a 3D CAD model. An alternative measure is to
look at ply complexity instead.
Ply complexity is a ratio of the perimeter of the ply boundary to the area of the ply
and is based on the tacit knowledge that this ratio influences manufacturing
process i.e. the more complex the shape of a ply the more time it takes to lay that
shape because the machines have to slowdown to make the necessary material
cuts.
The equation to calculate the complexity score for a given ply is:
𝑃𝑙𝑦 𝐶𝑜𝑚𝑝𝑙𝑒𝑥𝑖𝑡𝑦 % =𝑃𝑙𝑦 𝐴𝑟𝑒𝑎
𝑃𝑙𝑦 𝑃𝑒𝑟𝑖𝑚𝑒𝑡𝑒𝑟
Equation 12: Ply complexity equation
For the two sample ply shapes shown in Figure 22, ply A and ply B, the complexity
score can be calculated as:
𝑃𝑙𝑦 𝐴 𝐶𝑜𝑚𝑝𝑙𝑒𝑥𝑖𝑡𝑦 =15
16= 𝟗𝟑. 𝟕𝟓%
𝑃𝑙𝑦 𝐴 𝐶𝑜𝑛𝑡𝑖𝑛𝑢𝑖𝑡𝑦 =15 × 15
225= 𝟏𝟎𝟎%
Equation 13: Ply evaluation for ply A
𝑃𝑙𝑦 𝐵 𝐶𝑜𝑚𝑝𝑙𝑒𝑥𝑖𝑡𝑦 =15
20= 𝟕𝟓%
𝑃𝑙𝑦 𝐴 𝐶𝑜𝑛𝑡𝑖𝑛𝑢𝑖𝑡𝑦 =19 × 17
625= 𝟓𝟐%
Equation 14: Ply evaluation for ply B

95
Although the ply complexity scoring mechanism is enables rapid evaluation of
various play shapes, the main limitation is that it does not fully account for the
actual complexity of automated manufacturing process.
4.4 Validation of the strategy using higher fidelity design data
In order to test the method of scoring the continuity of plies as an indication of
cycle time, four laminate panels were designed and scored using the ply
continuity method. These laminates were then modelled in CATIA V5 Release 19
and their automated manufacture was simulated using software from MAG
Cincinatti called ACES v2 to derive a predicted cycle time for AFP manufacture.
The simulation approach enabled the flat coupons to be modified to suit curved
tooling surfaces and also scalled to a larger size to establish if the effects of ply
shape complexity scaled proportionally with ply size and ply geometry.
Figure 40: Visualisation of the AFP program simulation software being run on
two different ply shapes, on a curved tool surface representative of a fuselage

96
All four laminates have the same surface area and the same number of plies and
ply orientations. Only the boundary of the laminate was changed each time to
increase the complexity and fragmentation of the ply shapes. The first, simplest
and last, most complex coupons are illustrated in Figure 40 showing the
simulation being visualised on a curved surface.
4.4.1 Validation results
The coupon ply shapes are shown (for a 45 degree ply) in Table 12.

97
Table 12: Coupon shapes based on 45 degree ply
Coupon 1
The shape of coupon 1 is intended to
create the most simple ply contour
possible.
Coupon 2
The shape of coupon 2 is based on
coupon 1 but features two perimeter
areas where material is removed, and
two where material is added. The design
has the same area as coupon 1.
Coupon 3
The shape of coupon 3 is based on
coupon 1, and includes a hole cut from
the centre of the ply in addition to
perimeter features where material is
removed and added. The hole in the
centre is not affected by minimum cut
length constraints. The design has the
same area as coupon 1.
Coupon 4
The shape of coupon 4 is based on
coupon 1 but is entirely fragmented so
that no cell in the array has full
adjacency. The shape still includes a
hole and the area is designed to be the
same as coupon 1.

98
The coupons were digitally simulated to obtain estimated cycle times and the
results are shown in Table 13. This shows that when the area of each coupon is
kept constant, but the complexity is changed to increase the length of each ply
perimeter, the machine deposition time increases. ACES v2, configured with
Coriolis machine parameters was chosen to perform these simulations.
Table 13: Simulation results for 4 coupons
Ply Perimeter
Length (mm) /
Area (m2)
Ply
Complexity
Score
Ply
Continuity
Score
Simulated
Cycle Time
(S)
Coupon 1 2705 / 0.427 16% 100% 1692
Coupon 2 4606 / 0.435 9% 75% 2268
Coupon 3 5699 / 0.437 8% 50% 2628
Coupon 4 6974 / 0.441 6% 34% 3132
The manufacturing process simulation results show that each method of
evaluating manufacturing complexity is able to generally predict the correct trend,
where increased complexity is relative to longer production cycle times, however
the different methods do not accurately align. This is illustrated when the
simulated cycle time for each successive component is plotted against ply
continuity scores and ply complexity scores. This is shown in Figure 41, with the
coupons being represented in the X axis as a coupon perimeter divided by the
coupon area. This measure was selected as very small fluctuations in the coupon
area were present due to the addition of material required to suit the AFP process
known as minimum cut length, MCL, extensions. The values from the simulation
are averaged from the manufacture of 4 ply orientations for each shape, 0 degree,
45 degree, 90 degree and 135 degree.

99
Figure 41: Graph showing simulated deposition rate, continuity score and
complexity score per coupon
The continuity scores are close in value to the deposition rates generated using
simulation tools. The complexity scores were generated twice, once using only
the 2D sizing data prior to the 3D ply design being created, and then at a later
stage in the design lifecycle using the 3D data from the ply design. All three
methods for scoring the ply shapes predicted the correct trend in decreasing
deposition rate. The ply continuity method and 2D ply complexity scores obtained
similar trend profiles, but the 3D complexity score predicted the closes trend
profile to the simulated data.
100%
75%
50%
34%
100%
50%
39%
33%
16%
9% 8%6%
0.36
0.27 0.24
0.20
0.00
0.05
0.10
0.15
0.20
0.25
0.30
0.35
0.40
0%
10%
20%
30%
40%
50%
60%
70%
80%
90%
100%
6334.894614 10588.50575 13041.18993 15814.05896
Dep
osi
tio
n R
ate
kg/H
Sco
res
Coupon Perimeter/Area
Simulated validation of scoring methods
Continuity Scores Complexity Scores (2D)
Complexity Scores (3D) Simulated Depoition Rate

100
4.5 Validation of the design using physical trials
The four coupons were manufactured using a Coriolis AFP machine to obtain
accurate and realistic cycle times to validate both the simulation results and the
ply continuity scores. An example of coupon 4 at each stage of the life cycle is
shown in Figure 42.
Figure 42: Coupon 4, design lifecycle from preliminary design to manufacture
4.5.1 Definition of the physical trial coupons
Each of the four coupons transitioned from a preliminary 2D design in excel,
through to a CAD model in CATIA with 3D geometry and ply definitions, and then
finally each coupon was manufactured as a laminate with each of the principle
fibre orientations, 0 degree, 45 degree, 90 degree and 135 degree.
The definition of the coupons is shown in Table 14, with the design shown in 2D,
virtual 3D and then real life 3D for each coupon. The increase in fidelity between
the designs can be seen with the additional corner material representing the extra
material that must be added to diagonal corners to satisfy the minimum cut length
requirements of the AFP machine. The minimum cut length is not factored into
the 2D design, but it appears in the CAD design and has the effect of altering the
ply perimeter length and surface area ratio.

101
Table 14: Table showing stages of design for each coupon
Preliminary Design Detailed Design Manufactured Component
Coupon 1
Coupon 2
Coupon 3
Coupon 4
V1 V2 V3 V4 V5 V6 V7
H1
H2 1 1 1 1
H3 1 1 1 1
H4 1 1 1 1
H5 1 1 1 1
H6 1 1 1 1
H7 1 1 1 1
V1 V2 V3 V4 V5 V6 V7
H1 1
H2 1 1 1 1
H3 1 1 1 1 1
H4 1 1
H5 1 1 1 1
H6 1 1 1
H7 1 1 1 1 1
V1 V2 V3 V4 V5 V6 V7
H1 1 1
H2 1 1 1
H3 1 1 1 1 1 1 1
H4 1 1 1 1
H5 1 1
H6 1 1 1 1 1
H7 1
V1 V2 V3 V4 V5 V6 V7
H1 1 1 1
H2 1 1 1
H3 1 1 1 1
H4 1 1 1 1 1 1
H5 1 1
H6 1 1 1 1
H7 1 1

102
4.5.2 Comparison of the different methods
To be able to convert the increasing cycle times from the simulation and the
physical trials into a percentage that is comparable to the continuity score the
results for the square coupon (coupon 1) have been taken as the optimum 100%
solution. The times for other components are inverted (1 ÷ time) and then divided
by the time for the first coupon to generate a percentage value. The values are
colour coded to highlight red as the slowest and poorest values, through to green
for the fastest and most promising values in Table 15.
Table 15: Results from physical trials compared with simulation and continuity
scores
The continuity scores and the simulated cycle times follow the same trend, but
as complexity increases the basic continuity score and the higher fidelity process
simulation both start to diverge from the actual cycle times. This can be seen in
the graph of the results from Table 15, Figure 43.

103
Figure 43: Graphic representation of the values from Table 15
Figure 43 shows the results displayed graphically, with coupon ply perimeter in
mm displayed on the x-axis and the percentage score displayed on the y-axis.
The common trend of increasing perimeter/area ratio to decreasing production
cycle time can be seen.
The simulated data for the four coupons provided a smooth profile in the graph
illustrated in Figure 43. The increase in coupon perimeter is not uniform for the
CAD data, but the excel table is not able to capture the magnitude of the increase
because it does not account for exact geometrical measurements, only an
approximation of shape and scale. Whilst for both the simulation results and the
continuity scores, each coupon decreases in manufacturing speed, the exact
amount of decrease is not well aligned. The coupons were also smaller than ideal
50%
34%
75%
64%
54%
100%
90%
83%
77%
30%
40%
50%
60%
70%
80%
90%
100%
110%
6000 8000 10000 12000 14000 16000
Co
nti
nu
ity
Sco
re (
%)
Coupon Perimeter/Area
Score/Simulation/Physical
Continuity Scores Simulated as measure of coupon 1
Actual as measure of coupon 1

104
for this kind of research because the flat tool available for the trials was limited to
1.2m by 1.2m in size, and the CAD models had to be reduced in scale to fit. Whilst
the excel file is dimensionless and therefore unaffected by the scaling, the gaps
between ply boundaries in the more complex coupons were very close together,
restricting the opportunity for the AFP machine to accelerate to full speed during
the simulation and physical trials.
4.6 Concluding remarks
In this chapter, three example use-cases have been used to describe how to
evaluate the manufacturability of a design using automated fibre placement at
three different stages in the design lifecycle. The methods to estimate
manufacturability at a preliminary design stage, the simulation carried out at the
detailed design stage and the physical coupons manufactured all generate the
same trend of the assessment score decreasing as the ply shape complexity
increases. However, the greater the complexity of the ply shapes, the more the
results diverge as the simulation and ply continuity score fail to capture the full
effects of complexity at their lower fidelity stages of design maturity.
To perform a simulation of the deposition process, the designer is required to
create a high fidelity CAD model of the laminate, specifically defining the
boundary of each ply and the orientation of the fibres. This process requires a
skilled designer and takes time. For a large and complex structure like a carbon
fibre aircraft wing, the design process can take over six weeks. Because the
scoring methodology is able to identify the correct trend in deposition time relative
to ply shape complexity, the basic laminate design can be evaluated for
production speed without the need for a higher fidelity design. This enables
multiple basic laminate designs to be quickly evaluated and adjusted for
production potential before committing design resource to their development.
Prior to this research, it was not known if the variance in each alternative design
could be modelled to estimate cycle time without the presence of a detailed
design. The research proves that variations in the laminate conceptual design
can be evaluated during a conceptual design review using the methodologies
described in section 4.2, without the need for detailed design data.

105
The definition of the ply shapes of the four coupons did not account for the
minimum cut length required in the manufacturing process to produce 45 degree
and 135 degree plies, which adds a small tab of extra material to some corners
of the ply shape. A minimum cut length of 90mm was required for the AFP
machine configuration used in the physical trials, but this is only applied to
external corners in specific directions. When each coupon is compared, the
quantity of corners that needed to be extended for minimum cut length did not
uniformly increase as the complexity of each coupon increased, since each
coupon had a different number of corner additions. The additional surface area
and associated deposition time to manufacture these minimum cut length
features impacted the cycle times of the AFP production, and whilst this is
accounted for in the simulation, the scoring methodology does not identify or
account for minimum cut length complexity. The study suggests that whilst not all
of the complexities are represented in the continuity scoring method, it is still able
to predict a valuable trend when comparing multiple design solutions, and this
can be used to aid concept selection and help improve preliminary designs to
ensure that DFM is applied.

106
5 DESIGN PROCESS AND SUPPORTING TOOLS FOR
DFM
This chapter explains how a generic design process can be defined that will
enable DFM to be systematically applied to composite components that will be
manufactured using automated manufacturing technologies. Chapter 4
highlighted how ply continuity could be represented at an earlier stage of the
design lifecycle, but also identified that another manufacturing constraint, the
minimum cut length, was neglected at preliminary design, leading to divergence
in the results. The systematic approach must therefore be able to identify which
manufacturing constraints are significant enough to represent at an earlier design
stage, and be able to sort these by relevance in order to prevent the preliminary
design stage from becoming too detailed.
5.1 Introduction
The challenge of developing a strategy that enables a designer to ‘design for
manufacture’ can be split into two steps. First, a designer needs a method to
analyse the manufacturing potential of a design solution, and secondly, the
designer needs a process which maps the analysis directly to the design intent,
so that each manufacturing outcome can be linked to a design decision made
earlier in the design lifecycle. This enables the designer to analyse how effectively
the design can be manufactured.
Design for manufacture is widely reported in literature and in industry, albeit with
few examples targeting specifically automated deposition of composites.
However, the creation and use of a systematic approach is not currently
described in literature.
5.2 Methods followed in this research
The methods followed in this chapter incorporate three stages. Firstly, a review
of literature published in the field of design processes was required. The initial
literature survey carried out in chapter 2 focused on composite manufacturing
and DFM. The second stage involved testing the methods identified in the

107
literature survey on an automated composites manufacturing design process.
The final stage was to develop use cases based on a composite component
manufactured using an automated deposition process to establish if the design
process could identify the relevant manufacturing constraints in a format that
enabled them to be adopted into the earlier design lifecycle stages.
The majority of research carried out in the field of advanced laminates or
curvilinear fibre path laminates is specific to the AFP or ATL manufacturing
technology because these technologies accurately deposit composite fibres
along defined fibre paths. Most other automated deposition processes such as
filament winding, braiding and broad goods deposition are unable to control
steered fibres to the same degree of accuracy, limiting the degree of design
tailoring available. Within each AFP and ATL process there are process variables
that are specific to the machine, material and environment that may be different
from machine to machine and different for alternative materials, and as such, the
design rules may change depending on the selection.
The reviewed research articles relating to DFM and composites focused on
specific tools or specific design features but did not describe an underlying
process that could be used to implement DFM. For example, in industry it is
common practice to perform a failure mode, effect analysis (FMEA) on any new
manufacturing process as a final check before adopting the new process. The
FMEA process is generic enough to be applied to any manufacturing process,
and will help to highlight any potential manufacturing failures and develop
appropriate mitigations.
For composite DFM, instead of documenting the specific design and
manufacturing considerations for a single machine and material, the method of
identifying and negotiating conflicts between the manufacturing constraints and
the design intent can be evaluated. This generic process can then be followed to
identify and negotiate conflicts arising from a new material selection, or if
manufacture is planned on a different machine.
In the literature review, the most relevant articles relied on process FMEA to
provide the analytical structure required to evaluate the design lifecycle [98].

108
The method in this chapter is adapted from the commonly used Process FMEA.
This approach is used to identify potential problems with a manufacturing process
ahead of production at an earlier stage of the design lifecycle, and relies on user
experience while following a structured analysis to attain a confident set of
results. Whilst FMEA is commonly used to identify risk in a process or product,
this chapter looks at adapting it to identify risk in each design step.
A standard Process FMEA consists of 5 stages:
Capture potential failure modes
Analyse the effects of these failure modes
Establish root causes
Quantify the severity
Prioritise corrective/preventative actions
The data is typically taken from quality reports, for historic problems, and design
representations for future problems. A team of assessors who have relevant
subject matter experience carry out the analysis.
In order to utilise an FMEA approach to this composites design for manufacture
problem the 5 steps need to be adapted to make them more suitable.
5.3 Need for systematic design process
The challenge of creating a detailed composite design is being able to resolve
the conflicting requirements of the manufacturing process, and the performance
requirements of the design. Each conflict arises when the design objective is
different from the manufacturing objective. Whilst this makes for an interesting
multi-objective optimisation problem, being able to establish what good looks like
in respect to design objectives and manufacturing objectives is the reason why a
requirement to follow a design process exists.
When designing in a concurrent engineering environment, different designers will
be responsible for the design of different components in an assembly. If any
ambiguity exists around how to satisfy conflicting requirements, and there isn’t a
process in place to control the decisions, then different designers can generate

109
different solutions in terms of performance and cost to manufacture, which is
undesirable when the components are assembled into a complete system.
5.4 Design process flow
The standard process steps of an FMEA have been adapted to suit the challenge
of novel composites designs:
1. Capture potential failure modes – in the context of a composite design the
failure mode constitutes any design decision made upstream of
manufacturing in the design lifecycle. Although a decision isn’t strictly a
failure, to exhaustively assess all of the process steps it is assumed that
each design decision could have a negative effect on the manufacturing
process, or be an opportunity to improve the manufacturing process.
2. Analyse the effects of these failure modes – in the context of composite
design the effects of the failure modes either alter the design, or slow down
the production speed, or exist as a combination of both.
3. Establish root causes – the root causes should identify the design decision
and guidance on how the decision could affect the manufacturing process.
4. Quantify the severity – Any conflict between ‘good for design performance’
and ‘good for manufacture performance’ should be ranked for severity.
5. Prioritise corrective/preventative actions – Guidance should consider the
severity, so outcomes rating high in one discipline and low in the other
default to the recommended outcome, and situations where severity is
equal between design and manufacture, adequate information is provided
to help an engineer make an informed decision.
The FMEA approach was systematically applied to all of the design steps from
concept to detailed design for the AFP process to create a design process. The
process flow is recorded in section 5.4.1 through to section 5.4.4. The resulting
process contained 28 steps which is defined in section 5.4.5. The effects, root
causes, severity and corrective actions were all recorded in greater detail in
Appendix A.

110
The experts who were part of the FMEA assessment panel are described in Table
16.
Table 16: Experts used for FMEA process
Expert ID Area of expertise Location Years of
experience
Expert 1 AFP Manufacturing
Optimisation
Industry:
Aerospace &
Defence
13
Expert 2 Detailed design of
composite structures & AFP
Machine programming
Industry:
Aerospace &
Defence
17
Expert 3 Preliminary and detailed
design of composite
structures
Industry:
Aerospace
13
The design process flow is summarised as a generic design process to suit
automated composites manufacturing technologies in sections 5.4.1 to 5.4.4. The
design process is described in higher fidelity in section 5.4.5 with an physical part
used as an example for the specific dry fibre AFP process. This is illustrated in
Figure 44.
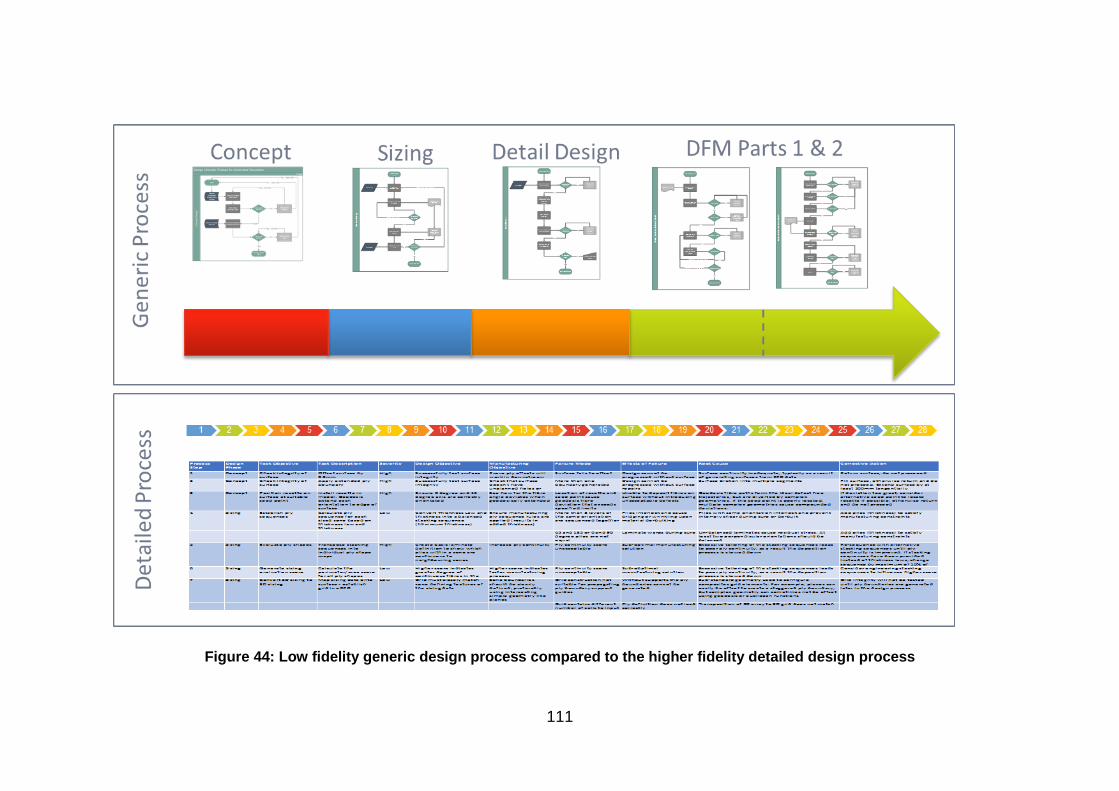
111
Figure 44: Low fidelity generic design process compared to the higher fidelity detailed design process

112
5.4.1 Process for conceptual design
The conceptual design phase for a composite component starts with a low fidelity
CAD surface, typically with no thickness data available for it, but sufficient fidelity
to show the overall shape of the composite structure. In the aerospace industry,
this CAD data is usually the aerodynamic surface for the composite structure.
The first practice identified by the experts listed in Table 16 was the surface offset
check and the ply boundary check. These serve as early indicators of the
suitability of the CAD surface. Since all composite layers that will be digitally built
onto this surface will need to be offset by a ply thickness, and be constrained with
a perimeter boundary, these checks highlight any low quality CAD and prompt it
to be repaired prior to progressing the design. This process loop is illustrated in
the upper section of the process flow in Figure 45.
Once the input CAD surface has been checked and passed, the rosette definition
must be checked. The rosette determines how the designed fibre orientations will
be interpreted, and consists of a vector for each listed ply orientation, positioned
around a single point positioned on the CAD surface. The experts described the
practice of extending the fibre orientation vectors from the rosette and maintaining
a trajectory that is normal to the surface. This is known as a geodesic trajectory
in design terms. The trajectories are expected to deviate from a straight course if
the surface exhibits geometric complexities such as tapers, joggles and ramps,
however the severity of the deviation is related to the starting position of the
rosette. If the rosette check highlights that the trajectories are deviating by more
than the allowable angle, then the rosette must be re-positioned. In the aerospace
industry, the allowable angle is typically 3 degrees.
If all of these checks are passed, the design can progress into the structural sizing
stage of its lifecycle.
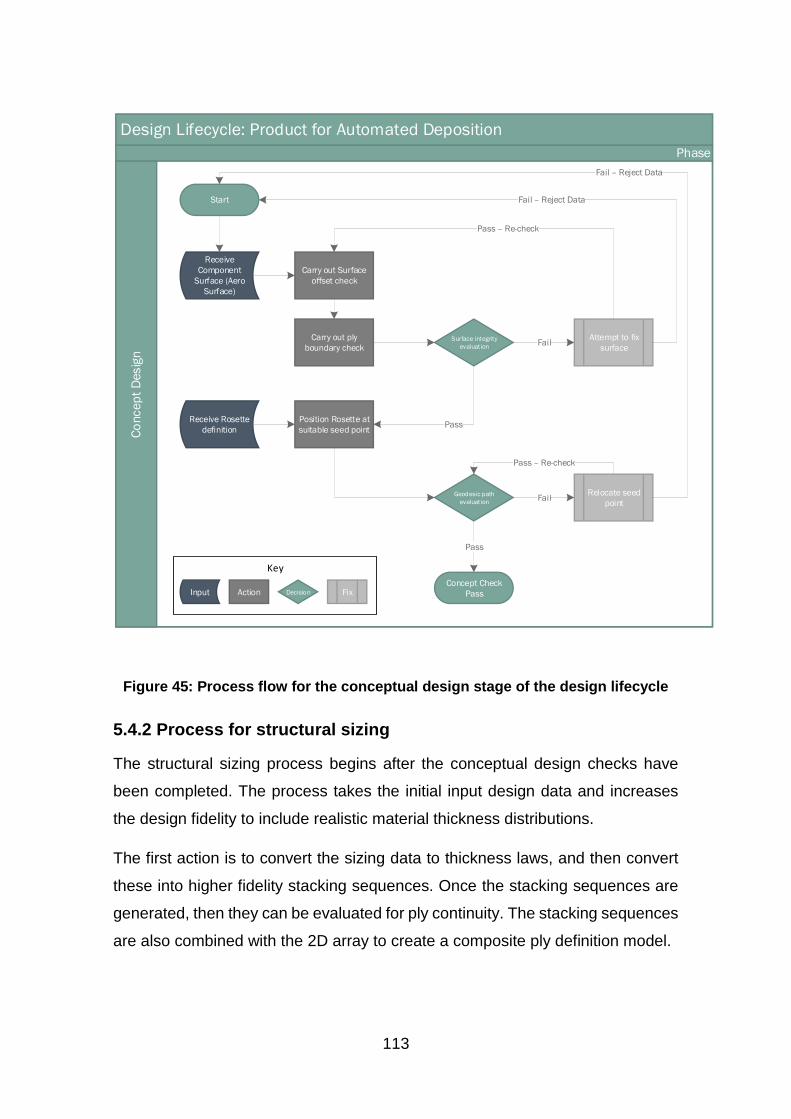
113
Design Lifecycle: Product for Automated DepositionC
oncep
t D
esig
n
Phase
Receive
Component
Surface (Aero
Surface)
Carry out Surface
offset check
Carry out ply
boundary checkSurface integrity
evaluation
Start
Attempt to fix
surfaceFail
Position Rosette at
suitable seed pointPass
Fail – Reject Data
Pass – Re-check
Receive Rosette
definition
Geodesic path
evaluation
Relocate seed
pointFail
Fail – Reject Data
Pass – Re-check
Concept Check
Pass
Pass
Key
Input Action Decision Fix
Figure 45: Process flow for the conceptual design stage of the design lifecycle
5.4.2 Process for structural sizing
The structural sizing process begins after the conceptual design checks have
been completed. The process takes the initial input design data and increases
the design fidelity to include realistic material thickness distributions.
The first action is to convert the sizing data to thickness laws, and then convert
these into higher fidelity stacking sequences. Once the stacking sequences are
generated, then they can be evaluated for ply continuity. The stacking sequences
are also combined with the 2D array to create a composite ply definition model.

114
The ply continuity evaluation enables the concept to be evaluated for
manufacturability, and gives the designer the opportunity to revise the stacking
sequence to improve the ply continuity score before progressing to the generation
of ply shapes.
After the manufacturing ply shapes have been generated, a comprehensive set
of manufacturing scores such as ply continuity and ply complexity can be
generated. By combining the composite ply definition with the 3D CAD surfaces,
the 2D sizing data can be represented as a 3D CAD model and a preliminary
evaluation of manufacturability can be carried out.
If the manufacturability evaluation generates an unacceptable score, then the
process loops back to the thickness laws to request changes to further improve
ply continuity. This is illustrated in Figure 46.
If the manufacturing evaluation is acceptable, then the design can progress to
the detailed design stage of the design lifecycle.

115
Figure 46: Process flow for the structural sizing stage of the design lifecycle
5.4.3 Process for detailed design
The detailed design stage starts with a structurally sized component which has
passed the manufacturing evaluation check in the structural sizing (preliminary
design) stage of the design lifecycle.
Str
uct
ura
l Siz
ing
Concept Check
Pass
Sizing DataConvert to
thickness laws
Convert to stacking
sequences
Create initial ply
shapes
Generate
manufacturing
scores
Convert 2D to 3D
sizing
Composite ply
definition
Manufacture
evaluation
Score Input
Data
Fail – Improve thickness laws
Sizing check Pass
Pass
Pass
Ply continuity
evaluationFail – Improve stacking
CAD Model

116
The first design step is to configure the ramps and clearances required to
accommodate changes in thicknesses. If the rate of change of thickness between
neighbouring cells is too great, the selected deposition machine may not be able
to access the geometry and the ramp rates will need to be reduced, which causes
mass to increase.
If the ramp check is passed, then the ply definition model and laminate attributes
can be added to the 3D model to further improve the design fidelity. At this stage,
the individual ply layers in the structure can be visualised in 3D, and a more
accurate ply shape assessment can be made.
If the ply shape assessment results in a poor score, the stacking sequences will
require re-sequencing to improve ply continuity. If the ply shape assessment
results in an acceptable score, the CAD tool can be used to generate high fidelity
ply boundaries. When these high fidelity ply boundaries are assessed, any
failures are entirely attributable to the 3D surface and not the sizing data, so the
failed design must regress back to the conceptual design stage so that the 3D
surface can be improved. If the ply shape assessment results in a pass, then the
design can progress to the DFM stage of the design lifecycle. This is illustrated
in Figure 47.

117
De
tail
Desig
nSizing check Pass
CAD ModelConfigure ramps
and clearances
Import sizing data
from composite ply
definition
document
Add laminate
attributes
Visualise the ply 3D
stacking solution
Generate detailed
ply boundaries
Ramp/Machine
compatible?
Reduce ramp
ratesFail
Pass
Continuity
acceptable
Pass
Re-sequence
plies/cells to
improve
continuity
Fail
Ply boundary
check Go back to Concept
stage
Detail Design Pass
Pass
Fail
Figure 47: Process flow for the detailed design stage of the design lifecycle
5.4.4 Process for DFM
The process for DFM begins with a completed detail design. The first design step
is to define the deposition strategy, as this establishes the manufacturing
constraints that will form the basis of the DFM activities carried out in this phase

118
of the design lifecycle. This information includes key characteristics such as the
minimum cut length for the selected machine, the dimensions of the deposition
roller and the motion performance values for the deposition system.
With the manufacturing system data now know, the ply boundaries can be revised
to accommodate the machine specific manufacturing constraints such as
minimum cut lengths. There are multiple different ways to account for minimum
cut lengths, so a ply boundary assessment loop is used to check and adapt the
ply boundaries. This is illustrated in Figure 48.
The next step of the design process is focused on the generation of geodesic
guide curves which form the guide for fibre trajectories deposited by the
deposition machine. The guide curves are created using the rosette, and whilst
the guide curves can be steered, they must remain geodesic (normal to the
surface) around any complex geometry such as corners or ramps. The designer
must steer the guide curves to enable geodesic compliance around the complex
features, but without exceeding the steering or angular deviation limits set by the
deposition strategy. To enforce this, the process introduces assessment and
adaption loops for geodesic, steering and angular deviation checks. This is
illustrated in Figure 48.
The next step is to generate ply coverage by defining where each strip of material
will be deposited. The trajectories can converge or diverge, and their positioning
on the surface relative to each other will cause either gaps or overlaps in the ply
coverage. The gap and overlap limits are defined in the deposition strategy, so
the process introduces three different gap checks for course to course gaps, tape
to tape gaps and overlaps. If any fail to meet the criteria of the deposition strategy,
the guide curves must be adapted and regenerated.

119
De
sign f
or
Ma
nufa
ctu
re: P
art
1
Detail Design Pass
Revise initial ply
contours
Deposition strategy
Apply minimum cut
length adaptionsMCL Check
Defect Check
Generate initial
guide curvesGeodesic Check
Generate
remaining guide
curves
Angle Check
Steering Check
Pass
Pass
Pass
Pass
DfM Part 1 Pass
Pass
Revise
minimum cut
lengths
Fail
Adapt ply
boundaries to
prevent tapes
lifting
Fail
Generate
alternative
guide curves
Fail
Fail – Re-generate guide curves
Fail = Re-generate guide curves
Figure 48: Process flow for the first part of the DFM stage of the design lifecycle
The laminate quality requirements are used to establish the constraints for the
ply stagger and convergence strategy. The ply stagger ensures that the gaps in
the laminate do not align out of plane when more plies are deposited on top of

120
existing plies. The convergence strategy is required for joining two adjacent plies
which are not parallel to each other.
Any areas which may become highly consolidated during the deposition process
need to be identified at this point, as the designer can introduce gaps to aid with
resin flow in these areas. The process introduces a check for consolidation which
triggers a loop to improve the amount of gaps locally where high consolidation is
anticipated. This is illustrated in Figure 49.
The next design step is to generate the geometry required to support the
deposition strategy. Each ply requires a unique guiding geometry set since
reusing the trajectories from a previous ply would cause the gaps and overlaps
to align and therefore fail to meet staggering requirements. Once guiding
geometries have been defined, all of the ply coverage in the laminate can be
generated. If the ply coverage fails to generate, the guiding geometry needs to
be revised.
The final design step is to simulate the deposition process. The simulation checks
that the deposition machine can access the component and tooling adequately.
If the tool cannot be accessed then it can be re-positioned in the deposition cell
and re-simulated. This loop is illustrated in Figure 49.
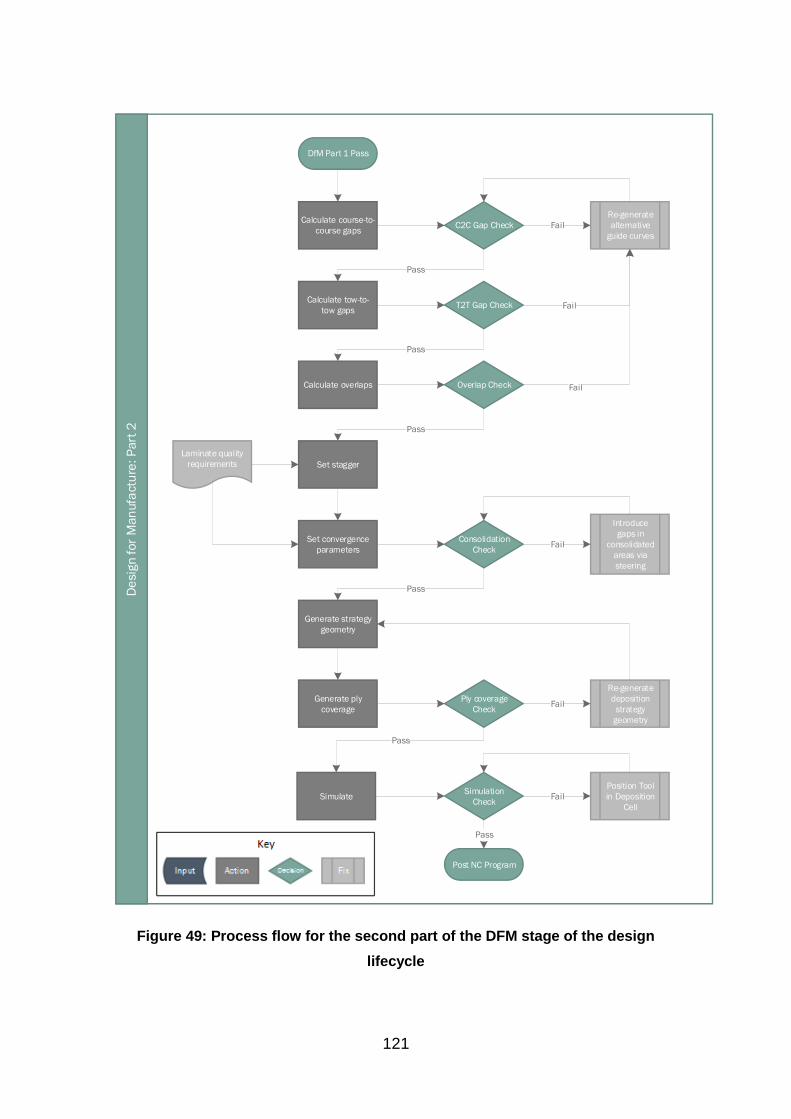
121
De
sign f
or
Man
ufa
ctu
re: P
art
2
DfM Part 1 Pass
Calculate course-to-
course gapsC2C Gap Check
Calculate tow-to-
tow gapsT2T Gap Check
Calculate overlaps Overlap Check
Set stagger
Set convergence
parameters
Laminate quality
requirements
Consolidation
Check
Introduce
gaps in
consolidated
areas via
steering
Simulate
Generate strategy
geometry
Generate ply
coverage
Ply coverage
Check
Simulation
Check
Position Tool
in Deposition
Cell
Post NC Program
Pass
Re-generate
alternative
guide curves
Fail
Pass
Pass
Fail
Fail
Fail
Pass
Pass
Re-generate
deposition
strategy
geometry
Fail
Pass
Fail
Figure 49: Process flow for the second part of the DFM stage of the design
lifecycle

122
5.4.5 Overall FMEA process
The process flow described in section 5.4.1 to section 5.4.4 was assessed using the adapted FMEA approach described in
section 5.3. The detailed results are provided in Table 17, Table 19, Table 19 and table 20. Three of these design steps have
been described in full detail in section 5.5.
Table 17: FMEA for the first 7 design steps
Process
Step
Design
Phase
Task Objective Task Description Severity Design Objective Manufacturing
Objective
Failure Mode Effects of Failure Root Cause Corrective Action
1 Concept Check integrity of
surface
Offset surface by
0.2mm
High Successfully test surface
integrity
Prove ply offsets will
work in downstream
Surface fails to offset Design cannot be
progressed without surface
Surface continuity inadequate, typically as a result
of generating surfaces from CFD data
Return surface, do not proceeed
2 Concept Check integrity of
surface
Apply extended ply
boundary
High Successfully test surface
integrity
Check that surface
doesn't have
unplanned holes or
More than one
boundary generated
Design cannot be
progressed without surface
repairs
Surface broken into multiple segments Fill surface, otherwise return and do
not proceed. Extend surface by at
least 200mm tangentially
3 Concept Position rosette on
surface at suitable
seed point
Install rosette in
model. Geodesic
extend each
orientation to edge of
surface
High Ensure 0 degree and 45
degree axis are correctly
orientated
See how far the fibre
angle deviates when
geodesically extended
Location of rosette and
seed point cause
geodesic fibre
deviation that exceeds
specified limits
Unable to deposit fibres on
surface without introducing
unacceptable defects
Geodesic fibre paths form the ideal defect free
trajectories, but are diverted by complex
geometries. If the seed point is poorly located,
multiple complex geometries cause compounded
deviations.
If deviation too great, consider
alternative seed point to locate
rosette if possible, otherwise return
and do not proceed
4 Sizing Establish ply
sequences
Calculate ply
sequence for each
sized zone based on
thickness law and
thickness
Low Convert Thickness Law and
thickness into a balanced
stacking sequence
(Minimum thickness)
Ensure manufacturing
ply sequence rules are
applied (results in
added thickness)
More than 3 layers of
the same orientation
are sequenced together
Plies interlock and cause
bridging or wrinkling upon
material de-bulking
Plies with same orientation interlock and prevent
inter-ply shear during cure or de-bulk
Add plies (thickness) to satisfy
manufacturing constraints
45 and 135 or 0 and 90
degree plies are not
equal
Laminate warps during cure Un-balanced laminates cause residual stress. At
least two perpendicular orientations should be
balanced
Add plies (thickness) to satisfy
manufacturing constraints
5 Sizing Evaluate ply shapes Transpose stacking
sequences into
individual ply shape
maps
High Create basic laminate
definition to show which
plies within a zone are
continuous to
neighbouring zones
Increase ply continuity Ply continuity score
unacceptable
Sub-optimal manufacturing
solution
Excessive tailoring of the stacking sequences leads
to poor ply continuity, as a result the deposition
process is slowed down
Re-sequence with alternative
stacking sequences until ply
continuity is improved. If stacking
sequences have been provided
instead of thickness laws, change
sequence by maximum of 10% of
6 Sizing Generate sizing
evaluation score
Calculate the
perimeter/area score
for all ply shapes
Low Higher score indicates
greater degree of
continuous fibres in the
Higher score indicates
faster manufacturing
process
Ply continuity score
unacceptable
Sub-obptimal
manufacturing solution
Excessive tailoring of the stacking sequences leads
to poor ply continuity, as a result the deposition
process is slowed down
Consider engineering stacking
sequences to influence higher score
7 Sizing Convert 2D sizing to
3D sizing
Map sizing data onto
surface - establish
grid in eCPD
Low Grid must closely match
zone defining features of
the sizing data
Zone boundaries
should be clearly
defined, preferably
using intersecting
simple geometry like
planes
Grid construction not
suitable for propagating
ply boundary support
guides
Without supports the ply
boundaries cannot be
generated
Sub-standard geometry used to configure
composites grid elements. For example, planes can
easily be offset to create a staggered ply boundary,
but complex geometry can sometimes not be offset
using geodesic or euclidean functions
Grid integrity will not be tested
until ply boundaries are generated
later in the design process
Grid contains different
number of cells to input
Ply definition does not load
correctly
Transposition of 2D array to 3D grid does not match

123
Table 18: FMEA for design steps 8 to 15
Process
Step
Design
Phase
Task Objective Task Description Severity Design Objective Manufacturing
Objective
Failure Mode Effects of Failure Root Cause Corrective Action
8 Detail
Design
Configure ramps and
clearance
parameters
set ply boundary rules
(ramping rates)
High Set exclusion zones where
ramping should not occur -
such as in interface areas
Restrict ramping rates
as the angular changes
cause changes in fibre
direction and can
Ramp geometry too
steep for deposition
roller access
Deposition machine cannot
access ramped areas
Angle of ramp causes roller to bridge preventing
adequate consolidation of material
Change clearance zone and ramp
rates and re-compute
Ply boundaries too
close together
Deposition slowed
excessively to perform
boundary cuts and starts
Ply boundaries are sufficiently spaced in the grid
until the ramping rules move them
Ply shapes fragmented Sub-optimal manufacturing
solution
Excessive tailoring of the stacking sequences leads
to poor ply continuity, as a result the deposition
process is slowed down
9 Detail
Design
Add laminate
attributes to model
Import/enter sizing
data into the grid
definition within
eCPD
Low Represent sizing data with
minimal changes
Ply coverage should be
as continuous as
possible
Uncured ply thickness
not representative
Deposition NC program
causes either poor
consolidation or colisions
The deposition program requires a revised surface
to follow at 2mm layers in the laminate. If the
revised surfaces are too low relative to the
programmed surface the roller does not consolidate
the laminate, too high and the machine may collide
with the laminate.
Re-check grid definition if import is
not successful
Orientation
nomenclature incorrect
Ply orientations transposed
incorrectly
CAD material catalogue doesn't match sizing data
material
10 Detail
Design
Explode the
laminate to illustrate
individual ply
coverage
Visualise the initial
stacking sequence by
plies
Low Move non-connected plies
to different layers in the
laminate where they
improve continuity &
move non-symmetry to
centre of laminate
Fill gaps in the plies by
moving material
through the stacking
sequence, strive for
maximum symmetry,
better ply continuity
Sizing transposition
incorrect
Sub-optimal manufacturing
solution
Excessive tailoring of the stacking sequences leads
to poor ply continuity, as a result the deposition
process is slowed down
Pass design back to sizing if a
symmetrical laminate cannot be
achieved
11 Detail
Design
Outline initial ply
contours
Automatically
generate ply
boundaries
High Establish how clearance
and ramp rates affect ply
boundaries
Join small gaps in plies
that have arisen from
boundary conditions
Ply boundaries too
close together
Deposition slowed
excessively to perform
boundary cuts and starts
Ply boundaries are sufficiently spaced in the grid
until the ramping rules move them
If plies do not generate add ramp
support fallback conditions, then re-
check grid definition for complex
Unacceptable ply
interleaving
Poor interleaving in a ramp
can cause delamination
Incorrect settings used for automatic ply generation
12 DfM Revise initial ply
contours
Regenerate ply
boundaries after
stacking data has
been updated
Medium Capture any modifications
to the stacking needed
due to ply boundary issues
Join small gaps in plies
that have arisen from
boundary conditions
Plies won't
automatically generate
Revision fails Corruption of stacking data If plies do not generate add ramp
support fallback conditions, then re-
check grid definition for complex
geometry
13 DfM Account for
minimum cut length
Check minimum cut
length for all ply
boundaries
High Add material and re-shape
areas of the ply
boundaries that canot be
laid due to minimum
Ensure features that
cannot be laid are
removed
Minimum cut length not
achieved
Unable to deposit fibres in
key areas
Minimum cut length is required to feed material
onto laminate. If the design requires shorter fibres,
they cannot be deposited
If angle cut wizard fails, manually
add minimum cut length allowance
to all affected ply boundaries
14 DfM Account for short
fibres
Check any areas
where short fibres
might delaminate due
to spring forces
Medium Ensure additions are
added to detail design
model, particularly if they
are inside the trim
allowance
Short tapes over radii
may spring off the
laminate and need to
be extended,
sometimes this is not
Short fibres not added
in areas where tapes
are in tension
Fibres lift off laminate after
deposition
The material's natural spring overcomes the
adhesion over a short length. Extending the length
increases adhesion
Liaise with design - it may not be
able to add extensions without
changing internal surface
definitions and interfaces
15 DfM Initiate guide curves Generate at least one
guide curve per ply to
base the machine
trajectory on
High Make guide curve angle as
close to the design rosette
for that ply
Follow a geodesic path
to reduce defects in the
deposited material -
although this may
invoke steering to
Geodesic path exceeds
material steering limit
Material is deposited with
defects
When steering radius is exceeded the material
buckles and lifts from the laminate causing a defect
Feed fibre angular deviation and
steering values back to design so
the stress model can be re-
validated. In most cases, the design
intent cannot be manufactured.

124
Table 19: FMEA for design steps 16 to 22
Process
Step
Design
Phase
Task Objective Task Description Severity Design Objective Manufacturing
Objective
Failure Mode Effects of Failure Root Cause Corrective Action
16 DfM Generate
trajectories
Apply a deposition
strategy to create the
tape courses for each
ply
High Fill in the ply boundary
with UD material
Generate coverage
with acceptable gaps,
overlaps, steering and
angular deviations
Trajectories diverge Fibres part leaving a gap,
sometimes needing to be
filled with an infill strip and
convergence zones
Complex features cause geodesic fibre paths to be
diverted
Failure to generate adequate
coverage will need a convergence
zone adding, a new ply boundary or
a new geometrical surface - liaise
directly with design.
Trajectories converge Fibres overlap or have to be
terminated in a
convergence zone
Complex features cause geodesic fibre paths to be
diverted
17 DfM Governance: Fibre
angles
Check angular
deviation
Low Try to maintain transposed
angles from the rosette
Steer to maintain
geodesic path to
reduce tape defects
Fibre angles exceed
allowable tolerance
Laminate has incorrect
structural properties
Fibre trajectories diverge by angle greater than
allowed
If fibre angle deviates too much
from design intent revisit geometry
with designer to reduce geodesic
impact
18 DfM Governance:
Steering Radius
Check radius of
steering
High Try to maintain transposed
angles from the rosette
Steer fibre trajectories
back to recover angular
deviation caused by
geodesic effects, but
do not exceed
minimum radius
Material steering limit
exceeded
Material is deposited with
defects
When steering radius is exceeded the material
buckles and lifts from the laminate causing a defect
If minimum radius exceeded,
change starting and ending fibre
alignments to reduce the degree of
steering required
Fibre angles exceed
allowable tolerance
Laminate has incorrect
structural properties
Fibre trajectories diverge by angle greater than
allowed
19 DfM Governance: Course
Gaps
Check course to
course gaps
High Try to keep individual gaps
below 2mm, while not
exceeding a cumulative
gap width of 25mm in a 1m
width of ply coverage
Distribute gaps to assist
with steering
Cumulative gap width
limit exceeded
Laminate weakened with
potential for fibre volume
fraction to be reduced
To cope with double curvature geometry, hybrid
steering introduces gaps to recover fibre angles
Liaise with design or reduce course
width by dropping tows
Individual gap width
limit exceeded
Laminate weakened with
potential for fibre volume
fraction to be reduced
Course to course gap combined with steering causes
excessive gaps
20 DfM Governance: Tow
Gaps
Check tow to tow
gaps
High Reduce gaps where
possible
Ensure individual and
cumulative gap widths
do not exceed design
conditions
Tow to tow gaps exceed
limit
Laminate weakened with
potential for fibre volume
fraction to be reduced
Course to course gap combied with steering causes
excessive gaps
Re-evaluate number of tows
deposited and degree of steering if
gaps are excessive
21 DfM Governance:
Overlaps
Check overlaps High Reduce overlap to design
limits or lower
Try to avoid overlaps at
all costs
Overlaps exceed design
limits
Excess material thickness
build up creates surface
defects
Incorrect strategy for gaps and overlaps Overlaps will cause an increase in
thickness and should be avoided is
possible, if not - highlight impact on
top surface to design
22 DfM Prevent alignment
of gaps through
laminate
Set stagger High Move the starting seed
point of each ply so that
they do not line up
through the laminate
Set seed point as close
to centre of largest
geometrical feature,
stagger from seed point
Gaps or overlaps align
through the z axis of the
laminate
Laminate weakened with
potential for fibre volume
fraction to be reduced
Course to course gap combined with steering causes
excessive gaps
Reiterate generation of coverage
with new seed and stagger points
until coverage is acceptable

125
Table 20: FMEA for design steps 23 to 28
Process
Step
Design
Phase
Task Objective Task Description Severity Design Objective Manufacturing
Objective
Failure Mode Effects of Failure Root Cause Corrective Action
23 DfM Establish
convergence
strategies
Set boundary and
convergence
parameters
High Transition ply coverage
using original rosette
where possible
Sectorise the ply
coverage to allow
acceptable
convergence zones
Fibre angles across
component deviate
from original rosette by
more than the design
Laminate has incorrect
structural properties
Fibre trajectories diverge by angle greater than
allowed
Liaise with design about acceptable
convergence strategies
24 DfM Identify areas of
high consolidation
(dry fibre)
Highlight the areas in
a structure where
poor permeability is
likely to occur
High Maintain target fibre
angles and a fibre volume
fraction within design
limits
Steer to introduce gaps
in and around areas of
high consolidation to
allow resin to flow in
areas of poor
Geometrical features
over-consolidated
For dry-fibre preforms, the
feature permeability is too
great to enable resin
infusion and the
component cannot be
The fibres are over-compacted leaving insufficient
air content, or permeability for the resin to flow
through the preform.
Poor permeability could cause a dry
infusion, therefore more radical
mitigations may be required in
discussion with design
25 DfM Create custom guide
curves
Create curves for
steering and
sectorisation if
High Align angle of curves to
fibre angles in sizing
Control steering and
gaps using a design
controlled geometry
Generated trajectories
do not match fibre
angles in sizing within
Laminate has incorrect
structural properties
Fibre trajectories diverge by angle greater than
allowed
Liaise with design if guide curves
exceed angular deviation limits to
have geometry changed accordingly
26 DfM Generate tape
coverage
Build ply coverage
using guide curves for
sectorisation and
guides for each ply
Low None Generate coverage
with acceptable gaps,
overlaps, steering and
angular deviations
Reiterate with different coverage
parameters
27 DfM Check tape coverage
in simulation
Simulate the
deposition of the
tapes, adjusting for
machine reach and
component location
High None Check geometry and
positioning of
component is
acceptable for AFP
machine access
Geometry prevents
access of AFP head
Material is deposited with
defects (bridging) or the
machine collides with
laminate
Deposition machine cannot access the deposition
surface
Re-position component in AFP cell
or liaise with design to change
geometry
28 DfM Calibrate tool
location
Probe the location of
the physical tool and
re-run simulation
Medium None Position tool and re-
check program as the
reach of the machine
will be slightly
different from
AFP machine cannot
reach component when
positioned in real world
When tool is positioned
and program updated to
account for real world
environment, machine
cannot reach/access
Offline program assumes ideal position of tool. It is
possible to position tool outside of machine reach
for components close to the limits of the machine
envelope
Physically reposition tool or change
programming parameters for
machine deposition strategy

126
5.5 Overview of design step examples
In order to highlight how this process can be adapted to work with the design
lifecycle, three example use-cases that have been taken from the overall process
are described in detail to provide three examples. The first addresses the effects
of minimum cut length, previously identified as having a negative impact on
manufacturing evaluation methods in section 4.6. The second example highlights
the problems associated with short fibres and the design modifications required
to eliminate manufacturing defects. The third example describes the effects of
high deposition forces on the laminate, and how the design can be altered to
compensate areas of the laminate which exhibit poor material permeability from
locally high consolidation forces.
These three examples were selected because they each provide a demonstration
of design evolution which can be quantified with a change in component mass, a
reduction in process speed and a potential failure to be manufactured.
5.6 Design step for minimum cut length (first example)
In the minimum cut length design step, the panel agreed that the design objective
and manufacturing objective are complementary and well-understood. The
design step relates to step 13 from the overall design process. The manufacturing
constraints can be easily described and quantified, and therefore the
manufacturing best practice can be accurately applied at an early stage of the
design, and in some cases, fully automated.
The minimum cut length is a parameter that is specific to each type of material
deposition machine. In the case of the Coriolis AFP machine that is most
commonly used at the NCC, the minimum cut length value is 100mm.

127
Figure 50: Schematic of the Coriolis AFP machine deposition head
The 100mm represents the length of material between the location of the knife
which cuts the material, and the point where the deposition roller clamps the
material against the tool or laminate. This is illustrated in Figure 50. If the AFP
machine attempts to deposit a length of material shorter than the minimum cut
length, then the material falls out of the AFP head before the roller can position it
onto the tool or laminate.
The impact on the design is seen in two kinds of feature: general plies that are
smaller than the minimum cut length and the corners of diagonal plies, which
have to be extended as in Figure 51.

128
Figure 51: Examples of minimum cut length additions to diagonal plies
5.6.1 Minimum cut length design objective
The design objective for minimum cut lengths is to add material and re-shape
areas of the ply boundaries that cannot be laid due to the minimum course length.
It is important for the designer to account for the effects of minimum cut length in
the initial design because it can significantly change the shape of key design
features. In a constant thickness laminate, the designer may need to create a
hole, and subsequently add a few additional plies of material around the hole to
account for the non-continuous fibres cause by the hole. The most mass-efficient
shape for these extra plies is a circle, but Figure 52 illustrates how this shape can
change to an octagon when the minimum cut length constraint is applied.

129
Figure 52: An internal pad-up (locally thicker area) changes shape to an octagon
due to MCL
5.6.2 Minimum cut length manufacturing objective
The manufacturing objective is to ensure that the features that cannot be laid are
removed or corrected.
In order to manufacture the design, there must be no tapes of material that are
shorter than the minimum cut length. There are often multiple resolutions for fixing
tapes that are shorter than the minimum cut length, and the lowest mass solution
is typically the preferred option where component performance is important, or
the solution with the fewest tape-cuts if production speed is more important.
5.6.3 Minimum cut length analysis
Failure Mode: Minimum cut length not achieved – cannot manufacture using
automation
Effect(s) of Failure: Unable to deposit fibres in key areas – fibre drops out of
head of machine. Machine may need to be stopped so a manual operation can
be introduced.
Root Cause: Minimum cut length is required to feed material onto laminate. If the
design requires shorter fibres, they cannot be deposited using automation. They
may be able to be hand-deposited but at a severe productivity disadvantage, and
with lower accuracy and repeatability compared to automated deposition.
130
Design Severity: High – Designs which are not 100% automatable require
operator interaction which severely affects productivity. Accuracy of the hand-
laminated plies is not as high as with automation, so the design allowable or
safety factor of the design may need to be increased.
Manufacturing Severity: High – Manual operator interaction is highly
undesirable. Some deposition machines use high powered lasers for heating, so
the process for stopping the machine and making the work area safe to enter for
a laminator will add significant delay to the process.
Corrective Action: If the design is checked and found to have short fibres,
manually add minimum cut length allowance to all affected ply boundaries. In
CATIA V5 R21 and higher, the checking process and suggestion of potential
solutions is now automated, so the designer only needs to be able to choose the
best solution for the design intent.
5.6.4 Example minimum cut length panel
The minimum cut length becomes significant when a designer creates a simple
quasi-isotropic composite laminate and is required to introduce a Ø50mm
diameter hole in the centre. In order to account for the broken fibres caused by
the hole, the thickness of the panel is locally increased around the hole by 20%
for a minimum distance of 50mm.
Figure 53 illustrates the flat panel with a reinforced circular pad-up around the
hole. If the component was laminated by hand, this solution would have the
lowest mass and be easily achievable using a manual process.

131
Figure 53: Hole in fat panel - hand-layup solution
If the same component is manufactured using a Coriolis AFP machine with a
minimum cut length of 100mm, then the design must be modified to account for
the machine restrictions. This solution is shown in Figure 54.
Figure 54: Hole in panel - modified to suit AFP process
Whilst the AFP produced laminate can be manufactured at a higher speed, with
greater accuracy and a higher degree of repeatability, the AFP pad-up weighs
496g, compared to the hand-laminated pad-up which weighs only 287g, which is
a 42% difference.

132
5.7 Design step for short fibres (second example)
In the design step for short fibres, relating to the 14th step in the overall design
process, the panel of expert designers carrying out the FMEA identified a design
risk that is notorious amongst AFP experts, but is never referenced in any design
guidelines for people designing for AFP. It involves a material characteristic
where the internal tension within the composite tape exceeds the adhesion limits
attaching that tape to the rest of the laminate. The result is the tape springs off
the contoured surface and stops further material being deposited.
The likelihood of material springing off the surface of a laminate is dependent on
the specific material selected, but typically occurs when a tape is terminated too
close to a geometrical feature that introduces tension in the tape, such as
wrapping a tape around a small radius 90° corner. This is illustrated in Figure 55,
note that the operator has stopped the automated process and used tape to
secure the first few tapes to prevent further lifting.
Figure 55: Material tension causing the tapes to lift

133
5.7.1 Short fibre design objective
The main design objective is to ensure that the tape extensions are added to the
detailed design model, particularly if they are inside the trim allowance.
Using an ‘L’ section component with a variable thickness as an example, the
tapes that are too short occur on the diagonal 45 degree and 135 degree plies.
This is illustrated in Figure 56. In the design, no allowance is made for these tapes
on the edge of the component or where the local thickness is increased. During
the manufacturing adaptation of the design, the tapes will be extended at the
edge of the component as these extensions are trimmed off at a later productions
stage, however the area with local thickness increase inside the part remains
unaltered.
Figure 56: Tape extensions around small radius to prevent tape from lifting
5.7.2 Short fibres manufacturing objective
Short tapes over radii may spring off the laminate and need to be extended,
sometimes this is not inside the trim allowance. If the radius is too small, the areas
inside the laminate where the thickness is locally increased either need to be
extended, or the resulting defects accepted as a concession. A material
dependant rule can be established to aid the designer in selecting when to
change the boundary shape to account for an extension, and when to leave the
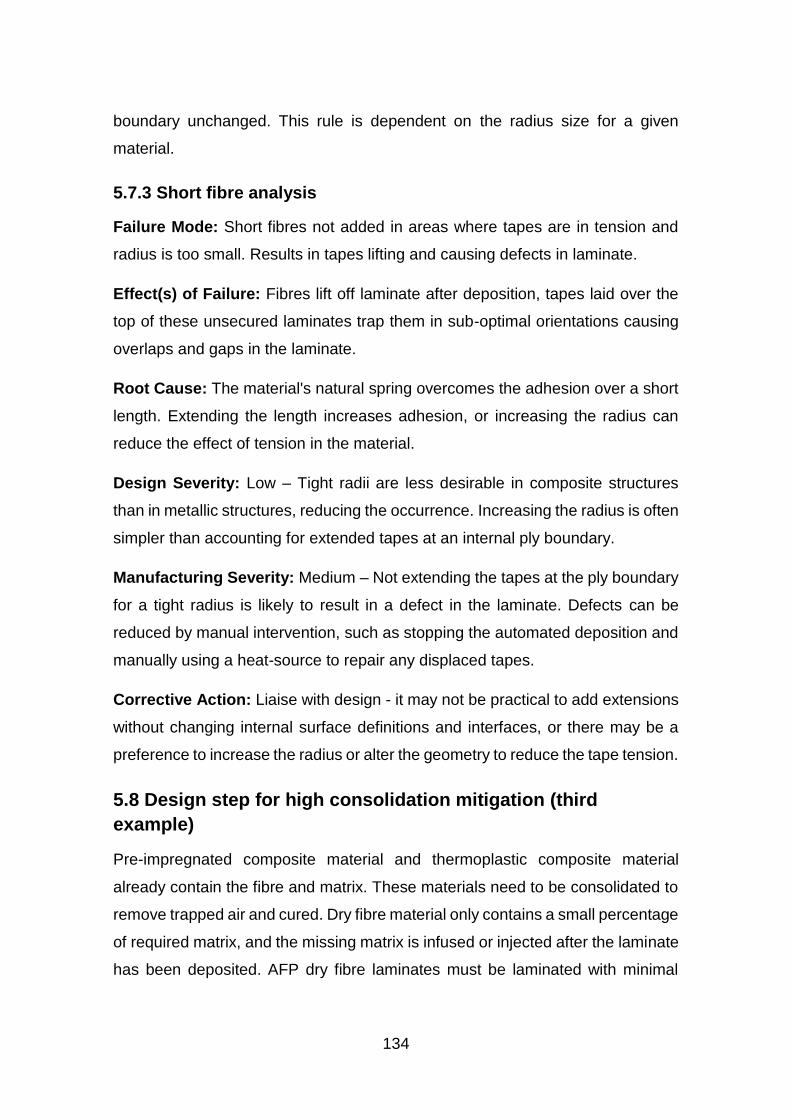
134
boundary unchanged. This rule is dependent on the radius size for a given
material.
5.7.3 Short fibre analysis
Failure Mode: Short fibres not added in areas where tapes are in tension and
radius is too small. Results in tapes lifting and causing defects in laminate.
Effect(s) of Failure: Fibres lift off laminate after deposition, tapes laid over the
top of these unsecured laminates trap them in sub-optimal orientations causing
overlaps and gaps in the laminate.
Root Cause: The material's natural spring overcomes the adhesion over a short
length. Extending the length increases adhesion, or increasing the radius can
reduce the effect of tension in the material.
Design Severity: Low – Tight radii are less desirable in composite structures
than in metallic structures, reducing the occurrence. Increasing the radius is often
simpler than accounting for extended tapes at an internal ply boundary.
Manufacturing Severity: Medium – Not extending the tapes at the ply boundary
for a tight radius is likely to result in a defect in the laminate. Defects can be
reduced by manual intervention, such as stopping the automated deposition and
manually using a heat-source to repair any displaced tapes.
Corrective Action: Liaise with design - it may not be practical to add extensions
without changing internal surface definitions and interfaces, or there may be a
preference to increase the radius or alter the geometry to reduce the tape tension.
5.8 Design step for high consolidation mitigation (third
example)
Pre-impregnated composite material and thermoplastic composite material
already contain the fibre and matrix. These materials need to be consolidated to
remove trapped air and cured. Dry fibre material only contains a small percentage
of required matrix, and the missing matrix is infused or injected after the laminate
has been deposited. AFP dry fibre laminates must be laminated with minimal
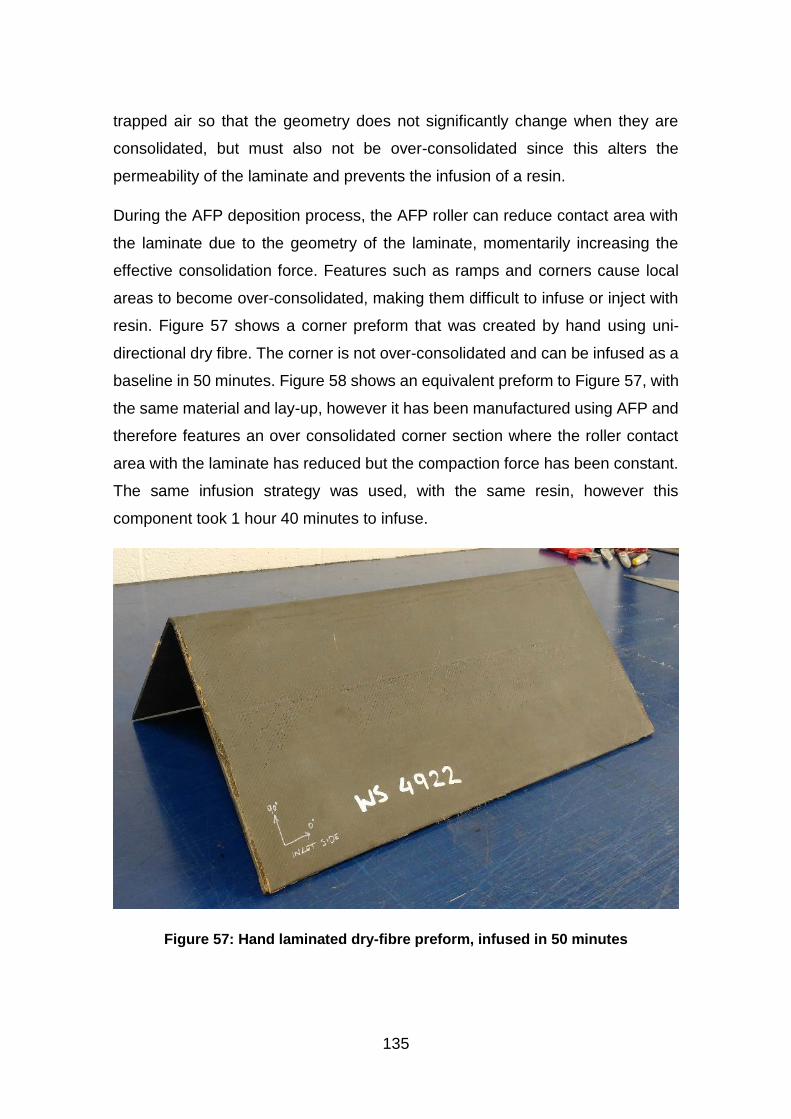
135
trapped air so that the geometry does not significantly change when they are
consolidated, but must also not be over-consolidated since this alters the
permeability of the laminate and prevents the infusion of a resin.
During the AFP deposition process, the AFP roller can reduce contact area with
the laminate due to the geometry of the laminate, momentarily increasing the
effective consolidation force. Features such as ramps and corners cause local
areas to become over-consolidated, making them difficult to infuse or inject with
resin. Figure 57 shows a corner preform that was created by hand using uni-
directional dry fibre. The corner is not over-consolidated and can be infused as a
baseline in 50 minutes. Figure 58 shows an equivalent preform to Figure 57, with
the same material and lay-up, however it has been manufactured using AFP and
therefore features an over consolidated corner section where the roller contact
area with the laminate has reduced but the compaction force has been constant.
The same infusion strategy was used, with the same resin, however this
component took 1 hour 40 minutes to infuse.
Figure 57: Hand laminated dry-fibre preform, infused in 50 minutes

136
Figure 58: AFP deposited dry fibre preform, no gaps between courses/tows,
infused in 1 hour 40 minutes
The AFP deposition strategy can be adapted to create resin flow channels so that
poor permeability can be mitigated in areas of over-consolidation. By introducing
deliberate gaps between the tows, resin channels can be used to increase the
resin flow to areas of poor permeability.
5.8.1 High consolidation design & manufacturing objectives
Highlight the areas in a structure where poor permeability is likely to occur, and
evaluate the feasibility of steering fibres locally to introduce gaps between
courses that will act as resin flow channels. Steer fibres in converging or diverging
paths to enable resin flow channels to be aligned through the laminate around
the target areas. Where possible, the designer should attempt to maintain target
fibre angles and a fibre volume fraction within design limits for the component.
5.8.2 High consolidation analysis
Failure Mode: Geometrical features that become over-consolidated during
automated deposition. If resin cannot flow to and then through these areas, the
laminate cannot be fully infused and areas of dry fibre are left.
137
Effect(s) of Failure: When resin cannot flow through an area of the laminate, it
flows around the area causing a dry patch. Once resin has flowed from the
laminate inlet, to the laminate outlet, there is no way to force resin to impregnate
the dry patch and the infusion of the laminate fails.
Root Cause: The fibres are over-compacted leaving insufficient air content, or
permeability for the resin to flow through the full preform.
Design Severity: Low – Any component with complex geometrical features will
require a degree of fibre steering when generating ply coverage. Exploiting the
steering opportunities to also improve resin flow is unlikely to negatively affect the
design performance.
Manufacturing Severity: High – Failure to fully infuse a dry fibre laminate results
in the entire laminate being scrapped.
Corrective Action: If the maximum quantity of gaps has been achieved and
there are still insufficient resin flow channels for a feature, then the designer must
change the geometry to reduce the effects of consolidation.
5.9 Concluding remarks
This chapter presents the design process for systematically identifying and then
implementing design for manufacturing principles for a composite component
design. In order to demonstrate this, the design process is described and then
the resulting process flow and process FMEA steps that have been generated
using the process are listed in the appendices. Three industrially relevant
examples have been used to demonstrate the process steps and resulting
corrective design actions which can be addressed in the earlier stages of the
design lifecycle.
A potential limitation associated with using an FMEA approach is that the analysis
and suggested corrective actions of each potential failure mode are limited by the
experience of the team carrying out the FMEA. In this work, the laminate chosen
to test the process closely resembles the structure of a section of aircraft wing,
with strong similarities to aircraft fuselages too. The team involved in the FMEA

138
all have at least 10 years of individual experience designing and manufacturing
aircraft wings, which helps to reduce the likelihood of not being able to identify all
the potential failure modes. No alternative to aerospace components have been
considered in this work, limiting it to typical grid-based aerospace structural
designs.
The FMEA process has delivered a systematic approach to valuating design
steps and the corrective actions enable this design process to be used as a
strategy to help designers take into account the design for manufacturing
considerations required for automated manufacturing processes. The use cases
described in this chapter do not necessarily transcend multiple industrial sectors,
and have a focus towards aerospace components and the automated fibre
placement manufacturing process.
The new and novel lessons learnt show that the use of FMEA under the context
of a ‘failure being an event that is not positive for the optimum manufacturing
process’ is a new approach to developing a generic design process. The
approach could be adapted to suit other manufacturing processes, or design
process flows where adequate design and manufacturing expertise is available.
This chapter demonstrates that a generic process can be developed for DFM of
composite components.

139
6 VALIDATION OF PROPOSED DFM PROCESSES AND
TOOLS
The purpose of this chapter is to demonstrate and validate the design process
described in chapter 5 using an industrially relevant demonstration as a use case.
The component selected is a composite laminate that incorporates multiple
complex features that are known to cause difficulties when manufactured using
automated deposition technologies. The component was created to address the
requirements of the following NCC customers, Airbus UK, Rolls Royce, Leonardo
Helicopters, BAE Systems, GKN Aerospace, QinteiQ and GE Aviation.
The design process described in Appendix A contains 28 steps. Whilst each of
these steps is required to progress the design from concept to a physical part,
not all of the steps contain manufacturing considerations which significantly alter
the design. This chapter highlights the design process steps where a
manufacturing decision causes a significant impact on the component design,
and describes the rationale and magnitude of the resulting change in the design.
6.1 Introduction
The use case described in this chapter has been specifically designed to provide
challenging geometrical features when the component is manufactured using an
AFP manufacturing system. The chosen system uses 6.35mm wide dry fibre
tapes and the NCC’s Coriolis AFP system is capable of laying a range from single
tapes to a maximum of 8 at a time. The heating system for depositing the tapes
uses a class 1 laser, and therefore no operators are allowed in the same room
as the AFP machine while it is depositing material. Manual interaction with the
component during automated deposition is therefore highly undesirable.
The component is illustrated in Figure 59. The corner angle is 90° with an internal
radius of R10mm. There is a change in thickness from 30mm to 10mm with a rate
of change of 1 in 5 or 11.6° that results in a tapered radius. The increase in
thickness is localised to account for a large penetration through one flange. The
additional material increases the load transfer around the holes, where the fibres
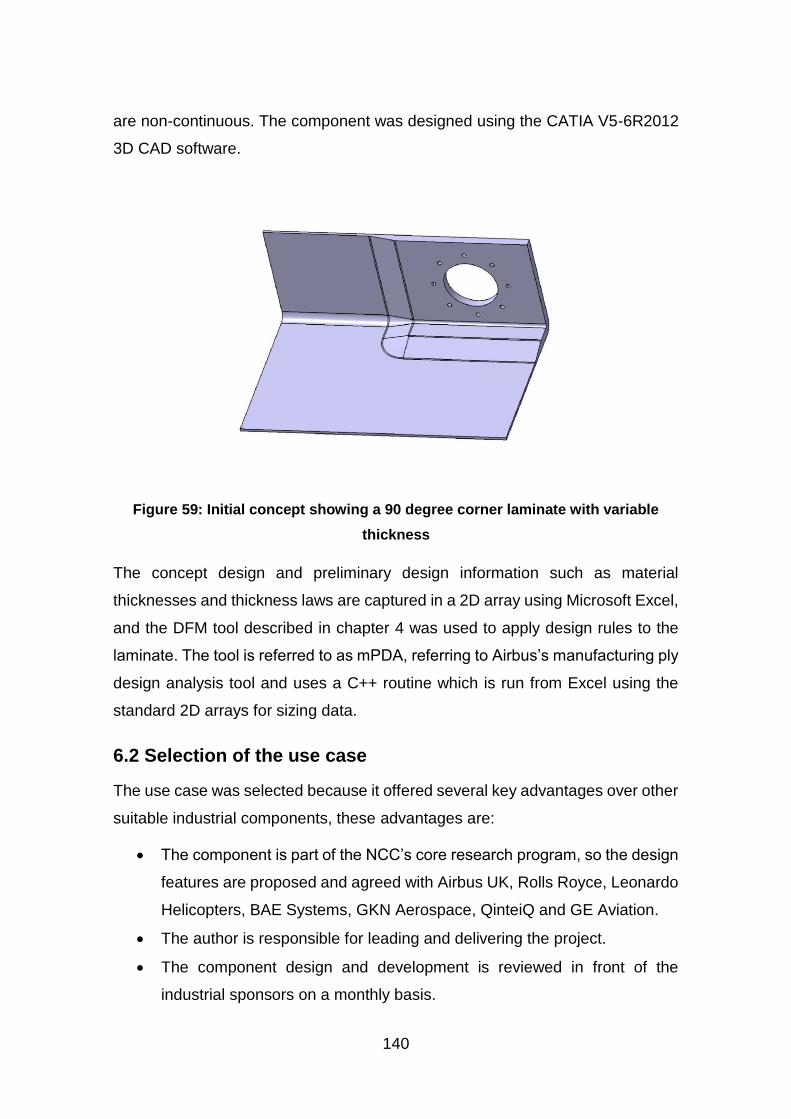
140
are non-continuous. The component was designed using the CATIA V5-6R2012
3D CAD software.
Figure 59: Initial concept showing a 90 degree corner laminate with variable
thickness
The concept design and preliminary design information such as material
thicknesses and thickness laws are captured in a 2D array using Microsoft Excel,
and the DFM tool described in chapter 4 was used to apply design rules to the
laminate. The tool is referred to as mPDA, referring to Airbus’s manufacturing ply
design analysis tool and uses a C++ routine which is run from Excel using the
standard 2D arrays for sizing data.
6.2 Selection of the use case
The use case was selected because it offered several key advantages over other
suitable industrial components, these advantages are:
The component is part of the NCC’s core research program, so the design
features are proposed and agreed with Airbus UK, Rolls Royce, Leonardo
Helicopters, BAE Systems, GKN Aerospace, QinteiQ and GE Aviation.
The author is responsible for leading and delivering the project.
The component design and development is reviewed in front of the
industrial sponsors on a monthly basis.

141
The features incorporated into the design are chosen specifically to push
the manufacturing process to the limit of what has previously been
demonstrated.
Only one use case was selected instead of a multiple use-case validation
because of the nature of the NCC core program. This single use case is endorsed
by eight aerospace and defence companies, and has been tailored to address
their primary development challenges associated with automated deposition of
composite materials. The eight companies endorsing the use case manufacture
a range of different composite products, such as aircraft wings, gas turbine
engines and rotor blades, and some are competitors like GE and Roll Royce, who
both manufacture gas turbines with composite intake blades. As a result, the
features of the use case must be representative of relevant industrial challenges,
but also remain generic enough to not be specific to any particular company
product. This means that the use case is both industrially relevant and suitably
generic to be used as validation of this research.
6.3 Methods followed in this research
In order to follow all of the process steps identified in the process flow in section
5.4, a table of corrective actions was required. The table is shown in section 5.4.5,
and lists the 28 stages required to produce a design that can be manufactured
using the AFP manufacturing process. The use case was identified as a concept,
and then each of the 28 steps was followed to mature the design to a point where
the component was physically manufactured.
The concept was created to deliberately include geometrical features that are
challenging to manufacture using the AFP process, and dry fibre material was
selected to highlight complexities when the component is infused. The process
steps which caused any of the following impacts are described in detail in this
chapter:
Changes in structural performance, such as changing ply sequences
Changes in component mass, such as increased thickness
Changes in ply shapes or overall geometry

142
Changes in fibre orientation and alignment
Section 6.4 describes the significant process steps in greater detail, using the use
case as an example. The concluding remarks compare the original concept
design to the final produced design in terms of design intent, ability to
manufacture and overall component mass.
The use case concept was created by the author, and the project to create the
design according to the design process and to manufacture the physical part was
also led by the author. The photographs and metrology data presented in section
6.4 are the work of Laura Veldenz, who as part of her EngD research is evaluating
the dry fibre AFP process [100] [101]. Laura’s research has played an important
part in developing a better understanding of the dry fibre AFP process, without
which the manufacture of a physical component of significant complexity would
have been extremely challenging.
6.4 Industrial use case
This section describes the design lifecycle and physical manufacture of the final
use case component, using the NCC’s Coriolis AFP system. The use case is
divided into six sub-sections, 6.4.1 to 6.4.7, which group similar design steps
together. The groupings are described in Table 21. The method of applying each
design step is explained in Table 22.

143
Table 21: Sub-sections of use case and the steps of the design process they
address
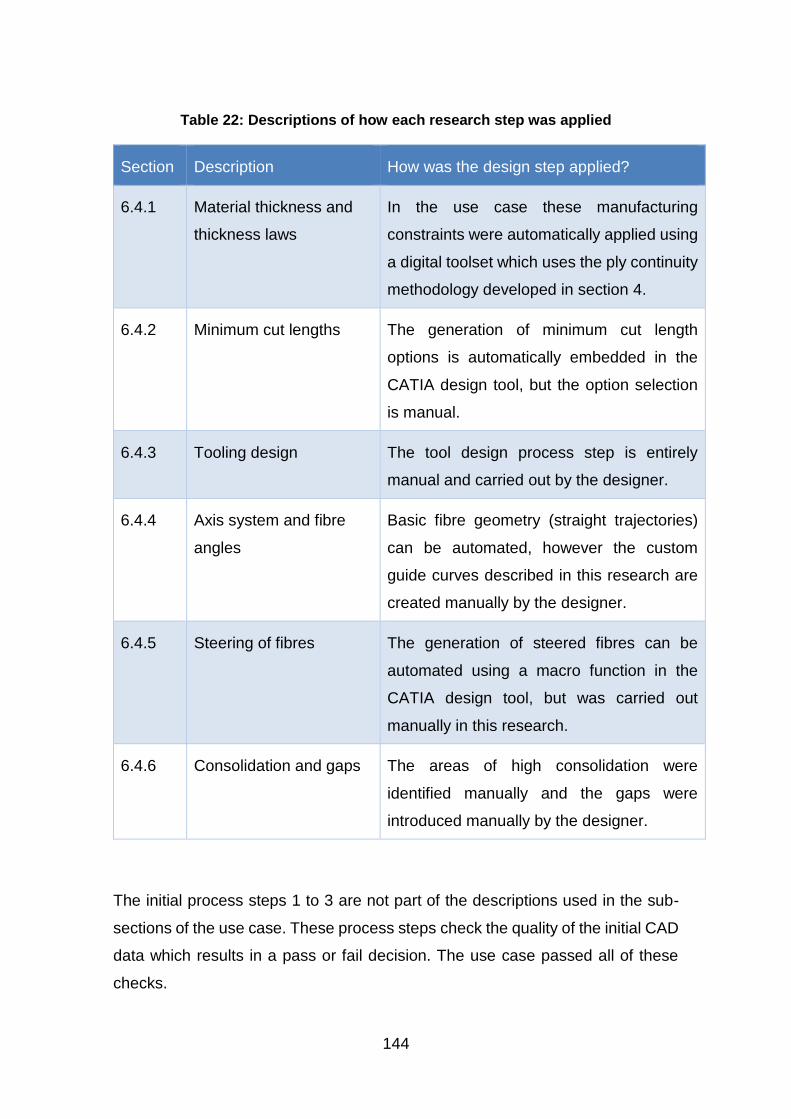
144
Table 22: Descriptions of how each research step was applied
Section Description How was the design step applied?
6.4.1 Material thickness and
thickness laws
In the use case these manufacturing
constraints were automatically applied using
a digital toolset which uses the ply continuity
methodology developed in section 4.
6.4.2 Minimum cut lengths The generation of minimum cut length
options is automatically embedded in the
CATIA design tool, but the option selection
is manual.
6.4.3 Tooling design The tool design process step is entirely
manual and carried out by the designer.
6.4.4 Axis system and fibre
angles
Basic fibre geometry (straight trajectories)
can be automated, however the custom
guide curves described in this research are
created manually by the designer.
6.4.5 Steering of fibres The generation of steered fibres can be
automated using a macro function in the
CATIA design tool, but was carried out
manually in this research.
6.4.6 Consolidation and gaps The areas of high consolidation were
identified manually and the gaps were
introduced manually by the designer.
The initial process steps 1 to 3 are not part of the descriptions used in the sub-
sections of the use case. These process steps check the quality of the initial CAD
data which results in a pass or fail decision. The use case passed all of these
checks.

145
Process steps 9 and 10 are also omitted from the descriptions used in the sub-
sections of the use case. These steps add the composite material properties to
the design, and create a visualisation of the laminate. The material for the use
case was identified at the start of the project, so these two process steps were
not required.
6.4.1 Material thickness and thickness laws
This section refers to the design process steps 4, 5, 6 & 7 listed in Appendix A.
The manufacturing considerations are to:
1) Generate a grid system for mapping data from 2D to 3D
2) Add material to original sizing concept in order to achieve feasibility
3) Re-sequence plies to improve ply continuity by up to 10%
4) Improve manufacturing evaluation scores where possible
The design process steps 4 to 7 relate to the process of generating the sizing
data and ensuring that the sized structure can be manufactured.
The material thickness requirements are basic for this concept compared to a
typical aircraft structure, with the standard component required to be at least
10mm thick and consisting of a 20/70/10 layup (20% fibres along the axis of the
bend, 70% of the fibres diagonal, and 10% across the radius). The increased
thickness pad-up must be 30mm thick, but with a more uniform quasi-isotropic
layup of 25/55/20 to help divert load around the broken fibres, but still retaining a
small bias towards diagonal and 0 Degree plies. The material chosen has a
cured-ply thickness of 0.254mm.
6.4.1.1 Generate a grid system for mapping data from 2D to 3D
By using the mPDA tool to automatically apply the design rules listed in section
3.3.2, the thicknesses and thickness laws can be converted into manufacturing
optimised stacking sequences. The 3D shape has to be translated into a 2D array
in order for mPDA to be run, and the schematic of how this shape is converted
into a 3 by 4 array is illustrated in Figure 60.

146
Figure 60: Schematic showing how the demonstrator can be translated into a 2D
array
The 2D array shows that there are only 2 different laminate properties across the
12 cells. However the way that each requirement is processed is different. In this
design, first the thickness law is selected based on the loads that the structure
will have to resist. In the case of the 10mm thick area, a biased laminate for
diagonal plies shows that the structure is expected to resist torsion rather than
buckling loads. Once the thickness law is selected, a stress analysis tool selects
an appropriate thickness of material to satisfy the load requirements.
6.4.1.2 Add material to original sizing concept in order to achieve
feasibility
From a manufacturing perspective, selecting the thickness law and thickness
without considering manufacturing constraints does not always generate the
correct design concept. The material thicknesses requested are not divisible by
the ply thickness, and when the thickness laws are applied, essential conditions
such as having a balanced and symmetrical laminate are not satisfied. These
Transition 1Transition
2Tansition 3
Flange
Radius
Cap 1
Cap 2

147
original requirements are shown in Table 23 for thickness and in Table 24 for
thickness law.
Table 23: 2D array showing the target material thinesses for the concept
Transition 1 Transition 2 Transition 3
Flange 10mm 10mm 30mm
Radius 10mm 10mm 30mm
Cap 1 10mm 10mm 30mm
Cap 2 10mm 10mm 10mm
Table 24: 2D array showing the target thickness laws for the concept
Transition 1 Transition 2 Transition 3
Flange 20/70/10 20/70/10 25/55/20
Radius 20/70/10 20/70/10 25/55/20
Cap 1 20/70/10 20/70/10 25/55/20
Cap 2 20/70/10 20/70/10 20/70/10
6.4.1.3 Re-sequence plies to improve ply continuity by up to 10%
The mPDA tool was developed to automate the application of manufacturing
constraints to the initial design requirements, and when run on this use case
demonstrator, the resulting thicknesses and thickness laws are different to the
original design intent. The mPDA results are shown in Table 25 for revised
thicknesses, and Table 26 for revised thickness laws.

148
Table 25: 2D array of new material thicknesses, modified at preliminary design
stage
Table 26: 2D array of new thickness laws, modified at preliminary design stage
Transition 1 Transition 2 Transition 3
Flange 24/57/19 24/57/19 24/56/20
Radius 24/57/19 24/57/19 24/56/20
Cap 1 24/57/19 24/57/19 24/56/20
Cap 2 24/57/19 24/57/19 24/57/19
6.4.1.4 Improve manufacturing evaluation scores where possible
The effects of applying laminate manufacturing constraints can be seen in both
zones as a slight increase in thickness, and a slight deviation in the thickness law
percentages.
The thickness laws are converted into explicit stacking sequences:
10mm [20/70/10] = 10.668mm
[-45/45/0/0/0/-45/45/90/-45/45/0/-45/45/90/-45/45/90/-45/45/90/0//Mirrored]
Transition 1 Transition 2 Transition 3
Flange 10.668mm 10.668mm 30.734mm
Radius 10.668mm 10.668mm 30.734mm
Cap 1 10.668mm 10.668mm 30.734mm
Cap 2 10.668mm 10.668mm 10.668mm

149
30mm [25/55/20] = 30.734mm
[-45/45/0/0/0/-45/45/90/-45/45/0/0/0/-45/45/90/-45/45/0/0/0/-45/45/90/-
45/45/0/0/0/-45/45/90/-45/45/0/0/-45/45/90/-45/45/90/-45/45/90/-45/45/90/-
45/45/90/-45/45/90/-45/45/90/-45/45/90/0//Pivoted around last 0]
The effect of these changes on component mass is an increase of 4%, with the
component gaining 1.065kg. This mass gain is unavoidable as it is a result of
applying manufacturing constraints to a design, however the practice of
identifying the mass gain at the earliest possible stage in the design lifecycle is
beneficial. This example validates the research by identifying the additional mass
at the conceptual design stage before a CAD model had been created.
6.4.2 Minimum cut lengths
This section refers to the design process steps 8, 11, 12 & 13 in Appendix A, with
the following manufacturing constraints requiring consideration:
1) Adjust positions of ply boundaries and ramp rates to suit manufacturing
constraints
2) Add supporting geometry to the CAD model to provide multiple options for
generating ramps
3) Add minimum cut lengths into CAD model for all plies affected
The design process steps 8, 11, 12 and 13 relate to the process of designing the
ply boundaries and associated ramp rates while considering the process specific
manufacturing constraints. In this use case, the main constraint that was not
accounted for in the conceptual design was the minimum cut length associated
with the AFP manufacturing process.
6.4.2.1 Adjust positions of ply boundaries and ramp rates to suit
manufacturing constraints
The original use case design, once adjusted for ply thickness and manufacturing
rules can be manufactured by hand without any geometrical modification. In order
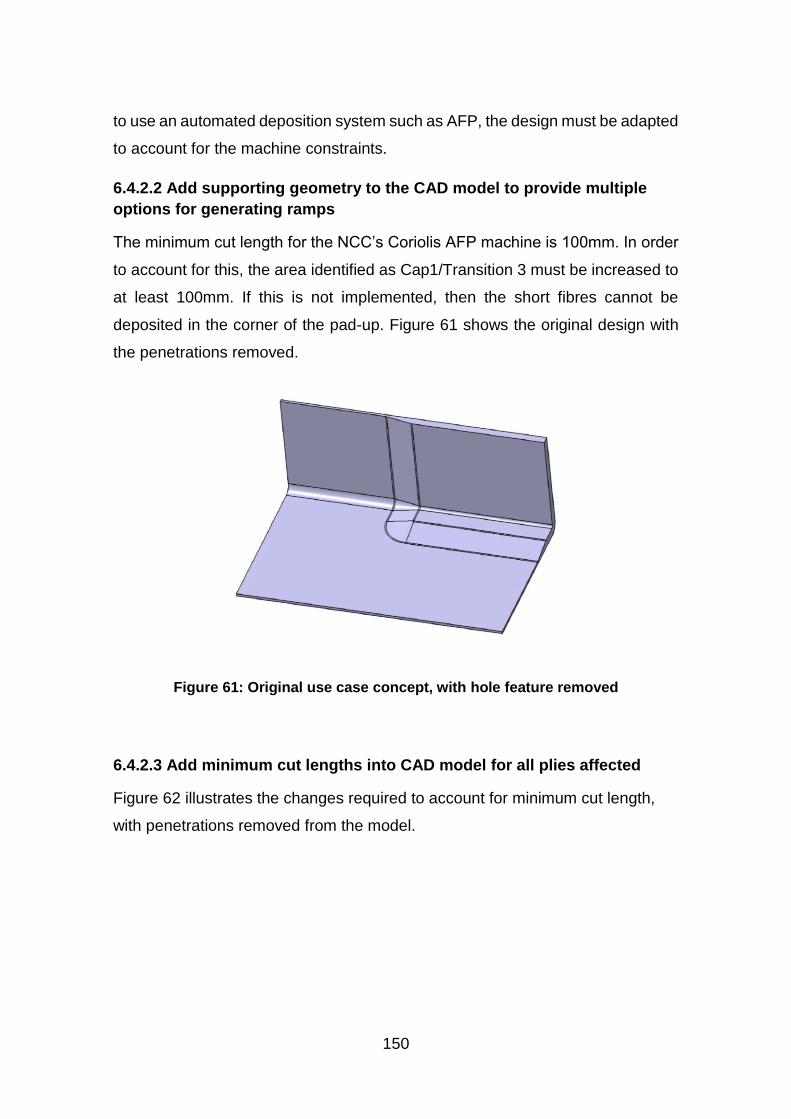
150
to use an automated deposition system such as AFP, the design must be adapted
to account for the machine constraints.
6.4.2.2 Add supporting geometry to the CAD model to provide multiple
options for generating ramps
The minimum cut length for the NCC’s Coriolis AFP machine is 100mm. In order
to account for this, the area identified as Cap1/Transition 3 must be increased to
at least 100mm. If this is not implemented, then the short fibres cannot be
deposited in the corner of the pad-up. Figure 61 shows the original design with
the penetrations removed.
Figure 61: Original use case concept, with hole feature removed
6.4.2.3 Add minimum cut lengths into CAD model for all plies affected
Figure 62 illustrates the changes required to account for minimum cut length,
with penetrations removed from the model.
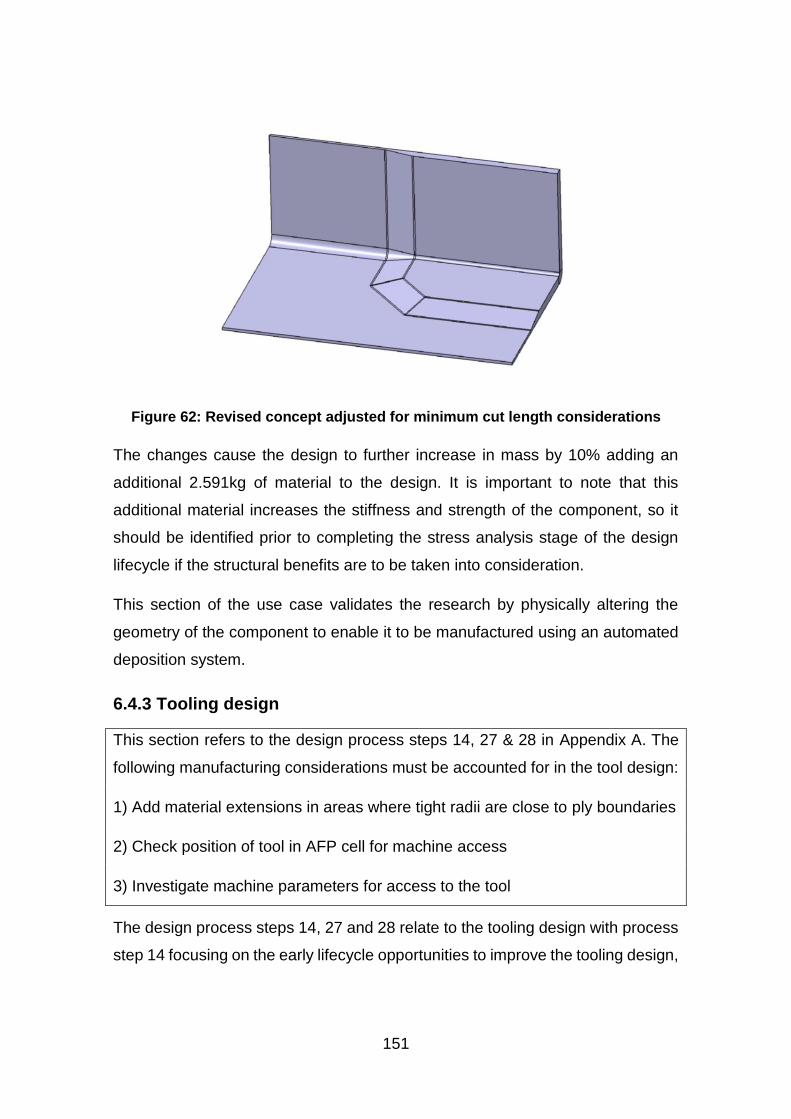
151
Figure 62: Revised concept adjusted for minimum cut length considerations
The changes cause the design to further increase in mass by 10% adding an
additional 2.591kg of material to the design. It is important to note that this
additional material increases the stiffness and strength of the component, so it
should be identified prior to completing the stress analysis stage of the design
lifecycle if the structural benefits are to be taken into consideration.
This section of the use case validates the research by physically altering the
geometry of the component to enable it to be manufactured using an automated
deposition system.
6.4.3 Tooling design
This section refers to the design process steps 14, 27 & 28 in Appendix A. The
following manufacturing considerations must be accounted for in the tool design:
1) Add material extensions in areas where tight radii are close to ply boundaries
2) Check position of tool in AFP cell for machine access
3) Investigate machine parameters for access to the tool
The design process steps 14, 27 and 28 relate to the tooling design with process
step 14 focusing on the early lifecycle opportunities to improve the tooling design,

152
and steps 27 and 28 focusing on the validation of the tooling design prior to
manufacture.
6.4.3.1 Add material extensions in areas where tight radii are close to ply
boundaries
The AFP tool needs to be larger than the component to allow the AFP machine
head to make contact, and pre-load the head before material is fed onto the tool
surface. The tooling is designed to be mounted on a table, so that the 150N of
force applied by the AFP machine is transferred to the ground. The initial tooling
concept is shown in Figure 63.
Figure 63: Initial tool design
6.4.3.2 Check position of tool in AFP cell for machine access
It is really important that the tool is checked using a simulation of the AFP process
to ensure that the component surface can be reached by the AFP machine. If the
AFP machine cannot access the tool surface because of the risk of collisions,
then the tool cannot be used. Because the tool was being installed on a pre-
existing table in the AFP cell, the initial concept tool was positioned too high
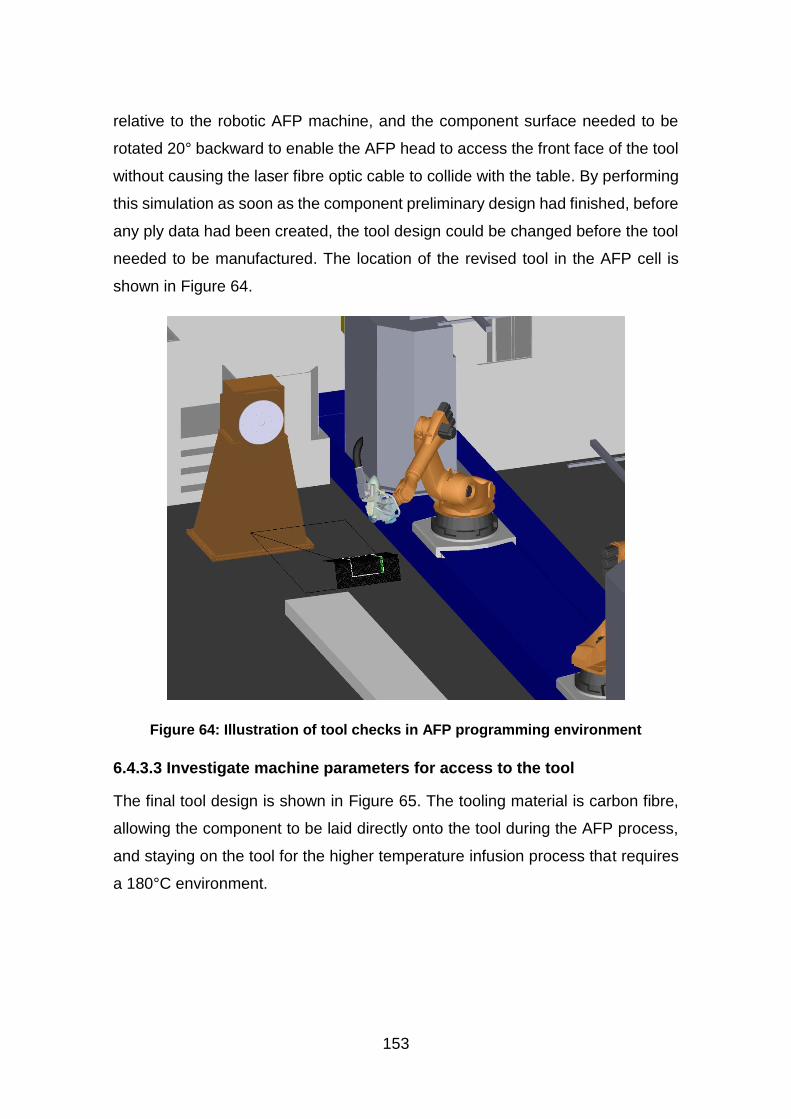
153
relative to the robotic AFP machine, and the component surface needed to be
rotated 20° backward to enable the AFP head to access the front face of the tool
without causing the laser fibre optic cable to collide with the table. By performing
this simulation as soon as the component preliminary design had finished, before
any ply data had been created, the tool design could be changed before the tool
needed to be manufactured. The location of the revised tool in the AFP cell is
shown in Figure 64.
Figure 64: Illustration of tool checks in AFP programming environment
6.4.3.3 Investigate machine parameters for access to the tool
The final tool design is shown in Figure 65. The tooling material is carbon fibre,
allowing the component to be laid directly onto the tool during the AFP process,
and staying on the tool for the higher temperature infusion process that requires
a 180°C environment.

154
Figure 65: Photograph of final layup and cure tool
The tooling design was improved during the initial investigations into its
compatibility with the AFP cell. This enabled the tool to be used successfully in
the AFP cell without the need for modification, and validates the benefits of
performing tooling checks at the earliest point in the design lifecycle.
6.4.4 Axis system and fibre angles
This section refers to the design process steps 15 to 23 in Appendix A. The
following manufacturing considerations must be accounted for in the detailed
design:
1) Feedback AFP simulated fibre angles to stress for validation
2) Add convergence zones or change geometrical surface to cope with geodesic
fibre paths that are too extreme

155
The design process steps 15 to 23 relate to the axis system and fibre angles. The
same steps also relate to the fibre steering, but steering is describes in section
6.4.5.
The design features an axis system on one face which is used to define the
orientation of the individual plies. The axis system needs to be transposed from
the initial face to the second face in order to establish the ideal direction of the
fibres. The transposed axis system does not account for the tapered radius and
the effect this has on diverging and converging fibre angles.
6.4.4.1 Feedback AFP simulated fibre angles to stress for validation
The effects of transposing the axis system can be seen clearly if the component
is simplified to focus only on the effects of the tapered radii. Transposing the
desired fibre angles onto the two faces of the component, but ignoring the radii
produces the correct fibre orientations in the flat flange and cap areas of the
component. This is illustrated in Figure 66.
Figure 66: Fibre angles transposed onto the cap and flange faces as the designer
intended (No coverage for radii)
If the radii is taken into consideration, then the geodesic path of the fibre is
disrupted by the tapered geometry, and the fibre angles diverge and converge on
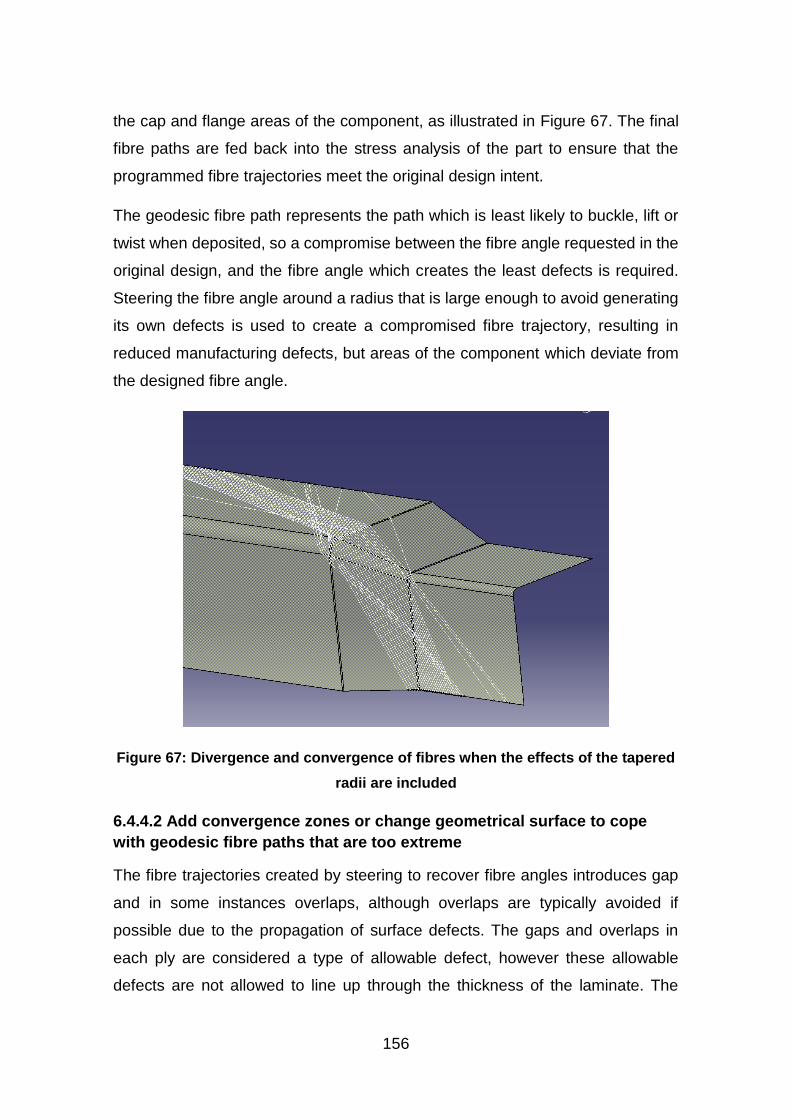
156
the cap and flange areas of the component, as illustrated in Figure 67. The final
fibre paths are fed back into the stress analysis of the part to ensure that the
programmed fibre trajectories meet the original design intent.
The geodesic fibre path represents the path which is least likely to buckle, lift or
twist when deposited, so a compromise between the fibre angle requested in the
original design, and the fibre angle which creates the least defects is required.
Steering the fibre angle around a radius that is large enough to avoid generating
its own defects is used to create a compromised fibre trajectory, resulting in
reduced manufacturing defects, but areas of the component which deviate from
the designed fibre angle.
Figure 67: Divergence and convergence of fibres when the effects of the tapered
radii are included
6.4.4.2 Add convergence zones or change geometrical surface to cope
with geodesic fibre paths that are too extreme
The fibre trajectories created by steering to recover fibre angles introduces gap
and in some instances overlaps, although overlaps are typically avoided if
possible due to the propagation of surface defects. The gaps and overlaps in
each ply are considered a type of allowable defect, however these allowable
defects are not allowed to line up through the thickness of the laminate. The

157
technique for preventing alignment of allowable defects is staggering the
trajectories. In the use case, the majority of the gaps occur around the tapered
radius, so each ply layer is staggered by offsetting the trajectory guide curve.
The introduction of gaps between carbon fibre tapes can be used to improve the
permeability of the highly consolidated radius area and also progressively reduce
the effects of steering across the component. For the 0 Degree plies, which follow
the radius, a convergence zone is required to accommodate the need to join the
cap and flange areas together. This is done by laying single tows along the length
of the radii and dropping the tows at the tapered radius. This is illustrated in Figure
68. The gaps created in this ply coverage create uniform voids inside the laminate
that can be used to help flow resin to the radius, where poor permeability is
predicted.
Figure 68: 0 Degree ply coverage showing tow dropping and convergence zone
This section of the design of the use case highlights the amount of manual
tailoring of the fibre paths that a designer must carry out. The generic design
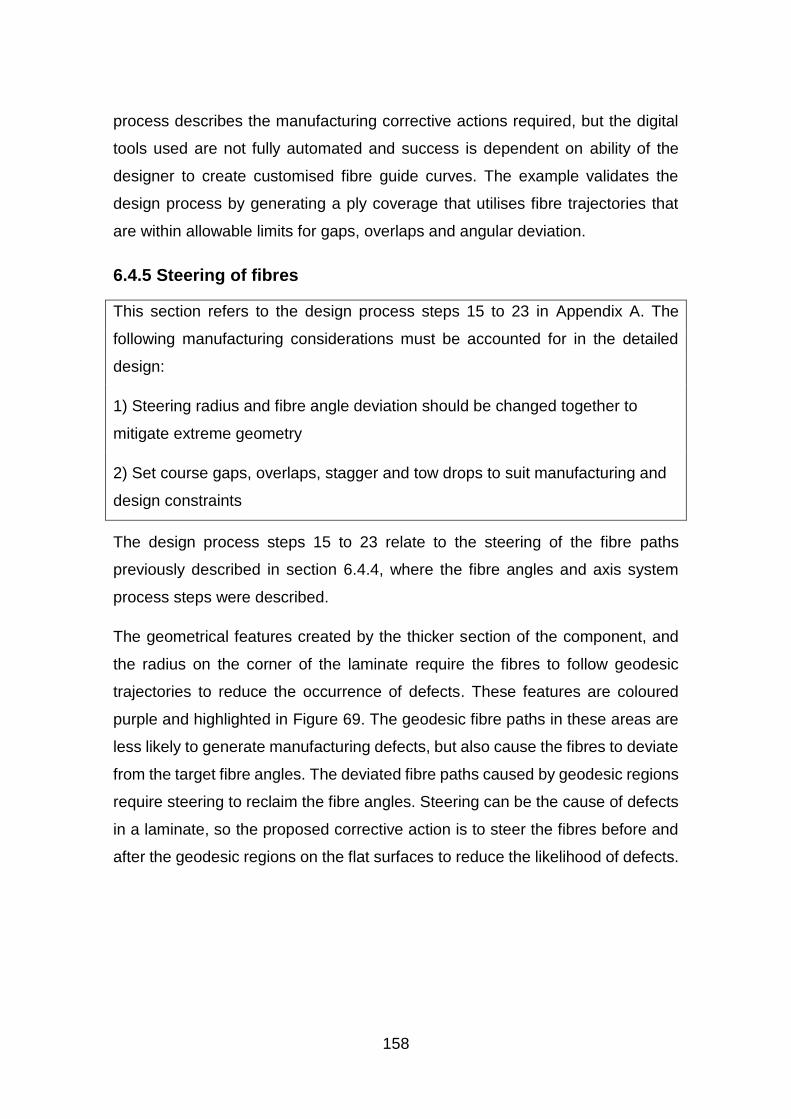
158
process describes the manufacturing corrective actions required, but the digital
tools used are not fully automated and success is dependent on ability of the
designer to create customised fibre guide curves. The example validates the
design process by generating a ply coverage that utilises fibre trajectories that
are within allowable limits for gaps, overlaps and angular deviation.
6.4.5 Steering of fibres
This section refers to the design process steps 15 to 23 in Appendix A. The
following manufacturing considerations must be accounted for in the detailed
design:
1) Steering radius and fibre angle deviation should be changed together to
mitigate extreme geometry
2) Set course gaps, overlaps, stagger and tow drops to suit manufacturing and
design constraints
The design process steps 15 to 23 relate to the steering of the fibre paths
previously described in section 6.4.4, where the fibre angles and axis system
process steps were described.
The geometrical features created by the thicker section of the component, and
the radius on the corner of the laminate require the fibres to follow geodesic
trajectories to reduce the occurrence of defects. These features are coloured
purple and highlighted in Figure 69. The geodesic fibre paths in these areas are
less likely to generate manufacturing defects, but also cause the fibres to deviate
from the target fibre angles. The deviated fibre paths caused by geodesic regions
require steering to reclaim the fibre angles. Steering can be the cause of defects
in a laminate, so the proposed corrective action is to steer the fibres before and
after the geodesic regions on the flat surfaces to reduce the likelihood of defects.

159
Figure 69: Geometrical features highlighted in purple where geodesic fibre paths
are required
6.4.5.1 Steering radius and fibre angle deviation should be changed
together to mitigate extreme geometry
The software used to automatically generate the fibre trajectories is Coriolis
CADFiber, and the digital tool is capable of creating fibre trajectories using
standard fibre strategies. The simulation of the standard fibre trajectories is
shown in Figure 70, with a colour map showing the degree of steering in each
tape. The standard trajectories are generated by creating a 45 degree fibre path
through the most severe feature (the tapered radius), and offsetting that path
parallel either side to create the full ply coverage.

160
Figure 70: Standard fibre trajectories generated using CADFiber with two sectors
To highlight the problems that this standard strategy creates, the 45 degree ply
was programmed and then manufactured. The result is shown in Figure 71 and
Figure 72. The tool was covered with a green nylon vacuum bag to make the
removal of trial material easier.
R800(mm)
R0(mm)

161
Figure 71: Top view of 45 degree ply using standard fibre trajectories

162
Figure 72: Metrology scan of 45 degree ply using standard fibre trajectories.
Areas in red show a defect of 1.5mm thickness, and on the left side of the radius
a tape can be seen lifting off the tool surface
The standard fibre coverage was deposited with the machine process parameters
that had been optimised using a series of smaller scale trials carried out
previously. Unfortunately some severe defects were created along the radius,
which can be seen in closer detail in Figure 73. The defects are attributed to a
difference in tension between the inner and outer edges of the tapes, typically
caused by steering too far from a geodesic fibre path. The metrology scan
highlighted that these defects exceeded 1.5mm in thickness which is not
acceptable. The metrology scan was performed using a Nikon MCAx portable
CMM arm, equipped with a MMD X100 laser scanner. This provided an accuracy
Surface Deviation from CAD (mm)

163
of approximately 100µm. The scan results were processed using Polyworks
metrology software which computed the image for surface deviation from CAD in
Figure 72. The areas shown in grey are areas around the outside of the
component which were not scanned.
Figure 73: Defects on radius caused by not using a geodesic fibre trajectory
A customised fibre trajectory can be created in CATIA V5 and then be imported
into the CADFiber machine programming software. This allows the designer to
generate a non-standard fibre trajectory and use fibre steering to distribute the
tensions in the tapes that are caused by the geometry over a longer length.
6.4.5.2 Set course gaps, overlaps, stagger and tow drops to suit
manufacturing and design constraints
The customised fibre trajectories can be tailored to address two manufacturing
corrective actions. Firstly, steering the fibres can be used to reduce the severity
of defects in the laminate, and secondly, introducing gaps between the tapes can
improve the delivery of resin to highly consolidated areas of the laminate.
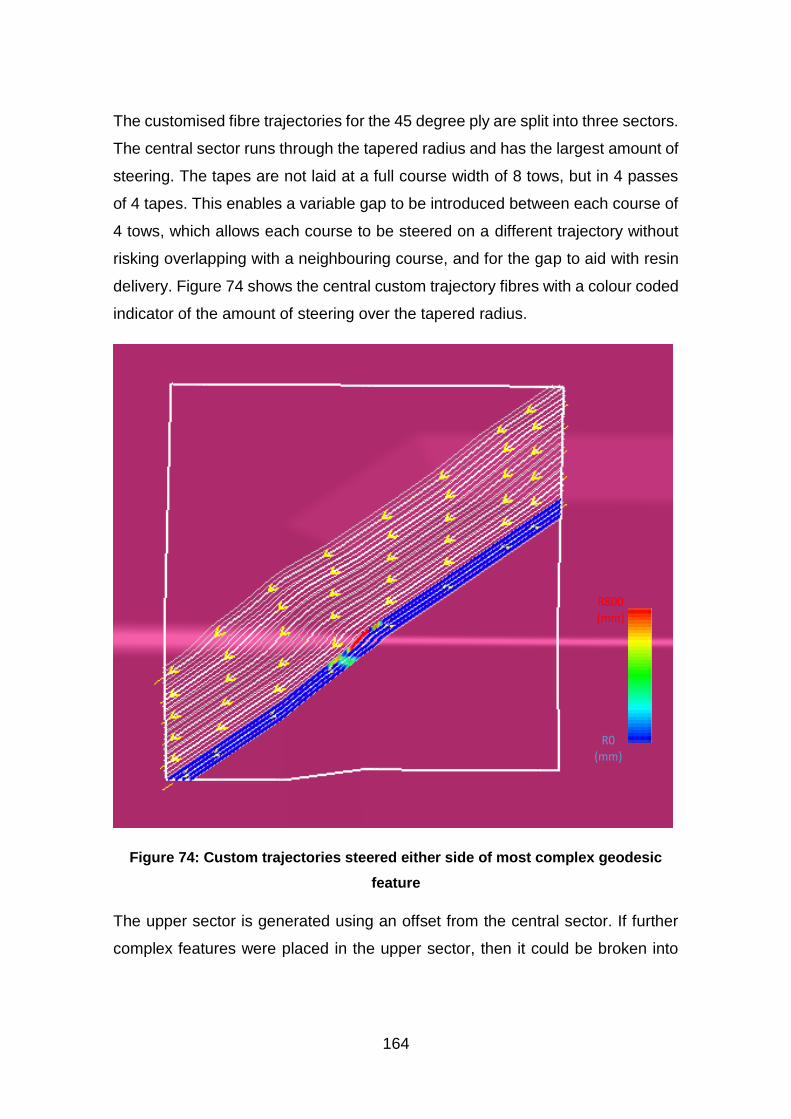
164
The customised fibre trajectories for the 45 degree ply are split into three sectors.
The central sector runs through the tapered radius and has the largest amount of
steering. The tapes are not laid at a full course width of 8 tows, but in 4 passes
of 4 tapes. This enables a variable gap to be introduced between each course of
4 tows, which allows each course to be steered on a different trajectory without
risking overlapping with a neighbouring course, and for the gap to aid with resin
delivery. Figure 74 shows the central custom trajectory fibres with a colour coded
indicator of the amount of steering over the tapered radius.
Figure 74: Custom trajectories steered either side of most complex geodesic
feature
The upper sector is generated using an offset from the central sector. If further
complex features were placed in the upper sector, then it could be broken into
R800(mm)
R0(mm)

165
smaller customised sectors with steering. The upper sector is illustrated in Figure
75.
Figure 75: Custom trajectories for upper half of the 45 degree ply (steered either
side of geodesic feature)
The lower sector is very similar to the upper sector, with a standard offset of the
central sector being used to generate the remaining ply coverage. This is
illustrated in Figure 76. The lower sector also contains a tape extension near the
corner to mitigate the likelihood of a short tape lifting off the tool surface due to
the material spring overcoming the material adhesion.
R800(mm)
R0(mm)

166
Figure 76: Custom trajectories for lower half of the 45 degree ply (steered either
side of geodesic feature)
The manufactured 45 degree ply using the customised fibre trajectories is
scanned using a contactless portable CMM scanning arm. The metrology
verification checks that any defects caused by fibre steering are acceptably small.
The scan result is shown in Figure 77, proving that the customised fibre
trajectories can spread the unacceptable steering induced defects into smaller
acceptable defects over a longer length of fibre trajectory.
R800(mm)
R0(mm)

167
Figure 77: Metrology scan of first 45 degree ply using customised fibre
trajectories. Gaps between courses can be seen coloured grey or blue.
The 45 degree ply that was manufactured as part of the programming testing is
illustrated in Figure 78. The gaps between the courses designed to aid the
delivery of resin to the highly consolidated regions can be seen in the photo.
Figure 79 illustrates the 135 degree ply which was programmed using the same
customised fibre trajectory strategy as the 45 degree ply.
Surface Deviation from CAD (mm)
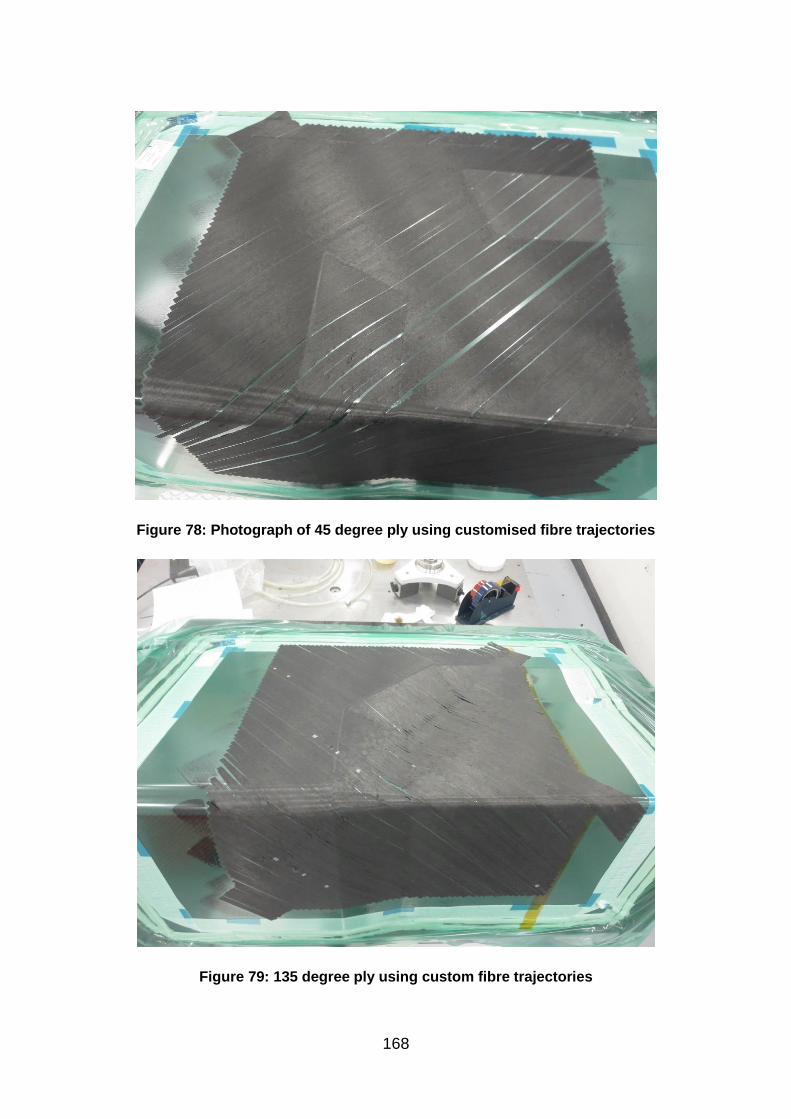
168
Figure 78: Photograph of 45 degree ply using customised fibre trajectories
Figure 79: 135 degree ply using custom fibre trajectories

169
The design steps described in this sub-section for the use case prove that the
manufacturing considerations from the generic design process can be used to
generate acceptable ply coverage. The example validates the design process by
generating a ply coverage that utilises fibre trajectories that are within allowable
limits for gaps, overlaps and steering.
6.4.6 Consolidation and gaps
This section refers to the design process steps 24, 25 & 26 in Appendix A. The
following manufacturing considerations must be accounted for in the detailed
design:
1) Consider changing the geometry to reduce areas of high consolidation
2) Introduce gaps in the laminate to aid resin delivery during the infusion process
The design process steps 24 to 26 relate to the deliberate gaps that can be
introduced into a laminate to enable it to infuse with resin more effectively.
6.4.6.1 Consider changing the geometry to reduce areas of high
consolidation
The corner radius is the main area of high consolidation for the component. With
the tight R10mm radius and a rapid increase in thickness around the pad-up,
there is a requirement to increase resin flow to the radius, particularly the tapered
radius section. The geometry in this location cannot be changed due to the
original design intent, so the introduction of gaps into the laminate was used.
6.4.6.2 Introduce gaps in the laminate to aid resin delivery during the
infusion process
By introducing gaps in between the courses, resin flow channels can be
incorporated into the laminate at the design stage. The gaps deliberately
designed into the 90 degree ply are illustrated in Figure 80.

170
Figure 80: Steered 90 degree fibres with additional gaps on tapered radius
The gaps introduced into each ply act as resin flow channels. Without the gaps,
the laminate becomes highly compacted on the radius of the component due to
the reduced contact patch of the AFP deposition roller during layup of the radius.
The high compaction force reduces the laminate permeability by compressing the
trapped air in the material whilst the material binder is simultaneously activated
by the AFP heating process. The gaps are larger in the areas of highest
compaction, such as the tapered radius section. The gaps in the laminate of the
use case help to validate the generic process by mitigating a resin infusion risk
that would manifest in the later stages of the manufacturing process.
6.4.7 Manufactured part
In this section the 28 steps of the design process flow are concluded with the
manufacture of the use case component. The successful layup of the component
using the AFP process demonstrates that all of the critical manufacturing
constraints associated with AFP have been incorporated into the design.
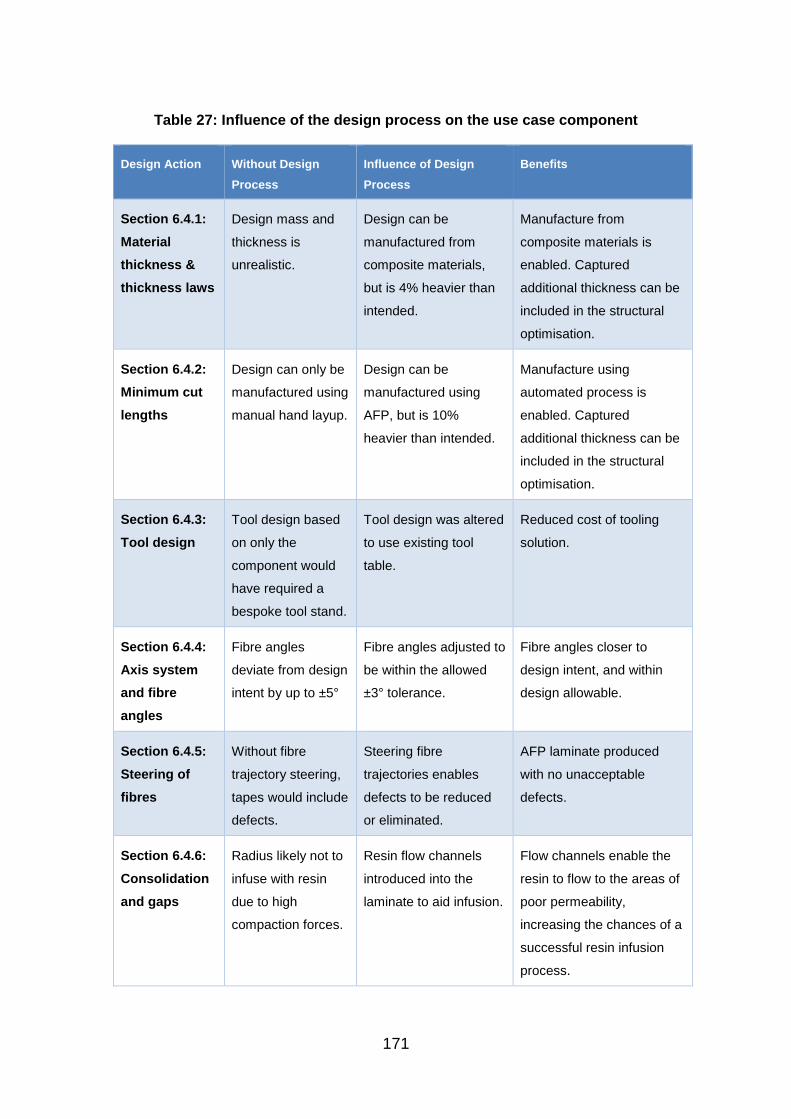
171
Table 27: Influence of the design process on the use case component
Design Action Without Design
Process
Influence of Design
Process
Benefits
Section 6.4.1:
Material
thickness &
thickness laws
Design mass and
thickness is
unrealistic.
Design can be
manufactured from
composite materials,
but is 4% heavier than
intended.
Manufacture from
composite materials is
enabled. Captured
additional thickness can be
included in the structural
optimisation.
Section 6.4.2:
Minimum cut
lengths
Design can only be
manufactured using
manual hand layup.
Design can be
manufactured using
AFP, but is 10%
heavier than intended.
Manufacture using
automated process is
enabled. Captured
additional thickness can be
included in the structural
optimisation.
Section 6.4.3:
Tool design
Tool design based
on only the
component would
have required a
bespoke tool stand.
Tool design was altered
to use existing tool
table.
Reduced cost of tooling
solution.
Section 6.4.4:
Axis system
and fibre
angles
Fibre angles
deviate from design
intent by up to ±5°
Fibre angles adjusted to
be within the allowed
±3° tolerance.
Fibre angles closer to
design intent, and within
design allowable.
Section 6.4.5:
Steering of
fibres
Without fibre
trajectory steering,
tapes would include
defects.
Steering fibre
trajectories enables
defects to be reduced
or eliminated.
AFP laminate produced
with no unacceptable
defects.
Section 6.4.6:
Consolidation
and gaps
Radius likely not to
infuse with resin
due to high
compaction forces.
Resin flow channels
introduced into the
laminate to aid infusion.
Flow channels enable the
resin to flow to the areas of
poor permeability,
increasing the chances of a
successful resin infusion
process.

172
Table 27 records how the design process has influenced the development of the
use case component. The final laminated component is shown in Figure 81 and
Figure 82. The thickest sides of the component are built up with layers of self-
adhesive cork. The cork edge to the preform enables the AFP roller to compress
and settle before making contact with the laminate. The practice leads to a higher
quality laminate with fewer thickness variations and very repeatable positioning
of the fibres.
Figure 81: Photograph of use case demonstrator laid up as a dry fibre AFP
laminate

173
Figure 82: Photograph of use case demonstrator laid up as a dry fibre AFP
laminate
The successful resin infusion process demonstrates that the concerns regarding
the over-consolidated regions of the laminate have been mitigated at the
component design stage. Figure 82 illustrates the use case component after the
final ply has been laminated. The recess in the tool has now been fully filled with
material to provide a flat exterior profile.
6.5 Concluding remarks
In this chapter the six sub-sections of the use case have been described and
demonstrated using an industrially relevant example. The design started with only
component performance objectives, but by following the design process steps,
the additional automated manufacturing process constraints have been
systematically applied to the design with respect to the original design intent. The
resulting component is compromised in some areas such as mass and fibre
volume fraction directly as a result of the manufacturing process constraints.
The design step in section 6.4.1 addressed the design rules around thickness
laws, stacking sequences and material thicknesses. The application of these

174
rules added 4% additional mass to the design, and would have been the same
for both manual lay-up and automated processes. This mass gain is typical in
industrial designs where design fidelity is increasing as a result of structural
analysis.
The design step in section 6.4.2 addressed the minimum cut length requirement
of the automated process. The shape of the plies in the laminate around the
locally reinforced area were altered and the component mass was increased by
10% to account for a machine specific parameter. This mass can be directly
attributed to the chosen manufacturing process and specific machine. The
Coriolis machine selected has a MCL of 100mm, however a competitor machine
may have a larger or smaller MCL which would offer a proportionally larger or
smaller mass addition. This design penalty is a direct result of selecting an
automated manufacturing process to produce the component, however
identifying this extra mass before the structural optimisation has enabled the extra
mass to be taken into account when evaluating the performance of the
component.
The design step in section 6.4.3 did not require the component design to be
altered, but did lead to a second iteration of tooling design. The design process
prompted this tooling check at a point in the design lifecycle where changes to
the component and tooling design could be easily incorporated at low cost. If this
step was addressed later in the design lifecycle then the cost of making the
change could have been greater. The cost would have been significant if the
component design and tool design had already been released for programming
and manufacture.
The design steps in sections 6.4.4 and 6.4.5 did not add mass to the component,
but did affect the orientations of the fibres. Typically the design allows the
manufacturing process to deposit fibres within ±3°, however some of the fibre
trajectories were adjusted locally up to ±5° in order to reduce defects. The
resulting fibre angles need to be captured in the early stages of the design so that
they can be evaluated along with the extra mass to ensure that the component
can still meet or exceed its performance objectives.

175
The design step in section 6.4.6 introduced gaps in specific areas of the laminate
where high consolidation forces cause the laminate to exhibit locally poor
permeability. These gaps ensure that the laminate can be successfully infused
with resin, but alter the resin to fibre volume fraction, lowering the percentage of
fibres per volume and reducing the structural performance of the laminate. This
is an essential design modification required for dry fibre AFP preforms that rely
on the resin infusion process to add the resin. There are other infusion processes
such as RTM which would not be so sensitive to permeability, however liquid
resin infusion is seen as a low-cost manufacturing technology and is currently
dominating the industrial research in composite structures for most UK based
aerospace structures companies.

176
7 DISCUSSION AND CONCLUSIONS
This chapter provides the reader with a detailed analysis of the research
achievements of this work, whilst describing the quality, generality, and
applicability of the methods followed. This is followed by a description of the key
limitations to the research in section 7.3 and the suggested future work in section
7.4. This chapter is closed with a conclusion containing a summary of the work
presented in this research.
7.1 Research achievements
The research reported in this thesis presents a new design process for
incorporating manufacturing considerations into a composite component design.
The aim of the PhD is to create “a generic design process to support the design
for automated manufacturing of composites components”. By implementing the
design process, DFM for automated manufacturing of composites can be
systematically applied to the design lifecycle, providing engineers with a more
reliable and repeatable way to create robust composite designs.
The research objectives defined in section 1.3 led to a number of research
challenges around the identification of manufacturing constraints, where in the
design lifecycle to account for them, and how to integrate them into existing digital
tools. The achievement of the research objectives is recorded in Table 28.

177
Table 28: Achievement of research objectives
Research
Objective Chapter Description
1: LITERATURE
REVIEW
2 Literature evaluated for design and manufacturing of
composites, DFM for composite structures, digital
tools for DFM and systematic approaches to apply
DFM
2: CAPTURING
CURRENT
PRACTICES
USING
INDUSTRIAL
USE CASES
3 Three industrial examples demonstrated with use
cases: Section 3.3.1 describes the structural sizing of
a composite structure. Section 3.3.2 describes the
manufacturing analysis carried out on a composite
design including design rules. Section 3.3.3 describes
the design evaluation methods including how to score
the manufacturability of the design.
3: STRATEGIES
TO APPLY DFM
USING DIGITAL
TOOLS
4 An approach to using digital tools (CATIA, Excel, VBA,
C++ and AFP simulation software) to apply DFM is
demonstrated with three industrially relevant use
cases: Section 4.3 demonstrates low fidelity design
evaluation. Section 4.4 demonstrates higher fidelity
evaluation using simulation. Section 4.5 validates the
proposed strategies by manufacturing physical trials.
4: DESIGN
PROCESS AND
SUPPORTING
TOOLS FOR
DFM
5 The design process is described in section 5.4. To
demonstrate this three examples are described in
sections 5.6, 5.7 & 5.8. The design process for AFP is
described in 5.4.5.
5: VALIDATION
OF PROPOSED
DFM
PROCESSES
AND TOOLS
6 The final validation of the research is achieved using
an industrially relevant use case, with the key DFM
practices and tools described in chapter 6.

178
In addition to the achievement of the research objectives, the design process
proposed is assessed for its quality, generality and applicability.
7.1.1 Quality of research process
To ensure adequate quality of the key findings derived from this research, a
systematic approach to identifying and understanding the findings was
established. Interactions with the experts referred to in this work were planned in
advance so that each expert was able to understand the questions before the
meeting or workshop took place. This ensured experts had time to think about
their responses and offer examples to aid in the extraction of knowledge or add
to the context of how a potential answer was used. All of the experts referred to
in this work interact on a regular basis with the author, increasing the
opportunities for them to be engaged with the research, and making the
facilitation of more formal interactions much easier.
The author has gained experience in the aerospace industry working with
different manufacturing and design projects. These projects include a variety of
tasks that are relevant to this research such as developing design rules for the
AFP process, creating digital tools to perform DFM at early stages in the design
lifecycle and designing and manufacturing composite structures using automated
deposition. Because the experience is relevant to the research objectives of this
thesis, the experience enhances the quality of the research.
The reliance on use-cases to describe DFM and evaluate DFM throughout this
research has enabled a strong theme of applied research to be implemented. The
research has been fully industrially funded and many of the research findings
have already been adopted by the sponsoring parties. The requirement to
demonstrate research findings with real designs, real components and using
existing digital tools enables real challenges to be described and addressed in
each chapter. The use cases provide a step by step route to validation of each
research objective or research finding. The final use case described in section
6.4 provides a validation of the full design process with an industrially relevant

179
component that is designed with the intention of highlighting known challenges
associated with dry automated fibre placement manufacturing.
The assessment of each research objective, excluding the first objective relating
to the literature review, was realised through quantitative and qualitative
analyses. The quantitative analysis aimed to determine the validity of the results
by means of measuring the design changes resulting from the integration of
manufacturing constraints. In each chapter at least one use case was chosen to
help qualify the research result. The qualitative analysis was carried out by using
experts to assess the design and manufacturing objectives for each design
process step. The experts help to establish the level of understanding of the
design and manufacturing rules, and the use cases enable a secondary
evaluation of usability and relevance of the design process. The procedure
followed to validate the outcomes of this research is described in Table 29.

180
Table 29: Validation of the research outcomes
Objective Validation Description
2: CAPTURING
CURRENT PRACTICES
USING INDUSTRIAL USE
CASES
Qualitative and
Quantitative
The use cases are used to describe the typical
problems faced by engineers in the aerospace
industry. The data presented quantifies the
design differences between as-designed and as-
manufactured solutions.
3: STRATEGIES TO
APPLY DFM USING
DIGITAL TOOLS
Qualitative and
Quantitative
The strategies described are derived and
assessed by experts, providing quality
assessment. The data presented in the use
cases is used to quantify the impact of digital
tools being used to apply DFM.
4: DESIGN PROCESS
AND SUPPORTING
TOOLS FOR DFM
Qualitative The design process is heavily reliant on the
quality assessments by a group of experts. The
assessment is recorded in the table in section
5.4.5.
5: VALIDATION OF
PROPOSED DFM
PROCESSES AND
TOOLS
Quantitative The use case described in this chapter uses the
design process to highlight manufacturing driven
changes in the design and quantifies the effects
of these changes in terms of mass gained by the
component and manufacturing speed
implications.
7.1.2 Generality of the research methodology
The generality of the research methodology is quantitatively discussed here. The
field of DFM is wide and covers many different manufacturing processes,
however this research focuses only on composite structures and automated
production technologies. Generality can therefore only be achieved within some
bounding limitations. The author believes that the design process proposed
represents a generic approach that is common for many manufacturing
processes, and can therefore be applied in a number of alternative contexts and
in other industries. However, safe claims can only be made when they have been

181
validated with a suitable use case, so the generality of this research needs to be
constrained as follows:
Limited to the aerospace industry, or others using automated composite
manufacturing technologies such as wind energy.
Only valid for products where the full design lifecycle is accessible, not
fully applicable for manufacturers who are not responsible for the
conceptual design of the product.
Only effective when adequate manufacturing and design expertise is
available to carry out the assessment.
This research proved to be an effective way to ensure that an aerospace inspired
composite component could be adapted to suit manufacture using an automated
system. Further research is required to prove the success of the design process
over a wider scope.
7.1.3 Applicability of the proposed design process
This section discusses the application of the design process and the potential
business impact. The design process allows engineers to address manufacturing
requirements of the design at the earliest possible stages in the design lifecycle,
and as highlighted in section 1.1, when 80% of the manufacturing costs are fixed
at the early stages of the design lifecycle [6], identifying these requirements early
can lead to significant cost savings.
The aerospace industry is leading the drive to industrialise automated production
methods and the extensive use of composite materials in aircraft structures.
Some of the research carried out in this work has already been adopted in
industry, and the exact nature of these adoptions is described in Table 30. For
example, Airbus integrated the ply continuity methodology into the manufacturing
ply design analysis tool named mPDA.
By taking a systematic approach to implementing design for manufacture, a
company can ensure that composite designs are progressed into production with
minimal design evolution and minimal production costs. In order to implement the
design process described in chapter 5 for a current aerospace component and

182
production process, the FMEA analysis would need to be revised to take account
of the specific automated deposition machines selected and the CAD system
selected for the design. A team of experts would be required to assess any new
process steps that the new software and new production system introduce.
Because the design process is likely to remain subtractive, and the manufacturing
process will still be additive, the majority of the process steps should remain
unchanged, albeit with updated parameters such as minimum cut lengths to suit
the new machines.
In summary, with this aerospace end-application in mind, the design process is
sufficiently generic to be easily adapted to a new machine or a new design. The
business impact will depend on the level of expertise available, but will in all cases
act as a guide to evaluate the design with respect to the manufacturing process.
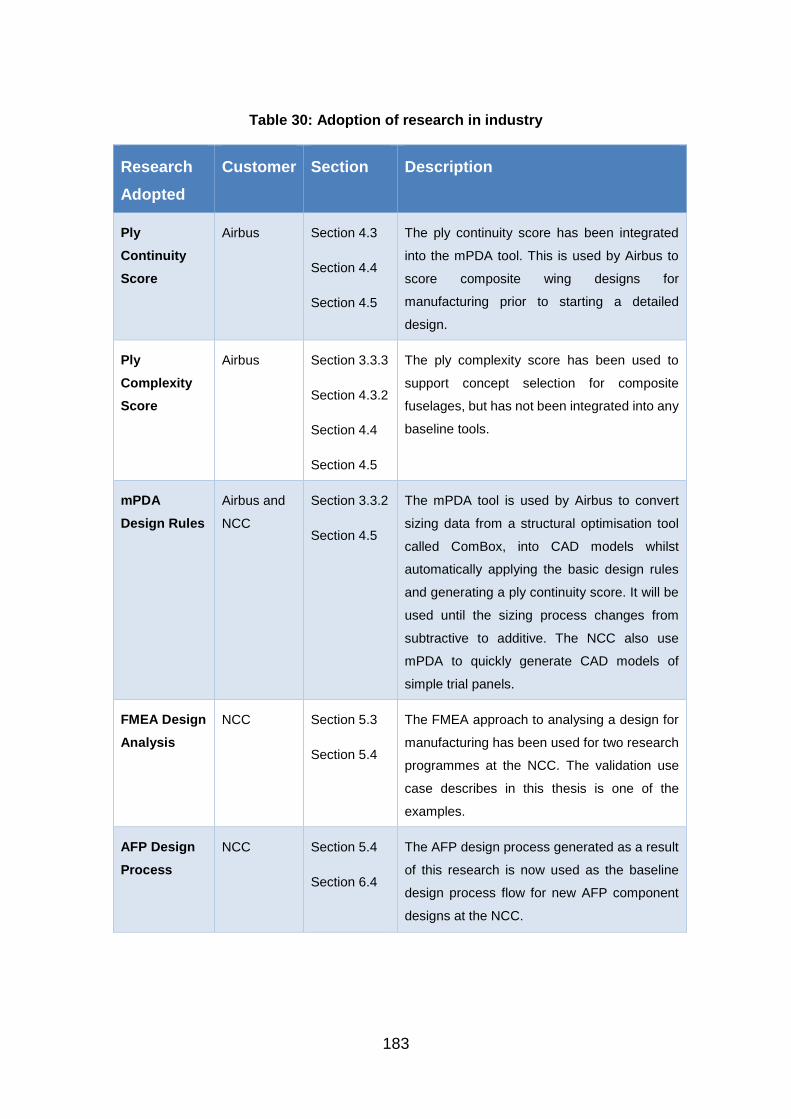
183
Table 30: Adoption of research in industry
Research
Adopted
Customer Section Description
Ply
Continuity
Score
Airbus Section 4.3
Section 4.4
Section 4.5
The ply continuity score has been integrated
into the mPDA tool. This is used by Airbus to
score composite wing designs for
manufacturing prior to starting a detailed
design.
Ply
Complexity
Score
Airbus Section 3.3.3
Section 4.3.2
Section 4.4
Section 4.5
The ply complexity score has been used to
support concept selection for composite
fuselages, but has not been integrated into any
baseline tools.
mPDA
Design Rules
Airbus and
NCC
Section 3.3.2
Section 4.5
The mPDA tool is used by Airbus to convert
sizing data from a structural optimisation tool
called ComBox, into CAD models whilst
automatically applying the basic design rules
and generating a ply continuity score. It will be
used until the sizing process changes from
subtractive to additive. The NCC also use
mPDA to quickly generate CAD models of
simple trial panels.
FMEA Design
Analysis
NCC Section 5.3
Section 5.4
The FMEA approach to analysing a design for
manufacturing has been used for two research
programmes at the NCC. The validation use
case describes in this thesis is one of the
examples.
AFP Design
Process
NCC Section 5.4
Section 6.4
The AFP design process generated as a result
of this research is now used as the baseline
design process flow for new AFP component
designs at the NCC.

184
7.1.4 Achieving the research objectives
Each of the research objectives has been achieved in a separate chapter of this
thesis. Table 31 draws comparison between each research objective and how it
has been achieved in this thesis.
Table 31: Research objectives and descriptions how they have been achieved
Research Objective Achievement
1. Capture the state of the art for
DFM of composites using digital
technologies.
Comprehensive literature survey of
published research completed and
reported in chapter 2.
2. Capture the current industrial
design practices using use cases
for composite structures.
Industrial design practices are explained
and documented using the examples
provided in chapter 3.
3. Develop strategies for applying
DFM best practice through the
use of digital tools.
Strategies for evaluating manufacturability
are described and examples are given in
chapter 4.
4. Develop a generic process and
supporting tools to systematically
apply DFM for automated
composite manufacture.
A generic process is described in chapter
5, and the process is applied to the design
of a composite component as an example.
The supporting tools are described.
5. Validate the proposed DFM tool
kit using a design use-case
described in section 1.6
“Research Methodology”.
An industrially relevant use case is
designed and then manufactured to
validate the generic design process
developed in this research. This is
documented in chapter 6.
The use cases described in this research have been developed over six years,
with some of the methods taking up to 18 months to create, test and refine. The
key contributions are summarised in Table 32.

185
Table 32: The main research contributions, use cases and associated timescales
Contribution Use Case Timescale
Chapter 2:
Design Rules
The industrial practice provided a
source for the generic composite
design rules. How the rules work
with a subtractive sizing process
and automated manufacture
needed to be established.
Initial research into how the design rules
affected the sizing and manufacturing
processes started in 2011 and after 6
months of testing on a wing design the
main issues had been identified.
Chapter 3: Ply
Continuity
The concept of checking cells in
an array for material occupancy
and adjacency using a
programmable procedure to
generate a score for a given
design.
A proof of concept was created in Excel
based on an attempt to predict machine
paths without CAD data. This was then
developed into the first mPDA application
over 9 months. mPDA went on to be
further developed over 3 years.
Chapter 3: Ply
Complexity
The concept of comparing the
area of a ply with the
circumference to generate a
score for a given design.
The concept was created to account for
geometry where ply continuity couldn’t.
This took 3 months to develop and test
using an aircraft wing as a use-case.
Chapter 4: AFP
Simulation
The use of AFP simulations to
generate indicative cycle times.
The strategies required to steer
fibre trajectories to eliminate
defects.
The coupons simulated and manufactured
in chapter 4 took 6 months to design,
simulate and manufacture. The
methodology to create custom steered
fibre trajectories was developed over 18
months with over £600k worth of trial
components manufactured.
Chapter 5:
FMEA Process
The adaption of the FMEA
process to create a generic
design process.
Developing the methodology and testing it
on trial components took 6 months.
Chapter 6: Final
Demonstrator
The design, development and
manufacture of the use case
using the generic design process.
The design, development and manufacture
of the use case took 15 months and cost
approximately £400k.

186
7.2 Novelty
In section 2.7.3 the research gap was identified in three main areas:
1) a lack of manufacturing constraints being addressed in the early stages of
the design lifecycle,
2) a shortage of research verified with physical use cases, and
3) the need for methods to design for automated production techniques.
The novelty in this research is the way in which each of these three gaps have
been addressed.
Lack of manufacturing constraints in the early stages of design. The generic
design process demonstrated that the adapted FMEA process was capable of
identifying the manufacturing constraints relative to the steps in the design
process, and provided a mechanism to account for the constraints at the earliest
opportunity in the design lifecycle. The methods used to define the design
process and identify the manufacturing constraints addresses this research gap.
Shortage of research verified with physical use cases. The research
objectives in this thesis utilise a number of design examples and use cases for
illustration purposes. This provides an opportunity to validate a number of design
steps and manufacturing constraints with physical components. Since the
automated deposition technology is not abundantly available to research
institutions, and is very costly to operate, very few automated deposition research
articles conclude with a physical demonstrator as validation. This research has
been carried out with unlimited access to three AFP machines at the NCC, and
access via industrially funded research to a further four alternative types of AFP
machine. Hence, multiple physical demonstration components have been
manufactured to validate the research objectives, and address the research gap.
Requirement of methods to design for automated production. The challenge
of designing for automated composite manufacturing processes was barely
recorded in published literature. Many machine specific rules must be established

187
for any given design, but the interpretation of the rules remains the responsibility
of the designer and is dependent on the experience gained by the individual. The
generic design process described in chapter 5 and the strategies for applying
DFM in chapter 4 enable a designer to adopt a systematic approach to applying
manufacturing constraints to a design, without relying on previous experience to
define the correct practices. The approach is suitably generic to be applied to a
design when the specific deposition machine is not known, yet detailed enough
to be used with machine specific constraints. This approach was not reported in
published literature, and now it has been defined, it addresses the remaining
research gap.
7.3 Key research limitations
In this section the limitations related to the research results are described. Three
types of limitation have been identified. The first limitation addresses the
availability of expert knowledge. The second limitation addresses the complexity
of the design, and the third addresses the suitability of the manufacturing
technology selected. In each of these limitations, the compromise between
design performance and production performance is traded and an unsatisfactory
result may emerge if the trade-off between the two is not balanced:
Availability of expert knowledge: As previously mentioned, the design
process is highly dependent on experts being able to identify potential
manufacturing problems, and also identify the root cause of the problem
in the design. In this research the design process and manufacturing
process were very well understood by the experts, so they were able to
propose evidence and experience based analysis. This led to the
formation of 28 high integrity design process steps. If the manufacturing
or design process is new or novel, and experience with previous
manufactured components is not readily available, then the correct
manufacturing constraints may not be easy to identify and their root cause
may be overlooked.
Design complexity: A high performance, high complexity design may
have less room for adaption when it comes to incorporating changes to
188
suit the manufacturing process. In section 6.4.2, the shape of the use-case
component changed, adding 10% additional mass to the component in
order to account for a machine characteristic, yet the original design could
have been manufactured without these changes if a manual process had
been chosen for production. This highlights the limitation that designing for
automated production requires a large degree of design freedom, and
some complex composite structure designs cannot tolerate such
significant changes.
Manufacturing suitability: The design process assumes that the
manufacturing process is suitable for the design. In some cases, a
technology like AFP is not appropriate for the specific design intent, and
the benefits of an automated and repeatable manufacturing process do
not outweigh the design limitations that need to be accounted for. In these
instances, the design process is likely to highlight all of the manufacturing
constraints, but the resulting design may fail to meet its original
performance criteria. This is common with components that are
manufactured by hand and are not sensitive to manufacturing variation.
Examples are sports equipment like bicycle frames and tennis rackets,
compared to the example of an aerospace engine fan blade where part
repeatability is more critical than component mass.
7.4 Future work
This section lists research areas that have been identified by the author as having
potential to carry out further work:
Knowledge management. A more structured way to store the knowledge
captured by experts while evaluating the design process would help the
re-use of captured expert knowledge. Being able to network the
knowledge and visualise trends could make the creation of new rules
easier.
Alternative manufacturing processes. Further work is required to
expand the design process so that it incorporates alternative automated
manufacturing processes and materials. Automated tape laying, braiding

189
and filament winding are all automated processes that could be
represented with minimal additional work.
Multi-objective optimisation. Throughout this thesis, the conflicting
requirements of design performance and manufacturing performance
have been compared. The mechanisms to evaluate and numerically score
performance parameters, such as mass and stiffness for design, and ply
continuity and ply complexity for manufacturing already exist, and can
therefore be used as objectives for a multi-objective optimisation exercise.
For example, changing the sequence of ply orientations in all of the
individual cell stacking sequences in order to reduce mass and improve
ply continuity would make a valuable digital tool for DFM.
Manufacturing informatics. The recent developments in digitally
connected manufacturing systems enable the use of manufacturing
process simulation to be more readily used to influence the design and
predict manufacturing process changes. The modern manufacturing
systems also monitor the processes at higher fidelity and gather large
amounts of data about the process that can be used to enhance
understanding of the process mechanics. Further work is required to
understand how the design process can be improved to utilise the benefits
of higher fidelity process data and process simulations.
7.5 Conclusions
In this research, a generic process that uses digital technology to facilitate design
for automated manufacture for composite structures was developed. The design
process addresses a set of industrial needs identified by the author. The parts of
this PhD thesis related to the original industrial motivations are:
Digitise manufacturing constraints so that they can be used with
digital tools. The Airbus MDOW project [11] identified a need to represent
manufacturing at a much earlier stage in the design lifecycle than would
normally be considered best practice. This introduced the challenge of
modelling high fidelity manufacturing events using very low fidelity design
data. In this regard, a key feature that was developed as part of this work

190
is the methodology of the ply continuity and complexity scores. The
methods described in this work have been incorporated into the digital
tools used by Airbus to evaluate conceptual and preliminary composite
aircraft designs.
Establish processes that represent manufacturing considerations at
early stages of the design lifecycle. It is easy to retrospectively assess
the decisions made early on in the design lifecycle when faced with a very
mature design or a physical component. However, making high integrity
design decisions about the manufacturing process when the design fidelity
is very low is a serious challenge. This research intended to create a
systematic approach to evaluate the design lifecycle with respect to
manufacturing. The work demonstrated that a designer equipped with a
low fidelity design could follow basic design process steps to identify how
design decisions will influence the manufacturing process. The final use
case proved that this approach could be taken to mature a conceptual
design and ensure it could be manufactured using an automated
deposition process.
Improve the manufacturing speed through design. The industrial goal
behind applying DFM best practices for automated composite production
is to manufacture a high performance aircraft with a large profit margin. If
Airbus decide to replace their current A320 family of single aisle aircraft
with a composite variant, they will need to offer the airlines an aircraft that
is capable of a significant performance improvement, at a price that is
competitive with the existing aircraft family and with a similar profit margin.
In order to achieve this, the next generation aircraft will need to be
designed with an automated composite manufacturing process in mind.
Manually producing composite structures using lower cost labour was
ruled out because manual lay-up could not deliver the repeatability of an
automated system. This research identifies a number of tools that can be
used to indicate the manufacturing speed of a design, and it also highlights
the points in the design lifecycle where it is important to account for the
manufacturing process constraints.

191
Advance the understanding of DFM for automated composite
manufacturing. Until undertaking this work, the active steps taken by a
designer to address the AFP manufacturing constraints had not been
adequately recorded or reported. A good designer or programmer relied
on their own past experience to identify best practice, and the outputs from
different designers varied based on their experience making it difficult to
achieve consistency across designs. Capturing the manufacturing
intelligence in the form of a process flow with corresponding corrective
actions provides designers with a generic process to follow that contains
both the manufacturing constraints and the corresponding design actions
in a chronological sequence of steps. This design process has been
reported in this thesis, and also published for use at the NCC and Airbus.
The validation of the design process was achieved through the successful design
and manufacture of a demonstrator component. The design lifecycle has been
documented in this work, and most significant DFM steps have been described
in greater detail in chapter 6. The manufactured component satisfied the original
design performance requirements, but mass was added in order to satisfy the
requirements of the manufacturing process. The design process has proven to
be an adequate guide for the application of automated composite manufacturing
considerations throughout the lifecycle of a composite structure design.
Prior to the initiation of this research, the following industrial challenges were
unresolved in the published literature:
Whilst systematic approaches to apply DFM to a design have been
published, a solution to address the specific challenges of automating
composite manufacturing had not been developed.
The challenges of designing for automated composite manufacture are not
adequately addressed in existing literature and industrial design guides,
relying on the skill and experience of the individual designers to produce
high quality designs.

192
As a result of this research, the following new conclusions have been generated:
A systematic design process can now be used for composite components
that will be manufactured using automated production technologies.
The specific manufacturing constraints which must be mitigated in order
to use automated composite manufacturing are known.
The design lifecycle for composite structures which will be manufactured
using AFP is now understood, with the key manufacturing considerations
identified at the correct stages of the lifecycle in order to have maximum
effect.
193
REFERENCES
[1] T. Homberg, “EADS Vision 2020: Keeping strategy focused through the
turbulences.” EADS, Broughton, UK, pp. 1–11, 2009.
[2] “Advanced Development Programs.” [Online]. Available:
http://www.lockheedmartin.com/us/products/adp.html. [Accessed: 08-Oct-
2012].
[3] M. Fischer, D. Kennedy, and C. A. Featherston, “Multilevel framework for
optimization of lightweight structures,” Proceedings of the Institution of
Mechanical Engineers, Part G: Journal of Aerospace Engineering, vol.
226, no. 4, pp. 380–394, Jan. 2012.
[4] “The digital thread: Transformation to automation.” [Online]. Available:
https://extranet.cranfield.ac.uk/columns/,DanaInfo=www.compositesworld.
com+the-digital-thread-transformation-to-automation.
[5] P. Bermell-Garcia, W. J. C. Verhagen, S. Astwood, K. Krishnamurthy, J.
L. Johnson, D. Ruiz, G. Scott, and R. Curran, “A framework for
management of Knowledge-Based Engineering applications as software
services: Enabling personalization and codification,” Advanced
Engineering Informatics, vol. 26, no. 2, pp. 219–230, 2012.
[6] K. Wang, D. Kelly, and S. Dutton, “Multi-objective optimisation of
composite aerospace structures,” Composite Structures, vol. 57, no. 1–4,
pp. 141–148, Jul. 2002.
[7] S. Quintana-Amate, P. Bermell-Garcia, and A. Tiwari, “Transforming
expertise into Knowledge-Based Engineering tools: A survey of
knowledge sourcing in the context of engineering design,” Knowledge-
Based Systems, vol. 84, pp. 89–97, 2015.
[8] S. Astwood, A. Tiwari, and D. Ruiz, “Optimisation of composite designs
for automated manufacture,” in Proceedings of the 9th International
Conference on Manufacturing Research ICMR 2011, 2011, pp. 12–17.
194
[9] “Delivering the future: Airbus Global Market Forecast 2011-2030.” Airbus
S.A.S., Blagnac, France, pp. 1–48, 2011.
[10] Innovate UK and Airbus UK Limited, “NGCW High Volume Manufacture
(HiVol),” Gateway to research, 2012. [Online]. Available:
http://gtr.rcuk.ac.uk/projects?ref=110007. [Accessed: 19-Apr-2017].
[11] Innovate UK and Airbus UK Limited, “NGCW : Multi Discipline Optimised
Wing (MDOW),” Gateway to research, 2012. [Online]. Available:
http://gtr.rcuk.ac.uk/projects?ref=110005. [Accessed: 19-Apr-2017].
[12] K. Schueler and R. Hale, “Object-oriented implementation of an integrated
design and analysis tool for fiber placed structures,” in International
SAMPE Symposium and Exhibition (Proceedings), 2002, vol. 47 II, pp.
1827–1841.
[13] M. L. Skinner, “New applications and approaches expand market for
composites software,” Reinforced Plastics, vol. 50, no. 6, pp. 42–47, Jun.
2006.
[14] D. Tyso and A. Langridge, “Composite parts: commercialising the time
and cost-estimation process, JEC Composites,” JEC Magazine #24,
2006. [Online]. Available:
http://www.jeccomposites.com/news/composites-news/composite-parts-
commercialising-time-and-cost-estimation-process. [Accessed: 27-Feb-
2012].
[15] C. Laval, “Composites design in the real world,” Reinforced Plastics, vol.
47, no. 8, pp. 50–53, Sep. 2003.
[16] R. I. Mair, “Advanced composite structures research in Australia,”
Composite Structures, vol. 57, no. 1–4, pp. 3–10, Jul. 2002.
[17] C. Grant, “Status update on composites automation : Composites World,”
Composites World, Feb-2011. [Online]. Available:
http://www.compositesworld.com/columns/status-update-on-composites-
automation. [Accessed: 28-Feb-2012].

195
[18] C. Grant, “Automated processes for composite aircraft structure,”
Industrial Robot: An International Journal, vol. 33, no. 2, pp. 117–121,
Mar. 2006.
[19] J. Sloan, “ATL and AFP: Signs of evolution in machine process control :
Composites World,” Composites World, Feb-2008. [Online]. Available:
http://www.compositesworld.com/articles/atl-and-afp-signs-of-evolution-in-
machine-process-control. [Accessed: 28-Feb-2012].
[20] J. Sloan, “ATL and AFP: Defining the megatrends in composite
aerostructures : Composites World,” Composites World, Feb-2012.
[Online]. Available: http://www.compositesworld.com/articles/atl-and-afp-
defining-the-megatrends-in-composite-aerostructures. [Accessed: 28-
Feb-2012].
[21] J. Sloan, “AFP/ATL design-to-manufacture: Bridging the gap : Composites
World,” Composites World, Feb-2009. [Online]. Available:
http://www.compositesworld.com/articles/afpatl-design-to-manufacture-
bridging-the-gap. [Accessed: 28-Feb-2012].
[22] A. Syberfeldt, A. Ng, R. I. John, and P. Moore, “Multi-objective
evolutionary simulation-optimisation of a real-world manufacturing
problem,” Robotics and Computer-Integrated Manufacturing, vol. 25, no.
6, pp. 926–931, 2009.
[23] L. Li and G. Q. Huang, “Multiobjective evolutionary optimisation for
adaptive product family design,” International Journal of Computer
Integrated Manufacturing, vol. 22, no. 4, pp. 299–314, 2009.
[24] G. Totaro and Z. Gürdal, “Optimal design of composite lattice shell
structures for aerospace applications,” Aerospace Science and
Technology, vol. 13, no. 4–5, pp. 157–164, Jun. 2009.
[25] M. R. Motley and Y. L. Young, “Performance-based design and analysis
of flexible composite propulsors,” Journal of Fluids and Structures, vol.
27, no. 8, pp. 1310–1325, Nov. 2011.

196
[26] G. Marsh, “Reinforced Plastics - Automating aerospace composites
production with fibre placement,” Reinforced Plastics, Feb-2011. [Online].
Available: http://www.reinforcedplastics.com/view/17236/automating-
aerospace-composites-production-with-fibre-placement/. [Accessed: 28-
Feb-2012].
[27] J. Gralfs, “Market requirements,” in Industry 4.0 Summit, 2017.
[28] D. G. Lee, J. Do Suh, H. Sung Kim, and J. Min Kim, “Design and
manufacture of composite high speed machine tool structures,”
Composites Science and Technology, vol. 64, no. 10–11, pp. 1523–1530,
2004.
[29] Y. S. Liao and C. Y. Chiou, “Robust optimum designs of fibre-reinforced
composites with design-variable and non-design-variable uncertainties,”
Proceedings of the Institution of Mechanical Engineers, Part L: Journal of
Materials: Design and Applications, vol. 222, no. 2, pp. 111–121, 2008.
[30] M. C. W. Lee, Z. Mikulik, D. W. Kelly, R. S. Thomson, and R. Degenhardt,
“Robust design – A concept for imperfection insensitive composite
structures,” Composite Structures, vol. 92, no. 6, pp. 1469–1477, May
2010.
[31] K. D. Potter, R. Davies, M. Barrett, A. Godbehere, L. Bateup, M. Wisnom,
and A. Mills, “Heavily loaded bonded composite structure: Design,
manufacture and test ‘I’ beam specimens,” Composite Structures, vol. 51,
no. 4, pp. 389–399, 2001.
[32] C. Featherston and A. Watson, “Multilevel optimization of composite
panels under complex load and boundary conditions,” Structural and
Multidisciplinary Optimization, vol. 36, no. 1, pp. 15–27, 2008.
[33] X. Li, G. Li, and C. Wang, “Optimisation of Composite Sandwich
Structures Subjected to Combined Torsion and Bending Stiffness
Requirements,” Applied Composite Materials, vol. 19, no. 3, pp. 689–704,
2012.
197
[34] M. W. Tosh and D. W. Kelly, “Fibre steering for a composite C-beam,”
Composite Structures, vol. 53, no. 2, pp. 133–141, Aug. 2001.
[35] T. Aized and B. Shirinzadeh, “Robotic fiber placement process analysis
and optimization using response surface method,” The International
Journal of Advanced Manufacturing Technology, vol. 55, no. 1–4, pp.
393–404, 2011.
[36] D. Mungalov, P. Duke, and A. Bogdanovich, “Advancements in design
and manufacture of 3-D braided preforms for complex composite
structures,” 2006.
[37] C. Dong, “Process-induced deformation of composite T-stiffener
structures,” Composite Structures, vol. 92, no. 7, pp. 1614–1619, Jun.
2010.
[38] A. Beukers, M. J. L. Van Tooren, and T. De Jong, “Multi-disciplinary
design philosophy for aircraft fuselages. Part I,” Applied Composite
Materials, vol. 12, no. 1, pp. 3–11, 2005.
[39] T. Coates, A. Smith, M. Emanuel, and B. Peterson, “Automation of
optimal laminate design,” Australian Journal of Mechanical Engineering,
vol. 6, no. 2, pp. 119–126, 2008.
[40] K. . Edwards, “Exploiting new materials and processes for higher
productivity: use of advanced composite technologies,” Materials &
Design, vol. 25, no. 7, pp. 565–571, Oct. 2004.
[41] M. P. Wiehn and R. D. Hale, “Low cost robotic fabrication methods for tow
placement,” in International SAMPE Symposium and Exhibition
(Proceedings), 2002, vol. 47 II, pp. 1842–1852.
[42] F. Romano, J. Fiori, and U. Mercurio, “Structural design and test
capability of an integrated stiffened CFRP panel,” Aircraft Engineering
and Aerospace Technology, vol. 82, no. 4, pp. 249–257, Jul. 2010.

198
[43] F. W. J. van Hattum, F. Regel, and M. Labordus, “Cost reduction in
manufacturing of aerospace composites,” Plastics, Rubber and
Composites, vol. 40, no. 2, pp. 93–99, Mar. 2011.
[44] M. Kaufmann, D. Zenkert, and M. Åkermo, “Cost/weight optimization of
composite prepreg structures for best draping strategy,” Composites Part
A: Applied Science and Manufacturing, vol. 41, no. 4, pp. 464–472, Apr.
2010.
[45] Z. Y. Han, Y. H. Li, H. Y. Fu, and Z. X. Shao, “Thermoplastic composites
fiber placement process research,” Cailiao Gongcheng/Journal of
Materials Engineering, no. 2, pp. 91–96, 2012.
[46] R. Schledjewski and M. Latrille, “Processing of unidirectional fiber
reinforced tapes—fundamentals on the way to a process simulation tool
(ProSimFRT),” Composites Science and Technology, vol. 63, no. 14, pp.
2111–2118, Nov. 2003.
[47] B. P. Van West, R. B. Pipes, M. Keefe, and S. G. Advani, “The draping
and consolidation of commingled fabrics,” Composites Manufacturing, vol.
2, no. 1, pp. 10–22, Mar. 1991.
[48] C. D. Rudd, M. R. Turner, A. C. Long, and V. Middleton, “Tow placement
studies for liquid composite moulding,” Composites Part A: Applied
Science and Manufacturing, vol. 30, no. 9, pp. 1105–1121, Sep. 1999.
[49] A. W. Blom, M. M. Abdalla, and Z. Gürdal, “Optimization of course
locations in fiber-placed panels for general fiber angle distributions,”
Composites Science and Technology, vol. 70, no. 4, pp. 564–570, Apr.
2010.
[50] M. W. Tosh and D. W. Kelly, “On the design, manufacture and testing of
trajectorial fibre steering for carbon fibre composite laminates,”
Composites Part A: Applied Science and Manufacturing, vol. 31, no. 10,
pp. 1047–1060, 2000.

199
[51] J. Choi, D. Kelly, and J. Raju, “A knowledge-based engineering tool to
estimate cost and weight of composite aerospace structures at the
conceptual stage of the design process,” Aircraft Engineering and
Aerospace Technology, vol. 79, no. 5, pp. 459–468, Sep. 2007.
[52] L. Zhang and Y. Fan, “Data integration of design, analysis and
manufacture for aircraft composite structures,” Beijing Hangkong
Hangtian Daxue Xuebao/Journal of Beijing University of Aeronautics and
Astronautics, vol. 34, no. 4, pp. 452–455, 2008.
[53] R. Hale, K. Schueler, and K. Lim, “Object-oriented design and analysis
tools for fiber steered composites,” Journal of Advanced Materials, vol.
38, no. 2, pp. 14–27, 2006.
[54] C. H. Park, W. I. Lee, S. J. Kim, W. S. Han, and A. Vautrin, “Simultaneous
optimization of design and manufacture of composite structures,” in 19th
AIAA Applied Aerodynamics Conference, Fluid Dynamics and Co-located
Conferences, 2001, vol. 1, pp. 186–196.
[55] P. Ungaro and J. Grape, “Designing composite structures for the
manufacturing process,” in SAMPE ’06: Creating New Opportunities For
The World Economy, 2006, vol. 51, p. 12.
[56] C. Zhang, S. Jiang, and B. Wang, “Performance modeling and
optimization of composite manufacturing processes,” American Society of
Mechanical Engineers, Manufacturing Engineering Division, MED, vol. 11,
pp. 1055–1059, 2000.
[57] S. Mouton, Y. Ledoux, D. Teissandier, and P. Sébastian, “Composite part
design based on numerical simulation of the manufacturing process,” The
International Journal of Advanced Manufacturing Technology, vol. 55, no.
5–8, pp. 421–431, Dec. 2010.
[58] J. Ye, B. Zhang, and H. Qi, “Cost estimates to guide manufacturing of
composite waved beam,” Materials and Design, vol. 30, no. 3, pp. 452–
458, 2009.

200
[59] R. D. Hale and V. M. Vasey-Glandon, “PACKS: An affordable knowledge-
driven composite design for manufacturing process,” in International
SAMPE Technical Conference series, 2001, vol. 46 II, pp. 1885–1898.
[60] M. Wheatley, “Design for manufacture: are you fit for purpose? - E & T
Magazine,” Engineering and Technology, vol. 5, no. 5, pp. 54–56, 2010.
[61] H. Ghiasi, D. Pasini, and L. Lessard, “Constrained Globalized Nelder--
Mead Method for Simultaneous Structural and Manufacturing
Optimization of a Composite Bracket,” Journal of Composite Materials,
vol. 42, no. 7, pp. 717–736, 2008.
[62] S. Jiang, C. Zhang, and B. Wang, “Optimum arrangement of gate and
vent locations for RTM process design using a mesh distance-based
approach,” Composites - Part A: Applied Science and Manufacturing, vol.
33, no. 4, pp. 471–481, 2002.
[63] S. Mouton, D. Teissandier, P. Sébastian, and J. P. Nadeau,
“Manufacturing requirements in design: The RTM process in aeronautics,”
Composites Part A: Applied Science and Manufacturing, vol. 41, no. 1,
pp. 125–130, Jan. 2010.
[64] Y. Hailian and Y. Xiongqing, “Integration of Manufacturing Cost into
Structural Optimization of Composite Wings,” Chinese Journal of
Aeronautics, vol. 23, no. 6, pp. 670–676, Dec. 2010.
[65] L. P. Chao, M. V. Gandhi, and B. S. Thompson, “Design-for-manufacture
methodology for incorporating manufacturing uncertainties in the robust
design of fibrous laminated composite structures,” Journal of Composite
Materials, vol. 27, no. 2, pp. 175–194, 1993.
[66] H. Ning, G. M. Janowski, U. K. Vaidya, G. Husman, C. Ulven, S. Pillay,
and J. C. Serrano, “Design, manufacture and analysis of a thermoplastic-
matrix composite bus frame structure,” in International SAMPE
Symposium and Exhibition (Proceedings), 2006, vol. 51.

201
[67] H. Ning, U. Vaidya, G. M. Janowski, and G. Husman, “Design,
manufacture and analysis of a thermoplastic composite frame structure
for mass transit,” Composite Structures, vol. 80, no. 1, pp. 105–116,
2007.
[68] U. K. Vaidya, “Design and Manufacture of Woven Reinforced
Glass/Polypropylene Composites for Mass Transit Floor Structure,”
Journal of Composite Materials, vol. 38, no. 21, pp. 1949–1972, 2004.
[69] L. J. Hart-Smith, “Innovative concepts for the design and manufacture of
secondary composite aircraft structures,” in Proceedings of the 5th
Australian Aeronautical Conference. Part 1 (of 2), 1993.
[70] K. Reifsnider, J. McGrath, R. Davis, J. Lesko, and J. Loverich,
“Composite system design for manufacturing,” Technical Paper - Society
of Manufacturing Engineers, vol. 97, no. 117, p. X-6, 1997.
[71] B. J. C. Babu, R. T. Durai Prabhakaran, and V. P. Agrawal, “DFX Analysis
Applied to Composite Products,” Journal of Reinforced Plastics and
Composites, vol. 27, no. 3, pp. 287–312, Feb. 2008.
[72] K. O. Walls and R. J. Crawford, “The ‘design for manufacture’ of
continuous fibre-reinforced thermoplastic products in primary aircraft
structure,” Composites Manufacturing, vol. 6, no. 3–4, pp. 245–254, 1995.
[73] M. V. Gandhi, B. S. Thompson, and F. Fischer, “Manufacturing-process-
driven design methodologies for components fabricated in composite
materials,” Composites Manufacturing, vol. 1, no. 1, pp. 32–40, Mar.
1990.
[74] C. Marsden, R. Fews, P. Oldroyd, and A. Yousefpour, “Design for
Manufacturing – One-Piece, Fibre-Placed Composite Helicopter
Tailboom,” IOP Conference Series: Materials Science and Engineering,
vol. 26, no. 1, p. 12016, 2011.

202
[75] F. M. Swanstrom and T. Hawke, “Design For Manufacturing and
Assembly (DFMA): A case study in cost reduction for composite wingtip
structures,” in International SAMPE Technical Conference, 1999, vol. 31,
pp. 101–113.
[76] R. Srinivasan, H. M. Karandikar, and F. Mistree, “Understanding design-
manufacture interaction using compromise decision support problems—I.
A formulation for composite pressure vessels,” Computers & Structures,
vol. 40, no. 3, pp. 679–692, 1991.
[77] R. Srinivasan, H. M. Karandikar, and F. Mistree, “Understanding design-
manufacture interaction using compromise decision support problems—II.
Preliminary synthesis of composite pressure vessels,” Computers &
Structures, vol. 40, no. 3, pp. 693–703, 1991.
[78] R. Srinivasan, H. M. Karandikar, and F. Mistree, “Understanding design-
manufacture interaction using compromise decision support problems—
III. Design for manufacture of composite pressure vessels,” Computers &
Structures, vol. 40, no. 3, pp. 705–717, 1991.
[79] J. Cong and B. Zhang, “Methodology for Evaluating Manufacturability of
Composite Materials,” Applied Composite Materials, vol. 19, no. 3–4, pp.
189–201, Mar. 2011.
[80] K. . Edwards, “A risk-based approach to manufacturing process control:
use in autoclave moulded composite sandwich panels,” Materials &
Design, vol. 26, no. 8, pp. 690–699, 2005.
[81] J. Cong, B. Zhang, and J. Yu, A knowledge-based DFM advisor for
composite manufacturing process, vol. 433–440. 2012.
[82] J. Fan, Q. Wang, S.-F. Chen, M. M. F. Yuen, and C. C. Chan, “A Spring-
Mass Model-based Approach for Warping Cloth Patterns on 3D Objects,”
Journal of Visualization and Computer Animation, vol. 9, no. 4, pp. 215–
227, 1998.

203
[83] V. S. Sokolinsky, K. C. Indermuehle, and J. A. Hurtado, “Numerical
simulation of the crushing process of a corrugated composite plate,”
Composites Part A: Applied Science and Manufacturing, vol. 42, no. 9,
pp. 1119–1126, Sep. 2011.
[84] P. Potluri and J. Atkinson, “Automated manufacture of composites:
handling, measurement of properties and lay-up simulations,” Composites
Part A: Applied Science and Manufacturing, vol. 34, no. 6, pp. 493–501,
Jun. 2003.
[85] R. Sharma and J. X. Gao, “A knowledge-based manufacturing and cost
evaluation system for product design/re-design,” The International Journal
of Advanced Manufacturing Technology, vol. 33, no. 9–10, pp. 856–865,
Mar. 2006.
[86] W. J. C. Verhagen, P. Bermell-Garcia, R. E. C. van Dijk, and R. Curran,
“A critical review of Knowledge-Based Engineering: An identification of
research challenges,” Advanced Engineering Informatics, vol. 26, no. 1,
pp. 5–15, Jan. 2012.
[87] G. Dell’Anno, I. Partridge, D. Cartié, A. Hamlyn, E. Chehura, S. James,
and R. Tatam, “Automated manufacture of 3D reinforced aerospace
composite structures,” International Journal of Structural Integrity, vol. 3,
no. 1, pp. 22–40, Mar. 2012.
[88] J. Obradovic, S. Boria, and G. Belingardi, “Lightweight design and crash
analysis of composite frontal impact energy absorbing structures,”
Composite Structures, vol. 94, no. 2, pp. 423–430, Jan. 2012.
[89] M. Kaufmann, D. Zenkert, and C. Mattei, “Cost optimization of composite
aircraft structures including variable laminate qualities,” Composites
Science and Technology, vol. 68, no. 13, pp. 2748–2754, Oct. 2008.
[90] M. Arian Nik, K. Fayazbakhsh, D. Pasini, and L. Lessard, “Surrogate-
based multi-objective optimization of a composite laminate with curvilinear
fibers,” Composite Structures, vol. 94, no. 8, pp. 2306–2313, Jul. 2012.

204
[91] J. M. J. F. van Campen, C. Kassapoglou, and Z. Gürdal, “Generating
realistic laminate fiber angle distributions for optimal variable stiffness
laminates,” Composites Part B: Engineering, vol. 43, no. 2, pp. 354–360,
Mar. 2012.
[92] S. G. Hancock and K. D. Potter, “The use of kinematic drape modelling to
inform the hand lay-up of complex composite components using woven
reinforcements,” Composites Part A: Applied Science and Manufacturing,
vol. 37, no. 3, pp. 413–422, Mar. 2006.
[93] S. R. Hall, “Iterative preliminary design tools for composite structures,”
Composite Structures, vol. 16, no. 1–3, pp. 103–123, 1990.
[94] A. Y. C. Nee, S. K. Ong, G. Chryssolouris, and D. Mourtzis, “Augmented
reality applications in design and manufacturing,” CIRP Annals -
Manufacturing Technology, vol. 61, no. 2, pp. 657–679, 2012.
[95] S. Astwood, K. Krishnamurthy, and A. Tiwari, “A strategy to analyse
composite designs to improve automated production speeds,”
Proceedings of the Institution of Mechanical Engineers, Part B: Journal of
Engineering Manufacture, Special Issue Article, pp. 1–8, Jul. 2016.
[96] G. G. Lozano, A. Tiwari, C. Turner, and S. Astwood, “A review on design
for manufacture of variable stiffness composite laminates,” Proceedings
of the Institution of Mechanical Engineers, Part B: Journal of Engineering
Manufacture, vol. 220, no. 6, pp. 981–992, Sep. 2016.
[97] K. Forslund, T. Kero, and R. Söderberg, “Appearance FMEA -a method
for appearance quality evaluation of early design concepts,” in
Proceedings of the ASME 2009 International Design Engineering
Technical Conferences & Computers and Information in Engineering
Conference IDETC/CIE 2009, 2009, pp. 1–9.
205
[98] I. Michalakoudis, P. R. Childs, M. Aurisicchio, N. Pollpeter, and N.
Sambell, “Using functional analysis diagrams as a design tool,” in
Proceedings of the ASME 2014 International Mechanical Engineering
Congress and Exposition, 2014, pp. 1–10.
[99] D. Di Pasquale, C. Holden, T. Kipouros, and M. Savill, “An automatic
aerodynamic design process in an industrial Multi-Disciplinary context,” in
IACM – ECCOMAS 2014 ECFDVI, At Barcelona, Spain, 2014.
[100] L. Veldenz, M. Di Francesco, S. Astwood, G. Dell, B. Chul Kim, and K.
Potter, “Characteristics and processability of bindered dry fibre material
for automated fibre placement,” in ECCM17 - 17th European Conference
on Composite Materials, 2016, pp. 1–8.
[101] M. Di Francesco, L. Veldenz, G. Dell’Anno, and K. Potter, “Heater power
control for multi-material, variable speed Automated Fibre Placement,”
Composites Part A: Applied Science and Manufacturing, vol. 101, pp.
408–421, 2017.

206
APPENDICES
Appendix A Individual design steps evaluated using
FMEA method
The following design steps have been analysed using an FMEA method. The
design process flow from chapter 5 is used as it takes a low fidelity preliminary
concept for a composite laminate through to a design with sufficient fidelity to
begin manufacture using an AFP machine.
A.1 Check integrity of surface
Design Step: 1
Design Phase: Concept
Task Objective: Check integrity of surface
Task Description: Offset surface by 0.2mm
Design Objective: Successfully test surface integrity
Manufacturing Objective: Prove ply offsets will work in downstream processes
Failure Mode: Surface fails to offset
Effect(s) of Failure: Design cannot be progressed without surface repairs
Root Cause: Surface continuity inadequate, typically as a result of generating
surfaces from CFD data
Design Severity: High
Manufacturing Severity: High
Corrective Action: Reject surface, do not proceed

207
Figure A-1: Illustration of a typical gap between two surfaces
Figure A-2: Overlap of a surface, causing surface offset failure
208
A.2 Check integrity of surface
Design Step: 2
Design Phase: Concept
Task Objective: Check integrity of surface
Task Description: Apply extended ply boundary
Design Objective: Successfully test surface integrity
Manufacturing Objective: Check that surface doesn't have unplanned holes or
gaps
Failure Mode: More than one boundary generated
Effect(s) of Failure: Design cannot be progressed without surface repairs
Root Cause: Surface broken into multiple segments
Design Severity: High
Manufacturing Severity: High
Corrective Action: Fill surface, otherwise return and do not proceed. Extend
surface by at least 200mm tangentially
A.3 Position rosette on surface at suitable seed point
Design Step: 3
Design Phase: Concept
Task Objective: Position rosette on surface at suitable seed point
Task Description: Install rosette in model. Geodesic extend each orientation to
edge of surface
Design Objective: Ensure 0 degree and 45 degree axis are correctly orientated

209
Manufacturing Objective: See how far the fibre angle deviates when
geodesically extended
Failure Mode: Location of rosette and seed point cause geodesic fibre deviation
that exceeds specified limits
Effect(s) of Failure: Unable to deposit fibres on surface without introducing
unacceptable defects
Root Cause: Geodesic fibre paths form the ideal defect free trajectories, but are
diverted by complex geometries. If the seed point is poorly located, multiple
complex geometries cause compounded deviations.
Design Severity: Medium
Manufacturing Severity: High
Corrective Action: If deviation is too great, consider alternative seed point to
locate rosette if possible, otherwise return and do not proceed
Figure A-3: Producibility analysis used to check the location of the rosette and
seed point. Areas in red exceed the permitted angular deviation
210
A.4 Establish ply sequences
Design Step: 4
Design Phase: Sizing
Task Objective: Establish ply sequences
Task Description: Calculate ply sequence for each sized zone based on
thickness law and thickness
Design Objective: Convert Thickness Law and thickness into a balanced
stacking sequence (Minimum thickness)
Manufacturing Objective: Ensure manufacturing ply sequence rules are applied
(results in added thickness)
Failure Mode (A): More than 3 layers of the same orientation are sequenced
together
Effect(s) of Failure (A): Plies interlock and cause bridging or wrinkling upon
material de-bulking
Root Cause (A): Plies with same orientation interlock and prevent inter-ply shear
during cure or de-bulk
Failure Mode (B): 45 and 135 or 0 and 90 degree plies are not equal
Effect(s) of Failure (B): Laminate warps during cure
Root Cause (B): Un-balanced laminates cause residual stress. At least two
perpendicular orientations should be balanced
Design Severity: High
Manufacturing Severity: Low
Corrective Action: Add plies (thickness) to satisfy manufacturing constraint

211
A.5 Evaluate ply shapes
Design Step: 5
Design Phase: Sizing
Task Objective: Evaluate ply shapes
Task Description: Transpose stacking sequences into individual ply shape
maps
Design Objective: Create basic laminate definition to show which plies within a
zone are continuous to neighbouring zones
Manufacturing Objective: Increase ply continuity
Failure Mode: Ply continuity score unacceptable
Effect(s) of Failure: Sub-optimal manufacturing solution
Root Cause: Excessive tailoring of the stacking sequences leads to poor ply
continuity, as a result the deposition process is slowed down
Design Severity: High
Manufacturing Severity: High
Corrective Action: Re-sequence with alternative stacking sequences until ply
continuity is improved. If stacking sequences have been provided instead of
thickness laws, change sequence by maximum of 10% of thickness
A.6 Generate sizing evaluation score
Design Step: 6
Design Phase: Sizing
Task Objective: Generate sizing evaluation score
Task Description: Calculate the perimeter/area score for all ply shapes

212
Design Objective: Higher score indicates greater degree of continuous fibres in
the laminate
Manufacturing Objective: Higher score indicates faster manufacturing process
Failure Mode: Ply continuity score unacceptable
Effect(s) of Failure: Sub-optimal manufacturing solution
Root Cause: Excessive tailoring of the stacking sequences leads to poor ply
continuity, as a result the deposition process is slowed down
Design Severity: Low
Manufacturing Severity: Low
Corrective Action: Consider engineering stacking sequences to influence higher
score
A.7 Convert 2D sizing to 3D sizing
Design Step: 7
Design Phase: Sizing
Task Objective: Convert 2D sizing to 3D sizing
Task Description: Map sizing data onto surface - establish grid in CATIA’s eCPD
workbench
Design Objective: Grid must closely match zone defining features of the sizing
data
Manufacturing Objective: Zone boundaries should be clearly defined,
preferably using intersecting simple geometry like planes
Failure Mode (A): Grid construction not suitable for propagating ply boundary
support guides

213
Effect(s) of Failure (A): Without supports the ply boundaries cannot be
generated
Root Cause (A): Sub-standard geometry used to configure composites grid
elements. For example, planes can easily be offset to create a staggered ply
boundary, but complex geometry can sometimes not be offset using geodesic or
Euclidean functions
Failure Mode (B): Grid contains different number of cells to input array
Effect(s) of Failure (B): Ply definition does not load correctly
Root Cause (B): Transposition of 2D array to 3D grid does not match
Design Severity: Low
Manufacturing Severity: Low
Corrective Action: Grid integrity will not be tested until ply boundaries are
generated later in the design process
A.8 Configure ramps and clearance parameters
Design Step: 8
Design Phase: Detail Design
Task Objective: Configure ramps and clearance parameters
Task Description: Set ply boundary rules (ramping rates)
Design Objective: Set exclusion zones where ramping should not occur - such
as in interface areas
Manufacturing Objective: Restrict ramping rates as the angular changes cause
changes in fibre direction and can restrict machine access
Failure Mode (A): Ramp geometry too steep for deposition roller access
Effect(s) of Failure (A): Deposition machine cannot access ramped areas

214
Root Cause (A): Angle of ramp causes roller to bridge preventing adequate
consolidation of material
Failure Mode (B): Ply boundaries too close together
Effect(s) of Failure (B): Deposition slowed excessively to perform boundary cuts
and starts
Root Cause (B): Ply boundaries are sufficiently spaced in the grid until the
ramping rules move them
Failure Mode (C): Ply shapes fragmented
Effect(s) of Failure (C): Sub-optimal manufacturing solution
Root Cause (C): Excessive tailoring of the stacking sequences leads to poor ply
continuity, as a result the deposition process is slowed down
Design Severity: High
Manufacturing Severity: High
Corrective Action: Change clearance zone and ramp rates and re-compute
A.9 Add laminate attributes to model
Design Step: 9
Design Phase: Detail Design
Task Objective: Add laminate attributes to model
Task Description: Import/enter sizing data into the grid definition within eCPD
Design Objective: Represent sizing data with minimal changes
Manufacturing Objective: Ply coverage should be as continuous as possible
Failure Mode (A): Uncured ply thickness not representative

215
Effect(s) of Failure (A): Deposition NC program causes either poor consolidation
or collisions
Root Cause (A): The deposition program requires a revised surface to follow at
2mm layers in the laminate. If the revised surfaces are too low relative to the
programmed surface the roller does not consolidate the laminate, too high and
the machine may collide with the laminate
Failure Mode (B): Orientation nomenclature incorrect
Effect(s) of Failure (B): Ply orientations transposed incorrectly
Root Cause (B): CAD material catalogue doesn't match sizing data material
Design Severity: Low
Manufacturing Severity: Low
Corrective Action: Re-check grid definition if import is not successful
Figure A-4: Table of ply data including location in laminate, material, stagger and
orientation

216
A.10 Explode the laminate to illustrate individual ply coverage
Design Step: 10
Design Phase: Detail Design
Task Objective: Explode the laminate to illustrate individual ply coverage
Task Description: Visualise the initial stacking sequence by plies
Design Objective: Move non-connected plies to different layers in the laminate
where they improve continuity & move non-symmetry to centre of laminate
Manufacturing Objective: Fill gaps in the plies by moving material through the
stacking sequence, strive for maximum symmetry, better ply continuity
Failure Mode: Sizing transposition incorrect
Effect(s) of Failure: Sub-optimal manufacturing solution
Root Cause: Excessive tailoring of the stacking sequences leads to poor ply
continuity, as a result the deposition process is slowed down
Design Severity: Low
Manufacturing Severity: Low
Corrective Action: Pass design back to sizing if a symmetrical laminate cannot
be achieved
A.11 Outline initial ply contours
Design Step: 11
Design Phase: Detail Design
Task Objective: Outline initial ply contours
Task Description: Automatically generate ply boundaries
Design Objective: Establish how clearance and ramp rates affect ply boundaries

217
Manufacturing Objective: Join small gaps in plies that have arisen from
boundary conditions
Failure Mode (A): Ply boundaries too close together
Effect(s) of Failure (A): Deposition slowed excessively to perform boundary cuts
and starts
Root Cause (A): Ply boundaries are sufficiently spaced in the grid until the
ramping rules move them
Failure Mode (B): Unacceptable ply interleaving
Effect(s) of Failure (B): Poor interleaving in a ramp can cause delamination
Root Cause (B): Incorrect settings used for automatic ply generation
Design Severity: Medium
Manufacturing Severity: High
Corrective Action: If plies do not generate add ramp support fall back conditions,
then re-check grid definition for complex geometry
A.12 Revise initial ply contours
Design Step: 12
Design Phase: Design for Manufacture
Task Objective: Revise initial ply contours
Task Description: Regenerate ply boundaries after stacking data has been
updated
Design Objective: Capture any modifications to the stacking needed due to ply
boundary issues
Manufacturing Objective: Join small gaps in plies that have arisen from
boundary conditions

218
Failure Mode: Plies won't automatically generate
Effect(s) of Failure: Revision fails
Root Cause: Corruption of stacking data
Design Severity: Medium
Manufacturing Severity: Medium
Corrective Action: If plies do not generate add ramp support fall back conditions,
then re-check grid definition for complex geometry
A.13 Account for minimum cut length
Design Step: 13
Design Phase: Design for Manufacture
Task Objective: Account for minimum cut length
Task Description: Check minimum cut length for all ply boundaries
Design Objective: Add material and re-shape areas of the ply boundaries that
cannot be laid due to minimum course length
Manufacturing Objective: Ensure features that cannot be laid are removed
Failure Mode: Minimum cut length not achieved
Effect(s) of Failure: Unable to deposit fibres in key areas
Root Cause: Minimum cut length is required to feed material onto laminate. If the
design requires shorter fibres, they cannot be deposited
Design Severity: High
Manufacturing Severity: High
Corrective Action: If angle cut wizard fails, manually add minimum cut length
allowance to all affected ply boundaries

219
Figure A-5: Minimum cut length added to diagonal plies
Figure A-6: An internal pad-up (locally thicker area) changes shape to an
octagonal profile when minimum cut length is added. This may have been a
round or square patch in the original design
A.14 Account for short fibres
Design Step: 14
Design Phase: Design for Manufacture
Task Objective: Account for short fibres

220
Task Description: Check any areas where short fibres might delaminate due to
spring forces
Design Objective: Ensure additions are added to detail design model,
particularly if they are inside the trim allowance
Manufacturing Objective: Short tapes over radii may spring off the laminate and
need to be extended, sometimes this is not just in the trim allowance
Failure Mode: Short fibres not added in areas where tapes are in tension
Effect(s) of Failure: Fibres lift off laminate after deposition
Root Cause: The material's natural spring overcomes the adhesion over a short
length. Extending the length increases adhesion
Design Severity: Low
Manufacturing Severity: Medium
Corrective Action: Liaise with design - it may not be able to add extensions
without changing internal surface definitions and interfaces
A.15 Initiate guide curves
Design Step: 15
Design Phase: Design for Manufacture
Task Objective: Initiate guide curves
Task Description: Generate at least one guide curve per ply to base the machine
trajectory on
Design Objective: Make guide curve angle as close to the design rosette for that
ply
221
Manufacturing Objective: Follow a geodesic path to reduce defects in the
deposited material - although this may invoke steering to recover rosette fibre
angles
Failure Mode: Geodesic path exceeds material steering limit
Effect(s) of Failure: Material is deposited with defects
Root Cause: When steering radius is exceeded the material buckles and lifts
from the laminate causing a defect
Design Severity: High
Manufacturing Severity: High
Corrective Action: Feed fibre angular deviation and steering values back to
design so the stress model can be re-validated. In most cases, the design intent
cannot be manufactured
A.16 Generate trajectories
Design Step: 16
Design Phase: Design for Manufacture
Task Objective: Generate trajectories
Task Description: Apply a deposition strategy to create the tape courses for
each ply
Design Objective: Fill in the ply boundary with UD material
Manufacturing Objective: Generate coverage with acceptable gaps, overlaps,
steering and angular deviations
Failure Mode (A): Trajectories diverge
Effect(s) of Failure (A): Fibres part leaving a gap, sometimes needing to be filled
with an infill strip and convergence zones

222
Root Cause (A): Complex features cause geodesic fibre paths to be diverted
Failure Mode (B): Trajectories converge
Effect(s) of Failure (B): Fibres overlap or have to be terminated in a
convergence zone
Root Cause (B): Complex features cause geodesic fibre paths to be diverted
Design Severity: High
Manufacturing Severity: High
Corrective Action: Failure to generate adequate coverage will need a
convergence zone adding, a new ply boundary or a new geometrical surface -
liaise directly with design
A.17 Governance: Fibre angles
Design Step: 17
Design Phase: Design for Manufacture
Task Objective: Governance: Fibre angles
Task Description: Check angular deviation
Design Objective: Try to maintain transposed angles from the rosette
Manufacturing Objective: Steer to maintain geodesic path to reduce tape
defects
Failure Mode: Fibre angles exceed allowable tolerance
Effect(s) of Failure: Laminate has incorrect structural properties
Root Cause: Fibre trajectories diverge by angle greater than allowed
Design Severity: High
Manufacturing Severity: Low

223
Corrective Action: If fibre angle deviates too much from design intent revisit
geometry with designer to reduce geodesic impact
Figure A-7: Comparing a programmed trajectory to the design intent
A.18 Governance: Steering Radius
Design Step: 18
Design Phase: Design for Manufacture
Task Objective: Governance: Steering Radius
Task Description: Check radius of steering
Design Objective: Try to maintain transposed angles from the rosette
Manufacturing Objective: Steer fibre trajectories back to recover angular
deviation caused by geodesic effects, but do not exceed minimum radius
Failure Mode (A): Material steering limit exceeded
Effect(s) of Failure (A): Material is deposited with defects
Root Cause (A): When steering radius is exceeded the material buckles and lifts
from the laminate causing a defect
± 3°
Nom
inal
± 3°± 3°
Nom
inal
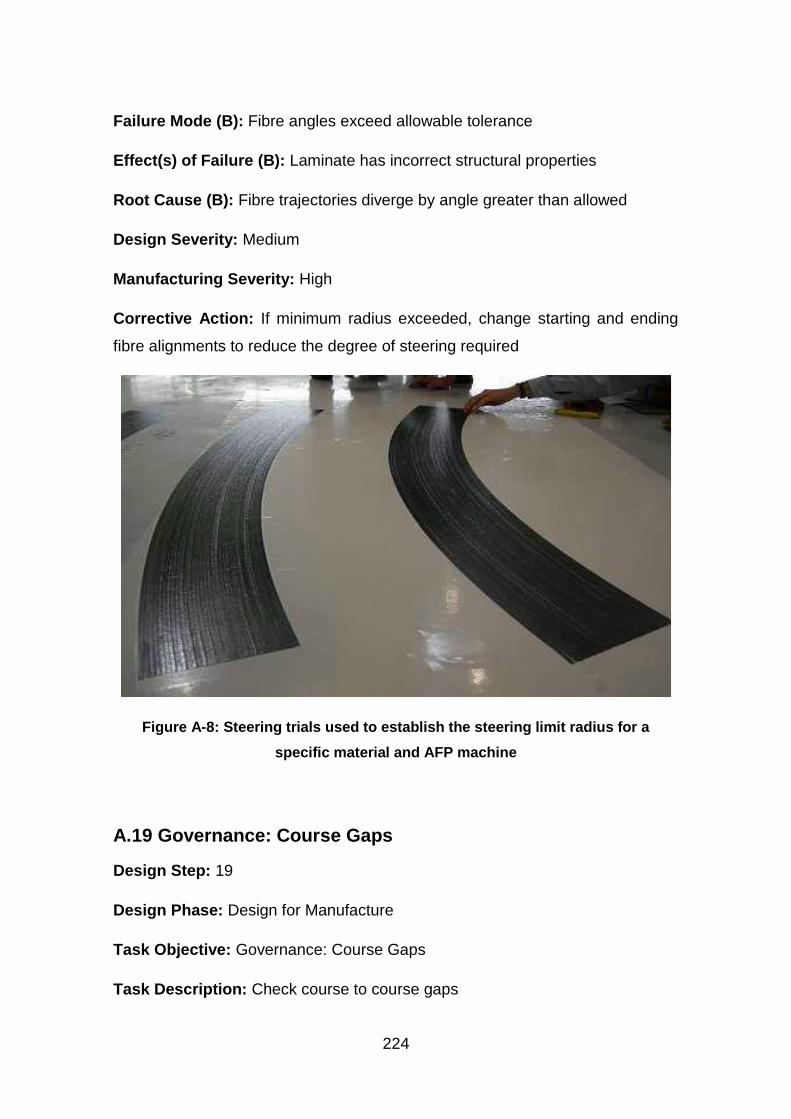
224
Failure Mode (B): Fibre angles exceed allowable tolerance
Effect(s) of Failure (B): Laminate has incorrect structural properties
Root Cause (B): Fibre trajectories diverge by angle greater than allowed
Design Severity: Medium
Manufacturing Severity: High
Corrective Action: If minimum radius exceeded, change starting and ending
fibre alignments to reduce the degree of steering required
Figure A-8: Steering trials used to establish the steering limit radius for a
specific material and AFP machine
A.19 Governance: Course Gaps
Design Step: 19
Design Phase: Design for Manufacture
Task Objective: Governance: Course Gaps
Task Description: Check course to course gaps
225
Design Objective: Try to keep individual gaps below 2mm, while not exceeding
a cumulative gap width of 25mm in a 1m width of ply coverage
Manufacturing Objective: Distribute gaps to assist with steering
Failure Mode (A): Cumulative gap width limit exceeded
Effect(s) of Failure (A): Laminate weakened with potential for fibre volume
fraction to be reduced
Root Cause (A): To cope with double curvature geometry, hybrid steering
introduces gaps to recover fibre angles
Failure Mode (B): Individual gap width limit exceeded
Effect(s) of Failure (B): Laminate weakened with potential for fibre volume
fraction to be reduced
Root Cause (B): Course to course gap combined with steering causes excessive
gaps
Design Severity: High
Manufacturing Severity: High
Corrective Action: Liaise with design or reduce course width by dropping tows
A.20 Governance: Tow Gaps
Design Step: 20
Design Phase: Design for Manufacture
Task Objective: Governance: Tow Gaps
Task Description: Check tow to tow gaps
Design Objective: Reduce gaps where possible

226
Manufacturing Objective: Ensure individual and cumulative gap widths do not
exceed design conditions
Failure Mode: Tow to tow gaps exceed limit
Effect(s) of Failure: Laminate weakened with potential for fibre volume fraction
to be reduced
Root Cause: Course to course gap combined with steering causes excessive
gaps
Design Severity: Medium
Manufacturing Severity: High
Corrective Action: Re-evaluate number of tows deposited and degree of
steering if gaps are excessive
Figure A-9: Manufacturing tolerance associated with AFP process causing tow-
gap defects

227
A.21 Governance: Overlaps
Design Step: 21
Design Phase: Design for Manufacture
Task Objective: Governance: Overlaps
Task Description: Check overlaps
Design Objective: Reduce overlap to design limits or lower
Manufacturing Objective: Try to avoid overlaps at all costs
Failure Mode: Overlaps exceed design limits
Effect(s) of Failure: Excess material thickness build up creates surface defects
Root Cause: Incorrect strategy for gaps and overlaps
Design Severity: High
Manufacturing Severity: High
Corrective Action: Overlaps will cause an increase in thickness and should be
avoided is possible, if not - highlight impact on top surface to design
Figure A-10: Three default options for terminating an AFP course when it is not
parallel or perpendicular to the ply boundary

228
A.22 Prevent alignment of gaps through laminate
Design Step: 22
Design Phase: Design for Manufacture
Task Objective: Prevent alignment of gaps through laminate
Task Description: Set stagger
Design Objective: Move the starting seed point of each ply so that they do not
line up through the laminate
Manufacturing Objective: Set seed point as close to centre of largest
geometrical feature, stagger from seed point
Failure Mode: Gaps or overlaps align through the z axis of the laminate
Effect(s) of Failure: Laminate weakened with potential for fibre volume fraction
to be reduced
Root Cause: Course to course gap combined with steering causes excessive
gaps
Design Severity: High
Manufacturing Severity: High
Corrective Action: Reiterate generation of coverage with new seed and stagger
points until coverage is acceptable

229
Figure A-11: Graphic representation of same ply orientation (red) being
staggered throughout the laminate
A.23 Establish convergence strategies
Design Step: 23
Design Phase: Design for Manufacture
Task Objective: Establish convergence strategies
Task Description: Set boundary and convergence parameters
Design Objective: Transition ply coverage using original rosette where possible
Manufacturing Objective: Sectorise the ply coverage to allow acceptable
convergence zones
Failure Mode: Fibre angles across component deviate from original rosette by
more than the design allowable
Effect(s) of Failure: Laminate has incorrect structural properties
Root Cause: Fibre trajectories diverge by angle greater than allowed

230
Design Severity: High
Manufacturing Severity: High
Corrective Action: Liaise with design about acceptable convergence strategies
A.24 Identify areas of high consolidation (dry fibre)
Design Step: 24
Design Phase: Design for Manufacture
Task Objective: Identify areas of high consolidation (dry fibre)
Task Description: Highlight the areas in a structure where poor permeability is
likely to occur
Design Objective: Maintain target fibre angles and a fibre volume fraction within
design limits
Manufacturing Objective: Steer to introduce gaps in and around areas of high
consolidation to allow resin to flow in areas of poor permeability
Failure Mode: Geometrical features over-consolidated
Effect(s) of Failure: For dry-fibre preforms, the feature permeability is too great
to enable resin infusion and the component cannot be infused and cured
Root Cause: The fibres are over-compacted leaving insufficient air content, or
permeability for the resin to flow through the preform
Design Severity: Low
Manufacturing Severity: High
Corrective Action: Poor permeability could cause a dry infusion, therefore more
radical mitigations may be required in discussion with design

231
A.25 Generate tape coverage
Design Step: 25
Design Phase: Design for Manufacture
Task Objective: Create custom guide curves
Task Description: Create curves for steering and sectorisation if required
Design Objective: Align angle of curves to fibre angles in sizing
Manufacturing Objective: Control steering and gaps using a design controlled
geometry
Failure Mode: Generated trajectories do not match fibre angles in sizing within
acceptable tolerances
Effect(s) of Failure: Laminate has incorrect structural properties
Root Cause: Fibre trajectories diverge by angle greater than allowed
Design Severity: Medium
Manufacturing Severity: High
Corrective Action: Liaise with design if guide curves exceed angular deviation
limits to have geometry changed accordingly
A.26 Check tape coverage in simulation
Design Step: 26
Design Phase: Design for Manufacture
Task Objective: Generate tape coverage
Task Description: Build ply coverage using guide curves for sectorisation and
guides for each ply
Design Objective: None
232
Manufacturing Objective: Generate coverage with acceptable gaps, overlaps,
steering and angular deviations
Failure Mode: None identified
Effect(s) of Failure: None identified
Root Cause: None identified
Design Severity: Low
Manufacturing Severity: Low
Corrective Action: Reiterate with different coverage parameters if results are
not acceptable
A.27 Check simulation of tape coverage
Design Step: 27
Design Phase: Design for Manufacture
Task Objective: Check tape coverage in simulation
Task Description: Simulate the deposition of the tapes, adjusting for machine
reach and component location where required
Design Objective: None
Manufacturing Objective: Check geometry and positioning of component is
acceptable for AFP machine access
Failure Mode: Geometry prevents access of AFP head
Effect(s) of Failure: Material is deposited with defects (bridging) or the machine
collides with laminate
Root Cause: Deposition machine cannot access the deposition surface

233
Design Severity: Low
Manufacturing Severity: High
Corrective Action: Re-position component in AFP cell or liaise with design to
change geometry
A.28 Calibrate tool location
Design Step: 28
Design Phase: Design for Manufacture
Task Objective: Calibrate tool location
Task Description: Probe the location of the physical tool and re-run simulation
Design Objective: None
Manufacturing Objective: Position tool and re-check program as the reach of
the machine will be slightly different from validation simulation
Failure Mode: AFP machine cannot reach component when positioned in real
world
Effect(s) of Failure: When tool is positioned and program updated to account for
real world environment, machine cannot reach/access component
Root Cause: Offline program assumes ideal position of tool. It is possible to
position tool outside of machine reach for components close to the limits of the
machine envelope
Design Severity: Low
Manufacturing Severity: Medium
Corrective Action: Physically reposition tool or change programming
parameters for machine deposition strategy

234
Figure A-12: Simulation testing reach of AFP machine for virtual tool. The
program generated will only work if the AFP machine can reach the tool when it
is datumed in the cell in real-world.