design and simulation of a fast-charging …digitool.library.mcgill.ca/thesisfile103758.pdf ·...
TRANSCRIPT
DESIGN AND SIMULATION OF A FAST-CHARGING
STATION FOR PLUG-IN HYBRID ELECTRIC
VEHICLE (PHEV) BATTERIES
by
Makram de Freige
A thesis submitted to the Department of Electrical and Computer
Engineering in partial fulfillment of the requirements of the degree of
Master in Engineering
Department of Electrical and Computer Engineering,
McGill University,
Montréal, Québec, Canada
February 2011
© Makram de Freige, 2011

i
ABSTRACT
With the increasing interest in green technologies in transportation, plug-in hybrid electric
vehicles (PHEV) have proven to be the best short-term solution to minimize greenhouse gas
emissions. Despite such interest, conventional vehicle drivers are still reluctant in using such a
new technology, mainly because of the long duration (4-8 hours) required to charge PHEV
batteries with the currently existing Level I and II chargers. For this reason, Level III fast-
charging stations capable of reducing the charging duration to 10-15 minutes are being
considered. The present thesis focuses on the design of a fast-charging station that uses, in
addition to the electrical grid, two stationary energy storage devices: a flywheel energy storage
and a supercapacitor. The power electronic converters used for the interface of the energy
sources with the charging station are designed. The design also focuses on the energy
management that will minimize the PHEV battery charging duration as well as the duration
required to recharge the energy storage devices. For this reason, an algorithm that minimizes
durations along with its mathematical formulation is proposed, and its application in fast
charging environment will be illustrated by means of two scenarios.

ii
RÉSUMÉ
Depuis le développement de l’intérêt porté aux technologies propres appliquées au domaine de
l’automobile et du transport, les véhicules hybrides et électriques rechargeables (VHER) sont
reconnus comme le meilleur compromis qui diminuerait les émissions de gaz a effet de serre.
Malgré ce progrès pour l’environnement, la plupart des usagers de véhicules conventionnels
refusent de s’adapter à cette nouvelle technologie a cause du long temps requis (4 à 8 heures)
pour recharger les batteries des VHERs si les chargeurs de Niveau I et II existants sont utilisés.
Pour cette raison, les stations de recharge rapide de Niveau III sont largement considérées. La
présente thèse propose une station qui emploi comme sources d’énergie le réseau électrique ainsi
que deux sources de stockage d’énergie : une roue d’inertie et un supercondensateur. Les
convertisseurs qui permettent l’interface de ces sources avec le chargeur sont également conçus
et dimensionnés en énergie. Afin d’optimiser le temps requis pour recharger la batterie du VHER
ainsi que le temps requis pour recharger les sources de stockage, un algorithme est proposé avec
son application à la technologie de recharge rapide. Deux différents scenarios sont mis en œuvre
pour illustrer l’efficacité de cet algorithme.

iii
ACKNOWLEDGEMENTS
I would like to thank Prof. Géza Joós, for his help, and patience during my Master degree.
Through his guidance, I have drastically improved my leadership skills and gained a better idea
on engineering principles and industry needs.
I would like to extend my thanks to Prof. Maxime Dubois from Laval University who leaded the
project Infrastructure for Wide Market Adoption of PHEVs in which I was involved.
I wish to acknowledge the financial support provided by the National Science and Engineering
Research Council (NSERC) and thank Auto21 Network of Centers of Excellence (NCE) that
gave me many unique opportunities to practice and drastically improve my public speaking skills
by delivering the results of my work in front large technical and non-technical audiences during
organized contests that occurred during the following conferences and exhibitions: Canadian
Manufacturers and Exporters (CME) Future of Manufacturing in Ottawa and Sustainable
Manufacturing in Mississauga in February and November 2010 respectively, the Automotive
Producers and Manufacturers Association (APMA) Summits in Windsor and Ottawa in June
2010 and May 2011 respectively.
Finally I would like to thank my lab colleagues: Michael Ross, Hamed Golestani Far, Aboutaleb
Haddadi, Ali Jahanbani Ardakani, Samer El Itani, David Zhuang, Mike Georges, Ali Shojaei,
and Moataz Ammar, who all gave me feedback on my work through my research, and helped in
the beginning to get familiar with Matlab and Simulink.

iv
TABLE OF CONTENTS
ABSTRACT ............................................................................................................................ i
RÉSUMÉ .................................................................................................................................. ii
ACKNOWLEDGEMENTS ......................................................................................... iii
TABLE OF CONTENTS .............................................................................................. iv
LIST OF FIGURES ........................................................................................................ viii
LIST OF TABLES ............................................................................................................ ix
Chapter 1: Introduction ................................................................................................. 1
1.1 Background ............................................................................................................................... 1
1.1.1 PHEV Definition .............................................................................................................. 1
1.1.2 PHEV Charging Equipment ............................................................................................. 1
1.1.3 History of Fast Charging .................................................................................................. 2
1.2 Literature Review...................................................................................................................... 3
1.2.1 The Level III Charger ...................................................................................................... 3
1.2.2 Existing PHEVs ............................................................................................................... 3
1.2.3 Fast Charging Outcomes .................................................................................................. 4
1.2.4 Conventional Charging Schemes ..................................................................................... 4
1.2.5 Power Electronics Systems .............................................................................................. 5
1.2.6 Thermal Management in Battery Fast Charging .............................................................. 6
1.2.7 Additional Charger Applications ..................................................................................... 6
1.2.8 Impacts of PHEV Deployment on the Grid ..................................................................... 8
1.2.9 PHEV Batteries .............................................................................................................. 15
1.2.10 Stationary Storage Devices .......................................................................................... 16
1.3 Problem Statement .................................................................................................................. 21
1.4 Contributions........................................................................................................................... 21
1.5 Thesis Outline ......................................................................................................................... 22
v
Chapter 2: Charging Station Basic Configuration ............................. 23
2.1 Grid Power Limitation ............................................................................................................ 23
2.2 Station Energy Sources Quantification ................................................................................... 24
2.3 Station Storage Devices Choice .............................................................................................. 25
2.3.1 Performance Requirements ............................................................................................ 25
2.3.2 Storage Devices Choice ................................................................................................. 26
Chapter 3: Power Electronic Interfaces ............................................................. 28
3.1 Static Power Switches ............................................................................................................. 28
3.1.1 Existing Technologies .................................................................................................... 28
3.1.2 Chosen Technology ....................................................................................................... 28
3.2 Grid Side Converter ................................................................................................................ 29
3.2.1 Converter Design ........................................................................................................... 29
3.2.2 Electrical Specifications ................................................................................................. 30
3.3 FES Converter ......................................................................................................................... 31
3.3.1 Converter Design ........................................................................................................... 31
3.3.2 Electrical Specifications ................................................................................................. 31
3.3.3 FES Design Parameters.................................................................................................. 32
3.4 Supercapacitor Converter ........................................................................................................ 33
3.4.1 Converter Design ........................................................................................................... 34
3.4.2 Supercapacitor Design Parameters ................................................................................ 34
3.4.3 Electrical Specifications ................................................................................................. 35
3.5 Output Converter .................................................................................................................... 36
3.5.1 Converter Design ........................................................................................................... 36
3.5.2 Electrical Specifications ................................................................................................. 36
3.6 Complete Power Circuit .......................................................................................................... 37
3.6.1 Circuit Design ................................................................................................................ 37
3.6.2 Electrical Specifications ................................................................................................. 37
vi
Chapter 4: Charging Station Control Circuit ................................................ 39
4.1 Converters Individual Controls ............................................................................................... 39
4.1.1 Grid Converter Control .................................................................................................. 39
4.1.2 FES Control ................................................................................................................... 40
4.1.3 Supercapacitor Converter Control ................................................................................. 42
4.1.4 Output Converter Control .............................................................................................. 43
4.2 Control Circuit Design ............................................................................................................ 44
4.2.1 Charging Station Central Control .................................................................................. 44
4.2.2 Central Control Algorithm ............................................................................................. 44
Chapter 5: Charging Station Operation ............................................................ 46
5.1 Charging Time Minimization ................................................................................................. 46
5.1.1 Charging Station Cycle .................................................................................................. 46
5.1.2 Problem Formulation ..................................................................................................... 47
5.1.3 Problem Summary ......................................................................................................... 49
5.2 Charging Station Operation .................................................................................................... 50
5.2.1 Charging of a Single PHEV Battery .............................................................................. 50
5.2.2 Charging of Two Consecutive PHEV Batteries............................................................. 52
Chapter 6: Conclusion ................................................................................................... 56
6.1 Summary ................................................................................................................................. 56
6.2 Conclusions ............................................................................................................................. 56
6.3 Recommendations for Future Work........................................................................................ 57
REFERENCES ................................................................................................................... 58
vii
LIST OF FIGURES
Figure 1.1. Grid Side Converter ...................................................................................................... 7
Figure 1.2. Control Scheme for V2G Mode ................................................................................... 7
Figure 1.3. Control Scheme for Charging Mode ............................................................................ 8
Figure 1.4. Nonlinear Load Characteristics .................................................................................... 9
Figure 1.5. Typical Load Current Spectrum ................................................................................. 10
Figure 1.6. Three-Phase Power System for Voltage Stability Analysis ....................................... 10
Figure 1.7. System Impact Analysis Framework .......................................................................... 12
Figure 1.8. The Stochastic Approach ............................................................................................ 13
Figure 1.9A. Transformer Yearly Aging ...................................................................................... 13
Figure 1.9B. Transformer Hot Spot Temperatures ....................................................................... 14
Figure 1.10. Number of Elements for Which Normal Rating Exceeded ...................................... 14
Figure 1.11. Impact of DOD and Temperature on Battery Cycles ............................................... 16
Figure 1.12. The Four FES Components ...................................................................................... 18
Figure 1.13. A Typical Supercapacitor ......................................................................................... 19
Figure 2.1. Charging Station Basic Design ................................................................................... 27
Figure 3.1. Grid Side Converter .................................................................................................... 30
Figure 3.2. Supercapacitor Bidirectional Chopper ....................................................................... 34
Figure 3.3. Charging Station Power Circuit.................................................................................. 38
Figure 4.1. Grid Converter Control............................................................................................... 39
Figure 4.2. Flywheel Emulation Using a PMDC .......................................................................... 40
Figure 4.3. Flywheel Charge and Discharge Control ................................................................... 42
Figure 4.4. Supercapacitor Converter Control .............................................................................. 42
Figure 4.5. Charging Station Output Converter Control............................................................... 43
Figure 4.6. Charging Station Cycle............................................................................................... 44
Figure 4.7. Central Control Algorithm ......................................................................................... 45
Figure 5.1. Detailed Charging Station Cycle ................................................................................ 47
Figure 5.2. PHEV Battery Characteristics Evolution ................................................................... 51
Figure 5.3. Charger Characteristics Evolution during the Full Cycle........................................... 52
Figure 5.4. Batteries 1 and 2 Characteristics Evolution during the Charging Process ................. 54
Figure 5.5. Charger Characteristics during the Two Cycles ......................................................... 55
viii
LIST OF TABLES
Table 1.1. PHEV Charging Modes Characteristics ........................................................................ 2
Table 1.2. Main Power Electronics Converters .............................................................................. 5
Table 1.3. Battery Technical Specifications ................................................................................. 15
Table 2.1. Nominal Voltage and Energy for PHEV/EV Batteries ................................................ 23
Table 2.2. Maximum PHEV Battery Charging Duration ............................................................. 23
Table 2.3. PHEV Charging Station Energy Management ............................................................ 25
Table 2.4. Classification by Criterion ........................................................................................... 26
Table 3.1. Main Controllable Switches Comparison .................................................................... 28
Table 3.2. Grid Converter Electrical Specifications ..................................................................... 31
Table 3.3. FES Converter Electrical Specifications...................................................................... 32
Table 3.4. FES Options (for EFES, in = 5.69 kWh) ......................................................................... 33
Table 3.5. Flywheel Parameters (for EFES, in = 5.69 kWh) ............................................................ 33
Table 3.6. Supercapacitor Options (for EScap, in = 1.25 kWh) ....................................................... 35
Table 3.7. Supercapacitor Converter Electrical Specifications .................................................... 36
Table 3.8. Charging Station Output Converter Electrical Specifications ..................................... 37
Table 3.9. Charging Station Electrical Specifications .................................................................. 37
Table 4.1. Figure 4.7 Abbreviations ............................................................................................. 45
Table 5.1. Optimization Parameters .............................................................................................. 48
Table 5.2. PHEV Battery Specifications....................................................................................... 51
Table 5.3. Charger Energy Management for the PHEV Battery .................................................. 51
Table 5.4. PHEV Batteries Specifications .................................................................................... 53
Table 5.5A. Charger Energy Management for Battery 1 .............................................................. 53
Table 5.5B. Charger Energy Management for Battery 2 .............................................................. 53
Chapter 1: Introduction
1
CHAPTER 1 Introduction
This chapter gives a background of the thesis topic: Design and Simulation of a Fast Charging
Station for PHEV Batteries then summarizes the work that has been conducted previously in the
area of fast charging technology. The problem is then explained and the thesis outline is
provided.
1.1 Background
This section defines what a PHEV is and describes briefly the equipment involved to charge it.
1.1.1 PHEV Definition
A Plug-in-Hybrid Electric Vehicle (PHEV) is a hybrid automobile with a higher-capacity battery
that can be recharged by connecting the vehicle to the electrical network [1]. When the battery is
below 20% capacity, a conventional combustion engine takes over and offers to the driver the
same autonomy as a conventional vehicle. The PHEV has been recognized as the best short-term,
economically viable opportunity for significantly reducing oil dependency and CO2 emissions
without altering motorists’ driving behavior [1]. Consequently, nearly all major car makers have
invested significant resources in PHEV development, and Toyota and GM delivered their first
PHEVs (in small numbers) in 2010.
1.1.2 PHEV Charging Equipment
A very important impact concerns the development of the charging equipment for the market
integration and daily use of PHEVs. It is essential that this equipment has the ability to:
Quickly charge the car battery
Modulate the electricity prices with the time of day
Detect the state of charge (SOC) of the car battery
Automatically bill for the electricity delivered
Adapt to various battery types and car models

Chapter 1: Introduction
2
The most critical problem in charging PHEV batteries involves the car owner and public safety.
Indeed the cords connecting house plugs or road stations to vehicles could cause electrical
hazards. For this reason, vehicle supply equipments have been conceived in order to avoid such
problems, and they consist of the three following devices [2]:
Supply Device: Main component of the charging station, it draws power and provides
shock protection.
Power Cord: It is a cable that contains electrical current and communication signals from
the charging device to the connector.
Connector: It is simply a plug on the power cord that links the supply equipment to the
PHEV charging socket.
The Society of Automotive Engineering (SAE) has been working on the J1772 standard that
classifies PHEV charging stations into the five categories, listed in Table 1.1 below [2, 3].
Table 1.1. PHEV Charging Modes Characteristics [2, 3]
Type Location Power Level (kW) Charging Duration
Level 1: 120 VAC On-board 1.2 – 2.0 18 hours
Level 2 (low): 208 – 240 VAC On-board 2.8 – 3.8 8 hours
Level 2 (high): 208 – 240 VAC On-board 6 – 15 4 hours
Level 3: 208 – 240 VAC Off-board > 15 - 96 20 – 50 min
Level 3: DC Charging: 600 VDC Off-board > 15 - 240 20 – 50 min
1.1.3 History of Fast Charging
The importance of a network of charging stations is already established as a critical part of the
PHEV and electric vehicle (EV) technologies. In the future, charging stations may play the same
role as gasoline stations today. In Israel (2011), Denmark (2011), Australia (2012) and Portugal,
governments have already set targets in place for a large penetration of charging stations in the
urban environment [4], [5]. US Company Better Place is a leader in this field and plans to install
hundreds of thousands of Level I and Level II AC charging stations in these countries. General
Motors plans to release the Chevy Volt EV in 2011, with a battery capacity of 16 kWh and a
Level I, on-board charger of power 3.3 kW [6].
There is currently a lack of fast-charging units. As an alternative, urban facilities have been
proposed where the discharged car batteries would be swapped with charged battery packs.

Chapter 1: Introduction
3
However, at the recently held Alternative Fuels and Vehicles conference, a panel of
representatives from some American electric car makers suggested that they would prefer fast
charging stations to the battery swapping scenario. The impact of fast charging on battery
degradation is a critical parameter that needs to be taken into account [7].
1.2 Literature Review
The current section summarizes previous works that have been conducted concerning the
charging and fast charging stations, and all areas that are closely related to them.
1.2.1 The Level III Charger
Among the three classes of charging stations, the Level III is the most interesting and practical
one for installations in public places like commercial areas since it enables an easier integration
of PHEVs and EVs into the market. For this reason, many developed countries are planning on
using Level III, off‐board quick chargers, especially in Western Europe [8]. In Japan, the Tokyo
Electrical Power Company has announced the installation of 200 10‐minute high power chargers
for 2010, which will coincide with the introduction of the Mitsubishi i‐Miev EV, which is
already advertized with a quick‐charge DC plug [9]. This is the result of a structural
characteristic of Tokyo, where drivers do not have access to a plug at their homes to charge their
cars.
1.2.2 Existing PHEVs
Some American companies have already built prototypes of such fast charging stations: a
prototype that boasts an expected 10 min charge time has been launched during the third quarter
of 2010 [10], and the LSV-100 Zip prototype that can charge in less than 30 min [11]. In Europe
in January 2010, Renault-Nissan announced its success in the development of a fast-charging
station that is capable of replenishing 80% of an EV car battery in less than 30 min [12].
Chapter 1: Introduction
4
1.2.3 Fast Charging Outcomes
Besides charging a battery car to 80% of its SOC in typically 15 minutes [13], fast charging also
decreases operating costs and increases productivity in two ways [14]:
Fast chargers are known to be more efficient than conventional chargers, and charging
with less overcharging increases the battery efficiency.
Fast charging technology increases the vehicle speed.
The main issues in fast charging reside in the four main failure mechanisms of industrial lead
acid batteries [14]:
Positive Active Material (PAM) Shedding
Corrosion of the positive plate grid
Imbalance among battery cells
Suffocation of negative plate
1.2.4 Conventional Charging Schemes
In a bidirectional battery charger, charging can be accomplished in two ways [15]:
In constant current/constant voltage mode, the battery is first charged in constant current
mode to 70% SOC then it is charged in constant voltage mode.
In order to implement fast charging, several algorithms and methods have been found,
and among them is a fully digitized smart method involving a combination of high continuous
constant charging current and some charging pulse current. Such techniques consider the actual
charge state of the battery and the battery previous charges and discharges [16]. However, the
method that has revealed as being the most practical one and as having the best efficiency and
the shortest charging time is the pulse-charged method. It basically consists of creating a large-
time charging pulse that is immediately followed by a very short-time discharging pulse,
followed then by a “waiting period” [16].
Chapter 1: Introduction
5
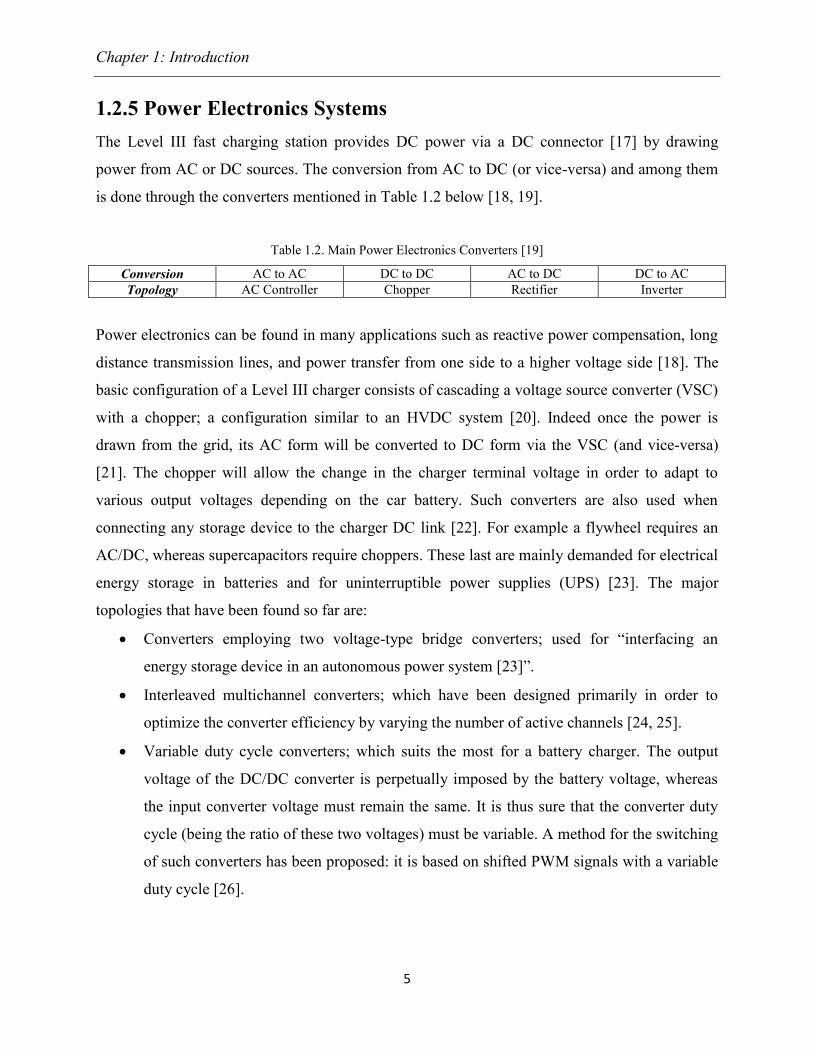
1.2.5 Power Electronics Systems
The Level III fast charging station provides DC power via a DC connector [17] by drawing
power from AC or DC sources. The conversion from AC to DC (or vice-versa) and among them
is done through the converters mentioned in Table 1.2 below [18, 19].
Table 1.2. Main Power Electronics Converters [19]
Conversion AC to AC DC to DC AC to DC DC to AC
Topology AC Controller Chopper Rectifier Inverter
Power electronics can be found in many applications such as reactive power compensation, long
distance transmission lines, and power transfer from one side to a higher voltage side [18]. The
basic configuration of a Level III charger consists of cascading a voltage source converter (VSC)
with a chopper; a configuration similar to an HVDC system [20]. Indeed once the power is
drawn from the grid, its AC form will be converted to DC form via the VSC (and vice-versa)
[21]. The chopper will allow the change in the charger terminal voltage in order to adapt to
various output voltages depending on the car battery. Such converters are also used when
connecting any storage device to the charger DC link [22]. For example a flywheel requires an
AC/DC, whereas supercapacitors require choppers. These last are mainly demanded for electrical
energy storage in batteries and for uninterruptible power supplies (UPS) [23]. The major
topologies that have been found so far are:
Converters employing two voltage-type bridge converters; used for “interfacing an
energy storage device in an autonomous power system [23]”.
Interleaved multichannel converters; which have been designed primarily in order to
optimize the converter efficiency by varying the number of active channels [24, 25].
Variable duty cycle converters; which suits the most for a battery charger. The output
voltage of the DC/DC converter is perpetually imposed by the battery voltage, whereas
the input converter voltage must remain the same. It is thus sure that the converter duty
cycle (being the ratio of these two voltages) must be variable. A method for the switching
of such converters has been proposed: it is based on shifted PWM signals with a variable
duty cycle [26].
Chapter 1: Introduction
6
1.2.6 Thermal Management in Battery Fast-Charging
When being quickly charged, vehicle batteries are subject to temperature elevation because of
the resistive (Ohmic) losses and the electrochemical reactions that occur during both the battery
charging and discharging processes [27].
The use of Thermoelectric Generators (TEG) has been proposed in order to accelerate the
cooling process in batteries in order to increase the battery life and use it in the automotive
sector. Such coolers can be placed either between the two terminals of a cell pair or a plate pair
[27]. An algorithm has been proposed for power-flow management where all the energy storage
devices must be charged up to their respective specified SOC before the whole system runs [28].
Also a hybrid PWM method has been proposed in order to reduce the temperature rise in
converters, without increasing considerably the switching losses. In such methods half of the
total number of switches is switched at high frequency (in the order of tens of kHz) whereas the
other half is switched at the system frequency (50 or 60 Hz). Such methods have proven to be
very successful [29].
1.2.7 Additional Charger Applications
A bidirectional charger is also capable of achieving two supplementary functions: vehicle to gird
(V2G) and vehicle to home (V2H); both of which are main topics of research in the PHEV’s
integration within the power grid. V2G corresponds to connecting the PHEV to the grid and then
using the power of the car battery in order to meet the grid demand [30], while V2H corresponds
to connecting the PHEV to the home electrical circuit in order to meet the home electrical
demand [30]. While the V2G impact on the grid stability will be seen in the next section, the
V2H impact will not be studied in this thesis.

Chapter 1: Introduction
7
LA LBLN
VN
Vdc
Cdc
L
L
C f
C f
LA
LB
LAB
VAB
Load
Figure 1.1. Grid-side Converter [Based on 30]
Control schemes have been implemented for the grid-side converter of a single AC source
charger modeled in Figure 1.1, in three modes of operations: Charging mode, V2G mode, and
V2H mode [30].
In the structure of Figure 1.2, showing a control scheme for V2G mode, Gc(s) is the
compensator and Gf(s) is the feed-forward loop compensator [30]. Unlike the MPPT function in
wind applications or PV, which tries to draw the maximum power from the sources, V2G
function considers the battery pack health. For this reason, the reference current magnitude iL* is
generated by the grid real power command instead of the DC voltage loop [30]. The phase
information is obtained via a PLL.
∑1
1
x
1
1
∑1 1
1
1 ∑ ∑1 1
1
1
1
1
PLL
Real
power
)(sGC
)(sGf
Vdc
)(5.0 sC f
L S2
1
r L2
+ +
+
+ +
+
- -
-
i_L*
i_L
i_f
i_c
θ
i_L
1
V AB
Figure 1.2. Control Scheme for V2G Mode [Based on 30]

Chapter 1: Introduction
8
The structure of Figure 1.3 that displays a control scheme for the charging mode is
designed with an inner current loop and an outer voltage loop [30]. Also a PI controller is added
in order to generate with the phase (via the PLL) the reference current magnitude [30].
∑ )(sGPI)(sGC Vdc
sC f
sL
1
r L
i_c
i_f
θ
V AB
)1(*
*
sCRVRV
dcLoadAB
LoadAB
x ∑ ∑ ∑1 1 1 1 1
1
1 1 1
1
1
1
PLL
1 11
1
+ + +1
++
- -
-
-
V dc
*i_L*
i_L
i_L
Vdc
Figure 1.3. Control Scheme for Charging Mode [Based on 30]
In the two previous modes of operation, two major kinds of harmonic pollution appeared
[31]: The first one is caused from the fact that the phase voltage reference was taken directly
from the grid voltage, which caused the apparition of harmonics arising from the grid due to the
phase reference of the input current. Thus, the harmonic pollution played a role in the reference
in the current loop, which is undesirable [31]. The second one is the 2nd
order harmonic on the
DC bus voltage. For this reason the control methods of [30] have been improved by adding to the
previous structures an internal voltage reference and a 2nd
order notch filter in order to attenuate
such sources of pollution [31].
1.2.8 Impacts of PHEV Deployment on the Grid
The current section summarizes the challenges faced with PHEV penetration to the grid as well
as the offered ancillary services.
1.2.8.1 Challenges
When PHEVs are not connected to the grid during off-peak load periods they may have
significant effects on the power system network. Indeed a new peak demand period will be faced
causing utilities to get stressed [32, 33]. Furthermore there will be excessive reactive power
Chapter 1: Introduction
9
injections [34, 35] and harmonics causing troubles such as burning capacitors or reactors located
at some substations [32]. Current harmonics injection will also have a bad impact on the power
quality of distribution systems [36]. A new infrastructure including transformers and power
distribution lines will thus be necessary [37].
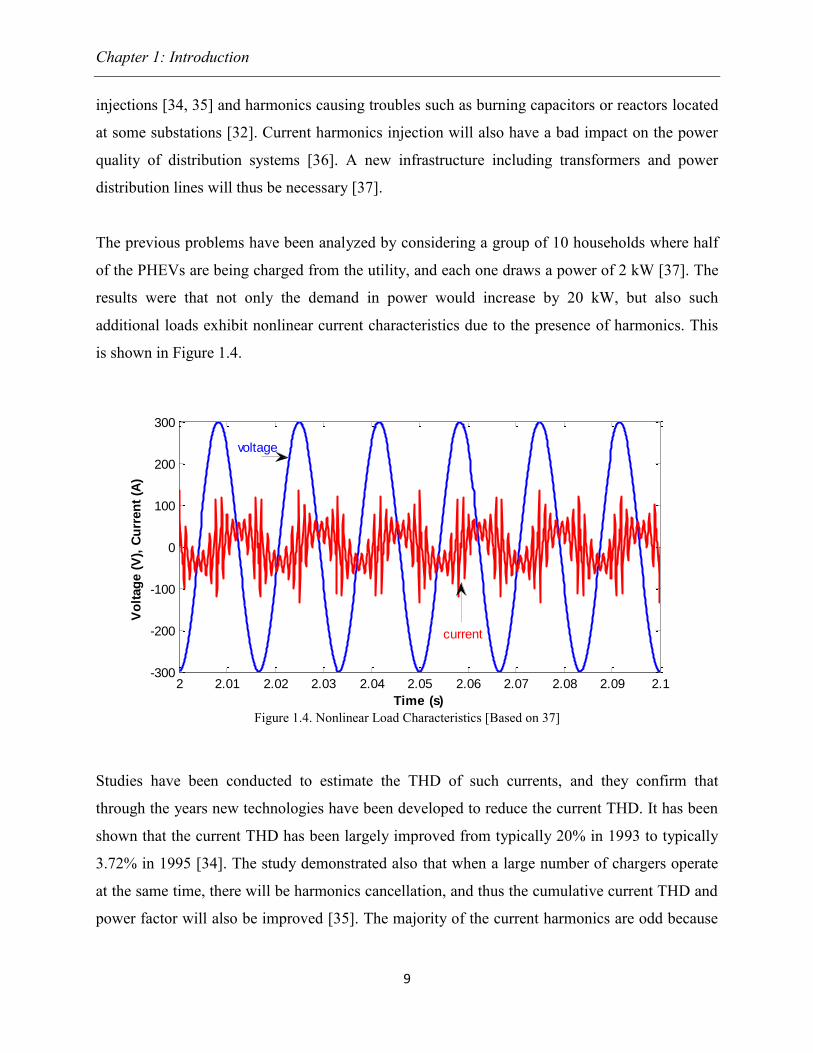
The previous problems have been analyzed by considering a group of 10 households where half
of the PHEVs are being charged from the utility, and each one draws a power of 2 kW [37]. The
results were that not only the demand in power would increase by 20 kW, but also such
additional loads exhibit nonlinear current characteristics due to the presence of harmonics. This
is shown in Figure 1.4.
Figure 1.4. Nonlinear Load Characteristics [Based on 37]
Studies have been conducted to estimate the THD of such currents, and they confirm that
through the years new technologies have been developed to reduce the current THD. It has been
shown that the current THD has been largely improved from typically 20% in 1993 to typically
3.72% in 1995 [34]. The study demonstrated also that when a large number of chargers operate
at the same time, there will be harmonics cancellation, and thus the cumulative current THD and
power factor will also be improved [35]. The majority of the current harmonics are odd because
2 2.01 2.02 2.03 2.04 2.05 2.06 2.07 2.08 2.09 2.1-300
-200
-100
0
100
200
300
Time (s)
Vo
ltag
e (
V),
Cu
rren
t (A
)
voltage
current
Chapter 1: Introduction
10
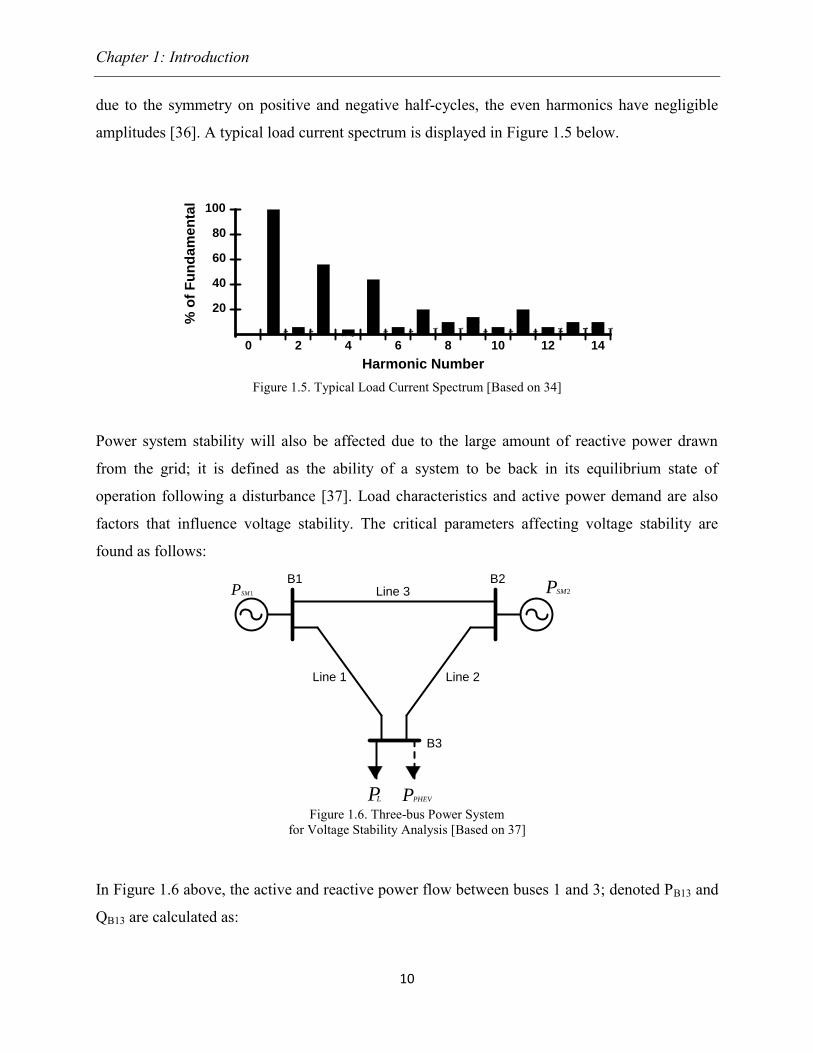
due to the symmetry on positive and negative half-cycles, the even harmonics have negligible
amplitudes [36]. A typical load current spectrum is displayed in Figure 1.5 below.
20
40
60
80
100
0 2 4 6 8 10 12 14
Harmonic Number
% o
f F
un
da
me
nta
l
text
text
text
text
text
text
text text
text
text
text
text text text
Figure 1.5. Typical Load Current Spectrum [Based on 34]
Power system stability will also be affected due to the large amount of reactive power drawn
from the grid; it is defined as the ability of a system to be back in its equilibrium state of
operation following a disturbance [37]. Load characteristics and active power demand are also
factors that influence voltage stability. The critical parameters affecting voltage stability are
found as follows:
1 1
PSM1 PSM2
PL PPHEV
Line 1 Line 2
Line 3B1 B2
B3
Figure 1.6. Three-bus Power System
for Voltage Stability Analysis [Based on 37]
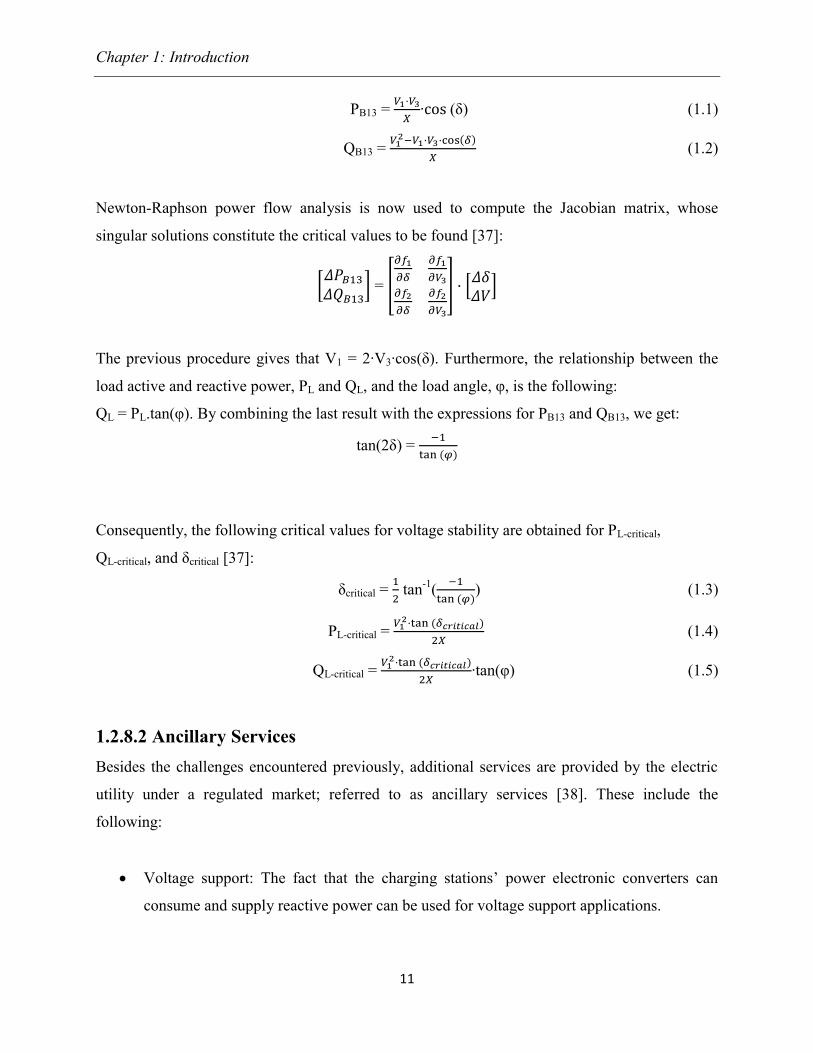
In Figure 1.6 above, the active and reactive power flow between buses 1 and 3; denoted PB13 and
QB13 are calculated as:
Chapter 1: Introduction
11
PB13 =
· (δ) (1.1)
QB13 =
(1.2)
Newton-Raphson power flow analysis is now used to compute the Jacobian matrix, whose
singular solutions constitute the critical values to be found [37]:
=
The previous procedure gives that V1 = 2·V3·cos(δ). Furthermore, the relationship between the
load active and reactive power, PL and QL, and the load angle, φ, is the following:
QL = PL.tan(φ). By combining the last result with the expressions for PB13 and QB13, we get:
tan(2δ) =
Consequently, the following critical values for voltage stability are obtained for PL-critical,
QL-critical, and δcritical [37]:
δcritical =
tan
-1(
) (1.3)
PL-critical =
(1.4)
QL-critical =
·tan(φ) (1.5)
1.2.8.2 Ancillary Services
Besides the challenges encountered previously, additional services are provided by the electric
utility under a regulated market; referred to as ancillary services [38]. These include the
following:
Voltage support: The fact that the charging stations’ power electronic converters can
consume and supply reactive power can be used for voltage support applications.

Chapter 1: Introduction
12
Load tracking and frequency regulation: The bidirectional power transfer of PHEV battery
chargers allows stationary PHEVs to be used as generators.
Peak shaving: When PHEVs produce electricity the stored battery energy could be used
for peak shaving, which results in an important decrease of line current and losses, and
thus reducing transmission upgrade costs.
Network stability services: Other PHEV functions include power system stabilizers and
backup generators in case of a contingency. This last feature improves the system
reliability.
Backup energy source: When being parked, PHEVs act as energy storage devices [39],
and thus can supply energy in exchange for monetary profits [40]. Energy storage is also
very useful to allow the operation of microgrid islanding [39].
1.2.8.3 Integration Studies
Many Canadian utilities (like Hydro-Quebec, BC Hydro, Manitoba Hydro, and Hydro One
Networks) are concerned with the impact of PHEV integration on electric distribution systems
and the creation of implementation standards [41, 42, 43].
Particularly, Hydro-Quebec is involved in a study with EPRI on the impacts on the distribution
grid of a wide deployment of PHEVs including: Transformer and transmission line thermal
loading, voltage regulation and harmonics, and transformer loss of life. The study assumes:
various PHEV charge profiles and penetration across utility customers, different charge times
and battery state of charges [41]. The followed methodology displayed in Figure 1.7 consisted of
a deterministic and a stochastic analysis [44].
Developed Network
Model Cases:
Peak Hour
Peak Day
Yearly 8760
Impact Analyses:
Deterministic
StochasticDistribution Models &
Load Profiles
PHEV Load
Characteristics
Figure 1.7. System Impact Analysis Framework [Based on 44]

Chapter 1: Introduction
13
The deterministic analysis is developed to identify the impact on the system distribution
components and the general trend in network behavior for forced scenario without considering
the spatial and temporal diversity of PHEV loads on the grid [44]. On the other hand, the
stochastic analysis shown in Figure 1.8 takes into consideration the previous factors and the
obtained results enable an understanding of which impacts are the most probable to occur [44].
Monte Carlo Analysis:
8760 simulations runs with
DSS
Empirical Results:
Thermal Overloads,
Under/Over Voltages,
Losses,
Imbalance,
etcP (# per Cust)
P (Charge Start Time)
P (TYPE)
11
1
Figure 1.8. The Stochastic Approach [Based on 44]
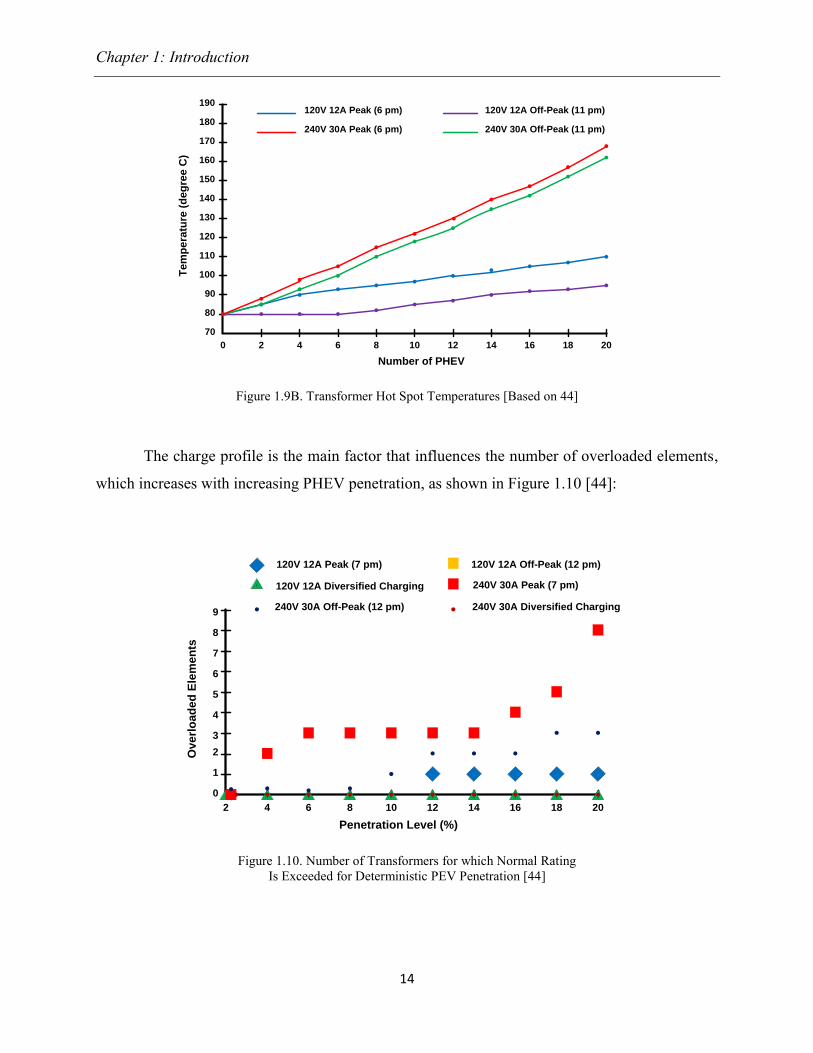
While the stochastic analysis is still in progress, the deterministic one revealed that:
The average transformer lifespan is very sensitive to an increase in PHEV loading. The
transformer aging and peak hot spot temperatures are displayed in Figures 1.9A and 1.9B,
respectively, for various charging profiles [44]:
2 4 6 8 10 12 14 16 18 20
0.100
1.000
10.000
0.010
0
120V 12A Peak (6 pm)
240V 30A Peak (6 pm)
120V 12A Off-Peak (11 pm)
240V 30A Off-Peak (11 pm)
Number of PHEV
% A
gin
g p
er
Ye
ar
Figure 1.9A. Transformer Yearly Aging [Based on 44]
Chapter 1: Introduction
14
2 4 6 8 10 12 14 16 18 20
Number of PHEV
0
70
80
90
100
110
120
130
140
150
160
170
180
190
Te
mp
era
ture
(d
eg
ree
C)
120V 12A Peak (6 pm)
240V 30A Peak (6 pm)
120V 12A Off-Peak (11 pm)
240V 30A Off-Peak (11 pm)
Figure 1.9B. Transformer Hot Spot Temperatures [Based on 44]
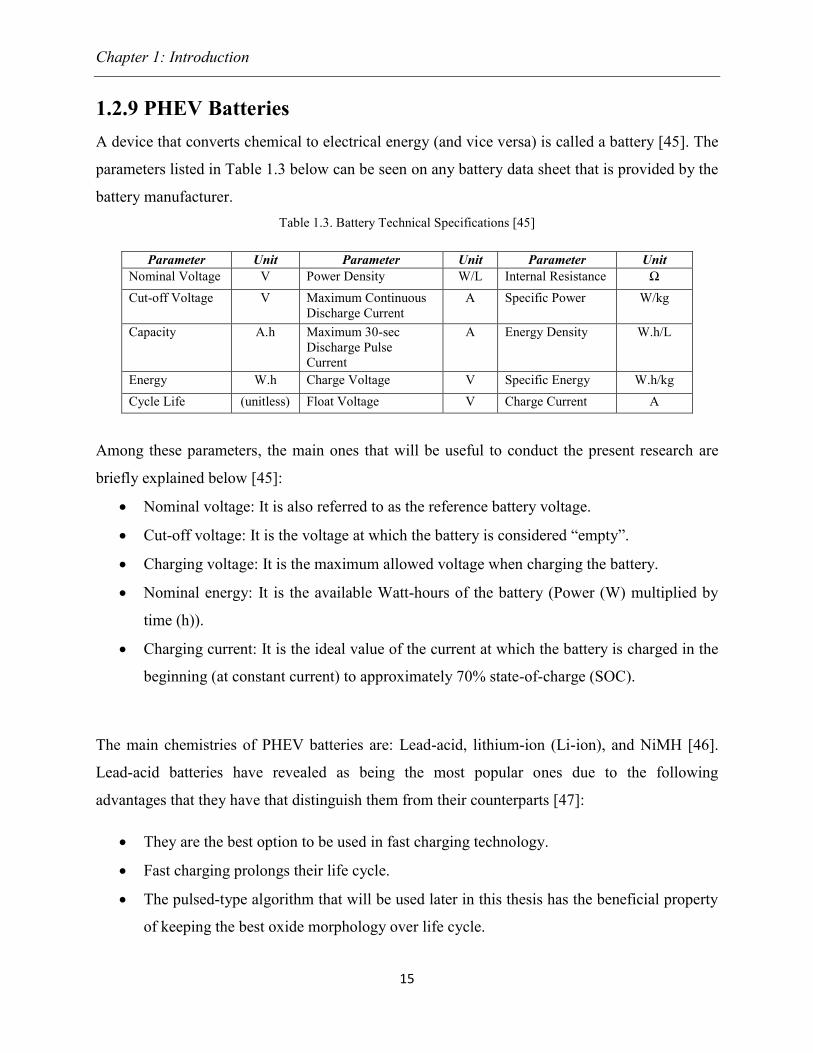
The charge profile is the main factor that influences the number of overloaded elements,
which increases with increasing PHEV penetration, as shown in Figure 1.10 [44]:
2 4 6 8 10 12 14 16 18
Penetration Level (%)
0
1
2
3
4
5
6
7
8
9
Ov
erl
oa
de
d E
lem
en
ts
20
11 1 1 1 1 1 1 1 1
1
120V 12A Peak (7 pm)
120V 12A Diversified Charging
240V 30A Off-Peak (12 pm)
120V 12A Off-Peak (12 pm)
240V 30A Peak (7 pm)
240V 30A Diversified Charging
Figure 1.10. Number of Transformers for which Normal Rating
Is Exceeded for Deterministic PEV Penetration [44]
Chapter 1: Introduction
15
1.2.9 PHEV Batteries
A device that converts chemical to electrical energy (and vice versa) is called a battery [45]. The
parameters listed in Table 1.3 below can be seen on any battery data sheet that is provided by the
battery manufacturer.
Table 1.3. Battery Technical Specifications [45]
Parameter Unit Parameter Unit Parameter Unit
Nominal Voltage V Power Density W/L Internal Resistance Ω
Cut-off Voltage V Maximum Continuous
Discharge Current
A Specific Power W/kg
Capacity A.h Maximum 30-sec
Discharge Pulse
Current
A Energy Density W.h/L
Energy W.h Charge Voltage V Specific Energy W.h/kg
Cycle Life (unitless) Float Voltage V Charge Current A
Among these parameters, the main ones that will be useful to conduct the present research are
briefly explained below [45]:
Nominal voltage: It is also referred to as the reference battery voltage.
Cut-off voltage: It is the voltage at which the battery is considered “empty”.
Charging voltage: It is the maximum allowed voltage when charging the battery.
Nominal energy: It is the available Watt-hours of the battery (Power (W) multiplied by
time (h)).
Charging current: It is the ideal value of the current at which the battery is charged in the
beginning (at constant current) to approximately 70% state-of-charge (SOC).
The main chemistries of PHEV batteries are: Lead-acid, lithium-ion (Li-ion), and NiMH [46].
Lead-acid batteries have revealed as being the most popular ones due to the following
advantages that they have that distinguish them from their counterparts [47]:
They are the best option to be used in fast charging technology.
Fast charging prolongs their life cycle.
The pulsed-type algorithm that will be used later in this thesis has the beneficial property
of keeping the best oxide morphology over life cycle.
Chapter 1: Introduction
16
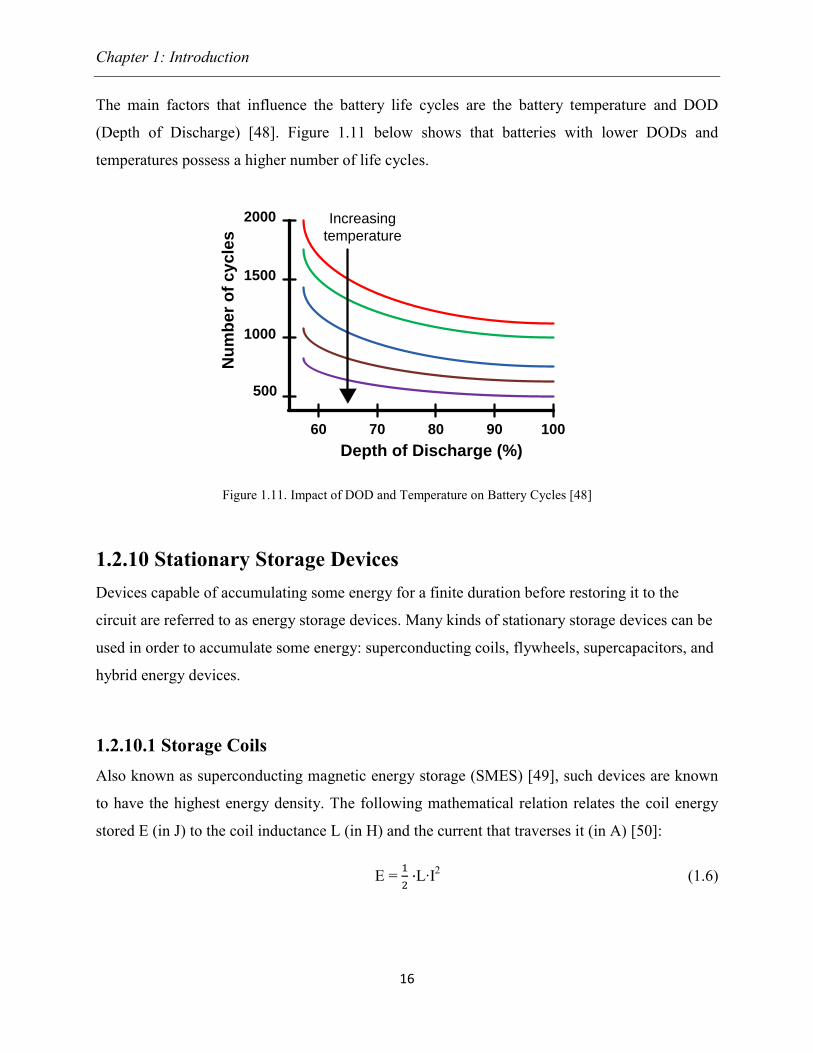
The main factors that influence the battery life cycles are the battery temperature and DOD
(Depth of Discharge) [48]. Figure 1.11 below shows that batteries with lower DODs and
temperatures possess a higher number of life cycles.
500
1000
1500
2000
60 70 80 90 100
Nu
mb
er
of
cy
cle
s
1
Depth of Discharge (%)
Increasing
temperature
Figure 1.11. Impact of DOD and Temperature on Battery Cycles [48]
1.2.10 Stationary Storage Devices
Devices capable of accumulating some energy for a finite duration before restoring it to the
circuit are referred to as energy storage devices. Many kinds of stationary storage devices can be
used in order to accumulate some energy: superconducting coils, flywheels, supercapacitors, and
hybrid energy devices.
1.2.10.1 Storage Coils
Also known as superconducting magnetic energy storage (SMES) [49], such devices are known
to have the highest energy density. The following mathematical relation relates the coil energy
stored E (in J) to the coil inductance L (in H) and the current that traverses it (in A) [50]:
E =
L·I
2 (1.6)
Chapter 1: Introduction
17
Storage coils found their use in many sectors:
The space sector where they are designed for satellites as solenoids due to their simple
construction and preferred structural mass over other types of magnets [51].
The transportation sector where coils are mainly used in high-speed rail locomotive
leading to higher fuel efficiency, lower prime mover weight and power rating, and
especially faster locomotive thus leading to a shorter trip time [52]. Coils are also applied
in automatic guided vehicle to allow contact-free energy transmission [53] by transferring
energy using the magnetic energy stored in the coil.
The stability sector where they are used to improve the transient stability of a system if
they are controlled appropriately; for example using a fuzzy-logic control scheme [54].
The main drawbacks of SMES are the measures of protection that need to be taken in order to
reduce the conduction losses; for example, the design and implementation of generic
commutation circuits for the charging and discharging processes [55].
1.2.10.2 Flywheels
Flywheel energy storage (FES) is an electromechanical device that stores energy in kinetic form
in a rotating mass [49]. Flywheels are useful when there exist an imbalance between the
generated power and the powere demanded by the load [56]. In such devices, the charging and
discharging processes are done by varying the rotational velocity of the mass: to store some
electricity, a motor converts the external electrical energy into mechanical energy (charging), on
the other hand to deliver some energy the motor acts as a generator and converts the energy into
electrical form (discharging) [56]. Some control strategies have been found in order to apply
flywheels in EVs. One of them has been found in [57], where the charging process is done
through the use of fuzzy logic and a PI controller whereas the discharging is done by simply
applying the PWM strategy to the interfacing converter (AC/DC) [57].
The energy E (in J) that can be stored in a flywheel rotor can be found using the wheel moment
of inertia J (in Kg.m2) and angular speed ω (in rad/s), in the following mathematical relation
[58]:
E =
·J·ω
2 (1.7)
Chapter 1: Introduction
18
FESs have been recognized as being the cleanest energy storage devices [59] and find their
applications in the following areas:
Previously, FESs have always been used for short-term energy storage in rotating
machines and engines to deliver smooth power [58].
Recently, they are being used for electrical energy storage [60]. In such case the FES is
referred to as a mechanical battery energy storage device: it always stores kinetic energy,
and releases it in electrical form upon demand. This last advantage will be considered
largely in this thesis.
For the next few years, researches are being conducted in order to design higher specific
power density (kW/Kg) and higher specific energy (kWh/Kg) density. The first one
depends completely on the motor/generator that drives it [60].
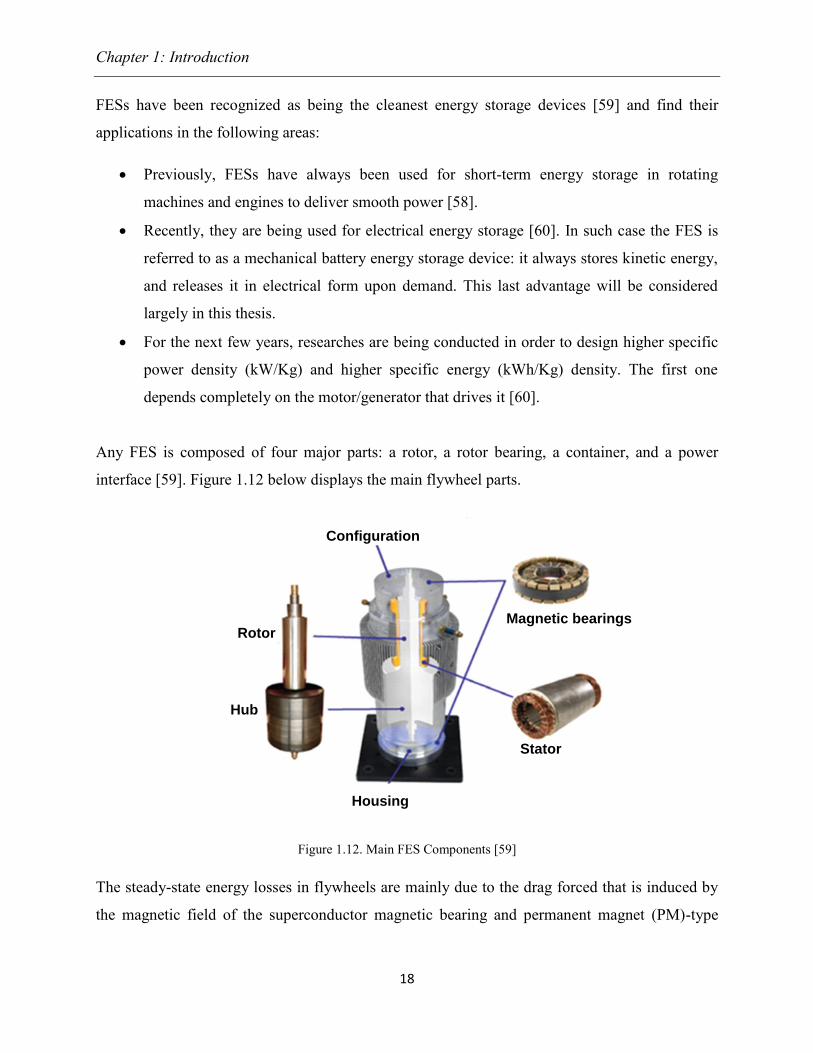
Any FES is composed of four major parts: a rotor, a rotor bearing, a container, and a power
interface [59]. Figure 1.12 below displays the main flywheel parts.
Configuration
Housing
Stator
Hub
Magnetic bearingsRotor
Figure 1.12. Main FES Components [59]
The steady-state energy losses in flywheels are mainly due to the drag forced that is induced by
the magnetic field of the superconductor magnetic bearing and permanent magnet (PM)-type

Chapter 1: Introduction
19
motor/generator (PMSM/G) [61]. However, the largest losses occur from the PMSM/G, and an
acceptable solution would be to simultaneously rotate the PMSM/G and the PM [62].
1.2.10.3 Supercapacitors
Also known as electric double layer capacitors (EDLC) or ultracapacitors, such devices behave
exactly like any normal capacitor with the differences of having a much higher capacitance (in
the order ranging from tens to hundreds of Farads) and a higher power density which lets them
charge and discharge rapidly [63], and allows them to be used in applications to replace batteries.
A typical supercapacitor is shown in Figure 1.13 below.
Figure 1.13. A Typical Supercapacitor [63]
Such devices store energy using the following mathematical relation that relates the energy
stored E (in J) to the capacitance C (in F) and the voltage across it U (in V) [50]:
E =
·C·U
2 (1.8)
They are classified into three categories [64]:
Double-layer capacitors depend on the double electric layer mechanism.
Electrochemical capacitors rely on the fast Faraday oxydo-reduction reactions.
Hybrid capacitors are a combination of the two previous categories.
Chapter 1: Introduction
20
A control strategy has been proposed for the supercapacitors to support current peaks that are
momentarily demanded by electrical road vehicles. Such a method is based on the fact that the
supercapacitors must be discharged once the current demanded by the load becomes greater than
the reference limit current for battery discharge [65].
Supercapacitors are safe, possess an average light weight, can be recycled, and are
environmentally friendly [66], which is what makes them mostly popular in the domain of
energy storage for traction applications [67] and elevator systems with a soft commutated
interface [64]. Additional applications include the following:
Diesel-electric locomotives power assistance: supecapacitors are preferred compared to
electromechanical accumulators when being used in power assistance [68].
Recuperation of the braking energy that is wasted in the braking resistors [69].
Sole energy storage device in hybrid electric cars if they are dimensioned appropriately.
Despite the benefits just mentioned, the energy that can be stored in a supercapacitor is low,
which prevents large vehicle autonomy. For this reason, some methods have been found in order
to allow fast energy transfer between supercapacitors in transport applications, such as the
introduction of sequential supply [70].
1.2.10.4 Hybrid Energy Storage Systems
The energy storage devices described above can be combined together to form a new energy
storage system. In the case where two of them are combined together, the resulting system is
referred to as hybrid energy storage.
A hybrid system based on compressed air and supercapacitors has been designed to meet its
maximum efficiency at any time. All the system devices are reversible, meaning they can charge
and discharge [71]:
During generation, the compressed air is liberated in the pneumatic machine that operates
as a motor to power the DC generator.

Chapter 1: Introduction
21
During storage, the machine acts as a motor that drives the pneumatic machine that
operates as a compressor to fill the tank with air under pressure.
Such a system has been proved as being too sensitive regarding multiple conversions, and the
efficiency of each of the system components has been found to be low [72]. This mean that such
equipment must be designed very carefully to ensure that it is practical [72].
1.3 Problem Statement
Fast charging of PHEV batteries means that the duration required to charge such batteries must
be minimized, which implies the use of the grid and additional sources of energy that must be
managed efficiently and intelligently.
A waiting period is also required to recharge the storage devices once the PHEV leaves the
station. Such a period should also be minimized in order to reduce the time that the client needs
to wait at the station before charging the battery, and to accelerate the battery swapping process
at some charging stations if applicable.
Finally, it is important to look at some aspects of the impacts caused by such charging stations on
the grid such as harmonics, THD, phase unbalance, power factor, ground fault and electricity
generation.
1.4 Contributions
The present research proposes the design and presents the simulation results of a fast-charging
station capable of recharging PHEV batteries with capacities lower or equal to 15 kWh from a
minimum of 20% to a maximum of 95% of the battery state-of-charge in a maximum duration of
15 minutes. After a battery has been charged, a waiting period (during which no cars have access
to the charging station) of a maximum duration of 7.5 minutes is required. During this period, the
storage devices are being recharged to their maximum.
The charging station employs the grid and two stationary storage devices; both with high power
densities, environmentally friendly, with a high efficiency, and that are capable of charging and

Chapter 1: Introduction
22
discharging in durations in the order of minutes. An algorithm that manages the three energy
sources in order to reduce the charging and waiting durations has been developed.
While the charging station may introduce harmonics on the grid, it does not affect the power
factor, and is more efficient than a conventional charger.
1.5 Thesis Outline
The present thesis follows an outline described below:
Chapter 2 describes the basic configuration used for the design of the fast charging station:
energy requirements and storage devices choice.
In Chapter 3, the different power electronic interfaces (including choppers and
rectifiers/inverters) of the charging station are designed.
Chapter 4 presents the individual control schemes of each converter as well as the control and
proposed algorithm of the whole charging station.
In Chapter 5, the charging station operation is simulated with two different scenarios: the first
one displays the charging process of a single PHEV battery whereas the second one displays the
charging process of two consecutive PHEV batteries.
Chapter 6 summarizes the performance of the proposed solution and proposes future work to be
improved in the fast charging station design.

Chapter 2: Charging Station Basic Configuration
23
CHAPTER 2 Charging Station Basic Configuration
This chapter justifies the necessity of storage technology in addition to the electrical grid in the
fast charging station design, then quantifies the grid and local storage need, and finally justifies
the use of a flywheel and a supercapacitor as the station storage devices.
2.1 Grid Power Limitation
The long duration required to charge PHEV batteries (4 to 8 hours) with the currently existing
Level I and II chargers is due to the fact that such chargers use the grid only as an energy source
to charge the PHEV battery [73]:
Typical PHEV and EV parameters are displayed in Table 2.1 below [74, 75].
Table 2.1. Nominal Voltage and Energy for PHEV/EV Batteries
Nominal Voltage (V) Nominal Energy (kWh)
PHEV 180 – 270 10 – 15
EV Above 300 20 – 60
Assuming a power factor, pf, the maximum duration, Δtmax, required to charge a PHEV battery
from the grid from 20% to 95% of its maximum capacity Emax = 15 kWh is found as:
Δtmax =
=
Table 2.2 below displays the maximum PHEV battery charging durations in Europe and North
America; given their respective grid voltage and current [76].
Table 2.2. Maximum PHEV Battery Charging Duration
RMS
Voltage (V)
RMS
Current (A)
Power
Factor (pf)
SOCmin (%) SOCmax (%) Emax (kWh) Δtmax
(hours)
Europe 230 16 0.95 20 95 15 3.2
North
America
120 15 0.95 20 95 15 6.6

Chapter 2: Charging Station Basic Configuration
24
Table 2.2 illustrated the insufficiency of the grid to charge a PHEV battery in less than an hour.
For this reason, additional energy sources are necessary to reduce the battery charging time. As
an example, the grid current of 20 A was insufficient, so the McGill Racing Team uses as an
additional source its dynamometer - used for testing batteries and electric motors - that can also
provide power. A motor is mounted on the dynamometer as a generator to charge the batteries at
much higher rates, raising the current to about 90 A. The team hybrid car uses a battery whose
specifications are: a capacity of 45 A.h at 0.2 C, and a continuous charging current of 180 A in
order to be fully recharged in 15 minutes (fast-charging) [77].
Another way to minimize the maximum charging duration is to use the energy storage
technology [78]; where the energy is being stored in storage devices before being delivered to
the load. This method will also enable a minimum reliance on the electrical grid in order to
diminish the impact on the grid of the additional load. More on this topic will be discussed in
Chapter 6.
2.2 Station Energy Sources Quantification
The designed fast charging station uses, in addition to the grid, the energy storage technology.
The law that relates the charger output energy EO (kWh) to the grid energy EGrid (kWh) and the
energy storage devices energy EStorage (kWh) is the following:
EO = EGrid + EStorage (2.1)
The grid is interfaced with the charger via an AC/DC converter.
According to the SAE J1772, the Level 3 fast-charging station employs DC charging with
600 V, as mentioned in Table 1.1 [3]. For this reason, the design will assume a voltage VDC =
600 V on the DC side. The design will also assume on the DC side a grid current IGrid,DC = 50 A
in order for the charging station to draw a maximum power of 30 kW from the grid.
The charging station is also designed to charge a typical PHEV battery in a maximum
duration of Δtmax = 15 minutes. The grid helps the battery charging process during a maximum
duration of ΔtGrid = 10 minutes (shown in Chapter 5). The grid energy is calculated as follows:

Chapter 2: Charging Station Basic Configuration
25
EGrid = VDC· IDC·Δtgrid = 600 x 50 x
EGrid = 5 kWh (2.2)
As mentioned in Section 1.4, the charging station is designed to charge PHEV batteries whose
energy capacities do not exceed 15 kWh, from a minimum of 20% of the battery state of charge
(SOC) to a maximum of 95% of the battery SOC. This implies that the maximum energy output
by the charger will be:
EO,max = EPHEVmax·(SOCmax – SOCmin) = 15·(0.95-0.20)
EO,max = 11.25 kWh (2.3)
Using (2.1), (2.2), and (2.3), the maximum energy provided by the charging station storage
devices, EStorage,max, can be found as follow:
EStorage,max = EO,max – EGrid = 11.25 – 5
EStorage,max = 6.25 kWh (2.4)
The energy management in the designed charging station is summarized in Table 2.3 below.
Table 2.3. PHEV Charging Station Energy Management
Sources Grid Storage Devices Output
Energy (kWh) 5 6.25 11.25
The choice of the charger storage devices is developed in the next section.
2.3 Station Storage Devices Choice
The present section lists the most popular stationary energy storage devices performance
requirements, and then justifies the charging station devices choice.
2.3.1 Performance Requirements
The chosen energy storage devices must ideally satisfy all of the following performance criteria
in order to maximize the fast charging station efficiency:

Chapter 2: Charging Station Basic Configuration
26
Dynamicity: The charging station is designed to charge a battery in a maximum 15
minutes (short duration). The storage device must thus be able to charge and discharge in
this period.
High Power Density: The device must be able to deliver a high amount of power in a
short period of time.
High Efficiency: The charging station must meet its maximum possible efficiency. This
last criterion depends on the main station parts: converters, storage devices, etc.
Therefore, it is a must to consider the storage devices that have the highest efficiency.
Environmentally Friendly: The device must have no or negligible negative impacts on the
environment.
Table 2.4 below displays the most popular stationary storage devices according to the previously
mentioned criteria [71, 72].
Table 2.4. Classification by Criterion
Storage Technology Life time
(cycles)
Power
Density
Efficiency
(%)
Impact on the
Environment
Flow Batteries 1500 – 2500 Low 75 – 85 Medium
Metal-Air Batteries 100 – 200 Low 50 Medium
NAS Batteries 2000 – 3000 Low 89 High
Lead-Acid Batteries 200 – 300 Medium 75 High
Li-Ion Batteries 300 – 500 Medium 95 Medium
Supercapacitors 10000 – 100000 High 93 – 98 Low
Flywheels (FES) 105 – 10
7 High 90 Low
2.3.2 Storage Devices Choice
As seen in Table 2.4 batteries have significant impacts on the environment, possess medium
efficiencies, and relatively low power density and number of life cycles. Thus, they do not satisfy
any of the performance requirements.
On the other hand, the FES and the supercapacitors have both: low impacts on the environment,
high efficiencies, power densities, and life cycles. Additionally they can both be charged and
Chapter 2: Charging Station Basic Configuration
27
discharged in a duration in the order of minutes [58]. The only drawback they both present is
their low energy density [79], which is not considered an issue since we are seeking high power
density instead.
However, the use of only one of them is not appropriate for the following reasons:
Even being a power device, the supercapacitor can provide a high amount of power for a
duration that is smaller than the PHEV battery charging time (15 minutes) [58]. Furthermore a
large capacitance would be required, which increases the supercapacitor cost.
The time required to charge an FES is relatively long (10 minutes), which will
significantly increase the time that a PHEV user will have to wait at the charging station before
the PHEV battery is reasonably charged.
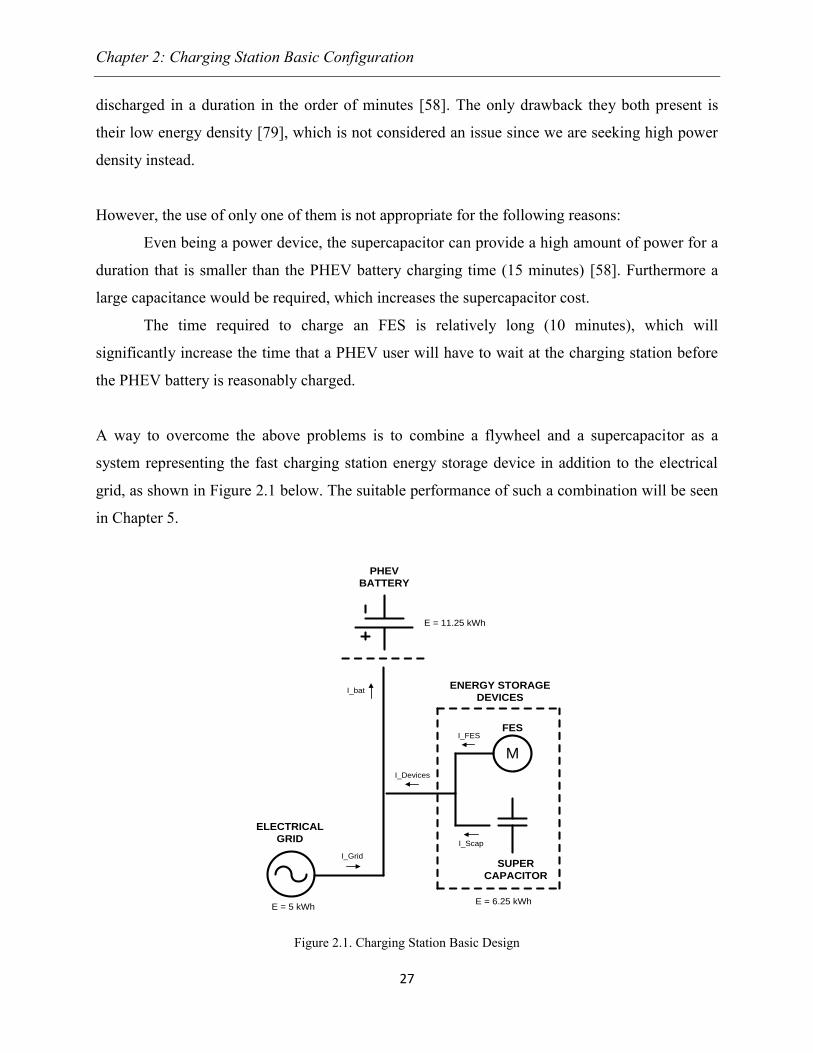
A way to overcome the above problems is to combine a flywheel and a supercapacitor as a
system representing the fast charging station energy storage device in addition to the electrical
grid, as shown in Figure 2.1 below. The suitable performance of such a combination will be seen
in Chapter 5.
ELECTRICAL
GRID
M
FES
SUPER
CAPACITOR
I_Grid
I_FES
I_Scap
I_bat
E = 5 kWh
I_Devices
ENERGY STORAGE
DEVICES
PHEV
BATTERY
E = 6.25 kWh
E = 11.25 kWh
Figure 2.1. Charging Station Basic Design
Chapter 3: Power Electronic Interfaces
28
CHAPTER 3
Power Electronic Interfaces
The designed fast charging station is composed of three energy sources: the grid, an FES, and a
supercapacitor. The last two sources are interfaced with the charger DC link via power electronic
converters [58, 64]. Also, since the car battery voltage is variable from one car battery to another,
a DC/DC converter must be placed on the charger output in order to adapt the charger output
voltage to the battery voltage. The present chapter discusses the individual design of such
converters, and then gives the electrical specifications of the whole charging station.
3.1 Static Power Switches
This section covers the existing technologies of static power electronic switches and then
justifies the use of IGBT as the best option for the design of the converters.
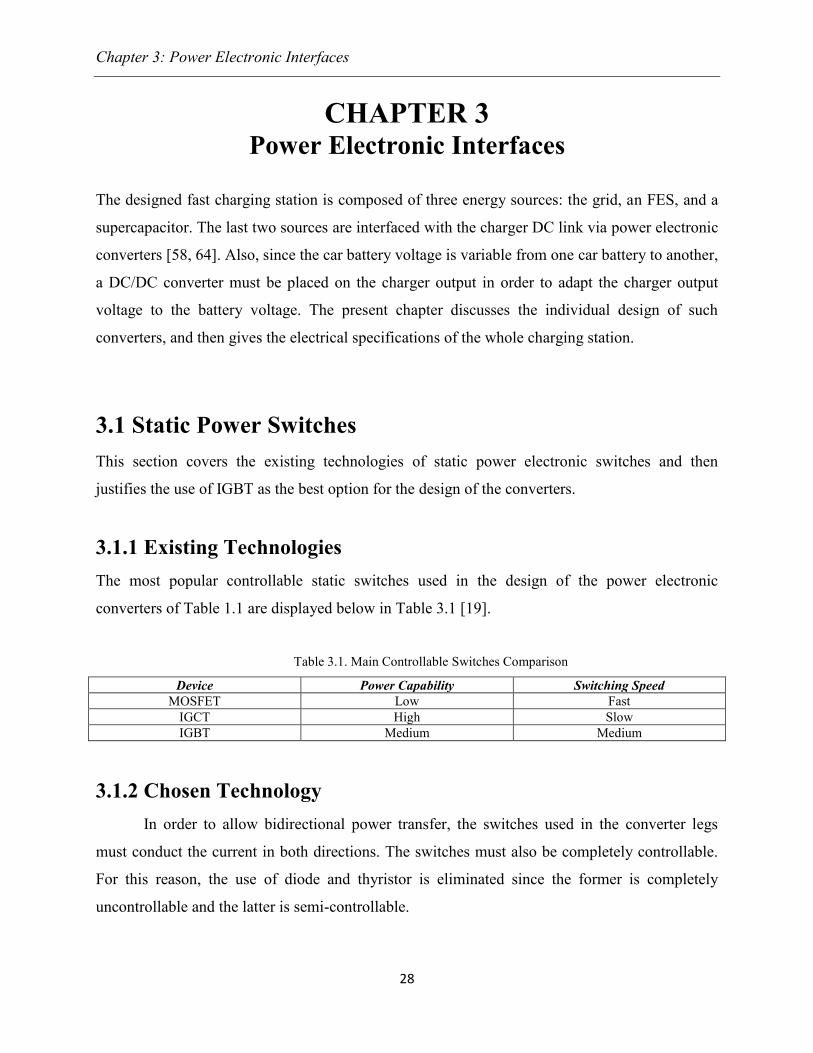
3.1.1 Existing Technologies
The most popular controllable static switches used in the design of the power electronic
converters of Table 1.1 are displayed below in Table 3.1 [19].
Table 3.1. Main Controllable Switches Comparison
Device Power Capability Switching Speed
MOSFET Low Fast
IGCT High Slow
IGBT Medium Medium
3.1.2 Chosen Technology
In order to allow bidirectional power transfer, the switches used in the converter legs
must conduct the current in both directions. The switches must also be completely controllable.
For this reason, the use of diode and thyristor is eliminated since the former is completely
uncontrollable and the latter is semi-controllable.

Chapter 3: Power Electronic Interfaces
29
Furthermore, the grid outputs a real power of 30 kW (see Section 2.2), and has a
frequency of 60 Hz; both are in the medium range of operation. In the technologies of Table 3.1,
the IGBT tends to be the best option for the design of the charging station is power electronic
interfaces. An IGBT converter has an efficiency of typically 90% [58].
3.2 Grid Side Converter
The grid provides single-phase AC voltage and current. In order to be interfaced with the
charger’s dc bus, a bidirectional AC/DC converter is required in order to allow the station to
operate in V2G mode as well [30].
3.2.1 Converter Design
In order to turn on and off the controllable switches inverters and rectifiers, many types of gating
signals can be used, among them are [19]:
Square wave inverters: DC input has to be varied to control the magnitude of the output
AC voltage.
Voltage cancellation: Switches operate at 0.5 duty cycle while the DC input remains
fixed.
Pulse-Width-Modulation (PWM): A modulating signal where the AC side frequency is
compared with a carrier having a frequency such that the frequency modulation mf
(defined below) is a large odd integer:
mf =
The most popular gating generation used in inverters is a sinusoidal PWM, where the control
signal is a sine wave; it generates harmonic voltages in the range of the switching frequency and
higher, which can be easily filtered out [19]. The grid-side converter is shown in Figure 3.1.
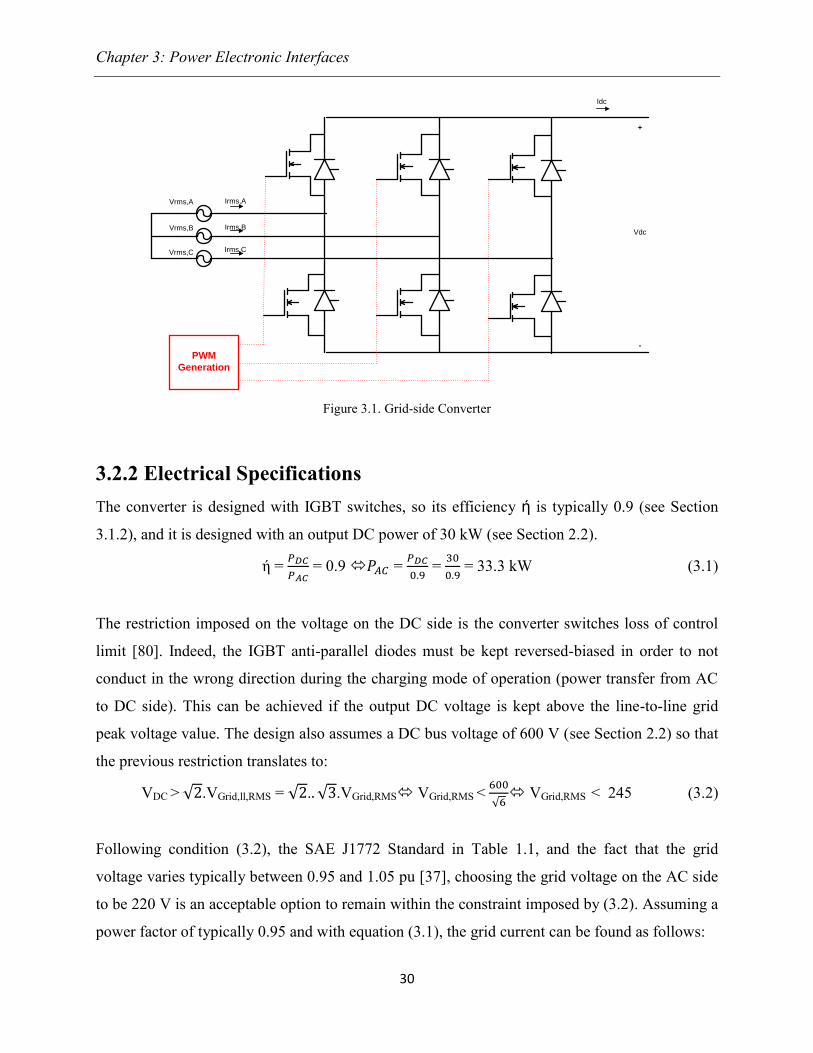
Chapter 3: Power Electronic Interfaces
30
+
Vdc
-
Idc
Irms,AVrms,A
PWM
Generation
Vrms,B
Vrms,C
Irms,B
Irms,C
Figure 3.1. Grid-side Converter
3.2.2 Electrical Specifications
The converter is designed with IGBT switches, so its efficiency ή is typically 0.9 (see Section
3.1.2), and it is designed with an output DC power of 30 kW (see Section 2.2).
ή =
= 0.9 =
=
= 33.3 kW (3.1)
The restriction imposed on the voltage on the DC side is the converter switches loss of control
limit [80]. Indeed, the IGBT anti-parallel diodes must be kept reversed-biased in order to not
conduct in the wrong direction during the charging mode of operation (power transfer from AC
to DC side). This can be achieved if the output DC voltage is kept above the line-to-line grid
peak voltage value. The design also assumes a DC bus voltage of 600 V (see Section 2.2) so that
the previous restriction translates to:
VDC > .VGrid,ll,RMS = . .VGrid,RMS VGrid,RMS <
VGrid,RMS < 245 (3.2)
Following condition (3.2), the SAE J1772 Standard in Table 1.1, and the fact that the grid
voltage varies typically between 0.95 and 1.05 pu [37], choosing the grid voltage on the AC side
to be 220 V is an acceptable option to remain within the constraint imposed by (3.2). Assuming a
power factor of typically 0.95 and with equation (3.1), the grid current can be found as follows:

Chapter 3: Power Electronic Interfaces
31
PAC = 3.VGrid,RMS.IGrid,RMS.pf
IGrid,RMS =
=
IGrid,RMS = 53 A (3.3)
With section 2.2 and the results found in (3.1) – (3.3), the following Table 3.2 can be drawn.
Table 3.2. Grid Converter Electrical Specifications
Input Side (RMS Values) Output Side (DC Values)
Grid Voltage (V) 220 600
Grid Current (A) 53 50
Real Power (kW) 33.3 30
3.3 Flywheel Energy Storage (FES) Converter
When acting as a generator, an FES converts kinetic energy into electrical energy [58]. This can
be translated in the following way: when rotating at an angular speed ω (rad/s), the energy is
converted into AC currents that must be converted to DC currents via an AC/DC converter [81].
3.3.1 Converter Design
The FES converter must also be bidirectional in order to allow both charge and discharge of the
FES.The converter may be single-stage (flywheel ISG a.c. ⇔ d.c. bus), or double stage (flywheel
ISG a.c. ⇔ d.c. bus ⇔ a.c. network) [58]. In this case, the simple single-stage case is needed
since the interface is to be done with the charging station dc bus. The FES converter looks
exactly like the grid-side converter that has been shown in Figure 3.1 previously.
3.3.2 Electrical Specifications
The FES is designed to provide a maximum output power of 30.75 kW (see Chapter 5). With a
DC bus voltage of 600 V, the output current on the DC side is:
IDC =
=
IDC = 51.25 A (3.4)

Chapter 3: Power Electronic Interfaces
32
When the FES is discharged, it charges back form the electrical grid. Furthermore since it is
interfaced with the DC bus via an IGBT converter, the input AC power must be:
ή =
= 0.9 =
=
= 34.17 kW (3.5)
With the same grid voltage and power factor, the grid current can be found as follows:
PAC = 3·VGrid,RMS·IGrid,RMS·pf
IGrid,RMS =
=
IGrid,RMS = 54.5 A (3.6)
With the results found in (3.4) – (3.6), the following Table 3.3 can be drawn.
Table 3.3. FES Converter Electrical Specifications
Input Side (RMS Values) Output Side (DC Values)
Grid Voltage (V) 220 600
Grid Current (A) 54.5 51.25
Real Power (kW) 34.17 30.75
3.3.3 FES Design Parameters
After the supercapacitor has provided the battery with 10% of its required energy, the remaining
90% will be provided by the FES and the grid simultaneously. This phase will not last more than
10 minutes of the battery charging process (see Chapter 5). Thus the maximum output energy
provided by the FES is found as follows:
EFES,max = 0.9·EO,max –
·PGrid = 0.9 x 11.25 – 30/6 = 5.125 kWh
However since the FES is interfaced with the charging station dc bus via an IGBT converter:
ή =
= 0.9 =
=
EFES,in = 5.69 kWh (3.7)
The relation relating the FES moment of inertia to its rated speed (see Section 1.2.10, equation
(1.7)) to provide the energy EFES,in is reminded below:
E =
·J·ω
2
Chapter 3: Power Electronic Interfaces
33
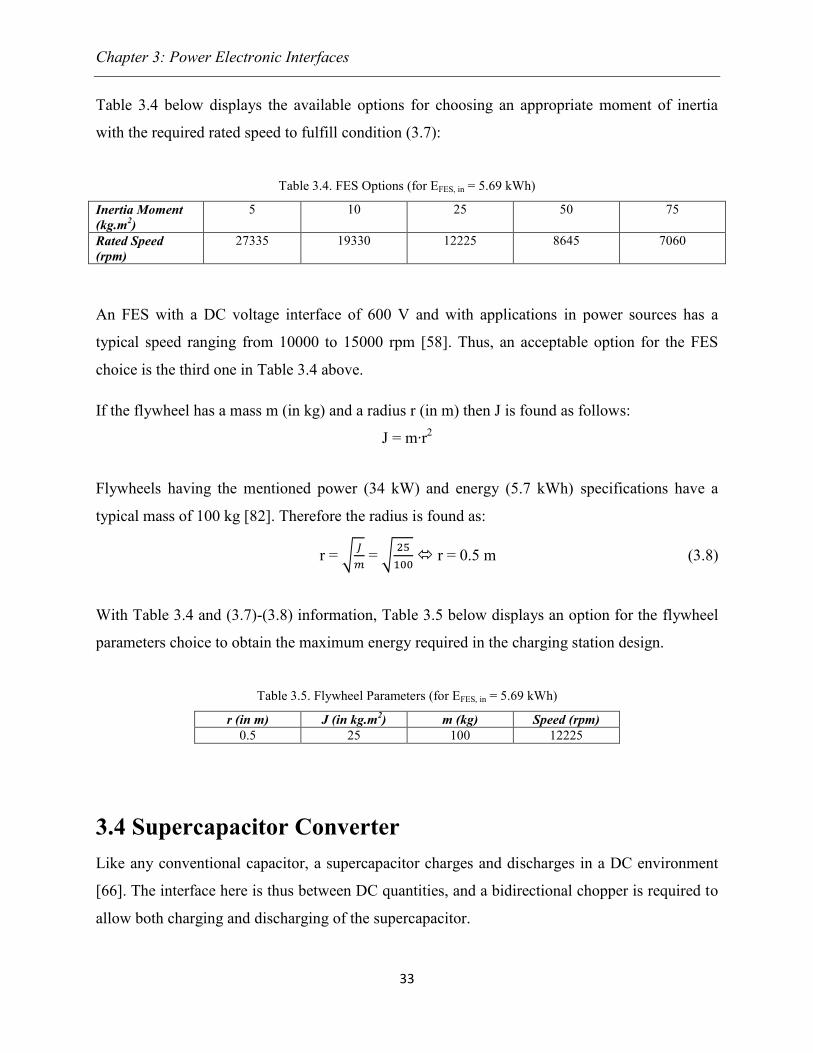
Table 3.4 below displays the available options for choosing an appropriate moment of inertia
with the required rated speed to fulfill condition (3.7):
Table 3.4. FES Options (for EFES, in = 5.69 kWh)
Inertia Moment
(kg.m2)
5 10 25 50 75
Rated Speed
(rpm)
27335 19330 12225 8645 7060
An FES with a DC voltage interface of 600 V and with applications in power sources has a
typical speed ranging from 10000 to 15000 rpm [58]. Thus, an acceptable option for the FES
choice is the third one in Table 3.4 above.
If the flywheel has a mass m (in kg) and a radius r (in m) then J is found as follows:
J = m·r2
Flywheels having the mentioned power (34 kW) and energy (5.7 kWh) specifications have a
typical mass of 100 kg [82]. Therefore the radius is found as:
r =
=
r = 0.5 m (3.8)
With Table 3.4 and (3.7)-(3.8) information, Table 3.5 below displays an option for the flywheel
parameters choice to obtain the maximum energy required in the charging station design.
Table 3.5. Flywheel Parameters (for EFES, in = 5.69 kWh)
r (in m) J (in kg.m2) m (kg) Speed (rpm)
0.5 25 100 12225
3.4 Supercapacitor Converter
Like any conventional capacitor, a supercapacitor charges and discharges in a DC environment
[66]. The interface here is thus between DC quantities, and a bidirectional chopper is required to
allow both charging and discharging of the supercapacitor.
Chapter 3: Power Electronic Interfaces
34
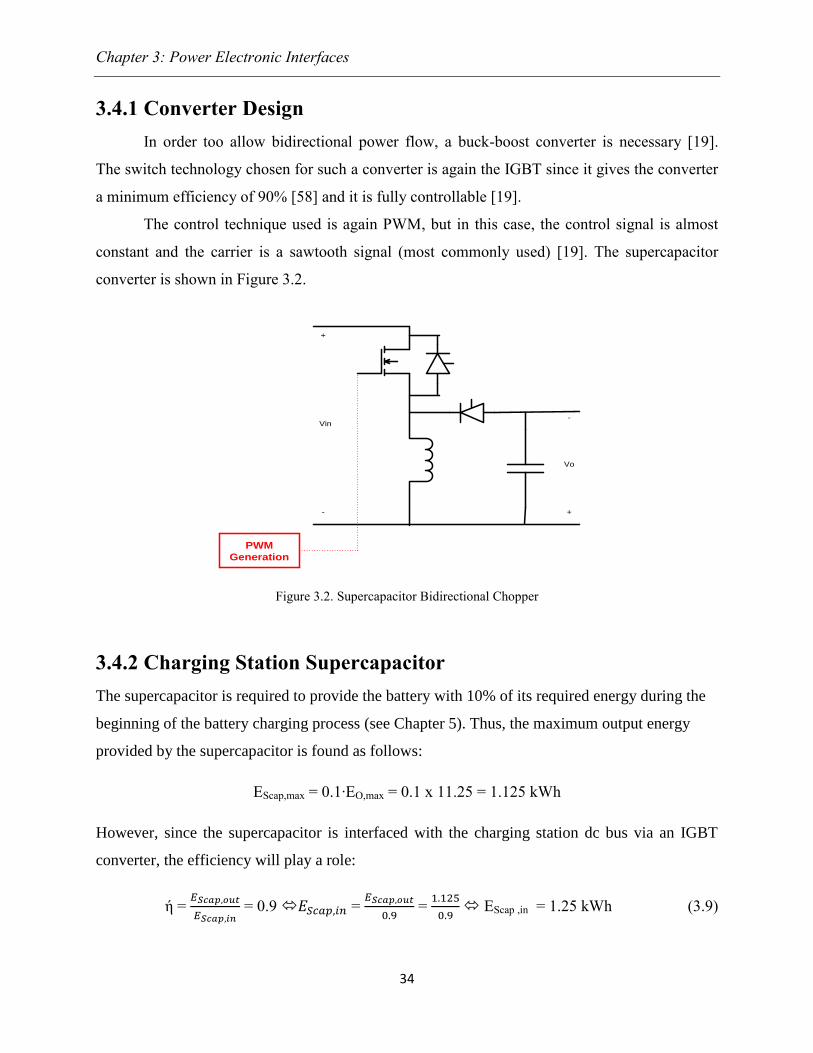
3.4.1 Converter Design
In order too allow bidirectional power flow, a buck-boost converter is necessary [19].
The switch technology chosen for such a converter is again the IGBT since it gives the converter
a minimum efficiency of 90% [58] and it is fully controllable [19].
The control technique used is again PWM, but in this case, the control signal is almost
constant and the carrier is a sawtooth signal (most commonly used) [19]. The supercapacitor
converter is shown in Figure 3.2.
+
-
Vo
+
-
Vin
PWM
Generation
Figure 3.2. Supercapacitor Bidirectional Chopper
3.4.2 Charging Station Supercapacitor
The supercapacitor is required to provide the battery with 10% of its required energy during the
beginning of the battery charging process (see Chapter 5). Thus, the maximum output energy
provided by the supercapacitor is found as follows:
EScap,max = 0.1·EO,max = 0.1 x 11.25 = 1.125 kWh
However, since the supercapacitor is interfaced with the charging station dc bus via an IGBT
converter, the efficiency will play a role:
ή =
= 0.9 =
=
EScap ,in = 1.25 kWh (3.9)

Chapter 3: Power Electronic Interfaces
35
The relation relating the supercapacitor moment capacitance to its rated voltage (see Section
1.2.10, equation (1.8)) to provide the energy EScap,in is reminded below:
E =
·C·U
2
Table 3.6 below displays the available options for choosing an appropriate capacitance with the
required voltage to fulfill condition (3.9):
Table 3.6. Supercapacitor Options (for EScap, in = 1.25 kWh)
Capacitance (F) 100 150 200 250 300
Rated Voltage (V) 300 245 212.13 190 173.20
An acceptable option would be a series / parallel combination of supercapacitors whose resulting
capacitance and voltage are 150 F and 245 V, respectively.
3.4.3 Electrical Specifications
The supercapacitor is rated to provide a maximum output power of 13.5 kW (see Chapter 5).
With a DC bus voltage of 600 V, the output current on the DC side is:
IDC =
=
IDC = 22.5 A (3.10)
Since the supercapacitor is interfaced with the charging station DC bus via an IGBT converter,
the input DC power must be:
ή =
= 0.9 =
=
= 15 kW (3.11)
In the previous section, it has been found that the supercapacitor must be rated less than 245 V in
order to provide the required energy during the vehicle battery charging process. The
supercapacitor rated current can now be found as follows:
PScap,in = VScap,in.IScap,in IScap,in =
=
= 61.25 A (3.12)
With the information (3.9)-(3.12), Table 3.7 below displays the supercapacitor converter
electrical specification.

Chapter 3: Power Electronic Interfaces
36
Table 3.7. Supercapacitor Converter Electrical Specifications
Input Side (DC Value) Output Side (DC Value)
Supercapacitor Voltage (V) 245 600
Supercapacitor Current (A) 61.25 22.5
Power (kW) 15 13.5
3.5 Output Converter
In order to adapt to various battery car voltages, the charging station dc bus must be interfaced
with the battery via a generic DC/DC converter that must also be bidirectional to allow both of
the battery charging and V2G modes.
3.5.1 Converter Design
The output converter configuration looks exactly like the one shown in Figure 3.2 above. Since
the dc bus voltage is always higher than the battery voltage, the converter acts as a buck
configuration in battery charging mode, and as a boost configuration in V2G mode.
3.5.2 Electrical Specifications
The output converter input current is equal to the sum of the output currents of the three
previously mentioned converters:
Itotal,DC = IGrid,DC + IFES,DC + IScap,DC
Itotal,DC = 50 + 51.25 + 22.5 = 123.75 A (3.13)
The converter input power is calculated as follows:
Ptotal,in = VDC.Itotal,DC = 600 x 123.75 = 74.25 kW (3.14)
The converter output power is calculated as follows:
ή =
= 0.9 = ή.Pin = 0.9 x 74.25 = 67 kW (3.15)
The converter output voltage is the maximum PHEV battery voltage, which is 270 V (Table 2.1).

Chapter 3: Power Electronic Interfaces
37
Finally the converter output current is calculated as follows:
Iout =
=
= 248 A (3.16)
With the information (3.13)-(3.16), the following Table 3.8 which displays the charging station
output converter electrical specification can be drawn.
Table 3.8. Charging Station Output Converter Electrical Specifications
Input Side (DC Value) Output Side (DC Value)
Voltage (V) 600 270
Current (A) 123.75 248
Power (kW) 74.25 67
3.6 Complete Power Circuit
The present section describes the combined design of the charging station, and then lists its
electrical specifications.
3.6.1 Circuit Design
The electrical grid, the supercapacitor, and the FES are all interfaced via their respective power
electronic converters previously designed to a common dc bus. The interface with the PHEV
battery is also done via a bidirectional DC/DC converter (see Section 3.5).
3.6.2 Electrical Specifications
The energy and power requirements of each current source are summarized in Table 3.9 below:
Table 3.9. Charging Station Electrical Specifications
Electrical Grid FES Supercapacitor
Maximum
output energy (kWh)
5.56 5.70 1.25
Converter Efficiency (%) 0.9 0.9 0.9
Maximum
output energy (kWh)
5 5.125 1.125
Maximum time of charging
operation (min)
10 10 5
Maximum Output power
(kW)
30 30.75 13.5

Chapter 3: Power Electronic Interfaces
38
Figure 3.3 below displays the combined charging station power circuit.
AC/DC
Converter
AC/DC
Converter
DC/DC
Converter
ELECTRICAL
GRID
M
FES
SUPER
CAPACITOR
DC/DC
Converter
PHEV
BATTERY
I_Grid_DC
I_FES_DC
I_Scap_DC
I_Total
I_bat
P = 33.3 kW
E = 5.56 kWh
V_Grid_RMS = 220 V
I_Grid_RMS = 53 A
Power factor = 0.95
P = 15 kW
E = 1.25 kWh
V_Scap_IN = 245 V
I_Scap_IN = 61.25 A
P = 67 kW
V_bat = 270 V
I_bat = 248 A
P = 30 kW
E = 5 kWh
Vdc = 600 V
I_Grid_DC = 50 A
P = 30.75 kW
E = 5.125 kWh
Vdc = 600 V
I_FES_DC = 51.25 A
P = 13.5 kW
E = 1.125 kWh
Vdc = 600 V
I_Scap_DC = 22.5 A
P = 74.25 kW
Vdc = 600 V
I_Total = 124 A
ή = 0.9
ή = 0.9
ή = 0.9
ή = 0.9
I_Scap_IN
I_FES_RMS
I_Grid_RMS
P = 34.17 kW
E = 5.70 kWh
V_Grid_RMS = 220 V
I_Grid_RMS = 54.5 A
Power factor = 0.95
Figure 3.3. Charging Station Power Circuit

Chapter 4: Charging Station Control Circuit
39
CHAPTER 4 Charging Station Control Circuit
In the previous chapter, the power circuit has been designed along with its electrical
specifications. The present chapter explains the control of each individual converter, then the
whole charging station control circuit.
4.1 Converters Individual Control
This section elaborates on the individual control schemes of each of the four charging station
power electronic converters.
4.1.1 Grid Converter Control
The grid side converter control circuit is shown in Figure 4.1 below. It is composed of two
nested control loops:
The outer loop is for voltage regulation. In order to keep the output dc bus voltage
constant, the error between the reference DC voltage and the measured bus voltage is fed to a PI
voltage controller that produces as an output the reference DC grid current.
The inner loop regulates the output DC current, whose reference is the output of the
previous outer loop. The error between the reference and measured DC current is fed to a current
regulator whose output is sent to the grid converter switching scheme (PWM).
Voltage
Regulator
Current
Regulator∑
1
∑
1
DC Bus Voltage
Reference
Measured
DC Bus Voltage
Grid DC Current
Reference
Measured
Grid DC Current
To grid converter
control
1 1 1 11
++
- -
Figure 4.1. Grid Converter Control

Chapter 4: Charging Station Control Circuit
40
4.1.2 FES Control
The FES control by itself is difficult.
4.1.2.1 FES Emulation
It has been demonstrated that an FES could easily be emulated by a PMDC (Permanent Magnet
DC Machine) [83]. Such operation would considerably decrease the system size and cost [83].
The FES system model will thus be replaced by a DC machine model as shown in Figure 4.2.
PMSM
M/G
PMDC
M/GFlywheel 1
DC
Power
Supply
3-Phase
Inverter
2-Quadrant
DC/DC
Converter
Figure 4.2. Flywheel Emulation Using a PMDC [Based on 83]
The power flow in the above system is bidirectional. Every power transfer is done through the
permanent magnet synchronous machine (PMSM), which can act as motor and generator. The
DC power supply not only imposes the dc bus voltage, but it also compensates for the system
losses.
It is reminded that the kinetic energy dW (in J) stored in the above system with moment
of inertia JF (in Kg.m2) and rotating from one speed ω1 to another speed ω2 (in rad/s) is
expressed as [83]:
dW =
·JF·(ω2
2 – ω1
2)
The above system is designed to operate in three modes based on the stored energy using the
above formula: charging, discharging, and no charging [83]. Each model is now explained
below.
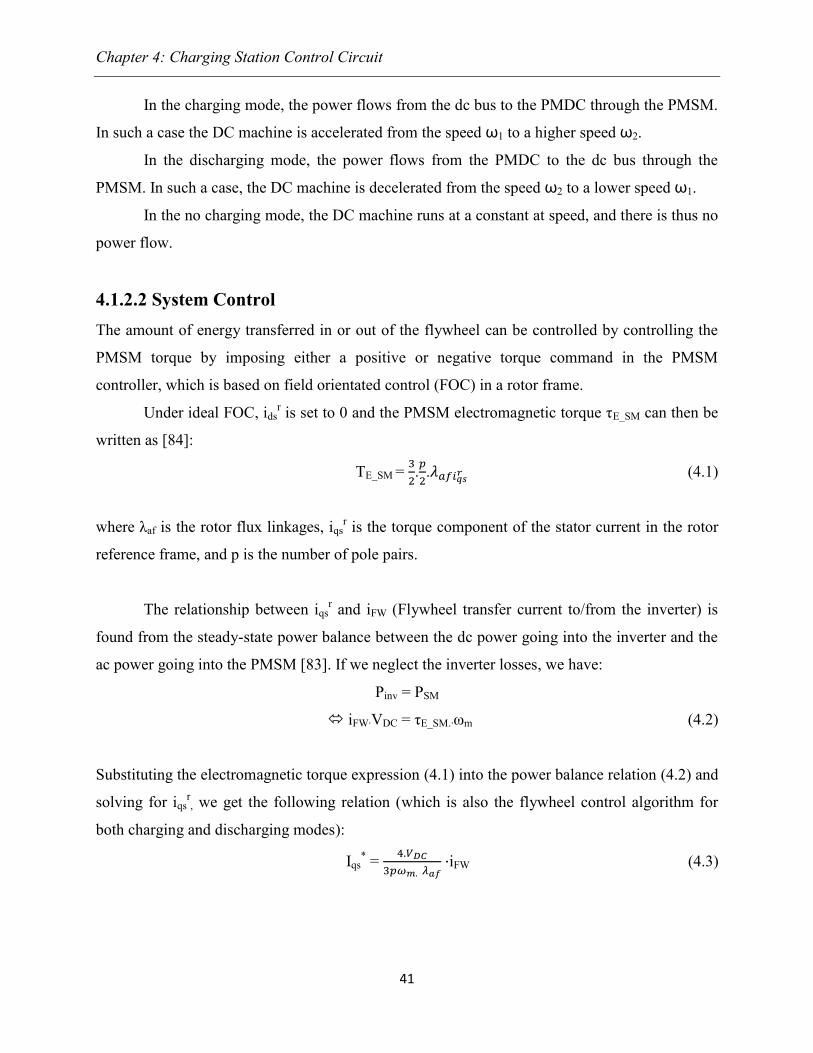
Chapter 4: Charging Station Control Circuit
41
In the charging mode, the power flows from the dc bus to the PMDC through the PMSM.
In such a case the DC machine is accelerated from the speed ω1 to a higher speed ω2.
In the discharging mode, the power flows from the PMDC to the dc bus through the
PMSM. In such a case, the DC machine is decelerated from the speed ω2 to a lower speed ω1.
In the no charging mode, the DC machine runs at a constant at speed, and there is thus no
power flow.
4.1.2.2 System Control
The amount of energy transferred in or out of the flywheel can be controlled by controlling the
PMSM torque by imposing either a positive or negative torque command in the PMSM
controller, which is based on field orientated control (FOC) in a rotor frame.
Under ideal FOC, idsr is set to 0 and the PMSM electromagnetic torque τE_SM can then be
written as [84]:
ΤE_SM =
.
.
(4.1)
where λaf is the rotor flux linkages, iqsr is the torque component of the stator current in the rotor
reference frame, and p is the number of pole pairs.
The relationship between iqsr and iFW (Flywheel transfer current to/from the inverter) is
found from the steady-state power balance between the dc power going into the inverter and the
ac power going into the PMSM [83]. If we neglect the inverter losses, we have:
Pinv = PSM
iFW·VDC = τE_SM.·ωm (4.2)
Substituting the electromagnetic torque expression (4.1) into the power balance relation (4.2) and
solving for iqsr, we get the following relation (which is also the flywheel control algorithm for
both charging and discharging modes):
Iqs* =
iFW (4.3)
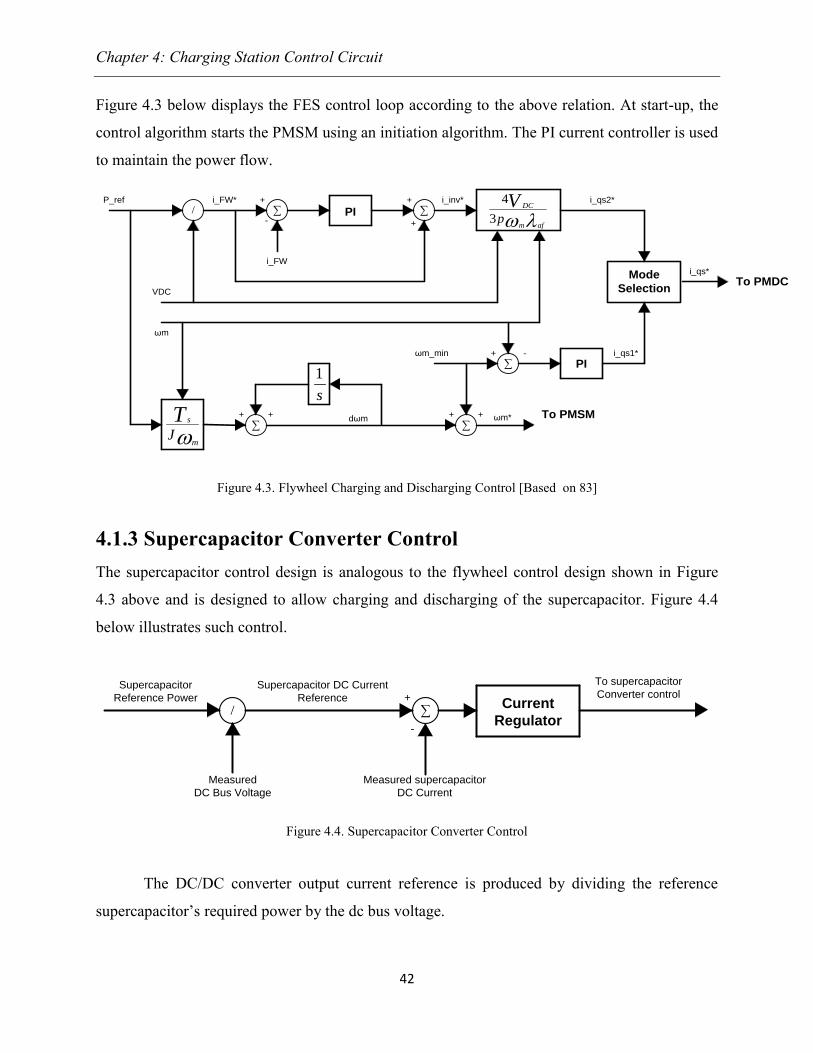
Chapter 4: Charging Station Control Circuit
42
Figure 4.3 below displays the FES control loop according to the above relation. At start-up, the
control algorithm starts the PMSM using an initiation algorithm. The PI current controller is used
to maintain the power flow.
PI/1
P_ref
∑+
-
1
i_FW*
i_FW
1
1 ∑+
+
1
i_inv*
1
1
Mode
Selection
1
i_qs*
1 To PMDC
PI
1
i_qs1*
∑+ -
1
ωm_min
1
∑
1
1
To PMSMωm*
1
+ +
1
1 1
VDC
1
∑
1
1
1
+ + dωm
1
1
ωm
i_qs2*
afm
DC
p
V3
4
m
s
J
Ts
1
Figure 4.3. Flywheel Charging and Discharging Control [Based on 83]
4.1.3 Supercapacitor Converter Control
The supercapacitor control design is analogous to the flywheel control design shown in Figure
4.3 above and is designed to allow charging and discharging of the supercapacitor. Figure 4.4
below illustrates such control.
Current
Regulator/
1
∑
1
Supercapacitor
Reference Power
Measured
DC Bus Voltage
Supercapacitor DC Current
Reference
Measured supercapacitor
DC Current
To supercapacitor
Converter control
1 1 11
+
-
Figure 4.4. Supercapacitor Converter Control
The DC/DC converter output current reference is produced by dividing the reference
supercapacitor’s required power by the dc bus voltage.

Chapter 4: Charging Station Control Circuit
43
The error in current is then fed to a PI current regulator in order to maintain the power
flow between the charger dc bus and the supercapacitor. Finally the regulator output will be
directed to the supercapacitor control scheme. The mode of operation (charging or discharging
mode) depends on the sign of the supercapacitor’s reference power.
4.1.4 Charging Station Output Converter Control
The control scheme of the output converter is very similar to the grid converter control, and is
presented in Figure 4.5 below. It is composed of two nested control loops:
The outer control loop is designed for voltage regulation. The error between the battery
nominal reference voltage and the measured battery charging voltage is fed to a PI controller,
whose output is the battery charging current reference.
The inner loop regulates the battery charging current. The reference here is the output of
the previous outer loop. The error between the reference and the measured current is also fed to a
PI controller whose output is sent to the charging station output converter control scheme.
∑∑
PHEV Battery
Current Reference To output converter
PWM control
11
11
+
-
1
Voltage
RegulatorCurrent
Regulator
1
PHEV Battery
Voltage Reference
1
Measured PHEV
Battery Current
Measured PHEV
Battery Voltage
+
-
Figure 4.5. Charging Station Output Converter Control

Chapter 4: Charging Station Control Circuit
44
4.2 Control Circuit Design
This section presents an algorithm that combines the previous individual controls in such that it
minimizes the PHEV battery charging duration.
4.2.1 Charging Station Central Control
A charging station cycle is composed of a PHEV battery charging period (two phases) that does
not exceed 15 minutes, followed by a period (one phase) during which the storage devices are
fully recharged, which lasts a maximum of 7.5 minutes. This is demonstrated in Figure 4.6.
Station Cycle
PHEV Battery
Charging Period
Waiting Period
(PHASE 3)
Max: 7.5 min
Grid + FES
(PHASE 1)
Max: 10 min
Supercapacitor
(PHASE 2)
Max: 5 min
11
11
Figure 4.6. Schematic Diagram of the Charging Station Cycles
More details on the three phases will be provided in the next chapter.
4.2.2 Central Control Algorithm
In order to obtain the requirements of Figure 4.6, the algorithm of Figure 4.7 below is proposed.
Table 4.1 displays the abbreviations used in the flowchart in Figure 4.7. Blue and red instructions
indicate whether energy is being transferred from the charger to the battery, or from the grid to
the storage devices (to recharge them), respectively.
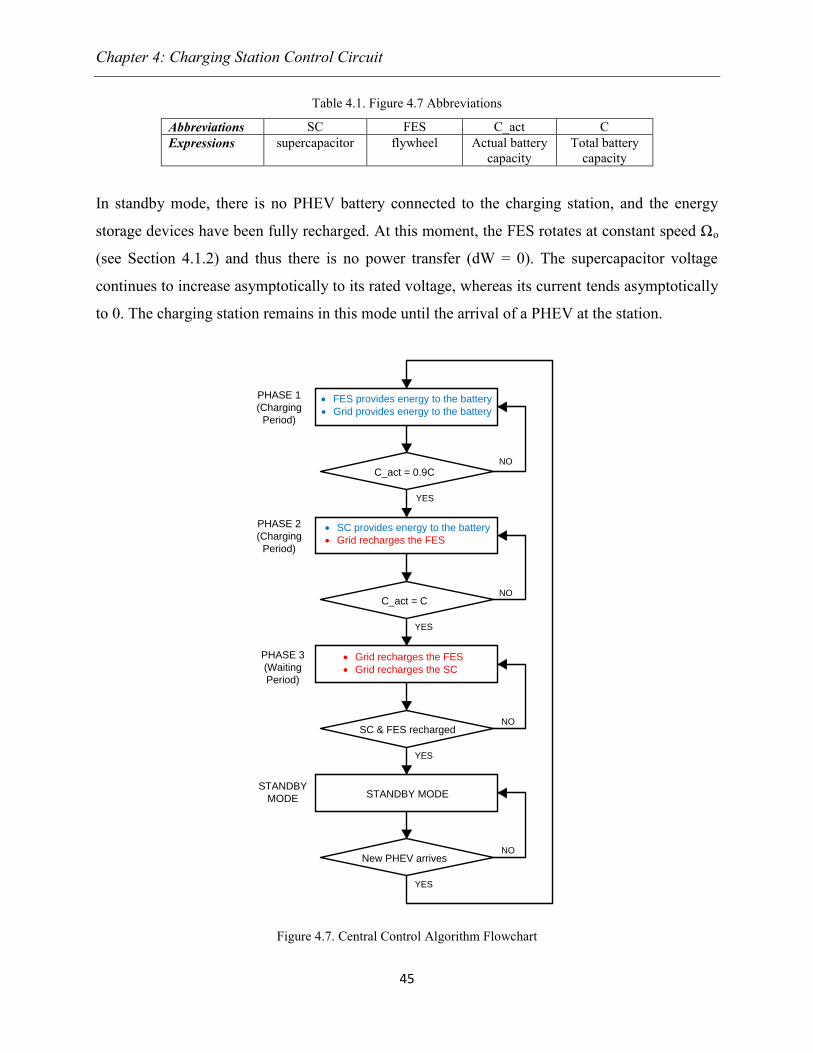
Chapter 4: Charging Station Control Circuit
45
Table 4.1. Figure 4.7 Abbreviations
Abbreviations SC FES C_act C
Expressions supercapacitor flywheel Actual battery
capacity
Total battery
capacity
In standby mode, there is no PHEV battery connected to the charging station, and the energy
storage devices have been fully recharged. At this moment, the FES rotates at constant speed Ωo
(see Section 4.1.2) and thus there is no power transfer (dW = 0). The supercapacitor voltage
continues to increase asymptotically to its rated voltage, whereas its current tends asymptotically
to 0. The charging station remains in this mode until the arrival of a PHEV at the station.
FES provides energy to the battery
Grid provides energy to the battery
C_act = 0.9C
SC provides energy to the battery
Grid recharges the FES
C_act = C
Grid recharges the FES
Grid recharges the SC
SC & FES recharged
STANDBY MODE
New PHEV arrives
1
NO
1
1
YES
1
1
1
1
1
11
1
NO
NO
NO
YES
YES
YES
1
PHASE 1
(Charging
Period)
PHASE 2
(Charging
Period)
PHASE 3
(Waiting
Period)
STANDBY
MODE
Figure 4.7. Central Control Algorithm Flowchart

Chapter 5: Charging Station Operation
46
CHAPTER 5
Charging Station Operation
The charging station operates as described in the flowchart shown in Figure 4.7. The energy
management of the energy sources is done via optimization; the topic of this chapter. Two
examples will be used to illustrate such operation.
5.1 Charging Time Minimization
The charging station is designed to minimize the PHEV battery charging time and required
duration to recharge the storage devices. This requires an effective management strategy of the
charging stations’ energy sources: grid, supercapacitor, and FES.
5.1.1 Charging Station Cycle
As mentioned previously, a charging station cycle is composed of three phases. The order of
Phases 1 and 2 has been established by considering the fact that some PHEV users may have a
limited amount of time to spend at the charging station; for this reason, most of the PHEV
battery charging is done in the beginning of the cycle (Phase 1). The maximum duration of each
phase has been determined by optimization (further details on the order of the charging durations
of the FES and supercapacitor were provided in section 2.3.2).
Phase 1: The FES and the electrical grid provide energy to the PHEV battery until it
reaches 90% of its required capacity. The maximum duration of this phase is 10 minutes.
Phase 2: While the supercapacitor provides energy to the PHEV battery until it reaches its
required capacity, the electrical grid is recharging the FES with a capacity determined by
optimization (described in Section 5.1.3). The maximum duration of this phase is 5
minutes.
Phase 3: During this phase, which lasts no more than 7.5 minutes, the electrical grid is
recharging the supercapacitor and the FES to their respective full capacities. It is also
called the “waiting period” because, during this time, no PHEV battery is allowed to be
connected to the charging station.

Chapter 5: Charging Station Operation
47
Once the storage devices are fully recharged, the charging station enters its standby mode until
another PHEV arrives at the charging station to recharge its battery. Examples of the system
operation are provided in Section 5.2.
5.1.2 Problem Formulation
A charging station cycle is graphically represented in Figure 5.1, where:
Blue and red colors indicate whether energy is being transferred from the charger to the
battery, or from the grid to the storage devices (to recharge them), respectively.
Positive and negative quantities indicate whether energy is being delivered or absorbed
by the device, respectively.
P and C denote the grid power and the PHEV battery capacity, respectively.
11
11
1
11 11 11
Phase 1 (Δt1) Phase 2 (Δt2) Phase 3 (Δt3)
1 111
Battery Charging Period Waiting Period
Time
Time
Time
Time
Grid
SC
FES
Battery
Power (kW)
P.Δt1 P.Δt2 P.Δt3
0.1C
C_FES_P1
-0.1C
-C_FES_P3
-P.Δt2
-0.1C-0.9C
P
Figure 5.1. Detailed Charging Station Cycle

Chapter 5: Charging Station Operation
48
While the grid provides 5 kWh of the maximum charging station output energy of 11.25 kWh
(see Table 2.3) during Phase 1, the storage devices provide the remaining 6.25 kWh as follows:
1.125 kWh is provided from the supercapacitor during Phase 2, and 5.125 kWh is provided from
the FES during Phase 1.
The choice of such proportions is in accordance with the station’s storage devices characteristics
(see Section 2.3.2): the supercapacitor is in operation for a relatively small period (maximum of
5 minutes) compared to the FES operation duration (maximum 10 minutes).
Once a PHEV arrives at the charging station, the parameters in Figure 5.1 that need to be
computed are listed in Table 5.1 below.
Table 5.1. Optimization Parameters
Parameter
Name
Phase 1 Duration
(min)
Phase 2 Duration
(min)
Phase 3 Duration
(min)
FES capacity in
phase 1 (kWh)
FES capacity in
phase 3 (kWh)
Symbolic
Notation
Δt1 Δt2 Δt3 CFES-P1 CFES-P3
Variable
Maximum
10 5 7.5 5.125 5.125
The problem can be written as:
min f(x) =
with x = (5.1)
The constraints imposed on such function are of equality and inequality types. They can be easily
visualized in Figure 5.1.
Since the supercapacitor’s capacity is smaller than the capacity of the FES, the duration
of Phase 2 must be smaller than the duration of Phase 1:
Δt2 < Δt1 (5.2)
The waiting period must never exceed the charging period, because the waiting time must
be minimized to satisfy the clients’ needs.
Δt3 < Δt1 + Δt2 (5.3)
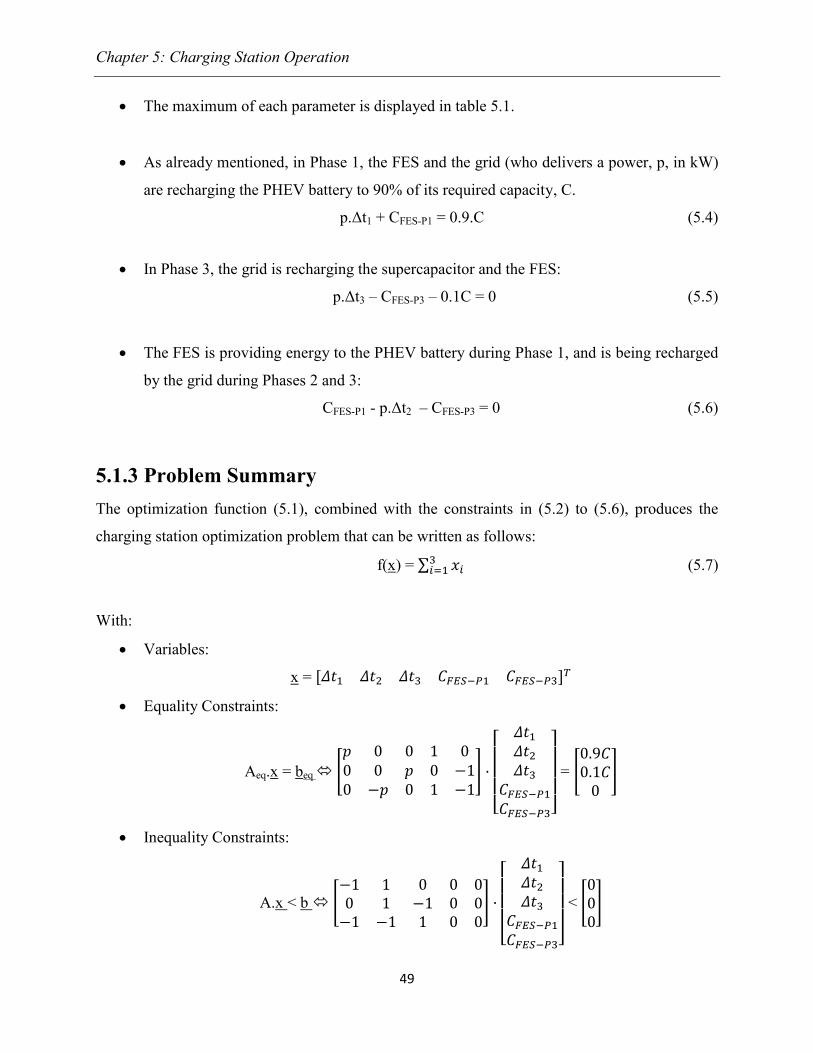
Chapter 5: Charging Station Operation
49
The maximum of each parameter is displayed in table 5.1.
As already mentioned, in Phase 1, the FES and the grid (who delivers a power, p, in kW)
are recharging the PHEV battery to 90% of its required capacity, C.
p.Δt1 + CFES-P1 = 0.9.C (5.4)
In Phase 3, the grid is recharging the supercapacitor and the FES:
p.Δt3 – CFES-P3 – 0.1C = 0 (5.5)
The FES is providing energy to the PHEV battery during Phase 1, and is being recharged
by the grid during Phases 2 and 3:
CFES-P1 - p.Δt2 – CFES-P3 = 0 (5.6)
5.1.3 Problem Summary
The optimization function (5.1), combined with the constraints in (5.2) to (5.6), produces the
charging station optimization problem that can be written as follows:
f(x) = (5.7)
With:
Variables:
x =
Equality Constraints:
Aeq.x = beq
=
Inequality Constraints:
A.x < b
<

Chapter 5: Charging Station Operation
50
Lower and Upper Bounds:
lb < x < up
<
<
5.2 Charging Station Operation
The charging station operates as shown in the flowchart of Figure 4.7.
Energy management parameters are given in tables 5.3, 5.5A, and 5.5B, where:
Blue and red numbers indicate whether energy is being transferred from the charger to
the battery, or from the grid to the storage devices (to recharge them), respectively.
Positive and negative quantities indicate whether energy is being delivered or absorbed
by the device, respectively.
The following battery charging characteristics are displayed in Figures 5.2 and 5.4:
Battery SOC (in %)
Battery current (in A)
Battery voltage (in V)
The following charger characteristics are displayed in Figures 5.3 and 5.5:
FES speed (in rad/s)
Grid current (in A)
FES current (in A)
Supercapacitor current (in A)
Total current (in A): The sum of the grid, FES, and supercapacitor currents
Supercapacitor voltage (in V)
5.2.1 Charging of a Single PHEV Battery
This scenario considers a single PHEV battery being recharged by the charging station. Its
technical specifications are presented below:

Chapter 5: Charging Station Operation
51
Table 5.2. PHEV Battery Specifications
Total Battery
Capacity
(kWh)
Battery Initial
& Final
SOCs (%)
Required
Battery
Capacity
(kWh)
Battery
Nominal
Voltage (V)
Battery
Maximum
Charging
Voltage (V)
Battery
Minimum
Charging
Voltage (V)
Battery
Maximum
Charging
Current (A)
12 20 to 95 9.75 200 233.2 166.5 300
The energy management that will minimize the charging phase duration and the waiting phase
duration for this PHEV battery is displayed in Table 5.2 below.
Table 5.3. Charger Energy Management for the PHEV Battery
Complete Cycle
Total
Charging Period Waiting Period
Phase 1 Phase 2 Phase 3
Duration (min) 10 4 4 18
Grid Energy (kWh) 5 2 2 9
SC Energy (kWh) 0 0.9 -0.9 0
FES Energy (kWh) 3.1 -2 -1.1 0
Battery Energy (kWh) -8.1 -0.9 0 9
The evolution of the PHEV battery parameters are displayed in Figure 5.2.
Figure 5.2. PHEV Battery Characteristics Evolution
0 2 4 6 8 10 12 140
50
100Battery State of Charge (SOC in %)
0 2 4 6 8 10 12 140
200
400Battery Current (in A)
0 2 4 6 8 10 12 14150
200
250Battery Voltage (in V)
time in min
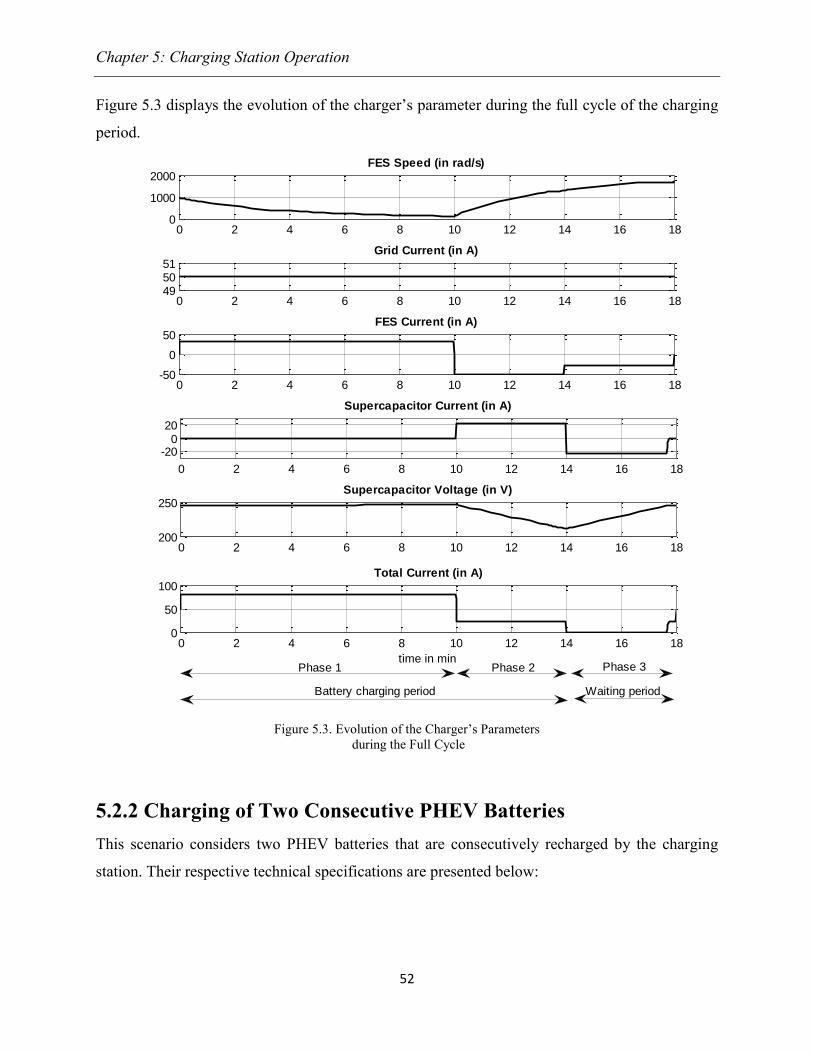
Chapter 5: Charging Station Operation
52
Figure 5.3 displays the evolution of the charger’s parameter during the full cycle of the charging
period.
Figure 5.3. Evolution of the Charger’s Parameters
during the Full Cycle
5.2.2 Charging of Two Consecutive PHEV Batteries
This scenario considers two PHEV batteries that are consecutively recharged by the charging
station. Their respective technical specifications are presented below:
0 2 4 6 8 10 12 14 16 18495051
Grid Current (in A)
0 2 4 6 8 10 12 14 16 18-50
0
50FES Current (in A)
0 2 4 6 8 10 12 14 16 18
-200
20
Supercapacitor Current (in A)
0 2 4 6 8 10 12 14 16 18200
250Supercapacitor Voltage (in V)
0 2 4 6 8 10 12 14 16 180
50
100Total Current (in A)
time in min
0 2 4 6 8 10 12 14 16 180
1000
2000FES Speed (in rad/s)
Phase 1 Phase 2 Phase 3
Battery charging period Waiting period
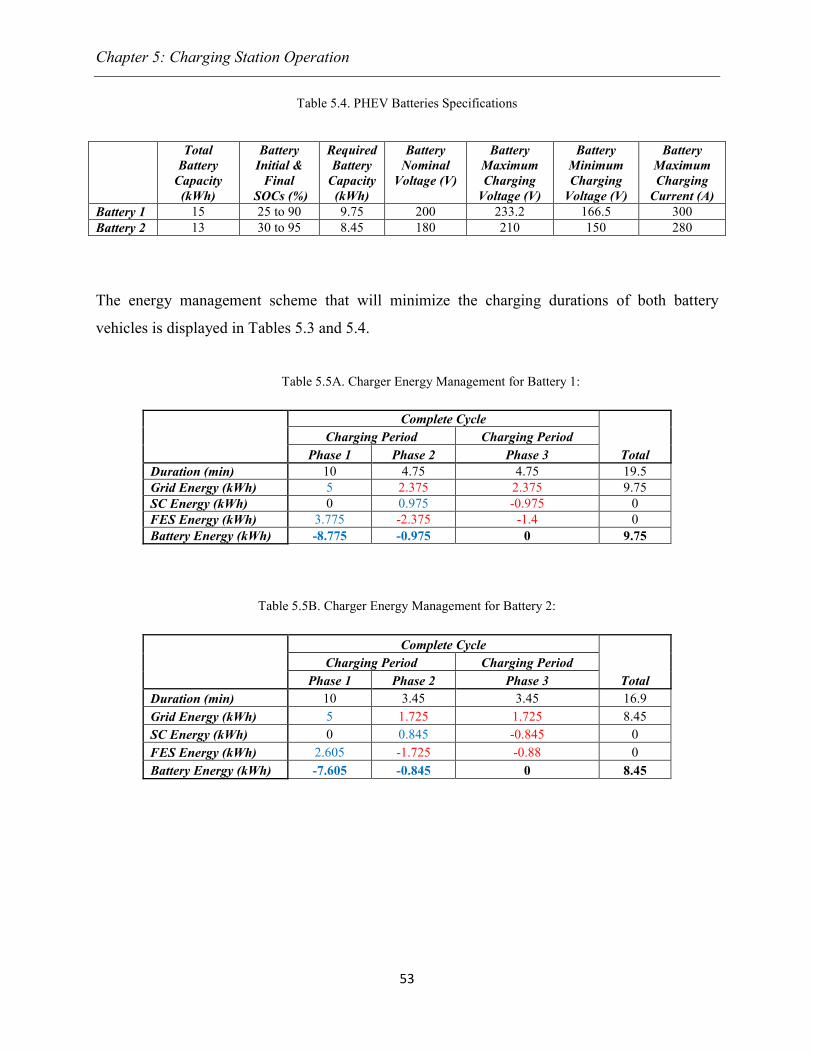
Chapter 5: Charging Station Operation
53
Table 5.4. PHEV Batteries Specifications
Total
Battery
Capacity
(kWh)
Battery
Initial &
Final
SOCs (%)
Required
Battery
Capacity
(kWh)
Battery
Nominal
Voltage (V)
Battery
Maximum
Charging
Voltage (V)
Battery
Minimum
Charging
Voltage (V)
Battery
Maximum
Charging
Current (A)
Battery 1 15 25 to 90 9.75 200 233.2 166.5 300
Battery 2 13 30 to 95 8.45 180 210 150 280
The energy management scheme that will minimize the charging durations of both battery
vehicles is displayed in Tables 5.3 and 5.4.
Table 5.5A. Charger Energy Management for Battery 1:
Complete Cycle
Total
Charging Period Charging Period
Phase 1 Phase 2 Phase 3
Duration (min) 10 4.75 4.75 19.5
Grid Energy (kWh) 5 2.375 2.375 9.75
SC Energy (kWh) 0 0.975 -0.975 0
FES Energy (kWh) 3.775 -2.375 -1.4 0
Battery Energy (kWh) -8.775 -0.975 0 9.75
Table 5.5B. Charger Energy Management for Battery 2:
Complete Cycle
Total
Charging Period Charging Period
Phase 1 Phase 2 Phase 3
Duration (min) 10 3.45 3.45 16.9
Grid Energy (kWh) 5 1.725 1.725 8.45
SC Energy (kWh) 0 0.845 -0.845 0
FES Energy (kWh) 2.605 -1.725 -0.88 0
Battery Energy (kWh) -7.605 -0.845 0 8.45
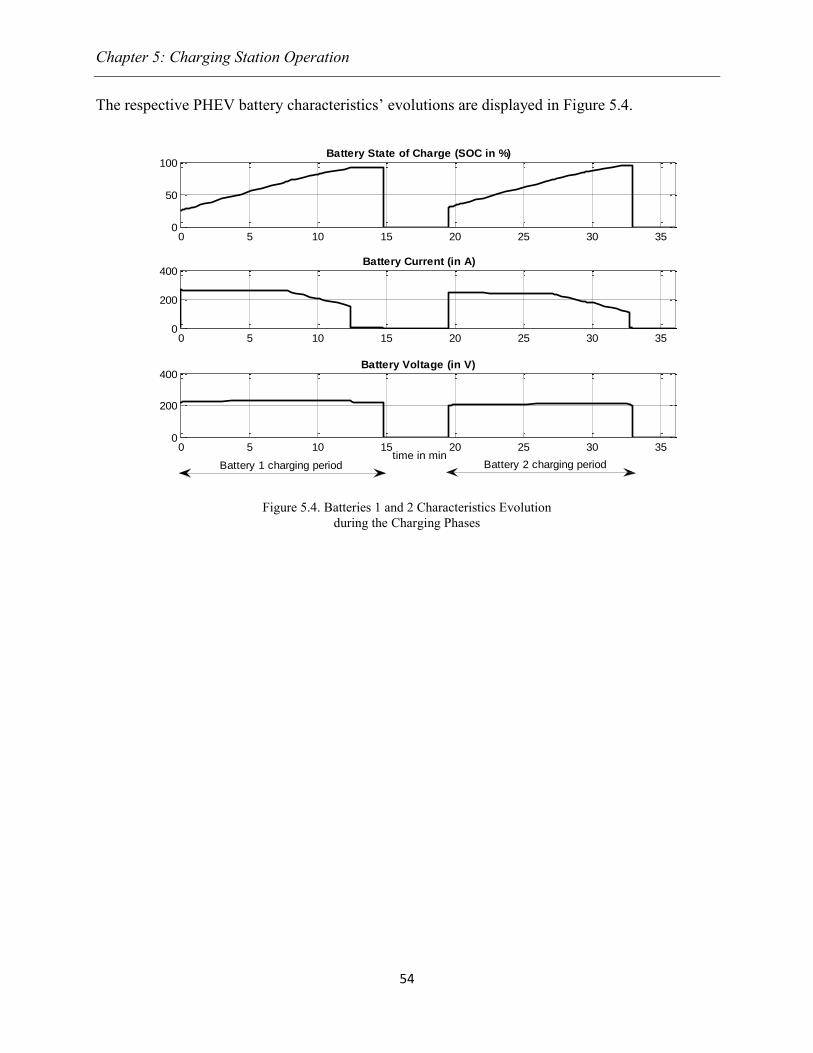
Chapter 5: Charging Station Operation
54
The respective PHEV battery characteristics’ evolutions are displayed in Figure 5.4.
Figure 5.4. Batteries 1 and 2 Characteristics Evolution
during the Charging Phases
0 5 10 15 20 25 30 350
50
100Battery State of Charge (SOC in %)
0 5 10 15 20 25 30 350
200
400Battery Current (in A)
0 5 10 15 20 25 30 350
200
400Battery Voltage (in V)
time in minBattery 1 charging period Battery 2 charging period
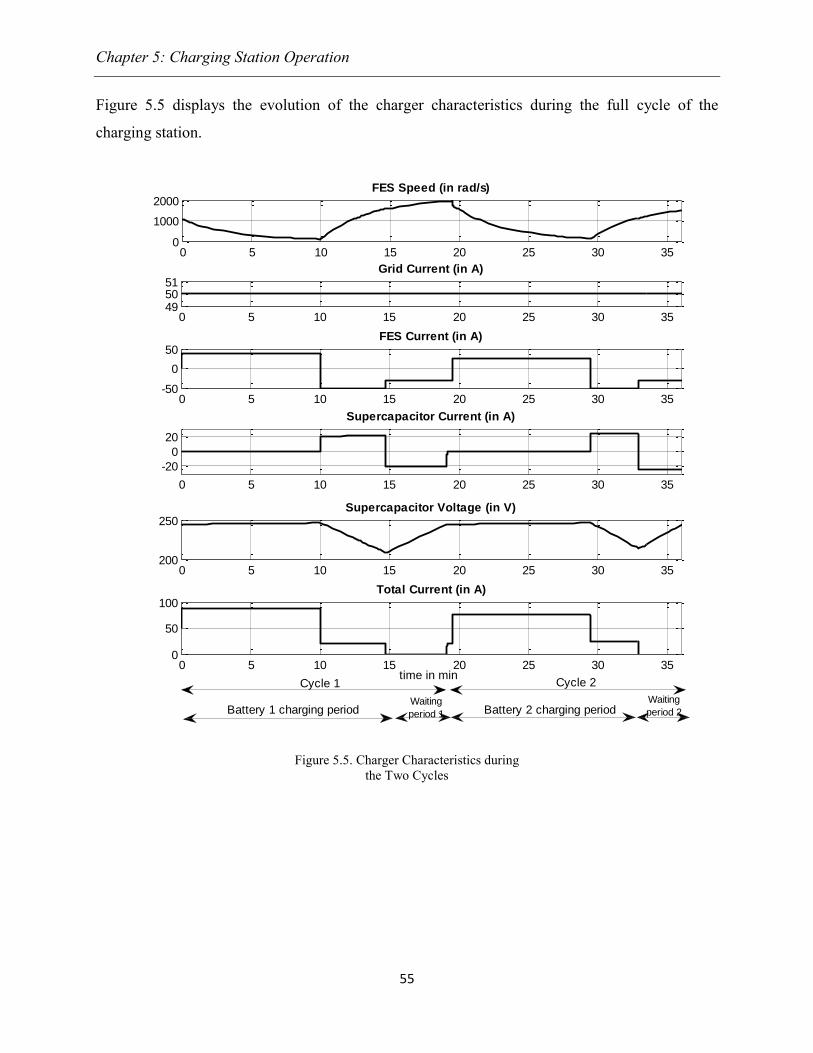
Chapter 5: Charging Station Operation
55
Figure 5.5 displays the evolution of the charger characteristics during the full cycle of the
charging station.
Figure 5.5. Charger Characteristics during
the Two Cycles
0 5 10 15 20 25 30 35495051
Grid Current (in A)
0 5 10 15 20 25 30 35-50
0
50FES Current (in A)
0 5 10 15 20 25 30 35
-20
0
20
Supercapacitor Current (in A)
0 5 10 15 20 25 30 35200
250Supercapacitor Voltage (in V)
0 5 10 15 20 25 30 350
50
100Total Current (in A)
time in min
0 5 10 15 20 25 30 350
1000
2000FES Speed (in rad/s)
Cycle 2Cycle 1
Waiting
period 2Battery 2 charging periodWaiting
period 1Battery 1 charging period
Chapter 6: Conclusion
56
CHAPTER 6 Conclusion
This chapter presents a summary of the work conducted in the research, and lists some
recommendations for future work to be done on this topic.
6.1 Summary
In this thesis, the basic configuration used for the design of the fast charging station (including
energy requirements and storage devices choice) has been described, the different power
electronic interfaces have been designed, and the individual control schemes of each converter as
well as the control and proposed algorithm of the whole charging station have been presented.
Afterwards the charging station operation has been simulated with two scenarios: the charging
process of a single PHEV battery, and two consecutive PHEV batteries.
6.2 Conclusions
In this thesis, the design and simulation of a fast-charging station for PHEV batteries has been
developed. The combination of a flywheel and a supercapacitor as additional stationary storage
devices is an excellent option since it inherently has four advantages: high energy density, high
power density, charging and discharging times in the order of minutes, and environmentally
friendly. The developed algorithm efficiently manages the three station energy sources, and
allows the charging of PHEV batteries whose capacities are below 15 kWh in a maximum
duration of 15 minutes from 20% to 95% of their state-of-charge, and maximizes the waiting
time (to recharge the storage devices) to 7.5 minutes when no PHEV is present at the station.
Afterwards the station enters the standby mode, where the supercapacitor voltage remains
constant and its current tends asymptotically to zero, while the flywheel rotates at constant speed.
The reduction of the duration of the charging station operation will accelerate the battery
recharging process in a battery swapping scheme.

Chapter 6: Conclusion
57
6.3 Recommendations for Future Work
While a general control algorithm has been developed in this research to minimize the battery
charging time and the duration required to charge the storage devices, more research could be
conducted on the following topics:
Optimization of the combination of flywheel and supercapacitor in terms of energy and
power sizing.
Impact of the battery charger on the power quality of the electric grid supply.
Design of more efficient converter systems for the flywheel and supercapacitor charging
schemes.

58
REFERENCES
[1] S.G. Wirasingha, A. Emadi, “Pihef: Plug-in Hybrid electric factor,” in Proc. 2009 IEEE
VPPC’09 Conf., pp. 661-668.
[2] L. Dickerman, J. Harrison, "A new car, a new grid," IEEE Trans. Power & Energy, vol. 8,
pp. 58-59, Apr. 2010
[3] Electric Vehicle Conductive Charge Coupler, SAE J1772, Recommended Practice, Draft
Document in progress, 2009
[4] “Better Place partners to bring electric vehicles to Australia,” Better Place. 2009 [Online].
Available: http://australia.betterplace.com/
[5] David Ehrlich, “The Electric Car Charging Startup Takes on its Biggest Project to Date.”
Better Place to Charge up Australia 2008. [Online] Available:
http//cleantech.com/news/3761/batter-place-charge-Australia
[6] The Associated Press, “GM Unveils Volt Electric Car.” CBC.ca 2008. [Online].
Available: http://www.cbc.ca/technology/story/2008/09/17GM-Volt.html
[7] J. Zhoua, P. Notten, "Studies on the degradation of Li-ion batteries by the use of micro
reference electrodes," IEEE Trans. Power Sources, no. 177, p. 553-560, Nov. 2007.
[8] “PHEVs Going International: Europe's Avere Conference” CalCars The California Cars
Initiative – 100+ MPG Hybrids. [Online]. Available: http://www.calcars.org/calcars-
news/769.html
[9] “Mitsubishi EV Fast Recharge Station Open to Public” Euro DB Automotive. [Online].
Available: http://www.eurodb.com.au/New-used-car-review/mitsubishi/mitsubishi-ev-fast-
recharge-station-open-to-public/
[10] “Electric Vehicle Fast Chargers - Level 3” BTCPower. [Online]. Available:
http://www.btcpower.com/products-and-applications/electric-vehicle-chargers-level-3/
[11] “Powering Transportation with Renewable Energy Sources” Eco-Trans Alliance. [Online].
Available: http://www.ecotransalliance.com/ev-phev-chargers.html.
[12] “European Car of the Year – 2011” Nissan. [Online]. Available:
http://www.nissan.ca/vehicles/ms/leaf/en/blog.aspx?item=0&title=European Car of The
Year - 2011
[13] H. Oman, "Making battery last longer," in IEEE Trans. AES System vol. 14, pp. 19-21,
Sep. 1999.
59
[14] B. Dickinson and J. Gill, “Issues and benefits with fast charging industrial batteries,” in
Proc. 2000 IEEE Battery Conference on Applications and Advances, pp. 223-229.
[15] P. Cheng and C. Chen, “A high-efficiency fast charger for lead-acid batteries,” in Proc.
2002 IEEE IECON 02, pp. 1410-1415.
[16] J. Alvarez, J. Marcos, A. Lago, A. Nogueiras, J. Doval and C. M. Peiialver, “A fully digital
smart and fast lead-acid battery charge system,” in Proc. 2003 IEEE Power Electronics
Specialists Conf., pp. 913-917.
[17] The Plug Standard Needed For Electric Car-Charging Cord Interface: SAE J1772, SAE
J1772 Standard, Apr. 2009. [Online]. Available: http://gm-volt.com/2009/04/16/plug-
standard-needed-for-electric-car-charging-cord-interface-sae-j1772/.
[18] A. Rufer, “Today and tomorrow’s meaning of power electronics within the grid
interconnection,” in Proc. 2007 IEEE Power Electronics and Applications Conf., pp. 1-11.
[19] N. Mohan, Tore M. Undeland, William P. Robbins, “Classification of Power Processors and
Converters,” in Power Electronics Converters, Applications, and Design. 3rd
Ed., USA,
2002, p. 29.
[20] A. Benaboud, A. Rufer, “A flexible, high efficiency, VSI-based HVDC transmission system
with reduced harmonics,” in Proc. 2008 IEEE Power Electronics Specialists Conf., pp.
4117-4123.
[21] Y. Lee, A. Khaligh, A. Emadi, "Advanced integrated bidirectional AC/DC and DC/DC
converter for plug-in hybrid electric vehicles," IEEE Trans. Vehicular Technology, vol. 58,
pp. 3970-3980, Jul. 2009
[22] Z. Amjadi, and S. S. Williamson, “Power-electronics-based solutions for plug-in hybrid
electric vehicle energy storage and management systems,” IEEE Trans. Industrial
Electronics, vol. 57, pp. 608-616, Feb. 2010.
[23] Y. Hu, J. Tatler, Z. Chen “A bi-directional DC/DC power electronic converter for an energy
storage device in an autonomous power system,” presented at the Power Electronics and
Motion Control Conference, 2004.
[24] L. Fleischli, S. Lemofouet, A. Rufer, “Multichannel DC/DC converter’s efficiency
optimization by variable number of active channels,” in Proc. 2006 IEEE Industrial
Electronics Conf., pp. 2581-2586.
[25] B. Destraz, Y. Louvrier, A. Rufer: “High efficient interleaved multi-channel DC/DC
converter dedicated to mobile applications,” in Proc. 2006 IEEE Industry Applications
Conf., pp. 2518-2523.
[26] R. Li, A. Pottharst, N. Frohleke, J. Bocker, “Analysis and design of improved isolated full-
bridge bi-directional DC/DC converter,” in Proc. 2004 IEEE Power Electronics Specialists
Conf., pp. 521-526.
60
[27] Ronald J. Parise, “Quick charge battery with internal thermal management,” in Proc. 2000
IEEE Energy Conversion Engineering Conf., pp. 120-127.
[28] H. Yoo, S. Seung-Ki, Y. Park, J. Jeong, "System integration and power-flow management
for a series hybrid electric vehicle using supercapacitors and batteries," IEEE Trans.
Industry Applications, vol. 44, pp. 108-114, Jan-Feb. 2008
[29] T. Ai, T. Liang, J. Chen, “A hybrid switching method for thermal management in full-
bridge inverter,” in Proc. 2001 IEEE Power Electronics and Drive Systems Conf., pp. 633-
637.
[30] X. Zhou, G. Wang, S. Lukic, S. Bhattacharya, and A. Huang, “Multi-function bi-directional
battery charger for plug-in hybrid electric vehicle application,” in Proc. 2009 IEEE Energy
Conversion Congress and Exposition., pp. 3930-3936.
[31] X. Zhou, S. Lukic, S. Bhattacharya, A. Huang, “Design and control of grid-connected
converter in bi-directional battery charger for plug-in hybrid electric vehicle application,” in
Proc. 2009 IEEE VPPC’09, pp. 1716-1721.
[32] F. Koyanagi, R. Yokohama, “Monte Carlo simulation on the demand impact by quick
chargers for electric vehicles,” in Proc. 1999 IEEE Power Engineering Society Summer
Meeting, pp. 1031-1036.
[33] L. Kelly and A. Rowe, and P. Wild, “Analyzing the impacts of plug-in electric vehicles on
distribution networks in British Columbia,” in Proc. 2009 IEEE EPEC’09, pp. 1-6.
[34] S.H. Berisha, G. Karady, R. Ahmad, R. Hobbs, and D. Karner, “Current harmonics
generated by electric vehicle battery chargers,” in Proc. 1996 IEEE International
Conference on Power Electronics, Drives, and Energy Systems for Industrial Growth, pp.
584-589.
[35] M. Basu, K. Gaughan, and E. Coyle, “Harmonic distortion caused by EV battery chargers in
the distribution systems network and its remedy,” in Proc. 2004 IEEE International
Universities Power Engineering Conference (UPEC), pp. 869-873.
[36] J. C. Gomez and M. Morcos, “Impact of EV battery chargers on the power quality of
distribution systems,” IEEE Trans. Power Delivery, vol. 18, pp. 975-981, Jul. 2003.
[37] O. Onar and A. Khaligh, “Grid interactions and stability analysis of distribution power
network with high penetration of plug-in hybrid electric vehicles,” in Proc. 2010 IEEE
Applied Power Electronics Conference and Exposition (APEC), pp. 1755-1762.
[38] C. Martinez, C. Abbey, and G. Joos, “Bidirectional battery chargers for plug-in hybrid
electric vehicles,” presented at the Conference on Power Systems, Winnipeg, Canada, 2008.
[39] G. Joos, M. El Chehaly, C. Martinez, “Advantages and applications of Vehicle-to-Grid
mode of operation in plug-in hybrid electric vehicles,” in Proc. 2009 IEEE EPEC’09, pp. 1-
6.

61
[40] C. Moreira, "MicroGrids and Electric Vehicles," in INESCPORTO Instituto de Engenharia
de Sistemas E Computadores Do Porto Laboratorio Associado, Sept 18, 2009
[41] A. Giumento, A. Maitra and W. Kook, “Evaluation of PEV loading characteristics on
Hydro-Québec's distribution system operations,” presented at the EVS24 International
Battery, Hybrid and Fuel Cell Electric Vehicle Symposium, Stavanger, Norway, 2009
[42] G. Joos, M. Dubois, “Integration of PHEVs and EVs: experience from Canada,” in Proc.
2010 IEEE Power and Energy Society General Meeting, pp. 1-5.
[43] A. Tsang, “Identifying PEV early adopters and their needs”, presented at the PHEV’09
Conference, Montreal, Canada, 2009.
[44] J. Taylor, A. Maitra, M. Alexander, D. Brooks, M. Duvall, “Evaluation of the impact of
PEV loading on distribution system operations,” presented at the IEEE Power Engineering
Society Conference, Calgary, Canada, 2009
[45] MIT Electric Vehicle team, “A Guide to Understanding Battery Specifications,” Dec 2008.
[Online]. Available: http://web.mit.edu/evt/summary_battery_specifications.pdf
[46] J. Daily, K.M. Abraham, R. Plivelich, J. Landi, and M. Klein, “Electro energy bipolar wafer
cell battery technology for PHEV applications,” in Proc. 2007 IEEE VPPC’07, pp. 336-343.
[47] N.R. Pinsky, J.C. Argueta, T.J. Knipe, V.L. Grosvenor, L.A. Gaillac, M.H. Merchant, A.
Cabrera, “Fast charge of lead acid batteries at the SCE EV Tech Center: battery
specifications and test equipment,” in Proc. 2000 IEEE Battery Conference on Applications
and Advances, pp. 231-236.
[48] M. Dubois, "Plug-in hybrid and electric vehicles" in PHEV-Québec Test Program: A real-
World test study on financial, technological and social aspects of PHEVs, Sept 28-30 2009.
[Online]. Available: http://www.emc-mec.ca/phev/Presentations_en/S05/PHEV09-S05-
3_MaximeDubois.pdf
[49] J. Boyes, N. Clark, “Technologies for energy storage flywheels and superconducting
magnetic energy storage,” in Proc. 2000 IEEE Power Engineering Society Summer Meeting,
pp. 1548-1550.
[50] H.Y. Ayoub, D.L. Milanez, “New approaches to ideal inductors stored energy nature,” in
Proc. 1998 IEEE Circuits and Systems Symposium, pp. 199-202.
[51] Y.M Eyssa, R.W. Boom, G.E. McIntosh, and Q. Li, “A 100 kW energy storage coil for
space application,” IEEE Tran. Magnetics, vol. 19, pp. 1081-1085, May. 1983
[52] B. Johnson, J. Law, and G. Swa “Using a superconducting magnetic energy storage coil to
improve efficiency of a gas turbine powered high speed rail locomotive” IEEE Trans.
Applied Superconductivity, vol. 11, pp. 1900-1903, Mar. 2001
[53] M. Jufer, “Electric drive system for automatic guided vehicles using contact-free energy
coils transmission,” in Proc. 2008 IEEE Power Electronics and Motion Control Conf., pp.
1-6.
62
[54] Mohd H. Ali, T. Murata, and T. Tamura, “A fuzzy logic-controlled Superconducting
Magnetic Energy Storage (SMES) unit for augmentation of transient stability,” in Proc.
2005 IEEE Power Electronics and Drives Systems International Conf., pp. 1566-1571.
[55] E. van Dijk, J.A Ferreira, P. van Gelder, “A method to charge and discharge high current
energy storage coils,” in Proc. 1999 IEEE Industry Applications Conf., pp. 2115-2120.
[56] J. Beno, R. Thompson, R. Hebner, “Flywheel batteries for vehicles,” in Proc. 2002 IEEE
Autonomous Underwater Vehicles, pp. 99-101.
[57] X. FU, X. Xie, “The control strategy of flywheel battery for electric vehicles,” in Proc. 2007
IEEE Control and Automation International Conf., pp. 492-496.
[58] “Investigation on Storage Technologies for Intermittent Renewable Energies: Evaluation
and Recommended R&D Strategy,” Investire-Network, Contract N° ENK5-CT-2000-20336,
Jun. 2003. [Online]. Available: http://www.itpower.co.uk/investire/pdfs/flywheelrep.pdf
[59] J-C. Park, G-H. Choe, “Analysis and design of PWM inverter system for flywheel energy
storage system,” in Proc. 2007 IEEE Power Electronics international Conf., pp. 169-173.
[60] Jack G. Bitterly, “Flywheel technology past, present, and 21st Century projections,” in Proc.
1997 IEEE Energy Conversion Engineering Conf., pp. 2312-2315.
[61] T. Coombs, A.M. Campbell, R. Storey, R. Weller, “Superconducting magnetic bearings for
energy storage flywheels,” IEEE Trans. Applied Superconductivity, vol. 9, pp. 968-971, Jun.
1999.
[62] J-P. Lee, B-J. Park, Y-H. Han, S-Y. Jung, T-H. Sung, “Energy loss by drag force of
superconductor flywheel energy storage system with permanent magnet rotor,” IEEE Trans.
Magnetics, vol. 44, pp. 4397-4400, Nov. 2008.
[63] J. Zou, L. Zhang, J. Song, "Development of the 40 V hybrid super-capacitor unit," IEEE
Trans. Magnetics, vol. 41, pp. 294-298, Jan. 2005.
[64] A. Rufer, “A supercapacitor-based energy-storage system for elevators with soft
commutated interface,” IEEE Trans. Industry Applications, vol. 38, pp. 1151-1159, Sept-
Oct. 2002.
[65] D. Iannuzzi, “Use of supercapacitors, fuel cells and electrochemical batteries for electric
road vehicles: a control strategy,” in Proc. 2007 IEEE Industrial Electronics Society Annual
Conf., pp. 539-544.
[66] “Supercapacitors,” in Illinois Capacitors Inc [Online]. Available:
http://www.illinoiscapacitor.com/uploads/papers_application/72B4ADF9DAD74E4CB7293
DE6F4B62427.pdf
[67] W. L Homme, P. Delarue, P. Barrade, A. Bouscaryol, A. Rufer, “Design and control of a
supercapacitor storage system for traction applications,” in Proc. 2005 IEEE Industry
Applications Conf., pp. 2013-2020.
63
[68] B. Destraz, P. Barrade, A. Rufer, “Power assistance for diesel – electric locomotives with
supercapacitive energy storage,” in Proc. 2004 IEEE Power Electronics Specialists Conf.,
pp. 677-682.
[69] A. Farkas, R. Bonert, “Ultracapacitors as sole energy storage device in hybrid electric cars
?” in Proc. 1994 IEEE Power Electronics in Transportation, pp. 97-101.
[70] A. Rufer, P. Barrade, D. Hotellier, S. Hauser, “Sequential supply for electrical
transportation vehicles: properties of the fast energy transfer between supercapacitive
tanks,” in Proc. 2003 IEEE Industry Applications Conf., 1530-1537.
[71] S. Lemofouet, A. Rufer, “A hybrid energy storage system based on compressed air and
supercapacitors with Maximum Efficiency Point Tracking (MEPT),” IEEE Trans. Industrial
Electronics, vol. 53, pp. 1105-1115, Jun. 2006.
[72] S. Lemofouet, A. Rufer, “Efficiency considerations and measurements of a hybrid energy
storage system based on compressed air and supercapacitors,” in Proc. 2006 IEEE Power
Electronics and Motion Control Conf., pp. 2077-2081.
[73] K. Morrow, D. Karner, J. Francfort, “Plug-in Hybrid Electric Vehicle Charging
Infrastructure Review,” US Department of Energy, Nov. 2008. [Online]. Available:
http://avt.inl.gov/pdf/phev/phevInfrastructureReport08.pdf
[74] B. Barnett, “PHEV Cost Assessment,” May. 2009. [Online] Available:
http://www1.eere.energy.gov/vehiclesandfuels/pdfs/merit_review_2009/energy_storage/es_
02_barnett.pdf
[75] J. Geralds, "PriusPlus History-Battery," Plug-in Hybrid, para. 2, Oct. 09, 2007. [Online].
Available: http://www.eaa-phev.org/wiki/Prius_PHEV_Battery_Options-CalCars
[76] P. Van den Bossche, "The electric vehicle charged by the grid: voltages and power levels,”
Sept 28-30 2009. [Online].
Available:http://www.emc-mec.ca/phev/Presentations_en/S06/PHEV09-
S06.4_PeterVanDerBossche.pdf
[77] “HP 602030 NCA 45 Ah/ 162 Wh Lithium Ion Cell,” Jun, 2006. [Online]. Available:
http://www.gaia-akku.com/fileadmin/user_upload/downloads/cells/45AhHP_NCA.pdf
[78] M. R. Dubois, M. Desjardins, L. Tremblay, “FRESS: Fast Rate Energy Storage System”,
US Patent Application 61/233,664, submitted 13 August 2009.
[79] Bo. Yang, Y. Makarov, J. Desteese, V. Viswanathan, P. Nyeng, B. McManus, and J. Pease,
“On the use of energy storage technologies for regulation services in electric power systems
with significant penetration of wind energy,” in Proc. 2008 IEEE Electricity Market
International Conf., pp. 1-6.
64
[80] O. Stihi, and Boon-Teck Ooi, “A single-phase controlled-current PWM rectifier” IEEE
Trans. Power Electronics, vol. 3, pp. 453-459, Oct. 1998.
[81] S. Samineni, B.K Johnson, H.L Hess, J.D Law, “Modeling and analysis of a flywheel
energy storage system with a power converter interface,” IEEE Trans. Industry
Applications, vol. 42, pp. 42-52, Jan-Feb. 2006.
[82] VYCON, “UPS/POWER QUALITY,” VDC Technology, 2008. [Online].
Available: http://www.vyconenergy.com/pq/VDCtech.htm
[83] B. Vafakhah, M. Masiala, J. Salmon, A. Knight, “Emulation of flywheel energy storage
system with a PMDC machine,” in Proc. 2008 IEEE International Conference on Electrical
Machines, pp. 1-6.
[84] R. Krishnan, Electric Motor Drives: Modeling, Analysis, and Control. Upper Saddle River,
NJ: Prentice Hall, 2001.