design and evaluation of wellbore strengthening …
TRANSCRIPT
DESIGN AND EVALUATION OF WELLBORE STRENGTHENING
MATERIALS FOR FRACTURED RESERVOIRS
A THESIS SUBMITTED TO
THE GRADUATE SCHOOL OF NATURAL AND APPLIED SCIENCES
OF
MIDDLE EAST TECHNICAL UNIVERSITY
BY
UĞUR GARGILI
IN PARTIAL FULFILLMENT OF THE REQUIREMENTS
FOR
THE DEGREE OF MASTER OF SCIENCE
IN
PETROLEUM AND NATURAL GAS ENGINEERING
AUGUST 2019

Approval of the thesis:
DESIGN AND EVALUATION OF WELLBORE STRENGTHENING
MATERIALS FOR FRACTURED RESERVOIRS
submitted by UĞUR GARGILI in partial fulfillment of the requirements for the
degree of Master of Science in Petroleum and Natural Gas Engineering
Department, Middle East Technical University by,
Prof. Dr. Halil Kalıpçılar
Dean, Graduate School of Natural and Applied Sciences
Assoc. Prof. Dr. Çağlar Sınayuç
Head of Department, Petroleum and Natural Gas Eng.
Assist. Prof. Dr. İsmail Durgut
Supervisor, Petroleum and Natural Gas Eng., METU
Examining Committee Members:
Prof. Dr. Serhat Akın
Petroleum and Natural Gas Engineering Dept., METU
Assist. Prof. Dr. İsmail Durgut
Petroleum and Natural Gas Eng., METU
Assoc. Prof. Dr. Gürşat Altun
Petroleum and Natural Gas Engineering Dept., ITU
Date: 28.08.2019

iv
I hereby declare that all information in this document has been obtained and
presented in accordance with academic rules and ethical conduct. I also declare
that, as required by these rules and conduct, I have fully cited and referenced all
material and results that are not original to this work.
Name, Surname:
Signature:
Uğur Gargılı
v
ABSTRACT
DESIGN AND EVALUATION OF WELLBORE STRENGTHENING
MATERIALS FOR FRACTURED RESERVOIRS
Gargılı, Uğur
Master of Science, Petroleum and Natural Gas Engineering
Supervisor: Assist. Prof. Dr. İsmail Durgut
August 2019, 195 pages
The lost circulation is a primary consideration while drilling through fractured
carbonate formations. Uncontrolled lost circulation may result in high nonproductive
drilling time and cost, stuck pipe, side-tracks, blowouts and occasionally, the
abandonment of expensive wells depending upon the severity of the loss.
Additionally, drill solids entering the reservoir as a result of lost circulation may plug
the pore throats, leading to a significant decrease in production.
In the industry, there are two approaches to struggle with loss circulation; to treat
(control and stop) losses after they occur, or alternatively strengthen the loss zones to
prevent losses. Indeed, it has been proved that it is easier and more effective to prevent
occurrence of losses than to attempt to control and stop them once they started.
Preventive method is also known as wellbore strengthening. The method aims to both
alter stresses around wellbore and minimize fluid loss. They are effective not only on
natural fractures but also induced fractures which occurs during drilling.
The objective of this study is to determine optimum concentration and particle size
distribution for fractured reservoir zones. A polymer-based reservoir drill-in fluid
supported by wellbore strengthening materials (WSM) was used in this study. Sized
ground marble (GM) was chosen as a WSM because of its hydrochloric acid solubility
and reservoir non-damaging nature. Sized GM was used as a WSM in different
vi
concentration and in different particle size range. The experiments were conducted by
using Permeability Plugging Apparatus (PPA). Fractured formations were simulated
by using metal slotted disks with fracture width of 400, 800 and 1200 microns. Tests
were conducted at room temperature (about 20 to 25 degrees Celcius). During the
study, a total 269 tests are run to investigate the effect of different particle size
distribution, concentration and fracture width. The results have been compared
according to maximum sealing time required to reach assumed pressure and fluid loss
values, therefore, optimum composition has been determined.
Keywords: Permeability Plugging Apparatus, Slotted Discs, Fractured Formations,
Ground Marble, Wellbore Strengthening Materials

vii
ÖZ
ÇATLAKLI REZERVUARLAR İÇİN KUYU CİDARI GÜÇLENDİRME
MALZEMELERİNİN TASARIMI VE DEĞERLENDİRİLMESİ
Gargılı, Uğur
Yüksek Lisans, Petrol ve Doğal Gaz Mühendisliği
Tez Danışmanı: Dr. Öğr. Üyesi İsmail Durgut
Ağustos 2019, 195 sayfa
Sirkülasyon kaybı, yoğun çatlaklı karbonatlı formasyon sondajlarında öncelikli
düşünülmesi gereken hususlardandır. Kontrol edilemeyen sirkülasyon kaybı; sondajda
yüksek zaman kayıpları ve maliyetleriyle, sondaj dizisi sıkışmalarıyla, kuyuyu
yeniden yönlendirmeyle, kontrolsüz kuyu gelişleriyle ve kayıplarının şiddetine bağlı
olarak kuyu terkedilmesi ile sonuçlanabilir. Bunların yanında, sirkülasyon kaybı
sonucu formasyona katı madde girişi gözenekler arası geçitleri tıkayabilir ve üretimde
gözle görünür bir düşüşe neden olabilir.
Endüstride sirkülasyon kaybı ile mücadele etmek için iki yaklaşım bulunmaktadır;
sirkülasyon kaybı olduktan sonra kontrol altına almak ve durdurmak, ya da
sirkülasyon kaybının gerçekleşebileceği formasyonları kayıpları önlemek amacıyla
güçlendirmek. Nitekim, sirkülasyon kayıplarını gerçekleşmeden engellemenin daha
kolay ve etkili olduğu kanıtlanmıştır.
Sirkülasyon kayıplarını önlemek için kullanılan yöntem kuyu cidarı
güçlendirme(KCG) olarak bilinir. Bu yöntem, hem kuyu cidarında meydana gelen
stresleri değiştirmeyi hem de sıvı kaybını en aza indirmeyi amaçlamaktadır. KCG,
hem doğal çatlaklarda hem de sondaj sırasında oluşan çatlaklarda etkili bir biçimde
uygulanabilir.
viii
Bu çalışma, çatlaklı rezervuar alanları için en uygun derişim ve parçacık boyut
dağılımını belirlemeyi amaçlamaktadır. Bu çalışmada, kuyu cidarı güçlendirme
malzemeleriyle (KCGM) desteklenmiş polimer bazlı rezervuar sondaj sıvıları
kullanılmıştır. Hidroklorik asitteki çözünürlüğü ve rezervuara zarar vermeyen yapısı
nedeniyle boyutlandırılmış doğal mermer KCGM olarak seçilmiştir. Farklı derişim ve
parçacık boyutlarındaki mermerler kullanılmıştır. Deneyler, geçirgenlik tıkama
aygıtında yapılmıştır. Çatlaklı formasyonlar 400, 800 ve 1200 mikron çatlak
genişliğine sahip metal yarıklı diskler kullanılarak benzetimlenmiştir. Testler oda
sıcaklığında (yaklaşık 20-25oC) yapılmıştır. Bu çalışmada parçacık boyut dağılımının,
derişimin ve çatlak genişliğinin etkilerini gözlemlemek için 269 test yapıldı. Sonuçlar
hedeflenen basınca ulaşma süreleri ve sıvı kayıpları değerlerine göre karşılaştırıldı. En
uygun derişim ve parçacık boyut dapılımları belirlendi.
Anahtar Kelimeler: Geçirgenlik Tıkama Aygıtı, Yarıklı Diskler, Çatlaklı
Formasyonlar, Mermer, Kuyu Cidarı Güçlendirme Malzemeleri

ix
To My Beloved Family

x
ACKNOWLEDGEMENTS
I would like to thank Assoc. Prof. Dr. İsmail Hakkı Gücüyener. His great experience,
enthusiasm, determination and the continuous support from determining the topic of thesis
to the end of this research helped me throughout the study.
I wish to express my sincere gratitude to my supervisor Assist.Prof. Dr. İsmail Durgut,
for his continuous guidance, support, patience and valuable advices.
Furthermore, I would like to thank Hüseyin Ali Doğan, Ahmet Ay and Ahmet Sönmez
for technical support and contribution during experiments.
I owe special thanks to my colleague Özgür Fırat Akel for his support through the process
of writing the thesis.
GEOS Energy Inc. is also acknowledged for supplying experimental setup and additives.
My beloved family deserves appreciation for their encouragement, endless support and
patience.

xi
TABLE OF CONTENTS
ABSTRACT ................................................................................................................. v
ÖZ... .......................................................................................................................... vii
ACKNOWLEDGEMENTS ......................................................................................... x
TABLE OF CONTENTS ........................................................................................... xi
LIST OF TABLES ................................................................................................... xxi
LIST OF FIGURES ............................................................................................... xxxi
CHAPTERS
1. INTRODUCTION ................................................................................................ 1
2. LITERATURE REVIEW ..................................................................................... 5
3. STATEMENT OF PROBLEM ........................................................................... 25
4. THEORY ............................................................................................................ 27
5. EXPERIMENTAL SET-UP AND PROCEDURE ............................................ 31
5.1. Determination of Particle Size Distribution .................................................... 31
5.2. Composition of Drill-In Fluid ......................................................................... 33
5.3. Additives Used in Drill-In Fluid Add .............................................................. 34
5.3.1. Modified Starch ........................................................................................ 34
5.3.2. XCD Polymer ........................................................................................... 34
5.3.3. Biocide ...................................................................................................... 34
5.3.4. Ground Marble .......................................................................................... 34
5.4. Determination of Rheological Properties of Drill-In Fluid ............................. 35
5.5. Preparation of Drill-in Fluid ............................................................................ 36
5.6. Sealing Capability Tests .................................................................................. 36

xii
5.6.1. Customization of Slots & Parts of Permeability Plugging Apparatus ...... 37
5.6.2. Test Procedure .......................................................................................... 42
6. RESULTS AND DISCUSSION ........................................................................ 47
6.1. Filtration Control............................................................................................. 49
6.2. Fluid Rheology ................................................................................................ 50
6.3. Effect of Particle Size Distribution of Ground Marble on Sealing 400 microns
fracture width ......................................................................................................... 52
6.3.1. Results Obtained for Total Concentration of 30 ppb for 400-µm Slot Size
............................................................................................................................ 53
6.3.2. Results Obtained for Total Concentration of 28 ppb for 400-µm Slot Size
............................................................................................................................ 55
6.3.3. Results Obtained for Total Concentration of 26 ppb for 400-µm Slot Size
............................................................................................................................ 55
6.3.4. Results Obtained for Total Concentration of 24 ppb for 400-µm Slot Size
............................................................................................................................ 56
6.3.5. Results Obtained for Total Concentration of 22 ppb for 400-µm Slot Size
............................................................................................................................ 57
6.3.6. Results Obtained for Total Concentration of 20 ppb for 400-µm Slot Size
............................................................................................................................ 58
6.3.7. Results Obtained for Total Concentration of 16 ppb for 400-µm Slot Size
............................................................................................................................ 61
6.3.8. Results Obtained for Total Concentration of 14 ppb for 400-µm Slot Size
............................................................................................................................ 62
6.3.9. Results Obtained for Total Concentration of 12 ppb for 400-µm Slot Size
............................................................................................................................ 62

xiii
6.3.10. Results Obtained for Total Concentration of 10 ppb for 400-µm Slot Size
............................................................................................................................ 63
6.3.11. Results Obtained for Total Concentration of 8 ppb for 400-µm Slot Size
............................................................................................................................ 63
6.3.12. Results Obtained for Total Concentration of 6 ppb for 400-µm Slot Size
............................................................................................................................ 64
6.3.13. Results Obtained for Total Concentration of 4 ppb for 400-µm Slot Size
............................................................................................................................ 66
6.4. Effect of Concentration of Ground Marble on Sealing 400 microns fracture
width ....................................................................................................................... 68
6.5. Effect of Particle Size Distribution of Ground Marble on Sealing 800 microns
fracture width ......................................................................................................... 69
6.5.1. Results Obtained for Total Concentration of 30 ppb for 800-µm Slot Size
............................................................................................................................ 69
6.5.2. Results Obtained for Total Concentration of 28 ppb for 800-µm Slot Size
............................................................................................................................ 74
6.5.3. Results Obtained for Total Concentration of 26 ppb for 800-µm Slot Size
............................................................................................................................ 75
6.5.4. Results Obtained for Total Concentration of 24 ppb for 800-µm Slot Size
............................................................................................................................ 75
6.5.5. Results Obtained for Total Concentration of 22 ppb for 800-µm Slot Size
............................................................................................................................ 76
6.5.6. Results Obtained for Total Concentration of 20 ppb for 800-µm Slot Size
............................................................................................................................ 77
6.6. Effect of Concentration of Ground Marble on Sealing 800 microns fracture
width ....................................................................................................................... 80

xiv
6.7. Effect of Particle Size Distribution of Ground Marble on Sealing 1200 microns
fracture width ......................................................................................................... 82
6.7.1. Results Obtained for Total Concentration of 30 ppb for 1200-µm Slot Size
............................................................................................................................ 82
6.7.2. Results Obtained for Total Concentration of 60 ppb for 1200-µm Slot Size
............................................................................................................................ 84
6.8. Effect of Concentration of Ground Marble on Sealing 1200 microns Fracture
width....................................................................................................................... 86
6.9. Effect of Fracture Width on Sealing ............................................................... 87
7. CONCLUSION ...................................................................................................... 89
8. RECOMMENDATIONS ....................................................................................... 91
REFERENCES .......................................................................................................... 93
APPENDICES ........................................................................................................... 99
A. Technical Data Sheet of AMYLOTROL .......................................................... 99
B. Technical Data Sheet of REOZAN D ............................................................. 101
C. Technical Data Sheet of GEOCIDE T ............................................................. 103
D. Specifications of Grace Viscometer ................................................................ 104
E. Specifications of Permeability Plugging Apparatus ........................................ 104
F. Effect of Particle Size Distribution of Ground Marble on Sealing 400-µ Fracture
Width .................................................................................................................... 105
F. I. Results Obtained for Total Concentration of 30 ppb for 400-µm Slot ..... 105
F. I. 1. FMC 30-0-0, FMC 0-30-0 & FMC 0-0-30 ....................................... 105
F. I. 2. FMC 10-10-10 ................................................................................... 106
F. II. Results Obtained for Total Concentration of 28 ppb for 400-µm Slot .... 107
F. II. 1. FMC 8-10-10 ................................................................................... 107
xv
F. II. 2. FMC 10-8-10 .................................................................................... 108
F. II. 3. FMC 10-10-8 .................................................................................... 109
F. III. Results Obtained for Total Concentration of 26 ppb for 400-µm Slot ... 110
F. III. 1. FMC 6-10-10 ................................................................................... 110
F. III. 2. FMC 10-6-10 ................................................................................... 111
F. III. 3. FMC 10-10-6 ................................................................................... 112
F. IV. Results Obtained for Total Concentration of 24 ppb for 400-µm Slot ... 113
F. IV. 1. FMC 4-10-10 .................................................................................. 113
F. IV. 2. FMC 10-4-10 .................................................................................. 114
F. IV. 3. FMC 10-10-4 .................................................................................. 115
F. V. Results Obtained for Total Concentration of 22 ppb for 400-µm Slot .... 116
F. V. 1. FMC 2-10-10 .................................................................................... 116
F. V. 2. FMC 10-2-10 .................................................................................... 117
F. V. 3. FMC 10-10-2 .................................................................................... 118
F. VI. Results Obtained for Total Concentration of 20 ppb for 400-µm Slot ... 119
F. VI. 1. FMC 0-10-10 .................................................................................. 119
F. VI. 2. FMC 10-0-10 .................................................................................. 120
F. VI. 3. FMC 10-10-0 .................................................................................. 121
F. VII. Results Obtained for Total Concentration of 16 ppb for 400-µm Slot . 122
F. VII. 1. FMC 8-6-2 ..................................................................................... 122
F. VIII. Results Obtained for Total Concentration of 14 ppb for 400-µm Slot 123
F. VIII. 1. FMC 6-6-2 .................................................................................... 123
F. IX. Results Obtained for Total Concentration of 12 ppb for 400-µm Slot ... 124
F. IX. 1. FMC 4-6-2 ...................................................................................... 124
xvi
F. X. Results Obtained for Total Concentration of 10 ppb for 400-µm Slot .... 125
F. X. 1. FMC 2-6-2 ....................................................................................... 125
F. X. 2. FMC 4-6-0 ....................................................................................... 126
F. X. 3. FMC 4-4-2 ....................................................................................... 127
F. XI. Results Obtained for Total Concentration of 8 ppb for 400-µm Slot
Size........ ........................................................................................................... 128
F. XI. 1. FMC 4-2-2 ...................................................................................... 128
F. XII. Results Obtained for Total Concentration of 6 ppb for 400-µm Slot
Size......... .......................................................................................................... 129
F. XII. 1. FMC 4-0-2 ..................................................................................... 129
F. XII. 2. FMC 4-2-0 ..................................................................................... 130
F. XIII. Results Obtained for Total Concentration of 4 ppb for 400-µm Slot .. 131
F. XIII. 1. FMC 2-2-0 ................................................................................... 131
G. Effect of Concentration of Ground Marble on Sealing 400-µ Fracture Width 132
G. I. 1. FMC 4-3-1 ........................................................................................ 132
G. I. 2. FMC 12-9-3 ...................................................................................... 133
G. I. 3. FMC 16-12-4 .................................................................................... 134
H. Effect of Particle Size Distribution of Ground Marble on Sealing 800-µ fracture
width..................................................................................................................... 135
H. I. Results Obtained for Total Concentration of 30 ppb for 800-µm Slot..... 135
H. I. 1. FMC 30-0-0, FMC 0-30-0 & FMC 0-0-30 ....................................... 135
H. I. 2. FMC 10-10-10 .................................................................................. 136
H. I. 3. FMC 10-6-14 .................................................................................... 137
H. I. 4. FMC 10-2-18 .................................................................................... 138
H. I. 5. FMC 10-18-2 .................................................................................... 139
xvii
H. I. 6. FMC 10-14-6 ..................................................................................... 140
H. I. 7. FMC 2-10-18 ..................................................................................... 141
H. I. 8. FMC 6-10-14 ..................................................................................... 142
H. I. 9. FMC 14-10-6 ..................................................................................... 143
H. I. 10. FMC 18-10-2 ................................................................................... 144
H. I. 11. FMC 18-2-10 ................................................................................... 145
H. I. 12. FMC 14-6-10 ................................................................................... 146
H. I. 13. FMC 6-14-10 ................................................................................... 147
H. I. 14. FMC 2-18-10 ................................................................................... 148
H. I. 15. FMC 18-6-6 ..................................................................................... 149
H. I. 16. FMC 6-18-6 ..................................................................................... 150
H. I. 17. FMC 6-6-18 ..................................................................................... 151
H. II. Results Obtained for Total Concentration of 28 ppb for 800-µm Slot .... 152
H. II. 1. FMC 8-10-10 ................................................................................... 152
H. II. 2. FMC 10-8-10 ................................................................................... 153
H. II. 3. FMC 10-10-8 ................................................................................... 154
H. III. Results Obtained for Total Concentration of 26 ppb for 800-µm Slot .. 155
H. III. 1. FMC 6-10-10 .................................................................................. 155
H. III. 2. FMC 10-6-10 .................................................................................. 156
H. III. 3. FMC 10-10-6 .................................................................................. 157
H. IV. Results Obtained for Total Concentration of 24 ppb for 800-µm Slot .. 158
H. IV. 1. FMC 4-10-10 .................................................................................. 158
H. IV. 2. FMC 10-4-10 .................................................................................. 159
H. IV. 3. FMC 10-10-4 .................................................................................. 160

xviii
H. V. Results Obtained for Total Concentration of 22 ppb for 800-µm Slot ... 161
H. V. 1. FMC 2-10-10 ................................................................................... 161
H. V. 2. FMC 10-2-10 ................................................................................... 162
H. V. 3. FMC 10-10-2 ................................................................................... 163
H. VI. Results Obtained for Total Concentration of 20 ppb for 800-µm Slot .. 164
H. VI. 1. FMC 0-10-10 ................................................................................. 164
H. VI. 2. FMC 10-0-10 ................................................................................. 165
H. VI. 3. FMC 10-10-0 ................................................................................. 166
H. VI. 4. FMC 6-6-8 ..................................................................................... 167
I. Effect of Concentration of Ground Marble on Sealing 800-µ fracture............. 168
I. I. 1. FMC 15-15-15 .................................................................................... 168
I. I. 2. FMC 20-20-20.................................................................................... 169
I. I. 3. FMC 9-15-21 ...................................................................................... 170
I. I. 4. FMC 12-20-28.................................................................................... 171
J. Effect of Particle Size Distribution of Ground Marble on Sealing 1200-µ Fracture
Width .................................................................................................................... 172
J. I. Results Obtained for Total Concentration of 30 ppb for 1200-µ Slot ....... 172
J. I. 1. FMC 30-0-0, FMC 0-30-0 & FMC 0-0-30 ........................................ 172
J. I. 2. FMC 10-10-10 ................................................................................... 173
J. I. 3. FMC 10-6-14 ..................................................................................... 174
J. I. 4. FMC 10-2-18 ..................................................................................... 175
J. I. 5. FMC 10-18-2 ..................................................................................... 176
J. I. 6. FMC 10-14-6 ..................................................................................... 177
J. I. 7. FMC 6-10-14 ..................................................................................... 178

xix
J. I. 8. FMC 2-10-18 ...................................................................................... 179
J. I. 9. FMC 18-10-2 ...................................................................................... 180
J. I. 10. FMC 14-10-6 .................................................................................... 181
J. I. 11. FMC 6-14-10 .................................................................................... 182
J. I. 12. FMC 2-18-10 .................................................................................... 183
J. I. 13. FMC 18-2-10 .................................................................................... 184
J. I. 14. FMC 14-6-10 .................................................................................... 185
J. II. Results Obtained for Total Concentration of 60 ppb for 1200-µ Slot ...... 186
J. II. 1. FMC 20-4-36 ..................................................................................... 186
J. II. 2. FMC 20-12-28 ................................................................................... 187
J. II. 3. FMC 15-15-30 ................................................................................... 188
J. II. 4. FMC 10-10-40 ................................................................................... 189
J. II. 5. FMC 25-5-30 ..................................................................................... 190
J. III. Results Obtained for Total Concentration of 90 ppb for 1200-µ Slot ..... 191
J. III. 1. FMC 15-30-45 ................................................................................. 191
J. IV. Results Obtained for Total Concentration of 120 ppb for 1200-µ Slot .. 192
J. IV. 1. FMC 20-40-60 ................................................................................. 192
J. V. Results Obtained for Total Concentration of 150 ppb for 1200-µ Slot .... 193
J. V. 1. FMC 25-50-75 .................................................................................. 193
K. Effect of Concentration of Ground Marble on Sealing 1200-µ Fracture......... 194
K. I. 1. FMC 16-16-16 ................................................................................... 194
K. I. 2. FMC 20-20-20 ................................................................................... 195

xx

xxi
LIST OF TABLES
TABLES
Table 2.1: Fundamental differences between wellbore strengthening mechanisms
(Cock et al, 2012) ....................................................................................................... 13
Table 2.2: Shape Factor of Different Materials (Kumar et. al., 2010) ...................... 14
Table 2.3: Composition of LCM used for comparing different slots
(Kumar and Savari, 2011) .......................................................................................... 18
Table 2.4: Fluid Loss Results for comparison of constant area slots and tapered slots
(Kumar and Savari,2011) ........................................................................................... 18
Table 2.5: Fluid Loss Testing Performed on Tapered Slot with different Particles .. 19
Table 2.6: Individual LCM concentration and PSD tested in Low Pressure Testing
Apparatus (Alsaba et al., 2014b) ............................................................................... 21
Table 2.7: Concentration and PSD of LCM Blends tested in Low Pressure Testing
Apparatus (Alsaba et al., 2014b) ............................................................................... 22
Table 5.1: Sieves Standard No. Mesh Sizes and Standard Sieves Designation ........ 31
Table 5.2: Particle Size Distribution of Ground Marble ........................................... 32
Table 5.3: Composition of Drill-in Fluid. ................................................................. 33
Table 5.4: The properties of Tap Water .................................................................... 33
Table 5.5: Dimensions of Re-designed Slots ............................................................ 40
Table 5.6: Examples of Mud Loss and Total Sealing Time Tables .......................... 43
Table 6.1: Results of Fluid Loss Measurement during 30 minutes ........................... 50
Table 6.2: PV, YP, LSRYP and LSRV at 0.0636 sec-1 values of Base A, Base B and
Base C fluid ................................................................................................................ 51
Table 6.3: Mud Loss & Total Sealing Time Values for FMC 10-10-10 on 400-micron
fracture ....................................................................................................................... 54
Table 6.4: Comparison of FMC 8-10-10, FMC 10-8-10 & FMC 10-10-8 ............... 55

xxii
Table 6.5: Comparison of FMC 6-10-10, FMC 10-6-10 & FMC 10-10-6 ............... 56
Table 6.6: Comparison of FMC 4-10-10, FMC 10-4-10 & FMC 10-10-4 ............... 57
Table 6.7: Comparison of FMC 2-10-10, FMC 10-2-10 & FMC 10-10-2 ............... 58
Table 6.8: Comparison of FMC 0-10-10, FMC 10-0-10 & FMC 10-10-0 ............... 59
Table 6.9: Mud Loss & Total Sealing Time Values for FMC 8-6-2 on 400-micron
fracture width ............................................................................................................. 62
Table 6.10: Comparison of FMC 2-6-2, FMC 4-4-2 & FMC 4-6-0 ......................... 63
Table 6.11: Mud Loss & Total Sealing Time Values for FMC 4-0-2 on 400-micron
fracture width ............................................................................................................. 65
Table 6.12: Comparison of FMC 4-0-2 and FMC 4-2-0 .......................................... 66
Table 6.13: Mud Loss & Total Sealing Time Values for FMC 2-2-0 on 400 micron
fracture width ............................................................................................................. 67
Table 6.14: Comparison of Best Results for Sealing of 400 µm fracture width ...... 67
Table 6.15: The effect of concentration on sealing 400-micron fracture width ....... 68
Table 6.16: Mud Loss & Total Sealing Time Values for FMC 10-10-10 on 800-
micron fracture width ................................................................................................ 70
Table 6.17: Comparison of importance of coarse and medium sized particles ........ 71
Table 6.18: Comparison of importance of fine sized and coarse sized particles on 800-
micron fracture width ................................................................................................ 72
Table 6.19:Comparison of the Importance of Fine and Medium Particle Ranges ... 73
Table 6.20: Comparison of FMC 18-6-6, FMC 6-18-6 and FMC 6-6-18 ................ 74
Table 6.21: Comparison of FMC 8-10-10, FMC 10-8-10 & FMC 10-10-8 ............. 74
Table 6.22: Comparison of FMC 6-10-10, FMC 10-6-10 & FMC 10-10-6 ............. 75
Table 6.23: Comparison of FMC 4-10-10, FMC 10-4-10 and FMC 10-10-4 .......... 75
Table 6.24: Comparison of FMC 2-10-10, FMC 10-2-10 and FMC 10-10-2 .......... 76
Table 6.25: Comparison of FMC 0-10-10, FMC 10-0-10 and FMC 10-10-0 .......... 77
Table 6.26: Mud Loss & Total Sealing Time Values for FMC 6-6-8 on 800-micron
fracture width ............................................................................................................. 78
Table 6.27: Comparison of Successful Results on Sealing of 800-µm Fracture Width
................................................................................................................................... 79
xxiii
Table 6.28: Effect of Concentration on Sealing (1) .................................................. 81
Table 6.29: Effect of Concentration on Sealing (2) .................................................. 81
Table 6.30: Comparison of Maximum Sealing Pressures of Different Compositions
on the 1200-µm fracture width (1) ............................................................................. 83
Table 6.31: Comparison of Maximum Sealing Pressures of Different Compositions
on the 1200-µm fracture width (2) ............................................................................. 83
Table 6.32: Comparison of Maximum Sealing Pressures of Different Compositions
on the 1200-µm fracture width (3) ............................................................................. 84
Table 6.33: Effect of Concentration on Sealing 1200-µm Fracture Width ............... 86
Table 6.34: Total Sealing Time and Total Mud Loss Values for FMC 10-10-10
composition on different fracture width ..................................................................... 87
Table F.1: Mud Loss & Total Sealing Time Values for each particle range
individually…… ...................................................................................................... 105
Table F.2: Mud Loss & Total Sealing Time Values for FMC 10-10-10 on 400-micron
slot…………… ........................................................................................................ 106
Table F.3: Mud Loss & Total Sealing Time Values for FMC 8-10-10 on 400-micron
slots…………… ...................................................................................................... 107
Table F.4: Mud Loss & Total Sealing Time Values for FMC 10-8-10 on 400-micron
fracture width……. ................................................................................................. 108
Table F.5:Mud Loss&Total Sealing Time Values for FMC 10-10-8 on 400-micron
fracture width… ...................................................................................................... 109
Table F.6: Mud Loss & Total Sealing Time Values for FMC 6-10-10 on 400-micron
fracture width…. ..................................................................................................... 110
Table F.7: Mud Loss & Total Sealing Time Values for FMC 10-6-10 on 400-micron
fracture width… ...................................................................................................... 111
Table F.8: Mud Loss & Total Sealing Time Values for FMC 10-10-6 on 400-micron
fracture width… ...................................................................................................... 112
Table F.9: Mud Loss & Total Sealing Time Values for FMC 4-10-10 on 400-micron
fracture width…. ...................................................................................................... 113

xxiv
Table F.10: Mud Loss & Total Sealing Time Values for FMC 10-4-10 on 400-micron
fracture width… ...................................................................................................... 114
Table F.11: Mud Loss & Total Sealing Time Values for FMC 10-10-4 on 400-micron
fracture width…. ..................................................................................................... 115
Table F.12: Mud Loss & Total Sealing Time Values for FMC 2-10-10 on 400-micron
fracture width… ...................................................................................................... 116
Table F.13: Mud Loss & Total Sealing Time Values for FMC 10-2-10 on 400-micron
fracture width..... ..................................................................................................... 117
Table F.14:Mud Loss & Total Sealing Time Values for FMC 10-10-2 on 400-micron
fracture width... ....................................................................................................... 118
Table F.15: Mud Loss & Total Sealing Time Values for FMC 0-10-10 on 400-micron
fracture width... ....................................................................................................... 119
Table F.16: Mud Loss & Total Sealing Time Values for FMC 10-0-10 on 400-micron
fracture width.... ....................................................................................................... 120
Table F.17: Mud Loss & Total Sealing Time Values for FMC 10-10-0 on 400-micron
fracture width.... ....................................................................................................... 121
Table F.18: Mud Loss & Total Sealing Time Values for FMC 8-6-2 on 400-micron
fracture width.... ....................................................................................................... 122
Table F.19: Mud Loss & Total Sealing Time Values for FMC 6-6-2 on 400-micron
fracture width.... ...................................................................................................... 123
Table F.20: Mud Loss & Total Sealing Time Values for FMC 4-6-2 on 400-micron
fracture width.... ....................................................................................................... 124
Table F.21: Mud Loss & Total Sealing Time Values for FMC 2-6-2 on 400-micron
fracture width... ....................................................................................................... 125
Table F.22: Mud Loss & Total Sealing Time Values for FMC 4-6-0 on 400-micron
fracture width.... ....................................................................................................... 126
Table F.23: Mud Loss & Total Sealing Time Values for FMC 4-4-2 on 400-micron
fracture width.... ....................................................................................................... 127
Table F.24: Mud Loss & Total Sealing Time Values for FMC 4-2-2 on 400-micron
fracture width.... ....................................................................................................... 128
xxv
Table F.25: Mud Loss & Total Sealing Time Values for FMC 4-0-2 on 400-micron
fracture width... ....................................................................................................... 129
Table F.26: Mud Loss & Total Sealing Time Values for FMC 4-2-0 on 400-micron
fracture width.... ....................................................................................................... 130
Table F.27: Mud Loss & Total Sealing Time Values for FMC 2-2-0 on 400-micron
fracture width... ....................................................................................................... 131
Table G.1: Mud Loss & Total Sealing Time Values for FMC 4-3-1 on 400-micron
fracture width.... ....................................................................................................... 132
Table G.2: Mud Loss & Total Sealing Time Values for FMC 12-9-3 on 400-micron
fracture width.... ...................................................................................................... 133
Table G.3: Mud Loss & Total Sealing Time Values for FMC 16-12-4 on 400-micron
fracture width.... ....................................................................................................... 134
Table H.1: Mud Loss & Total Sealing Time Values for each particle range
individually....... ....................................................................................................... 135
Table H.2: Mud Loss&Total Sealing Time Values for FMC 10-10-10 on 800-micron
fracture width.... ....................................................................................................... 136
Table H.3: Mud Loss & Total Sealing Time Values for FMC 10-6-14 on 800-micron
fracture width.... ....................................................................................................... 137
Table H.4: Mud Loss &Total Sealing Time Values for FMC 10-2-18 on 800-micron
fracture width.... ....................................................................................................... 138
Table H.5: Mud Loss &Total Sealing Time Values for FMC 10-18-2 on 800-micron
fracture width.... ....................................................................................................... 139
Table H.6: Mud Loss&Total Sealing Time Values for FMC 10-14-06 on 800-micron
fracture width..... ...................................................................................................... 140
Table H.7: Mud Loss & Total Sealing Time Values for FMC 18-10-2 on 800-micron
fracture width..... ...................................................................................................... 141
Table H.8: Mud Loss & Total Sealing Time Values for FMC 6-10-14 on 800-micron
fracture width.... ....................................................................................................... 142
Table H.9: Mud Loss & Total Sealing Time Values for FMC 14-10-6 on 800-micron
fracture width.... ....................................................................................................... 143
xxvi
Table H.10: Mud Loss & Total Sealing Time Values for FMC 18-10-2 on 800-micron
fracture width.... ....................................................................................................... 144
Table H.11: Mud Loss &Total Sealing Time Values for FMC 18-2-10 on 800-micron
fracture width.... ....................................................................................................... 145
Table H.12: Mud Loss & Total Sealing Time Values for FMC 14-6-10 on 800-micron
fracture width.... ....................................................................................................... 146
Table H.13: Mud Loss &Total Sealing Time Values for FMC 6-14-10 on 800-micron
fracture width...... .................................................................................................... 147
Table H.14: Mud Loss & Total Sealing Time Values for FMC 2-18-10 on 800-micron
fracture width.... ....................................................................................................... 148
Table H.15: Mud Loss & Total Sealing Time Values for FMC 18-6-6 on 800-micron
fracture width...... .................................................................................................... 149
Table H.16: Mud Loss & Total Sealing Time Values for FMC 6-18-6 on 800-micron
fracture width....... .................................................................................................... 150
Table H.17: Mud Loss & Total Sealing Time Values for FMC 6-6-18 on 800-micron
fracture width....... .................................................................................................... 151
Table H.18: Mud Loss & Total Sealing Time Values for FMC 8-10-10 on 800-micron
fracture width.... ....................................................................................................... 152
Table H.19: Mud Loss &Total Sealing Time Values for FMC 10-8-10 on 800-micron
fracture width...... .................................................................................................... 153
Table H.20: Mud Loss & Total Sealing Time Values for FMC 10-10-8 on 800-micron
fracture width..... ...................................................................................................... 154
Table H.21: Mud Loss & Total Sealing Time Values for FMC 6-10-10 on 800 micron
fracture width.... ....................................................................................................... 155
Table H.22: Mud Loss & Total Sealing Time Values for FMC 10-6-10 on 800 micron
fracture width..... ...................................................................................................... 156
Table H.23: Mud Loss &Total Sealing Time Values for FMC 10-10-6 on 800-micron
fracture width..... ...................................................................................................... 157
Table H.24: Mud Loss & Total Sealing Time Values for FMC 4-10-10 on 800-micron
fracture width.... ....................................................................................................... 158

xxvii
Table H.25: Mud Loss &Total Sealing Time Values for FMC 10-4-10 on 800-micron
fracture width...... .................................................................................................... 159
Table H.26: Mud Loss & Total Sealing Time Values for FMC 10-10-4 on 800-micron
fracture width.... ....................................................................................................... 160
Table H.27: Mud Loss &Total Sealing Time Values for FMC 2-10-10 on 800-micron
fracture width.... ....................................................................................................... 161
Table H.28: Mud Loss & Total Sealing Time Values for FMC 10-2-10 on 800-micron
fracture width.... ....................................................................................................... 162
Table H.29: Mud Loss &Total Sealing Time Values for FMC 10-10-2 on 800-micron
fracture width.... ....................................................................................................... 163
Table H.30: Mud Loss & Total Sealing Time Values for FMC 0-10-10 on 800-micron
fracture width.... ....................................................................................................... 164
Table H.31: Mud Loss &Total Sealing Time Values for FMC 10-0-10 on 800-micron
fracture width.... ....................................................................................................... 165
Table H.32: Mud Loss & Total Sealing Time Values for FMC 4-10-10 on 800-micron
fracture width.... ....................................................................................................... 166
Table H.33: Mud Loss & Total Sealing Time Values for FMC 6-6-8 on 800-micron
fracture width....... .................................................................................................... 167
Table I.1: Mud Loss&Total Sealing Time Values for FMC 15-15-15 on 800-micron
fracture width.... ....................................................................................................... 168
Table I.2: Mud Loss & Total Sealing Time Values for FMC 20-20-20 on 800-micron
fracture width.... ....................................................................................................... 169
Table I.3: Mud Loss & Total Sealing Time Values for FMC 9-15-21 on 800-micron
fracture width.... ....................................................................................................... 170
Table I. 4: Mud Loss & Total Sealing Time Values for FMC 12-20-28 on 800-micron
fracture width.... ....................................................................................................... 171
Table J.1: Mud Loss & Total Sealing Time Values for each particle range individually
on 1200-micron fracture width................................................................................. 172
Table J.2: Mud Loss & Total Sealing Time Values for FMC 10-10-10 on 1200-micron
fracture width.... ....................................................................................................... 173
xxviii
Table J.3: Mud Loss&Total Sealing Time Values for FMC 10-6-14 on 1200-micron
fracture width.... ....................................................................................................... 174
Table J.4: Mud Loss & Total Sealing Time Values for FMC 10-2-18 on 1200-micron
fracture width.... ....................................................................................................... 175
Table J.5: Mud Loss&Total Sealing Time Values for FMC 10-18-2 on 1200-micron
fracture width.... ....................................................................................................... 176
Table J.6: Mud Loss&Total Sealing Time Values for FMC 10-14-6 on 1200-micron
fracture width.... ....................................................................................................... 177
Table J.7: Mud Loss &Total Sealing Time Values for FMC 6-10-14 on 1200-micron
fracture width..... ...................................................................................................... 178
Table J.8: Mud Loss & Total Sealing Time Values for FMC 2-10-18 on 1200-micron
fracture width.... ....................................................................................................... 179
Table J.9: Mud Loss &Total Sealing Time Values for FMC 18-10-2 on 1200-micron
fracture width.... ....................................................................................................... 180
Table J.10: Mud Loss & Total Sealing Time Values for FMC 14-10-6 on 1200-micron
fracture width.... ....................................................................................................... 181
Table J.11: Mud Loss&Total Sealing Time Values for FMC 6-14-10 on 1200-micron
fracture width..... ...................................................................................................... 182
Table J.12: Mud Loss &Total Sealing Time Values for FMC 2-18-10 on 1200-micron
fracture width.... ....................................................................................................... 183
Table J.13: Mud Loss&Total Sealing Time Values for FMC 18-2-10 on 1200-micron
fracture width.... ....................................................................................................... 184
Table J.14: Mud Loss&Total Sealing Time Values for FMC 14-6-10 on 1200-micron
fracture width..... ...................................................................................................... 185
Table J.15: Mud Loss& Total Sealing Time Values for FMC 20-4-36 on 1200-micron
fracture width.... ....................................................................................................... 186
Table J.16: Mud Loss & Total Sealing Time Values for FMC 20-12-28 on 1200-
micron fracture width .............................................................................................. 187
Table J.17: Mud Loss & Total Sealing Time Values for FMC 15-15-30 on 1200-
micron fracture width .............................................................................................. 188

xxix
Table J.18: Mud Loss & Total Sealing Time Values for FMC 10-10-40 on 1200-
micron fracture width ............................................................................................... 189
Table J.19: Mud Loss &Total Sealing Time Values for FMC 25-5-30 on1200-micron
fracture width..... ...................................................................................................... 190
Table J.20: Mud Loss & Total Sealing Time Values for FMC 15-30-45 on 1200-
micron fracture width .............................................................................................. 191
Table J.21: Mud Loss & Total Sealing Time Values for FMC 20-40-60 on 1200-
micron fracture width .............................................................................................. 192
Table J.22: Mud Loss & Total Sealing Time Values for FMC 25-50-75 on 1200-
micron fracture width .............................................................................................. 193
Table K.1: Mud Loss & Total Sealing Time Values for FMC 16-16-16 on 1200-
micron fracture width .............................................................................................. 194
Table K.2: Mud Loss & Total Sealing Time Values for FMC 20-20-20 on 1200-
micron fracture width .............................................................................................. 195

xxx

xxxi
LIST OF FIGURES
FIGURES
Figure 1.1: Density ranges for different drilling fluid systems (Lake & Mitchell, 2006)
...................................................................................................................................... 3
Figure 2.1: Schematics of PPA (Mostafavi et al, 2011) .............................................. 7
Figure 2.2: Schematic of Permeable Fracture Test Device (Hettema et al, 2007) ...... 9
Figure 2.3: Corrugated Aluminum Platens for Fracture Tester (Sanders et al, 2008)
.................................................................................................................................... 10
Figure 2.4: Schematics of Impermeable Fracture Test Device ................................. 11
Figure 2.5: Alteration in Fracture Width with Changing Equivalent Circulating
Density (ECD) (Kumar et al, 2010) ........................................................................... 15
Figure 2.6: Low Pressure LCM Test Apparatus (Alsaba et al.,2014b) ..................... 20
Figure 2.7: High Pressure Test Apparatus (Alsaba et al. 2014) ................................ 23
Figure 4.1: Stress Cage Concept (Cock et al., 2011) ................................................ 28
Figure 4.2: Fracture Closure Stress Concept (Growcock, 2011) .............................. 29
Figure 4.3: Fracture Tip Isolation Concept in (a)(left figure) WBDFs (b)(right figure)
OBDFs (Cock, 2012) .............................................................................................. 30
Figure 5.1: Numbers of sieves and their mesh sizes in micron ................................. 32
Figure 5.2: GRACE M3600 Automatic Viscometer ................................................. 35
Figure 5.3: Normal PPA Assembly .......................................................................... 37
Figure 5.4: Illustration of bridge formed by particles in the needle valve ................ 38
Figure 5.5: Front view (the left figure) and bottom view (the right figure) of
redesigned top cap ...................................................................................................... 38
Figure 5.6: Representation of accumulation of particles inside the fracture due to
inappropriate flow channel ......................................................................................... 39
xxxii
Figure 5.7: Front view (left figure) and Bottom view(right figure) of redesigned slots
................................................................................................................................... 39
Figure 5.8: Drawings of redesigned slots ................................................................. 40
Figure 5.9: Final Configuration of slots .................................................................... 41
Figure 5.10: PPA Assembly used in the test ............................................................. 41
Figure 5.11: Hand Pump Gauge ............................................................................... 43
Figure 5.12: Representation of Pressure Sealing Test Graphs ................................. 45
Figure 6.1: Comparison of Filtration Values ............................................................ 49
Figure 6.2: Shear Stress vs Shear Rate Graph of Base A, Base B & Base C fluids . 51
Figure 6.3: Viscosity vs Shear Rate Graph of Base A, Base B and Base C Fluids on
log-log coordinates .................................................................................................... 52
Figure 6.4: Pressure vs Time curve for FMC 10-10-10 on sealing 400-micron fracture
width .......................................................................................................................... 54
Figure 6.5: Illustration of Particle Breaking under pressure .................................... 57
Figure 6.6: Illustration of flow through the highly permeable sands (Petropedia, 2018)
................................................................................................................................... 59
Figure 6.7: Pressure vs Time curve for FMC 8-6-2 on 400-micron fracture width . 61
Figure 6.8: Pressure vs Time curve for FMC 4-0-2 on 400-micron fracture width . 64
Figure 6.9: Pressure vs Time curve for FMC 2-2-0 on 400 micron fracture width .. 66
Figure 6.10: Pressure vs Time curve for FMC 10-10-10 on 800-micron fracture width
................................................................................................................................... 70
Figure 6.11: Pressure vs Time curve for FMC 6-6-8 on 800-micron fracture width 78
Figure F.1: Pressure vs Time curve for each particle range individually on sealing
400-micron fracture width………………………………………………………... 105
Figure F.2: Pressure vs Time curve for FMC 10-10-10 on sealing 400-micron fracture
width…………. ....................................................................................................... 106
Figure F.3: Pressure vs Time curve for FMC 8-10-10 on 400-micron fracture
width…………. ....................................................................................................... 107
xxxiii
Figure F.4: Pressure vs Time curve for FMC 10-8-10 on 400-micron fracture
width…………. ........................................................................................................ 108
Figure F.5: Pressure vs Time curve for FMC 10-10-8 on 400-micron fracture
width………………………………………………………………………………109
Figure F.6: Pressure vs Time curve for FMC 6-10-10 on 400-micron fracture
width………………………………………………………………………………110
Figure F.7: Pressure vs Time curve for FMC 10-6-10 on 400-micron fracture
width…………. ........................................................................................................ 111
Figure F.8: Pressure vs Time curve for FMC 10-10-6 on 400-micron fracture
width…………. ........................................................................................................ 112
Figure F.9: Pressure vs Time curve for FMC 4-10-10 on 400-micron fracture
width…………. ........................................................................................................ 113
Figure F.10: Pressure vs Time curve for FMC 10-4-10 on 400-micron fracture
width……………. .................................................................................................... 114
Figure F.11: Pressure vs Time curve for FMC 10-10-4 on 400-micron fracture
width……………. .................................................................................................... 115
Figure F.12: Pressure vs Time curve for FMC 2-10-10 on 400-micron fracture
width……………. .................................................................................................... 116
Figure F.13: Pressure vs Time curve for FMC 10-2-10 on 400-micron fracture
width……………. .................................................................................................... 117
Figure F.14: Pressure vs Time curve for FMC 10-10-2 on 400-micron fracture
width……………. .................................................................................................... 118
Figure F.15: Pressure vs Time curve for FMC 0-10-10 on 400-micron fracture
width……………. .................................................................................................... 119
Figure F.16: Pressure vs Time curve for FMC 10-0-10 on 400-micron fracture
width……………. .................................................................................................... 120
Figure F.17: Pressure vs Time curve for FMC 10-10-0 on 400-micron fracture
width……………. .................................................................................................... 121
Figure F.18: Pressure vs Time curve for FMC 8-6-2 on 400-micron fracture
width……………. .................................................................................................... 122
xxxiv
Figure F.19: Pressure vs Time curve for FMC 6-6-2 on 400-micron fracture
width…………….. .................................................................................................. 123
Figure F.20: Pressure vs Time curve for FMC 4-6-2 on 400-micron fracture
width……………. ................................................................................................... 124
Figure F.21: Pressure vs Time curve for FMC 2-6-2 on 400-micron fracture
width……………. ................................................................................................... 125
Figure F.22: Pressure vs Time curve for FMC 4-6-0 on 400-micron fracture
width……………. ................................................................................................... 126
Figure F.23: Pressure vs Time curve for FMC 4-4-2 on 400-micron fracture
width……………. ................................................................................................... 127
Figure F.24: Pressure vs Time curve for FMC 4-2-2 on 400-micron fracture
width……………. ................................................................................................... 128
Figure F.25: Pressure vs Time curve for FMC 4-0-2 on 400-micron fracture
width……………. ................................................................................................... 129
Figure F.26: Pressure vs Time curve for FMC 4-2-0 on 400-micron fracture
width……………. ................................................................................................... 130
Figure F.27: Pressure vs Time curve for FMC 2-2-0 on 400-micron fracture
width……………. ................................................................................................... 131
Figure G.1: Pressure vs Time curve for FMC 4-3-1 on 400-micron fracture
width………….. ...................................................................................................... 132
Figure G.2: Pressure vs Time curve for FMC 12-9-3 on 400-micron fracture
width…………. ....................................................................................................... 133
Figure G.3: Pressure vs Time curve for FMC 12-9-3 on 400-micron fracture
width…………. ....................................................................................................... 134
Figure H.1: Pressure vs Time curve for each particle range individually on sealing
800-micron fracture width ....................................................................................... 135
Figure H. 2: Pressure vs Time curve for FMC 10-10-10 on 800-micron fracture
width…………. ....................................................................................................... 136
Figure H.3: Pressure vs Time curve for FMC 10-6-14 on 800-micron fracture
width…………. ....................................................................................................... 137

xxxv
Figure H.4: Pressure vs Time curve for FMC 10-2-18 on 800-micron fracture
width…………. ........................................................................................................ 138
Figure H.5: Pressure vs Time curve for FMC 10-18-2 on 800-micron fracture
width…………. ........................................................................................................ 139
Figure H.6: Pressure vs Time curve for FMC 10-14-6 on 800-micron fracture
width…………. ........................................................................................................ 140
Figure H.7: Pressure vs Time curve for FMC 18-10-2 on 800-micron fracture
width…………. ........................................................................................................ 141
Figure H.8: Pressure vs Time curve for FMC 6-10-14 on 800-micron fracture
width…………. ........................................................................................................ 142
Figure H.9: Pressure vs Time curve for FMC 14-10-6 on 800-micron fracture
width…………. ........................................................................................................ 143
Figure H.10: Pressure vs Time curve for FMC 18-10-2 on 800-micron fracture
width……………. .................................................................................................... 144
Figure H.11: Pressure vs Time curve for FMC 18-2-10 on 800-micron fracture
width……………. .................................................................................................... 145
Figure H.12: Pressure vs Time curve for FMC 14-6-10 on 800-micron fracture
width……………. .................................................................................................... 146
Figure H.13: Pressure vs Time curve for FMC 6-14-10 on 800-micron fracture
width…………….. ................................................................................................... 147
Figure H.14: Pressure vs Time curve for FMC 2-18-10 on 800-micron fracture
width…………….. ................................................................................................... 148
Figure H.15: Pressure vs Time curve for FMC 18-6-6 on 800-micron fracture
width……………. .................................................................................................... 149
Figure H.16: Pressure vs Time curve for FMC 6-18-6 on 800-micron fracture
width……………. .................................................................................................... 150
Figure H.17: Pressure vs Time curve for FMC 6-6-18 on 800-micron fracture
width……………. .................................................................................................... 151
Figure H.18: Pressure vs Time curve for FMC 8-10-10 on 800-micron fracture
width……………. .................................................................................................... 152

xxxvi
Figure H.19: Pressure vs Time curve for FMC 10-8-10 on 800-micron fracture
width……………. ................................................................................................... 153
Figure H.20: Pressure vs Time curve for FMC 10-10-8 on 800-micron fracture
width……………. ................................................................................................... 154
Figure H.21: Pressure vs Time curve for FMC 6-10-10 on 800-micron fracture
width……………. ................................................................................................... 155
Figure H.22: Pressure vs Time curve for FMC 10-6-10 on 800-micron fracture
width……………. ................................................................................................... 156
Figure H.23: Pressure vs Time curve for FMC 10-10-6 on 800-micron fracture
width……………. ................................................................................................... 157
Figure H.24: Pressure vs Time curve for FMC 4-10-10 on 800-micron fracture
width…………….. .................................................................................................. 158
Figure H.25: Pressure vs Time curve for FMC 10-4-10 on 800-micron fracture
width……………. ................................................................................................... 159
Figure H.26: Pressure vs Time curve for FMC 10-10-4 on 800-micron fracture
width……………. ................................................................................................... 160
Figure H.27: Pressure vs Time curve for FMC 10-10-10 on 800-micron fracture
width……………. ................................................................................................... 161
Figure H.28: Pressure vs Time curve for FMC 10-2-10 on 800-micron fracture
width……………. ................................................................................................... 162
Figure H.29: Pressure vs Time curve for FMC 10-10-2 on 800-micron fracture
width……………. ................................................................................................... 163
Figure H.30: Pressure vs Time curve for FMC 0-10-10 on 800-micron fracture
width…………….. .................................................................................................. 164
Figure H.31: Pressure vs Time curve for FMC 10-0-10 on 800-micron fracture
width……………. ................................................................................................... 165
Figure H.32: Pressure vs Time curve for FMC 10-10-0 on 800-micron fracture
width……………. ................................................................................................... 166
Figure H.33: Pressure vs Time curve for FMC 6-6-8 on 800-micron fracture
width……………. ................................................................................................... 167

xxxvii
Figure I.1: Pressure vs Time curve for FMC 15-15-15 on 800-micron fracture
width………….. ....................................................................................................... 168
Figure I.2: Pressure vs Time curve for FMC 20-20-20 on 800-micron fracture
width…………. ........................................................................................................ 169
Figure I.3: Pressure vs Time curve for FMC 9-15-21 on 800-micron fracture
width…………. ........................................................................................................ 170
Figure I.4: Pressure vs Time curve for FMC 12-20-28 on 800-micron fracture
width…………. ........................................................................................................ 171
Figure J.1: Pressure vs Time curve for FMC 10-10-10 on 1200-micron fracture
width…………. ........................................................................................................ 173
Figure J.2: Pressure vs Time curve for FMC 10-6-14 on 1200-micron fracture
width…………. ........................................................................................................ 174
Figure J.3: Pressure vs Time curve for FMC 10-2-18 on 1200-micron fracture
width…………. ........................................................................................................ 175
Figure J.4: Pressure vs Time curve for FMC 10-14-6 on 1200-micron fracture
width…………. ........................................................................................................ 177
Figure J.5:Pressure vs Time curve for FMC 6-10-14 on 1200-micron fracture
width…………. ........................................................................................................ 178
Figure J.6: Pressure vs Time curve for FMC 2-10-18 on 1200-micron fracture
width…………. ........................................................................................................ 179
Figure J.7: Pressure vs Time curve for FMC 14-10-6 on 1200-micron fracture
width…………. ........................................................................................................ 181
Figure J.8: Pressure vs Time curve for FMC 6-14-10 on 1200-micron fracture
width…………. ........................................................................................................ 182
Figure J.9: Pressure vs Time curve for FMC 2-18-10 on 1200-micron fracture
width………….. ....................................................................................................... 183
Figure J.10: Pressure vs Time curve for FMC 18-2-10 on 1200-micron fracture
width…………. ........................................................................................................ 184
Figure J.11: Pressure vs Time curve for FMC 14-6-10 on 1200-micron fracture
width…………. ........................................................................................................ 185

xxxviii
Figure J.12: Pressure vs Time curve for FMC 20-4-36 on 1200-micron fracture
width…………. ....................................................................................................... 186
Figure J.13: Pressure vs Time curve for FMC 20-12-28 on 1200-micron fracture
width…………. ....................................................................................................... 187
Figure J.14: Pressure vs Time curve for FMC 15-15-30 on 1200-micron fracture
width…………. ....................................................................................................... 188
Figure J.15: Pressure vs Time curve for FMC 10-10-40 on 1200-micron fracture
width………….. ...................................................................................................... 189
Figure J.16: Pressure vs Time curve for FMC 25-5-30 on 1200-micron fracture
width………….. ...................................................................................................... 190
Figure J.17: Pressure vs Time curve for FMC 15-30-45 on 800-micron fracture
width…………. ....................................................................................................... 191
Figure J.18: Pressure vs Time curve for FMC 20-40-60 on 1200-micron fracture
width…………… .................................................................................................... 192
Figure J.19: Pressure vs Time curve for FMC 25-50-75 on 800-micron fracture
width…………. ....................................................................................................... 193
Figure K.1: Pressure vs Time curve for FMC 16-16-16on 1200-micron fracture
width…………. ....................................................................................................... 194
Figure K.2: Pressure vs Time curve for FMC 20-20-20 on 1200-micron fracture
width…………. ....................................................................................................... 195

1
CHAPTER 1
1. INTRODUCTION
Over the past century, demand for oil and gas has significantly increased with growing
economies. Drilling activities has shifted to explore deeper, harsher and more complex
environments to meet this demand. While drilling these environments, operators face
with many challenges where lost circulation is one of the main ones. Lost circulation
can be defined as the loss of drilling fluids partially or totally into the formation. Due
to the loss of the costly drilling fluid, drilling expenses increase and create non-
productive time (NPT) which is spent for mitigating and regaining mud circulation.
Apart from trouble cost for mud losses and non-productive operation time, it can also
end up with lost of expensive downhole equipment or drilling problems such as
differential stuck, blowout and abandonment of well. Moreover, since solids and
liquid in the mud might invade into the target zone during drilling of reservoir section,
it can result in unsatisfactory production rates due to formation damage.
In general, four types of formation have high potential for lost circulation;
A. Natural or induced formation fractures
B. Vugular and/or cavernous formations
C. Highly permeable formations
D. Unconsolidated formations.
Although, small fractures are found in almost all formations, highly conductive natural
fractures are present mostly in chalks and limestone reservoirs where significant losses
occur. In Turkey, highly fractured carbonate formations are encountered frequently
and may lead to lost circulation while drilling. These natural fractures can be micro-
fractured sized or large opening size with high interconnected channels.

2
While drilling, fluid pressure might exceed the formation fracture pressure. In
impermeable and tight formations, induced fractures may occur and losses through
these fractures can be encountered. Once these fractures are created, it may be difficult
to remove it since the pressure required to lengthen a fracture is often lower than that
required to initiate it. Therefore, it may never regain the original formation strength
and lost circulation may never be stopped even though pressure over formation is
reduced.
In general, circulation losses are classified in three groups based on the losses rate
(bbl/hr):
• Seepage loss, (1-10 bbl/hr)
• Partial loss (10-500 bbl/hr)
• Total loss (over 500 bbl/hr).
This categorization is only valid for losses through permeable formations. In natural
fractures, there is no barrier to stop the flow into the formation because of large
opening size. Therefore, totally from hundreds to thousands of barrels of drilling fluid
might be lost.
There are plenty of studies made for solving the lost circulation problem. All of these
studies can be classified into two: Corrective (or Mitigating) Methods and Preventive
Methods. Corrective methods include treating, i.e. controlling and stopping of losses
after lost circulation occurs. On the other hand, Preventive Methods are applied prior
to entering loss circulation zones and used to strength the wellbore and to prevent the
occurrence of losses. This approach depends on propping and sealing the fractures
using wellbore strengthening materials (WSMs) while drilling to enhance the fracture
gradient and widen the operational window (Salehi and Nygaard, 2011). WSMs are
drilling fluid additives which are specially sized and designed particulates. Resilient
graphitic carbon, cellulosic fibre, ground nutshell and marble are examples of WSMs.
They can be categorized also in Lost Circulation Materials. However, WSM’s have
proved effects on both to mitigate losses and for preventing them.

3
Ground Marble (GM) is often used to combat severe fluid losses. Its chemical
composition is calcium carbonate (CaCO3). GM is the most appropriate granular type
of material that can be used for the design of Drill-in Fluids because of its mechanical
and chemical properties. Also, it is resistant to high pressure differentials and also
swap/surge and drill string impacts in the wellbore. It is chemically soluble in
hydrochloric (HCl) acid which guarantees its removal from porous media and pore
throats after invasion and allows using it even in production zones. In this study,
ground marble will be tested as WSM with different range and concentration.
The range of particle size distribution (PSD) of ground marble used in this study will
be based on the range of materials available in the market.
While drilling highly depleted fractured zones, drilling with conventional water-based
and oil-based systems might be difficult and losses can be occurred due to high
overbalance. In these environments, sometimes systems with lower densities which
can be seen in Figure 1.1 may be used. As can be seen, these environments can be
drilled with aerated mud, stable foam and mist or air. However, for drilling with these
drilling fluids, it needs to set-up expensive surface equipment.
Figure 1.1: Density ranges for different drilling fluid systems (Lake & Mitchell, 2006)

4
By means of usage of wellbore strengthening materials in conventional oil or water-
based systems, these highly depleted environments can be drilled without needed
systems with lower densities.
Intention of the study is to conduct experimental investigation on determining
optimum concentration and PSD, which enables to drill fractured reservoirs. To do
this, firstly the wells in the Turkey is examined. According to the statistics which
obtained from website of General Directorate of Mining and Petroleum Affairs, there
is no well which is currently producing oil or gas deeper than 4200 metres. Also, the
deepest geothermal well in Turkey is SY-23 located in Alaşehir, Manisa. The depth
of this well is 4312 metres (Ülgen, Damcı & Gülmez, 2018). Since there is no deeper
well than 4400 metres in Turkey, the fractured and depleted reservoirs at depth of
4400 metres had been chosen as target of this study. Conventional oil or water systems
supported with wellbore strengthening materials that resist to 2000 psi overbalance
should be preferred to eliminate the usage of systems with lower densities.
Overbalance Pressure (psi) = 0.052 * Differential Mud Weight (ppg) * Depth (ft)
2000 psi = 0.052 * Δρ * 4400m * 3.281 ft/m
Δρ = 2.66 lb/gal
In general, the densities of conventional water-based drilling systems may change
between 8.50 lb/gal and 9.34 lb/gal. By using of wellbore strengthening materials,
environments with pore pressure ranging from 5.84 lb/gal to 6.65 lb/gal can be drilled.
These densities can change according to the amount of used materials.
In this study, experiments conducted to find the effect of particle size distribution,
concentration and the fracture size on sealing. Also, it is aimed to define optimum
composition which seals the predetermined openings

5
CHAPTER 2
2. LITERATURE REVIEW
Wellbore Strengthening prevents occurrence of losses by strengthening the wellbore
and enhancing the effective fracture pressure. Hoop Stress Enhancement (or Stress
Cage Model), Fracture Closure Stress and Fracture Propagation Resistance (or
Fracture Tip Isolation) are different mechanism of wellbore strengthening. Each
mechanism uses different technique to prevent occurrence of losses. Detailed
information about wellbore strengthening mechanisms can be found in Theory
Chapter.
Many experimental studies have been conducted on lost circulation and wellbore
strengthening. The DEA-13 experimental study conducted in the middle 1980s to
early 1990s [Morita, Black and Fuh, (1996) , van Oort and Razavi, (2014), Fuh,
Morita, Boyd and McGoffin, (1992)] is an early experimental investigation into lost
circulation.
The aim of that study was to examine and understand why lost circulation occurs less
frequently while drilling with water-based mud (WBM) than with oil based mud
(OBM). A major observation of DEA-13 project was that fracture propagation
pressure (FPP) is strongly related to mud type and significantly increased by the use
of LCM additives.
This result was explained by a physical model called “tip screen-out” [Morita, Black
and Fuh, (1996), Morita, Fuh and Black, (1996), Morita and Fuh (2012), Fuh, Morita,
Boyd, McGoffin, (1992)], which indicates that the increase in FPP is due to isolation
of the fracture tip and wellbore pressure by an LCM filtercake in the fracture.
Another major experimental effort, The GPRI 2000 project, was conducted in the late
1990s to early 2000s [van Oort, Friedheim, Pierce and Lee, (2011)]. The purpose of
6
the GPRI 2000 project was to evaluate the capabilities of different LCMs on increasing
fracture gradient. The experimental results show that fracture reopening pressure
(FRP) of a wellbore can be increased by using LCMs and this effect is more
remarkable in WBM than in OBM or synthetic based muds (SBM).
A recent experimental study on lost circulation conducted from late 2000s to early
2010s is called the Lost Circulation and Wellbore Strengthening Research
Cooperative Agreement (RCA) project [Guo, Cook, Way, Ji and Friedheim, (2014)].
The aim of this project was to investigate the wellbore strengthening mechanism and
the effectiveness of different wellbore strengthening methods (preventive and
remedial methods). The main results of this study include that (1) a preventive
wellbore strengthening treatment is more effective than remedial treatment; (2)
particle size distribution (PSD) and concentration of LCM are critical in wellbore
strengthening; and (3) fracture pressure achieved with wellbore strengthening can be
higher than the formation breakdown pressure (FBP).
Mostafavi et al. (2011) conducted experiments on not only PPA with a wide range of
particles but also on core fracturing tests. Their aim was to develop a reliable model
for wellbore strengthening by understanding the governing mechanism of particle
sealing. PSD, concentration, fracture surface friction coefficient parameters were
investigated and evaluated. Firstly, particles were selected in order to test all particle
shapes. Resilient graphite, mica flakes, calcium carbonate, and two types of
commercially used fibers were tested in different concentrations (8 lb/bbl, 17 lb/bbl,
35 lb/bbl) and mixtures after sieved and prepared to mix into water-based drilling fluid
according to specific PSDs. The tests were conducted at atmospheric pressure. The
known opening sizes used in this test 300 µm, 500 µm and 700 µm. Since the results
of traditional PPA method of data analysis did not correlate with field experiences and
core fracturing tests, new data analysis was designed and applied. Modified system
can be seen in Figure 2.1. In this method, water was pumped with a constant flow rate
of 0.067 ml/sec on the top of sample fluid of 350 ml to push the sample out of the
vessel. Eventually, a bridge was formed by the particles on the fracture and prevented

7
the fluid exiting the vessel. Due to constant water injection, pressure increase was
observed. The bridge collapsed at an elevated pressure and sealing rebuilt up. This
situation repeated several times until the whole fluid (350 ml) exits the vessel. All
pressures were recorded by using computer data acquisition system. Each test was
repeated at least five times for reliability and average values of them were applied in
the analysis. The test results were correlated by a core fracturing set-up.
Figure 2.1: Schematics of PPA (Mostafavi et al, 2011)
Besides the effects of PSD and concentration, they also examined the impact of
fracture surface coefficient. In order to investigate it, tests were conducted by using a
smooth fracture surface and repeated it in wrinkled fracture surfaces.
Apart from the traditional data such as the maximum pressure observed in the cell
(Pmax ) and the cumulative filtrate volume, they introduced terms like average pressure
in the cell (Pave), average peak pressure in the cell (Ppeak), total number of bridges (N),
total number of zero (Z), average number of bridges per minute (Nt), average number
of zeros per minute (Zt), average number of peaks per one zero (Nz). They eliminated
the pressure related parameters due to differentiation with correlation tests on core
fracturing, Nz ,the number of bridges formed by particles with respect to the filtrate
volume, was found the most important estimated parameters in order to evaluate the
sealing properties of applied particles.

8
They developed two models according to the following results which were obtained
from tests on PPA and core fracturing.
✓ Plugging is more important than sealing during bridge formation. If the large
particles could not plug the opening first and smaller ones could not settle in
the void between the large particles.
✓ Higher concentrations of particles reduced filtration and make it easier to form
a bridge.
✓ If bridge is formed in a fracture with rough planes, higher pressure level is
necessary to remove it.
✓ Size of the opening influences the stability of the sealing negatively. Larger
particles are required to seal the openings.
✓ High resiliency of particles leads to build up stronger bridges over the fractures
and higher pressures are required to reinitiate loss circulation.
Hettema et al. (2007) designed on unique high-pressure testing device for determining
the sealing properties in fractured permeable formations as can be seen in the Figure
2.2. This device has the ability to measure two discrete fluid streams; (1) through the
fracture tip and (2) through the formation matrix. Two parallel 175-micron soapstone
plates were used in the cylindrical vessel of the device to simulate permeable medium.
This apparatus consists of a cylindrical vessel, four high-pressure accumulators to
handle both pore fluid and test fluid, four syringe pumps and a computer with data
acquisition system. Permeable Fracture testing apparatus provides the capability of
measurement of fluid losses at the tip and formation matrix, calculation of fracture
width and estimation of seal location.

9
Figure 2.2: Schematic of Permeable Fracture Test Device (Hettema et al, 2007)
Maximum sealing pressures, fracture size, leak-off rates through the tip and formation
matrix, particle size and seal location data were gathered from this device. They were
correlated with spurt loss values from PPA under similar condition with cut soapstone
plates. The spurt loss values were strongly correlated for low loss volumes which also
resulted in forming the most efficient seals whereas High-Temperature, High Pressure
fluid loss values at 300 oF and 500 psi so different. Also Scanning Electron
Microscope was used to see the physical nature of the fracture seals.
Results obtained from these tests,
✓ Fracture sealing in permeable media is highly dependent on both PSD and
concentration. LCM materials should have a broad PSD for effective sealing.
✓ For highly permeable or highly porous medium, using of relatively coarse
LCM blends is the most effective way to reduce spurt loss before formation of
bridge.
✓ Effective sealing occurs at or near the mouth of the fracture. Higher mud losses
are observed while sealing occurs further within the fracture (greater distance
from mouth).

10
✓ Maximum sealing pressure increases with the increase in concentration of
sized particles of LCM; not through total solids contribution of barite.
✓ Apart from spurt loss values, fluid loss is not a good parameter to measure the
sealing efficiency.
✓ They proposed that the most effective LCM formulation should include blends
of various grades of calcium carbonate (or ground marble), ground nut and
graphite.
Another test apparatus has been developed by Sanders et al. (2008) to evaluate the
sealing efficiency of LCM treatments in sealing impermeable fractured formations.
Fracture faces were simulated by the two matched corrugated aluminum platens as in
Figure 2.3. The fracture width is controlled by three set of screws. The most significant
benefit of this apparatus is to measure changes in the fracture width with the increase
in sealing pressure.
Figure 2.3: Corrugated Aluminum Platens for Fracture Tester (Sanders et al, 2008)
Impermeable Fracture Tester consists of three syringe pumps, in conjuction with two
accumulators to control mud pressure and fracture tip pressure within in the fracture
cell (FC). During the test, constant the fracture closure pressure and the fracture tip
pressure was maintained. The volume of filtrate collected from the tip and the fracture
closure volume were monitored by data acquisition system. Figure 2.4 shows all parts
of test apparatus.

11
To achieve these functions, mud pressure, i.e. fluid pressure applied through the
fracture and into the fracture tip by injecting the sample fluid at a constant flow rate,
conduction loss, i.e. fluid lost into the fracture through the fracture tip, and change in
fracture width is measured.
Dozens of materials including cellulosic, synthetic elastomers, rubber, polyethylene,
polyprophylene, mica, glass, graphite and petroleum coke-based materials, iron-based
compounds and calcium carbonate were tested in this apparatus. The effect of shape,
surface texture, material hardness, resilience, bulk density and size are also evaluated.
Figure 2.4: Schematics of Impermeable Fracture Test Device
12
According to test results, it was found that
✓ Proper size and distribution of sizes (particle-size range or PSD) are the most
critical parameter for fracture sealing.
✓ Required maximum size will be determined by the anticipated fracture width.
Efficient bridge can be achieved by good linear spread of particle below this
upper size.
✓ Roughness particles have been shown to be more efficient in sealing whereas
high aspect materials such as mica do not function well. In addition, if these
two parameters are optimized successfully, increase in concentration leads to
more rapid and efficient seal.
✓ Materials with a higher compressive strength will provide a more efficient seal.
Besides, resiliency plays an important role in the overall performance of
particles, however the importance of it is behind the other characteristics.
✓ The most effective LCM formulation should include blends of various grades
of calcium carbonate (or ground marble), ground nut and graphite.
Mechanical strengthening of wellbore relies on particle size distribution (PSD),
concentration and mechanical properties. (Mostafavi et al, 2011). Also, it is strongly
believed that the increase in the fracture gradient is affected by the physical properties
such as shape, strength, resiliency and the crushing resistance. The relation between
these parameters and wellbore strengthening mechanism can be tabulated in Table 2.1.
Every WSM type has own characteristic physical properties. Their shape, strength and
resiliency differ from each other somewhat. These physical properties were studied in
many researches. As a result of many experiments, Sanders et al (2008) found that
shape and texture are important parameters and spheroidal-shaped particles with rough
surface and low aspect ratio are the optimum shape to maximize the sealing pressure.
They also concluded that particles with high compressive strength shows a more
efficient seal. In addition, high resilient materials play an important role in forming
seal.

13
Table 2.1: Fundamental differences between wellbore strengthening mechanisms (Cock et al, 2012)
Category Fracture
Propagation
Resistance Stress Cage
Fracture
Closure Stress
Application technique
Continuous in
mud Continuous in
mud or pill
squeeze
Continuous in
mud or pill
squeeze
Formation or closure
stress applied?
No No Yes
Fracture tip isolation
required? Yes No Yes
High fluid loss required? No No Yes
WSM particle strength Unimportant
Somewhat
Important Unimportant
WSM particle size Important Important Unimportant
WSM particle type Important Important Unimportant
Alsaba et al. (2014c,2016) presented the effect of lost circulation material type, shape,
concentration and particle size distribution (PSD) on sealing integrity with respect to
differential pressure at different fracture widths. After sealing integrity tests, which
will be explained later, materials and formed seals were examined under Optical
Microscope and Scanning Electron Microscope to correlate performance of samples
with the particle morphology. They found that particle shape, in terms of sphericity
and roundness, exhibits significant effect on the overall seal integrity. The low
sphericity and angularity of nutshells particles resulted in a better alignment of the
particles within the fracture and maintaining higher seal integrities compared to
graphite and calcium carbonate. In other words, thanks to irregular shape, nut shell
particle perform better performance.
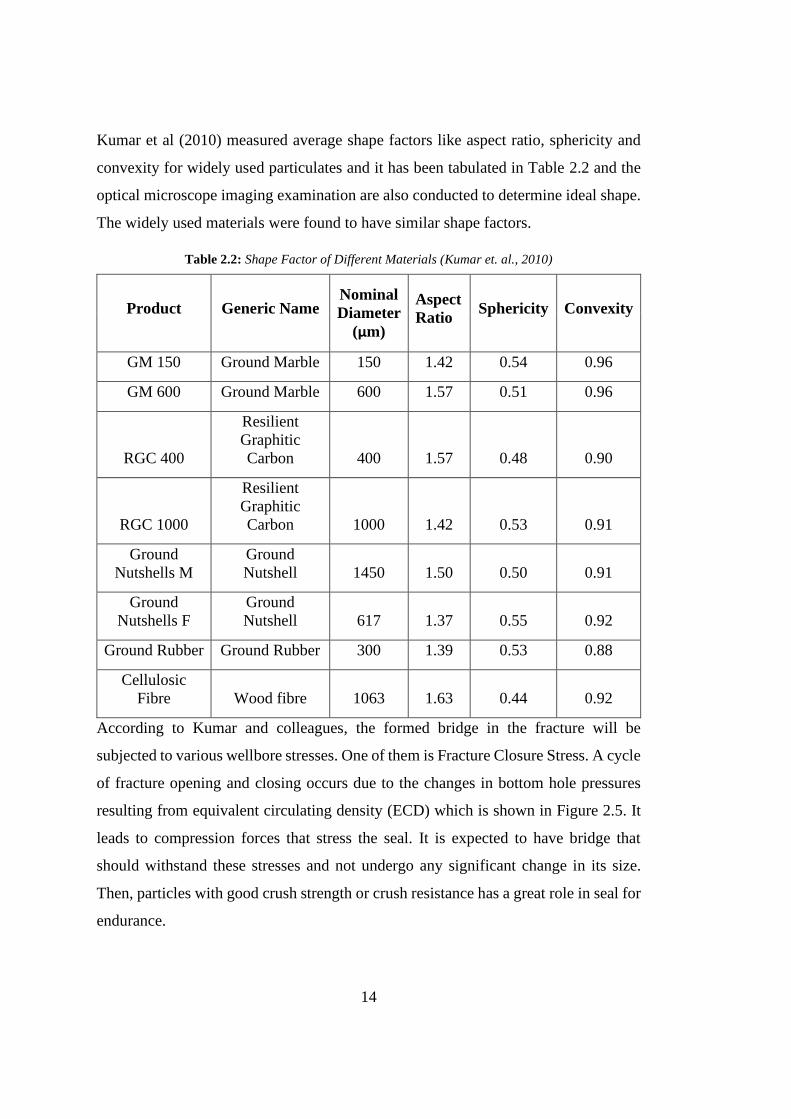
14
Kumar et al (2010) measured average shape factors like aspect ratio, sphericity and
convexity for widely used particulates and it has been tabulated in Table 2.2 and the
optical microscope imaging examination are also conducted to determine ideal shape.
The widely used materials were found to have similar shape factors.
Table 2.2: Shape Factor of Different Materials (Kumar et. al., 2010)
Product Generic Name Nominal
Diameter
(µm)
Aspect
Ratio Sphericity Convexity
GM 150 Ground Marble 150 1.42 0.54 0.96
GM 600 Ground Marble 600 1.57 0.51 0.96
RGC 400
Resilient
Graphitic
Carbon 400 1.57 0.48 0.90
RGC 1000
Resilient
Graphitic
Carbon 1000 1.42 0.53 0.91
Ground
Nutshells M
Ground
Nutshell 1450 1.50 0.50 0.91
Ground
Nutshells F
Ground
Nutshell 617 1.37 0.55 0.92
Ground Rubber Ground Rubber 300 1.39 0.53 0.88
Cellulosic
Fibre Wood fibre 1063 1.63 0.44 0.92
According to Kumar and colleagues, the formed bridge in the fracture will be
subjected to various wellbore stresses. One of them is Fracture Closure Stress. A cycle
of fracture opening and closing occurs due to the changes in bottom hole pressures
resulting from equivalent circulating density (ECD) which is shown in Figure 2.5. It
leads to compression forces that stress the seal. It is expected to have bridge that
should withstand these stresses and not undergo any significant change in its size.
Then, particles with good crush strength or crush resistance has a great role in seal for
endurance.

15
Figure 2.5: Alteration in Fracture Width with Changing Equivalent Circulating Density (ECD)
(Kumar et al, 2010)
Tinius Olsen Hydraulic Press Tester was used for crushing resistance determination
and resiliency determination. They compare widely used materials such as Ground
Marble (GM), Resilient Graphitic Carbon (RGC), Ground Nut Shells (GNS). Results
can be shown as followings:
✓ GM acts like a brittle material since it was undergoing high compaction and
its particle size reduced under load. Also, it shows ZERO resiliency in
resiliency test.
✓ GNS acts like a ductile material. Although, it undergoes permanent
deformation, there is no significant change in particle size and increase in
particle size is observed. Also, during resiliency test it exhibits approximately
16% resiliency.
✓ RGC undergoes elastic deformation and it bears stresses without undergoing
significant particle change and the resiliency of it is around 120% at 10000 psi.
✓ Blending just 20% by volume of RGC particles with other materials increase
crushing resistance.
According to the crush test and resiliency tests, it is concluded that mechanical
strength of material will play an important role for wellbore strengthening and Ground
Marble or Ground Nut Shell may not be effective as WSM when used alone. Savari et
al. (2014) supported this idea by indicating ground marble particles alone were not
able to plug the tapered slot and plug breaking pressure, the maximum pressure which
bridge withhold before further fluid loss was resumed, is zero for Ground Marble.
16
In this study, it was planned to design WSM for highly fractured carbonate reservoir
that is why removal of particles after drilling or solubility of particles in acid were
taken into consideration. Since Resilient Graphitic Carbon and Ground Nut Shells
cannot be removed totally during acidizing operations, residual particles can plug
hydraulic channels. They may not be recovered back from these hydraulic channels
with backflow during production operations and that can lead to reduction in
production. On the other hand, Ground Marble is chemically calcium carbonate and
as it is known, calcium carbonate is the most widely used, granular type of bridging
material. Its mechanical and chemical characteristics are the primary reasons to
consider Ground Marble to be used in the production zones since it can be removed to
recover the permeability of the rock by hydrochloric acidizing.
In this study, Ground Marble is also selected as WSM particles because of its
solubility. Also, the results by Kumar et al (2010) showed that Ground Marble were
not able to plug alone was also rechecked in this study.
There have been several studies for selection of material based on size to effectively
plug the fracture or pore to keep the fluid loss at minimum.
Loeppke et al. (1990) studied high temperature and fracture dominated loss zones in
geothermal fields instead of matrix loss zones. They developed models for single-
particle bridging and multiple-particle bridging. These models indicate that size and
shape have a great importance in determining the maximum allowable pressure
differential across the plug. They stated that when dimension of particle is slightly
larger than the fracture, higher maximum allowable pressure differentials are obtained
for single particle bridging. They also emphasized that when concentration increases,
the probability of forming a bridge increases whereas volume of spurt loss decreases.
Rojas et al. (1998) evaluated various fluid combinations which includes different
particle sealing agents such as particulates (CaCO3) and fibres in a standard API sand
bed test, a purpose-built fracture crack cell and in the Permeability Plugging Apparatus
(PPA). They found that the drilling fluid must contain a wide range of particles and

17
largest particles should be at least as large as the fracture width or the diameter of the
largest pore throat. Also, sealing capability increases with increasing concentration.
Dick et al (2000) proposed ideal packing theory (IPT). This theory defines the total
particle range required to seal all voids. The IPT is a graphical approach to determine
optimum PSD of bridging material for given formation. The IPT uses either pore
sizing from thin section analyses or permeability information, combined with PSD of
bridging material. However, it is not valid for sealing of fractures since fractures have
unlimited permeability.
Vickers et al (2006) tried to expand Ideal Packing Theory (IPT). IPT approach
depends on an estimation of the median pore size estimated from permeability by
taking the square root of the permeability. If the size distribution of pore throats in a
reservoir were linear, IPT would be accurate. However, in a reservoir the most
common pore throat will not be the middle of the size range. Therefore, according to
this theory, bridging blend should meet the following standards:
D(90) = largest pore throat
D(75) < 2/3 of largest pore throat
D(50) +/- 1/3 mean pore throat
D(25)= 1/7 of mean pore throat
D(10) > smallest pore throat
Whitfill (2008) proposed that the d50 of the particle size distribution should be equal
to estimated fracture width. Therefore, Sufficient particles both larger and smaller than
the estimated fracture width are present.
Alsaba et al (2016) found that to effectively seal fractures using granular LCM
treatments, the D90 value should be equal or slightly larger than the anticipated
fracture width.
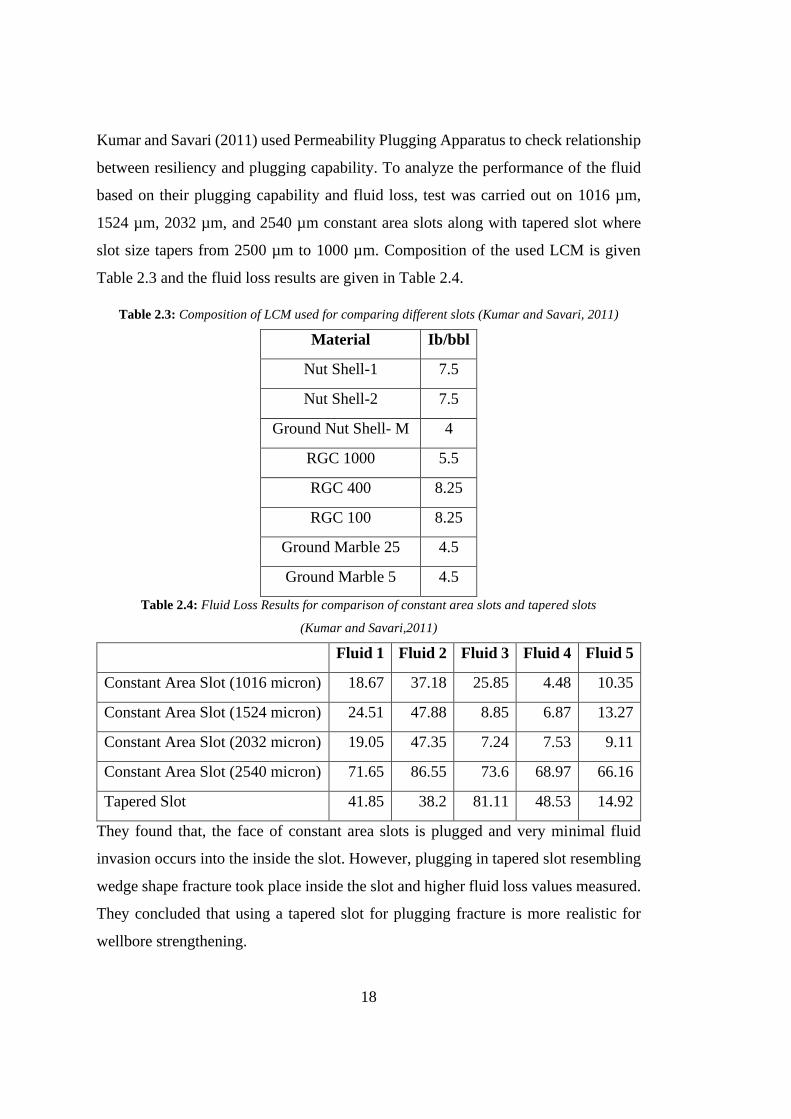
18
Kumar and Savari (2011) used Permeability Plugging Apparatus to check relationship
between resiliency and plugging capability. To analyze the performance of the fluid
based on their plugging capability and fluid loss, test was carried out on 1016 µm,
1524 µm, 2032 µm, and 2540 µm constant area slots along with tapered slot where
slot size tapers from 2500 µm to 1000 µm. Composition of the used LCM is given
Table 2.3 and the fluid loss results are given in Table 2.4.
Table 2.3: Composition of LCM used for comparing different slots (Kumar and Savari, 2011)
Material Ib/bbl
Nut Shell-1 7.5
Nut Shell-2 7.5
Ground Nut Shell- M 4
RGC 1000 5.5
RGC 400 8.25
RGC 100 8.25
Ground Marble 25 4.5
Ground Marble 5 4.5
Table 2.4: Fluid Loss Results for comparison of constant area slots and tapered slots
(Kumar and Savari,2011)
Fluid 1 Fluid 2 Fluid 3 Fluid 4 Fluid 5
Constant Area Slot (1016 micron) 18.67 37.18 25.85 4.48 10.35
Constant Area Slot (1524 micron) 24.51 47.88 8.85 6.87 13.27
Constant Area Slot (2032 micron) 19.05 47.35 7.24 7.53 9.11
Constant Area Slot (2540 micron) 71.65 86.55 73.6 68.97 66.16
Tapered Slot 41.85 38.2 81.11 48.53 14.92
They found that, the face of constant area slots is plugged and very minimal fluid
invasion occurs into the inside the slot. However, plugging in tapered slot resembling
wedge shape fracture took place inside the slot and higher fluid loss values measured.
They concluded that using a tapered slot for plugging fracture is more realistic for
wellbore strengthening.

19
Several more tests are done to establish the effectiveness of a tapered slot by using
compositions which are from crush test results. The results can be seen in Table 2.5.
Table 2.5: Fluid Loss Testing Performed on Tapered Slot with different Particles
S1
No Combination Conc. D(10)
µm
D(50)
µm
D(90)
µm
Fluid Loss
(ml)
1 GM 600/RGC 400 80/20 479 677 1230 20
2 GM 600/RGC 400 50/50 329 629 1159 70
3 GM 1200 100 8 943 1489
No control
over fluid loss
4 RGC 100 100 604 1156 1539 20-30
5 GM 1200/RGC 400 80/20 11 847 1434 12
6 GM 1200/RGC 400 50/50 43 618 1307 5
7 GNS 100 243 1408 1935 5-7
8 GNS/RGC 50 80/20 49 1278 1879 18-20
9 GNS/RGC 400 80/20 250 1295 1888 10
10 GNS/RGC 1000 80/20 274 1339 1887 10
In the test, it was observed that;
• GM 1200 particles were able to plug the slot but did not control the fluid loss
because the interstitial void in the plug was too large and continuous fluid loss
occurs. By this way, pressure transmission from wellbore to the fracture tip
cannot be stopped and fracture propagation occurs. They concluded that
improper PSD could worsen the situation.
• The blend of Ground Marble(GM) and Resilient Graphitic Carbon(RGC) is
the one of the most effective LCM combination. By this way, they proved the
results obtained from resiliency and crushing test. They concluded that
resilient particles decrease the crushing of the particles and lead to have good
wellbore strengthening results.
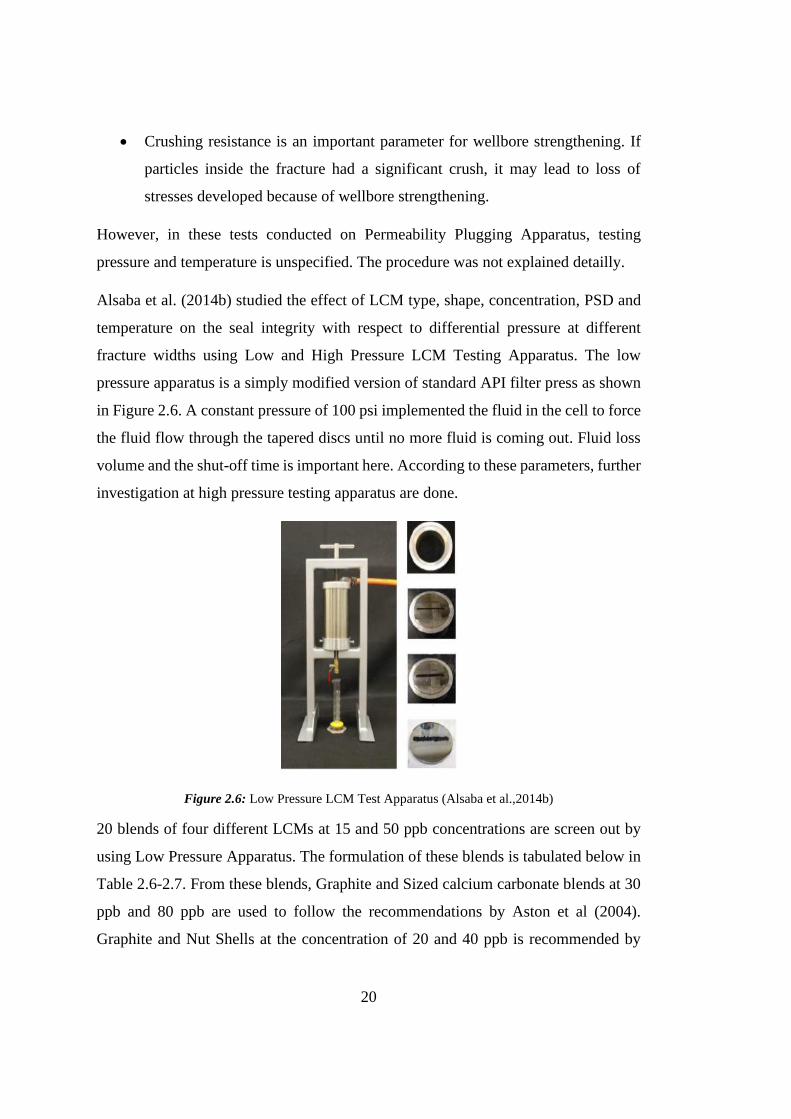
20
• Crushing resistance is an important parameter for wellbore strengthening. If
particles inside the fracture had a significant crush, it may lead to loss of
stresses developed because of wellbore strengthening.
However, in these tests conducted on Permeability Plugging Apparatus, testing
pressure and temperature is unspecified. The procedure was not explained detailly.
Alsaba et al. (2014b) studied the effect of LCM type, shape, concentration, PSD and
temperature on the seal integrity with respect to differential pressure at different
fracture widths using Low and High Pressure LCM Testing Apparatus. The low
pressure apparatus is a simply modified version of standard API filter press as shown
in Figure 2.6. A constant pressure of 100 psi implemented the fluid in the cell to force
the fluid flow through the tapered discs until no more fluid is coming out. Fluid loss
volume and the shut-off time is important here. According to these parameters, further
investigation at high pressure testing apparatus are done.
Figure 2.6: Low Pressure LCM Test Apparatus (Alsaba et al.,2014b)
20 blends of four different LCMs at 15 and 50 ppb concentrations are screen out by
using Low Pressure Apparatus. The formulation of these blends is tabulated below in
Table 2.6-2.7. From these blends, Graphite and Sized calcium carbonate blends at 30
ppb and 80 ppb are used to follow the recommendations by Aston et al (2004).
Graphite and Nut Shells at the concentration of 20 and 40 ppb is recommended by
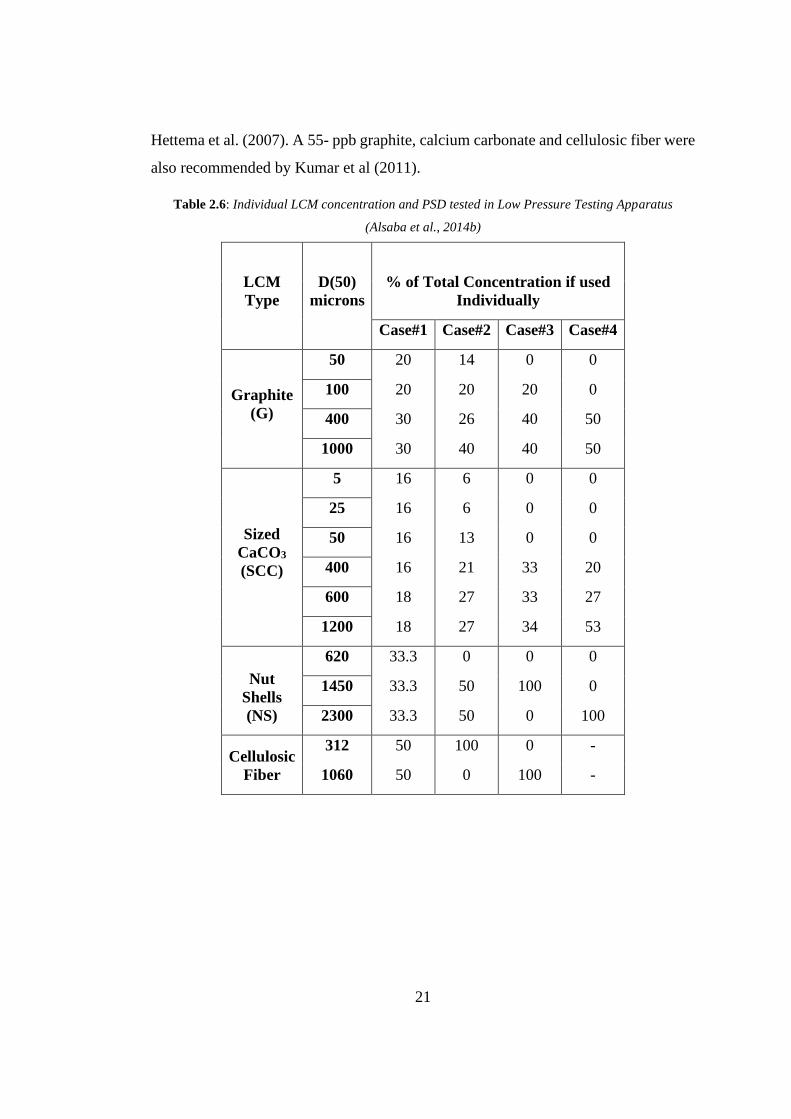
21
Hettema et al. (2007). A 55- ppb graphite, calcium carbonate and cellulosic fiber were
also recommended by Kumar et al (2011).
Table 2.6: Individual LCM concentration and PSD tested in Low Pressure Testing Apparatus
(Alsaba et al., 2014b)
LCM
Type
D(50)
microns
% of Total Concentration if used
Individually
Case#1 Case#2 Case#3 Case#4
Graphite
(G)
50 20 14 0 0
100 20 20 20 0
400 30 26 40 50
1000 30 40 40 50
Sized
CaCO3
(SCC)
5 16 6 0 0
25 16 6 0 0
50 16 13 0 0
400 16 21 33 20
600 18 27 33 27
1200 18 27 34 53
Nut
Shells
(NS)
620 33.3 0 0 0
1450 33.3 50 100 0
2300 33.3 50 0 100
Cellulosic
Fiber
312 50 100 0 -
1060 50 0 100 -

22
Table 2.7: Concentration and PSD of LCM Blends tested in Low Pressure Testing Apparatus
(Alsaba et al., 2014b)
LCM
Type
D(50)
microns
% of Total Concentration if used in combinations
G & SCC G, SCC & CF G & NS
Case#1 Case#2 Case#1 Case#2 Case#1 Case#2
Graphite
(G)
50 10 6.7 3.6 2.4 10 6.5
100 10 10 3.6 3.6 10 10
400 15 13.3 5.5 4.8 15 13.5
1000 15 20 5.5 7.3 15 20
Sized
CaCO3
(SCC)
5 3 0 4.4 0 - -
25 3 0 4.4 0 - -
50 7 0 9.5 0 - -
400 11 16.5 15.3 24 - -
600 14 16.5 19.6 24 - -
1200 14 17 19.6 24.7 - -
Nut
Shells
(NS)
620 - - - - 16.5 16.5
1450 - - - - 16.5 16.5
2300 - - - - 17 17
Cellulosic
Fiber
312 - - 4.5 4.5 - -
1060 - - 4.5 4.5 - -
A total of 160 tests were conducted with 4 different tapered slots. 100 ml fluid loss
has been determined as cut-off value. If fluid loss goes over 100 ml, it is said to be
non-controlled. In this test 26 blends were successful. Then, sealing efficiency of these
blends are evaluated in High Pressure Test Apparatus shown in Figure 2.7.
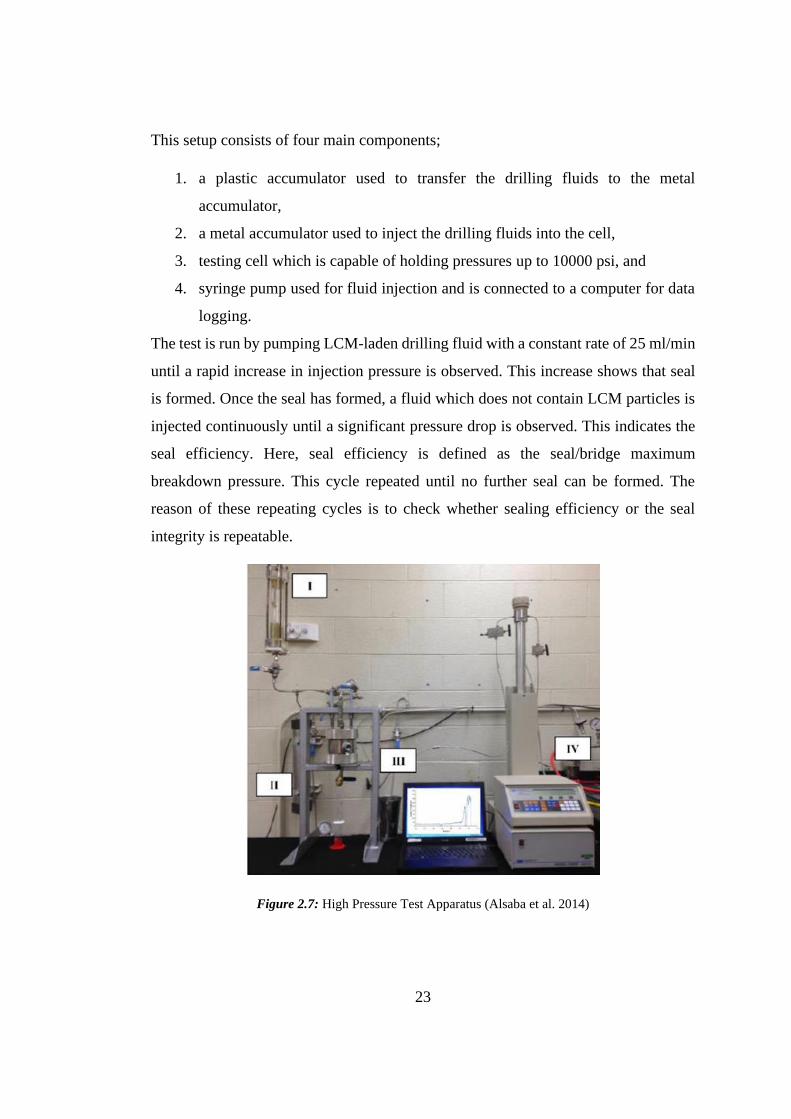
23
This setup consists of four main components;
1. a plastic accumulator used to transfer the drilling fluids to the metal
accumulator,
2. a metal accumulator used to inject the drilling fluids into the cell,
3. testing cell which is capable of holding pressures up to 10000 psi, and
4. syringe pump used for fluid injection and is connected to a computer for data
logging.
The test is run by pumping LCM-laden drilling fluid with a constant rate of 25 ml/min
until a rapid increase in injection pressure is observed. This increase shows that seal
is formed. Once the seal has formed, a fluid which does not contain LCM particles is
injected continuously until a significant pressure drop is observed. This indicates the
seal efficiency. Here, seal efficiency is defined as the seal/bridge maximum
breakdown pressure. This cycle repeated until no further seal can be formed. The
reason of these repeating cycles is to check whether sealing efficiency or the seal
integrity is repeatable.
Figure 2.7: High Pressure Test Apparatus (Alsaba et al. 2014)
24
According to these tests, the following results are found:
✓ LCM can seal effectively if the D90 value is equal or slightly larger than the
anticipated fracture width. However, when determining maximum size of
conventional LCM particles, the risk of plugging downhole tools is taken into
consideration.
✓ The broad range of PSD is necessary for a good sealing performance.
✓ Higher concentration was found to improve sealing efficiency.
✓ The irregular shape and the ability to deform under pressure improves seal
integrity.
✓ A strong relationship between sealing efficiency and fluid loss values is
observed.
✓ There is no significant effect of temperature on fluid loss.
✓ While granular particles (Ground Marble, Resilient Graphitic Carbon) have
lower seal integrity, Fibrous material showed superior performance.
Due to swelling ability at higher temperatures, the sealing efficiency of Ground Nut
Shells has improved
25
CHAPTER 3
3. STATEMENT OF PROBLEM
Lost circulation is one of the primary problems in drilling industry. There are several
ways for treatment of lost circulation. Using wellbore strengthening materials is the
most popular way for preventing lost circulation because of simplicity of usage and
economic reasons. It is important to determine the type, composition, particle size,
and the rheology of the fluid successfully.
Intention of the study is to conduct experimental investigation on determining
optimum concentration and particle size distribution for sealing fractured reservoirs.
By doing this, the effect of particle size distribution, concentration and fracture width
on sealing are also examined.

27
CHAPTER 4
4. THEORY
The wellbore strengthening techniques have been extensively used in the drilling
industry to prevent or mitigate drilling fluid loss. Wellbore strengthening can be
defined as methods to artificially increase the maximum pressure a wellbore can
withstand without intolerable mud losses. Wellbore strengthening aims to enhance the
effective fracture pressure and widen the mud weight window, rather than increasing
the strength of the wellbore rock [Ito, Zoback & Peska (2001), Abé, Keer, Mura
(1976), Geertsma, De Klerk (1969), Feng & Gray (2016)]. By preventing and/or
mitigating fluid loss, wellbore strengthening also reduces lost circulation associated
NPT events, e.g. wellbore instability, pipe sticking, underground blowouts, and kicks.
Wellbore strengthening attempts to bridge, plug, or seal wellbore fractures with lost
circulation materials (LCMs) to arrest the propagation of lost circulation in fracture(s).
The pressure-bearing capacity of the wellbore can be enhanced by one or a
combination of the following mechanisms in wellbore strengthening treatments.
✓ Bridge a fracture near its mouth to increase the local compressive hoop stress
around the wellbore and enhance fracture opening resistance.
✓ Widen and prop a fracture to enhance the fracture closure stress that acts on
closing the fracture.
✓ Form a filter cake in the fracture to isolate the fracture tip from wellbore
pressure and enhance resistance to fracture propagation.
Hoop Stress Enhancement or Stress Cage Model
In this model, Alberty and McLean,(2004) proposed that with the addition of suitable
WSM to the drilling fluid, the hoop stresses around the wellbore may be increased
thanks to setting of WSM at the fracture mouth and forming a seal.
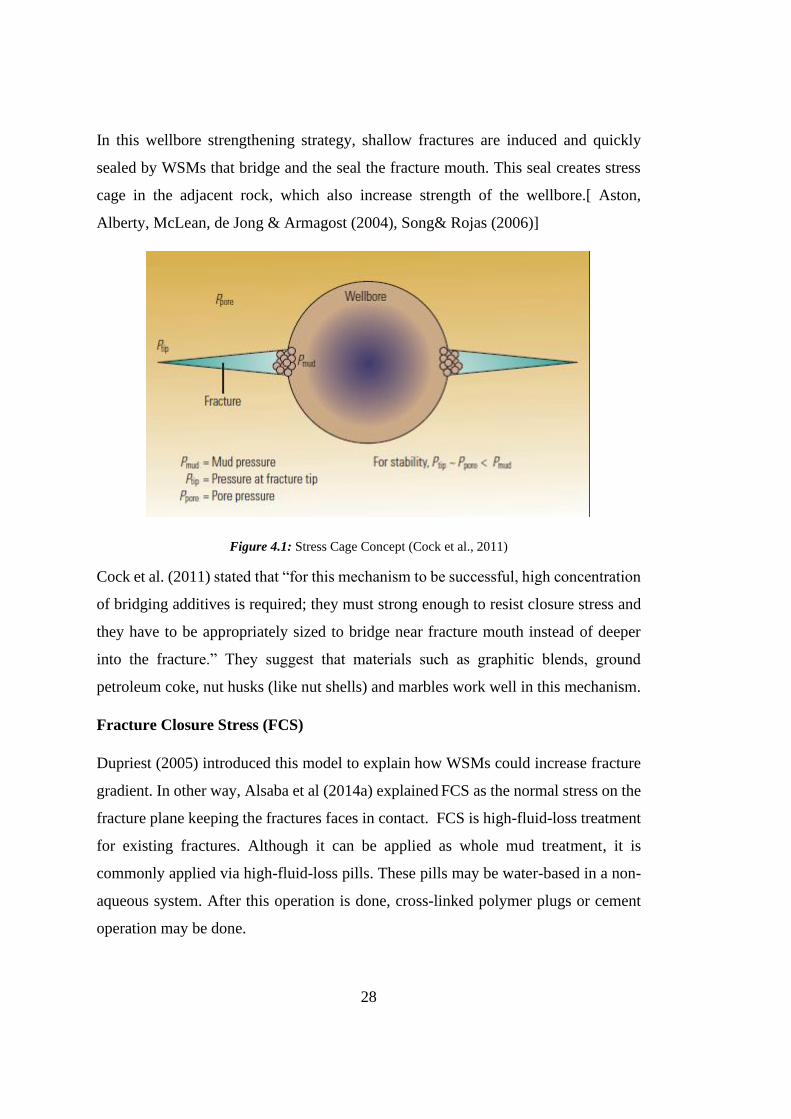
28
In this wellbore strengthening strategy, shallow fractures are induced and quickly
sealed by WSMs that bridge and the seal the fracture mouth. This seal creates stress
cage in the adjacent rock, which also increase strength of the wellbore.[ Aston,
Alberty, McLean, de Jong & Armagost (2004), Song& Rojas (2006)]
Figure 4.1: Stress Cage Concept (Cock et al., 2011)
Cock et al. (2011) stated that “for this mechanism to be successful, high concentration
of bridging additives is required; they must strong enough to resist closure stress and
they have to be appropriately sized to bridge near fracture mouth instead of deeper
into the fracture.” They suggest that materials such as graphitic blends, ground
petroleum coke, nut husks (like nut shells) and marbles work well in this mechanism.
Fracture Closure Stress (FCS)
Dupriest (2005) introduced this model to explain how WSMs could increase fracture
gradient. In other way, Alsaba et al (2014a) explained FCS as the normal stress on the
fracture plane keeping the fractures faces in contact. FCS is high-fluid-loss treatment
for existing fractures. Although it can be applied as whole mud treatment, it is
commonly applied via high-fluid-loss pills. These pills may be water-based in a non-
aqueous system. After this operation is done, cross-linked polymer plugs or cement
operation may be done.

29
In this method, WSM laden drilling fluid enters into the existing fractures. As fracture
is widened, carrier fluid leaks from the drilling fluids mixture through the fracture
walls or tip. The particles in this slurry consolidate and agglomerate during squeeze
phase. Then, the communication between the wellbore and fracture tip are cut off.
Therefore, sealing of the fracture tip is achieved. By isolating fracture tip, adjacent
rock is compressed and it leads to changing near wellbore hoop stresses.
In this theory, plug can form anywhere in the fracture, unlike in stress caging theory.
According to Cock et al (2011), the ideal WSM which is suitable for this theory must
be capable of relatively large particles of similar size and considerable roughness that
do not pack well. They show diatomaceous earth or barite as an example.
Figure 4.2: Fracture Closure Stress Concept (Growcock, 2011)
Fracture Propagation Resistance (Fracture Tip Isolation)
In this strategy, the tip of existing fractures is isolated from wellbore, the fracture
propagation is stopped and fracture reopening pressure increases mechanically.
Actually, this strategy is a result of joint industry project known as the Drilling
Engineering association (DEA)-13, which was conducted in the mid 1980s to
determine why oil-base drilling fluids (OBDF) seemed to yield a lower fracture
gradient than water-base drilling fluids (WBDF). They found that there is no
difference in fracture initiation pressures for different fluid types and formulations,
however fracture propagation behavior influenced by fluid type and composition is
significantly different.

30
This difference explained by van Oort et al (2011) with a fracture tip screenout
phenomenon. According to van Oort et al (2011), when fracture growth initiates, some
amount of drilling fluid is lost into the new void space of the fracture. WSM laden
drilling fluid enters into the fracture and starts to isolate or screen the fracture tip from
the wellbore. Occurrence of this isolation varies according to fluid type.
In Water-Based Drilling Fluid (WBDF) systems, the fracture tip is isolated by an
external filter cake. This prevent effective pressure communication between fracture
tip and the drilling fluid. Therefore, fracture extension is blocked until drilling fluid
pressure is high enough to puncture this barrier. (See Figure 4.3a)
In Oil-Based Drilling Fluids (OBDF), an ultrathin internal filter cake cannot block the
communication between wellbore and fracture tip. This leads to fracture extension at
lower propagation pressures than with a WBDF. (See Figure 4.3b)
Cock et al (2012) states that synthetic graphite, ground nut hulls, and oil dispersible
cellulose particles are most effective in sealing a fracture and minimizing leakoff
through the fracture tip.
Figure 4.3: Fracture Tip Isolation Concept in (a)(left figure) WBDFs (b)(right figure) OBDFs
(Cock, 2012)
Regardless of the strategy for solution, the ability to cure severe losses which occurs
in fractures using WSM laden drilling fluids is of a great benefit in terms of reducing
the costs and time. In this study, our intention is to expand usage of WSM in sealing
fractures. Since fracture depth, shape and apertures may be highly variable, our aim
to seal the fracture mouth by WSMs and increase the wellbore strength
31
CHAPTER 5
5. EXPERIMENTAL SET-UP AND PROCEDURE
5.1. Determination of Particle Size Distribution
The first step of this study is to determine the size distribution of ground marble. Dry
sieve analysis was used to determine particle size distribution (PSD). During
determination of sieve sizes used, available manufacturer’s product range are taken
into consideration. Therefore, production of specially designed ground marble for this
study by manufacturer and availability of materials were ensured.
Samples of ground marble was obtained and separated according to sizes by sieving
through a series of stacked sieves with different sizes respectively as shown as Figure
5.1. Size of sieves can be seen in Table 5.1.
Table 5.1: Sieves Standard No. Mesh Sizes and Standard Sieves Designation
(Dhanlal De Lloyd, 2000)
Mesh Size
(µm)
TYLER
(Mesh)
ASTM-E11
(No)
BS410
(Mesh)
DIN-4188
(mm)
50 60 60 60 0.250
850 20 20 20 0.850
1180 16 16 16 1.180

32
Figure 5.1: Numbers of sieves and their mesh sizes in micron
Particle size distribution of ground marble used in this study is presented in Table 5.2.
According to it, a particle size under the size of 250 µm represent a fine sample,
particles between 250 µm - 850 µm sizes indicate medium size and particle size
includes between 850 µm - 1180 µm named coarse sample.
Table 5.2: Particle Size Distribution of Ground Marble
Particle Size
Coarse 850 µm – 1180 µm
Medium 250 µm – 850 µm
Fine < 250 µm
The ground marble samples were screened by using sieves and collected. Then, base
fluid which will be described in the following sections were prepared and different
amount of ground marble added to study the effect of particle size distribution and
concentration on seal integrity.

33
5.2. Composition of Drill-In Fluid
The polymer-based drill-in fluid used in this study. This system is a specially designed
for drilling through the reservoir section of a wellbore. Only additives essential for
filtration control and cuttings carrying are present in a drill-in fluid. The drill-in fluid
used in this study was formulated using modified starch, XCD, biocide and ground
marble. The features of used additives will be explained detailly in Section 5.3. Goal-
oriented tests were done to determine the concentration of used polymers. For
instance, standard fluid loss tests were done to determine the concentration of
Modified Starch, whereas rheology tests were done to determine the concentration of
XCD polymer. Detailed information will be found in Results and Discussion Part.
According to test results, the concentration of polymers used were shown in Table 5.3.
In this study, triazine based biocide was also used with concentration of 0.5%.
Table 5.3: Composition of Drill-in Fluid.
Additive Function Concentration
M.Starch Fluid loss reducer 7 lb/bbl
XCD Suspending agent 2 lb/bbl
Biocide Bactericide 0.5%
In this study, these additives were added to tap water. The chemical properties of tap
water are shown in Table 5.4.
Table 5.4: The properties of Tap Water
Properties Results
Alkalinity – Pf (ml) 0.00
Alkalinity – Mf (ml) 0.03
Sulfate (SO4-2) (mg/l) 120.00
Calcium (Ca+2) (mg/l) 68.00
Total Hardness (mg/l) 88.00
Chloride (Cl-) (mg/l) 350
Temperature (oF) 77

34
5.3. Additives Used in Drill-In Fluid Add
5.3.1. Modified Starch
Modified Starch, which is an anionic polymer, is a drilling mud additive which is used
to control fluid loss in water base muds. In this study technical grade modified starch,
which has brand name as AMYLOTROL by GEOS ENERGY INC is used with
concentration of 7 lb/bbl. Detailed information is given in Appendix A.1.
5.3.2. XCD Polymer
XCD polymer is anionic, finely powdered, high molecular weight Xantham Gum
biopolymer. It is used to achieve desirable rheology required for efficient cutting
lifting in water-based muds. In this study, technical grade XCD polymer, which has
brand name as REOZAN D by GEOS ENERGY INC was used in concentration of 2
lb/bbl. Detailed information can be reached in Appendix A.2.
5.3.3. Biocide
Triazine based biocide was used to protect modified starch and XCD polymer from
the bacterial attack. In this study, technical grade Triazine based biocide, which has
brand name as GEOCIDE T by GEOS ENERGY INC was used in concentration of
0.5%. Detailed information can be found in Appendix A.3.
5.3.4. Ground Marble
Its chemical composition is basically CaCO3 with S.G of 2.7 g/cm3. GM is preferred
to use in drill-in fluid because of the solubility in HCl acid. Different sizes of ground
marble are used during the experiments. Samples are named regarding to their micron
sizes after being sieved such as fine, medium and coarse.

35
5.4. Determination of Rheological Properties of Drill-In Fluid
GRACE M3600 Automatic Viscometer was used to determine the rheological
properties of the drill-in fluid. It is a true coaxial cylinder, rotational viscometer.
Specifications of the viscometer and measurement configurations are given in
Appendix-A.4. Rheological measurements were performed according to API-13B.
Rheological properties used to characterize the drill-in fluid are plastic viscosity (PV),
yield point (YP), low-shear rate yield point (LSRYP) and low-shear rate viscosity
(LSRV). These parameters were calculated as below:
PV (cP) = ϴ600 - ϴ300
YP (lb/ft2) = ϴ300 – PV
LSRYP = τy (lb/ft2) = 2 ϴ3 - ϴ6
LSRV at 0.0636 sec-1 is calculated by interpolating viscosity values measured at
0.0681 sec-1 and 0.0511 sec-1.
Figure 5.2: GRACE M3600 Automatic Viscometer
(Grace Instrument Company, M3600 Viscometer Manual)

36
5.5. Preparation of Drill-in Fluid
1. 7 ppb Modified starch in 350 cc tap water is aged dynamically during overnight
to become totally soluble and homogenized.
2. Added 2 ppb XCD polymer and mixed in mixer (Hamilton Beach brand) at
19770 rpm for 15 minutes to become totally soluble and homogenized.
3. Reduced the volume of drill-in fluid according to calculated volume increase
of Wellbore Strengthening Material (WSM) sample to get 350 cm3 drill-in
fluid embedded with WSM
4. Added WSM particles and mixed only one (1) more minute. It needs to mix
only one (1) minute to avoid from gridding effect.
5. Samples are taken for the sealing capability tests.
5.6. Sealing Capability Tests
Sealing capability tests are done on Permeability Plugging Apparatus (PPA) which is
shown in Figure 5.3. Specifications of the device are given in Appendix-A.5.
In this study, slotted steel discs are used to simulate highly fractured formations.
During test, hydraulic pressure applied from bottom of test cell by a hand pump. The
fluid in the cell try to flow through the aperture of slot. Steel slots are used to simulate
fractured formations. If slot becomes plugged, the pressure on the gauge of hand pump
starts to increase. By continuing pumping, pressure in the cell is increased. Once
desired pressure reached, tests will be completed.

37
Figure 5.3: Normal PPA Assembly
5.6.1. Customization of Slots & Parts of Permeability Plugging Apparatus
Due to selected working pressure and wellbore strengthening material, the standard
permeability plugging apparatus was customized and some changes were done on the
apparatus.
During trial tests, firstly straight slots which are made of Grade 303 Stainless Steel
were used. The reasons of use of steel are to simulate fracture width, avoid of bending
of filtration medium during tests and reutilize it. However, it is observed that although
wellbore strengthening particles passed through the slots it could plug needle valve on
the top cap as shown in Figure 5.4 and pressure increase due to this can lead to false
results. In other words, used wellbore strengthening particles can plug space around

38
needle valve instead of slot and it can be interpreted incorrectly as that used particles
sealed this fracture width.
Figure 5.4: Illustration of bridge formed by particles in the needle valve
Furthermore, top cap was redesigned as shown in Figure 5.5 and removed needle valve
since tests will have conducted at ambient temperature and there is no need back
pressure to prevent boiling of sample fluid.
Figure 5.5: Front view (the left figure) and bottom view (the right figure) of redesigned top cap

39
During trial tests, it had been also realized that flow was not appropriate between slot
and top cap. Since the slot is straight and some part of it faces the wall of top cap, the
wellbore strengthening particles which passed through the fracture edge face with bulk
structure of top cap. Then, these particles had lost their motion and started to
accumulate at the fracture from edge to center and eventually they plugged the whole
aperture as it is illustrated in Figure 5.6. Since this is not correct simulation of sealing,
it was decided to change the structure of slots and created a void between slot and top
cap.
Figure 5.6: Representation of accumulation of particles inside the fracture due to inappropriate flow
channel
Then, the slots which have void spaces as shown in Figure 5. were designed with
Grade 303 Stainless Steel. However, they could not withstand high differential
pressures and bended. Bending led to false results because it led to narrow fracture
face and could be easily plugged. It was decided to produce slots from Grade 316
Stainless Steel and we faced with the same results.
Figure 5.7: Front view (left figure) and Bottom view(right figure) of redesigned slots
Top cap
Slot
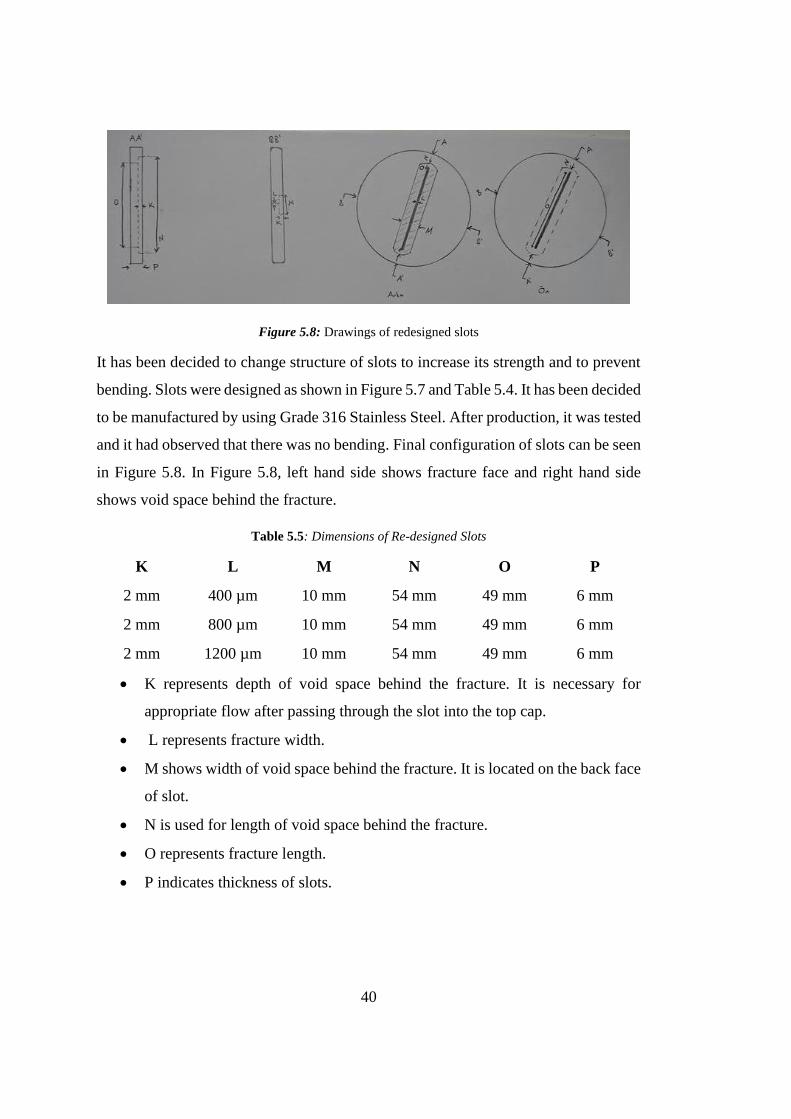
40
Figure 5.8: Drawings of redesigned slots
It has been decided to change structure of slots to increase its strength and to prevent
bending. Slots were designed as shown in Figure 5.7 and Table 5.4. It has been decided
to be manufactured by using Grade 316 Stainless Steel. After production, it was tested
and it had observed that there was no bending. Final configuration of slots can be seen
in Figure 5.8. In Figure 5.8, left hand side shows fracture face and right hand side
shows void space behind the fracture.
Table 5.5: Dimensions of Re-designed Slots
K L M N O P
2 mm 400 µm 10 mm 54 mm 49 mm 6 mm
2 mm 800 µm 10 mm 54 mm 49 mm 6 mm
2 mm 1200 µm 10 mm 54 mm 49 mm 6 mm
• K represents depth of void space behind the fracture. It is necessary for
appropriate flow after passing through the slot into the top cap.
• L represents fracture width.
• M shows width of void space behind the fracture. It is located on the back face
of slot.
• N is used for length of void space behind the fracture.
• O represents fracture length.
• P indicates thickness of slots.

41
Figure 5.9: Final Configuration of slots
The test set up was redesigned after many experiences from trial tests and final shape
is shown in Figure 5.10:
Figure 5.10: PPA Assembly used in the test

42
5.6.2. Test Procedure
Procedure for seal capability tests is given below step by step:
1. Collect WSM-laden mixture.
2. Drop defoamer into it to eliminate gas trapped in the mud.
3. Pour 350 ml of sample into the cell.
4. Place slot into the cell.
5. Start pumping of hydraulic oil. (STAGE-I is initiated)
6. When bridge starts to form, pressure on the gauge starts to increase. When it
reaches lowest recordable pressure (100 psi) (see Figure 5.11), record the
initial mud loss which indicates mud loss prior to sealing, i.e. mud loss up to
100 psi. (STAGE-I is finalized)
7. Continue to increase pumping with the rate of 10 psi/sec until pressure reaches
2000 psi. During this process whole pressure falls are recorded. (STAGE-II is
initiated)
8. When pressure reaches 2000 psi, make sure that seal can withstand under 2000
psi without pressure falling.
• If sudden pressure fall is observed, continue to recording pressure falls
and pumping with the rate of 10 psi/sec increment.
• If there is no sudden pressure fall, record mud loss values as mud loss
in Stage II. (STAGE-II is finalized)
Mud loss in Stage II indicates mud loss volume between 100 psi and 2000 psi.
It shows that whole mud loss which occurs during all pressure increments and
falls.
9. To see whether the seal can hold 2000 psi without break, wait 5 minutes and
continue to record pressure and volume change (STAGE-III is initiated). Mud
loss in Stage III shows mud loss during 5 minutes.
10. After 5 min, test is finished (STAGE-III is finished). Disassemble the cell and
remove the slot.
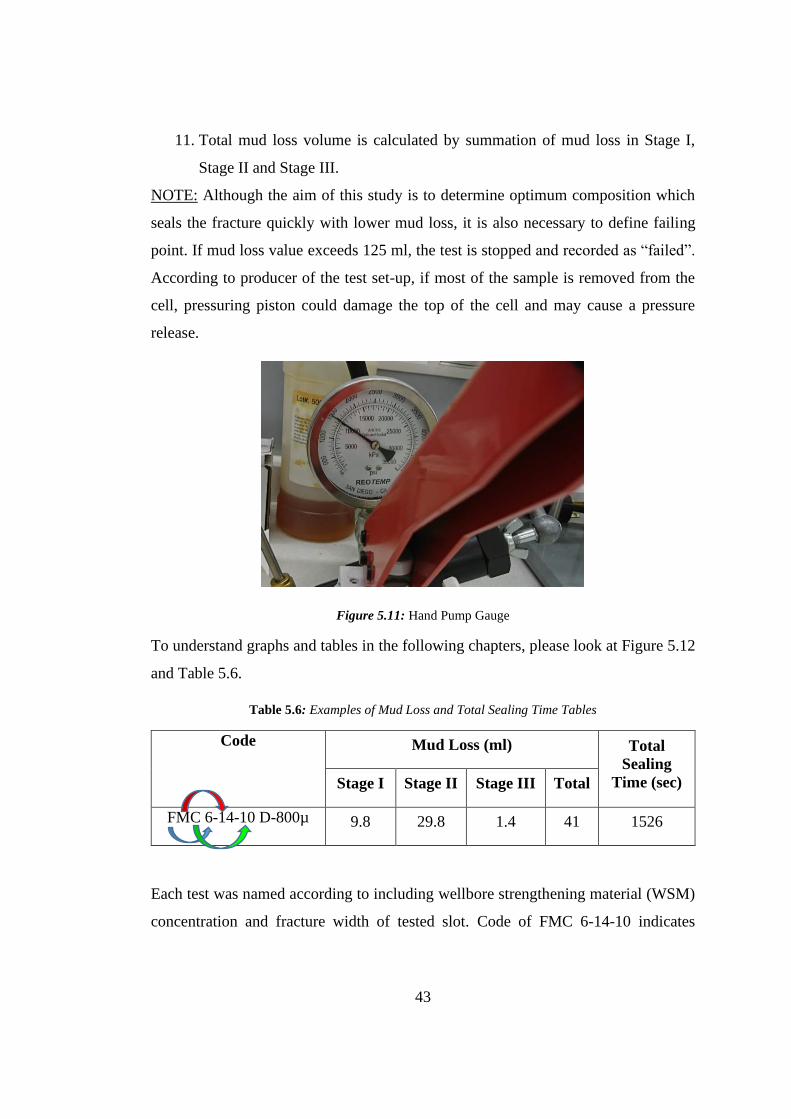
43
11. Total mud loss volume is calculated by summation of mud loss in Stage I,
Stage II and Stage III.
NOTE: Although the aim of this study is to determine optimum composition which
seals the fracture quickly with lower mud loss, it is also necessary to define failing
point. If mud loss value exceeds 125 ml, the test is stopped and recorded as “failed”.
According to producer of the test set-up, if most of the sample is removed from the
cell, pressuring piston could damage the top of the cell and may cause a pressure
release.
Figure 5.11: Hand Pump Gauge
To understand graphs and tables in the following chapters, please look at Figure 5.12
and Table 5.6.
Table 5.6: Examples of Mud Loss and Total Sealing Time Tables
Code Mud Loss (ml) Total
Sealing
Time (sec) Stage I Stage II Stage III Total
FMC 6-14-10 D-800µ 9.8 29.8 1.4 41 1526
Each test was named according to including wellbore strengthening material (WSM)
concentration and fracture width of tested slot. Code of FMC 6-14-10 indicates

44
concentration of used each WSM concentration. The first number indicates that the
concentration of fine size particles. In this example, FMC 6-14-10 includes 6 lb/bbl
fine sized ground marble. Second number is used for the concentration of medium
sized particles. FMC 6-14-10 has 14 lb/bbl medium sized ground marble. Third
number presents the concentration of coarse size particles. FMC 6-14-10 composition
includes 10 lb/bbl coarse sized particles. D-800µ indicates that test was done on the
fracture which has the width of 800 µ. For better understanding, the following
examples can be examined.
FMC 08-06-12 D-400µ indicates that WSM sample includes 8 ppb Fine, 6 ppb
Medium and 12 ppb Coarse particles. Also, it indicates that test was done on slot which
has 400-µm fracture width. On the other hand, FMC 10-00-02-D1200µ is used for test
of the sample with 10 ppb Fine and 2 ppb Coarse GM particles on slot having 1200-
µm fracture width.
Test steps can be explained detailly in the following:
Stage I:
• When seal forms on the fracture face, the bridge shows resistance to the flow.
• If hydraulic oil pumping is continued, pressure in the cell increases.
• When it reaches the lowest recordable pressure (100 psi) on gauge, pressure
vs time recording starts after mud loss value in Stage I had recorded.
• t0 in the x axis of graph indicates the time which pressure reach 100 psi and it
is accepted as 0.
• In stage I, it is recorded only the amount of fluid lost until bridge is formed.
Stage II: By the increment with rate of 10 psi/sec, whole pressure falls are recorded in
Stage II. Since Pressure increment rate is constant, the time is easily calculated
according to pressure data.
• If pressure reaches assumed maximum pressure sealing pressure (2000 psi),
seal efficiency is tested under 2000 psi about 20 sec.

45
• If there is no sudden pressure fall, it means that Stage II finished and Mud Loss
in Stage II is recorded. Since some amount of fluid passes through the bridge
during all pressure falls, mud loss may be higher in this stage.
Stage III: After Stage II has ended, Stage III starts. Endurance of bridge under 2000
psi overbalance is tested during 5 min. As can be seen, pressure slightly reduces in 5
minutes, the reason of this filtration occurs in seal pack in 5 minutes
• Some amount of fluid releases the seal therefore, pressure inside the cell
reduces.
• After 5 minutes, the mud loss in Stage III and total sealing time are recorded.
Figure 5.12: Representation of Pressure Sealing Test Graphs


47
CHAPTER 6
6. RESULTS AND DISCUSSION
In the first parts of this section, tests were done to determine suitable composition for
drill-in fluid. The ideal concentration of modified starch and XCD polymers used in
this study as filtration control and cuttings carrying additives of drill-in fluids
respectively were determined according to these tests. The concentration of modified
starch was determined by a result of standard API fluid loss test. Rheology tests were
done to determine the amount of XCD polymer to avoid settling of Wellbore
Strengthening Materials.
Based on the data obtained from several sealing capability tests of drill-in fluids with
different sized ground marble samples with different concentrations, both particle size
distribution and concentration effect on both sealing time and seal integrity are
evaluated in other parts. Sealing pressure vs time curves at ambient temperature are
presented for each sample of drill-in fluids in Appendix Part detailly. Total sealing
time and mud loss volume in each stage for the same composition are given in the
tables.
These tests results will be categorized firstly according to fracture width tests
conducted on. Then, the effect of particle size distribution (PSD) on sealing will be
evaluated for each fracture width separately and the optimum composition will be also
determined in these sections. After that, the effect of concentration on sealing will be
examined for each fracture width. Finally, the effect of fracture width on sealing will
be evaluated.
All results of total sealing time have been evaluated according to following success
criteria.

48
Success Criteria
The following criteria should be satisfied to define results as successful. In addition,
the needs in the field applications are taken into consideration.
• Rheological properties. To suspend and keep uniform distribution of WSMs,
low-shear rate viscosity values has gained importance. In this study, it is
accepted that Low Shear Rate Viscosity (LSRV) must be above 60,000 cP as
a rule of thumb. Their good suspension in the fluid can be ensured with this.
• Seal Point: Compositions must seal the fracture and resist to 2000 psi
overbalance. Thanks to this, formations, which leads to lost circulation problems
due to high pressure differentials even water-polymer drilling fluids used, can
be drilled.
All results should meet the success conditions above. If the result of one test for the
same sample did not meet these conditions, it could be said that this composition is
not appropriate to use.
Recommended Range
Although the results meet the success criteria, the repeatability of tests is also
important. To provide this, recommended range for each sample is presented. Since in
use of standard deviation which is commonly used in statistics can cause that close
data stay out from deviation range whereas the results diverge highly from each other
can be taken place in deviation range, in this study ±10% of mean is accepted as
recommended range. During the determination of this range, after the mean of three
tests determined for each sample, 10% of it is calculated. By subtracting this value
from mean, lower limit of recommended range is defined. By summing 10% of mean
up to mean, upper limit is determined. If total sealing time of these three tests are not
in this recommended range, the repeatability of tests can be seen as questionable.
Although mud losses are not primary indicator in comparison of samples, it can be
used as secondary parameter to determine the optimum composition.

49
6.1. Filtration Control
Standard API fluid loss tests conducted to determine the concentration of modified
starch which is commonly used for filtration control. During these tests the same
amount of fine-sized ground marble is used as bridging agent. The effect of
concentration of modified starch examined on low pressure (100 psi) filter press.
Results during the tests can be seen in Figure 6.1 and detailed results tabulated in
Table 6.1.
Figure 6.1: Comparison of Filtration Values
According to the results obtained from filtration tests, fluid loss decreased with
increasing concentration of modified starch. However, the same values were obtained
from tests with samples includes 7 lb/bbl and 9 lb/bbl modified starch. Therefore, 7
lb/bbl modified starch selected as the optimum concentration of fluid loss control
agent since the same filtration loss data were obtained by less amount of additive.
y = 0.3752x + 8.5439R² = 0.9784
y = 0.1848x + 5.9894R² = 0.9437
y = 0.1095x + 5.1288R² = 0.9579
y = 0.1052x + 3.4409R² = 0.9266
y = 0.1052x + 3.4409R² = 0.9266
0.0
5.0
10.0
15.0
20.0
25.0
0.0 10.0 20.0 30.0 40.0
Flu
id
Loss
(m
l)
Time (min)
Fluid Loss vs Time
1 ppb Modified Starch
3 ppb Modified Starch
5 ppb Modified Starch
7 ppb Modified Starch
9 ppb Modified Starch
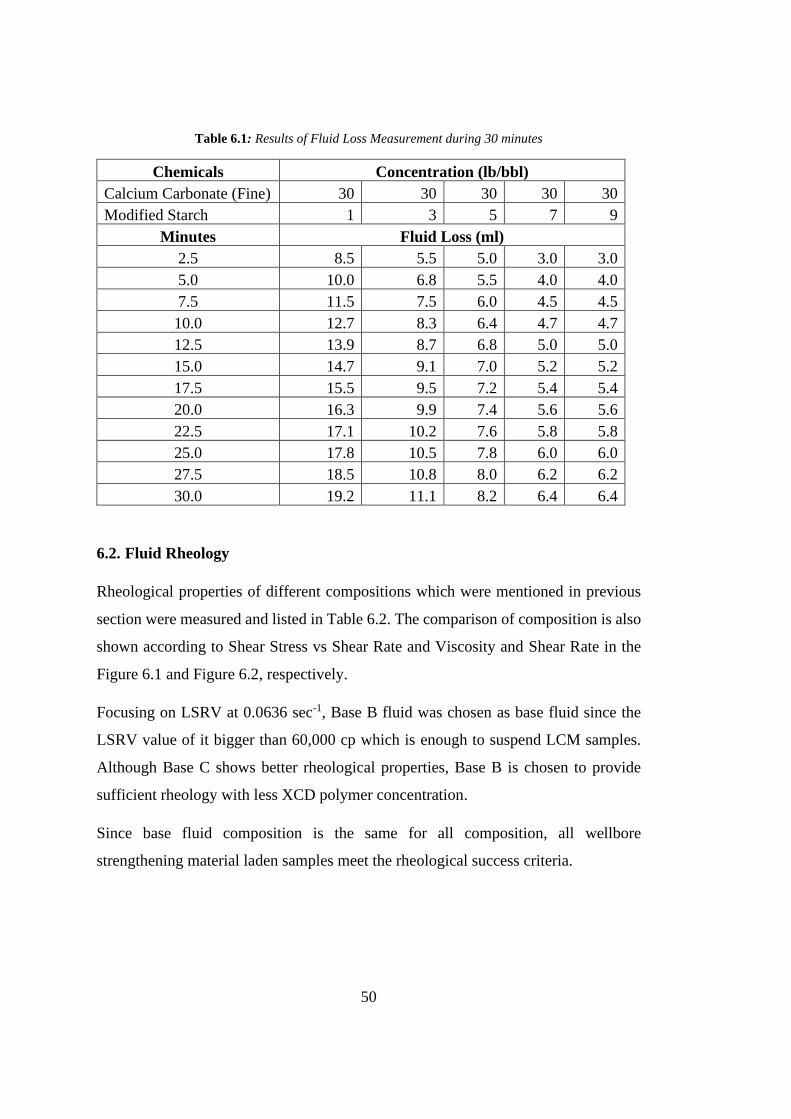
50
Table 6.1: Results of Fluid Loss Measurement during 30 minutes
Chemicals Concentration (lb/bbl)
Calcium Carbonate (Fine) 30 30 30 30 30
Modified Starch 1 3 5 7 9
Minutes Fluid Loss (ml)
2.5 8.5 5.5 5.0 3.0 3.0
5.0 10.0 6.8 5.5 4.0 4.0
7.5 11.5 7.5 6.0 4.5 4.5
10.0 12.7 8.3 6.4 4.7 4.7
12.5 13.9 8.7 6.8 5.0 5.0
15.0 14.7 9.1 7.0 5.2 5.2
17.5 15.5 9.5 7.2 5.4 5.4
20.0 16.3 9.9 7.4 5.6 5.6
22.5 17.1 10.2 7.6 5.8 5.8
25.0 17.8 10.5 7.8 6.0 6.0
27.5 18.5 10.8 8.0 6.2 6.2
30.0 19.2 11.1 8.2 6.4 6.4
6.2. Fluid Rheology
Rheological properties of different compositions which were mentioned in previous
section were measured and listed in Table 6.2. The comparison of composition is also
shown according to Shear Stress vs Shear Rate and Viscosity and Shear Rate in the
Figure 6.1 and Figure 6.2, respectively.
Focusing on LSRV at 0.0636 sec-1, Base B fluid was chosen as base fluid since the
LSRV value of it bigger than 60,000 cp which is enough to suspend LCM samples.
Although Base C shows better rheological properties, Base B is chosen to provide
sufficient rheology with less XCD polymer concentration.
Since base fluid composition is the same for all composition, all wellbore
strengthening material laden samples meet the rheological success criteria.
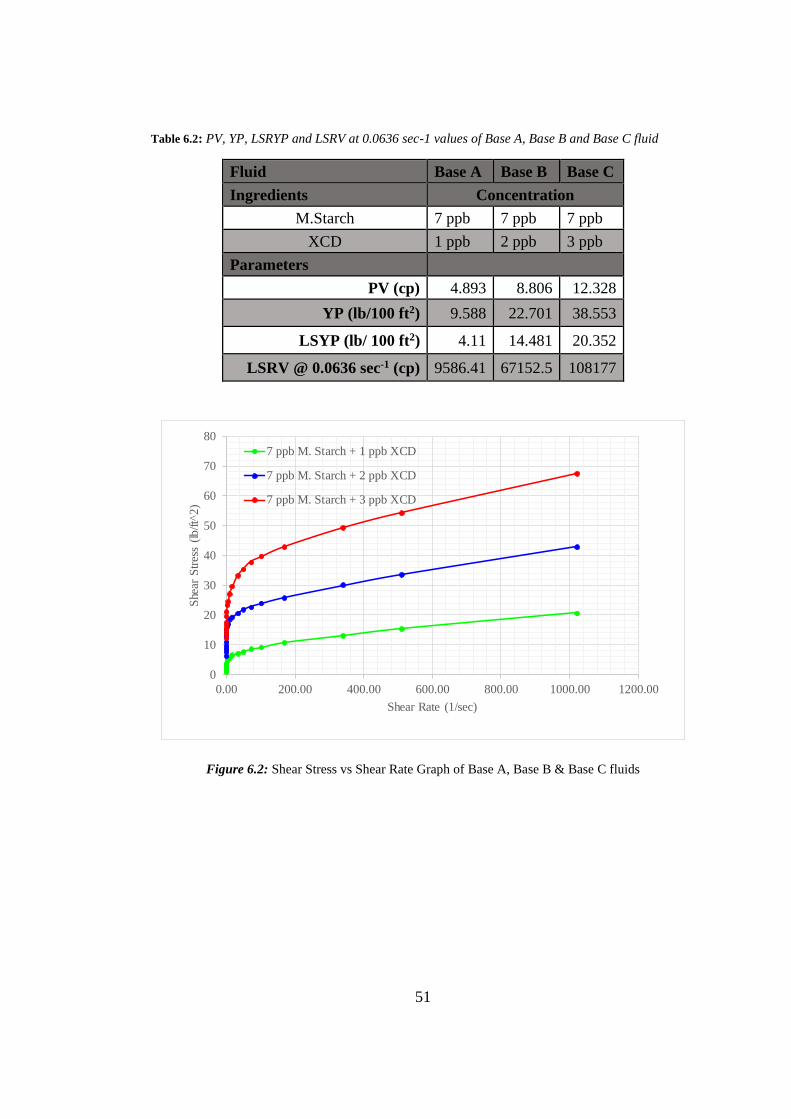
51
Table 6.2: PV, YP, LSRYP and LSRV at 0.0636 sec-1 values of Base A, Base B and Base C fluid
Fluid Base A Base B Base C
Ingredients Concentration
M.Starch 7 ppb 7 ppb 7 ppb
XCD 1 ppb 2 ppb 3 ppb
Parameters
PV (cp) 4.893 8.806 12.328
YP (lb/100 ft2) 9.588 22.701 38.553
LSYP (lb/ 100 ft2) 4.11 14.481 20.352
LSRV @ 0.0636 sec-1 (cp) 9586.41 67152.5 108177
Figure 6.2: Shear Stress vs Shear Rate Graph of Base A, Base B & Base C fluids
0
10
20
30
40
50
60
70
80
0.00 200.00 400.00 600.00 800.00 1000.00 1200.00
She
ar S
tres
s (lb
/ft^
2)
Shear Rate (1/sec)
7 ppb M. Starch + 1 ppb XCD
7 ppb M. Starch + 2 ppb XCD
7 ppb M. Starch + 3 ppb XCD
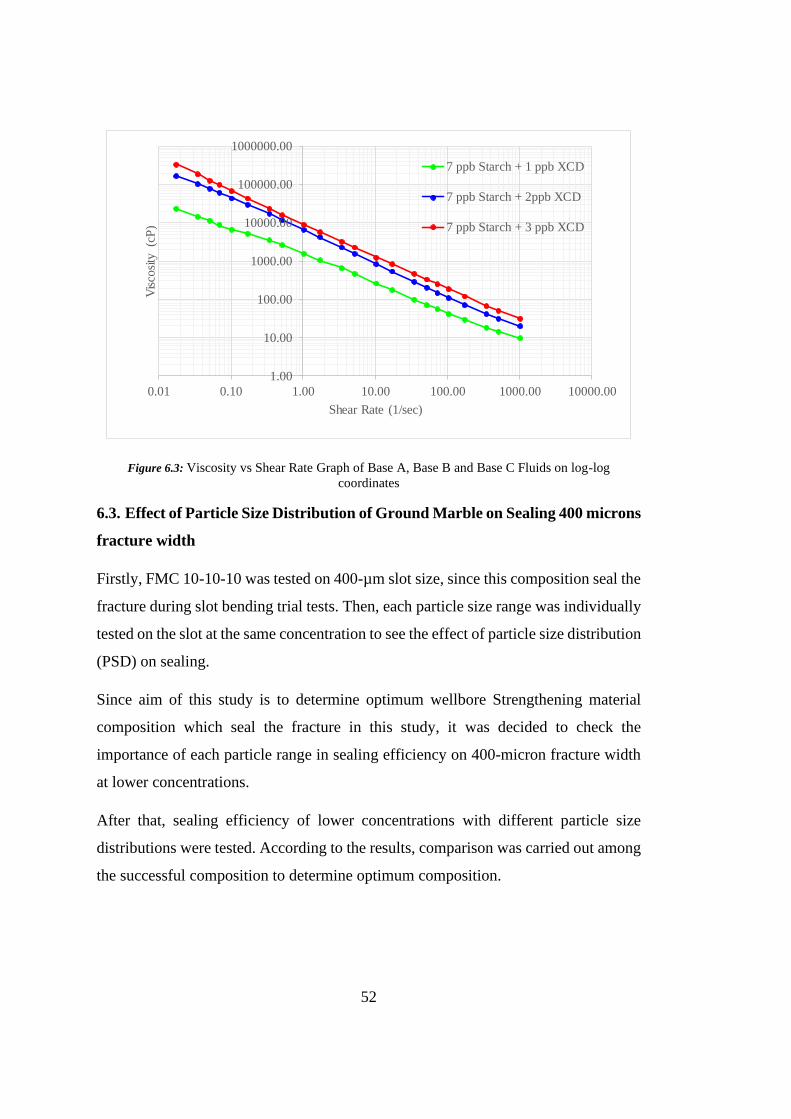
52
Figure 6.3: Viscosity vs Shear Rate Graph of Base A, Base B and Base C Fluids on log-log
coordinates
6.3. Effect of Particle Size Distribution of Ground Marble on Sealing 400 microns
fracture width
Firstly, FMC 10-10-10 was tested on 400-µm slot size, since this composition seal the
fracture during slot bending trial tests. Then, each particle size range was individually
tested on the slot at the same concentration to see the effect of particle size distribution
(PSD) on sealing.
Since aim of this study is to determine optimum wellbore Strengthening material
composition which seal the fracture in this study, it was decided to check the
importance of each particle range in sealing efficiency on 400-micron fracture width
at lower concentrations.
After that, sealing efficiency of lower concentrations with different particle size
distributions were tested. According to the results, comparison was carried out among
the successful composition to determine optimum composition.
1.00
10.00
100.00
1000.00
10000.00
100000.00
1000000.00
0.01 0.10 1.00 10.00 100.00 1000.00 10000.00
Vis
cosi
ty
(cP
)
Shear Rate (1/sec)
7 ppb Starch + 1 ppb XCD
7 ppb Starch + 2ppb XCD
7 ppb Starch + 3 ppb XCD

53
6.3.1. Results Obtained for Total Concentration of 30 ppb for 400-µm Slot Size
Each particle size range was tested individually on the 400-µm fracture width. 30
lb/bbl from each particle size range was taken and tested. Detailed results can be seen
in Appendix F.I.1. According to the results obtained, fine-sized particles
(FMC 30-0-0) and medium-sized particles (FMC 0-30-0) could not form a bridge on
this slot when they were used alone. Although coarse-sized particle
(FMC 0-0-30) could seal the fracture, it could not withstand higher pressure
differentials when it was used individually. Once mud loss value went over 125 ml,
the tests were finished and recorded as “failed” as mentioned before. However, the
fracture sealed and withstand 2000 psi overbalance when it was used from each
particle size range equally. Once 10 lb/bbl fine-sized, 10 lb/bbl medium-sized and 10
lb/bbl coarse-sized particles (FMC 10-10-10) were used, the bridge could be formed
and aimed pressure was reached quickly as can be seen in Figure 6.4. After bridge was
formed, pressure value reached to 2000 psi in 527.3 ± 3.5 sec according to Table 6.3.
Observed total mud loss value was 4.2 ± 0.5 ml and all tests are in recommended
range. Even these results can be used to show the importance of use of different
particle size ranges.

54
Figure 6.4: Pressure vs Time curve for FMC 10-10-10 on sealing 400-micron fracture width
Table 6.3: Mud Loss & Total Sealing Time Values for FMC 10-10-10 on 400-micron fracture
width
Code
Mud Loss (ml) Total
Sealing
Time (sec) Stage I Stage II Stage III Total
FMC 10-10-10 D-400µ 1.2 2.6 0.1 3.9 531.0
FMC 10-10-10 D-400µ-R1 1.6 2.2 0.2 4.0 524.0
FMC 10-10-10 D-400µ-R2 1.5 3.1 0.2 4.8 527.0
Mean - - - 4.2 527.3
Std Dev - - - 0.5 3.5
Deviation range, min - - - 3.7 523.8
Deviation range, max - - - 4.7 530.8
Recommended Range, min - - - - 474.6
Recommended Range, max - - - - 580.1
0
100
200
300
400
500
600
700
800
900
1000
1100
1200
1300
1400
1500
1600
1700
1800
1900
2000
0 50
100
150
200
250
300
350
400
450
500
550
600
Sea
ling
Pre
ssur
e (p
si)
Time (sec) t0+t
FMC 10-10-10 D-400 µ
FMC 10-10-10 D-400 µ-R1
FMC 10-10-10 D-400 µ-R2

55
6.3.2. Results Obtained for Total Concentration of 28 ppb for 400-µm Slot Size
Then, total concentration decreased to 28 lb/bbl and the effect of particle size
distribution was examined. FMC 8-10-10, FMC 10-8-10 and FMC 10-10-8
compositions were tested on 400-µm fracture width. Total sealing time and mud loss
values of each composition was recorded. The mean of total sealing time and total
mud loss values presented in Table 6.4. Detailed information can be found in
Appendix F.II. According to these test results, FMC 10-8-10 & FMC 10-10-8 shows
similar performance in terms of total sealing time whereas higher total sealing time
was observed in FMC 8-10-10. However, mud loss value of FMC 8-10-10 was slightly
higher than FMC 10-8-10 and FMC 10-10-8. Decrease in the concentration of fine-
sized particles led to increase in total sealing time and total mud loss values. In other
words, the aimed pressure can be reached later in FMC 8-10-10 than
FMC 10-8-10 and FMC 10-10-8.
Table 6.4: Comparison of FMC 8-10-10, FMC 10-8-10 & FMC 10-10-8
Composition
Total Sealing Time (sec) Total Mud Loss (ml)
Mean Std
Dev
Worst
Case Mean
Std
Dev
Worst
Case
FMC 8-10-10 570.7 42.3 617 6.2 0.9 7
FMC 10-8-10 526.7 13.5 540 5.1 1.5 6.6
FMC 10-10-8 517.7 19.1 538 4.7 1 5.8
6.3.3. Results Obtained for Total Concentration of 26 ppb for 400-µm Slot Size
When total concentration of WSM decreased to 26 ppb, the performance of FMC 6-
10-10, FMC 10-6-10 and FMC 10-10-6 were compared. Decrease in the concentration
of fine-sized particles continued to increase total sealing time and mud loss values.
Although this situation was the same for FMC 10-6-10, the increase in those values
were not large as in FMC 6-10-10. However, FMC 10-10-6 composition sealed the
fracture more quickly than others with lowest mud loss values. Besides all of these,
one test result of FMC 6-10-10 composition stayed out from recommended range since
pressure falls leads to increase in the difference between the total sealing times of the

56
same composition. Mean values of total sealing time and total mud loss can be seen
in Table 6.5. Detailed results can be found in Appendix F.III.
Table 6.5: Comparison of FMC 6-10-10, FMC 10-6-10 & FMC 10-10-6
Composition
Total Sealing Time (sec) Total Mud Loss (ml)
Mean Std
Dev
Worst
Case Mean
Std
Dev
Worst
Case
FMC 6-10-10* 589.7 72.7 673 7.4 1.7 9.3
FMC 10-6-10 552 40.7 599 5.9 0.4 6.3
FMC 10-10-6 527.7 10.4 536 4.5 0.5 5
*The results of FMC 6-10-10 composition is not in recommended range.
6.3.4. Results Obtained for Total Concentration of 24 ppb for 400-µm Slot Size
While comparing the effect of the different particle size ranges at 24 ppb
concentration, FMC 10-10-4 shows superior performance according to total sealing
time and total mud loss values as shown in Table 6.6. As can be seen in
Appendix F.IV.1, although, all tests with FMC 4-10-10 composition faced with major
pressure falls, all tests met the success criteria and reached aimed pressure. However,
third test of this composition (FMC 4-10-10 D-400µ-R2) spent more time than others
to reach aimed pressure. Therefore, total sealing time of it was largest and it led to
staying out FMC 4-10-10 composition from the recommended range. In addition to
suspicion about the repeatability of tests with FMC 4-10-10 composition, its sealing
time and mud loss values were the highest among samples which includes 24 lb/bbl
wellbore strengthening materials totally. On the other hand, the decrease in the
concentration of medium-sized particles did not cause slight changes in total sealing
time and mud loss values. FMC 10-4-10 showed nearly same time with FMC 10-6-10
composition. Again, decrease in the concentration of coarse-sized particles did not
change in total sealing time and total mud loss values.

57
Table 6.6: Comparison of FMC 4-10-10, FMC 10-4-10 & FMC 10-10-4
Composition
Total Sealing Time (sec) Total Mud Loss (ml)
Mean Std
Dev
Worst
Case Mean
Std
Dev
Worst
Case
FMC 4-10-10* 674 66.8 747 12.6 0.6 13.2
FMC 10-4-10 545.3 16 561 6.2 1.1 7.3
FMC 10-10-4 517 14 531 4.3 0.3 4.5
*The results of FMC 4-10-10 composition is not recommended range.
6.3.5. Results Obtained for Total Concentration of 22 ppb for 400-µm Slot Size
At the total concentration of WSMs is 22 ppb, FMC 2-10-10 requires more time to
reach the predetermined pressure and more fluid loss occurs during this process
according to others. As can be seen in Appendix F.V.1, although all tests met the
success criteria, in the third test, pressure in the cell which applied on the bridge was
lost suddenly. That was strongly originated from breaking of particle on the mouth of
the fracture under 2000 psi as it is illustrated in Figure 6.5. Endurance of bridge was
damaged by this breaking and seal breaking occurred. Pressure in the cell fell since
there was no barrier to resist. This led to bigger differentiation between total sealing
time values. Therefore, this composition stayed out from recommended range. The
repeat test with this composition might give different results.
Figure 6.5: Illustration of Particle Breaking under pressure

58
The values in terms of total sealing time and total mud loss of FMC 10-2-10 are
slightly bigger than FMC 10-10-2 as can be seen in Table 6.7. Decrease in the
concentration of FMC 10-10-2 leads to slight increase in total sealing time whereas
total mud loss can be seen the same with higher concentrations.
Table 6.7: Comparison of FMC 2-10-10, FMC 10-2-10 & FMC 10-10-2
Composition
Total Sealing Time (sec) Total Mud Loss (ml)
Mean Std
Dev
Worst
Case Mean
Std
Dev
Worst
Case
FMC 2-10-10* 846 272.9 1161 22.7 9.7 33.8
FMC 10-2-10 583 39 623 8.8 0.9 9.4
FMC 10-10-2 558.3 20 578 4.6 5 5.1
*The results of FMC 2-10-10 composition is not recommended range.
6.3.6. Results Obtained for Total Concentration of 20 ppb for 400-µm Slot Size
Then, total concentration decreased to 20 lb/bbl and the effect of the absence of one
particle size ranges were also examined by this way. FMC 0-10-10, FMC 10-0-10 and
FMC 10-10-0 were tested on 400-µm fracture width.
Firstly, the effect of the absence of fine sized particles were examined. As can be seen
in Appendix F.VI.1, none of these tests with FMC 0-10-10 composition could met the
success criteria. Although plugging occurred at 100 psi, then bridge damaged and mud
continued through the aperture. Once mud loss went over 125 ml, tests were finished.
This situation resembles like highly permeable sands as illustrated in Figure 6.6. In
the absence of fine-sized particles, medium and coarse sized particles accumulated at
the mouth of the fracture. Since the voids between the particles could not filled, the
mud flow through the bridge and fracture could not be prevented.

59
Figure 6.6: Illustration of flow through the highly permeable sands (Petropedia, 2018)
Although, absence of medium particles led to larger pressure drops, the bridge dealt
with higher pressure differentials and met the success criteria whereas the absence of
fine sized particles resulted in failure of tests. That means, the bridge is affected by
the absence of fine sized range particles more significantly than the absence of
medium sized range particles. On the other hand, the repeatability of FMC 10-0-10 is
questionable since two tests were not in recommended range.
On the other hand, FMC 10-10-0 composition showed superior performance.
Although there are no coarse-sized particles in the tested fluid, medium and fine sized
particles formed a good pack and quickly sealed the fracture with lower mud loss
values as can be seen in Table 6.8.
Table 6.8: Comparison of FMC 0-10-10, FMC 10-0-10 & FMC 10-10-0
Composition
Total Sealing Time (sec) Total Mud Loss (ml)
Mean Std
Dev
Worst
Case Mean
Std
Dev
Worst
Case
FMC 0-10-10 - - - >125 - -
FMC 10-0-10* 597.3 120 735 12.3 2.2 14.6
FMC 10-10-0 541.7 9.3 548 4.6 0.5 5
*The results of FMC 10-0-10 composition is not in recommended range.
60
According to previous tests, the dependency of sealing integrity on particle size ranges
can be summarized as follows:
• As the concentration of coarse sized particles decreased, total sealing time and
mud loss values were not affected from it in comparison with medium sized
and fine sized particles. The reason might be formation of good pack by
medium and fine sized particles. Since medium size particles range includes
larger particles than fracture width, it can plug the fracture width. When the
fine sized particles filled the gaps between the medium sized particles, the
fracture sealed. On the other hand, decrease in the concentration of fine sized
particles resulted in higher total sealing time and mud loss. Also, in the absence
of this range, bridge could not withstand higher pressures. That may be
because coarse and medium sized particles plugged the opening, however
interstitial voids could not be filled. It seems like if highly permeable
formations are sealed, after a while the seal is broken and some amount of fluid
passed through the slot until it is sealed again. However, the decrease in
medium sized particles leads to slight increase in total sealing time and mud
loss. In this case, fined sized particles and formed new sized particles after
crushes filled the voids between the larger particles which requires slightly
more time.
• As can be seen from the table, the concentration of fine sized particles is the
most important parameter. In the absence of it, higher pressures cannot be
reached. It is followed by medium sized particles since the lower concentration
of it causes the more time and more fluid loss. The importance of coarse sized
particles took place in the end of the line. Even the lack of these size, the total
sealing and mud loss values are close to values in higher concentration of it.
To determine the optimum composition, the following tests were done.
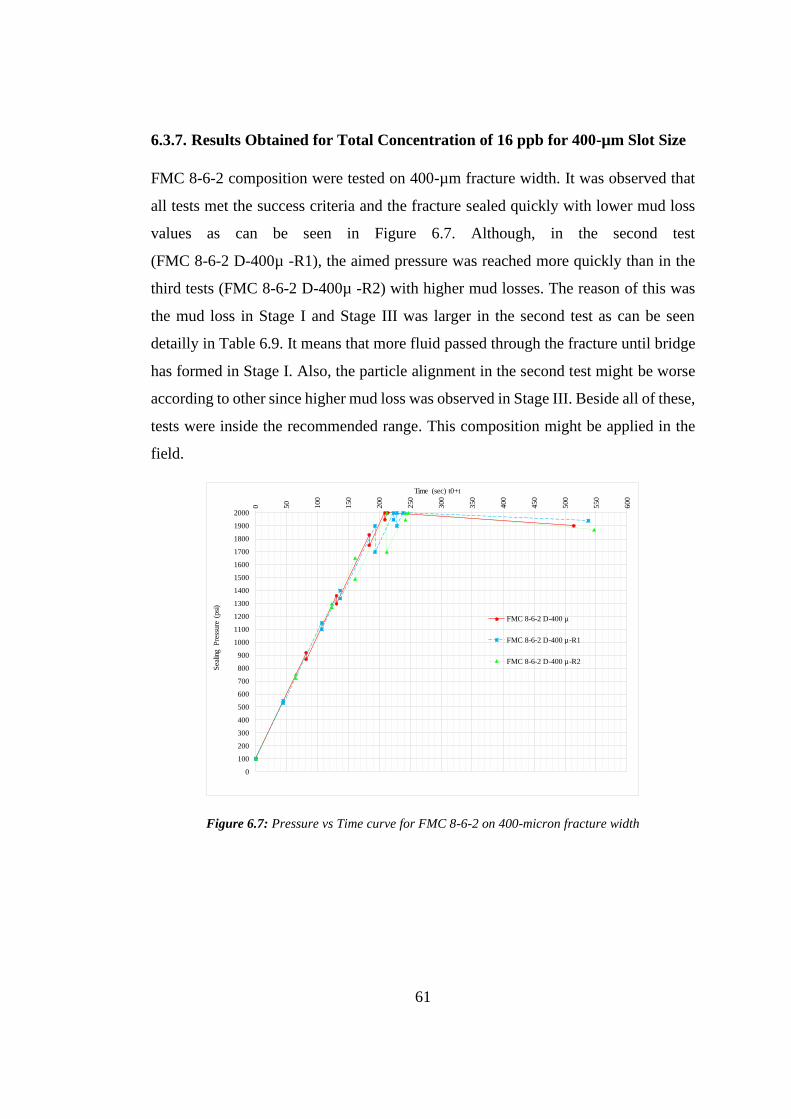
61
6.3.7. Results Obtained for Total Concentration of 16 ppb for 400-µm Slot Size
FMC 8-6-2 composition were tested on 400-µm fracture width. It was observed that
all tests met the success criteria and the fracture sealed quickly with lower mud loss
values as can be seen in Figure 6.7. Although, in the second test
(FMC 8-6-2 D-400µ -R1), the aimed pressure was reached more quickly than in the
third tests (FMC 8-6-2 D-400µ -R2) with higher mud losses. The reason of this was
the mud loss in Stage I and Stage III was larger in the second test as can be seen
detailly in Table 6.9. It means that more fluid passed through the fracture until bridge
has formed in Stage I. Also, the particle alignment in the second test might be worse
according to other since higher mud loss was observed in Stage III. Beside all of these,
tests were inside the recommended range. This composition might be applied in the
field.
Figure 6.7: Pressure vs Time curve for FMC 8-6-2 on 400-micron fracture width
0
100
200
300
400
500
600
700
800
900
1000
1100
1200
1300
1400
1500
1600
1700
1800
1900
2000
0 50
10
0
15
0
20
0
250
300
350
40
0
45
0
50
0
55
0
600
Sea
ling
Pre
ssur
e (p
si)
Time (sec) t0+t
FMC 8-6-2 D-400 µ
FMC 8-6-2 D-400 µ-R1
FMC 8-6-2 D-400 µ-R2

62
Table 6.9: Mud Loss & Total Sealing Time Values for FMC 8-6-2 on 400-micron fracture width
Code
Mud Loss (ml) Total
Sealing
Time (sec) Stage I Stage II Stage III Total
FMC 8-6-2 D-400µ 3.1 2 0.1 5.2 514
FMC 8-6-2 D-400µ-R1 3.4 3 0.3 6.7 538
FMC 8-6-2 D-400µ-R2 3 3.1 0.1 6.2 547
Mean - - - 6.0 533.0
Std Dev - - - 0.8 17.1
Deviation range, min - - - 5.3 515.9
Deviation range, max - - - 6.8 550.1
Recommended Range, min - - - - 479.7
Recommended Range, max - - - - 586.3
6.3.8. Results Obtained for Total Concentration of 14 ppb for 400-µm Slot Size
Once satisfied results were obtained with FMC 8-6-2 composition, the concentration
of fine-sized particles decreased to 6 lb/bbl and FMC 6-6-2 composition were tested
on 400-µm fracture width. The fracture sealed and aimed pressure was reached as can
be seen in Appendix F.VIII.1. After bridge was formed, pressure value reached to
2000 psi in 615.7 ± 20.6 sec and observed total mud loss value was 9.7 ± 0.8 ml. All
three tests with the same composition were inside the recommended range.
6.3.9. Results Obtained for Total Concentration of 12 ppb for 400-µm Slot Size
Then, FMC 4-6-2 composition were tested. The bridge could be formed and it resist
to 2000 psi overbalance as can be seen in Appendix F.IX.1. Aimed pressure reached
in 576.7 ± 27.8 sec. Observed total mud loss value was 9.9 ± 0.6 ml. In the second test,
(FMC 4-6-2 D-400µ-R1) composition reached to aimed pressure more quickly than
the first test. However, mud loss in the second test was larger because the mud loss
value in Stage I was higher than in the first test. Beside these, all three tests were in
recommended range.

63
6.3.10. Results Obtained for Total Concentration of 10 ppb for 400-µm Slot Size
After that, the concentration of fine-sized particles decreased, FMC 2-6-2
composition tested on 400-µ fracture width. The fracture sealed in 843.0 ± 145.0
sec. Total mud loss was observed 19.3 ± 6.7 ml. Also, two tests with the same
composition stayed out from recommended range. Since sealing time and mud loss
increased significantly according to previous tests, FMC 4-6-0 composition were
tested. As can be seen in Appendix F.X.2, in the second test with this composition
(FMC 4-6-0 D-400µ-R1) the good pack of the particles was formed and aimed
pressure was reached more quickly than others. This led to stay out this
composition from the recommended range. Then, FMC 4-4-2 composition was
tested. It was observed that FMC 4-4-2 and FMC 4-6-0 compositions showed
really close performance in terms of total sealing time and total mud loss.
However, not only the worst case of FMC 4-4-2 composition was better
performance but also FMC 4-6-0 composition was not in recommended range due
to deviations between the results from repeat tests with the same composition.
Table 6.10: Comparison of FMC 2-6-2, FMC 4-4-2 & FMC 4-6-0
Composition
Total Sealing Time (sec) Total Mud Loss (ml)
Mean Std
Dev
Worst
Case Mean
Std
Dev
Worst
Case
FMC 2-6-2* 843 145 1010 19.3 6.7 27
FMC 4-4-2 613 4.4 618 11.5 0.8 12.1
FMC 4-6-0* 618.3 83.1 675 11.5 2 12.9
*The results of these compositions were not in recommended range.
6.3.11. Results Obtained for Total Concentration of 8 ppb for 400-µm Slot Size
FMC 4-2-2 composition were tested on 400-µm fracture width. As can be seen in
Appendix F.XI.1, all tests met the success criteria. The fracture sealed in 685.0±66.6
sec. Observed total mud loss value was 15.5 ± 1.9 ml. One of the tests with this
composition was not in recommended range.

64
6.3.12. Results Obtained for Total Concentration of 6 ppb for 400-µm Slot Size
FMC 4-0-2 composition was tested on 400-µm fracture width. As can be seen in
Figure 6.8, although many high pressure drops occurred, all three tests were able to
reach 2000 psi eventually and met the success criteria. According to Table 6.8, total
sealing time and total mud loss values were 1060.3 ± 148.3 sec and 44.4 ± 9.4 ml,
respectively. As can be seen both these tests and previous tests, even the same
composition on the same slots, the repeat tests could result in different sealing time
and mud loss values due to pressure falls and their different damage on the bridge.
Because of these pressure falls originated from seal breaks, high deviations in total
sealing time was observed. These deviations led to staying out two of these tests from
recommended range.
Figure 6.8: Pressure vs Time curve for FMC 4-0-2 on 400-micron fracture width
0
100
200
300
400
500
600
700
800
900
1000
1100
1200
1300
1400
1500
1600
1700
1800
1900
2000
0 50
100
15
0
20
0
25
0
300
350
400
45
0
50
0
55
0
600
650
700
75
0
80
0
85
0
900
950
1000
10
50
11
00
11
50
1200
1250
1300
Sea
ling
Pre
ssur
e (p
si)
Time (sec) t0+t
FMC 4-0-2 D-400 µ
FMC 4-0-2 D-400 µ-R1
FMC 4-0-2 D-400 µ-R2

65
Table 6.11: Mud Loss & Total Sealing Time Values for FMC 4-0-2 on 400-micron fracture width
Code
Mud Loss (ml) Total
Sealing
Time (sec) Stage I Stage II Stage III Total
FMC 4-0-2 D-400µ 27 27.4 0.6 55 1220
FMC 4-0-2 D-400µ-R1 24 13 0.1 37.1 927
FMC 4-0-2 D-400µ-R2 25 16 0.2 41.2 1034
Mean - - - 44.4 1060.3
Std Dev - - - 9.4 148.3
Deviation range, min - - - 35.1 912.1
Deviation range, max - - - 53.8 1208.6
Recommended Range, min - - - - 954.3
Recommended Range, max - - - - 1166.4
Then 4-2-0 composition was tested on the same slot. As can be seen in Appendix
F.XII.2, all tests satisfied the predetermined success criteria. However, the results of
this composition were not in recommended range. The fracture sealed and observed
total sealing time was 851.3 ± 110.8 sec. Recorded total mud loss value was
9.7 ± 2.1 ml.
As mentioned before, the importance of particle size distribution (PSD) on sealing the
fracture is important. At the same concentration, the less total sealing time and mud
loss values can be obtained with different particle size distribution design. For
example, comparison of FMC 4-0-2 and FMC 4-2-0 shows that when medium sized
particles used instead of coarse sized particles, aimed pressure can be reached quickly
and less amount of fluid is lost through the bridge.

66
Table 6.12: Comparison of FMC 4-0-2 and FMC 4-2-0
Composition
Total Sealing Time (sec) Total Mud Loss (ml)
Mean Std
Dev
Worst
Case Mean
Std
Dev
Worst
Case
FMC 4-0-2* 1060.3 148.3 1220 44.4 9.4 55
FMC 4-2-0* 851.3 110.8 976 19.7 2.1 22
*The results of these compositions were not in recommended range.
6.3.13. Results Obtained for Total Concentration of 4 ppb for 400-µm Slot Size
Figure 6.9: Pressure vs Time curve for FMC 2-2-0 on 400 micron fracture width
Although many pressure drops occurred in Figure 6.9, tests eventually met
predetermined success criteria. However, it showed that by means of proper selection
of particle size distribution, by using total concentration of 4-lb/bbl wellbore
strengthening materials, 400-µm fracture could be sealed. However, repeat tests with
this composition might give different results since two of these tests stayed out from
recommended range as can be seen in Table 6.13.
0
100
200
300
400
500
600
700
800
900
1000
1100
1200
1300
1400
1500
1600
1700
1800
1900
2000
0 50
100
150
200
250
300
350
400
450
500
550
600
650
700
750
800
850
900
950
1000
1050
1100
Sea
ling
Pre
ssur
e (p
si)
Time (sec) t0+t
FMC 2-2-0 D-400 µ
FMC 2-2-0 D-400 µ-R1
FMC 2-2-0 D-400 µ-R2

67
Table 6.13: Mud Loss & Total Sealing Time Values for FMC 2-2-0 on 400 micron fracture width
Code
Mud Loss (ml) Total
Sealing
Time (sec) Stage I Stage II Stage III Total
FMC 2-2-0 D-400µ 14 12.4 0.4 26.8 1046
FMC 2-2-0 D-400µ-R1 13 9.8 0.4 23.2 849
FMC 2-2-0 D-400µ-R2 11.8 7.2 0.4 19.4 806
Mean - - - 23.1 900.3
Std Dev - - - 3.7 128.0
Deviation range, min - - - 19.4 772.4
Deviation range, max - - - 26.8 1028.3
Recommended Range, min - - - - 810.3
Recommended Range, max - - - - 990.4
Although most of the tests examined before could seal the fracture and resist to aimed
pressure, the lower total sealing time can be shown as in the Table 6.14.
Table 6.14: Comparison of Best Results for Sealing of 400 µm fracture width
Composition
Total Sealing Time (sec) Total Mud Loss (ml)
Mean Std
Dev
Worst
Case Mean
Std
Dev
Worst
Case
FMC 10-10-10 527.3 3.5 531 4.2 0.4 4.8
FMC 10-8-10 526.7 13.5 540 5.1 1.5 6.6
FMC 10-10-8 517.7 19.1 538 4.7 1 5.8
FMC 10-10-6 527.7 10.4 536 4.5 0.5 5
FMC 10-10-4 517 14 531 4.3 0.3 4.5
FMC 8-6-2 533 17.1 547 6 0.8 6.7
These all compositions met the predetermined success criteria and the results of them
are repeatable. All of these compositions can be seen as successful and application of
them can give good results.

68
In this study, although the mud loss in the test was slightly higher than other options,
FMC 8-6-2 composition can be selected as optimum composition since the fracture
was sealed by this composition at the same time with the others. Also, this composition
includes less amount of coarse particles and total concentration of it is less than other
alternatives.
6.4. Effect of Concentration of Ground Marble on Sealing 400 microns fracture
width
To show the effect of concentration, FMC 8-6-2 is selected since it was selected as
optimum concentration. By keeping the ratio between the particle size ranges, the
effect of concentration on sealing 400-µ fracture width discussed in this section.
FMC 4-3-1, FMC 8-6-2, FMC 12-9-3 and FMC 16-12-4 compositions were compared
according to total sealing time and mud loss values in Table 6.15. Detailed information
about sealing pressure vs. time graph and total sealing time with mud loss values tables
presented in Appendix G.
Table 6.15: The effect of concentration on sealing 400-micron fracture width
Composition Success
/ Fail
Total Sealing
Time (sec)
Total Mud
Loss (ml) Recommended
or not Mean
Std
Dev Mean
Std
Dev
FMC 4-3-1 S 646.3 28.9 15.6 6.3 R
FMC 8-6-2 S 533 17.1 6 0.8 R
FMC 12-9-3 S 506.7 4.2 4.4 0.4 R
FMC 16-12-4 S 500.7 10.5 3 0.5 R
As it is expected, increasing concentration leads to more efficient seal. The number
and severity of pressure falls decreased with increasing concentration. Therefore, total
sealing time decreased. Fracture can be sealed quickly. Since the number of pressure
falls decreased, less mud loss into the fracture occurred with increasing concentration.
69
6.5. Effect of Particle Size Distribution of Ground Marble on Sealing 800 microns
fracture width
6.5.1. Results Obtained for Total Concentration of 30 ppb for 800-µm Slot Size
Each particle size range was firstly tested individually on the 800-µm fracture width.
30 lb/bbl from each particle size range was taken and tested. Detailed results can be
seen in Appendix H.I.1. The same results were obtained also on this fracture width.
While fine-sized particles (FMC 30-0-0) and medium-sized particles (FMC 0-30-0)
could not form a bridge on this slot when they were used alone, coarse-sized particle
(FMC 0-0-30) could succeed to form a bridge on the aperture. However, the bridge
could not withstand higher pressure differentials when it was used individually and
once mud loss value went over 125 ml, the tests were finished and recorded as “failed”.
Therefore, it was concluded that each particle size range were not able to seal the
fracture when they were used alone. In other words, one size range was not enough to
plugged and sealed the fracture.
Then, FMC 10-10-10 were used, the bridge could be formed and aimed pressure was
reached. According to data in Table 6.16, observed total sealing time and total mud
loss value was 1130.3 ± 56.3 sec and 25.7 ± 1.5 ml. Although, all tests were in
recommended range more severe pressure falls observed as can be seen in Figure 6.10.
Therefore, other compositions with different particle size distribution at the same
concentration were tested.

70
Figure 6.10: Pressure vs Time curve for FMC 10-10-10 on 800-micron fracture width
Table 6.16: Mud Loss & Total Sealing Time Values for FMC 10-10-10 on 800-micron fracture width
Code
Mud Loss (ml) Total
Sealing
Time (sec) Stage I Stage II Stage III Total
FMC 10-10-10 D-800µ 7.0 16.6 0.4 24.0 1084.0
FMC 10-10-10 D-800µ-R1 7.0 18.4 0.8 26.2 1114.0
FMC 10-10-10 D-800µ-R2 6.7 19.9 0.2 26.8 1193.0
Mean - - - 25.7 1130.3
Std Dev - - - 1.5 56.3
Deviation range, min - - - 24.2 1074.0
Deviation range, max - - - 27.1 1186.6
Recommended Range, min - - - - 1017.3
Recommended Range, max - - - - 1243.4
0
100
200
300
400
500
600
700
800
900
1000
1100
1200
1300
1400
1500
1600
1700
1800
1900
2000
0 100
20
0
300
400
50
0
600
700
80
0
900
1000
11
00
12
00
1300
Pre
ssur
e (p
si)
Time (sec) t0+t
FMC 10-10-10 D-800 µ
FMC 10-10-10 D-800 µ-R1
FMC 10-10-10 D-800 µ-R2

71
Firstly, the concentration of fine-sized particles was kept the same, the concentration
of coarse and medium sized particles were changed and the effect of particle size
distribution were examined. To do this, FMC 10-6-14, FMC 10-2-18, FMC 10,18-2
and FMC 10-14-6 compositions were tested on 800-µ fracture width. Comparison of
these compositions according to total sealing time and total mud loss values can be
found in Table 6.17. For detailed graph and tables, Appendix H.II can be checked out.
Table 6.17: Comparison of importance of coarse and medium sized particles
Composition
Total Sealing Time (sec) Total Mud Loss (ml)
Mean Std
Dev
Worst
Case Mean
Std
Dev
Worst
Case
FMC 10-10-10 1130.3 56.3 1193 25.7 1.5 26.8
FMC 10-6-14* 928 177.4 1112 21.6 4.9 27
FMC 10-2-18* 1703.7 409.8 2155 46.1 11.5 57
FMC 10-18-2* FAIL FAIL FAIL >125 - -
FMC 10-14-6* 1455 636.4 2140 35.5 16.7 53.6
*The repeatability of these tests are questionable.
According to these tests, it was observed that once the concentration of coarse particles
and medium sized particles were close to each other more durable bridge could be
formed as larger particles plug the fracture face, the voids filled with smaller particles
and the bridge was formed. Besides all of these, size of coarse particles was slightly
larger than fracture width although size of medium size particles was near to it. As the
concentration of coarser particles decreases, the probability of forming plug decreases.
In the absence of coarser particles, the bridge might not be sealed whereas coarse sized
and fined sized particles could plug and resist higher pressure differentials in lack of
medium sized particles. Therefore, the importance of coarse sized particles is more
than of medium sized to seal the 800-µ fracture width and to reach aimed pressure.
Although the repeatability of FMC 10-6-14 composition was questionable, it showed
better performance than FMC 10-10-10. Its both total sealing time and mud loss value

72
was smaller than FMC 10-10-10. While comparing worst values which were observed
during test, mud loss values were almost the same, whereas total sealing time of FMC
10-6-14 was shorter than FMC 10-10-10. Therefore, it could be said that FMC 10-6-
14 can show better performance.
After that, the concentration of medium sized particles was kept the same and the
concentration of fine size and coarse size particles were changed to see the effect of
changing fine-sized and coarse-sized particles inversely on sealing. FMC 2-10-18,
FMC 6-10-14, FMC 14-10-6 and FMC 18-10-2 compositions were tested and
compared in terms of total sealing time and mud loss values tabulated in Table 6.18.
Table 6.18: Comparison of importance of fine sized and coarse sized particles on 800-micron
fracture width
Composition
Total Sealing Time (sec) Total Mud Loss (ml)
Mean Std
Dev
Worst
Case Mean
Std
Dev
Worst
Case
FMC 10-10-10 1130.3 56.3 1193 25.7 1.5 26.8
FMC 2-10-18 FAIL FAIL FAIL >125 - -
FMC 6-10-14 890.3 53.4 947 23.6 2.2 25.2
FMC 14-10-6* 2605.7 473.6 2952 70.4 12.9 79.1
FMC 18-10-2 FAIL FAIL FAIL >125 - -
*The repeatability of this test is questinable.
As can be seen above results, decrease in the concentration of coarse sized particles
affected sealing performance negatively. Total sealing time and mud loss values
increased significantly. Also, in the absence of coarse-sized particles, the fracture
could be sealed with cooperation of medium and fine-sized particles. However, aimed
pressure could not be reached. On the other hand, the presence of fine-sized particles
was also important. Although concentrations of coarse sized and medium sized
particles were high, the bridge formed by these particles resembles like highly
permeable sands. Fluid continued to flow through the bridge and fracture unless void

73
between the larger particles filled with fine particles. Also, if the difference between
concentration of coarse sized and fined particles was too small, it has been observed
good performance. FMC 6-10-14 showed the really good parameters in terms of total
sealing time and mud loss. On the other hand, FMC 14-10-6 did not show good
performance. The reason of this may be that the concentration of coarse sized particles
is not enough to resist higher pressure values.
Then, the concentration of coarse-sized particles was kept and the effect of changing
fine-sized and medium-sized particles were examined. In these tests, when
concentration of fine-sized particles decreased, the concentration of medium-sized
particles increased, or vice versa. The results are tabulated in Table 6.19. According
to the results obtained from these tests, in the absence of fine-sized particles, although
the bridge formed at low pressures, it could not withstand to higher pressure
differentials. In addition, to get good performance, the concentration of particle-sized
should close to each other like in FMC 6-14-10.
Table 6.19:Comparison of the Importance of Fine and Medium Particle Ranges
Composition
Total Sealing Time
(sec) Total Mud Loss (ml)
Mean Std
Dev
Worst
Case Mean
Std
Dev
Worst
Case
FMC 10-10-10 1130.3 56.3 1193 25.7 1.5 26.8
FMC 18-2-10* 1460.7 544.6 1899 37.8 17 53.6
FMC 14-6-10* 1618.3 695.5 2407 45.1 20.7 67
FMC 6-14-10* 1119.3 352.5 1523 29.2 10.2 41
FMC 2-18-10 FAIL FAIL FAIL >125 - -
*The repeatability of these tests are questionable.
Then FMC 18-6-6, FMC 6-18-6 and FMC 6-6-18 compositions were compared.
According to the results shown in Table 6.20, FMC 18-6-6 showed the worse
performance than the others. Total sealing time and total mud loss value were higher
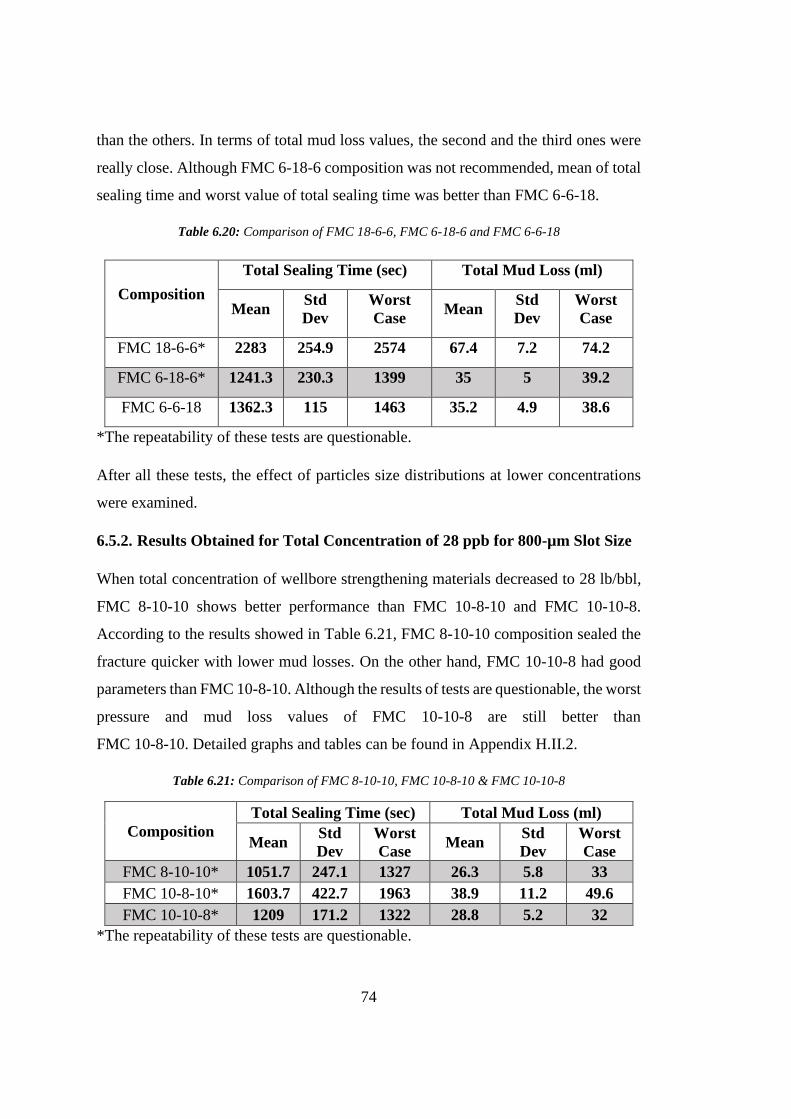
74
than the others. In terms of total mud loss values, the second and the third ones were
really close. Although FMC 6-18-6 composition was not recommended, mean of total
sealing time and worst value of total sealing time was better than FMC 6-6-18.
Table 6.20: Comparison of FMC 18-6-6, FMC 6-18-6 and FMC 6-6-18
Composition
Total Sealing Time (sec) Total Mud Loss (ml)
Mean Std
Dev
Worst
Case Mean
Std
Dev
Worst
Case
FMC 18-6-6* 2283 254.9 2574 67.4 7.2 74.2
FMC 6-18-6* 1241.3 230.3 1399 35 5 39.2
FMC 6-6-18 1362.3 115 1463 35.2 4.9 38.6
*The repeatability of these tests are questionable.
After all these tests, the effect of particles size distributions at lower concentrations
were examined.
6.5.2. Results Obtained for Total Concentration of 28 ppb for 800-µm Slot Size
When total concentration of wellbore strengthening materials decreased to 28 lb/bbl,
FMC 8-10-10 shows better performance than FMC 10-8-10 and FMC 10-10-8.
According to the results showed in Table 6.21, FMC 8-10-10 composition sealed the
fracture quicker with lower mud losses. On the other hand, FMC 10-10-8 had good
parameters than FMC 10-8-10. Although the results of tests are questionable, the worst
pressure and mud loss values of FMC 10-10-8 are still better than
FMC 10-8-10. Detailed graphs and tables can be found in Appendix H.II.2.
Table 6.21: Comparison of FMC 8-10-10, FMC 10-8-10 & FMC 10-10-8
Composition
Total Sealing Time (sec) Total Mud Loss (ml)
Mean Std
Dev
Worst
Case Mean
Std
Dev
Worst
Case
FMC 8-10-10* 1051.7 247.1 1327 26.3 5.8 33
FMC 10-8-10* 1603.7 422.7 1963 38.9 11.2 49.6
FMC 10-10-8* 1209 171.2 1322 28.8 5.2 32
*The repeatability of these tests are questionable.

75
6.5.3. Results Obtained for Total Concentration of 26 ppb for 800-µm Slot Size
Then, FMC 6-10-10, FMC 10-6-10 and FMC 10-10-6 were compared according to
the results shown in Table 6.22. All these compositions were able to meet
predetermined success criteria somehow. However, results of all compositions were
not in the recommended ranges. Therefore, the repeatability of these tests are
questionable. On the other, decrease in the concentration of coarse sized particles led
to higher differentiations between the results.
Table 6.22: Comparison of FMC 6-10-10, FMC 10-6-10 & FMC 10-10-6
Composition
Total Sealing Time (sec) Total Mud Loss (ml)
Mean Std
Dev
Worst
Case Mean
Std
Dev
Worst
Case
FMC 6-10-10* 1201 184.6 1361 29.3 4 33.4
FMC 10-6-10* 1171 246.5 1429 25.1 3.6 28
FMC 10-10-6* 1650.7 620.4 2211 42.6 15 54.2
*The repeatability of these tests are questionable.
6.5.4. Results Obtained for Total Concentration of 24 ppb for 800-µm Slot Size
Although FMC 10-10-4 composition failed to keep its endurance under 2000 psi
overbalance, FMC 4-10-10 and FMC 10-4-10 compositions were able to meet the
success criteria. According to the results shown in Table 6.23, FMC 4-10-10
composition showed better performance than FMC 10-4-10 composition in terms of
sealing time. Their mud loss values are close to each other.
Table 6.23: Comparison of FMC 4-10-10, FMC 10-4-10 and FMC 10-10-4
Composition
Total Sealing Time (sec) Total Mud Loss (ml)
Mean Std
Dev Worst Case Mean
Std
Dev
Worst
Case
FMC 4-10-10* 1248 220.5 1492 34.2 6.9 42.1
FMC 10-4-10 1459.3 255 1662 34.9 4.6 38
FMC 10-10-4 FAIL FAIL FAIL >125 - -
The repeatability of these tests are questionable.

76
6.5.5. Results Obtained for Total Concentration of 22 ppb for 800-µm Slot Size
When total concentration of wellbore strengthening materials decreased to 22 lb/bbl,
FMC 2-10-10, FMC 10-2-10 and FMC 10-10-2 compositions were compared
according to total sealing time and total mud loss values. FMC 2-10-10 and
FMC 10-10-2 compositions sealed the fracture, they could not succeed to withstand
under 2000 psi overbalance. Many pressure falls were observed. Once mud loss values
went over 125 ml, the tests were finished. On the other hand, tests with FMC 10-2-10
composition were able to seal the fracture and met the success criteria as shown in
Table 6.24. However, the big difference between the results of each test led to stayed
out this composition from the recommended range.
Table 6.24: Comparison of FMC 2-10-10, FMC 10-2-10 and FMC 10-10-2
Composition
Total Sealing Time (sec) Total Mud Loss (ml)
Mean Std
Dev
Worst
Case Mean
Std
Dev
Worst
Case
FMC 2-10-10 FAIL FAIL FAIL >125 - -
FMC 10-2-10* 1562.3 612.4 2269 36 15.5 53.8
FMC 10-10-2 FAIL FAIL FAIL >125 - -
*The repeatability of these tests are questionable.
The results obtained from test done with 22-lb/bbl wellbore strengthening materials
showed that coarse sized particles are required to plug abd seal the 800-micron fracture
width. Also, fine sized particles are also required to fill the interstitial voids. The
reason of being successful of FMC 10-2-10 is that fine sized particles plugged the
openings voids filled by fine particles. However, it took time to enable seal integrity
since all stresses were on the coarse sized particles and they crushed under these. This
led to pressure falls and time loss. The presence of medium sized particles is not
important as other two particle ranges, but, it is required to be present in the sample to
distribute the stresses on the coarser particles and to support them.

77
6.5.6. Results Obtained for Total Concentration of 20 ppb for 800-µm Slot Size
FMC 0-10-10, FMC 10-0-10 and FMC 10-10-0 compositions were tested on 800-µm
fracture width and the effect of absence of one particle size range were examined also
by this way. In the absence of fine sized particles (FMC 0-10-10), the fracture could
not be plugged. Although coarser sized particles might form a bridge on the mouth of
the fracture, the gap between the particles could not filled. Fluid continued to flow
through the bridge and once mud loss went over 125 ml, the tests were finished and
recorded as “failed”. In the absence of medium sized particles, fine sized and coarse
sized particles were able to plug and seal the fracture. Predetermined success criteria
were met. Although, many and severe pressure falls observed, total sealing time values
of all tests were in the recommended range. As can be seen in Appendix H..VI.2, total
sealing time was 2039.3 ± 131.8 sec while total mud loss was 66.7 ± 3.3 ml. When
coarse sized particles did not exist in the sample, the bridge could be formed on the
fracture and this bridge could withstand lower pressure differentials. However, higher
pressure differentials could not be reached by this composition.
Table 6.25: Comparison of FMC 0-10-10, FMC 10-0-10 and FMC 10-10-0
Composition
Total Sealing Time (sec) Total Mud Loss (ml)
Mean Std
Dev
Worst
Case Mean
Std
Dev
Worst
Case
FMC 0-10-10 FAIL FAIL FAIL >125 - -
FMC 10-0-10 2039.3 131.8 2166 66.7 3.3 70.4
FMC 10-10-0 FAIL FAIL FAIL >125 - -
Then FMC 6-6-8 composition was tested. All tests sealed the fracture and reached to
aimed pressure somehow as shown in the Figure 6.11. As can be seen in Table 6.26,
the first test with this composition reached to 2000 psi quickly. Good alignment of
particles on the bridge might lead to this. However, this situation cause that none of
the tests with this composition take place in the recommended range.

78
Figure 6.11: Pressure vs Time curve for FMC 6-6-8 on 800-micron fracture width
Table 6.26: Mud Loss & Total Sealing Time Values for FMC 6-6-8 on 800-micron fracture width
Code
Mud Loss (ml) Total
Sealing
Time (sec) Stage I Stage II Stage III Total
FMC 6-6-8 D-800µ 14 52 1 67 2303
FMC 6-6-8 D-800µ-R1 9.8 55.6 0.7 66.1 2351
FMC 6-6-8 D-800µ-R2 9.2 20.8 1 31 1102
Mean - - - 54.7 1918.7
Std Dev - - - 20.5 707.7
Deviation range, min - - - 34.2 1211.0
Deviation range, max - - - 75.2 2626.3
Recommended Range, min - - - - 1726.8
Recommended Range, max - - - - 2110.5
0
100
200
300
400
500
600
700
800
900
1000
1100
1200
1300
1400
1500
1600
1700
1800
1900
2000
0 100
200
300
400
500
600
700
800
90
0
10
00
11
00
12
00
13
00
14
00
15
00
16
00
17
00
18
00
1900
2000
2100
2200
2300
2400
2500
Pre
ssur
e (p
si)
Time (sec) t0+t
FMC 6-6-8 D-800 µ
FMC 6-6-8 D-800 µ-R1
FMC 6-6-8 D-800 µ-R2

79
As can be seen even in Table 6.26, even with this composition used, higher mud loss
and higher sealing times were observed. It has been decided not to lessen
concentrations.
Although, most of the tests examined before could seal the fracture and resist to aimed
pressure, compositions with the lowest total sealing time values can be shown as in
the Table 6.27.
Table 6.27: Comparison of Successful Results on Sealing of 800-µm Fracture Width
Composition
Total Sealing Time (sec) Total Mud Loss (ml)
Mean Std
Dev
Worst
Case Mean
Std
Dev
Worst
Case
FMC 10-10-10 1130.3 56.3 1193 25.7 1.5 26.8
FMC 8-10-10 1051.7 247.1 1327 26.3 5.8 33
FMC 10-6-14* 928 177.4 1112 21.6 4.9 27
FMC 6-10-14 890.3 53.4 947 23.6 2.2 25.2
FMC 6-14-10* 1119.3 352.5 1523 29.2 10.2 41
*The repeatability of these tests are questionable.
Although, mean of total sealing time for FMC 8-10-10 and FMC 6-14-10
compositions were less than FMC 10-10-10, their total mud loss and worst value of
total sealing time were higher than FMC 10-10-10. That is why, FMC 10-10-10
composition selected instead.
Although the repeatability of FMC 10-6-14 was questionable, the results was pretty
good. When looking at the worst value of total sealing time, it was better than most of
the tests. Therefore, FMC 10-6-14*, FMC 10-10-10 and FMC 6-10-14 compositions
can be applied to seal 800-micron fracture width. FMC 6-10-14 can be seen the best
composition among these compositions since the worst mud loss volume was
observed with this composition, besides lower total sealing time. Although in this

80
composition, concentration of coarse particles is high, since the maximum particle size
is 1180 µ, it can be applied during drilling with downhole tools.
In general, it can be said that coarse and fine sized particles are important to seal 800-
micron fracture width. The coarse sized range is important because the size of it is
larger than fracture width. The coarse sized particles plugged fracture width and
placed on the fracture mouth after some amount of fluid passed. The fine particles are
also important since the voids between larger particles was filled by these. After
coarser particles plugged the fractures, with the participation of fine sized particles,
the perfect seal is formed. Although the importance of medium sized particles falls
behind the others, the presence of it is also important. In high differential pressures,
coarser particles have to resist the pressure behind. The force on them is higher. Some
of them couldn’t withstand these forces and crushing occurs. Crushed particles deform
the stability of the bridge. Sometimes, voids open in the bridge and fluid loss resumes
till the other particles healed the damaged parts. The medium size particles enable to
distribute these forces and to heal these damaged parts quickly and endurance of the
bridge might be strengthened.
6.6. Effect of Concentration of Ground Marble on Sealing 800 microns fracture
width
The effect of concentration was examined by using FMC 10-10-10 and FMC 6-10-14
compositions on the 800-µ fracture width. Concentration of these particles increased
by keeping the ratio between the particles size ranges the same.
Firstly, the concentration of FMC 10-10-10 composition increased. As can be seen in
Table 6.28, mean of total sealing time and total mud loss decreased with increasing
concentration as it was expected due that higher concentration led to decrease in the
number and severity of pressure falls.

81
Table 6.28: Effect of Concentration on Sealing (1)
Composition
Total Sealing Time (sec) Total Mud Loss (ml)
Mean Std
Dev
Worst
Case Mean
Std
Dev
Worst
Case
FMC 10-10-10 1130.3 56.3 1193 25.7 1.5 26.8
FMC 15-15-15* 1051.7 151.8 1184 19.7 1.7 21.1
FMC 20-20-20* 858.7 225.1 1116 14.3 6 21.1
*The repeatability of these tests are questionable.
Then, the concentration of FMC 6-10-14 composition increased by keeping the ratio
between particle size ranges the same.
Table 6.29: Effect of Concentration on Sealing (2)
Composition
Total Sealing Time (sec) Total Mud Loss (ml)
Mean Std
Dev
Worst
Case Mean
Std
Dev
Worst
Case
FMC 6-10-14 890.3 53.4 947 23.6 2.2 25.2
FMC 9-15-21* 1064 236.2 1064 22.2 6.5 29.4
FMC 12-20-28* 973.7 135.4 1103 18.8 3.9 21.6
*The repeatability of these tests are questionable.
It was expected that increase in the concentration of wellbore strengthening materials
led to decrease in the total sealing time and decrease in mud losses. However, in these
tests, due to seal breaks and pressure falls, total sealing times increased with increasing
concentration. This exception showed that particle alignment and distribution in the
bridge is also important. Sometimes increase in concentration might not be end up
with decreasing total sealing time due to this. On the other hand, the mean of mud loss
values decreased with increasing concentration. However, the worst values indicated
different results. Especially in second test (FMC9-15-21), mud loss values increased
significantly. This might be due to particles alignment on the face of the fracture.

82
6.7. Effect of Particle Size Distribution of Ground Marble on Sealing 1200
microns fracture width
Tests on the 1200-µm fracture width had started with each particle size range
individually as it had done before. Then, FMC 10-10-10 was tested on 1200-µm slot
size. After it was failed, other compositions with different particle size distributions at
the same concentrations were tested. Then, total concentration of best results increased
to 60 ppb.
6.7.1. Results Obtained for Total Concentration of 30 ppb for 1200-µm Slot Size
30 lb/bbl particle from each particles size range were tested on 1200-µm fracture
width. None of these particles could not form a bridge on the fracture alone even at
100 psi. Once mud loss went over 125 ml, tests were finished and recorded as “failed”.
Then, FMC 10-10-10 composition was tested on the same fracture width. Although,
the fracture was plugged by this composition at lower pressures. However, many seal
breaks observed at higher pressure differentials. After upper limit passed over, the
tests were finished and recorded as “failed”. During these tests, recorded maximum
sealing pressures were 1340 psi, 1100 psi and 1240 psi in each test, respectively. After
this composition was failed, different particle size distributions were tested on the
same slot.
Firstly, the concentration of fine sized particles was kept the same and the
concentration of coarse and medium sized particles changed. Then, FMC 10-6-14,
FMC 10-2-18, FMC 10-18-2 and FMC 10-14-6 compositions were tested and detailed
results can be found in Appendix J.I.
As can be seen from table 6.30, FMC 10-18-2 could not plug the fracture. Therefore,
it can be concluded that in the absence of coarse sized particles, the fracture might not
be sealed. On the other hand, other compositions sealed the fracture at lower pressure
differentials. However, none of these compositions could reached the aimed pressure.
Therefore, all of these were recorded as “failed”. FMC 10-14-6 sealed the fracture and

83
resisted to lower pressures than others as can be seen in Table 6.30. FMC 10-2-18 was
the composition which reached highest pressure differentials. Also, each test of these
compositions showed different results. During these tests, it was observed that
increasing concentration of coarse sized particles leads to higher pressure differentials.
Table 6.30: Comparison of Maximum Sealing Pressures of Different Compositions on the 1200-µm
fracture width (1)
Composition Maximum Sealing Pressures (psi)
Test #1 Test #2 Test #3
FMC 10-10-10 1340 1100 1240
FMC 10-18-2 0 0 0
FMC 10-14-6 340 440 900
FMC 10-6-14 1280 1450 1480
FMC 10-2-18 1960 1530 1600
Then, the concentration of medium sized particles was kept the same, the effect of
change in the concentration of fine-sized and coarse-sized particles were examined.
Then, FMC 6-10-14, FMC 2-10-18, FMC 14-10-6 and FMC 18-10-2 compositions
were tested. Among these, FMC 18-10-2 composition could not form a bridge.
Therefore, the same results were obtained. In the absence of coarse-sized particles, the
bridge might not be sealed. Although other compositions could seal the fracture, none
of them met predetermined success criteria. Recorded maximum sealing pressures
were tabulated in Table 6.31. According to data on this table, FMC 6-10-14 showed
the best performance among these compositions.
Table 6.31: Comparison of Maximum Sealing Pressures of Different Compositions on the 1200-µm
fracture width (2)
Composition Maximum Sealing Pressures (psi)
Test #1 Test #2 Test #3
FMC 10-10-10 1340 1100 1240
FMC 2-10-18 900 800 330
FMC 6-10-14 1480 1180 1680
FMC 14-10-6 610 780 460
FMC 18-10-2 0 0 0
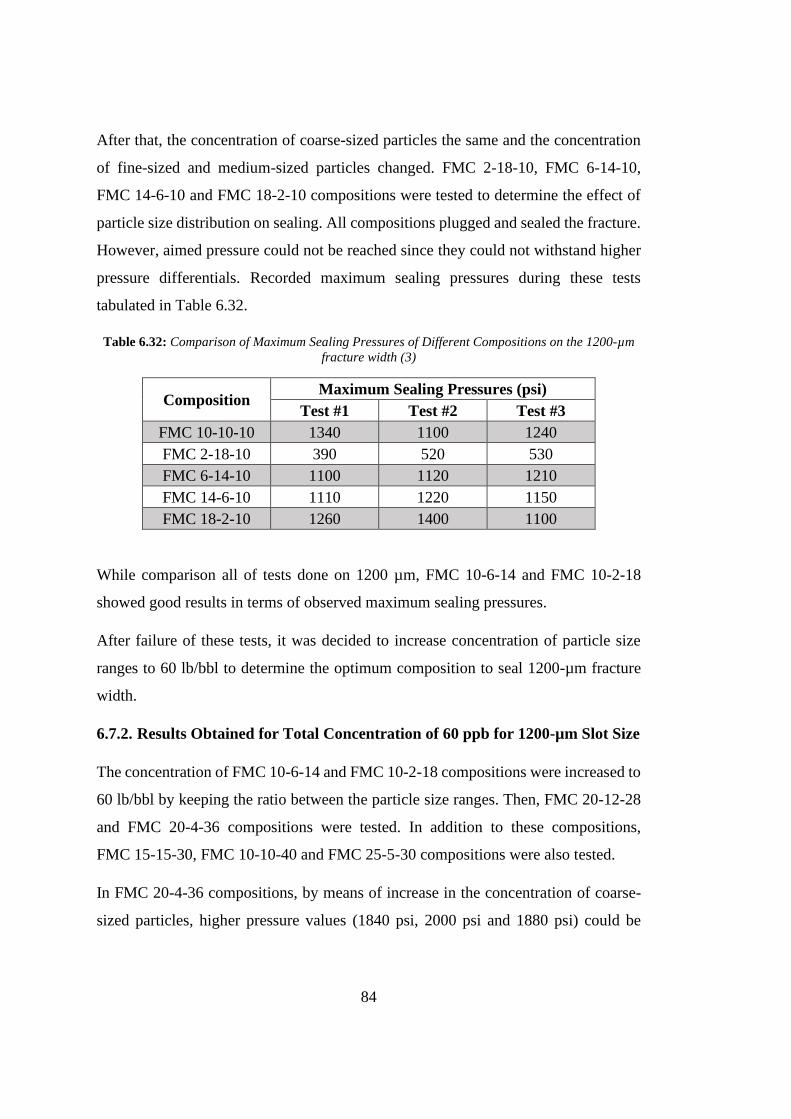
84
After that, the concentration of coarse-sized particles the same and the concentration
of fine-sized and medium-sized particles changed. FMC 2-18-10, FMC 6-14-10,
FMC 14-6-10 and FMC 18-2-10 compositions were tested to determine the effect of
particle size distribution on sealing. All compositions plugged and sealed the fracture.
However, aimed pressure could not be reached since they could not withstand higher
pressure differentials. Recorded maximum sealing pressures during these tests
tabulated in Table 6.32.
Table 6.32: Comparison of Maximum Sealing Pressures of Different Compositions on the 1200-µm
fracture width (3)
Composition Maximum Sealing Pressures (psi)
Test #1 Test #2 Test #3
FMC 10-10-10 1340 1100 1240
FMC 2-18-10 390 520 530
FMC 6-14-10 1100 1120 1210
FMC 14-6-10 1110 1220 1150
FMC 18-2-10 1260 1400 1100
While comparison all of tests done on 1200 µm, FMC 10-6-14 and FMC 10-2-18
showed good results in terms of observed maximum sealing pressures.
After failure of these tests, it was decided to increase concentration of particle size
ranges to 60 lb/bbl to determine the optimum composition to seal 1200-µm fracture
width.
6.7.2. Results Obtained for Total Concentration of 60 ppb for 1200-µm Slot Size
The concentration of FMC 10-6-14 and FMC 10-2-18 compositions were increased to
60 lb/bbl by keeping the ratio between the particle size ranges. Then, FMC 20-12-28
and FMC 20-4-36 compositions were tested. In addition to these compositions,
FMC 15-15-30, FMC 10-10-40 and FMC 25-5-30 compositions were also tested.
In FMC 20-4-36 compositions, by means of increase in the concentration of coarse-
sized particles, higher pressure values (1840 psi, 2000 psi and 1880 psi) could be

85
reached according to compositions with lower concentrations. In one test with this
composition reached the aimed pressure. However, the bridges could not withstand
under 2000 psi. In other two tests, aimed pressure could not be reached. Tests with
these compositions recorded as “failed”.
Then, FMC 20-12-28 composition was tested on 1200-µm fracture width. Although
the first test with this composition reached to 2000 psi many times, the bridge were
not withstand under this pressure. The second test reached to maximum 1880 psi. The
third test reached aimed pressure once, then it had a seal break. All tests had seal
breaks and pressure falls. Once mud losses passed over 125 ml, the tests were finished
and recorded as “failed”.
After failure of these compositions, FMC 15-15-30, FMC 10-10-40 and
FMC 25-5-30 compositions were tested on 1200-µm fracture width. As can be seen in
Appendix J.II, during testing of FMC 15-15-30 composition, many pressure falls
occurred. Once mud loss passed the upper limit for mud loss, tests were finished.
Recorded maximum sealing pressure for this test was 1800 psi. Since this composition
already failed, other tests have not been done.
FMC 10-10-40 composition was tested. Although the test reached to 2000 psi two
times, it could not resist to it. Once measured mud loss exceeded, the test was finished.
Once this composition failed, repeat tests have not been done.
Then, FMC 25-5-30 composition was tested on 1200-µm fracture width. After many
pressure falls occurred, fluid loss passed the upper limit for mud loss and tests were
finished. Recorded maximum sealing pressure was 1880 psi.
After these tests, it was observed that GM may not be effective to plug 1200-µm
fracture width and withstand under 2000 psi overbalance when it is used alone.
After these tests, higher concentrations were tested on the same fracture width to see
whether 1200-µm fracture width could be plugged with these particle size ranges or
not. It was observed that FMC 15-30-45 (total WSM concentration of 90 lb/bbl),

86
FMC 20-40-60 (total WSM concentration of 120 lb/bbl) and FMC 25-50-75
(total concentration of 150 lb/bbl) compositions sealed the fracture. However, these
concentrations are too high for continuous application in mud. Therefore, it was not
suitable for wellbore strengthening mechanisms. However, 1200-µm fracture width
might be sealed with Lost Circulation Pill application by using higher concentrations
of these particle size ranges.
6.8. Effect of Concentration of Ground Marble on Sealing 1200 microns Fracture
width
Besides tests were done before, the concentration of FMC 10-10-10 composition
increased to show the effect of concentration on sealing. As can be seen in 6.33,
increasing concentration increased recorded maximum sealing pressures. Also, the
bridge could be formed more easily and the bridges could become more durable with
increasing concentration since the number of pressure fluctuations increased during
these tests as shown in graphs and tables in Appendix K.
Table 6.33: Effect of Concentration on Sealing 1200-µm Fracture Width
Composition Maximum Sealing Pressures (psi)
Test #1 Test #2 Test #3
FMC 10-10-10 1340 1100 1240
FMC 16-16-16 1540 1400 1800
FMC 20-20-20 1780 1940 1980

87
6.9. Effect of Fracture Width on Sealing
The same composition tested on different fracture widths to see the effect of fracture
width. FMC 10-10-10 composition has been chosen. As can be seen in Table 6.34,
increasing fracture width size affected seal integrity negatively. As the fracture width
increases, it gets difficult to form a bridge and resist to higher pressure differentials.
Table 6.34: Total Sealing Time and Total Mud Loss Values for FMC 10-10-10 composition on
different fracture width
Fracture
Width Size
(µm)
Total Sealing Time (sec) Total Mud Loss (ml)
Mean Std
Dev
Worst
Case Mean
Std
Dev
Worst
Case
400 527.3 3.5 531 4.2 0.5 4.8
800 1130.3 56.3 1193 25.7 1.5 26.8
1200 FAIL FAIL FAIL >125 - -
Results obtained in this study can be summarized as followings:
• Optimum wellbore strengthening concentration and particle size distribution
of Ground Marble for 400-µm and 800-µm fracture width were determined.
• Sealing 1200-µm fracture width with particle size range used in this study is
possible thanks to lost circulation pills applications.
• Particle crushing and seal breaks dominated the test results. Damage on the
seal could be different for each sample. Even the composition was the same,
the repeat tests could result in different sealing time and mud loss volumes in
reaction to damage of pressure falls.
• PSD and concentration of WSM are critical parameters to seal the fracture.
• As stated by Sanders (2008), the required maximum size might be determined
according to anticipated fracture width. Particle range can be determined at
lower concentrations according to this. Particles which are larger than aperture
plug the fracture face, then smaller particles filled the voids between larger

88
particles and sealing occurred. However, if maximum particle size was less
than fracture width, sealing might be achieved at higher concentrations.
• As stated by Mostafavi et al (2011), increasing fracture width affects the seal
integrity negatively. Larger particles and/or higher concentrations are required
to seal larger apertures.
• Higher concentration reduces the number of pressure falls and amount of mud
loss as the possibility of forming a bridge increases at higher concentrations.
• Contrary to statements done by Kumar et al. (2010), GM particles can be used
as WSM alone depending on fracture width, particle size range, concentration
and anticipated test pressure.
• Especially in Stage II, generally strong relationship observed between sealing
efficiency and mud loss values. However, pressure falls and its damage on the
seal can affect this relationship.

89
CHAPTER 7
7. CONCLUSION
This study was done to investigate the effect of Particle Size Distribution range,
concentration and fracture width on sealing performance in Ground Marble laden drill-
in fluids. Following conclusions are drawn as a result of experimental work:
1. Ground Marble particles can be used as wellbore strengthening materials to
seal 400-µm and 800-µm fracture width and formed bridges resisted to 2000
psi.
2. Used particle size range of ground marble in this study may not be effective to
plug the 1200-µm when used alone in wellbore strengthening applications
under 2000 psi overbalance.
3. Particle Size Distribution has a major effect to seal the fracture regardless of
the aperture.
4. The required maximum particle size might be determined according to
anticipated fracture width.
5. In general, concentration influences total sealing time and mud loss values
inversely proportional.
6. Pressure falls and damage on the bridge caused by them are highly effective
on the results. Even the same composition is tested repeatedly, different
sealing time and mud loss values observed depending on the severity of
pressure falls.
7. Fracture size affects the stability of the seal inversely proportional. As the
fracture width grows larger, sealing the fracture is getting harder.

90
91
CHAPTER 8
8. RECOMMENDATIONS
This study is an important step to understand the effect of particle size distribution,
concentration of wellbore strengthening materials used to prevent lost circulation and
the effect of fracture width on sealing. On the other hand, further studies are
recommended for better understanding of wellbore strengthening material character
and wellbore strengthening mechanism;
• Different particle size ranges might be chosen.
• Higher and lower fracture aperture might be considered.
• Although ground marble is the most commonly used type of granular wellbore
strengthening material, different wellbore strengthening material types might
be used for non-productive formations.
• Shape and number of slots can be reevaluated in the further studies.

93
REFERENCES
Abé, H., Keer, L. M. and Mura, T.1976. Growth rate of a penny-shaped crack in
hydraulic fracturing of rocks, 2 J Geophys Res 81(35).6292–6298
Alberty, M.W. and McLean, M. R.2004. A physical model for stress cages. In: SPE
Annual Technical Conference and Exhibition, 26–29 Sept, Houston, Texas.
https://doi.org/10.2118/90493-MS
Alsaba, M., Nygaard, R., Saasen, A. and Nes, O. (2014). Lost Circulation Materials
Capability of Sealing Wide Fractures. SPE Deepwater Drilling and Completions
Conference.
Alsaba, M., Nygaard, R., Saasen, A., Nes, O.-M. (2014) Laboratory Evaluation of
Sealing Wide Fractures Using Conventional Lost Circulation Materials. In: SPE
Annual Technical Conference and Exhibition, Amsterdam, The Netherlands, 27-29
Oct. https://doi.org/10.2118/170576-MS
Alsaba, M., Nygaard, R., Saasen, A., Nes, O.-M. (2016) Experimental Investigation
of Fracture Width Limitations of Granular Lost Circulation Treatments. Journal of
Petroleum Exploration and Production Technology. https://doi.org/10.1007/s13202-
015-0225-3

94
Aston, M.S., Alberty, M.W., McLean, M. R., de Jong, H. J. and Armagost, K. 2004.
Drilling fluids for wellbore strengthening. Presented at the IADC/SPE Drilling
Conference, 2–4 March, Dallas, Texas. https://doi.org/10.2118/87130-MS
Cook, J., Growcock, F., Guo, Q., Hodder, M. and Van Oort, E. 2011. Stabilizing the
wellbore to prevent lost circulation. Oilfield Rev 23(4)
De Lloyd, D. 2000. Chemistry Department, the University of The West Indies, St.
Augustine campus, The Republic of Trinidad and Tobago.
Dick, M. A., Heinz, T. J., Svoboda, C. F., & Aston, M. 2000, January 1. Optimizing
the Selection of Bridging Particles for Reservoir Drilling Fluids. Society of Petroleum
Engineers. https://doi.org/10.2118/58793-MS
Dupriest, F. E. 2005 Fracture closure stress (FCS) and lost returns practices. In:
SPE/IADC Drilling Conference, 23–25 Feb, Amsterdam, Netherlands.
https://doi.org/10.2118/92192-MS
Feng, Y., Gray, K. E. 2016. A parametric study for wellbore strengthening. J Nat Gas
Sci Eng. 30:350–363
Fuh, G. F., Morita, N., Boyd, P. A. and McGoffin, S. J. (1992) A new approach to
preventing lost circulation while drilling. In: SPE Annual Technical Conference and
Exhibition, 4–7 Oct, Washington, D.C. https://doi.org/10.2118/24599-MS
95
Geertsma, J. and De Klerk, F. 1969. A rapid method of predicting width and extent of
hydraulically induced fractures. J Petrol Technol 21(12):1571–1581
Guo, Q., Cook, J., Way, P., Ji, L. and Friedheim, J. E. 2014. A comprehensive
experimental study on wellbore strengthening. In: IADC/SPE Drilling Conference and
Exhibition,4–6 March, Fort Worth, Texas, USA. https://doi.org/10.2118/167957-MS
Hettema, M., Horsrud, P., Taugbol, K., Friedheim, J., Huynh, H., Sanders, M.W. and
Young, S. 2007. Development of an Innovative High-Pressure Testing Device for the
Evaluation of Drilling Fluid Systems and Drilling Fluid Additives within Fractured
Permeable Zones.OMC-2007-082, Offshore Mediterranean Conference and
Exhibition, 28-30 March, Ravenna, Italy.
Ito, T., Zoback, M.D., Peska, P. 2001. Utilization of mud weights in excess of the least
principal stress to stabilize wellbores: theory and practical examples. SPE Drilling
Completion 16(4):221–229
Kumar, A., Savari, S. 2011, April. Lost Circulation Control and Wellbore
Strengthening: Looking Beyond Particle Size Distribution. AADE National Technical
Conference and Exhibition, Houston.
Kumar, A., Savari, S., Whitfill, D.L. and Jamison, D.E. 2010. Wellbore Strengthening:
The Less-Studied Properties of Lost Circulation Materials. In: SPE Annual Technical
Conference and Exhibition, Florence , Italy, 19-22 Sept.
http://dx.doi.org/10.2118/133484-MS.
96
Lake, Larry W., and Robert F. Mitchell. Petroleum Engineering Handbook. Society
of Petroleum Engineers, 2006.
Loeppke, G. E., Glowka, D. A., & Wright, E. K. 1990, March. Design and Evaluation
of Lost Circulation Materials for Severe Environments. Journal of Petroleum
Technology, 42(3). https://doi.org/10.2118/18022-PA
Morita, N., Black, A.D., Fuh, G.F. 1996. Borehole breakdown pressure with drilling
fluids—I. Empirical results. Int J Rock Mech Min Sci Geomech Abstr 33(1):39–51
Morita, N., Fuh, G.-F. 2012 Parametric analysis of wellbore-strengthening methods
from basic rock mechanics. SPE Drilling Completion 27(02):315–327
Morita, N., Fuh, G.F., Black, A.D. 1996. Borehole breakdown pressure with drilling
fluids—II.Semi-analytical solution to predict borehole breakdown pressure. Int J Rock
Mech Min Sci Geomech Abstr 33(1):53–69
Mostafavi, V., Hareland, G., Belayneh, M. and Aadnoy, B.S. 2011. Experimental and
Mechanistic Modelling of Fracture Sealing Resistance with Respect to Fluid and
.Fracture Properties. In: 45th US Rock Mechanics / Geomechanics Symposium, 26-29
June, San Francisco, CA, USA.
Rojas, J. C., Bern, P. A., Fitzgerald, B. L., Modi, S., & Bezant, P. N. 1998, January 1.
Minimising Down Hole Mud Losses. Society of Petroleum Engineers.
https://doi.org/10.2118/39398-MS

97
Salehi, S. and Nygaard, R. 2011, 27-29 March. Evaluation of New Drilling Approach
for Widening Operational Window: Implications for Wellbore Strengthening. SPE
140753. SPE Production and Operations Symposium. Oklahama City, USA.
Sanders, M.V., Young, S. and Friedheim, J. 2008. Development and Testing of Novel
Additives for Improved Wellbore Stability and Reduced Losses. AADE Fluids
Conference and Exhibition, Houston, USA.
Savari, S., Whitfill, D.L., Jamison, D.E. and Kumar, A. 2014 A Method to Evaluate
Lost Circulation Materials – Investigation of Effective Wellbore Strengthening
Applications. In IADC/SPE Drilling Conference and Exhibition, Fort Worth, Texas,
USA, 4-6 March. https://doi.org/10.2118/167977-MS
Song, J. and Rojas, J.C. 2006. Preventing mud losses by wellbore strengthening. In:
SPE Russian Oil and Gas Technical Conference and Exhibition, 3–6 October,
Moscow, Russia. https://doi.org/10.2118/101593-MS
Ülgen, U. B., Damcı, E., Gülmez, F. 2018. a New Insight of the Geothermal Systems
in Turkey: First Geothermal Power Plant in Mountainous Area, “Özmen-1 GEPP”.
71st Geological Congress of Turkey.
van Oort, E., Friedheim, J.E., Pierce, T. and Lee, J.2011. Avoiding losses in depleted
and weak zones by constantly strengthening wellbores. SPE Drilling Completion
26(4):519–530
98
van Oort, E. and Razavi, O. S. 2014. Wellbore strengthening and casing smear: the
common underlying mechanism. In: IADC/SPE Drilling Conference and Exhibition,
4–6 March, FortWorth, Texas, USA. https://doi.org/10.2118/168041-MS
Van Oort, E., Friedheim, J. E., Pierce, T., & Lee, J. 2011, December 1. Avoiding
Losses in Depleted and Weak Zones by Constantly Strengthening Wellbores. Society
of Petroleum Engineers. https://doi.org/10.2118/125093-PA
Vickers, S., Cowie, M., Jones, T., & Twynam, A. J. 2006. a New Methodology That
Surpasses Current Bridging Theories to Efficiently Seal a Varied Pore Throat
Distribution as Found in Natural Reservoir Formations. Wiertnictwo Nafta Gaz, 23(1),
501-515.
Whitfill, D. and Miller, M. 2008 Developing and Testing Lost Circulation Materials.
AADE Fluids Conference and Exhibition, Houston, Texas, USA.8–9 April.

99
APPENDICES
A. Technical Data Sheet of AMYLOTROL
DESCRIPTION
AMYLOTROL is a non–fermenting modified starch used as primary low
viscosity fluid loss control agent in all water-base drilling fluids. It meets and
surpasses ISO 13500, API Specification 13A – 16.
TYPICAL PROPERTIES
FEATURES AND BENEFITS
AMYLOTROL is effective in all types of water-base drilling, workover and
completion fluids.
AMYLOTROL imparts superior fluid loss control properties to the drilling
fluids with minimum viscosity build-up.
AMYLOTROL reduces disintegration of cuttings and thus enhances solids
removal process.
AMYLOTROL is non-ionic and thus has a good tolerance to monovalent and
multivalent cations and is effective over a wide pH range.
AMYLOTROL is not susceptible to bacterial attack.
APPLICATION
AMYLOTROL can be used as fluid loss control agent in all types of the water-
base drilling, workover and completion fluids.
100
LIMITATIONS
AMYLOTROL becomes less effective under the combined effect of high
hardness and high pH as well as in saturated salt systems dictating greater
additive consumption.
AMYLOTROL is thermally stable up to 132 °C (270 °F). The temperature
stability can be increased by 20 °C using POLYTS P or POLYTS L
temperature stabilizer.
AMYLOTROL may cause excess viscosity when added to drilling fluids with
high solids content.

101
B. Technical Data Sheet of REOZAN D
DESCRIPTION
REOZAN D is an easily dispersible, high molecular weight biopolymer (xanthan
gum) used as viscosifier in water-base fluid systems. It meets and surpasses ISO
13500, API Specifications 13A-19.
TYPICAL PROPERTIES
FEATURES AND BENEFITS
REOZAN D produces highly shear-thinning and thixotropic fluids with
excellent hole cleaning and suspension capacity.
REOZAN D is effective in all types of fresh and sea water-base drilling fluids
as well saturated monovalent salt systems.
REOZAN D is effective over a wide pH range and also provides some degree of
fluid loss control.
REOZAN D causes minimum formation damage and is completely removed by
acids and oxidizing agents.
REOZAN D disperses easily in fresh water or brine with minimum risk of “fish
eyes” and lumping.
APPLICATION
REOZAN D is used to enhance hole cleaning and suspension capacity of fresh
water and monovalent brine-base drilling and completion fluids.
102
LIMITATIONS
Soluble iron ion content greater than 40 mg/l causes rapid and severe cross-
linking of REOZAN D. Citric acid is used to sequester the iron.
Since REOZAN D becomes less effective in fluids containing high calcium and
high pH, the fluid must be pretreated with citric acid and/or sodium bicarbonate
before drilling cement.
REOZAN D is thermally stable up to 150 °C (300 °F). The temperature stability
can be increased by 20 °C using POLYTS L or POLYTS P temperature
stabilizer.
REOZAN D is subject to bacterial degradation so a preservative such as
GEOCIDE T or GEOCIDE G is recommended.
103
C. Technical Data Sheet of GEOCIDE T
DESCRIPTION
GEOCIDE T is a triazine based biocide used to control bacteria growth in water-
base drilling, completion, workover and packer fluids.
TYPICAL PROPERTIES
FEATURES AND BENEFITS
GEOCIDE T is compatible with all water-base drilling fluids.
GEOCIDE T is biodegradable and has low toxicity to marine life.
GEOCIDE T in small concentrations effectively controls aerobic and anaerobic
bacteria.
GEOCIDE T is compatible with most oxygen and hydrogen sulfide scavengers.
GEOCIDE T also provides effective control on slime and corrosion
caused by microorganisms in drilling, completion, workover and
packer fluids.
APPLICATION
GEOCIDE T is used to protect bio-polymers (REOZAN D and REOZAN DS)
and cellulosic LCM (FIBROCEL F, FIBROCEL M and FIBROCEL C) against
to bacterial degradation.
GEOCIDE T is used for the prevention of slime and corrosion caused by
sulfate reducing bacteria.
LIMITATIONS
GEOCIDE T is incompatible with oxygen scavengers (DRILSCAV OXA and
DRILSCAV OXN) and some amine based shale inhibitors (CLAHIB N).
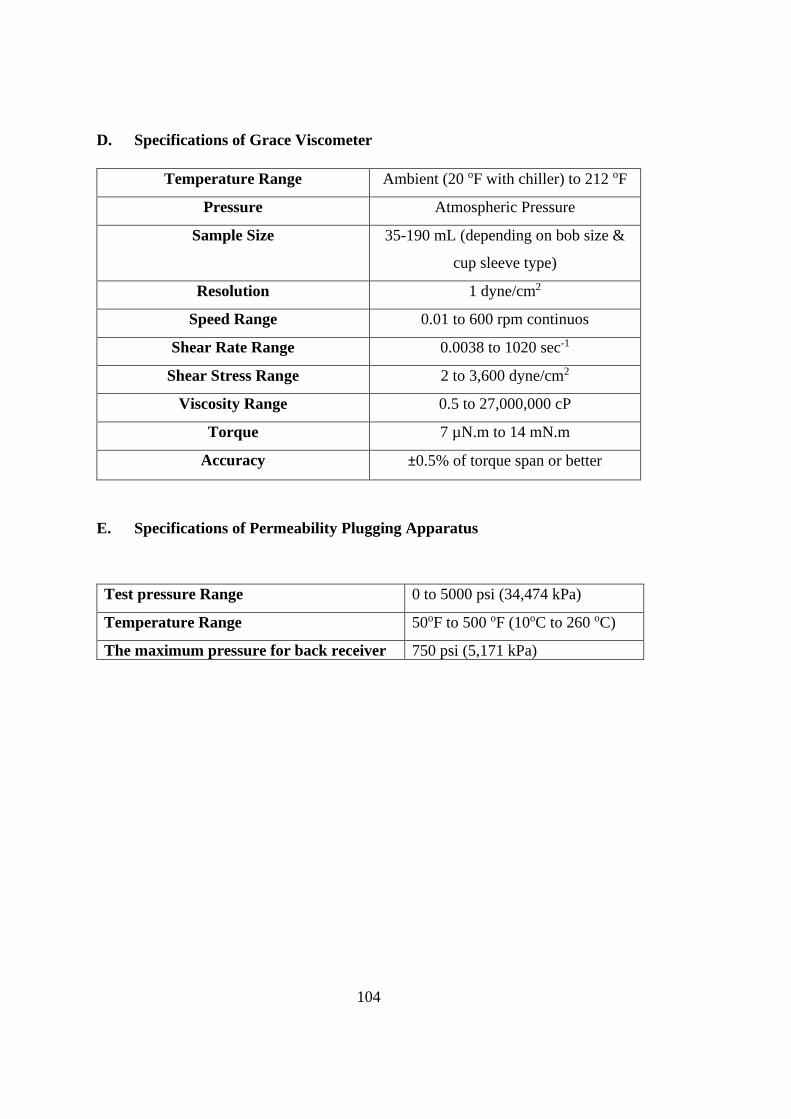
104
D. Specifications of Grace Viscometer
Temperature Range Ambient (20 oF with chiller) to 212 oF
Pressure Atmospheric Pressure
Sample Size 35-190 mL (depending on bob size &
cup sleeve type)
Resolution 1 dyne/cm2
Speed Range 0.01 to 600 rpm continuos
Shear Rate Range 0.0038 to 1020 sec-1
Shear Stress Range 2 to 3,600 dyne/cm2
Viscosity Range 0.5 to 27,000,000 cP
Torque 7 µN.m to 14 mN.m
Accuracy ±0.5% of torque span or better
E. Specifications of Permeability Plugging Apparatus
Test pressure Range 0 to 5000 psi (34,474 kPa)
Temperature Range 50oF to 500 oF (10oC to 260 oC)
The maximum pressure for back receiver 750 psi (5,171 kPa)

105
F. Effect of Particle Size Distribution of Ground Marble on Sealing 400-µ
Fracture Width
F. I. Results Obtained for Total Concentration of 30 ppb for 400-µm Slot
F. I. 1. FMC 30-0-0, FMC 0-30-0 & FMC 0-0-30
Figure F. 1: Pressure vs Time curve for each particle range individually on sealing 400-micron
fracture width
Table F. 1: Mud Loss & Total Sealing Time Values for each particle range individually
Code
Mud Loss (ml) Total Sealing
Time (sec) Stage I Stage II Stage III Total
FMC 30-0-0 D-400µ * * * >125 FAIL
FMC 0-30-0 D-400µ * * * >125 FAIL
FMC 0-0-30 D-400µ 32 * * >125 FAIL
0
100
200
300
400
500
600
700
800
900
1000
1100
1200
1300
1400
1500
1600
1700
1800
1900
2000
0 10
20
30
40
50
60
70
80
90
100
Sea
ling
Pre
ssur
e (p
si)
Time (sec) t0+t
FMC 30-0-0 D-400 µ
FMC 0-30-0 D-400 µ
FMC 0-0-30 D-400 µ

106
F. I. 2. FMC 10-10-10
Figure F. 2: Pressure vs Time curve for FMC 10-10-10 on sealing 400-micron fracture width
Table F. 2: Mud Loss & Total Sealing Time Values for FMC 10-10-10 on 400-micron slot
Code
Mud Loss (ml) Total
Sealing
Time (sec) Stage I Stage II Stage III Total
FMC 10-10-10 D-400µ 1.2 2.6 0.1 3.9 531.0
FMC 10-10-10 D-400µ-R1 1.6 2.2 0.2 4.0 524.0
FMC 10-10-10 D-400µ-R2 1.5 3.1 0.2 4.8 527.0
Mean - - - 4.2 527.3
Std Dev - - - 0.5 3.5
Deviation range, min - - - 3.7 523.8
Deviation range, max - - - 4.7 530.8
Recommended Range, min - - - - 474.6
Recommended Range, max - - - - 580.1
0
100
200
300
400
500
600
700
800
900
1000
1100
1200
1300
1400
1500
1600
1700
1800
1900
20000 50
100
150
200
250
300
350
400
450
500
550
600
Sea
ling
Pre
ssur
e (p
si)
Time (sec) t0+t
FMC 10-10-10 D-400 µ
FMC 10-10-10 D-400 µ-R1
FMC 10-10-10 D-400 µ-R2

107
F. II. Results Obtained for Total Concentration of 28 ppb for 400-µm Slot
F. II. 1. FMC 8-10-10
Figure F. 3: Pressure vs Time curve for FMC 8-10-10 on 400-micron fracture width
Table F. 3: Mud Loss & Total Sealing Time Values for FMC 8-10-10 on 400-micron slots
Code
Mud Loss (ml) Total
Sealing
Time (sec) Stage I Stage II Stage III Total
FMC 8-10-10 D-400µ 1.8 4.4 0.3 6.5 561
FMC 8-10-10 D-400µ-R1 1.8 5 0.2 7 617
FMC 8-10-10 D-400µ-R2 1 4 0.2 5.2 534
Mean - - - 6.2 570.7
Std Dev - - - 0.9 42.3
Deviation range, min - - - 5.3 528.3
Deviation range, max - - - 7.2 613.0
Recommended Range, min - - - - 513.6
Recommended Range, max - - - - 627.7
0
100
200
300
400
500
600
700
800
900
1000
1100
1200
1300
1400
1500
1600
1700
1800
1900
2000
0 50
10
0
150
200
25
0
300
350
40
0
450
500
55
0
600
650
Sea
ling
Pre
ssur
e (p
si)
Time (sec) t0+t
FMC 8-10-10 D-400 µ
FMC 8-10-10 D-400 µ-R1
FMC 8-10-10 D-400 µ-R2

108
F. II. 2. FMC 10-8-10
Figure F. 4: Pressure vs Time curve for FMC 10-8-10 on 400-micron fracture width
Table F. 4: Mud Loss & Total Sealing Time Values for FMC 10-8-10 on 400-micron fracture
width
Code
Mud Loss (ml) Total
Sealing
Time (sec) Stage I Stage II Stage III Total
FMC 10-8-10 D-400µ 1.4 2.2 0.1 3.7 527
FMC 10-8-10 D-400µ-R1 2.2 2.6 0.2 5 513
FMC 10-8-10 D-400µ-R2 3 3.4 0.2 6.6 540
Mean - - - 5.1 526.7
Std Dev - - - 1.5 13.5
Deviation range, min - - - 3.6 513.2
Deviation range, max - - - 6.6 540.2
Recommended Range, min - - - - 474.0
Recommended Range, max - - - - 579.3
0
100
200
300
400
500
600
700
800
900
1000
1100
1200
1300
1400
1500
1600
1700
1800
1900
20000 50
100
150
200
250
300
350
400
450
500
550
600
Sea
ling
Pre
ssur
e (p
si)
Time (sec) t0+t
FMC 10-8-10 D-400 µ
FMC 10-8-10 D-400 µ-R1
FMC 10-8-10 D-400 µ-R2

109
F. II. 3. FMC 10-10-8
Figure F. 5: Pressure vs Time curve for FMC 10-10-8 on 400-micron fracture width
Table F. 5: Mud Loss&Total Sealing Time Values for FMC 10-10-8 on 400-micron fracture
width
Code
Mud Loss (ml) Total
Sealing
Time (sec) Stage I Stage II Stage III Total
FMC 10-10-8 D-400µ 1.2 2.8 0.1 4.1 515
FMC 10-10-8 D-400µ-R1 1.2 4.4 0.2 5.8 538
FMC 10-10-8 D-400µ-R2 1.6 2.4 0.1 4.1 500
Mean - - - 4.7 517.7
Std Dev - - - 1.0 19.1
Deviation range, min - - - 3.7 498.5
Deviation range, max - - - 5.6 536.8
Recommended Range, min - - - - 465.9
Recommended Range, max - - - - 569.4
0
100
200
300
400
500
600
700
800
900
1000
1100
1200
1300
1400
1500
1600
1700
1800
1900
2000
0 50
100
150
200
250
300
350
400
450
500
550
600
Sea
ling
Pre
ssur
e (p
si)
Time (sec) t0+t
FMC 10-10-8 D-400 µ
FMC 10-10-8 D-400 µ-R1
FMC 10-10-8 D-400 µ-R2

110
F. III. Results Obtained for Total Concentration of 26 ppb for 400-µm Slot
F. III. 1. FMC 6-10-10
Figure F. 6: Pressure vs Time curve for FMC 6-10-10 on 400-micron fracture width
Table F. 6: Mud Loss & Total Sealing Time Values for FMC 6-10-10 on 400-micron fracture
width
Code
Mud Loss (ml) Total
Sealing
Time (sec) Stage I Stage II Stage III Total
FMC 6-10-10 D-400µ 2 7.2 0.1 9.3 673
FMC 6-10-10 D-400µ-R1 2.2 4.3 0.1 6.6 557
FMC 6-10-10 D-400µ-R2 2 4 0.2 6.2 539
Mean - - - 7.4 589.7
Std Dev - - - 1.7 72.7
Deviation range, min - - - 5.7 516.9
Deviation range, max - - - 9.1 662.4
Recommended Range, min - - - - 530.7
Recommended Range, max - - - - 648.6
0
100
200
300
400
500
600
700
800
900
1000
1100
1200
1300
1400
1500
1600
1700
1800
1900
2000
0 50
100
150
200
25
0
30
0
35
0
40
0
45
0
50
0
550
600
650
700
750
Sea
ling
Pre
ssur
e (p
si)
Time (sec) t0+t
FMC 6-10-10 D-400 µ
FMC 6-10-10 D-400 µ-R1
FMC 6-10-10 D-400 µ-R2

111
F. III. 2. FMC 10-6-10
Figure F. 7: Pressure vs Time curve for FMC 10-6-10 on 400-micron fracture width
Table F. 7: Mud Loss & Total Sealing Time Values for FMC 10-6-10 on 400-micron fracture
width
Code
Mud Loss (ml) Total
Sealing
Time (sec) Stage I Stage II Stage III Total
FMC 10-6-10 D-400µ 3 2.9 0.1 6 599
FMC 10-6-10 D-400µ-R1 2.8 2.4 0.3 5.5 529
FMC 10-6-10 D-400µ-R2 3 3 0.3 6.3 528
Mean - - - 5.9 552.0
Std Dev - - - 0.4 40.7
Deviation range, min - - - 5.5 511.3
Deviation range, max - - - 6.3 592.7
Recommended Range, min - - - - 496.8
Recommended Range, max - - - - 607.2
0
100
200
300
400
500
600
700
800
900
1000
1100
1200
1300
1400
1500
1600
1700
1800
1900
2000
0 50
10
0
150
200
25
0
300
350
40
0
450
500
55
0
600
650
Sea
ling
Pre
ssur
e (p
si)
Time (sec) t0+t
FMC 10-6-10 D-400 µ
FMC 10-6-10 D-400 µ-R1
FMC 10-6-10 D-400 µ-R2

112
F. III. 3. FMC 10-10-6
Figure F. 8: Pressure vs Time curve for FMC 10-10-6 on 400-micron fracture width
Table F. 8: Mud Loss & Total Sealing Time Values for FMC 10-10-6 on 400-micron fracture
width
Code
Mud Loss (ml) Total
Sealing
Time (sec) Stage I Stage II Stage III Total
FMC 10-10-6 D-400µ 1.4 2.6 0 4 516
FMC 10-10-6 D-400µ-R1 1 3.4 0.2 4.6 536
FMC 10-10-6 D-400µ-R2 1.6 3.2 0.2 5 531
Mean - - - 4.5 527.7
Std Dev - - - 0.5 10.4
Deviation range, min - - - 4.0 517.3
Deviation range, max - - - 5.0 538.1
Recommended Range, min - - - - 474.9
Recommended Range, max - - - - 580.4
0
100
200
300
400
500
600
700
800
900
1000
1100
1200
1300
1400
1500
1600
1700
1800
1900
20000 5
0
10
0
15
0
20
0
250
300
350
40
0
45
0
50
0
55
0
600
Sea
ling
Pre
ssur
e (p
si)
Time (sec) t0+t
FMC 10-10-6 D-400 µ
FMC 10-10-6 D-400 µ-R1
FMC 10-10-6 D-400 µ-R2

113
F. IV. Results Obtained for Total Concentration of 24 ppb for 400-µm Slot
F. IV. 1. FMC 4-10-10
Figure F. 9: Pressure vs Time curve for FMC 4-10-10 on 400-micron fracture width
Table F. 9: Mud Loss & Total Sealing Time Values for FMC 4-10-10 on 400-micron fracture width
Code
Mud Loss (ml) Total
Sealing
Time (sec) Stage I Stage II Stage III Total
FMC 4-10-10 D-400µ 4.6 7.4 0.1 12.1 659
FMC 4-10-10 D-400µ-R1 5.8 6.4 0.2 12.4 616
FMC 4-10-10 D-400µ-R2 4.8 8.2 0.2 13.2 747
Mean - - - 12.6 674.0
Std Dev - - - 0.6 66.8
Deviation range, min - - - 12.0 607.2
Deviation range, max - - - 13.1 740.8
Recommended Range, min - - - - 606.6
Recommended Range, max - - - - 741.4
0
100
200
300
400
500
600
700
800
900
1000
1100
1200
1300
1400
1500
1600
1700
1800
1900
2000
0 50
10
0
15
0
20
0
25
0
300
350
400
450
500
55
0
60
0
65
0
70
0
750
800
Sea
ling
Pre
ssur
e (p
si)
Time (sec) t0+t
FMC 4-10-10 D-400 µ
FMC 4-10-10 D-400 µ-R1
FMC 4-10-10 D-400 µ-R2

114
F. IV. 2. FMC 10-4-10
Figure F. 10: Pressure vs Time curve for FMC 10-4-10 on 400-micron fracture width
Table F. 10: Mud Loss & Total Sealing Time Values for FMC 10-4-10 on 400-micron fracture
width
Code
Mud Loss (ml) Total
Sealing
Time (sec) Stage I Stage II Stage III Total
FMC 10-4-10 D-400µ 3 3.1 0.1 6.2 546
FMC 10-4-10 D-400µ-R1 3.1 2.1 0 5.2 529
FMC 10-4-10 D-400µ-R2 3.4 3.8 0.1 7.3 561
Mean - - - 6.2 545.3
Std Dev - - - 1.1 16.0
Deviation range, min - - - 5.2 529.3
Deviation range, max - - - 7.3 561.3
Recommended Range, min - - - - 490.8
Recommended Range, max - - - - 599.9
0
100
200
300
400
500
600
700
800
900
1000
1100
1200
1300
1400
1500
1600
1700
1800
1900
20000 5
0
10
0
15
0
20
0
250
300
350
40
0
45
0
50
0
55
0
600
Sea
ling
Pre
ssur
e (p
si)
Time (sec) t0+t
FMC 10-4-10 D-400 µ
FMC 10-4-10 D-400 µ-R1
FMC 10-4-10 D-400 µ-R2

115
F. IV. 3. FMC 10-10-4
Figure F. 11: Pressure vs Time curve for FMC 10-10-4 on 400-micron fracture width
Table F. 11: Mud Loss & Total Sealing Time Values for FMC 10-10-4 on 400-micron fracture
width
Code
Mud Loss (ml) Total
Sealing
Time (sec) Stage I Stage II Stage III Total
FMC 10-10-4 D-400µ 1.8 2.4 0.3 4.5 503
FMC 10-10-4 D-400µ-R1 1.4 2.6 0 4 517
FMC 10-10-4 D-400µ-R2 1.2 3 0.3 4.5 531
Mean - - - 4.3 517.0
Std Dev - - - 0.3 14.0
Deviation range, min - - - 4.0 503.0
Deviation range, max - - - 4.6 531.0
Recommended Range, min - - - - 465.3
Recommended Range, max - - - - 568.7
0
100
200
300
400
500
600
700
800
900
1000
1100
1200
1300
1400
1500
1600
1700
1800
1900
2000
0 50
10
0
15
0
20
0
250
300
350
40
0
45
0
50
0
55
0
600
Sea
ling
Pre
ssur
e (p
si)
Time (sec) t0+t
FMC 10-10-4 D-400 µ
FMC 10-10-4 D-400 µ-R1
FMC 10-10-4 D-400 µ-R2

116
F. V. Results Obtained for Total Concentration of 22 ppb for 400-µm Slot
F. V. 1. FMC 2-10-10
Figure F. 12: Pressure vs Time curve for FMC 2-10-10 on 400-micron fracture width
Table F. 12: Mud Loss & Total Sealing Time Values for FMC 2-10-10 on 400-micron fracture
width
Code
Mud Loss (ml) Total
Sealing
Time (sec) Stage I Stage II Stage III Total
FMC 2-10-10 D-400µ 9.6 8.4 1 19 683
FMC 2-10-10 D-400µ-R1 7 8 0.6 15.6 694
FMC 2-10-10 D-400µ-R2 8 24 1.8 33.8 1161
Mean - - - 22.8 846.0
Std Dev - - - 9.7 272.9
Deviation range, min - - - 13.1 573.1
Deviation range, max - - - 32.5 1118.9
Recommended Range, min - - - - 761.4
Recommended Range, max - - - - 930.6
0
100
200
300
400
500
600
700
800
900
1000
1100
1200
1300
1400
1500
1600
1700
1800
1900
2000
0 50
100
150
200
250
300
350
40
0
45
0
50
0
55
0
60
0
65
0
70
0
75
0
80
0
85
0
900
950
1000
1050
1100
1150
1200
1250
Sea
ling
Pre
ssur
e (p
si)
Time (sec) t0+t
FMC 2-10-10 D-400 µ
FMC 2-10-10 D-400 µ-R1
FMC 2-10-10 D-400 µ-R2

117
F. V. 2. FMC 10-2-10
Figure F. 13: Pressure vs Time curve for FMC 10-2-10 on 400-micron fracture width
Table F. 13: Mud Loss & Total Sealing Time Values for FMC 10-2-10 on 400-micron fracture
width
Code
Mud Loss (ml) Total
Sealing
Time (sec) Stage I Stage II Stage III Total
FMC 10-2-10 D-400µ 4.8 2.6 0.3 7.7 545
FMC 10-2-10 D-400µ-R1 4 5.2 0.2 9.4 623
FMC 10-2-10 D-400µ-R2 5 4.2 0 9.2 581
Mean - - - 8.8 583.0
Std Dev - - - 0.9 39.0
Deviation range, min - - - 7.8 544.0
Deviation range, max - - - 9.7 622.0
Recommended Range, min - - - - 524.7
Recommended Range, max - - - - 641.3
0
100
200
300
400
500
600
700
800
900
1000
1100
1200
1300
1400
1500
1600
1700
1800
1900
2000
0 50
10
0
150
200
25
0
30
0
350
40
0
45
0
500
550
60
0
650
700
Sea
ling
Pre
ssur
e (p
si)
Time (sec) t0+t
FMC 10-2-10 D-400 µ
FMC 10-2-10 D-400 µ-R1
FMC 10-2-10 D-400 µ-R2

118
F. V. 3. FMC 10-10-2
Figure F. 14: Pressure vs Time curve for FMC 10-10-2 on 400-micron fracture width
Table F. 14: Mud Loss & Total Sealing Time Values for FMC 10-10-2 on 400-micron fracture
width
Code
Mud Loss (ml) Total
Sealing
Time (sec) Stage I Stage II Stage III Total
FMC 10-10-2 D-400µ 1.4 3.6 0.1 5.1 559
FMC 10-10-2 D-400µ-R1 2 2.4 0.1 4.5 538
FMC 10-10-2 D-400µ-R2 1.8 2.2 0.1 4.1 578
Mean - - - 4.6 558.3
Std Dev - - - 0.5 20.0
Deviation range, min - - - 4.1 538.3
Deviation range, max - - - 5.1 578.3
Recommended Range, min - - - - 502.5
Recommended Range, max - - - - 614.2
0
100
200
300
400
500
600
700
800
900
1000
1100
1200
1300
1400
1500
1600
1700
1800
1900
20000 50
100
150
200
250
300
350
400
450
500
550
600
650
Sea
ling
Pre
ssur
e (p
si)
Time (sec) t0+t
FMC 10-10-2 D-400 µ
FMC 10-10-2 D-400 µ-R1
FMC 10-10-2 D-400 µ-R2

119
F. VI. Results Obtained for Total Concentration of 20 ppb for 400-µm Slot
F. VI. 1. FMC 0-10-10
Figure F. 15: Pressure vs Time curve for FMC 0-10-10 on 400-micron fracture width
Table F. 15: Mud Loss & Total Sealing Time Values for FMC 0-10-10 on 400-micron fracture
width
Code
Mud Loss (ml) Total
Sealing
Time (sec) Stage I Stage II Stage III Total
FMC 0-10-10 D-400µ 57 * * >125 FAIL
FMC 0-10-10 D-400µ-R1 73 * * >125 FAIL
FMC 0-10-10 D-400µ-R2 64 * * >125 FAIL
0
100
200
300
400
500
600
700
800
900
1000
1100
1200
1300
1400
1500
1600
1700
1800
1900
2000
0 50
Sea
ling
Pre
ssur
e (p
si)
Time (sec) t0+t
FMC 0-10-10 D-400 µ
FMC 0-10-10 D-400 µ-R1
FMC 0-10-10 D-400 µ-R2

120
F. VI. 2. FMC 10-0-10
Figure F. 16: Pressure vs Time curve for FMC 10-0-10 on 400-micron fracture width
Table F. 16: Mud Loss & Total Sealing Time Values for FMC 10-0-10 on 400-micron fracture
width
Code
Mud Loss (ml) Total
Sealing
Time (sec) Stage I Stage II Stage III Total
FMC 10-0-10 D-400µ 8 2.1 0.2 10.3 515
FMC 10-0-10 D-400µ-R1 8.4 5.6 0.6 14.6 735
FMC 10-0-10 D-400µ-R2 8.4 3.6 0 12 542
Mean - - - 12.3 597.3
Std Dev - - - 2.2 120.0
Deviation range, min - - - 10.1 477.3
Deviation range, max - - - 14.5 717.3
Recommended Range, min - - - - 537.6
Recommended Range, max - - - - 657.1
0
100
200
300
400
500
600
700
800
900
1000
1100
1200
1300
1400
1500
1600
1700
1800
1900
20000 5
0
10
0
15
0
20
0
25
0
300
350
400
450
500
55
0
60
0
65
0
70
0
750
800
Sea
ling
Pre
ssur
e (p
si)
Time (sec) t0+t
FMC 10-0-10 D-400 µ
FMC 10-0-10 D-400 µ-R1
FMC 10-0-10 D-400 µ-R2

121
F. VI. 3. FMC 10-10-0
Figure F. 17: Pressure vs Time curve for FMC 10-10-0 on 400-micron fracture width
Table F. 17: Mud Loss & Total Sealing Time Values for FMC 10-10-0 on 400-micron fracture
width
Code
Mud Loss (ml) Total
Sealing
Time (sec) Stage I Stage II Stage III Total
FMC 10-10-0 D-400µ 1 3.4 0.3 4.7 546
FMC 10-10-0 D-400µ-R1 2 2.8 0.2 5 531
FMC 10-10-0 D-400µ-R2 0.8 3.2 0.1 4.1 548
Mean - - - 4.6 541.7
Std Dev - - - 0.5 9.3
Deviation range, min - - - 4.1 532.4
Deviation range, max - - - 5.1 551.0
Recommended Range, min - - - - 487.5
Recommended Range, max - - - - 595.8
0
100
200
300
400
500
600
700
800
900
1000
1100
1200
1300
1400
1500
1600
1700
1800
1900
2000
0 50
10
0
15
0
20
0
250
300
350
40
0
45
0
50
0
55
0
600
Sea
ling
Pre
ssur
e (p
si)
Time (sec) t0+t
FMC 10-10-0 D-400 µ
FMC 10-10-0 D-400 µ-R1
FMC 10-10-0 D-400 µ-R2

122
F. VII. Results Obtained for Total Concentration of 16 ppb for 400-µm Slot
F. VII. 1. FMC 8-6-2
Figure F. 18: Pressure vs Time curve for FMC 8-6-2 on 400-micron fracture width
Table F. 18: Mud Loss & Total Sealing Time Values for FMC 8-6-2 on 400-micron fracture width
Code
Mud Loss (ml) Total
Sealing
Time (sec) Stage I Stage II Stage III Total
FMC 8-6-2 D-400µ 3.1 2 0.1 5.2 514
FMC 8-6-2 D-400µ-R1 3.4 3 0.3 6.7 538
FMC 8-6-2 D-400µ-R2 3 3.1 0.1 6.2 547
Mean - - - 6.0 533.0
Std Dev - - - 0.8 17.1
Deviation range, min - - - 5.3 515.9
Deviation range, max - - - 6.8 550.1
Recommended Range, min - - - - 479.7
Recommended Range, max - - - - 586.3
0
100
200
300
400
500
600
700
800
900
1000
1100
1200
1300
1400
1500
1600
1700
1800
1900
2000
0 50
10
0
15
0
20
0
250
300
350
40
0
45
0
50
0
55
0
600
Sea
ling
Pre
ssur
e (p
si)
Time (sec) t0+t
FMC 8-6-2 D-400 µ
FMC 8-6-2 D-400 µ-R1
FMC 8-6-2 D-400 µ-R2

123
F. VIII. Results Obtained for Total Concentration of 14 ppb for 400-µm Slot
F. VIII. 1. FMC 6-6-2
Figure F. 19: Pressure vs Time curve for FMC 6-6-2 on 400-micron fracture width
Table F. 19: Mud Loss & Total Sealing Time Values for FMC 6-6-2 on 400-micron fracture
width
Code
Mud Loss (ml) Total
Sealing
Time (sec) Stage I Stage II Stage III Total
FMC 6-6-2 D-400µ 4.1 4.9 0.2 9.2 594
FMC 6-6-2 D-400µ-R1 4.8 4.4 0.2 9.4 635
FMC 6-6-2 D-400µ-R2 4.8 5.6 0.2 10.6 618
Mean - - - 9.7 615.7
Std Dev - - - 0.8 20.6
Deviation range, min - - - 9.0 595.1
Deviation range, max - - - 10.5 636.3
Recommended Range, min - - - - 554.1
Recommended Range, max - - - - 677.2
0
100
200
300
400
500
600
700
800
900
1000
1100
1200
1300
1400
1500
1600
1700
1800
1900
2000
0 50
100
150
200
250
300
350
400
450
500
550
600
650
700
Sea
ling
Pre
ssur
e (p
si)
Time (sec) t0+t
FMC 6-6-2 D-400 µ
FMC 6-6-2 D-400 µ-R1
FMC 6-6-2 D-400 µ-R2

124
F. IX. Results Obtained for Total Concentration of 12 ppb for 400-µm Slot
F. IX. 1. FMC 4-6-2
Figure F. 20: Pressure vs Time curve for FMC 4-6-2 on 400-micron fracture width
Table F. 20: Mud Loss & Total Sealing Time Values for FMC 4-6-2 on 400-micron fracture width
Code
Mud Loss (ml) Total
Sealing
Time (sec) Stage I Stage II Stage III Total
FMC 4-6-2 D-400µ 5 5 0.1 10.1 602
FMC 4-6-2 D-400µ-R1 5.6 4.5 0.2 10.3 581
FMC 4-6-2 D-400µ-R2 5.2 3.8 0.2 9.2 547
Mean - - - 9.9 576.7
Std Dev - - - 0.6 27.8
Deviation range, min - - - 9.3 548.9
Deviation range, max - - - 10.5 604.4
Recommended Range, min - - - - 519.0
Recommended Range, max - - - - 634.3
0
100
200
300
400
500
600
700
800
900
1000
1100
1200
1300
1400
1500
1600
1700
1800
1900
2000
0 50
10
0
150
200
25
0
300
350
40
0
450
500
55
0
600
650
Sea
ling
Pre
ssur
e (p
si)
Time (sec) t0+t
FMC 4-6-2 D-400 µ
FMC 4-6-2 D-400 µ-R1
FMC 4-6-2 D-400 µ-R2

125
F. X. Results Obtained for Total Concentration of 10 ppb for 400-µm Slot
F. X. 1. FMC 2-6-2
Figure F. 21: Pressure vs Time curve for FMC 2-6-2 on 400-micron fracture width
Table F. 21: Mud Loss & Total Sealing Time Values for FMC 2-6-2 on 400-micron fracture
width
Code
Mud Loss (ml) Total
Sealing
Time (sec) Stage I Stage II Stage III Total
FMC 2-6-2 D-400µ 14 12.4 0.6 27 770
FMC 2-6-2 D-400µ-R1 8 7.8 0.6 16.4 1010
FMC 2-6-2 D-400µ-R2 7.8 6.4 0.4 14.6 749
Mean - - - 19.3 843.0
Std Dev - - - 6.7 145.0
Deviation range, min - - - 12.6 698.0
Deviation range, max - - - 26.0 988.0
Recommended Range, min - - - - 758.7
Recommended Range, max - - - - 927.3
0
100
200
300
400
500
600
700
800
900
1000
1100
1200
1300
1400
1500
1600
1700
1800
1900
2000
0 50
100
150
200
250
300
350
400
450
500
550
600
650
700
750
800
850
900
950
1000
1050
1100
Sea
ling
Pre
ssur
e (p
si)
Time (sec) t0+t
FMC 2-6-2 D-400 µ
FMC 2-6-2 D-400 µ-R1
FMC 2-6-2 D-400 µ-R2

126
F. X. 2. FMC 4-6-0
Figure F. 22: Pressure vs Time curve for FMC 4-6-0 on 400-micron fracture width
Table F. 22: Mud Loss & Total Sealing Time Values for FMC 4-6-0 on 400-micron fracture width
Code
Mud Loss (ml) Total
Sealing
Time (sec) Stage I Stage II Stage III Total
FMC 4-6-0 D-400µ 6.2 6.6 0.1 12.9 657
FMC 4-6-0 D-400µ-R1 6 3 0.2 9.2 523
FMC 4-6-0 D-400µ-R2 5 7.2 0.2 12.4 675
Mean - - - 11.5 618.3
Std Dev - - - 2.0 83.1
Deviation range, min - - - 9.5 535.3
Deviation range, max - - - 13.5 701.4
Recommended Range, min - - - - 556.5
Recommended Range, max - - - - 680.2
0
100
200
300
400
500
600
700
800
900
1000
1100
1200
1300
1400
1500
1600
1700
1800
1900
20000 50
100
150
200
25
0
30
0
35
0
40
0
45
0
50
0
550
600
650
700
750
Sea
ling
Pre
ssur
e (p
si)
Time (sec) t0+t
FMC 4-6-0 D-400 µ
FMC 4-6-0 D-400 µ-R1
FMC 4-6-0 D-400 µ-R2

127
F. X. 3. FMC 4-4-2
Figure F. 23: Pressure vs Time curve for FMC 4-4-2 on 400-micron fracture width
Table F. 23: Mud Loss & Total Sealing Time Values for FMC 4-4-2 on 400-micron fracture width
Code
Mud Loss (ml) Total
Sealing
Time (sec) Stage I Stage II Stage III Total
FMC 4-4-2 D-400µ 6 6 0.1 12.1 618
FMC 4-4-2 D-400µ-R1 6.5 5.3 0.1 11.9 611
FMC 4-4-2 D-400µ-R2 5.5 4.9 0.2 10.6 610
Mean - - - 11.5 613.0
Std Dev - - - 0.8 4.4
Deviation range, min - - - 10.7 608.6
Deviation range, max - - - 12.3 617.4
Recommended Range, min - - - - 551.7
Recommended Range, max - - - - 674.3
Recommended Range, max - - - - 680.2
0
100
200
300
400
500
600
700
800
900
1000
1100
1200
1300
1400
1500
1600
1700
1800
1900
2000
0 50
10
0
150
200
25
0
300
350
40
0
450
500
55
0
600
650
Sea
ling
Pre
ssur
e (p
si)
Time (sec) t0+t
FMC 4-4-2 D-400 µ
FMC 4-4-2 D-400 µ-R1
FMC 4-4-2 D-400 µ-R2
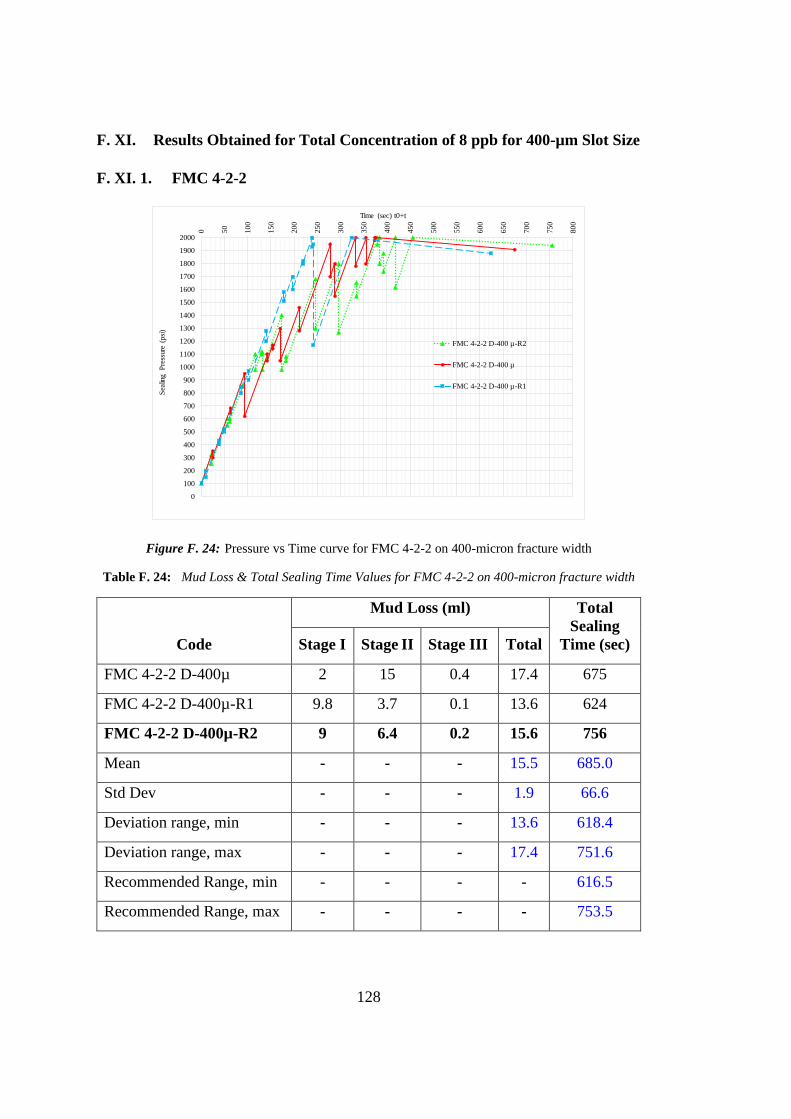
128
F. XI. Results Obtained for Total Concentration of 8 ppb for 400-µm Slot Size
F. XI. 1. FMC 4-2-2
Figure F. 24: Pressure vs Time curve for FMC 4-2-2 on 400-micron fracture width
Table F. 24: Mud Loss & Total Sealing Time Values for FMC 4-2-2 on 400-micron fracture width
Code
Mud Loss (ml) Total
Sealing
Time (sec) Stage I Stage II Stage III Total
FMC 4-2-2 D-400µ 2 15 0.4 17.4 675
FMC 4-2-2 D-400µ-R1 9.8 3.7 0.1 13.6 624
FMC 4-2-2 D-400µ-R2 9 6.4 0.2 15.6 756
Mean - - - 15.5 685.0
Std Dev - - - 1.9 66.6
Deviation range, min - - - 13.6 618.4
Deviation range, max - - - 17.4 751.6
Recommended Range, min - - - - 616.5
Recommended Range, max - - - - 753.5
0
100
200
300
400
500
600
700
800
900
1000
1100
1200
1300
1400
1500
1600
1700
1800
1900
2000
0 50
10
0
15
0
20
0
25
0
300
350
400
450
500
55
0
60
0
65
0
70
0
750
800
Sea
ling
Pre
ssur
e (p
si)
Time (sec) t0+t
FMC 4-2-2 D-400 µ-R2
FMC 4-2-2 D-400 µ
FMC 4-2-2 D-400 µ-R1

129
F. XII. Results Obtained for Total Concentration of 6 ppb for 400-µm Slot Size
F. XII. 1. FMC 4-0-2
Figure F. 25: Pressure vs Time curve for FMC 4-0-2 on 400-micron fracture width
Table F. 25: Mud Loss & Total Sealing Time Values for FMC 4-0-2 on 400-micron fracture
width
Code
Mud Loss (ml) Total
Sealing
Time (sec) Stage I Stage II Stage III Total
FMC 4-0-2 D-400µ 27 27.4 0.6 55 1220
FMC 4-0-2 D-400µ-R1 24 13 0.1 37.1 927
FMC 4-0-2 D-400µ-R2 25 16 0.2 41.2 1034
Mean - - - 44.4 1060.3
Std Dev - - - 9.4 148.3
Deviation range, min - - - 35.1 912.1
Deviation range, max - - - 53.8 1208.6
Recommended Range, min - - - - 954.3
Recommended Range, max - - - - 1166.4
0
100
200
300
400
500
600
700
800
900
1000
1100
1200
1300
1400
1500
1600
1700
1800
1900
2000
0 50
100
15
0
20
0
25
0
300
350
400
45
0
50
0
55
0
600
650
700
75
0
80
0
85
0
900
950
1000
10
50
11
00
11
50
1200
1250
1300
Sea
ling
Pre
ssur
e (p
si)
Time (sec) t0+t
FMC 4-0-2 D-400 µ
FMC 4-0-2 D-400 µ-R1
FMC 4-0-2 D-400 µ-R2
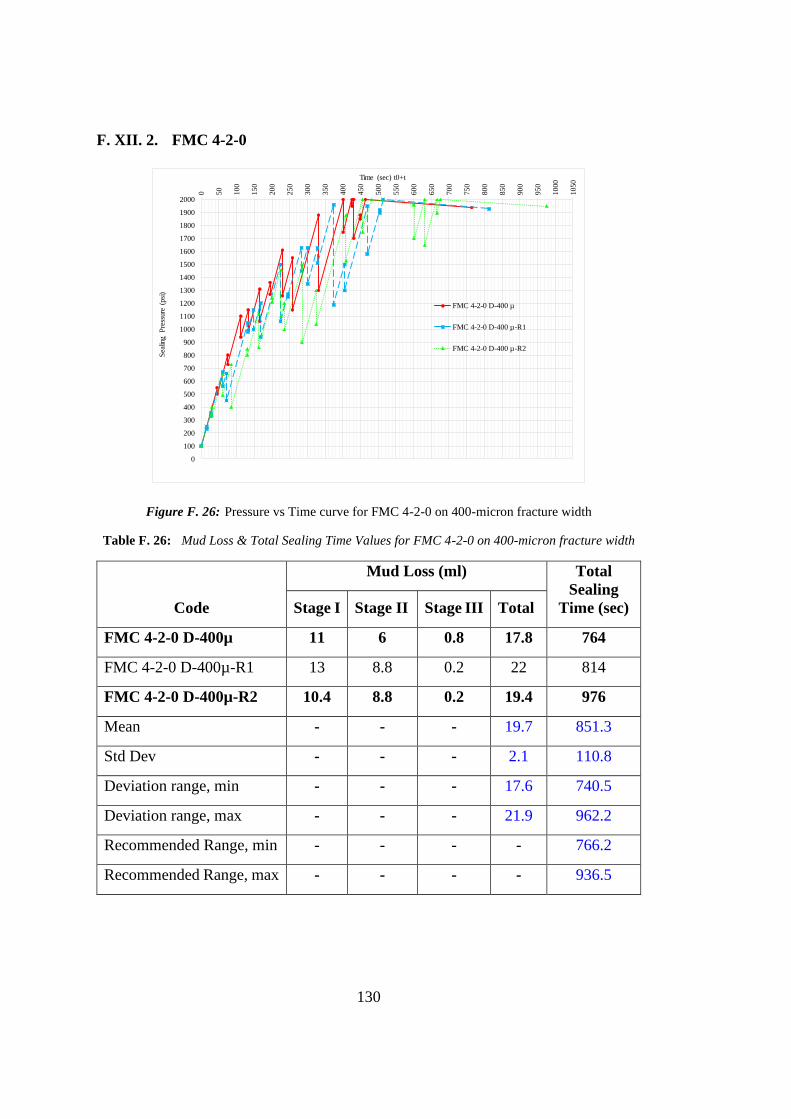
130
F. XII. 2. FMC 4-2-0
Figure F. 26: Pressure vs Time curve for FMC 4-2-0 on 400-micron fracture width
Table F. 26: Mud Loss & Total Sealing Time Values for FMC 4-2-0 on 400-micron fracture width
Code
Mud Loss (ml) Total
Sealing
Time (sec) Stage I Stage II Stage III Total
FMC 4-2-0 D-400µ 11 6 0.8 17.8 764
FMC 4-2-0 D-400µ-R1 13 8.8 0.2 22 814
FMC 4-2-0 D-400µ-R2 10.4 8.8 0.2 19.4 976
Mean - - - 19.7 851.3
Std Dev - - - 2.1 110.8
Deviation range, min - - - 17.6 740.5
Deviation range, max - - - 21.9 962.2
Recommended Range, min - - - - 766.2
Recommended Range, max - - - - 936.5
0
100
200
300
400
500
600
700
800
900
1000
1100
1200
1300
1400
1500
1600
1700
1800
1900
20000 50
100
150
200
250
300
350
400
450
500
550
600
650
700
750
800
850
900
950
1000
1050
Sea
ling
Pre
ssur
e (p
si)
Time (sec) t0+t
FMC 4-2-0 D-400 µ
FMC 4-2-0 D-400 µ-R1
FMC 4-2-0 D-400 µ-R2
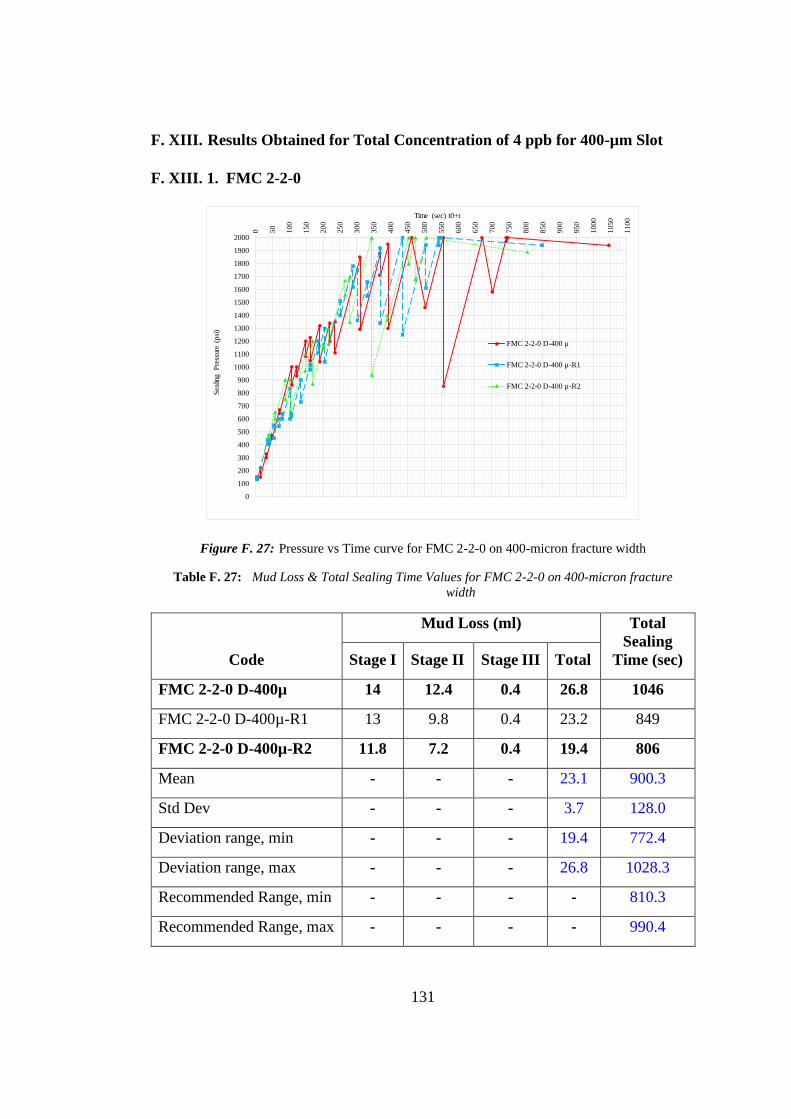
131
F. XIII. Results Obtained for Total Concentration of 4 ppb for 400-µm Slot
F. XIII. 1. FMC 2-2-0
Figure F. 27: Pressure vs Time curve for FMC 2-2-0 on 400-micron fracture width
Table F. 27: Mud Loss & Total Sealing Time Values for FMC 2-2-0 on 400-micron fracture
width
Code
Mud Loss (ml) Total
Sealing
Time (sec) Stage I Stage II Stage III Total
FMC 2-2-0 D-400µ 14 12.4 0.4 26.8 1046
FMC 2-2-0 D-400µ-R1 13 9.8 0.4 23.2 849
FMC 2-2-0 D-400µ-R2 11.8 7.2 0.4 19.4 806
Mean - - - 23.1 900.3
Std Dev - - - 3.7 128.0
Deviation range, min - - - 19.4 772.4
Deviation range, max - - - 26.8 1028.3
Recommended Range, min - - - - 810.3
Recommended Range, max - - - - 990.4
0
100
200
300
400
500
600
700
800
900
1000
1100
1200
1300
1400
1500
1600
1700
1800
1900
2000
0 50
100
150
200
250
300
350
400
450
500
550
600
650
700
750
800
850
900
950
1000
1050
1100
Sea
ling
Pre
ssur
e (p
si)
Time (sec) t0+t
FMC 2-2-0 D-400 µ
FMC 2-2-0 D-400 µ-R1
FMC 2-2-0 D-400 µ-R2

132
G. Effect of Concentration of Ground Marble on Sealing 400-µ Fracture
Width
G. I. 1. FMC 4-3-1
Figure G. 1: Pressure vs Time curve for FMC 4-3-1 on 400-micron fracture width
Table G. 1: Mud Loss & Total Sealing Time Values for FMC 4-3-1 on 400-micron fracture width
Code
Mud Loss (ml) Total
Sealing
Time (sec) Stage I Stage II Stage III Total
FMC 4-3-1 D-400µ 7.1 4.5 0.3 11.9 636
FMC 4-3-1 D-400µ-R1 8.1 3.9 0.1 12.1 624
FMC 4-3-1 D-400µ-R2 14.2 7.8 0.9 22.9 679
Mean - - - 15.6 646.3
Std Dev - - - 6.3 28.9
Deviation range, min - - - 9.3 617.4
Deviation range, max - - - 21.9 675.3
Recommended Range, min - - - - 581.7
Recommended Range, max - - - - 711.0
0
100
200
300
400
500
600
700
800
900
1000
1100
1200
1300
1400
1500
1600
1700
1800
1900
2000
0 50
100
150
200
250
300
350
400
450
500
550
600
650
700
750
Sea
ling
Pre
ssur
e (p
si)
Time (sec) t0+t
FMC 4-3-1 D-400 µ
FMC 4-3-1 D-400 µ-R1
FMC 4-3-1 D-400 µ-R2
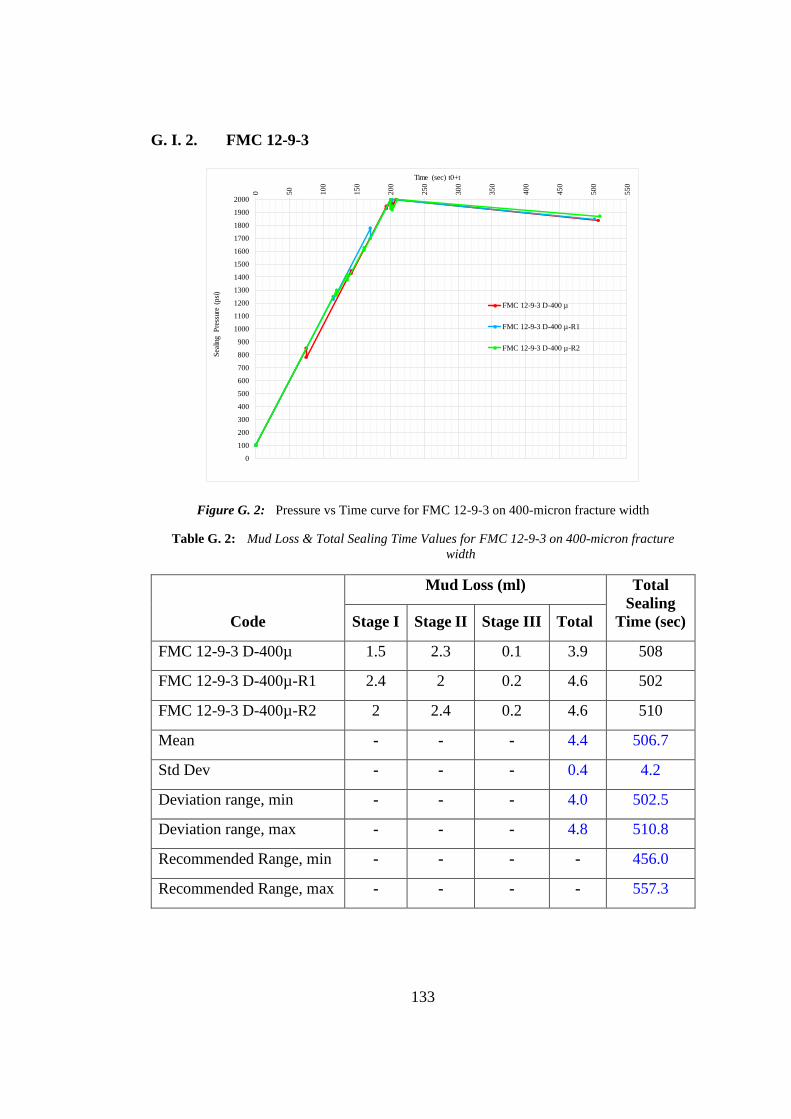
133
G. I. 2. FMC 12-9-3
Figure G. 2: Pressure vs Time curve for FMC 12-9-3 on 400-micron fracture width
Table G. 2: Mud Loss & Total Sealing Time Values for FMC 12-9-3 on 400-micron fracture
width
Code
Mud Loss (ml) Total
Sealing
Time (sec) Stage I Stage II Stage III Total
FMC 12-9-3 D-400µ 1.5 2.3 0.1 3.9 508
FMC 12-9-3 D-400µ-R1 2.4 2 0.2 4.6 502
FMC 12-9-3 D-400µ-R2 2 2.4 0.2 4.6 510
Mean - - - 4.4 506.7
Std Dev - - - 0.4 4.2
Deviation range, min - - - 4.0 502.5
Deviation range, max - - - 4.8 510.8
Recommended Range, min - - - - 456.0
Recommended Range, max - - - - 557.3
0
100
200
300
400
500
600
700
800
900
1000
1100
1200
1300
1400
1500
1600
1700
1800
1900
2000
0 50
100
150
200
250
300
350
400
450
500
550
Sea
ling
Pre
ssur
e (p
si)
Time (sec) t0+t
FMC 12-9-3 D-400 µ
FMC 12-9-3 D-400 µ-R1
FMC 12-9-3 D-400 µ-R2
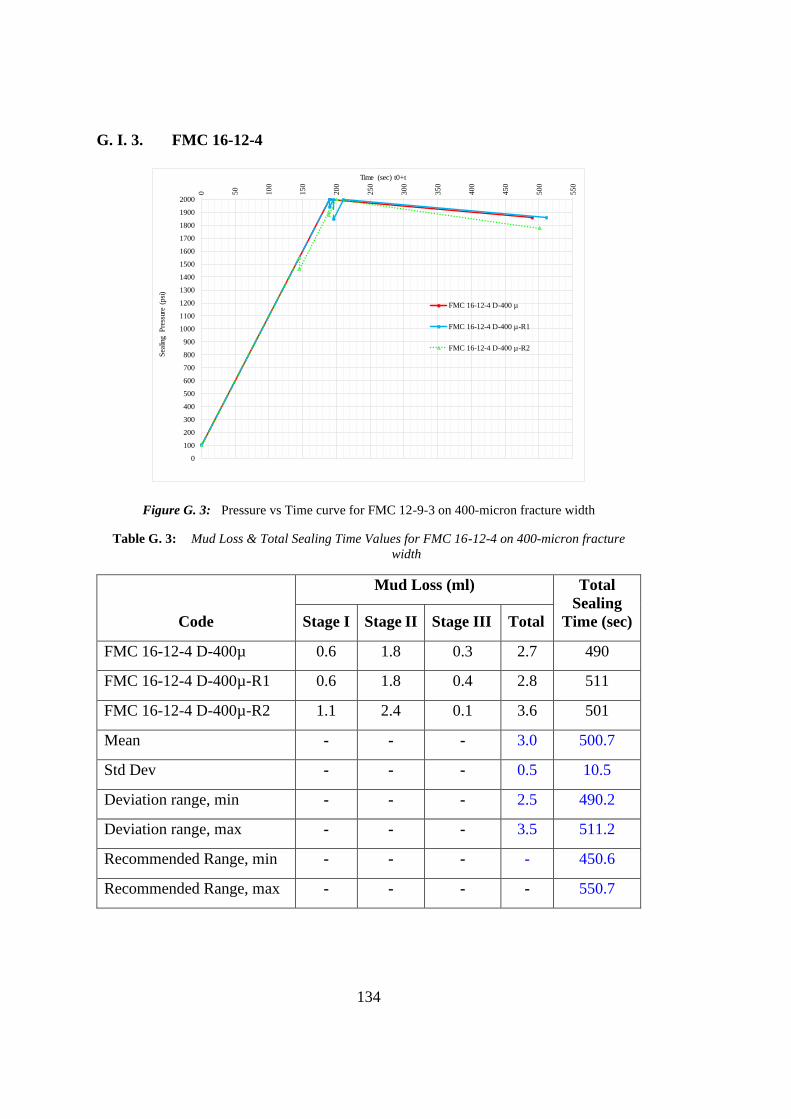
134
G. I. 3. FMC 16-12-4
Figure G. 3: Pressure vs Time curve for FMC 12-9-3 on 400-micron fracture width
Table G. 3: Mud Loss & Total Sealing Time Values for FMC 16-12-4 on 400-micron fracture
width
Code
Mud Loss (ml) Total
Sealing
Time (sec) Stage I Stage II Stage III Total
FMC 16-12-4 D-400µ 0.6 1.8 0.3 2.7 490
FMC 16-12-4 D-400µ-R1 0.6 1.8 0.4 2.8 511
FMC 16-12-4 D-400µ-R2 1.1 2.4 0.1 3.6 501
Mean - - - 3.0 500.7
Std Dev - - - 0.5 10.5
Deviation range, min - - - 2.5 490.2
Deviation range, max - - - 3.5 511.2
Recommended Range, min - - - - 450.6
Recommended Range, max - - - - 550.7
0
100
200
300
400
500
600
700
800
900
1000
1100
1200
1300
1400
1500
1600
1700
1800
1900
20000 50
100
150
200
250
300
350
400
450
500
550
Sea
ling
Pre
ssur
e (p
si)
Time (sec) t0+t
FMC 16-12-4 D-400 µ
FMC 16-12-4 D-400 µ-R1
FMC 16-12-4 D-400 µ-R2
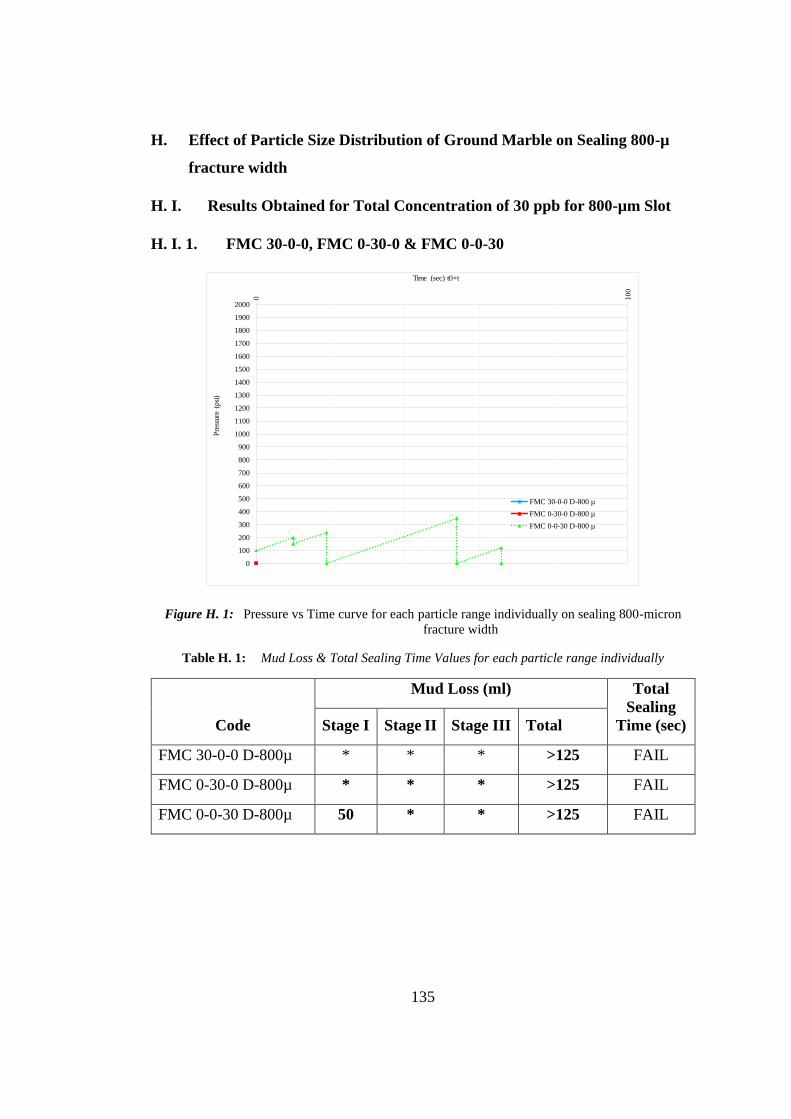
135
H. Effect of Particle Size Distribution of Ground Marble on Sealing 800-µ
fracture width
H. I. Results Obtained for Total Concentration of 30 ppb for 800-µm Slot
H. I. 1. FMC 30-0-0, FMC 0-30-0 & FMC 0-0-30
Figure H. 1: Pressure vs Time curve for each particle range individually on sealing 800-micron
fracture width
Table H. 1: Mud Loss & Total Sealing Time Values for each particle range individually
Code
Mud Loss (ml) Total
Sealing
Time (sec) Stage I Stage II Stage III Total
FMC 30-0-0 D-800µ * * * >125 FAIL
FMC 0-30-0 D-800µ * * * >125 FAIL
FMC 0-0-30 D-800µ 50 * * >125 FAIL
0
100
200
300
400
500
600
700
800
900
1000
1100
1200
1300
1400
1500
1600
1700
1800
1900
2000
0 100
Pre
ssur
e (p
si)
Time (sec) t0+t
FMC 30-0-0 D-800 µ
FMC 0-30-0 D-800 µ
FMC 0-0-30 D-800 µ
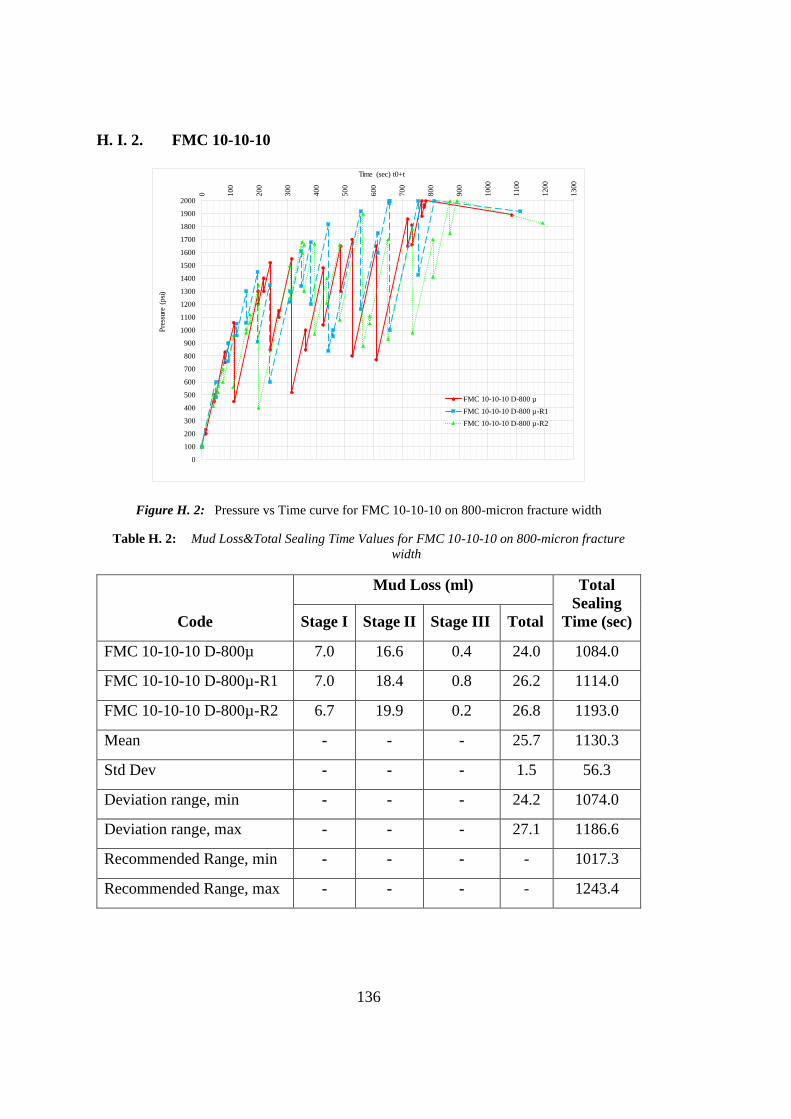
136
H. I. 2. FMC 10-10-10
Figure H. 2: Pressure vs Time curve for FMC 10-10-10 on 800-micron fracture width
Table H. 2: Mud Loss&Total Sealing Time Values for FMC 10-10-10 on 800-micron fracture
width
Code
Mud Loss (ml) Total
Sealing
Time (sec) Stage I Stage II Stage III Total
FMC 10-10-10 D-800µ 7.0 16.6 0.4 24.0 1084.0
FMC 10-10-10 D-800µ-R1 7.0 18.4 0.8 26.2 1114.0
FMC 10-10-10 D-800µ-R2 6.7 19.9 0.2 26.8 1193.0
Mean - - - 25.7 1130.3
Std Dev - - - 1.5 56.3
Deviation range, min - - - 24.2 1074.0
Deviation range, max - - - 27.1 1186.6
Recommended Range, min - - - - 1017.3
Recommended Range, max - - - - 1243.4
0
100
200
300
400
500
600
700
800
900
1000
1100
1200
1300
1400
1500
1600
1700
1800
1900
20000 100
20
0
300
400
50
0
600
700
80
0
900
1000
11
00
12
00
1300
Pre
ssur
e (p
si)
Time (sec) t0+t
FMC 10-10-10 D-800 µ
FMC 10-10-10 D-800 µ-R1
FMC 10-10-10 D-800 µ-R2

137
H. I. 3. FMC 10-6-14
Figure H. 3: Pressure vs Time curve for FMC 10-6-14 on 800-micron fracture width
Table H. 3: Mud Loss & Total Sealing Time Values for FMC 10-6-14 on 800-micron fracture
width
Code
Mud Loss (ml) Total
Sealing
Time (sec) Stage I Stage II Stage III Total
FMC 10-06-14 D-800µ 8.6 8.6 0.4 17.6 758
FMC 10-06-14 D-800µ-R1 9 11 0.2 20.2 914
FMC 10-06-14 D-800µ-R2 9 17.1 0.9 27 1112
Mean - - - 21.6 928.0
Std Dev - - - 4.9 177.4
Deviation range, min - - - 16.7 750.6
Deviation range, max - - - 26.5 1105.4
Recommended Range, min - - - - 835.2
Recommended Range, max - - - - 1020.8
0
100
200
300
400
500
600
700
800
900
1000
1100
1200
1300
1400
1500
1600
1700
1800
1900
2000
0 10
0
20
0
30
0
400
500
600
700
80
0
90
0
10
00
1100
1200
Pre
ssur
e (p
si)
Time (sec) t0+t
FMC 10-06-14 D-800 µ
FMC 10-06-14 D-800 µ-R1
FMC 10-06-14 D-800 µ-R2

138
H. I. 4. FMC 10-2-18
Figure H. 4: Pressure vs Time curve for FMC 10-2-18 on 800-micron fracture width
Table H. 4: Mud Loss &Total Sealing Time Values for FMC 10-2-18 on 800-micron
fracture width
Code
Mud Loss (ml) Total
Sealing
Time (sec) Stage I Stage II Stage III Total
FMC 10-02-18 D-800µ 10 46 1 57 2155
FMC 10-02-18 D-800µ-R1 12 34 1.2 47.2 1601
FMC 10-02-18 D-800µ-R2 8.2 25 0.9 34.1 1355
Mean - - - 46.1 1703.7
Std Dev - - - 11.5 409.8
Deviation range, min - - - 34.6 1293.9
Deviation range, max - - - 57.6 2113.4
Recommended Range, min - - - - 1533.3
Recommended Range, max - - - - 1874.0
0
100
200
300
400
500
600
700
800
900
1000
1100
1200
1300
1400
1500
1600
1700
1800
1900
20000 100
20
0
300
40
0
500
600
70
0
800
90
0
1000
1100
12
00
1300
14
00
1500
16
00
17
00
1800
19
00
2000
21
00
22
00
2300
Pre
ssur
e (p
si)
Time (sec) t0+t
FMC 10-2-18 D-800 µ
FMC 10-2-18 D-800 µ-R1
FMC 10-2-18 D-800 µ-R2

139
H. I. 5. FMC 10-18-2
Figure H. 5: Pressure vs Time curve for FMC 10-18-2 on 800-micron fracture width
Table H. 5: Mud Loss &Total Sealing Time Values for FMC 10-18-2 on 800-micron
fracture width
Code
Mud Loss (ml) Total
Sealing
Time (sec) Stage I Stage II Stage III Total
FMC 10-18-02 D-800µ 14.4 * * >125 FAIL
FMC 10-18-02 D-800µ-R1 12.4 * * >125 FAIL
FMC 10-18-02 D-800µ-R2 14.2 * * >125 FAIL
0
100
200
300
400
500
600
700
800
900
1000
1100
1200
1300
1400
1500
1600
1700
1800
1900
2000
0 10
0
200
30
0
400
500
60
0
700
80
0
900
1000
11
00
1200
13
00
1400
15
00
16
00
1700
18
00
1900
20
00
21
00
2200
23
00
2400
25
00
26
00
2700
28
00
2900
30
00
31
00
3200
33
00
3400
Pre
ssur
e (p
si)
Time (sec) t0+t
FMC 10-18-02 D-800 µ
FMC 10-18-02 D-800 µ-R1
FMC 10-18-02 D-800 µ-R2

140
H. I. 6. FMC 10-14-6
Figure H. 6: Pressure vs Time curve for FMC 10-14-6 on 800-micron fracture width
Table H. 6: Mud Loss&Total Sealing Time Values for FMC 10-14-06 on 800-micron fracture
width
Code
Mud Loss (ml) Total
Sealing
Time (sec) Stage I Stage II Stage III Total
FMC 10-14-06 D-800µ 8.9 11.3 0.4 20.6 882
FMC 10-14-06 D-800µ-R1 9.4 21.8 1 32.2 1343
FMC 10-14-06 D-800µ-R2 10.1 43.2 0.3 53.6 2140
Mean - - - 35.5 1455.0
Std Dev - - - 16.7 636.4
Deviation range, min - - - 18.7 818.6
Deviation range, max - - - 52.2 2091.4
Recommended Range, min - - - - 1309.5
Recommended Range, max - - - - 1600.5
0
100
200
300
400
500
600
700
800
900
1000
1100
1200
1300
1400
1500
1600
1700
1800
1900
20000 100
20
0
300
40
0
500
600
70
0
800
90
0
1000
1100
12
00
1300
14
00
1500
16
00
17
00
1800
19
00
2000
21
00
22
00
2300
Pre
ssur
e (p
si)
Time (sec) t0+t
FMC 10-14-6 D-800 µ
FMC 10-14-6 D-800 µ-R1
FMC 10-14-6 D-800 µ-R2

141
H. I. 7. FMC 2-10-18
Figure H. 7: Pressure vs Time curve for FMC 18-10-2 on 800-micron fracture width
Table H. 7: Mud Loss & Total Sealing Time Values for FMC 18-10-2 on 800-micron
fracture width
Code
Mud Loss (ml) Total
Sealing
Time (sec) Stage I Stage II Stage III Total
FMC 02-10-18 D-800µ 12.8 96.2 1.3 110.3 1557
FMC 02-10-18 D-800µ-R1 14 * * >125 FAIL
FMC 02-10-18 D-800µ-R2 14 97 1 112 1776
0
100
200
300
400
500
600
700
800
900
1000
1100
1200
1300
1400
1500
1600
1700
1800
1900
2000
0 10
0
200
30
0
400
50
0
600
70
0
800
90
0
1000
11
00
12
00
1300
14
00
1500
16
00
1700
18
00
1900
Pre
ssur
e (p
si)
Time (sec) t0+t
FMC 2-10-18 D-800 µ
FMC 2-10-18 D-800 µ-R1
FMC 2-10-18 D-800 µ-R2
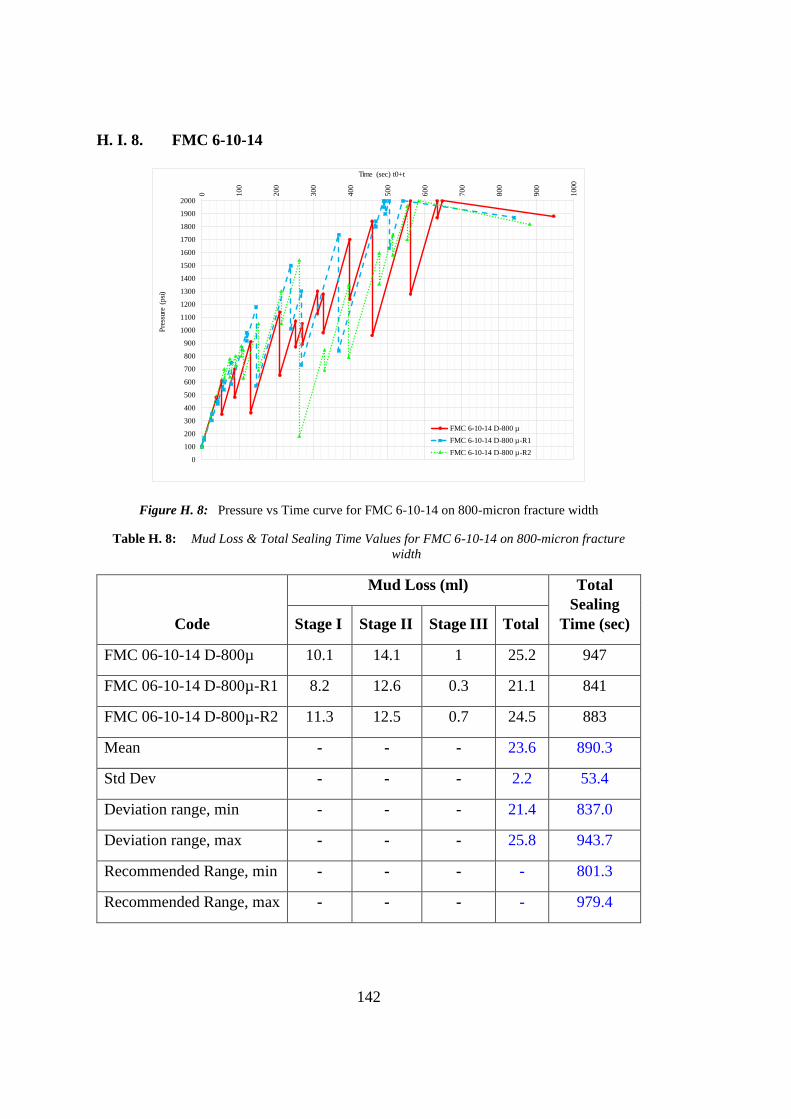
142
H. I. 8. FMC 6-10-14
Figure H. 8: Pressure vs Time curve for FMC 6-10-14 on 800-micron fracture width
Table H. 8: Mud Loss & Total Sealing Time Values for FMC 6-10-14 on 800-micron fracture
width
Code
Mud Loss (ml) Total
Sealing
Time (sec) Stage I Stage II Stage III Total
FMC 06-10-14 D-800µ 10.1 14.1 1 25.2 947
FMC 06-10-14 D-800µ-R1 8.2 12.6 0.3 21.1 841
FMC 06-10-14 D-800µ-R2 11.3 12.5 0.7 24.5 883
Mean - - - 23.6 890.3
Std Dev - - - 2.2 53.4
Deviation range, min - - - 21.4 837.0
Deviation range, max - - - 25.8 943.7
Recommended Range, min - - - - 801.3
Recommended Range, max - - - - 979.4
0
100
200
300
400
500
600
700
800
900
1000
1100
1200
1300
1400
1500
1600
1700
1800
1900
20000 1
00
200
30
0
40
0
500
60
0
700
800
90
0
1000
Pre
ssur
e (p
si)
Time (sec) t0+t
FMC 6-10-14 D-800 µ
FMC 6-10-14 D-800 µ-R1
FMC 6-10-14 D-800 µ-R2

143
H. I. 9. FMC 14-10-6
Figure H. 9: Pressure vs Time curve for FMC 14-10-6 on 800-micron fracture width
Table H. 9: Mud Loss & Total Sealing Time Values for FMC 14-10-6 on 800-micron fracture
width
Code
Mud Loss (ml) Total
Sealing
Time (sec) Stage I Stage II Stage III Total
FMC 14-10-06 D-800µ 8.2 67.7 0.7 76.6 2799
FMC 14-10-06 D-800µ-R1 12.1 43.3 0.2 55.6 2066
FMC 14-10-06 D-800µ-R2 11.2 67 0.9 79.1 2952
Mean - - - 70.4 2605.7
Std Dev - - - 12.9 473.6
Deviation range, min - - - 57.5 2132.1
Deviation range, max - - - 83.3 3079.3
Recommended Range, min - - - - 2345.1
Recommended Range, max - - - - 2866.2
0
100
200
300
400
500
600
700
800
900
1000
1100
1200
1300
1400
1500
1600
1700
1800
1900
2000
0 10
0
20
0
300
400
50
0
60
0
70
0
800
900
10
00
11
00
1200
1300
1400
15
00
16
00
1700
1800
19
00
20
00
2100
2200
2300
24
00
25
00
2600
2700
28
00
29
00
30
00
3100
Pre
ssur
e (p
si)
Time (sec) t0+t
FMC 14-10-06 D-800 µ
FMC 14-10-06 D-800 µ-R1
FMC 14-10-06 D-800 µ-R2

144
H. I. 10. FMC 18-10-2
Figure H. 10: Pressure vs Time curve for FMC 18-10-2 on 800-micron fracture width
Table H. 10: Mud Loss & Total Sealing Time Values for FMC 18-10-2 on 800-micron fracture
width
Code
Mud Loss (ml) Total
Sealing
Time (sec) Stage I Stage II Stage III Total
FMC 18-10-02 D-800µ 22.4 92 0.2 114.6 3099
FMC 18-10-02 D-800µ-R1 19 * * >125 FAIL
FMC 18-10-02 D-800µ-R2 16 * * >125 FAIL
0
100
200
300
400
500
600
700
800
900
1000
1100
1200
1300
1400
1500
1600
1700
1800
1900
20000 1
00
200
30
0
400
500
60
0
700
80
0
900
1000
11
00
1200
13
00
1400
15
00
16
00
1700
18
00
1900
20
00
21
00
2200
23
00
2400
25
00
26
00
2700
28
00
2900
30
00
31
00
3200
33
00
3400
Pre
ssur
e (p
si)
Time (sec) t0+t
FMC 18-10-2 D-800 µ
FMC 18-10-2 D-800 µ-R1
FMC 18-10-2 D-800 µ-R1

145
H. I. 11. FMC 18-2-10
Figure H. 11: Pressure vs Time curve for FMC 18-2-10 on 800-micron fracture width
Table H. 11: Mud Loss &Total Sealing Time Values for FMC 18-2-10 on 800-micron
fracture width
Code
Mud Loss (ml) Total
Sealing
Time (sec) Stage I Stage II Stage III Total
FMC 18-02-10 D-800µ 9.8 9.6 0.4 19.8 851
FMC 18-02-10 D-800µ-R1 10 29 1 40 1632
FMC 18-02-10 D-800µ-R2 9.8 41.3 2.5 53.6 1899
Mean - - - 37.8 1460.7
Std Dev - - - 17.0 544.6
Deviation range, min - - - 20.8 916.1
Deviation range, max - - - 54.8 2005.3
Recommended Range, min - - - - 1314.6
Recommended Range, max - - - - 1606.7
0
100
200
300
400
500
600
700
800
900
1000
1100
1200
1300
1400
1500
1600
1700
1800
1900
2000
0 100
20
0
30
0
400
50
0
60
0
700
80
0
90
0
1000
11
00
12
00
1300
1400
15
00
1600
1700
18
00
1900
2000
Pre
ssur
e (p
si)
Time (sec) t0+t
FMC 18-2-10 D-800 µ
FMC 18-2-10 D-800 µ-R1
FMC 18-2-10 D-800 µ-R2

146
H. I. 12. FMC 14-6-10
Figure H. 12: Pressure vs Time curve for FMC 14-6-10 on 800-micron fracture width
Table H. 12: Mud Loss & Total Sealing Time Values for FMC 14-6-10 on 800-micron fracture
width
Code
Mud Loss (ml) Total
Sealing
Time (sec) Stage I Stage II Stage III Total
FMC 14-06-10 D-800µ 13.6 28.6 0.2 42.4 1355
FMC 14-06-10 D-800µ-R1 13 54 0 67 2407
FMC 14-06-10 D-800µ-R2 8.4 17 0.4 25.8 1093
Mean - - - 45.1 1618.3
Std Dev - - - 20.7 695.5
Deviation range, min - - - 24.3 922.9
Deviation range, max - - - 65.8 2313.8
Recommended Range, min - - - - 1456.5
Recommended Range, max - - - - 1780.2
0
100
200
300
400
500
600
700
800
900
1000
1100
1200
1300
1400
1500
1600
1700
1800
1900
20000 100
200
30
0
40
0
50
0
600
700
800
90
0
10
00
11
00
1200
1300
1400
15
00
16
00
17
00
1800
1900
2000
21
00
22
00
23
00
24
00
2500
2600
Pre
ssur
e (p
si)
Time (sec) t0+t
FMC 14-06-10 D-800 µ
FMC 14-06-10 D-800 µ-R1
FMC 14-06-10 D-800 µ-R2
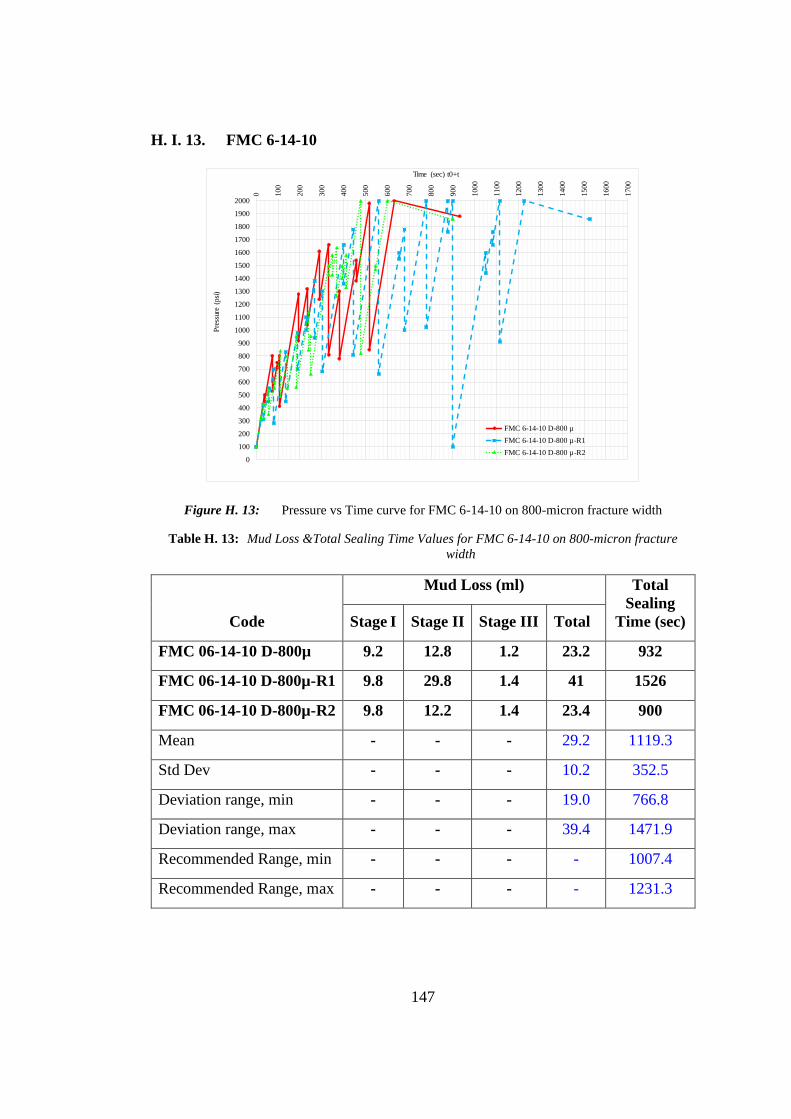
147
H. I. 13. FMC 6-14-10
Figure H. 13: Pressure vs Time curve for FMC 6-14-10 on 800-micron fracture width
Table H. 13: Mud Loss &Total Sealing Time Values for FMC 6-14-10 on 800-micron fracture
width
Code
Mud Loss (ml) Total
Sealing
Time (sec) Stage I Stage II Stage III Total
FMC 06-14-10 D-800µ 9.2 12.8 1.2 23.2 932
FMC 06-14-10 D-800µ-R1 9.8 29.8 1.4 41 1526
FMC 06-14-10 D-800µ-R2 9.8 12.2 1.4 23.4 900
Mean - - - 29.2 1119.3
Std Dev - - - 10.2 352.5
Deviation range, min - - - 19.0 766.8
Deviation range, max - - - 39.4 1471.9
Recommended Range, min - - - - 1007.4
Recommended Range, max - - - - 1231.3
0
100
200
300
400
500
600
700
800
900
1000
1100
1200
1300
1400
1500
1600
1700
1800
1900
2000
0 100
200
30
0
40
0
500
600
700
80
0
90
0
10
00
1100
1200
13
00
14
00
15
00
1600
1700
Pre
ssur
e (p
si)
Time (sec) t0+t
FMC 6-14-10 D-800 µ
FMC 6-14-10 D-800 µ-R1
FMC 6-14-10 D-800 µ-R2

148
H. I. 14. FMC 2-18-10
Figure H. 14: Pressure vs Time curve for FMC 2-18-10 on 800-micron fracture width
Table H. 14: Mud Loss & Total Sealing Time Values for FMC 2-18-10 on 800-micron fracture
width
Code
Mud Loss (ml) Total
Sealing
Time (sec) Stage I Stage II Stage III Total
FMC 02-18-10 D-800µ 15.4 * * >125 FAIL
FMC 02-18-10 D-800µ-R1 14 * * >125 FAIL
FMC 02-18-10 D-800µ-R2 73 * * >125 FAIL
0
100
200
300
400
500
600
700
800
900
1000
1100
1200
1300
1400
1500
1600
1700
1800
1900
20000 1
00
20
0
300
400
500
60
0
70
0
80
0
900
Pre
ssur
e (p
si)
Time (sec) t0+t
FMC 2-18-10 D-800 µ
FMC 2-18-10 D-800 µ
FMC 2-18-10 D-800 µ
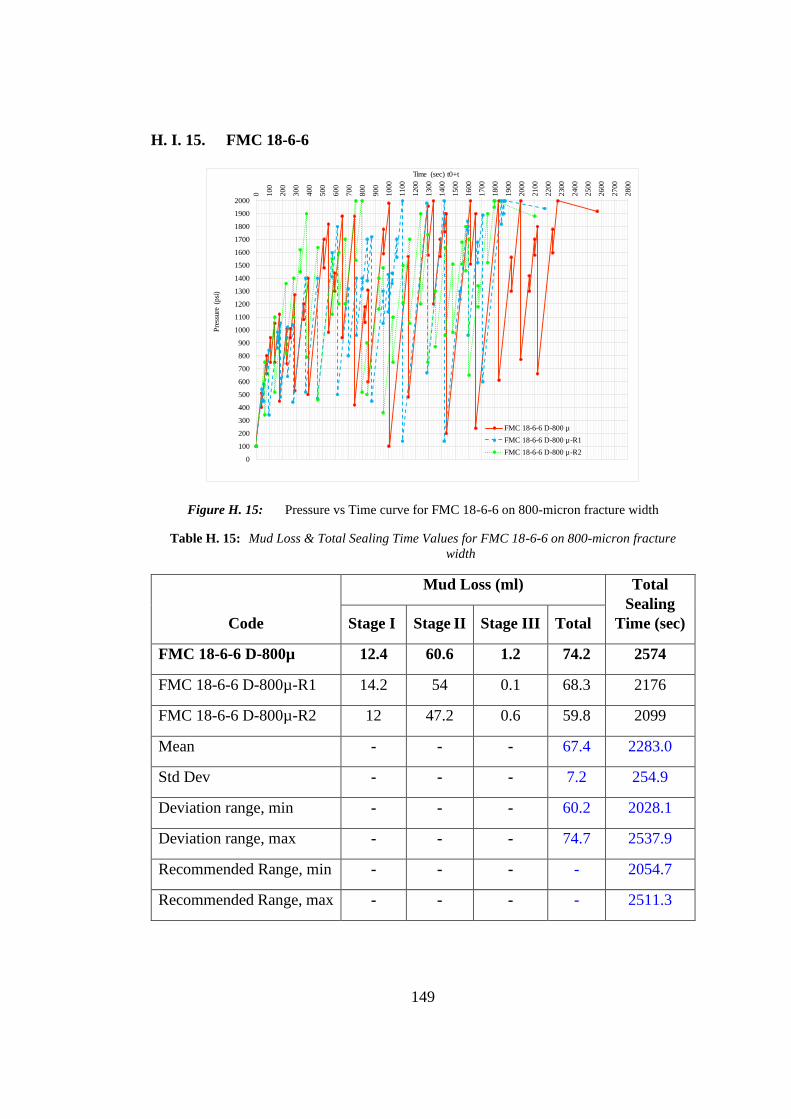
149
H. I. 15. FMC 18-6-6
Figure H. 15: Pressure vs Time curve for FMC 18-6-6 on 800-micron fracture width
Table H. 15: Mud Loss & Total Sealing Time Values for FMC 18-6-6 on 800-micron fracture
width
Code
Mud Loss (ml) Total
Sealing
Time (sec) Stage I Stage II Stage III Total
FMC 18-6-6 D-800µ 12.4 60.6 1.2 74.2 2574
FMC 18-6-6 D-800µ-R1 14.2 54 0.1 68.3 2176
FMC 18-6-6 D-800µ-R2 12 47.2 0.6 59.8 2099
Mean - - - 67.4 2283.0
Std Dev - - - 7.2 254.9
Deviation range, min - - - 60.2 2028.1
Deviation range, max - - - 74.7 2537.9
Recommended Range, min - - - - 2054.7
Recommended Range, max - - - - 2511.3
0
100
200
300
400
500
600
700
800
900
1000
1100
1200
1300
1400
1500
1600
1700
1800
1900
2000
0 10
0
200
300
40
0
500
60
0
70
0
800
90
0
10
00
1100
12
00
13
00
1400
15
00
1600
1700
18
00
1900
2000
21
00
2200
2300
24
00
2500
2600
27
00
2800
Pre
ssur
e (p
si)
Time (sec) t0+t
FMC 18-6-6 D-800 µ
FMC 18-6-6 D-800 µ-R1
FMC 18-6-6 D-800 µ-R2

150
H. I. 16. FMC 6-18-6
Figure H. 16: Pressure vs Time curve for FMC 6-18-6 on 800-micron fracture width
Table H. 16: Mud Loss & Total Sealing Time Values for FMC 6-18-6 on 800-micron
fracture width
Code
Mud Loss (ml) Total
Sealing
Time (sec) Stage I Stage II Stage III Total
FMC 06-18-06 D-800µ 10.2 27.8 1.2 39.2 1399
FMC 06-18-06 D-800µ-R1 12.6 15.4 0.8 28.8 977
FMC 06-18-06 D-800µ-R2 12 24 1 37 1348
Mean - - - 35.0 1241.3
Std Dev - - - 5.5 230.3
Deviation range, min - - - 29.5 1011.0
Deviation range, max - - - 40.5 1471.7
Recommended Range, min - - - - 1117.2
Recommended Range, max - - - - 1365.5
0
100
200
300
400
500
600
700
800
900
1000
1100
1200
1300
1400
1500
1600
1700
1800
1900
20000 100
200
300
400
500
60
0
70
0
80
0
90
0
10
00
11
00
1200
1300
1400
1500
Pre
ssur
e (p
si)
Time (sec) t0+t
FMC 6-18-6 D-800 µ
FMC 6-18-6 D-800 µ-R1
FMC 6-18-6 D-800 µ-R2

151
H. I. 17. FMC 6-6-18
Figure H. 17: Pressure vs Time curve for FMC 6-6-18 on 800-micron fracture width
Table H. 17: Mud Loss & Total Sealing Time Values for FMC 6-6-18 on 800-micron
fracture width
Code
Mud Loss (ml) Total
Sealing
Time (sec) Stage I Stage II Stage III Total
FMC 06-06-18 D-800µ 9 27 1.4 37.4 1387
FMC 06-06-18 D-800µ-R1 9 28.2 1.4 38.6 1463
FMC 06-06-18 D-800µ-R2 8.6 20.4 0.6 29.6 1237
Mean - - - 35.2 1362.3
Std Dev - - - 4.9 115.0
Deviation range, min - - - 30.3 1247.3
Deviation range, max - - - 40.1 1477.3
Recommended Range, min - - - - 1226.1
Recommended Range, max - - - - 1498.6
0
100
200
300
400
500
600
700
800
900
1000
1100
1200
1300
1400
1500
1600
1700
1800
1900
2000
0 10
0
20
0
30
0
40
0
50
0
600
700
800
900
10
00
11
00
12
00
13
00
14
00
1500
1600
Pre
ssur
e (p
si)
Time (sec) t0+t
FMC 6-6-18 D-800 µ
FMC 6-6-18 D-800 µ-R1
FMC 6-6-18 D-800 µ-R2

152
H. II. Results Obtained for Total Concentration of 28 ppb for 800-µm Slot
H. II. 1. FMC 8-10-10
Figure H. 18: Pressure vs Time curve for FMC 8-10-10 on 800-micron fracture width
Table H. 18: Mud Loss & Total Sealing Time Values for FMC 8-10-10 on 800-micron fracture
width
Code
Mud Loss (ml) Total
Sealing
Time (sec) Stage I Stage II Stage III Total
FMC 8-10-10 D-800µ 9.2 23.3 0.5 33 1327
FMC 8-10-10 D-800µ-R1 8 14.6 0.4 23 979
FMC 8-10-10 D-800µ-R2 10.2 12.2 0.6 23 849
Mean - - - 26.3 1051.7
Std Dev - - - 5.8 247.1
Deviation range, min - - - 20.6 804.5
Deviation range, max - - - 32.1 1298.8
Recommended Range, min - - - - 946.5
Recommended Range, max - - - - 1156.8
0
100
200
300
400
500
600
700
800
900
1000
1100
1200
1300
1400
1500
1600
1700
1800
1900
2000
0 100
20
0
30
0
400
50
0
60
0
700
800
90
0
1000
1100
12
00
1300
1400
Pre
ssur
e (p
si)
Time (sec) t0+t
FMC 8-10-10 D-800 µ
FMC 8-10-10 D-800 µ-R1
FMC 8-10-10 D-800 µ-R2

153
H. II. 2. FMC 10-8-10
Figure H. 19: Pressure vs Time curve for FMC 10-8-10 on 800-micron fracture width
Table H. 19: Mud Loss &Total Sealing Time Values for FMC 10-8-10 on 800-micron fracture
width
Code
Mud Loss (ml) Total
Sealing
Time (sec) Stage I Stage II Stage III Total
FMC 10-8-10 D-800µ 7.8 31.2 1 40 1710
FMC 10-8-10 D-800µ-R1 9 17.8 0.4 27.2 1138
FMC 10-8-10 D-800µ-R2 10.1 38.9 0.6 49.6 1963
Mean - - - 38.9 1603.7
Std Dev - - - 11.2 422.7
Deviation range, min - - - 27.7 1181.0
Deviation range, max - - - 50.2 2026.3
Recommended Range, min - - - - 1443.3
Recommended Range, max - - - - 1764.0
0
100
200
300
400
500
600
700
800
900
1000
1100
1200
1300
1400
1500
1600
1700
1800
1900
2000
0 100
200
30
0
40
0
500
600
700
80
0
90
0
1000
1100
1200
13
00
14
00
1500
1600
17
00
18
00
19
00
2000
2100
Pre
ssur
e (p
si)
Time (sec) t0+t
FMC 10-8-10 D-800 µ
FMC 10-8-10 D-800 µ-R1
FMC 10-8-10 D-800 µ-R2

154
H. II. 3. FMC 10-10-8
Figure H. 20: Pressure vs Time curve for FMC 10-10-8 on 800-micron fracture width
Table H. 20: Mud Loss & Total Sealing Time Values for FMC 10-10-8 on 800-micron fracture
width
Code
Mud Loss (ml) Total
Sealing
Time (sec) Stage I Stage II Stage III Total
FMC 10-10-8 D-800µ 9.8 21.7 0.5 32 1322
FMC 10-10-8 D-800µ-R1 8.5 22.5 0.6 31.6 1293
FMC 10-10-8 D-800µ-R2 7.2 15.4 0.2 22.8 1012
Mean - - - 28.8 1209.0
Std Dev - - - 5.2 171.2
Deviation range, min - - - 23.6 1037.8
Deviation range, max - - - 34.0 1380.2
Recommended Range, min - - - - 1088.1
Recommended Range, max - - - - 1329.9
0
100
200
300
400
500
600
700
800
900
1000
1100
1200
1300
1400
1500
1600
1700
1800
1900
20000 100
20
0
30
0
400
50
0
60
0
700
800
90
0
1000
1100
12
00
1300
1400
Pre
ssur
e (p
si)
Time (sec) t0+t
FMC 10-10-8 D-800 µ
FMC 10-10-8 D-800 µ-R1
FMC 10-10-8 D-800 µ-R2
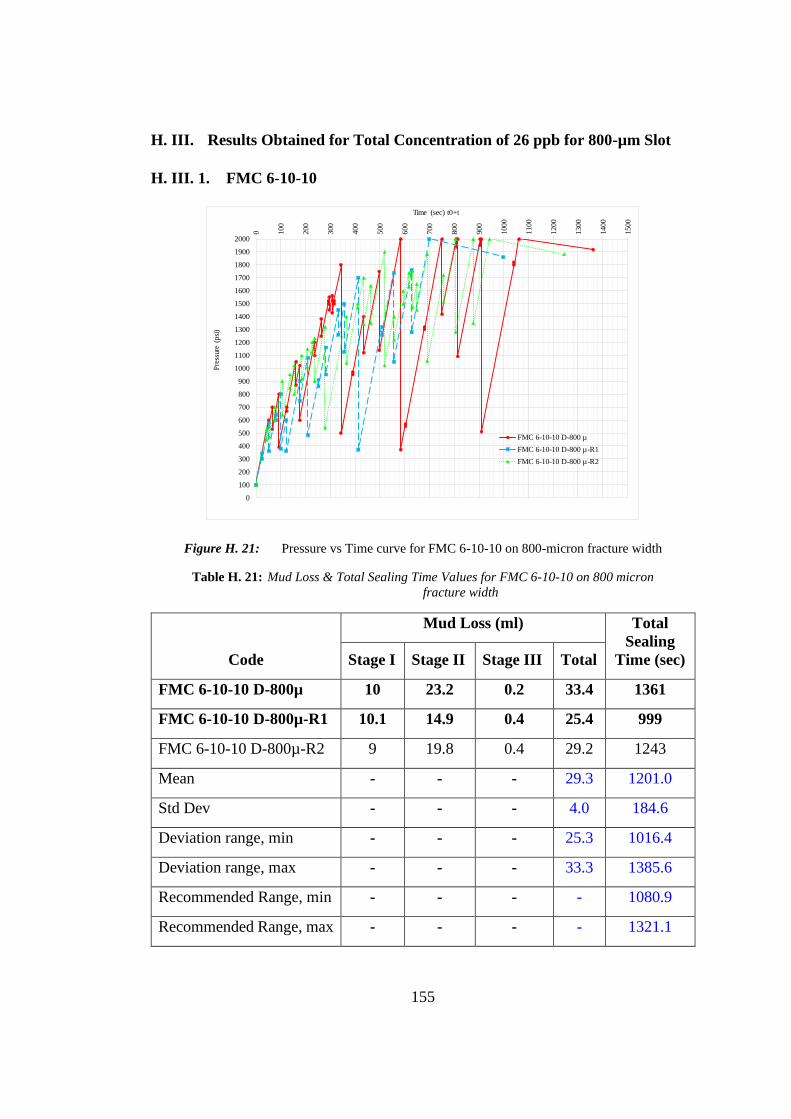
155
H. III. Results Obtained for Total Concentration of 26 ppb for 800-µm Slot
H. III. 1. FMC 6-10-10
Figure H. 21: Pressure vs Time curve for FMC 6-10-10 on 800-micron fracture width
Table H. 21: Mud Loss & Total Sealing Time Values for FMC 6-10-10 on 800 micron
fracture width
Code
Mud Loss (ml) Total
Sealing
Time (sec) Stage I Stage II Stage III Total
FMC 6-10-10 D-800µ 10 23.2 0.2 33.4 1361
FMC 6-10-10 D-800µ-R1 10.1 14.9 0.4 25.4 999
FMC 6-10-10 D-800µ-R2 9 19.8 0.4 29.2 1243
Mean - - - 29.3 1201.0
Std Dev - - - 4.0 184.6
Deviation range, min - - - 25.3 1016.4
Deviation range, max - - - 33.3 1385.6
Recommended Range, min - - - - 1080.9
Recommended Range, max - - - - 1321.1
0
100
200
300
400
500
600
700
800
900
1000
1100
1200
1300
1400
1500
1600
1700
1800
1900
2000
0 100
200
300
400
500
60
0
70
0
80
0
90
0
10
00
11
00
1200
1300
1400
1500
Pre
ssur
e (p
si)
Time (sec) t0+t
FMC 6-10-10 D-800 µ
FMC 6-10-10 D-800 µ-R1
FMC 6-10-10 D-800 µ-R2

156
H. III. 2. FMC 10-6-10
Figure H. 22: Pressure vs Time curve for FMC 10-6-10 on 800-micron fracture width
Table H. 22: Mud Loss & Total Sealing Time Values for FMC 10-6-10 on 800 micron
fracture width
Code
Mud Loss (ml) Total
Sealing
Time (sec) Stage I Stage II Stage III Total
FMC 10-6-10 D-800µ 7.8 12.8 0.4 21 938
FMC 10-6-10 D-800µ-R1 8 19.8 0.2 28 1146
FMC 10-6-10 D-800µ-R2 8.2 17.5 0.5 26.2 1429
Mean - - - 25.1 1171.0
Std Dev - - - 3.6 246.5
Deviation range, min - - - 21.4 924.5
Deviation range, max - - - 28.7 1417.5
Recommended Range, min - - - - 1053.9
Recommended Range, max - - - - 1288.1
0
100
200
300
400
500
600
700
800
900
1000
1100
1200
1300
1400
1500
1600
1700
1800
1900
20000 1
00
20
0
30
0
40
0
50
0
600
700
800
900
10
00
11
00
12
00
13
00
14
00
1500
1600
Pre
ssur
e (p
si)
Time (sec) t0+t
FMC 10-6-10 D-800 µ
FMC 10-6-10 D-800 µ-R1
FMC 10-6-10 D-800 µ-R2

157
H. III. 3. FMC 10-10-6
Figure H. 23: Pressure vs Time curve for FMC 10-10-6 on 800-micron fracture width
Table H. 23: Mud Loss &Total Sealing Time Values for FMC 10-10-6 on 800-micron
fracture width
Code
Mud Loss (ml) Total
Sealing
Time (sec) Stage I Stage II Stage III Total
FMC 10-10-6 D-800µ 10.2 14.8 0.6 25.6 984
FMC 10-10-6 D-800µ-R1 13.5 34 0.5 48 1757
FMC 10-10-6 D-800µ-R2 7 47 0.2 54.2 2211
Mean - - - 42.6 1650.7
Std Dev - - - 15.0 620.4
Deviation range, min - - - 27.6 1030.3
Deviation range, max - - - 57.6 2271.0
Recommended Range, min - - - - 1485.6
Recommended Range, max - - - - 1815.7
0
100
200
300
400
500
600
700
800
900
1000
1100
1200
1300
1400
1500
1600
1700
1800
1900
2000
0 10
0
20
0
30
0
40
0
50
0
60
0
70
0
800
900
1000
1100
1200
1300
1400
15
00
16
00
17
00
18
00
19
00
20
00
21
00
2200
2300
2400
Pre
ssur
e (p
si)
Time (sec) t0+t
FMC 10-10-6 D-800 µ
FMC 10-10-6 D-800 µ-R1
FMC 10-10-6 D-800 µ-R2

158
H. IV. Results Obtained for Total Concentration of 24 ppb for 800-µm Slot
H. IV. 1. FMC 4-10-10
Figure H. 24: Pressure vs Time curve for FMC 4-10-10 on 800-micron fracture width
Table H. 24: Mud Loss & Total Sealing Time Values for FMC 4-10-10 on 800-micron fracture
width
Code
Mud Loss (ml) Total
Sealing
Time (sec) Stage I Stage II Stage III Total
FMC 4-10-10 D-800µ 12.5 28.7 0.9 42.1 1492
FMC 4-10-10 D-800µ-R1 12 18.8 0.6 31.4 1189
FMC 4-10-10 D-800µ-R2 10.6 18 0.5 29.1 1063
Mean - - - 34.2 1248.0
Std Dev - - - 6.9 220.5
Deviation range, min - - - 27.3 1027.5
Deviation range, max - - - 41.1 1468.5
Recommended Range, min - - - - 1123.2
Recommended Range, max - - - - 1372.8
0
100
200
300
400
500
600
700
800
900
1000
1100
1200
1300
1400
1500
1600
1700
1800
1900
2000
0 10
0
20
0
30
0
40
0
50
0
600
700
800
900
10
00
11
00
12
00
13
00
14
00
1500
1600
Pre
ssur
e (p
si)
Time (sec) t0+t
FMC 4-10-10 D-800 µ
FMC 4-10-10 D-800 µ-R1
FMC 4-10-10 D-800 µ-R2

159
H. IV. 2. FMC 10-4-10
Figure H. 25: Pressure vs Time curve for FMC 10-4-10 on 800-micron fracture width
Table H. 25: Mud Loss &Total Sealing Time Values for FMC 10-4-10 on 800-micron fracture
width
Code
Mud Loss (ml) Total
Sealing
Time (sec) Stage I Stage II Stage III Total
FMC 10-4-10 D-800µ 10 19 0.6 29.6 1173
FMC 10-4-10 D-800µ-R1 10.2 26.8 1 38 1543
FMC 10-4-10 D-800µ-R2 8.6 27.8 0.8 37.2 1662
Mean - - - 34.9 1459.3
Std Dev - - - 4.6 255.0
Deviation range, min - - - 30.3 1204.3
Deviation range, max - - - 39.6 1714.3
Recommended Range, min - - - - 1313.4
Recommended Range, max - - - - 1605.3
0
100
200
300
400
500
600
700
800
900
1000
1100
1200
1300
1400
1500
1600
1700
1800
1900
2000
0 10
0
20
0
30
0
40
0
50
0
600
700
800
900
1000
11
00
12
00
13
00
14
00
15
00
16
00
1700
1800
Pre
ssur
e (p
si)
Time (sec) t0+t
FMC 10-4-10 D-800 µ
FMC 10-4-10 D-800 µ-R1
FMC 10-4-10 D-800 µ-R2

160
H. IV. 3. FMC 10-10-4
Figure H. 26: Pressure vs Time curve for FMC 10-10-4 on 800-micron fracture width
Table H. 26: Mud Loss & Total Sealing Time Values for FMC 10-10-4 on 800-micron fracture
width
Code
Mud Loss (ml) Total
Sealing
Time (sec) Stage I Stage II Stage III Total
FMC 10-10-4 D-800µ 13 * * >125 FAIL
FMC 10-10-4 D-800µ-R1 15 * * >125 FAIL
FMC 10-10-4 D-800µ-R2 15 59.4 2.2 76.6 2487
0
100
200
300
400
500
600
700
800
900
1000
1100
1200
1300
1400
1500
1600
1700
1800
1900
20000 1
00
20
0
300
40
0
500
60
0
700
80
0
900
10
00
1100
12
00
1300
14
00
1500
16
00
1700
18
00
19
00
2000
21
00
2200
23
00
2400
25
00
2600
27
00
2800
29
00
3000
31
00
3200
33
00
3400
35
00
36
00
3700
38
00
3900
40
00
4100
Pre
ssur
e (p
si)
Time (sec) t0+t
FMC 10-10-4 D-800 µ
FMC 10-10-4 D-800 µ-R1
FMC 10-10-4 D-800 µ-R2

161
H. V. Results Obtained for Total Concentration of 22 ppb for 800-µm Slot
H. V. 1. FMC 2-10-10
Figure H. 27: Pressure vs Time curve for FMC 10-10-10 on 800-micron fracture width
Table H. 27: Mud Loss &Total Sealing Time Values for FMC 2-10-10 on 800-micron
fracture width
Code
Mud Loss (ml) Total
Sealing
Time (sec) Stage I Stage II Stage III Total
FMC 2-10-10 D-800µ 15 48 1 64 1591
FMC 2-10-10 D-800µ-R1 14 * * >125 FAIL
FMC 2-10-10 D-800µ-R2 14 * * >125 FAIL
0
100
200
300
400
500
600
700
800
900
1000
1100
1200
1300
1400
1500
1600
1700
1800
1900
2000
0 100
200
30
0
40
0
500
600
700
80
0
90
0
10
00
1100
1200
13
00
14
00
15
00
1600
1700
Pre
ssur
e (p
si)
Time (sec) t0+t
FMC 2-10-10 D-800 µ
FMC 2-10-10 D-800 µ-R1
FMC 2-10-10 D-800 µ-R2

162
H. V. 2. FMC 10-2-10
Figure H. 28: Pressure vs Time curve for FMC 10-2-10 on 800-micron fracture width
Table H. 28: Mud Loss & Total Sealing Time Values for FMC 10-2-10 on 800-micron fracture
width
Code
Mud Loss (ml) Total
Sealing
Time (sec) Stage I Stage II Stage III Total
FMC 10-2-10 D-800µ 9.2 19.2 0.5 28.9 1231
FMC 10-2-10 D-800µ-R1 9.6 15.6 0.2 25.4 1187
FMC 10-2-10 D-800µ-R2 9.6 44 0.2 53.8 2269
Mean - - - 36.0 1562.3
Std Dev - - - 15.5 612.4
Deviation range, min - - - 20.5 949.9
Deviation range, max - - - 51.5 2174.7
Recommended Range, min - - - - 1406.1
Recommended Range, max - - - - 1718.6
0
100
200
300
400
500
600
700
800
900
1000
1100
1200
1300
1400
1500
1600
1700
1800
1900
20000 1
00
20
0
30
0
40
0
50
0
60
0
70
0
800
900
1000
1100
1200
1300
1400
15
00
16
00
17
00
18
00
19
00
20
00
21
00
2200
2300
2400
Pre
ssur
e (p
si)
Time (sec) t0+t
FMC 10-2-10 D-800 µ
FMC 10-2-10 D-800 µ-R1
FMC 10-2-10 D-800 µ-R2

163
H. V. 3. FMC 10-10-2
Figure H. 29: Pressure vs Time curve for FMC 10-10-2 on 800-micron fracture width
Table H. 29: Mud Loss &Total Sealing Time Values for FMC 10-10-2 on 800-micron
fracture width
Code
Mud Loss (ml) Total
Sealing
Time (sec) Stage I Stage II Stage III Total
FMC 10-10-2 D-800µ 17 * * >125 FAIL
FMC 10-10-2 D-800µ-R1 16.6 * * >125 FAIL
FMC 10-10-2 D-800µ-R2 14 * * >125 FAIL
0
100
200
300
400
500
600
700
800
900
1000
1100
1200
1300
1400
1500
1600
1700
1800
1900
2000
0 10
0
200
30
0
400
50
0
60
0
700
80
0
900
10
00
1100
12
00
13
00
1400
15
00
1600
17
00
1800
19
00
20
00
2100
22
00
2300
24
00
2500
2600
27
00
2800
29
00
3000
31
00
3200
3300
34
00
3500
36
00
3700
Pre
ssur
e (p
si)
Time (sec) t0+t
FMC 10-10-2 D-800 µ
FMC 10-10-2 D-800 µ-R1
FMC 10-10-2 D-800 µ-R2

164
H. VI. Results Obtained for Total Concentration of 20 ppb for 800-µm Slot
H. VI. 1. FMC 0-10-10
Figure H. 30: Pressure vs Time curve for FMC 0-10-10 on 800-micron fracture width
Table H. 30: Mud Loss & Total Sealing Time Values for FMC 0-10-10 on 800-micron fracture
width
Code
Mud Loss (ml) Total
Sealing
Time (sec) Stage I Stage II Stage III Total
FMC 0-10-10 D-800µ * * * >125 FAIL
FMC 0-10-10 D-800µ-R1 * * * >125 FAIL
FMC 0-10-10 D-800µ-R2 * * * >125 FAIL
0
100
200
300
400
500
600
700
800
900
1000
1100
1200
1300
1400
1500
1600
1700
1800
1900
2000
0 100
Pre
ssur
e (p
si)
Time (sec) t0+t
FMC 0-10-10 D-800 µ
FMC 0-10-10 D-800 µ-R1
FMC 0-10-10 D-800 µ-R2
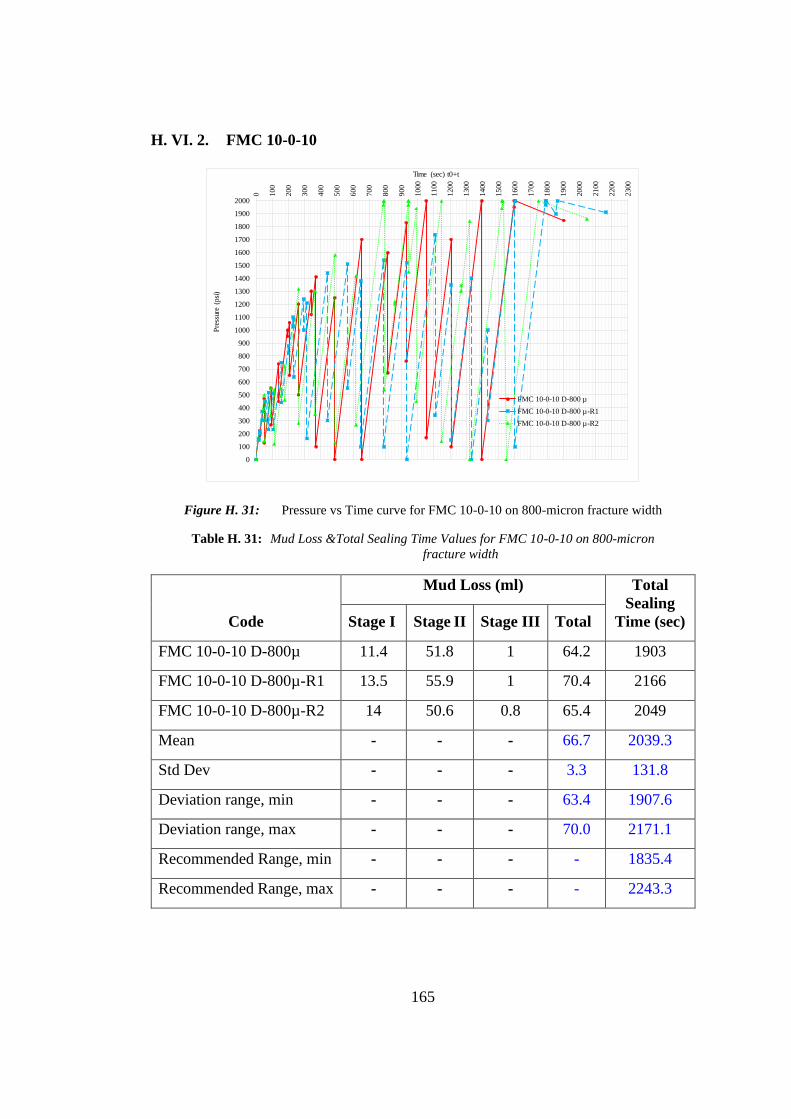
165
H. VI. 2. FMC 10-0-10
Figure H. 31: Pressure vs Time curve for FMC 10-0-10 on 800-micron fracture width
Table H. 31: Mud Loss &Total Sealing Time Values for FMC 10-0-10 on 800-micron
fracture width
Code
Mud Loss (ml) Total
Sealing
Time (sec) Stage I Stage II Stage III Total
FMC 10-0-10 D-800µ 11.4 51.8 1 64.2 1903
FMC 10-0-10 D-800µ-R1 13.5 55.9 1 70.4 2166
FMC 10-0-10 D-800µ-R2 14 50.6 0.8 65.4 2049
Mean - - - 66.7 2039.3
Std Dev - - - 3.3 131.8
Deviation range, min - - - 63.4 1907.6
Deviation range, max - - - 70.0 2171.1
Recommended Range, min - - - - 1835.4
Recommended Range, max - - - - 2243.3
0
100
200
300
400
500
600
700
800
900
1000
1100
1200
1300
1400
1500
1600
1700
1800
1900
2000
0 100
20
0
300
40
0
500
600
70
0
800
90
0
1000
1100
12
00
1300
14
00
1500
16
00
17
00
1800
19
00
2000
21
00
22
00
2300
Pre
ssur
e (p
si)
Time (sec) t0+t
FMC 10-0-10 D-800 µ
FMC 10-0-10 D-800 µ-R1
FMC 10-0-10 D-800 µ-R2
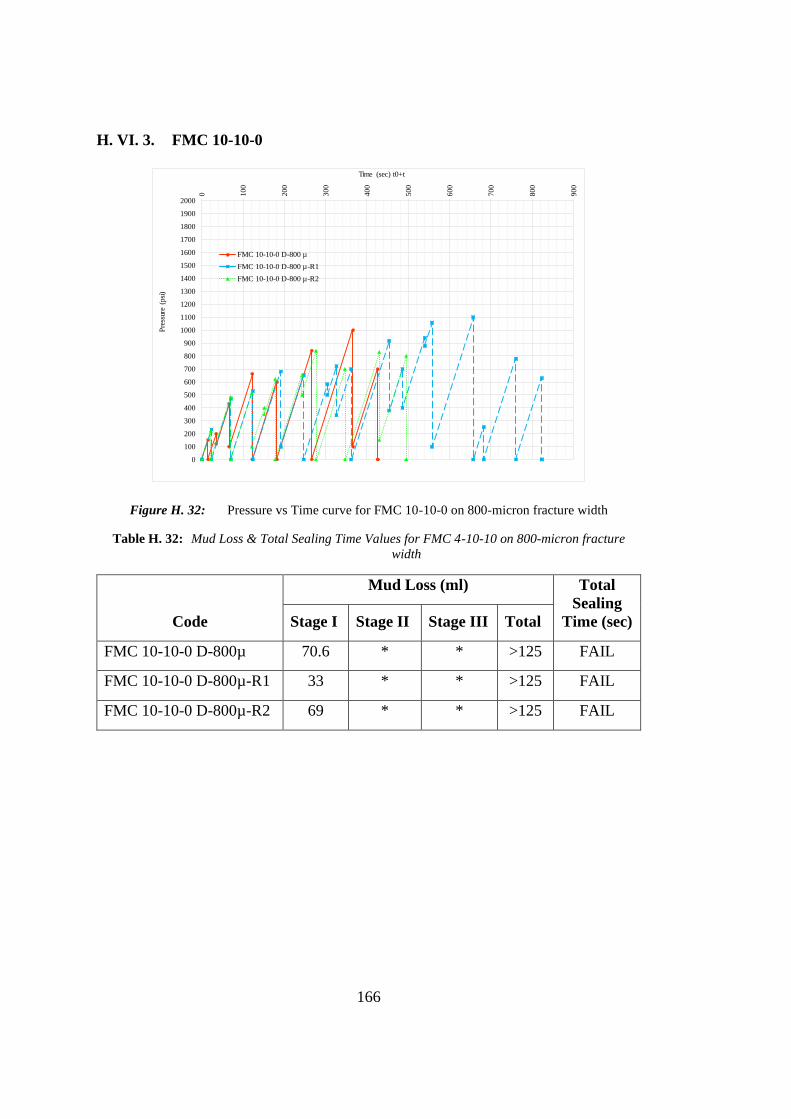
166
H. VI. 3. FMC 10-10-0
Figure H. 32: Pressure vs Time curve for FMC 10-10-0 on 800-micron fracture width
Table H. 32: Mud Loss & Total Sealing Time Values for FMC 4-10-10 on 800-micron fracture
width
Code
Mud Loss (ml) Total
Sealing
Time (sec) Stage I Stage II Stage III Total
FMC 10-10-0 D-800µ 70.6 * * >125 FAIL
FMC 10-10-0 D-800µ-R1 33 * * >125 FAIL
FMC 10-10-0 D-800µ-R2 69 * * >125 FAIL
0
100
200
300
400
500
600
700
800
900
1000
1100
1200
1300
1400
1500
1600
1700
1800
1900
20000 1
00
20
0
300
400
500
60
0
70
0
80
0
900
Pre
ssur
e (p
si)
Time (sec) t0+t
FMC 10-10-0 D-800 µ
FMC 10-10-0 D-800 µ-R1
FMC 10-10-0 D-800 µ-R2

167
H. VI. 4. FMC 6-6-8
Figure H. 33: Pressure vs Time curve for FMC 6-6-8 on 800-micron fracture width
Table H. 33: Mud Loss & Total Sealing Time Values for FMC 6-6-8 on 800-micron
fracture width
Code
Mud Loss (ml) Total
Sealing
Time (sec) Stage I Stage II Stage III Total
FMC 6-6-8 D-800µ 14 52 1 67 2303
FMC 6-6-8 D-800µ-R1 9.8 55.6 0.7 66.1 2351
FMC 6-6-8 D-800µ-R2 9.2 20.8 1 31 1102
Mean - - - 54.7 1918.7
Std Dev - - - 20.5 707.7
Deviation range, min - - - 34.2 1211.0
Deviation range, max - - - 75.2 2626.3
Recommended Range, min - - - - 1726.8
Recommended Range, max - - - - 2110.5
0
100
200
300
400
500
600
700
800
900
1000
1100
1200
1300
1400
1500
1600
1700
1800
1900
2000
0 100
200
300
400
500
600
700
800
90
0
10
00
11
00
12
00
13
00
14
00
15
00
16
00
17
00
18
00
1900
2000
2100
2200
2300
2400
2500
Pre
ssur
e (p
si)
Time (sec) t0+t
FMC 6-6-8 D-800 µ
FMC 6-6-8 D-800 µ-R1
FMC 6-6-8 D-800 µ-R2
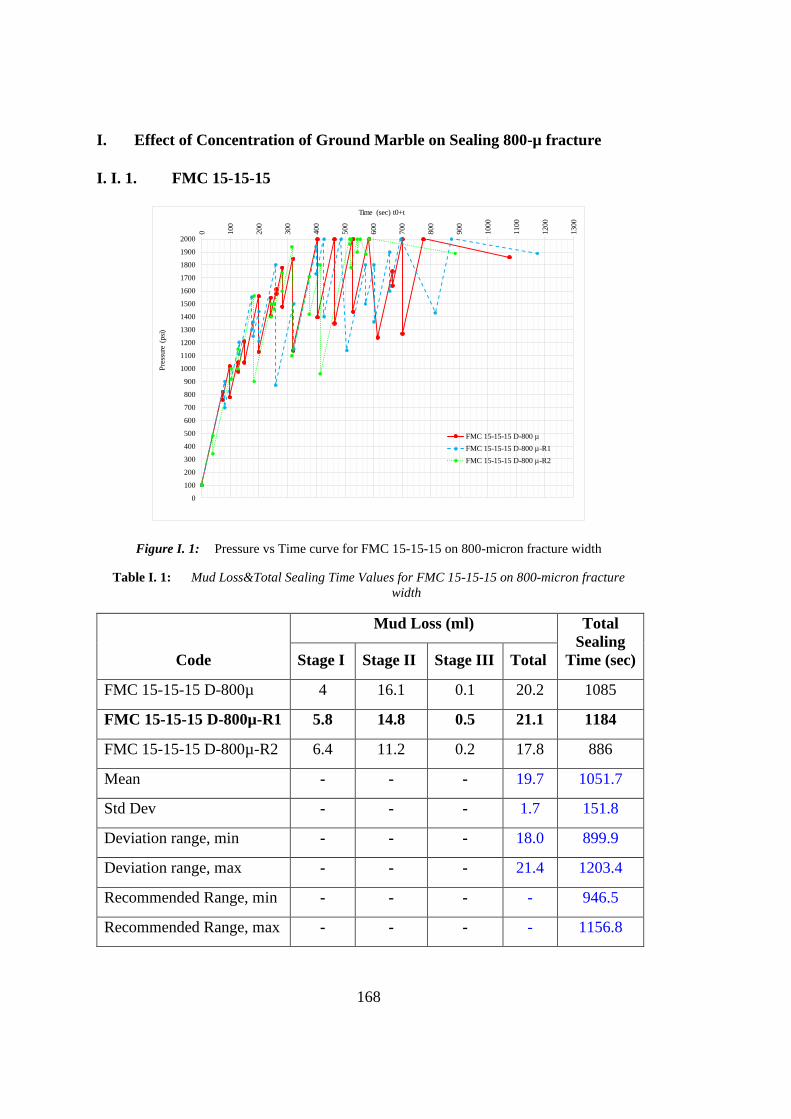
168
I. Effect of Concentration of Ground Marble on Sealing 800-µ fracture
I. I. 1. FMC 15-15-15
Figure I. 1: Pressure vs Time curve for FMC 15-15-15 on 800-micron fracture width
Table I. 1: Mud Loss&Total Sealing Time Values for FMC 15-15-15 on 800-micron fracture
width
Code
Mud Loss (ml) Total
Sealing
Time (sec) Stage I Stage II Stage III Total
FMC 15-15-15 D-800µ 4 16.1 0.1 20.2 1085
FMC 15-15-15 D-800µ-R1 5.8 14.8 0.5 21.1 1184
FMC 15-15-15 D-800µ-R2 6.4 11.2 0.2 17.8 886
Mean - - - 19.7 1051.7
Std Dev - - - 1.7 151.8
Deviation range, min - - - 18.0 899.9
Deviation range, max - - - 21.4 1203.4
Recommended Range, min - - - - 946.5
Recommended Range, max - - - - 1156.8
0
100
200
300
400
500
600
700
800
900
1000
1100
1200
1300
1400
1500
1600
1700
1800
1900
2000
0 100
200
300
400
500
600
700
800
900
1000
1100
1200
1300
Pre
ssur
e (p
si)
Time (sec) t0+t
FMC 15-15-15 D-800 µ
FMC 15-15-15 D-800 µ-R1
FMC 15-15-15 D-800 µ-R2

169
I. I. 2. FMC 20-20-20
Figure I. 2: Pressure vs Time curve for FMC 20-20-20 on 800-micron fracture width
Table I. 2: Mud Loss & Total Sealing Time Values for FMC 20-20-20 on 800-micron fracture
width
Code
Mud Loss (ml) Total
Sealing
Time (sec) Stage I Stage II Stage III Total
FMC 20-20-20 D-800µ 4.1 16.6 0.4 21.1 1116
FMC 20-20-20 D-800µ-R1 3.2 6.6 0.2 10 698
FMC 20-20-20 D-800µ-R2 2.6 9.1 0.1 11.8 762
Mean - - - 14.3 858.7
Std Dev - - - 6.0 225.1
Deviation range, min - - - 8.3 633.5
Deviation range, max - - - 20.3 1083.8
Recommended Range, min - - - - 772.8
Recommended Range, max - - - - 944.5
0
100
200
300
400
500
600
700
800
900
1000
1100
1200
1300
1400
1500
1600
1700
1800
1900
2000
0 100
200
300
400
500
600
700
800
900
1000
1100
1200
Pre
ssur
e (p
si)
Time (sec) t0+t
FMC 20-20-20 D-800 µ
FMC 20-20-20 D-800 µ-R1
FMC 20-20-20 D-800 µ-R2

170
I. I. 3. FMC 9-15-21
Figure I. 3: Pressure vs Time curve for FMC 9-15-21 on 800-micron fracture width
Table I. 3: Mud Loss & Total Sealing Time Values for FMC 9-15-21 on 800-micron fracture
width
Code
Mud Loss (ml) Total
Sealing
Time (sec) Stage I Stage II Stage III Total
FMC 9-15-21 D-800µ 5.9 19.5 4 29.4 1330
FMC 9-15-21 D-800µ-R1 4.8 11.6 0.2 16.6 879
FMC 9-15-21 D-800µ-R2 5.6 13.8 1.2 20.6 983
Mean - - - 22.2 1064.0
Std Dev - - - 6.5 236.2
Deviation range, min - - - 15.7 827.8
Deviation range, max - - - 28.7 1300.2
Recommended Range, min - - - - 957.6
Recommended Range, max - - - - 1170.4
0
100
200
300
400
500
600
700
800
900
1000
1100
1200
1300
1400
1500
1600
1700
1800
1900
20000 100
20
0
30
0
400
50
0
60
0
700
800
90
0
1000
1100
12
00
1300
1400
Pre
ssur
e (p
si)
Time (sec) t0+t
FMC 9-15-21 D-800 µ
FMC 9-15-21 D-800 µ-R1
FMC 9-15-21 D-800 µ-R2

171
I. I. 4. FMC 12-20-28
Figure I. 4: Pressure vs Time curve for FMC 12-20-28 on 800-micron fracture width
Table I. 4: Mud Loss & Total Sealing Time Values for FMC 12-20-28 on 800-micron fracture
width
Code
Mud Loss (ml) Total
Sealing
Time (sec) Stage I Stage II Stage III Total
FMC 12-20-28 D-800µ 4.2 17 0.4 21.6 1103
FMC 12-20-28 D-800µ-R1 4.8 15.5 0.2 20.5 985
FMC 12-20-28 D-800µ-R2 4.2 10 0.2 14.4 833
Mean - - - 18.8 973.7
Std Dev - - - 3.9 135.4
Deviation range, min - - - 15.0 838.3
Deviation range, max - - - 22.7 1109.0
Recommended Range, min - - - - 876.3
Recommended Range, max - - - - 1071.0
0
100
200
300
400
500
600
700
800
900
1000
1100
1200
1300
1400
1500
1600
1700
1800
1900
2000
0 10
0
20
0
30
0
400
500
600
700
80
0
90
0
10
00
1100
1200
Pre
ssur
e (p
si)
Time (sec) t0+t
FMC 12-20-28 D-800 µ
FMC 12-20-28 D-800 µ-R1
FMC 12-20-28 D-800 µ-R2

172
J. Effect of Particle Size Distribution of Ground Marble on Sealing 1200-µ
Fracture Width
J. I. Results Obtained for Total Concentration of 30 ppb for 1200-µ Slot
J. I. 1. FMC 30-0-0, FMC 0-30-0 & FMC 0-0-30
Table J. 1: Mud Loss & Total Sealing Time Values for each particle range individually
on 1200-micron fracture width
Code
Mud Loss (ml) Total
Sealing
Time (sec) Stage I Stage II Stage III Total
FMC 30-0-0 D-1200µ * * * >125 FAIL
FMC 0-30-0 D-1200µ * * * >125 FAIL
FMC 0-0-30 D-1200µ * * * >125 FAIL

173
J. I. 2. FMC 10-10-10
Figure J. 1: Pressure vs Time curve for FMC 10-10-10 on 1200-micron fracture width
Table J. 2: Mud Loss & Total Sealing Time Values for FMC 10-10-10 on 1200-micron fracture
width
Code
Mud Loss (ml) Total
Sealing
Time (sec) Stage I Stage II Stage III Total
FMC 10-10-10 D-1200µ 36.1 * * >125 FAIL
FMC 10-10-10 D-1200µ-R1 56.0 * * >125 FAIL
FMC 10-10-10 D-1200µ-R2 38.0 * * >125 FAIL
0
100
200
300
400
500
600
700
800
900
1000
1100
1200
1300
1400
1500
1600
1700
1800
1900
2000
0 50
100
150
200
250
300
350
400
450
500
550
600
650
700
750
800
850
900
950
1000
1050
1100
Sea
ling
Pre
ssur
e (p
si)
Time (sec) t0+t
FMC 10-10-10 D-1200 µ
FMC 10-10-10 D-1200 µ-R1
FMC 10-10-10 D-1200 µ-R2

174
J. I. 3. FMC 10-6-14
Figure J. 2: Pressure vs Time curve for FMC 10-6-14 on 1200-micron fracture width
Table J. 3: Mud Loss&Total Sealing Time Values for FMC 10-6-14 on 1200-micron fracture
width
Code
Mud Loss (ml) Total
Sealing
Time (sec) Stage I Stage II Stage III Total
FMC 10-6-14 D-1200µ 30.0 * * >125 FAIL
FMC 10-6-14 D-1200µ-R1 40.0 * * >125 FAIL
FMC 10-6-14 D-1200µ-R2 22.6 * * >125 FAIL
0
100
200
300
400
500
600
700
800
900
1000
1100
1200
1300
1400
1500
1600
1700
1800
1900
20000 5
0
100
15
0
200
250
30
0
350
40
0
450
500
55
0
600
65
0
700
750
80
0
850
90
0
950
1000
10
50
1100
11
50
1200
1250
13
00
1350
14
00
1450
15
00
15
50
1600
16
50
1700
Sea
ling
Pre
ssur
e (p
si)
Time (sec) t0+t
FMC 10-6-14 D-1200 µ
FMC 10-6-14 D-1200 µ-R1
FMC 10-6-14 D-1200 µ-R2
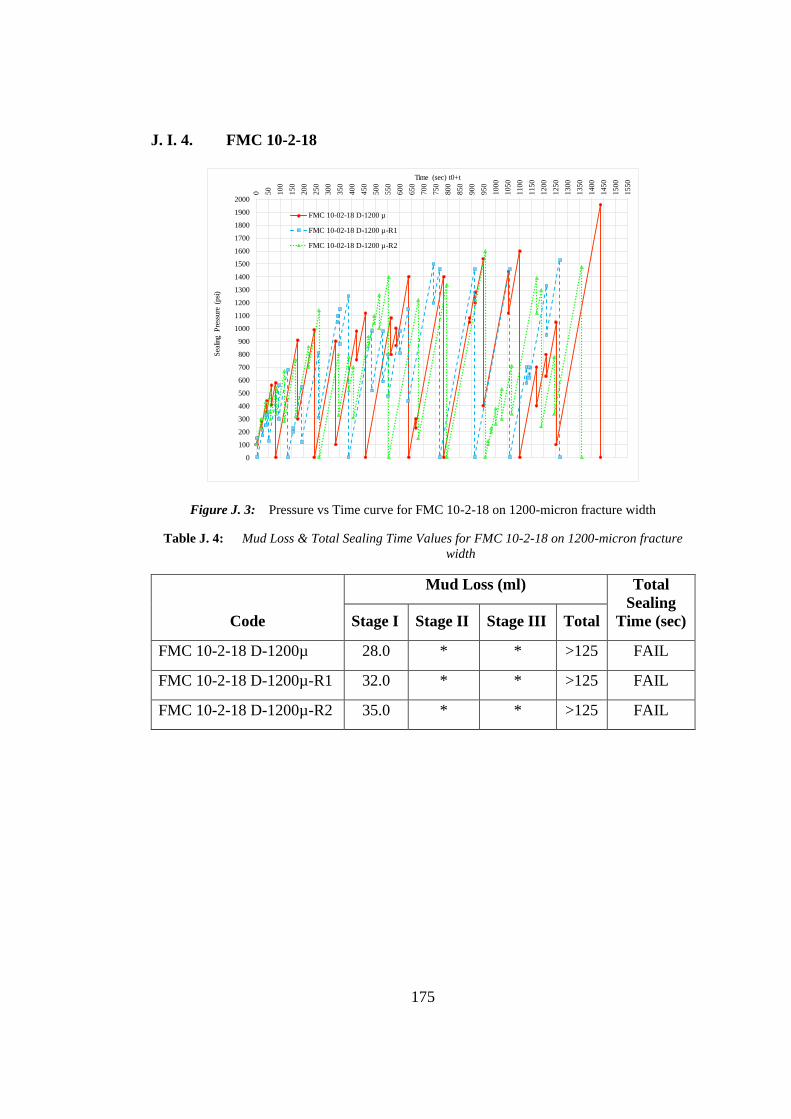
175
J. I. 4. FMC 10-2-18
Figure J. 3: Pressure vs Time curve for FMC 10-2-18 on 1200-micron fracture width
Table J. 4: Mud Loss & Total Sealing Time Values for FMC 10-2-18 on 1200-micron fracture
width
Code
Mud Loss (ml) Total
Sealing
Time (sec) Stage I Stage II Stage III Total
FMC 10-2-18 D-1200µ 28.0 * * >125 FAIL
FMC 10-2-18 D-1200µ-R1 32.0 * * >125 FAIL
FMC 10-2-18 D-1200µ-R2 35.0 * * >125 FAIL
0
100
200
300
400
500
600
700
800
900
1000
1100
1200
1300
1400
1500
1600
1700
1800
1900
2000
0 50
10
0
150
200
250
30
0
35
0
400
450
50
0
55
0
600
650
700
75
0
80
0
850
900
95
0
10
00
10
50
1100
1150
12
00
12
50
1300
1350
1400
14
50
15
00
1550
Sea
ling
Pre
ssur
e (p
si)
Time (sec) t0+t
FMC 10-02-18 D-1200 µ
FMC 10-02-18 D-1200 µ-R1
FMC 10-02-18 D-1200 µ-R2
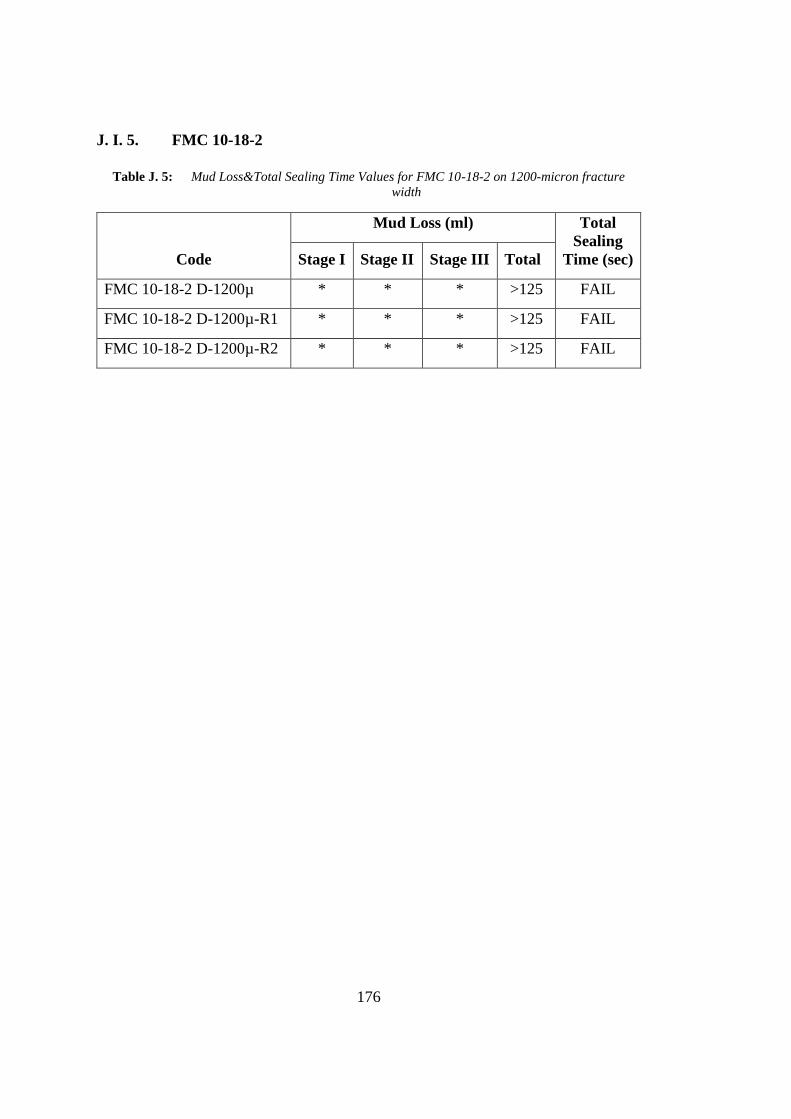
176
J. I. 5. FMC 10-18-2
Table J. 5: Mud Loss&Total Sealing Time Values for FMC 10-18-2 on 1200-micron fracture
width
Code
Mud Loss (ml) Total
Sealing
Time (sec) Stage I Stage II Stage III Total
FMC 10-18-2 D-1200µ * * * >125 FAIL
FMC 10-18-2 D-1200µ-R1 * * * >125 FAIL
FMC 10-18-2 D-1200µ-R2 * * * >125 FAIL

177
J. I. 6. FMC 10-14-6
Figure J. 4: Pressure vs Time curve for FMC 10-14-6 on 1200-micron fracture width
Table J. 6: Mud Loss&Total Sealing Time Values for FMC 10-14-6 on 1200-micron fracture
width
Code
Mud Loss (ml) Total
Sealing
Time (sec) Stage I Stage II Stage III Total
FMC 10-14-6 D-1200µ 99.4 * * >125 FAIL
FMC 10-14-6 D-1200µ-R1 100.4 * * >125 FAIL
FMC 10-14-6 D-1200µ-R2 77.6 * * >125 FAIL
0
100
200
300
400
500
600
700
800
900
1000
1100
1200
1300
1400
1500
1600
1700
1800
1900
2000
0 50
100
15
0
20
0
250
30
0
350
400
45
0
500
Sea
ling
Pre
ssur
e (p
si)
Time (sec) t0+t
FMC 10-14-06 D-1200 µ
FMC 10-14-06 D-1200 µ-R1
FMC 10-14-06 D-1200 µ-R2

178
J. I. 7. FMC 6-10-14
Figure J. 5: Pressure vs Time curve for FMC 6-10-14 on 1200-micron fracture width
Table J. 7: Mud Loss &Total Sealing Time Values for FMC 6-10-14 on 1200-micron fracture
width
Code
Mud Loss (ml) Total
Sealing
Time (sec) Stage I Stage II Stage III Total
FMC 6-10-14 D-1200µ 31.0 * * >125 FAIL
FMC 6-10-14 D-1200µ-R1 40.0 * * >125 FAIL
FMC 6-10-14 D-1200µ-R2 21.5 * * >125 FAIL
0
100
200
300
400
500
600
700
800
900
1000
1100
1200
1300
1400
1500
1600
1700
1800
1900
20000 50
100
150
20
0
25
0
30
0
35
0
40
0
450
500
550
600
65
0
70
0
75
0
80
0
85
0
900
950
1000
1050
11
00
11
50
12
00
12
50
13
00
1350
1400
1450
1500
1550
16
00
16
50
17
00
17
50
1800
1850
1900
1950
Sea
ling
Pre
ssur
e (p
si)
Time (sec) t0+t
FMC 6-10-14 D-1200 µ
FMC 6-10-14 D-1200 µ-R1
FMC 6-10-14 D-1200 µ-R2
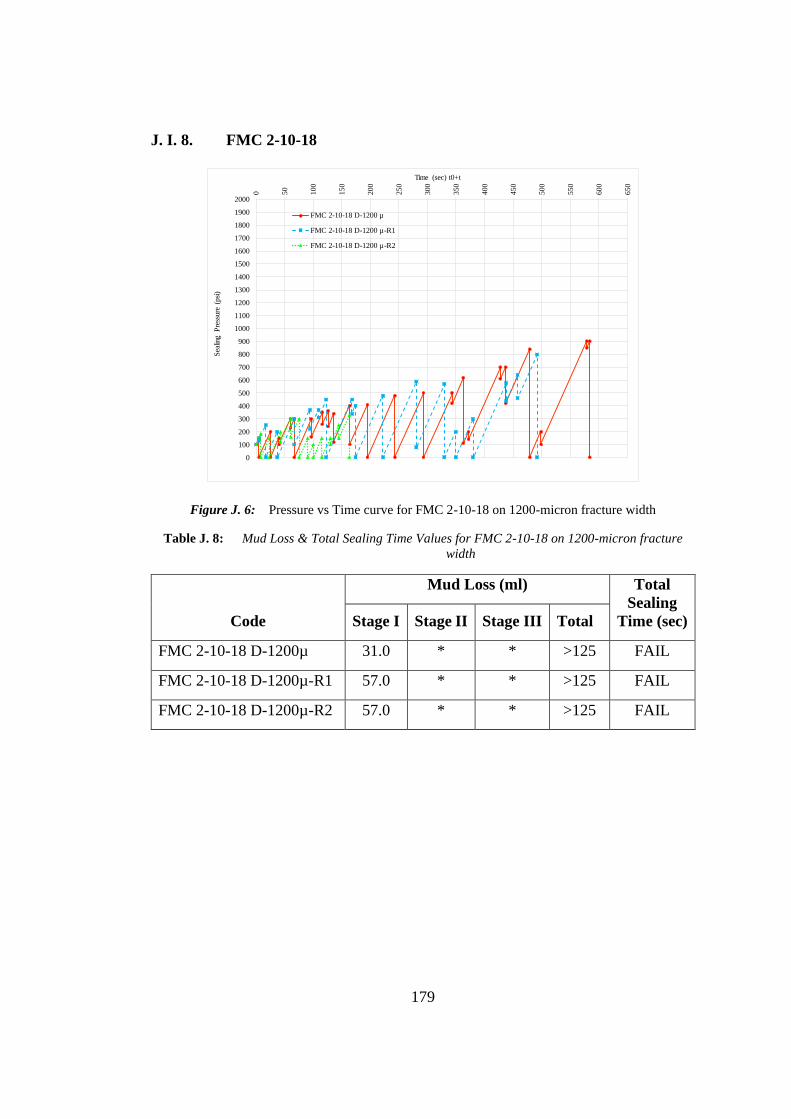
179
J. I. 8. FMC 2-10-18
Figure J. 6: Pressure vs Time curve for FMC 2-10-18 on 1200-micron fracture width
Table J. 8: Mud Loss & Total Sealing Time Values for FMC 2-10-18 on 1200-micron fracture
width
Code
Mud Loss (ml) Total
Sealing
Time (sec) Stage I Stage II Stage III Total
FMC 2-10-18 D-1200µ 31.0 * * >125 FAIL
FMC 2-10-18 D-1200µ-R1 57.0 * * >125 FAIL
FMC 2-10-18 D-1200µ-R2 57.0 * * >125 FAIL
0
100
200
300
400
500
600
700
800
900
1000
1100
1200
1300
1400
1500
1600
1700
1800
1900
2000
0 50
10
0
150
200
25
0
300
350
40
0
450
500
55
0
600
650
Sea
ling
Pre
ssur
e (p
si)
Time (sec) t0+t
FMC 2-10-18 D-1200 µ
FMC 2-10-18 D-1200 µ-R1
FMC 2-10-18 D-1200 µ-R2

180
J. I. 9. FMC 18-10-2
Table J. 9: Mud Loss &Total Sealing Time Values for FMC 18-10-2 on 1200-micron fracture
width
Code
Mud Loss (ml) Total
Sealing
Time (sec) Stage I Stage II Stage III Total
FMC 18-10-2 D-1200µ * * * >125 FAIL
FMC 18-10-2 D-1200µ-R1 * * * >125 FAIL
FMC 18-10-2 D-1200µ-R2 * * * >125 FAIL
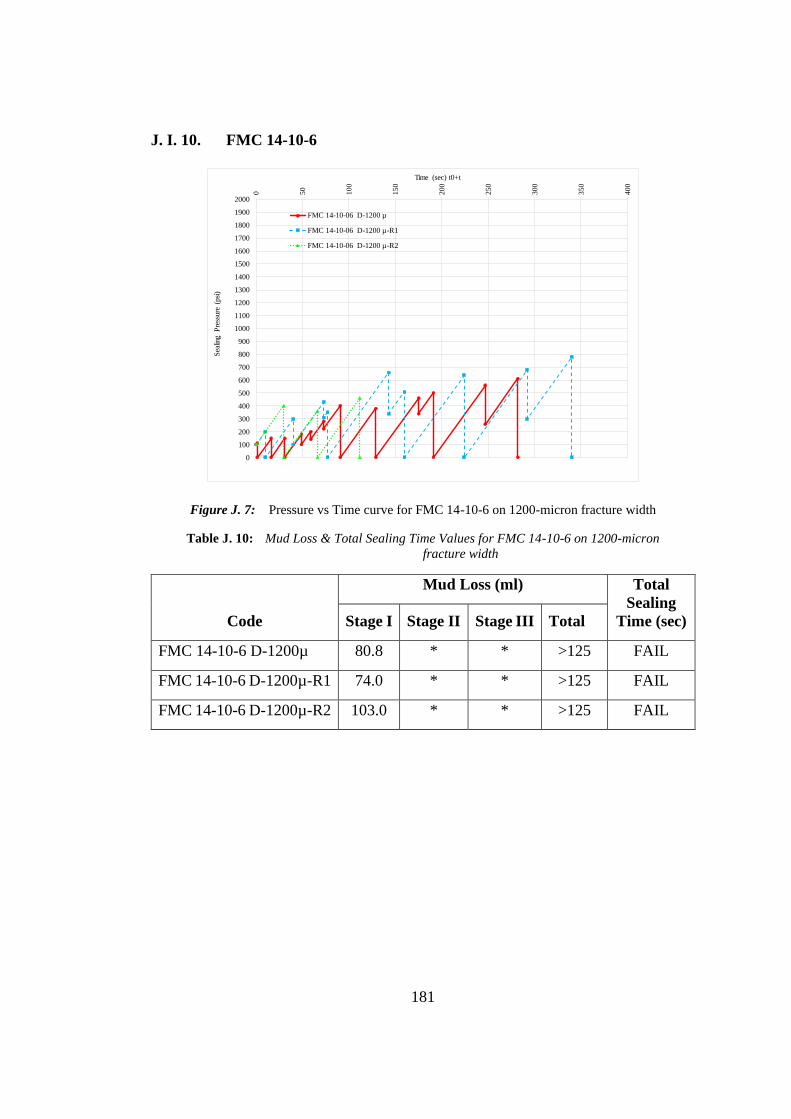
181
J. I. 10. FMC 14-10-6
Figure J. 7: Pressure vs Time curve for FMC 14-10-6 on 1200-micron fracture width
Table J. 10: Mud Loss & Total Sealing Time Values for FMC 14-10-6 on 1200-micron
fracture width
Code
Mud Loss (ml) Total
Sealing
Time (sec) Stage I Stage II Stage III Total
FMC 14-10-6 D-1200µ 80.8 * * >125 FAIL
FMC 14-10-6 D-1200µ-R1 74.0 * * >125 FAIL
FMC 14-10-6 D-1200µ-R2 103.0 * * >125 FAIL
0
100
200
300
400
500
600
700
800
900
1000
1100
1200
1300
1400
1500
1600
1700
1800
1900
2000
0 50
10
0
150
200
250
30
0
35
0
400
Sea
ling
Pre
ssur
e (p
si)
Time (sec) t0+t
FMC 14-10-06 D-1200 µ
FMC 14-10-06 D-1200 µ-R1
FMC 14-10-06 D-1200 µ-R2

182
J. I. 11. FMC 6-14-10
Figure J. 8: Pressure vs Time curve for FMC 6-14-10 on 1200-micron fracture width
Table J. 11: Mud Loss&Total Sealing Time Values for FMC 6-14-10 on 1200-micron fracture
width
Code
Mud Loss (ml) Total
Sealing
Time (sec) Stage I Stage II Stage III Total
FMC 6-14-10 D-1200µ 54.0 * * >125 FAIL
FMC 6-14-10 D-1200µ-R1 52.0 * * >125 FAIL
FMC 6-14-10 D-1200µ-R2 36.0 * * >125 FAIL
0
100
200
300
400
500
600
700
800
900
1000
1100
1200
1300
1400
1500
1600
1700
1800
1900
20000 50
100
150
200
250
300
350
40
0
45
0
50
0
55
0
60
0
65
0
70
0
75
0
80
0
85
0
900
950
1000
1050
1100
1150
1200
1250
Sea
ling
Pre
ssur
e (p
si)
Time (sec) t0+t
FMC 6-14-10 D-1200 µ
FMC 6-14-10 D-1200 µ-R1
FMC 6-14-10 D-1200 µ-R2

183
J. I. 12. FMC 2-18-10
Figure J. 9: Pressure vs Time curve for FMC 2-18-10 on 1200-micron fracture width
Table J. 12: Mud Loss &Total Sealing Time Values for FMC 2-18-10 on 1200-micron fracture
width
Code
Mud Loss (ml) Total
Sealing
Time (sec) Stage I Stage II Stage III Total
FMC 2-18-10 D-1200µ 32.0 * * >125 FAIL
FMC 2-18-10 D-1200µ-R1 56.0 * * >125 FAIL
FMC 2-18-10 D-1200µ-R2 56.0 * * >125 FAIL
0
100
200
300
400
500
600
700
800
900
1000
1100
1200
1300
1400
1500
1600
1700
1800
1900
2000
0 50
10
0
15
0
200
250
Sea
ling
Pre
ssur
e (p
si)
Time (sec) t0+t
FMC 2-18-10 D-1200 µ
FMC 2-18-10 D-1200 µ-R1
FMC 2-18-10 D-1200 µ-R2
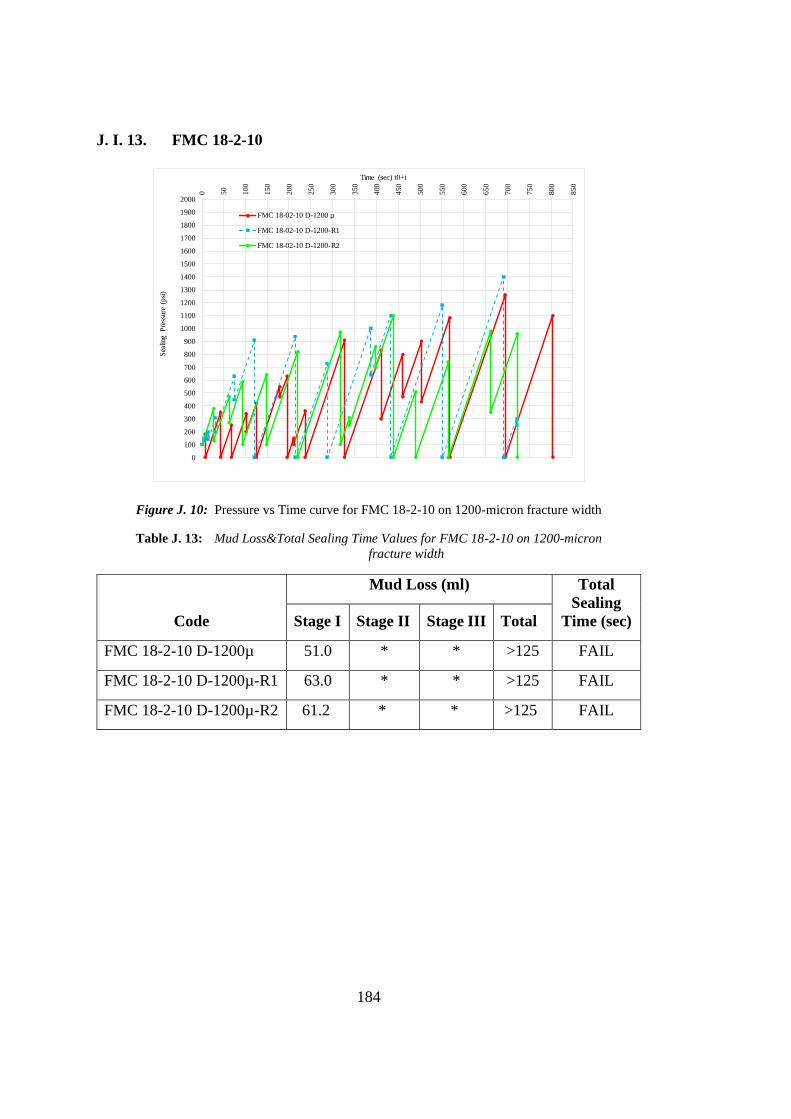
184
J. I. 13. FMC 18-2-10
Figure J. 10: Pressure vs Time curve for FMC 18-2-10 on 1200-micron fracture width
Table J. 13: Mud Loss&Total Sealing Time Values for FMC 18-2-10 on 1200-micron
fracture width
Code
Mud Loss (ml) Total
Sealing
Time (sec) Stage I Stage II Stage III Total
FMC 18-2-10 D-1200µ 51.0 * * >125 FAIL
FMC 18-2-10 D-1200µ-R1 63.0 * * >125 FAIL
FMC 18-2-10 D-1200µ-R2 61.2 * * >125 FAIL
0
100
200
300
400
500
600
700
800
900
1000
1100
1200
1300
1400
1500
1600
1700
1800
1900
20000 50
100
15
0
20
0
250
300
350
40
0
45
0
500
550
600
65
0
70
0
75
0
800
850
Sea
ling
Pre
ssur
e (p
si)
Time (sec) t0+t
FMC 18-02-10 D-1200 µ
FMC 18-02-10 D-1200-R1
FMC 18-02-10 D-1200-R2

185
J. I. 14. FMC 14-6-10
Figure J. 11: Pressure vs Time curve for FMC 14-6-10 on 1200-micron fracture width
Table J. 14: Mud Loss&Total Sealing Time Values for FMC 14-6-10 on 1200-micron fracture
width
Code
Mud Loss (ml) Total
Sealing
Time (sec) Stage I Stage II Stage III Total
FMC 14-6-10 D-1200µ 84.6 * * >125 FAIL
FMC 14-6-10 D-1200µ-R1 50.0 * * >125 FAIL
FMC 14-6-10 D-1200µ-R2 84.9 * * >125 FAIL
0
100
200
300
400
500
600
700
800
900
1000
1100
1200
1300
1400
1500
1600
1700
1800
1900
2000
0 50
10
0
150
200
25
0
30
0
350
40
0
45
0
500
55
0
60
0
650
700
75
0
800
850
90
0
950
1000
Sea
ling
Pre
ssur
e (p
si)
Time (sec) t0+t
FMC 14-06-10 D-1200 µ
FMC 14-06-10 D-1200 µ-R1
FMC 14-06-10 D-1200 µ-R2

186
J. II. Results Obtained for Total Concentration of 60 ppb for 1200-µ Slot
J. II. 1. FMC 20-4-36
Figure J. 12: Pressure vs Time curve for FMC 20-4-36 on 1200-micron fracture width
Table J. 15: Mud Loss& Total Sealing Time Values for FMC 20-4-36 on 1200-micron
fracture width
Code
Mud Loss (ml) Total
Sealing
Time (sec) Stage I Stage II Stage III Total
FMC 20-4-36 D-1200µ 20.2 * * >125 FAIL
FMC 20-4-36 D-1200µ-R1 14.0 * * >125 FAIL
FMC 20-4-36 D-1200µ-R2 13.0 * * >125 FAIL
0
100
200
300
400
500
600
700
800
900
1000
1100
1200
1300
1400
1500
1600
1700
1800
1900
2000
0 50
100
15
0200
25
0300
35
0400
45
0500
55
0600
65
0700
75
08
00
850
90
0950
10
00
1050
11
00
1150
12
00
1250
13
00
1350
14
00
1450
15
00
1550
16
00
1650
17
00
1750
1800
18
50
1900
19
50
2000
20
50
2100
21
50
2200
22
50
2300
23
50
2400
24
50
2500
Sea
ling
Pre
ssur
e (p
si)
Time (sec) t0+t
FMC 20-4-36 D-1200 µ
FMC 20-4-36 D-1200 µ-R1
FMC 20-4-36 D-1200 µ-R2

187
J. II. 2. FMC 20-12-28
Figure J. 13: Pressure vs Time curve for FMC 20-12-28 on 1200-micron fracture width
Table J. 16: Mud Loss & Total Sealing Time Values for FMC 20-12-28 on 1200-micron fracture
width
Code
Mud Loss (ml) Total
Sealing
Time (sec) Stage I Stage II Stage III Total
FMC 20-12-28 D-1200µ 16.0 * * >125 FAIL
FMC 20-12-28 D-1200µ-R1 12.0 * * >125 FAIL
FMC 20-12-28 D-1200µ-R2 14.0 * * >125 FAIL
0
100
200
300
400
500
600
700
800
900
1000
1100
1200
1300
1400
1500
1600
1700
1800
1900
2000
0 50
10
0150
200
25
03
00
350
40
04
50
500
550
60
0650
700
75
08
00
850
90
09
50
1000
1050
11
00
1150
1200
12
50
13
00
1350
14
00
14
50
1500
1550
16
00
1650
1700
17
50
18
00
1850
19
00
19
50
2000
2050
21
00
2150
2200
22
50
23
00
2350
24
00
24
50
2500
2550
26
00
2650
2700
Sea
ling
Pre
ssur
e (p
si)
Time (sec) t0+t
FMC 20-12-28 D-1200 µ
FMC 20-12-28 D-1200 µ-R1
FMC 20-12-28 D-1200 µ-R2

188
J. II. 3. FMC 15-15-30
Figure J. 14: Pressure vs Time curve for FMC 15-15-30 on 1200-micron fracture width
Table J. 17: Mud Loss & Total Sealing Time Values for FMC 15-15-30 on 1200-micron fracture
width
Code
Mud Loss (ml) Total
Sealing
Time (sec) Stage I Stage II Stage III Total
FMC 15-15-30 D-1200µ 15.6 * * >125 FAIL
0
100
200
300
400
500
600
700
800
900
1000
1100
1200
1300
1400
1500
1600
1700
1800
1900
20000 50
10
01
50
20
02
50
30
03
50
40
04
50
50
0550
600
650
700
750
800
850
900
950
10
00
10
50
11
00
11
50
12
00
12
50
13
00
13
50
14
00
1450
1500
1550
1600
1650
1700
1750
1800
1850
19
00
19
50
20
00
20
50
21
00
21
50
22
00
22
50
23
00
2350
2400
2450
Sea
ling
Pre
ssur
e (p
si)
Time (sec) t0+t
FMC 15-15-30 D-1200 µ

189
J. II. 4. FMC 10-10-40
Figure J. 15: Pressure vs Time curve for FMC 10-10-40 on 1200-micron fracture width
Table J. 18: Mud Loss & Total Sealing Time Values for FMC 10-10-40 on 1200-micron fracture
width
Code
Mud Loss (ml) Total
Sealing
Time (sec) Stage I Stage II Stage III Total
FMC 10-10-40 D-1200µ 13.0 * * >125 FAIL
0
100
200
300
400
500
600
700
800
900
1000
1100
1200
1300
1400
1500
1600
1700
1800
1900
2000
0 50
10
01
50
20
02
50
30
03
50
40
04
50
50
0550
600
650
700
750
800
850
900
950
10
00
10
50
11
00
11
50
12
00
12
50
13
00
13
50
14
00
1450
1500
1550
1600
1650
1700
1750
1800
1850
19
00
19
50
20
00
20
50
21
00
21
50
22
00
22
50
23
00
2350
2400
2450
Sea
ling
Pre
ssur
e (p
si)
Time (sec) t0+t
FMC 10-10-40 D-1200 µ

190
J. II. 5. FMC 25-5-30
Figure J. 16: Pressure vs Time curve for FMC 25-5-30 on 1200-micron fracture width
Table J. 19: Mud Loss &Total Sealing Time Values for FMC 25-5-30 on1200-micron
fracture width
Code
Mud Loss (ml) Total
Sealing
Time (sec) Stage I Stage II Stage III Total
FMC 25-5-30 D-1200µ 10.8 * * >125 FAIL
0
100
200
300
400
500
600
700
800
900
1000
1100
1200
1300
1400
1500
1600
1700
1800
1900
20000 50
10
01
50
20
02
50
30
03
50
40
04
50
50
0550
600
650
700
750
800
850
900
950
10
00
10
50
11
00
11
50
12
00
12
50
13
00
13
50
14
00
1450
1500
1550
1600
1650
1700
1750
1800
1850
19
00
19
50
20
00
20
50
21
00
21
50
22
00
22
50
23
00
2350
2400
2450
Sea
ling
Pre
ssur
e (p
si)
Time (sec) t0+t
FMC 25-5-30 D-1200 µ

191
LCP Applications
J. III. Results Obtained for Total Concentration of 90 ppb for 1200-µ Slot
J. III. 1. FMC 15-30-45
Figure J. 17: Pressure vs Time curve for FMC 15-30-45 on 800-micron fracture width
Table J. 20: Mud Loss & Total Sealing Time Values for FMC 15-30-45 on 1200-micron
fracture width
Code
Mud Loss (ml) Total
Sealing
Time (sec) Stage I Stage II Stage III Total
FMC 15-30-45 D-1200µ 14.0 103.2 1.2 118.4 2996.0
FMC 15-30-45 D-1200µ-R1 11.3 101.7 1.2 114.2 3116.0
0
100
200
300
400
500
600
700
800
900
1000
1100
1200
1300
1400
1500
1600
1700
1800
1900
2000
0 10
0
200
300
40
0
500
600
70
0
800
900
10
00
11
00
1200
13
00
14
00
1500
16
00
17
00
1800
19
00
20
00
2100
22
00
23
00
2400
25
00
26
00
2700
28
00
29
00
3000
3100
32
00
3300
Sea
ling
Pre
ssur
e (p
si)
Time (sec) t0+t
FMC 15-30-45 D-1200 µ
FMC 15-30-45 D-1200 µ-R1
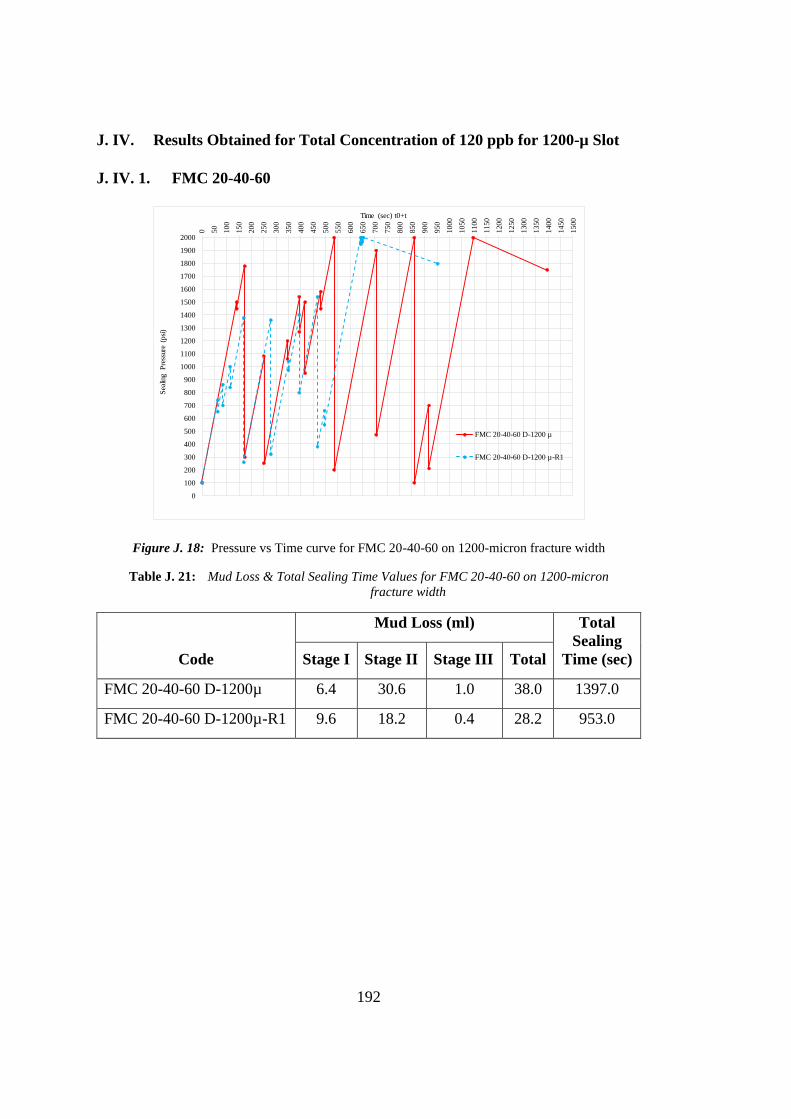
192
J. IV. Results Obtained for Total Concentration of 120 ppb for 1200-µ Slot
J. IV. 1. FMC 20-40-60
Figure J. 18: Pressure vs Time curve for FMC 20-40-60 on 1200-micron fracture width
Table J. 21: Mud Loss & Total Sealing Time Values for FMC 20-40-60 on 1200-micron
fracture width
Code
Mud Loss (ml) Total
Sealing
Time (sec) Stage I Stage II Stage III Total
FMC 20-40-60 D-1200µ 6.4 30.6 1.0 38.0 1397.0
FMC 20-40-60 D-1200µ-R1 9.6 18.2 0.4 28.2 953.0
0
100
200
300
400
500
600
700
800
900
1000
1100
1200
1300
1400
1500
1600
1700
1800
1900
2000
0 50
100
15
0
200
25
0
300
35
0
400
45
0
50
0
550
60
0
650
70
0
750
80
0
850
90
0
950
10
00
1050
1100
11
50
1200
12
50
1300
13
50
1400
14
50
1500
Sea
ling
Pre
ssur
e (p
si)
Time (sec) t0+t
FMC 20-40-60 D-1200 µ
FMC 20-40-60 D-1200 µ-R1

193
J. V. Results Obtained for Total Concentration of 150 ppb for 1200-µ Slot
J. V. 1. FMC 25-50-75
Figure J. 19: Pressure vs Time curve for FMC 25-50-75 on 800-micron fracture width
Table J. 22: Mud Loss & Total Sealing Time Values for FMC 25-50-75 on 1200-micron
fracture width
Code
Mud Loss (ml) Total
Sealing
Time (sec) Stage I Stage II Stage III Total
FMC 25-50-75 D-1200µ 4.2 14.8 0.8 19.8 858.0
0
100
200
300
400
500
600
700
800
900
1000
1100
1200
1300
1400
1500
1600
1700
1800
1900
2000
0 10
0
200
30
0
40
0
500
60
0
700
800
90
0
1000
Sea
ling
Pre
ssur
e (p
si)
Time (sec) t0+t
FMC 25-50-75 D-1200 µ

194
K. Effect of Concentration of Ground Marble on Sealing 1200-µ Fracture
K. I. 1. FMC 16-16-16
Figure K. 1: Pressure vs Time curve for FMC 16-16-16on 1200-micron fracture width
Table K. 1: Mud Loss & Total Sealing Time Values for FMC 16-16-16 on 1200-micron
fracture width
Code
Mud Loss (ml) Total
Sealing
Time (sec) Stage I Stage II Stage III Total
FMC 16-16-16 D-1200µ 20.6 * * >125 FAIL
FMC 16-16-16 D-1200µ-R1 29.1 * * >125 FAIL
FMC 16-16-16 D-1200µ-R2 21.0 * * >125 FAIL
0
100
200
300
400
500
600
700
800
900
1000
1100
1200
1300
1400
1500
1600
1700
1800
1900
2000
0 100
20
0
30
0
40
0
500
600
70
0
80
0
90
0
1000
1100
12
00
13
00
14
00
1500
1600
17
00
18
00
19
00
2000
2100
Sea
ling
Pre
ssur
e (p
si)
Time (sec) t0+t
FMC 16-16-16 D-1200 µ
FMC 16-16-16 D-1200 µ-R1
FMC 16-16-16 D-1200 µ-R2

195
K. I. 2. FMC 20-20-20
Figure K. 2: Pressure vs Time curve for FMC 20-20-20 on 1200-micron fracture width
Table K. 2: Mud Loss & Total Sealing Time Values for FMC 20-20-20 on 1200-micron
fracture width
Code
Mud Loss (ml) Total
Sealing
Time (sec) Stage I Stage II Stage III Total
FMC 20-20-20 D-1200µ 16.0 * * >125 FAIL
FMC 20-20-20 D-1200µ-R1 28.0 * * >125 FAIL
FMC 20-20-20 D-1200µ-R2 14.0 * * >125 FAIL
0
100
200
300
400
500
600
700
800
900
1000
1100
1200
1300
1400
1500
1600
1700
1800
1900
2000
0 100
200
300
400
500
600
700
800
900
1000
1100
1200
1300
1400
1500
1600
1700
1800
1900
2000
2100
2200
Sea
ling
Pre
ssur
e (p
si)
Time (sec) t0+t
FMC 20-20-20 D-1200 µ
FMC 20-20-20 D-1200 µ-R1
FMC 20-20-20 D-1200 µ-R2