aade-15-ntce-34 fracture-based wellbore strengthening
TRANSCRIPT

Copyright 2015, AADE This paper was prepared for presentation at the 2015 AADE National Technical Conference and Exhibition held at the Henry B. Gonzalez Convention Center, San Antonio, Texas, April 8-9, 2015. This conference was sponsored by the American Association of Drilling Engineers. The information presented in this paper does not reflect any position, claim or endorsement made or implied by the American Association of Drilling Engineers, their officers or members. Questions concerning the content of this paper should be directed to the individual(s) listed as author(s) of this work.
Abstract
Wellbore strengthening techniques can be effectively
utilized to reduce mud loss by increasing the safe mud weight
window in depleted sections. Although the underlying
mechanisms for wellbore strengthening are still a subject of
research, several field applications show successful
implementation of this technique in depleted zones.
For conventional drilling purposes, strengthening is
achieved via drilling fluid and the particulate system (Lost
Circulation Material-LCM) within. In other applications, such
as casing while drilling, mechanical contact of pipe with the
wellbore also helps the strengthening performance. This
contact can build a layer of low permeability material on
wellbore wall (external mud cake), create a non-porous layer
of rock (internal mud cake), induce thermal/compressive
stresses and smear particles into induced fractures to
effectively isolate the fracture tip and inhibiting further
propagation.
Most analytical industry standard strengthening design
tools are decoupled from near-wellbore stress and stability
analysis. For example, these models ignore the effect of near
wellbore stress perturbations due to a combination of wellbore
deviation, stress anisotropy, temperature variations, mud-cake
and pore pressure changes. The aim of this study is to propose
a fast-running integrated geomechanical tool based on
analytical models to analyze near-wellbore stresses, stability
and strengthening. Utilizing a fully analytical workflow
coupled with stress concentration around the wellbore;
fracture width distribution and fracture re-initiation pressure
(FRIP) after plugging can be modeled. Proposed modeling
technique allows us to quantify degree of strengthening and
identify conditions where near wellbore region experiences
stable vs. unstable fracture growth. The applicability of the
integrated tool for drilling depleted zones is shown using
different examples.
Introduction
One of the major problems encountered during drilling
operations in challenging wells, such as deep-water depleted
reservoirs, is lost circulation. Unstable fracture propagation
can cause extensive loss of drilling fluids. Several methods
can be utilized to mitigate fracture initiation and propagation.
For example, Casing while Drilling (CwD) technology is
being used to successfully drill through the depleted zones
with lowest possible fluid loss rate while the wellbore
strengthens. For an effective wellbore strengthening operation,
induced fracture characteristics, (such as width, stable length,
FRIP), need to be predicted under in-situ stress conditions.
This ensures an accurate determination of the required Lost
Circulation Material (LCM) size and type as they plug the
induced fractures. Plugged fractures not only prevent
excessive fluid loss into the formation but also inhibit further
fracture propagation as the fracture re-initiation pressure
(FRIP) increases and wellbore strengthens.
Current industry standard analytical models for wellbore
strengthening design in general ignore near wellbore stress
perturbations (i.e. due to a combination of wellbore deviation
and far field stress anisotropy). This is an oversimplification
of the real process and can lead to an inaccurate strengthening
design. In addition, most strengthening models assume a fix
stable fracture length for strengthening calculations (Alberty
and McLean, 2004, Guo et al. 2011) which might lead to an
inaccurate estimation of the wellbore strength and FRIP.
A detailed review of available literature provides several
examples for current wellbore strengthening techniques
utilized in the field. Most of these techniques focus/rely on
induced-fracture(s) created around the wellbore and
emphasize “Fracture-Based Strengthening” techniques. For
example, Alberty and McLean (2004) introduced the concept
of stress cage by explaining hoop stress augmentation around
the wellbore due to propped and plugged induced-fractures.
According to Alberty and McLean (2004), the increase in
hoop-stress around the wellbore mitigates new fracture
initiation and might help with wellbore strengthening. The
proposed model does not allow re-initiation from the
existing/plugged fracture tip (i.e. assumes that new fractures
will initiate from other locations/flaws around the wellbore).
Other researchers (Morita 1990, Fuh 1992, Fuh 2007, Van
Oort et al. 2011) investigated existing induced-fracture
stability by fracture tip isolation. In this approach, also known
as “fracture tip screen-out” or “Fracture Propagation
Resistance”, further fracture propagation can be eliminated by
AADE-15-NTCE-34
Fracture-Based Wellbore Strengthening Design and Application:
An Analytical Approach
Mojtaba P. Shahri, Reza Safari and Uno Mutlu, Weatherford;
Reza Majidi, BP

2 M. P. Shahri, R. Safari, U, Mutlu and R. Majidi AADE-15-NTCE-34
isolating the area close to the fracture tip. In addition, Dupriest
(2005) proposed another theory for wellbore strengthening
technique and based on “Fracture Closure Stress”. In this
approach, integrity can be built by increasing fracture opening
to get sufficient closure stress above wellbore ECD.
According to Dupriest (2005), this could be achieved by
creating an immobile mass inside the fracture. For example,
for low permeability reservoirs, hesitation squeeze can be
applied to create layers of LCM and widen the fracture.
Several numerical models have also been proposed to simulate
strengthening mechanisms (Alberty and McLean, 2004, Wang
et al. 2007 and 2009, Guo et al. 2011). However, these models
are computationally extensive.
Although different theories have been proposed in the past,
there is still a need for a comprehensive model that can
quantify degree of strengthening under a variety of stress and
wellbore conditions. The aim of this study is to utilize an
advanced analytical model for simulating near-wellbore
fracture propagation and strengthening phenomena.
Our analytical engine (i.e., poro-thermo-elastic) is
embedded within a wellbore stress, stability, strengthening and
loss circulation mitigation workflow. The overall workflow is
illustrated in Figure (1).
Figure 1: Integrated Workflow
We first calculate formation breakdown pressure and
identify scenarios (along a pre-defined wellbore trajectory or
among multiple wellbore trajectories) where risk of loss
circulation (through induced fractures) is relatively high/low.
Risk analysis is followed by Fracture Trace Angle (FTA) and
Fracture Stability calculations. FTA analysis provides
information on (i) fracture plane deviation(s) w.r.t. the
wellbore axis and (ii) coalescence potential of near wellbore
fractures. Stability calculations determine the “stable” fracture
length, for a given wellbore pressure, formation properties and
fluid/plug characteristics, which then feeds into the fracture
width calculations. Note that if the analysis indicates that there
is risk of unstable fracture propagation: wellbore pressure,
fluid/plug characteristics and/or wellbore trajectory is
modified to stabilize fractures. Calculated fracture width
distribution (along the stable fracture length) provides an
important data point for LCM particle size design. Once the
fracture is plugged with the optimized LCM, Fracture Re-
initiation Pressure (FRIP) analysis can be calculated to
quantify the amount of wellbore strengthening and adjust mud
weight.
The strengthening model presented in this paper is an
improvement over industry standard analytical models. In this
model, fracture characteristics are investigated under the effect
of near wellbore perturbed stress field. Accordingly, key
parameters affecting near wellbore stresses, such as wellbore
trajectory, in-situ stress anisotropy, stable-unstable
propagation regime(s) are taken into account and their
effect(s) on fracture based strengthening can be quantified.
The applicability of the proposed model in wellbore
strengthening design during drilling depleted reservoirs is
demonstrated using a typical field data of depleted reservoirs.
Proposed analytical model provides a suitable tool for
designing Lost Circulation Materials (LCM) at a reduced
computational cost and improved accuracy as compared to
other numerical methods.
Mathematical Model
Shahri et al. (2014) proposed a fast-running semi-analytical
model for wellbore strengthening design in depleted
reservoirs. Kolossoff and Muskhelishvili complex functions of
the plane-strain theory (Muskhelishvili 1953) have been
combined with the near-wellbore stress distribution to find
induced-fracture width distribution and fracture tip stress
intensity factor. Utilizing superposition principle, effect of
perturbed stress zone around the wellbore on the induced-
fracture characteristics can be quantified more accurately
using this model. Wellbore strengthening can be achieved by
plugging the induced-fracture, mitigate further fracture
propagation and increase FRIP. Accordingly, LCM particle
size distribution need to be designed based on fracture opening
under near-wellbore stress condition. Upon plugging, amount
of wellbore strengthening can be quantified by calculating the
stress intensity factor at the tip against fracture toughness
under different wellbore pressure. Induced-fractures (and
based on plug efficiency) start propagating once (if) the stress
intensity factor at the tip reaches the fracture toughness. If the
stress state and wellbore pressure dictate that unstable
propagation will occur, induced fractures propagate greater
lengths into the reservoir with significant fluid losses into the
formation. Otherwise, and if stable propagation occur, induced
fractures are arrested near wellbore region. Stress intensity
factor calculations can be utilized to determine the transition
between stable and unstable propagation. This helps going
beyond some of the misconceptions (6 inch constant fracture
length) as utilized in some of the industry standard wellbore
strengthening calculations. These outputs are discussed using
different examples in the following section. Based on the
semi-analytical model, fracture width distribution and stress

AADE-15-NTCE-34 Fracture-Based Wellbore Strengthening Design and Application: An Analytical Approach 3
intensity factor at the tip can be calculated as follows: (Shahri
et al. 2014)
���� � ��� � �2�
4�1 � ���� ������
�
��� (1)
�� � �2��� � � 12����1��������� �1 � ��1 � ���
���
��� (2)
Utilizing superposition principle, effect of near wellbore
stress perturbation around the wellbore and its effect on the
induced-fracture characteristics can also be quantified. Shahri
et al. (2014) explained the formulation for vertical wellbore,
wherein the normal stress component on the fracture surface
corresponds to the tangential (hoop) stress, as shown in Eqn.
(3). This condition can be generalized by replacing the
tangential stress with the normal stress component along the
fracture surface and for different wellbore trajectories. As an
example, for a deviated wellbore, stress field can be resolved
based on far-field stress components and wellbore trajectory to
find the normal stress component along the fracture surface.
Accordingly, we can replace the near-wellbore stress
distribution (derived based on classical Kirsch solution for a
deviated wellbore) as normal stress component along the
fracture surface in the following equation:
σ!!�"� � #$ � #%2 &1 � 3("( ) �
#% � #$2 &1 � �"�) � *+ �
"�� *,�"�
(3)
It is important to note that one of the assumptions used to
develop the proposed analytical model is in-plane
development of fractures (i.e. plane-strain assumption, where
induced fractures are assumed to propagate parallel to the
wellbore axis). This assumption works very well for vertical
wells. However, for a deviated wellbore, fractures might
initiate and propagate at an angle with respect to the borehole
axis, known as Fracture Trace Angle (FTA). This is primarily
due to the rotation of principle stresses caused by the shear
stress component acting on the deviated wellbore wall. This is
shown in Figure (2). Depending on key parameters; e.g., stress
state, wellbore trajectory and pore pressure, FTA could
deviate (i.e. by a few degrees to tens of degrees) from the in-
plane assumption. In order to check the validity of this
assumption for depleted zones, we investigate several
scenarios and show the effect of depletion on the resulting
FTA. In general, depletion (i.e. a reduction in pore pressure)
reduces FTA and relaxes the constraint on the plane strain
assumption for deviated wells.
Figure 2: Stress Perturbation around Deviated Wellbore
Along these lines, we extend the classical Kirsch solution
to calculate stress perturbation/distribution around the
wellbore for deviated wells and as published by Fjar et al.
(2008). FTA is then calculated under different stress regimes
and wellbore trajectories as explained by Peska and Zoback
(1995). Table (1) shows the input stress and pore pressure data
used to determine FTA under different conditions. These input
data can be considered as typical values for different stress
regimes under normal pore pressure. Table 1: Different Stress Regimes Input Data
#- (SG) #$ (SG) #% (SG) *. (SG)
Normal Faulting 1 0.9 0.8 0.5
Strike-Slip Faulting 1 1.2 0.7 0.5
Reverse Faulting 1 1.3 1.1 0.5
FTA(s) for different wellbore trajectories and stress regime;
i.e., normal, strike-slip and reverse faulting, and under normal
pore pressure condition are shown in Figures (3), (5) and (7),
respectively.
Figure 3: Normal Faulting Regime, Normal Pore Pressure

4 M. P. Shahri, R. Safari, U, Mutlu and R. Majidi AADE-15-NTCE-34
Figure 4: Normal Faulting Regime, Depleted Reservoir
Figure 5: Strike-Slip Faulting Regime, Normal Pore Pressure
Figure 6: Strike-Slip Faulting Regime, Depleted Reservoir
Figure 7: Reverse Faulting Regime, Normal Pore Pressure
Figure 8: Reverse Faulting Regime, Depleted Reservoir
In order to show the effect of depletion on FTA, pore
pressure is reduced from 0.5 SG to 0.2 SG. FTA(s) for
different stress regime; i.e., normal, strike-slip and reverse
faulting, and depleted pore pressure condition is shown in
Figures (4), (6) and (8), respectively. According to the results,
depletion reduces the deviation from plane-strain assumption
where FTA starts aligning with the wellbore as induced-
fractures initiate in a plane parallel to the wellbore axis. For
example, maximum FTA under specified strike-slip faulting
regime is equal to about 70 degree under normal pore pressure
condition as shown in Figure (5). In this case, pore pressure
depletion causes the reduction in FTA up to 35 degree (see
Figure (6)). Similarly, the same effect reduces maximum FTA
under normal faulting regime from about 27 to 15 degree,
further aligning FTA with wellbore axis. Note that as FTA
reduces, fractures (Figure (2), in red) tend to coalesce as they
propagate. This phenomenon forces multiple fractures to
coalesce into a single fracture and align along the wellbore
axis. (Aadony and Looyeh 2000)
Therefore, although the plane-strain assumption “for
deviated well fracture(s)” is a simplification, dictated by the
limitations of the analytical model, for depleted reservoirs (i.e.
the focus of this paper) this constraint can be relaxed by FTA
analysis.
AADE-15-NTCE-34 Fracture-Based Wellbore Strengthening Design and Application: An Analytical Approach 5
Fracture-Based Strengthening
The aim of this study is to apply the analytical model on a
typical input data set from Gulf of Mexico depleted reservoir
and quantify the degree of strengthening for a variety of
geologically plausible scenarios. Input data, shown in Table
(2), are used to simulate the characteristic of induced-fractures
and to quantify the strengthening after plugging under
different conditions. In this section we will not go through the
entire workflow steps as illustrated in Figure (1), but rather
focus on fracture width, stable length and FRIP calculations.
Table 2: Typical Input Data – Gulf of Mexico
Attribute Value Attribute Value
TVD (ft) 16590 KIc (psi.in0.5
) 500
Hole Size (in) 12.25 E (psi) 1.6 E+6 φ (Degree) 17 v 0.2 P12 (ppg) 10.8 ECD (ppg) 12.4 P13�ppg� 10 Perm (mD) 700-900 σ6 (ppg) 14.2 ∅(%) 20-25 σ8(ppg) 11.7 FPC 70%
Eqns. (1) and (2) can be used to determine fracture opening
and stress intensity factor at the tip under different stress
conditions. To do so, normal stress component along the
fracture surface should be determined corresponding to
wellbore trajectory and in-situ stress condition. Four different
scenarios are assumed in this example corresponding to
isotropic stress state, and 5%, 15% and 25% in-situ stress
anisotropy (i.e. we vary σ9 while keeping σ8 constant to
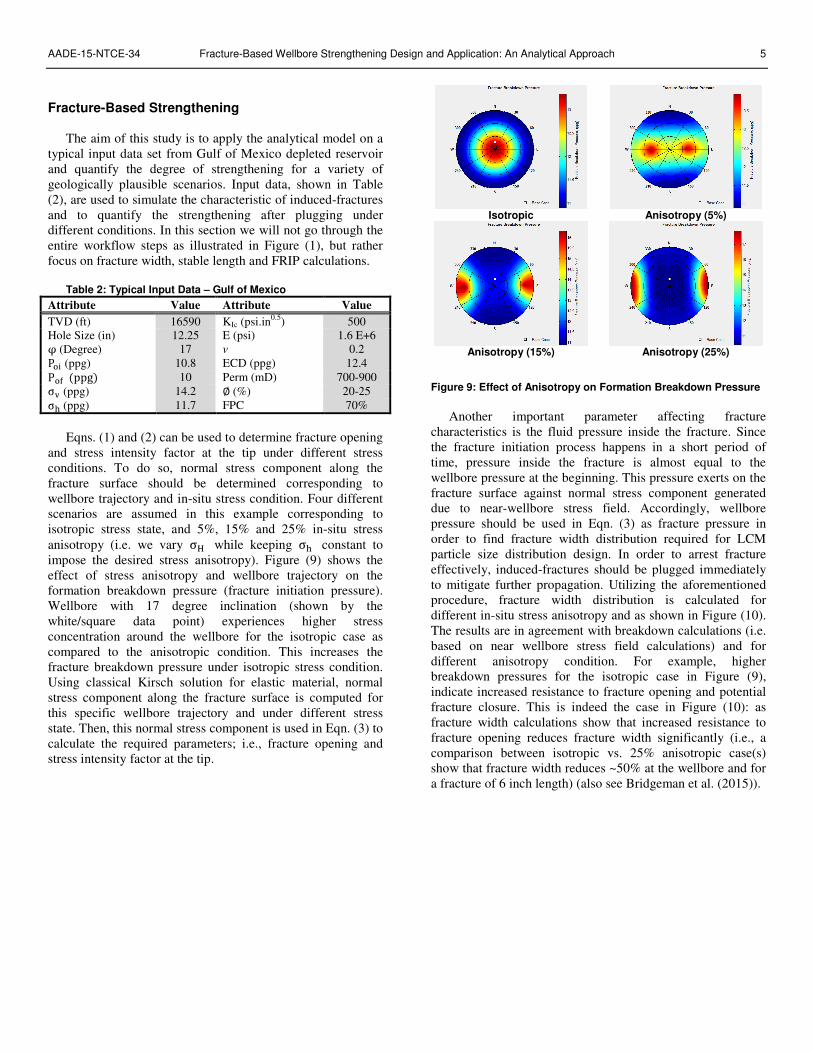
impose the desired stress anisotropy). Figure (9) shows the
effect of stress anisotropy and wellbore trajectory on the
formation breakdown pressure (fracture initiation pressure).
Wellbore with 17 degree inclination (shown by the
white/square data point) experiences higher stress
concentration around the wellbore for the isotropic case as
compared to the anisotropic condition. This increases the
fracture breakdown pressure under isotropic stress condition.
Using classical Kirsch solution for elastic material, normal
stress component along the fracture surface is computed for
this specific wellbore trajectory and under different stress
state. Then, this normal stress component is used in Eqn. (3) to
calculate the required parameters; i.e., fracture opening and
stress intensity factor at the tip.
Isotropic
Anisotropy (5%)
Anisotropy (15%)
Anisotropy (25%)
Figure 9: Effect of Anisotropy on Formation Breakdown Pressure
Another important parameter affecting fracture
characteristics is the fluid pressure inside the fracture. Since
the fracture initiation process happens in a short period of
time, pressure inside the fracture is almost equal to the
wellbore pressure at the beginning. This pressure exerts on the
fracture surface against normal stress component generated
due to near-wellbore stress field. Accordingly, wellbore
pressure should be used in Eqn. (3) as fracture pressure in
order to find fracture width distribution required for LCM
particle size distribution design. In order to arrest fracture
effectively, induced-fractures should be plugged immediately
to mitigate further propagation. Utilizing the aforementioned
procedure, fracture width distribution is calculated for
different in-situ stress anisotropy and as shown in Figure (10).
The results are in agreement with breakdown calculations (i.e.
based on near wellbore stress field calculations) and for
different anisotropy condition. For example, higher
breakdown pressures for the isotropic case in Figure (9),
indicate increased resistance to fracture opening and potential
fracture closure. This is indeed the case in Figure (10): as
fracture width calculations show that increased resistance to
fracture opening reduces fracture width significantly (i.e., a
comparison between isotropic vs. 25% anisotropic case(s)
show that fracture width reduces ~50% at the wellbore and for
a fracture of 6 inch length) (also see Bridgeman et al. (2015)).

6 M. P. Shahri, R. Safari, U, Mutlu and R. Majidi AADE-15-NTCE-34
Figure 10: Effect of Stress Anisotropy on Fracture Opening (wellbore is located at 6.125 inches, analysis take into account near wellbore perturbed stress field)
Two other important parameters which need to be
quantified for a successful fracture-based wellbore
strengthening design are: (i) stable fracture length and (ii)
FRIP after fracture plugging. Eqn. (2) can be used to
determine stress intensity factor under near-wellbore stress
perturbation. If the calculated stress intensity factor is less
than fracture toughness, fracture remains stable without
further propagation and fracture length can be quantified. On
the other hand, higher stress intensity factor (driven by higher
pressure inside the fracture) results in unstable fracture
growth. If the fracture plug efficiency is relatively low,
pressure inside the fracture would be equal to the wellbore
pressure which in turn causes unstable fracture growth for a
depleted zone. Plug efficiency depends on several factors such
as formation permeability and porosity, fluid rheological
properties, efficiency of plug, etc. Along these lines, fracture
Pressure Coefficient, (FPC), is defined that relates pressure
inside the plug region to the wellbore and pore pressures as
follows:
*, � *+ � �*:�*+ � *.� (4)
If FPC is equal to 1, pressure inside the plug region is
completely cut-off from the wellbore pressure and can diffuse
out to the formation pore pressure. On the other hand, for the
case of FPC equals to 0, the combination of low permeability
formation and low plug efficiency (i.e., direct communication
with wellbore pressure) causes the fracture pressure to be
equal to wellbore pressure. The step-wise function can be
defined to simulate different plug configurations; i.e., near-tip,
middle of fracture, whole fracture, as shown in Figure (11).
(a)
(b)
(c)
Figure 11: Fracture Plugging; (a) near tip (b) middle of fracture (c) whole fracture
AADE-15-NTCE-34 Fracture-Based Wellbore Strengthening Design and Application: An Analytical Approach 7
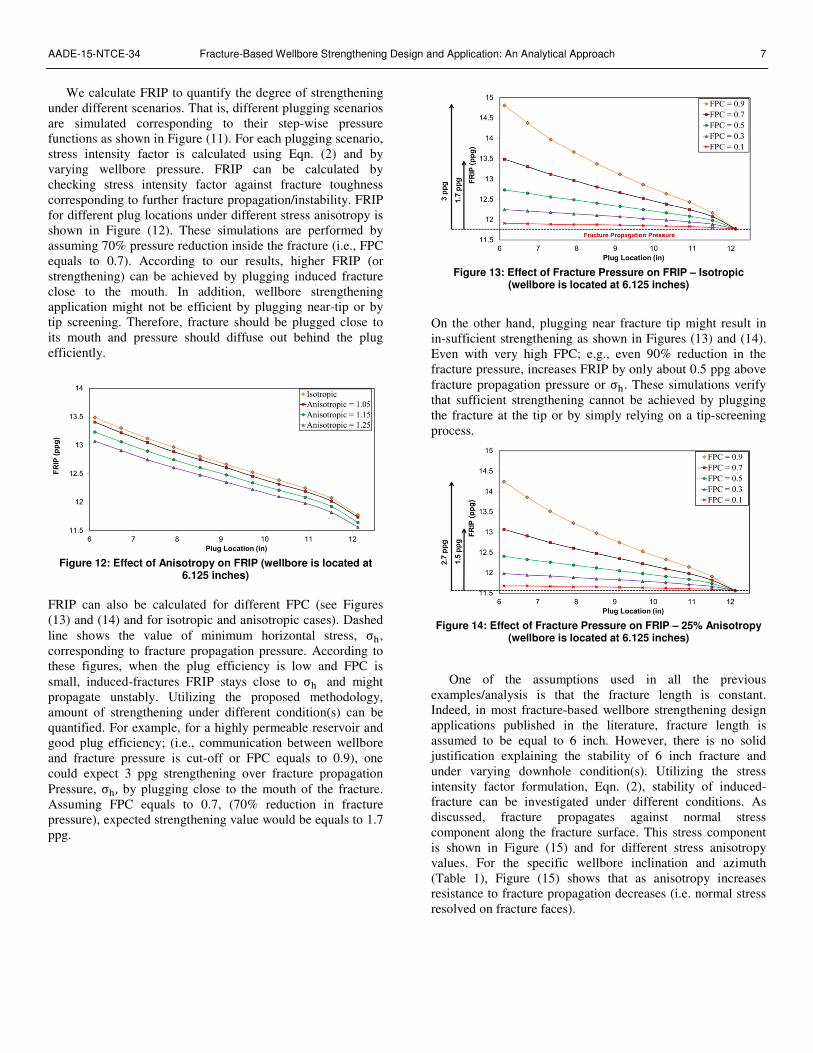
We calculate FRIP to quantify the degree of strengthening
under different scenarios. That is, different plugging scenarios
are simulated corresponding to their step-wise pressure
functions as shown in Figure (11). For each plugging scenario,
stress intensity factor is calculated using Eqn. (2) and by
varying wellbore pressure. FRIP can be calculated by
checking stress intensity factor against fracture toughness
corresponding to further fracture propagation/instability. FRIP
for different plug locations under different stress anisotropy is
shown in Figure (12). These simulations are performed by
assuming 70% pressure reduction inside the fracture (i.e., FPC
equals to 0.7). According to our results, higher FRIP (or
strengthening) can be achieved by plugging induced fracture
close to the mouth. In addition, wellbore strengthening
application might not be efficient by plugging near-tip or by
tip screening. Therefore, fracture should be plugged close to
its mouth and pressure should diffuse out behind the plug
efficiently.
Figure 12: Effect of Anisotropy on FRIP (wellbore is located at
6.125 inches)
FRIP can also be calculated for different FPC (see Figures
(13) and (14) and for isotropic and anisotropic cases). Dashed
line shows the value of minimum horizontal stress, σ8,
corresponding to fracture propagation pressure. According to
these figures, when the plug efficiency is low and FPC is
small, induced-fractures FRIP stays close to σ8 and might
propagate unstably. Utilizing the proposed methodology,
amount of strengthening under different condition(s) can be
quantified. For example, for a highly permeable reservoir and
good plug efficiency; (i.e., communication between wellbore
and fracture pressure is cut-off or FPC equals to 0.9), one
could expect 3 ppg strengthening over fracture propagation
Pressure, σ8, by plugging close to the mouth of the fracture.
Assuming FPC equals to 0.7, (70% reduction in fracture
pressure), expected strengthening value would be equals to 1.7
ppg.
Figure 13: Effect of Fracture Pressure on FRIP – Isotropic (wellbore is located at 6.125 inches)
On the other hand, plugging near fracture tip might result in
in-sufficient strengthening as shown in Figures (13) and (14).
Even with very high FPC; e.g., even 90% reduction in the
fracture pressure, increases FRIP by only about 0.5 ppg above
fracture propagation pressure or σ8. These simulations verify
that sufficient strengthening cannot be achieved by plugging
the fracture at the tip or by simply relying on a tip-screening
process.
Figure 14: Effect of Fracture Pressure on FRIP – 25% Anisotropy
(wellbore is located at 6.125 inches)
One of the assumptions used in all the previous
examples/analysis is that the fracture length is constant.
Indeed, in most fracture-based wellbore strengthening design
applications published in the literature, fracture length is
assumed to be equal to 6 inch. However, there is no solid
justification explaining the stability of 6 inch fracture and
under varying downhole condition(s). Utilizing the stress
intensity factor formulation, Eqn. (2), stability of induced-
fracture can be investigated under different conditions. As
discussed, fracture propagates against normal stress
component along the fracture surface. This stress component
is shown in Figure (15) and for different stress anisotropy
values. For the specific wellbore inclination and azimuth
(Table 1), Figure (15) shows that as anisotropy increases
resistance to fracture propagation decreases (i.e. normal stress
resolved on fracture faces).

8 M. P. Shahri, R. Safari, U, Mutlu and R. Majidi AADE-15-NTCE-34
Figure 15: Normal Stress on Fracture Surface (wellbore is located
at 6.125 inches)
Figure (16) shows the stable-fracture length under different
far-field anisotropy conditions and for different fracture
pressures. Note that pressure inside the fracture can vary
between pore pressure; i.e., efficient plug or permeable
formation (FPC = 1), to wellbore pressure; i.e., non-efficient
plug or impermeable formation (FPC = 0). In order to arrest
the fracture and mitigate further propagation, fracture pressure
should be reduced from the given wellbore pressure (12.4 ppg
according to Table 1), to a value lower than 11.7 ppg.
Otherwise at values equal or greater than 11.7 ppg, fracture
length reaches an asymptotic behavior and will propagate
unstably. For example, to maintain a 6 inch “industry
standard” stable fracture length, wellbore pressure should be
reduced to ~ 11.2 ppg for a highly anisotropic case and for the
plug efficiency defined in Table 1. Our analysis confirm that
stable fracture length is a function of near-wellbore stress
perturbation, in-situ stress anisotropy, wellbore trajectory,
wellbore pressure, fracture plug efficiency, fracture toughness
and among others, and needs to be quantified for each
analysis.
Figure 16: Effect of Anisotropy on Stable Fracture Length
There are other factors controlling fracture propagation
under near-wellbore stress field such as fracture toughness.
Different simulations have been performed to show the effect
of fracture toughness on stable fracture length. Our results
show that as fracture toughness increases, a specific stable
fracture length requires less pressure reduction inside the
fracture. This is shown in Figure (17).
Figure 17: Effect of Fracture Toughness on Stable Fracture
Length
Finally and as discussed by Shahri et al. (2015), transient
pore pressure changes around the wellbore can be simulated
using analytical models as well. Total normal stress
component (which includes pore pressure effects) can be
calculated using analytical solutions and imported into the
strengthening design algorithm via mud cake efficiency.
Figure (18) shows the effect of pore pressure build-up around
the wellbore on the fracture stable length. Lower mud-cake
efficiency causes higher pressure build-up around the wellbore
which in turn increase(s) the total stress component on the
fracture surface. This higher resistive force might result in
stable fracture length even with small pressure drop inside the
fracture. Analyses presented in Figure(s) 16-18 assume that
linear elastic fracture mechanics govern fracture propagation.
Analyses don’t take into account fracture propagation in
unconsolidated formations or plastic dissipation.
Figure 18: Effect of Mud-cake Efficiency on Stable Fracture
Length Conclusions
We utilize a fast-running analytical model to quantify
induced fracture characteristics and wellbore strengthening
with implications to drilling through depleted zones. Fracture
width distribution, FRIP, stable fracture length can be
determined using an advanced analytical engine. Our results
show that fracture geometry, stable fracture length and amount
of strengthening are controlled by in-situ stress anisotropy,
near-wellbore stress perturbation, wellbore trajectory, fracture
plug efficiency and location, wellbore pressure, fracture

AADE-15-NTCE-34 Fracture-Based Wellbore Strengthening Design and Application: An Analytical Approach 9
toughness, mud cake efficiency and among other
formation/rock properties. Utilizing the analytical engine,
stable fracture length can be calculated under different
condition and can be used instead of current industry fixed
length (e.g., 6 inch) approach. In terms of strengthening,
fracture should be plugged close to the mouth to get desired
outcome instead of near-tip isolation. Similar analyses and
workflow(s) can be utilized (i.e. pre-drill or near real time) to
mitigate loss circulation risks while drilling through depleted
zones.
There are other mechanisms that contribute to wellbore
strengthening: such as transient thermal and/or poro-elastic
stress effect(s). Although the proposed analytical engine is
capable of simulating such conditions, a detailed investigation
of these effects on the strengthening behavior is beyond the
scope of this paper.
Acknowledgments
The authors would like to thank Weatherford and BP for
permission to publish this paper. The support of Scott Ball and
Moji Karimi throughout the study is much appreciated.
Nomenclature Wellbore Radius � Fracture Tip Location � Young’s Modulus �:< Equivalent Circulating Density
FPC Fracture Pressure Coefficient �� Fracture Tip Stress Intensity Factor ��= Fracture Toughness > Fracture Length � Chebyshev Polynomial Terms *+ Wellbore Pressure *, Fracture Pressure *. Pore Pressure � Poisson’s Ratio � Fracture Opening
σ!! Stress Distribution Along Fracture Surface
#?? Tangential Stress
#% Minimum Horizontal Stress
#$ Maximum Horizontal Stress
#- Vertical Stress
φ Wellbore Inclination Angle
∅ Porosity
θ Tensile Fracture Orientation Around the Wellbore
References Aadnoy, B.S., Looyeh, R., 2010. Petroleum Rock Mechanics:
Drilling Operation and Well Design, Gulf Professional
Publishing
Alberty, M., McLean, M., 2004. A Physical Model for Stress Cages.
Paper SPE 90493 presented at 2004 SPE Annual Technical
Conference and Exhibition, Houston, Texas, 26−29 September
Bridgeman, W., Salminen, C., Rosenberg, S., Karimi, M., Shahri,
M.P. Drilling with Liner Technology Enables Successful
Sidetrack through Depleted Sands in Shallow Water Gulf of
Mexico. IADC/SPE 173046, IADC/SPE Drilling Conference
and Exhibition, 17–19 March, London, United Kingdom, 2015.
Dupriest, F. 2005. Fracture closure stress (FCS) and lost returns
practices. Paper SPE 92192 presented at the SPE/IADC Drilling
Conference, Amsterdam, Netherlands, February 23−25
Fjar, Erling, Rachel M. Holt, A. M. Raaen, Rasmus Risnes, and P.
Horsrud.Petroleum related rock mechanics. Vol. 53. Elsevier,
2008
Fuh, G. et al 1992. A new approach to preventing lost circulation
while drilling. SPE 24599 presented at 67th Annual Technical
Conference and Exhibition, Washington, 4-7 October.
Fuh, G. et. al 2007. Further development, field testing and application
of the wellbore strengthening technique for drilling operations.
SPE/IADC paper 105809 presented at 2007 at IADC/SPE
drilling conference, Amsterdam, 20-22 February.
Guo, Q., Feng, Y. Z., Jin, Z. H., 2011. Fracture Aperture for
Wellbore Strengthening Applications. Paper ARMA 11-378
presented at the 45th U.S. Rock Mechanics/Geomechanics
Symposium, San Francisco, California, June 26−29
Morita N. et al. 1990. Theory of lost circulation pressure. SPE paper
20409 presented at the 65th Annual Technical Conference and
Exhibition, New Orleans, 23-26 September.
Muskhelishvili, N.I., 1953. Some Basic Problems of the
Mathematical Theory of Elasticity, 3rd Ed. translated by J.R.M.
Radok, P. Noordhoff, Ltd., Groningen, Holland
Peška, P., and Zoback, M. D. 1995. Compressive and tensile failure
of inclined well bores and determination of in situ stress and
rock strength. Journal of Geophysical Research: Solid
Earth, 100(B7), 12791-12811.
Shahri, M.P., Safari, R., Oar, T., Karimi, M., Mutlu, O. Advanced
Geomechanical Analysis of Wellbore Strengthening for
Depleted Reservoir Drilling Applications. SPE-167976,
IADC/SPE Drilling Conference and Exhibition, Fort Worth,
Society of Petroleum Engineers, 2014.
Shahri, M.P., Oar, T., Safari, R., Karimi, M., and Mutlu, U. In press.
Advanced Semi-Analytical Geomechanical Model of Wellbore
Strengthening Applications. SPE Journal (accepted 4 February
2015).
Shahri, M.P., Safari, R., Karimi, M., Mutlu, O. An Integrated
Analytical Workflow for Analyzing Wellbore Stress, Stability
and Strengthening. ARMA 15-82, 49th U.S. Rock Mechanics /
Geomechanics Symposium, San Francisco, California, June 28
– July 1.
Van Oort, E., Friedheim, J., Pierce, T., Lee, J., 2011. Avoiding
Losses in Depleted and Weak Zones by Constantly
Strengthening Wellbores. SPE Drilling & Completion, 26(4),
519−530
Wang, H., Towler, B., Soliman, M., 2007. Fractured Wellbore Stress
Analysis: Sealing Cracks to Strengthen a Wellbore.
Paper SPE/IADC 104947 presented at the 2007 SPE/IADC
Drilling Conference, Amsterdam, The Netherlands, 20−22
February
Wang, H., Soliman, M., & Towler, B., 2009. Investigation of Factors
for Strengthening a Wellbore by Propping Fractures. SPE
Drilling & Completion, 24(3), 441−451