design and construction of living sh lishorelines
TRANSCRIPT

Design and Construction of Living Sh liShorelines
A course for living shorelines professionals
September 29, 2010
This course made possible by a grant from the Virginia Coastal Zone Management Program
NOAA

Course Outline
Part 1 BackgroundgSite Evaluation Process Selecting a StrategySelecting a Strategy
Part 2 Lessons Learned from Case Studies
Part 3 Work Through Design Examples

Course InstructorsC. Scott Hardaway, Jr. Karen A. Duhring
VIMS since 1979Shorelines Studies Program DirectorExpert in headland breakwater systemsR h j t l Ch k B
VIMS since 1999
Center for Coastal Resources Management (CCRM) Scientist III
Research projects along Chesapeake Bayand ocean shorelines of Virginia and Maryland
Tidal shoreline advisory program, living shorelines, cumulative wetland impacts
M.S. Geology, East Carolina University 1979B.A. Geology, East Carolina University 1973 M.S. Coastal Zone Mgmt, FL Institute of Tech. 1988
B.A. Environmental Studies, New College 1986

Who Are You?Who Are You?
Wh t i ?What is your name?
What kind of living shorelines work do youWhat kind of living shorelines work do youdo?
Tell us one living shorelines designTell us one living shorelines designchallenge you are faced with

Why are we all here today?
• CZM contracted with VIMS to prepare design manual and teach a classand teach a class
• Improve understanding of performance and design standards
• Shoreline management plans with LS targeting• Regulatory programs now treat living shorelines as
f d th dpreferred methods• Growing interest in general permits, other streamlining
for living shorelinesfor living shorelines• Educated professionals are needed to facilitate public
interest review of how appropriate living shorelines are

Not Course ObjectivesNot Course Objectives
• Cover all living shoreline methodsCover all living shoreline methods• Solve all design challenges in 1 class
R i th ti it• Review the entire permit process• VIMS endorsements

Part 1Follows outline of Living Shorelines Design Manual
• Living Shorelines Principles• Chesapeake Bay Shorelinesy• Site Evaluation Process• Selecting Strategy• Selecting Strategy• Level of protection / design storms• Encroachment and habitat tradeoffs

Living Shorelines Principles
• Shore protectionS l i i
Integrated Shoreline Management– Solving erosion
problems– Least impacting,
Management
Riparian Buffernecessary method
S t i i
Riparian Buffer+
Tidal Wetlands • Sustaining
ecosystem services– Water quality
+Shallow Water Habitat
Water quality– Storm protection– Habitat
= Combined Protection Benefits

Chesapeake Bay Shorelines Ph i l S ttiPhysical Setting
• How a shore reach has evolved helpsHow a shore reach has evolved helpsdetermine management options
• Scarps and terraces – Determine high and low banks– Flooding frequency– Erosion trends

Lands west ofSuffolk ScarpSu o Sca pare generally
high with infrequentflooding
Lands east ofSuffolk Scarp are generally
lo ithlow withextensivemarshes

Chesapeake Bay Shorelines S L l RiSea Level Rise
• Relative Sea Level RiseRelative Sea Level Rise– sea level rise + land subsidence
• Variable rates in mid-Atlantic
• Accelerated rates are predicted withcce e ated ates a e p ed cted tuncertainty

Chesapeake Bay Shorelines H d d i S ttiHydrodynamic Setting
• Wave climate • Wind directionWave climate– Wind influenced everywhere – Ocean influence in lower
Wind direction
• Tide rangeBay year-round
• Fetch determines wave t ti l
– Mean
– Great diurnal or springenergy potential– Very low <0.5 mile
Low 0 5 1 mile
Great diurnal or spring
• Storm water levels– Low 0.5-1 mile– Medium 1-5 miles– High 5-15 miles
• Relative sea level riseHigh 5 15 miles
– Very high >15 miles

SITE EVALUATION PROCESSSITE EVALUATION PROCESS

Site Evaluation ProcessSite Evaluation Process
Each shoreline professional has a method for pconducting site evaluations
A standardized data collection process is recommended
Not all parameters have equal weight, professional judgment necessaryjudgment necessary
Appendix A is a site evaluation worksheet

Site EvaluationDesktop or Map Parameters
• Existing information
Site Visit Parameters
• Site-specificgavailable from maps or Internet resources
pcharacteristics
• Local setting• Not readily visible or
measurable at ground level
Local setting
• Not easily captured by remote sensingremote sensing

Desktop or Map ParametersShoreline orientationFetchShore MorphologyDepth OffshorepNearshore MorphologySubmerged Aquatic Vegetation (SAV)Submerged Aquatic Vegetation (SAV)Tide RangeStorm SurgeStorm SurgeErosion RateDesign WaveDesign Wave
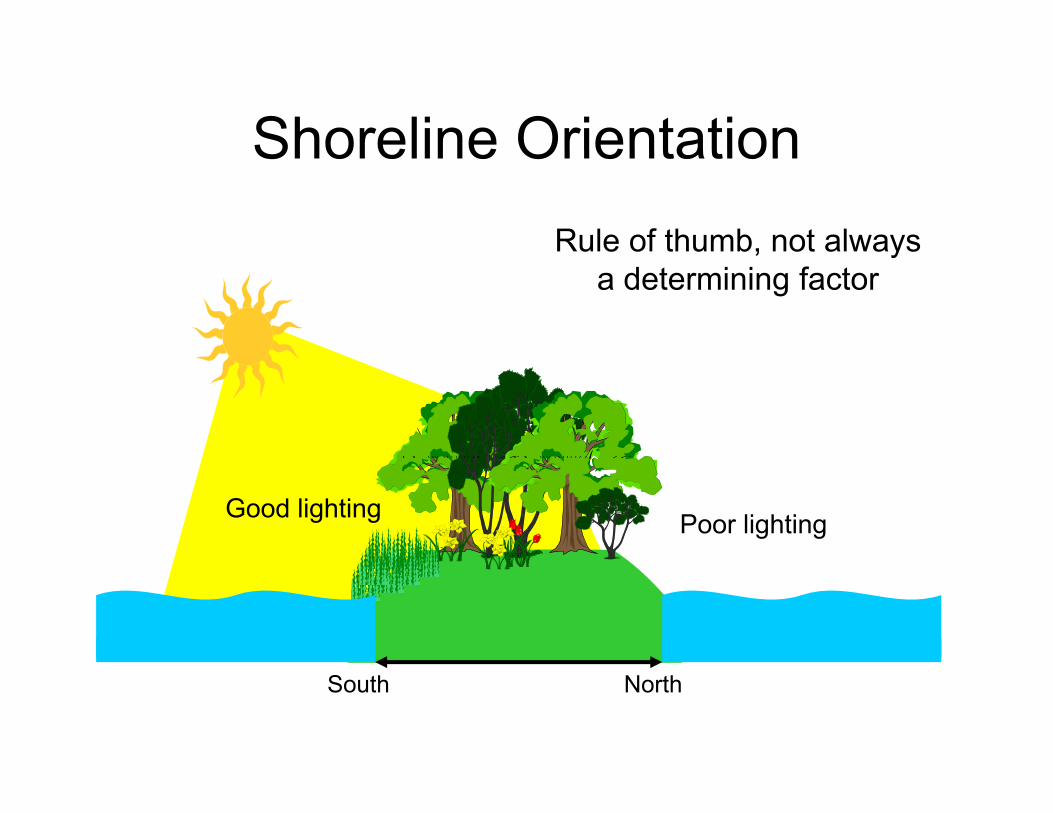
Shoreline OrientationShoreline OrientationRule of thumb, not always, y
a determining factor
Good lighting Poor lighting
South North
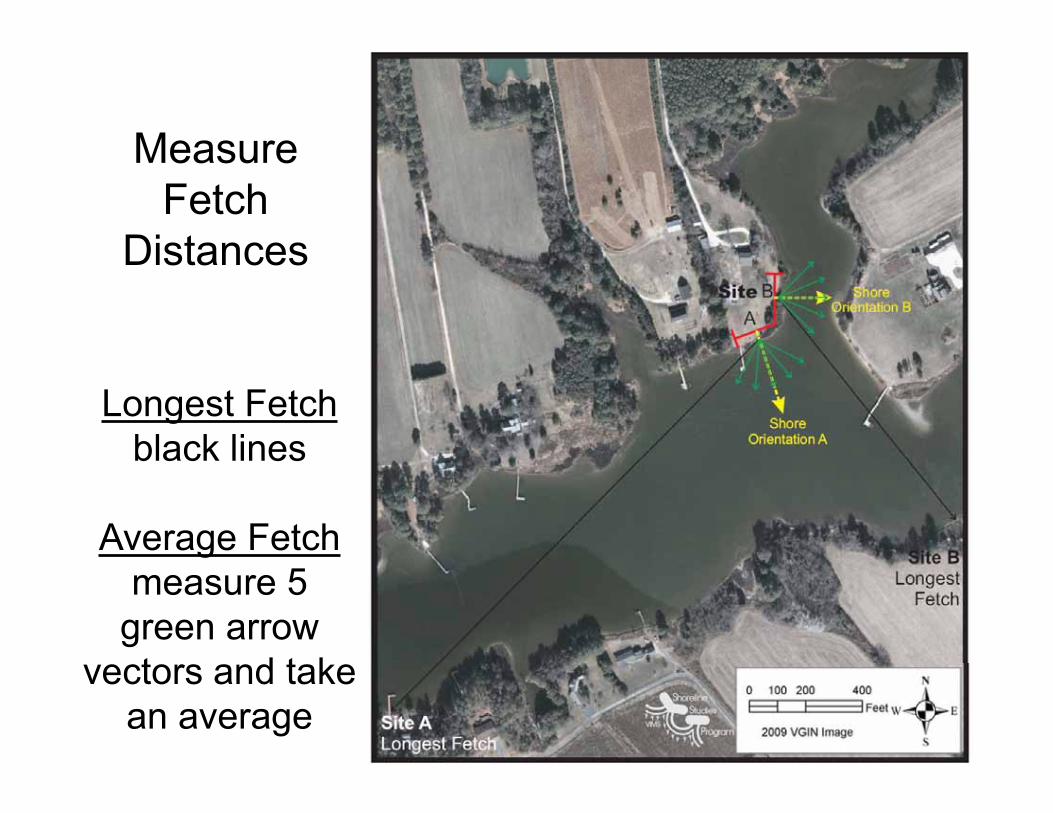
MeasureMeasureFetch
DistancesDistances
Longest Fetchblack linesblack lines
Average Fetch measure 5
green arrow t d t kvectors and take
an average

ShoreMorphologyMorphology
Pocket or embayed h li t d tshorelines tend to cause
waves to diverge and spread wave energy out
Straight and headland shorelines receive the fullshorelines receive the fullimpact of the wave climate
Irregular shorelines tend to break up wave crests

Depth Offshore distance to 6 ft or 2m contourdistance to 6 ft or 2m contour
Broad shallow nearshore has different wave
attenuation than narrow deep water
with same fetchwith same fetch
6 ft contour lines
NOAA Reduced Scale Navigational Charts http://ocsdata.ncd.noaa.gov/bookletchart/

Nearshore Morphology
Presence or absence of nearshore tidal flats and sand bars indicate sand supply bottom conditionssand bars indicate sand supply, bottom conditions
Important consideration for sills and breakwatersHard supportive substrate vs. soft, fine-grained sediment

Submerged Aquatic Vegetation (SAV)
Shallow sand flat with Submerged
Aquatic Vegetation SAVSAV

Submerged Aquatic Vegetation – Quick CheckCCRM Shoreline Assessment MapperCCRM Shoreline Assessment MapperPrevious 10 yrs SAV combined into 1 polygon
http://139.70.26.131:8008/ShorelineAssessmentMapper/

Submerged Aquatic Vegetation - Details Check VIMS SAV Inventory and Monitoring
Interactive Map
http://web.vims.edu/bio/sav/?svr=www

Tide RangeTide Range
• NOAA Tides and Currents – benchmarksNOAA Tides and Currents benchmarks• Variable by region
M tid d i tid• Mean tide range and spring tide range• Reference to tidal datum
– NAVD88• Critical information for planted marshesC t ca o at o o p a ted a s es

Mean Tide RangesMean Tide Rangesin feet
Polygonsi t l t d finterpolated fromNOAA data points
Figure 1-3, pp. 46

Spring TideSpring Tideor
Great Diurnal Tide Ranges
in feet
Figure 1-4, pp. 47

Storm SurgeStorm Surge
• Predicted water level during certain stormsPredicted water level during certain storms• Return frequencies – probability of
repeatingrepeating• 100-yr storm = 1% chance• 50 yr storm = 2% chance• 50-yr storm = 2% chance• 25-yr storm = 4% chance• water level will occur in any given yeara e e e occu a y g e yea
• FEMA Flood Insurance Studies web site– Look in Product Catalog– Look in Product Catalog

Erosion or Shoreline Change RateShoreline Studies Program Evolution Reports
• Northumberland Co • Newport News• Northumberland Co.• Lancaster Co.• Westmoreland Co
• Newport News• Poquoson• York Co• Westmoreland Co.
• Middlesex Co.Gl t C
• York Co.• Hampton
N f lk• Gloucester Co.• Mathews Co.
• Norfolk• VA Beach
A k C t• Accomack County• Northampton County
Go To http://web.vims.edu/physical/research/shoreline/Publications-Dune.htm

Example fromExample fromShoreline Evolution Report
for Gloucester Pointfor Gloucester Point

Design Wave
• Significant wave heights are the average of the
• Predicted waves may be more or less thanare the average of the
highest 33% of the wind/wave field
be more or less thanactual storm wave
wind/wave field
• Wave heights for the• Many sophisticated
wave predictionWave heights for thehighest 10% should be noted to determine rock
wave predictionmodels can be used
size • Simple method uses forecasting curvesg

Design Wave Forecasting Curves
Source: U.S. Army Corps of Engineers (1977)

Site Visit Parameters• Site boundaries• Site characteristics• RPA BufferRPA Buffer
• Bank conditionBank height• Bank height
• Bank composition
• Shore zone– width and elevation
• Backshore zone– width and elevation
• Existing shoreline defense structures
• Nearshore stability• Boat wake potential
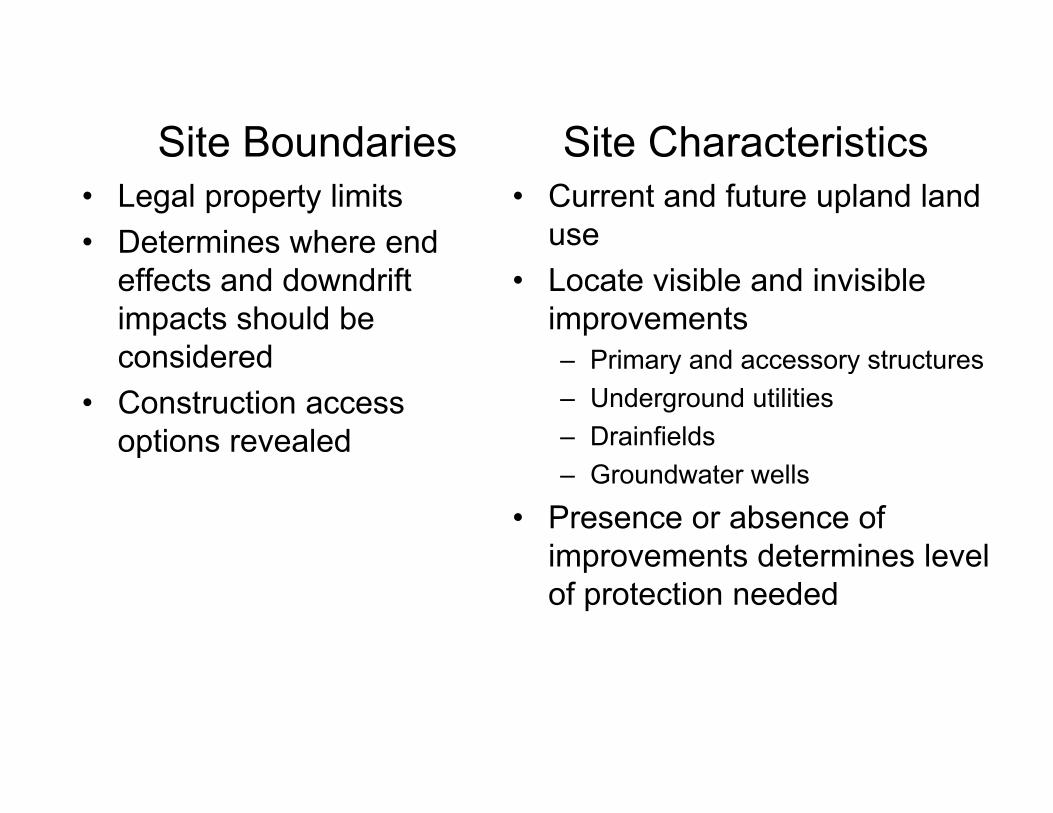
Site Boundaries Site CharacteristicsSite Boundaries• Legal property limits• Determines where end
Site Characteristics• Current and future upland land
useeffects and downdrift impacts should be considered
• Locate visible and invisible improvements
Primary and accessory structuresconsidered• Construction access
options revealed
– Primary and accessory structures– Underground utilities– Drainfieldsp– Groundwater wells
• Presence or absence of improvements determines levelimprovements determines levelof protection needed

Bank ConditionA A stable base of bank and bank face that has been graded and planted with vegetation. James River, Virginia
BA
B An unstable base of bank and bank face. The different colored layers indicates different types of material. Piankatank River, Virginia
C An undercut bank on the C
East River, Virginia.

Bank Height & Composition
Upper bankUpper bank
Base of bank

Bank Vegetation CoverResource Protection Area BufferResource Protection Area Buffer
Densely Vegetated / Forested Previously Cleared
D t ti t ib t t i t tiDoes vegetation cover contribute to erosion protection or problem?Should the bank be graded or not ?S ou d t e ba be g aded o otIs the absence of vegetation due to active erosion or previous land disturbance?

Combined Shore and Backshore Zone Width and Elevation

Shore Zone Width and Elevation• Existing tidal wetland
– Non-vegetatedS l f h h
• Measure width of each feature in profile
– Salt or freshwater marsh– Cypress trees
• Identify plant species, • Existing sand beach
– Intertidal beach
jurisdictional limits
• CombinationPatchy marsh headlands
• Do existing beach and marsh contribute to
i t ti ?– Patchy marsh headlandswith pocket beaches erosion protection?
• Can they be temporarily disturbed or enhanced?

Backshore Zone Width and Elevation• Existing high marsh
– Saltmeadow hay• Measure width of each
feature in profile– Phragmites– Salt bushes • Identify plant species,
• Existing supratidal beach > MHW
Overwash sand
jurisdictional limits
– Overwash sand– Primary & secondary dune
features• Do existing features
contribute to erosion t ti ?• Backshore terrace
– Bank slumping– Upland grasses and trees
protection?
– Upland grasses and trees • Can they be temporarily disturbed or enhanced?

Nearshore Stability
Highly suitable for sill or breakwater
Important consideration for sills and breakwatersNot suitable
Firm vs. soft

Boat Wakes
Boat wake effects are difficult to determine or predict
High boat traffic in narrow waterways will produce severe g y pwave climate not indicated by other parameters (fetch)
Presence or absence of docks marinas marked channelsPresence or absence of docks, marinas, marked channels
Local knowledge and judgment calls are required to weigh thi tthis parameter

Existing Shoreline Defense StructuresTarget Shoreline
• Serviceable or failingAdjacent Shoreline
• Consider effects onServiceable or failing
• Contributing to
Consider effects onstructural integrity
• Contributing toerosion protection or problem ?
• Opportunities for reach-basedp
• Failed structures
solutions?
Failed structuresindicate wave climate, other design alternatives

Coastal Profile• Combine all parameters for site-specific
conditionsconditions– Are all parameters weighed equally?
• Consider how integrated habitats can influence shore protection water qualityinfluence shore protection, water qualityand habitat functions
• Each element in the system works to reduce wave energy impacting the upland

Coastal profile examples

SELECTING A STRATEGYSELECTING A STRATEGY

Selecting a Strategy
• First consider if any ti i d daction is needed, can
minor erosion be tolerated?tolerated?
• If No Action is not• If No Action is notacceptable, what is the least impacting solution p gto solve the particular erosion problem?

CCRM Decision Tree f U d f d dfor Undefended
Shorelines
Suggested strategies in red
Judgment calls required if it d ’t fit f tlsite doesn’t fit perfectly
Does not account for allDoes not account for allparameters in a weighted fashion

Marsh Planting and ManagementMarsh Planting and Management
• Non-structuralNon structuralapproach
• Very low fetch <0.5 miley• Planting at grade or into
sand fill• Fiber logs• Tree pruningee p u g
If marsh will not persist without fiber logs, then
id h illconsider marsh sill

Marsh SillMarsh Sill• Stone revetment
l d MLWplaced near MLW• Backfilled with sand• Planted with tidal
wetland vegetation
StoneSand All 3 elements usually
required for sustainable Plants design

Marsh Toe RevetmentMarsh Toe Revetment• Sill placed next to an
i ti id hexisting wide marsh• Maintain desirable
h tmarsh ecosystemservices
• Natural accretion• Natural accretiondepends on local sediment supplysediment supply
• Can also spot fill and plant to fill in non-pvegetated areas

Why Tidal Openings ?Marsh Sills and Marsh Toe RevetmentsMarsh Sills and Marsh Toe Revetments
• Mitigate sill impacts on h ll t hshallow water – marsh
edge interactions
• Tidal inundation and positive drainage forpositive drainage forhealthy plant growth
Tightly packed stone in gabions t i t t t th h
• Marsh access for fish, crabs terrapins
restricts water movement throughstones
Algae bloom in warmer, stagnant areacrabs, terrapins g , g

Tidal OpeningsWhen should they be included?When should they be included?
• Site-specificTidal ponds– Tidal ponds
– Natural or created channels
– Open ends– Recreation access
• Sill crest height > MHW Tidal openings allow access for marine wildlife, but they also introduce wave
• Sill length > 100 Ft
, yenergy into the planted marsh.
Stable embayments eventually form
– No definitive standard– May need more or less

Tidal OpeningsDesign ChallengesDesign Challenges
• Minimize sand loss,,planted marsh failure at gapsMbGb
• How to predict stable embayment position ?
Gb
• Use similar ratio as breakwaters ???
Maximum Bay Indentation : Gap WidthMb:Gb
More research is needed to confirm a design standard for predicting Mb:Gb
1:1.65
g p gembayment position
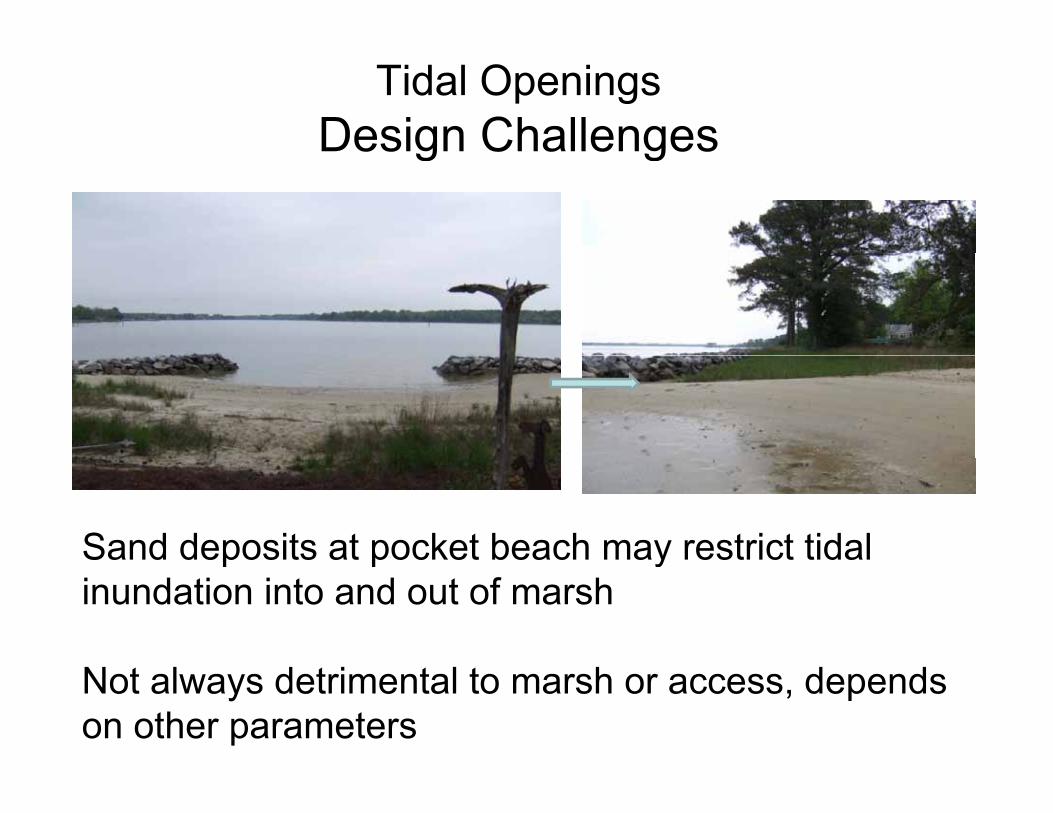
Tidal OpeningsDesign ChallengesDesign Challenges
Sand deposits at pocket beach may restrict tidal p p yinundation into and out of marsh
Not always detrimental to marsh or access, depends on other parameters

Tidal OpeningsOther Design TypesOther Design Types
Weir Opening or Vented Sill Straight gap with cobblestone
Gap covered with stone at lower elevation
Reduces sand deposits
Sediment deposition still evidentHow is biological activity
altered?

Tidal OpeningsOther Design TypesOther Design Types
Gapped offset sections at pocket marshTaper ends toward wave energy

Offshore BreakwatersOffshore Breakwaters
• Most appropriate for highpp p genergy sand beach sites
• Create stable pocket beaches between fixed headlandsheadlands– At least 2 units
• Proper design requires advanced knowledge of coastal processes at sitecoastal processes at site

Breakwater Design G id li
Maximum Bay Indentation
Guidelines
: Gap Width
Mb:GbMb:Gb1:1.65
Crest Length : Gap Width
Lb:Gb1:1.4

Level of Protection and Design Storms
• Maximum wind-wave li t t d
• Design stormsclimate expected – 10 yr
– 25 yr• Amount of risk or
damage property owner is willing to
– 50 yr– 100 yr
owner is willing toaccept • Set elevations
against eroding• Balanced with cost-
effectiveness
against erodingupland bank
effectiveness

Encroachment / Habitat Tradeoffs
Landward• Bank grading
Channelward• Non-vegetated to
• Tree removal• Upland conversion to
vegetated tidal wetlandp
tidal wetlands • Shallow water conversion to stone and vegetated marshand vegetated marsh
• Submerged Aquatic VegetationVegetation
• Sand movement & navigation channelsnavigation channels
• Shellfish lease areas

Encroachment / Habitat TradeoffsEncroachment / Habitat Tradeoffs
• Which type is more common?Which type is more common?– Landward or channelward

Encroachment / Habitat TradeoffsEncroachment / Habitat Tradeoffs
• Which type is more common?Which type is more common?– Landward or channelward
• Which conversion typically has the most i t?impact?– Upland to wetland– Non-vegetated to vegetated wetland– Shallow water to vegetated wetland

End of Part 1