describing patient populations for the my health team
TRANSCRIPT

Authors: Dan Chateau, PhDAlan Katz, MBChB, MSc, CCFP, FCFPColleen Metge, BSc (Pharm), PhDCarole Taylor, MScChelsey McDougall, MScScott McCulloch, MA Fall 2017 Manitoba Centre for Health Policy Max Rady College of Medicine Rady Faculty of Health Sciences University of Manitoba
Describing Patient Populations for the My Health Team Initiative
This report is produced and published by the Manitoba Centre for Health Policy (MCHP). It is also available in PDF format on our website at: http://mchp-appserv.cpe.umanitoba.ca/deliverablesList.html
Information concerning this report or any other report produced by MCHP can be obtained by contacting:
Manitoba Centre for Health Policy Rady Faculty of Health SciencesMax Rady College of Medicine, University of Manitoba408-727 McDermot Avenue Winnipeg, Manitoba, Canada R3E 3P5
Email: [email protected] Phone: (204) 789-3819 Fax: (204) 789-3910
How to cite this report:Chateau D, Katz A, Metge C, Taylor C, McDougall C, McCulloch S. Describing Patient Populations for the My Health Team Initiative. Winnipeg, MB. Manitoba Centre for Health Policy, Fall 2017.
Legal Deposit:Manitoba Legislative LibraryNational Library of Canada
ISBN 978-1-896489-87-2
©Manitoba Health, Seniors and Active Living
This report may be reproduced, in whole or in part, provided the source is cited.
1st printing (Fall 2017)
This report was prepared at the request of Manitoba Health, Seniors and Active Living(MHSAL), a department within the Government of Manitoba as part of the contract between the University of Manitoba and MHSAL. It was supported through funding provided by MHSAL to the University of Manitoba (HIPC 2014/2015 - 39). The results and conclusions are those of the authors and no official endorsement by MHSAL was intended or should be inferred. Data used in this study are from the Manitoba Population Research Data Repository housed at the Manitoba Centre for Health Policy, University of Manitoba and were derived from data provided by MHSAL, CancerCare Manitoba, and the Departments of Families, Education and Training, and Justice. Strict policies and procedures were followed in producing this report to protect the privacy and security of the Repository data.

umanitoba.ca/medicine/units/mchp/ 1
Describing Patient Populations for the My Health Team Initiative Manitoba Centre for Health Policy
About the Manitoba Centre For Health Policy
The Manitoba Centre for Health Policy (MCHP) is located within the Department of Community Health Sciences, Max Rady College of Medicine, Rady Faculty of Health Sciences, University of Manitoba. The mission of MCHP is to provide accurate and timely information to healthcare decision–makers, analysts and providers, so they can offer services which are effective and efficient in maintaining and improving the health of Manitobans. Our researchers rely upon the unique Manitoba Population Research Data Repository (Repository) to describe and explain patterns of care and profiles of illness and to explore other factors that influence health, including income, education, employment, and social status. This Repository is unique in terms of its comprehensiveness, degree of integration, and orientation around an anonymized population registry.
Members of MCHP consult extensively with government officials, healthcare administrators, and clinicians to develop a research agenda that is topical and relevant. This strength, along with its rigorous academic standards, enables MCHP to contribute to the health policy process. MCHP undertakes several major research projects, such as this one, every year under contract to Manitoba Health, Seniors and Active Living. In addition, our researchers secure external funding by competing for research grants. We are widely published and internationally recognized. Further, our researchers collaborate with a number of highly respected scientists from Canada, the United States, Europe, and Australia.
We thank the Health Research Ethics Board at the University of Manitoba for their review of this project. MCHP complies with all legislative acts and regulations governing the protection and use of sensitive information. We implement strict policies and procedures to protect the privacy and security of anonymized data used to produce this report and we keep the provincial Health Information Privacy Committee informed of all work undertaken for Manitoba Health, Seniors and Active Living.

2 UNIVERSITY OF MANITOBA, RADY FACULTY OF HEALTH SCIENCES
Fall 2017

umanitoba.ca/medicine/units/mchp/ 3
Describing Patient Populations for the My Health Team Initiative Manitoba Centre for Health Policy
AcknowledgementsThe authors wish to acknowledge the individuals whose knowledge and contributions made it possible to produce this report. We apologize in advance to anyone we might have overlooked.
We thank our Advisory Group for their input and expertise:
• Dr. Andrew Buchel (formerly at Prairie Research Associates)• Breann Zelenitsky (Interlake-Eastern Regional Health Authority)• Carol Styles (Winnipeg Regional Health Authority)• Cheryl Osborne (Manitoba Health, Seniors and Active Living)• Dr. Harold Nyhof (formerly at Northern Health Region)• Dr. Ingrid Botting (Winnipeg Regional Health Authority)• Jeanette Edwards (Winnipeg Regional Health Authority)• Jo-Anne Lutz (formerly at Northern Health Region)• Karen Ilchyna (Southern Health-Santé Sud)• Laura Morrison (Manitoba Health, Seniors and Active Living)• Pam Whitfield (Prairie Mountain Health)• Robin Reid (Southern Health-Santé Sud)
We are grateful for the feedback provided by our external reviewer Dr. Tyler Williamson (University of Calgary). We also thank Dr. Denis Fortier and Annette Dacquay, for helping us define the Francophone My Health Team, and Tom Fogg for his input in the development of this project.
We thank our colleagues at the Manitoba Centre for Health Policy for their valuable contributions: Dr. Randy Fransoo (senior reader), Dr. Jennifer Enns (editor), Dr. Marni Brownell, Dr. Noralou Roos, Dr. Sazzadul Khan, Randy Walld, Heather Prior, Dale Stevenson, Susan Burchill, Jessica Jarmasz, Ken Turner, Leanne Rajotte, Shannon Turczak, Charles Burchill, Kara Dyck, Emily Jones, and Jo-Anne Baribeau.
We appreciate the input provided by members of Family Medical Centre at 400 Tache, who participated in a focus group to discuss potential impacts of My Health Teams: Diane Labossiere, Dr. Kira Gullane, Dr. Leon Waye, Dr. Alex Singer, Dr. Kiran Brar, Andrea Wills, Dr. Steven Gray, Dr. Gerald Konrad, Ruth Thomson, Michelle Allard, Dr. Angelle Downey, and Dr. Nené Rush.
We acknowledge the University of Manitoba Health Research Ethics Board for their review of the proposed research project. The Health Information Privacy Committee (HIPC) is kept informed of all MCHP deliverables. The HIPC number for this project is 2014/2015 - 39. We also acknowledge Manitoba Health, Seniors and Active Living, as well as CancerCare Manitoba and the Departments of Families, Education and Training, and Justice for the use of their data.
All data management, programming and analyses were performed using SAS® version 9.4.

4 UNIVERSITY OF MANITOBA, RADY FACULTY OF HEALTH SCIENCES
Fall 2017

umanitoba.ca/medicine/units/mchp/ 5
Describing Patient Populations for the My Health Team Initiative Manitoba Centre for Health Policy
Report Contents
7 Report Overview
9 Section 1. Primary Care Networks
11 Section 2. My Health Team Geographies
15 Section 3. Patient Populations within the My Health Team Boundaries
23 Section 4. High Use of Health Services
29 Section 5. Medical Complexity
35 Section 6. Social Complexity
41 Section 7. The Overlap of High Use of Services, Medical Complexity, and Social Complexity
43 Section 8. How can all of this Information be used?
45 Reference List
47 Appendix: Report Supplement Content

6 UNIVERSITY OF MANITOBA, RADY FACULTY OF HEALTH SCIENCES
Fall 2017

umanitoba.ca/medicine/units/mchp/ 7
Describing Patient Populations for the My Health Team Initiative Manitoba Centre for Health Policy
Report OverviewPrimary care, provided by family physicians and nurse practitioners, is the initial access point to healthcare services for residents of Manitoba. Manitoba Health, Seniors and Active Living (MHSAL) regularly engages in initiatives to improve the care given by these professionals by providing resources and updating policies. An ongoing initiative to improve primary care is the development of My Health Teams (MyHTs). As suggested by the name of the initiative itself, the goal is to improve care by developing teams of healthcare professionals who will work together to address primary care needs of Manitobans.
MethodsIn order to describe the patient population comprising each MyHT, we assessed the most recent three-year period for which the wide variety of data we used were available (April 1, 2011 – March 31, 2014). Individuals must have resided in the province for a period long enough to have reliable data to characterize them. We looked at the MyHT patient population in two ways:
1. Residence-Based CohortAll Manitobans who live within the boundaries of a specific MyHT.
2. Provider-Based CohortAll Manitobans who receive the majority of their care from a primary care provider who practices within the boundaries of a specific MyHT.
Within these cohorts, we characterized patients who were likely to benefit most from the MyHT model of care. We examined patients who had high use of health services, patients who were medically complex, and patients who were socially complex.
Key ResultsPatient Populations• Almost one in three community-dwelling (i.e., not living in institutions like personal care homes or prisons) Manitobans do not see
a primary care provider regularly. • Of those who see a primary care provider regularly, approximately 40% travel outside their MyHTs for care.
High Use of Health Services• Half of all Manitobans use 87% of all primary care visits.• Less than 2% of Manitobans account for 30% of hospitalizations (updated November 29, 2017).• High users are much more likely to be older than the average Manitoban, more likely to be female, and more likely to reside in a
low-income area.
Medical Complexity • We divided medical complexity into issues related to physical health and issues related to mental health.• Approximately 5% of the population has been dispensed 10 or more different prescription drugs within a one-year period.• Winnipeg has higher rates of individuals defined as medically complex based on mental health concerns than other parts of the
province.• People with mental health medical complexities are younger and from lower income areas than people with physical health
medical complexities.
Social Complexity• Approximately 13% of Manitobans have three or more social factors that pose challenges to their health.• Many Manitobans who are socially complex are young (more than 25% are under 18).• Downtown/Point Douglas MyHT has higher rates of patients with social complexities than other Winnipeg MyHTs.• Poverty is a key contributor to social complexity, with over half of socially complex Manitobans living in the poorest areas.

8 UNIVERSITY OF MANITOBA, RADY FACULTY OF HEALTH SCIENCES
Report Overview Fall 2017
The Overlap of High Use of Services, Medical Complexity and Social Complexity • Approximately one in five Manitobans with a primary care provider meet the criteria for at least one of the three groups of
high-priority patients (high use of services, medically complex, or socially complex).• High users of services are not necessarily medically complex, and vice versa.• Social complexity is more closely related to mental health medical complexity than to physical health medical complexity.
This report has an online supplement that contains more detailed methods and results.
ConclusionsThe residence- and provider-based populations present two very different approaches to planning for the targeted MyHT patient populations. The immediate needs for the MyHTs are reflected in the provider-based numbers. These are the people who are seeing primary care providers and would be accessing the MyHT services in the near term. If MyHTs begin to capture more of the Manitobans residing in their geographic area, then the residence-based numbers will begin to play a larger role.
My Health Teams can incorporate information about Manitobans who are high users of services, medically complex, or socially complex into their planning. High users may benefit the most from the enhanced coordinated care MyHTs offer, but they are certainly not the only ones who stand to benefit from MyHTs. At the time of the analysis, we saw that medically complex Manitobans were in many cases distinct from high users of services. Addressing their care needs might be a priority for MyHTs. In addition, the distinction between medical complexity due to physical health concerns and medical complexity due to mental health concerns highlights the different types of services that might be most beneficial for different patients.
The presence of social complexity presents a different challenge and a different opportunity. The interventions or referrals that are available to socially complex patients can have a big impact in ways that might not typically come to mind when thinking about primary care providers. More widespread use of ‘Get your Benefits’, a poverty tool for primary care providers that helps them diagnose and address poverty, can help to lessen the impact of the social determinants of health.
umanitoba.ca/medicine/units/mchp/ 9
Describing Patient Populations for the My Health Team Initiative Manitoba Centre for Health Policy
Section 1. Primary Care NetworksPrimary care, provided by family physicians and nurse practitioners, is the initial access point to healthcare services for most residents of Manitoba. Manitoba Health, Seniors and Active Living (MHSAL) regularly engages in initiatives to improve the care given by these professionals by providing resources and updating policies. An ongoing initiative is the development of My Health Teams (MyHTs). Similar initiatives have been undertaken across Canada and in other jurisdictions. In fact, the World Health Organization discusses the shift to team-based primary care and the benefits of this approach in its 2008 World Health report, Primary Healthcare: Now More Than Ever [1].
Manitoba’s MyHTs have four key goals:
1. As suggested by the name of the initiative itself, MyHTs aim to improve care by developing teams of healthcare professionals that will work together in a broad virtual network to address primary care needs of Manitobans. In other words, the groups of care providers will be interprofessional. In the words of MHSAL, “team members may include primary care nurses, nurse practitioners, midwives, dietitians, pharmacists, mental health workers, social workers, spiritual care providers, community developers, exercise specialists, physiotherapists, or occupational therapists” [2].
2. When operating as planned, the teams will be able to provide care after hours, be the usual first contact for care, and offer timely appointments to avoid unnecessary waiting. In other words, the development of MyHTs will ensure that every patient has accessible primary care.
3. By involving patients extensively in the development of care plans and providing assistance with accurate information, patients will be able to make informed decisions about ongoing care, not just for treatment, but also for prevention. MyHTs will allow for truly comprehensive person-centred care.
4. Finally, by working with the teams, patients will have access to the right provider, with coordinated referrals to other providers and services. With the patient’s authorization, health information will be made available to those that need it to provide the best care possible. This coordinated care is a critical component of MyHTs.
Unlike some previous initiatives, there is no requirement that the team of individuals comprising a MyHT work in the same clinic, or even in the same building. The focus instead is on coordination of existing services that would allow for more comprehensive and consistent care for patients. However, the teams should not consist of members too distant to provide timely or accessible care. This approach to care was highlighted recently in a report for MHSAL by Health Intelligence Inc. and Associates (known as the Peachey report), that discusses in some length the considerable opportunities the development of MyHTs might offer for improved healthcare in Manitoba [3]. In combination with services such as Family Doctor Finder (http://www.gov.mb.ca/health/familydoctorfinder/) and focused chronic disease care management programs, the integration of services envisioned in MyHTs in Manitoba would confer a strong advantage. In this report, Peachey declares, “there is no comparable model in Canada with the same potential” [3, p.51].
MyHTs are a virtual network with a common vision and shared standard for primary care. The current report on MyHTs provides some key examples of indicators of health, health service use, and social determinants of health for the existing and projected MyHT areas throughout Manitoba. Understanding these indicators and how they present in the each MyHT population is essential for determining the needs for each MyHT area. From this understanding, two further undertakings are evident: 1) determining how to identify patients with specific needs (in advance and reliably), and 2) planning to meet the needs once they are identified.
In 2014, only two MyHTs (Steinbach area and Brandon area) had entered into agreements with MHSAL and were operating. For this reason, all of the analyses and data presented in this report are for current and future MyHT geographic areas. None of the analyses correspond perfectly with the patient populations of currently operating MyHTs, but rather correspond with the potential and intended patient populations for each of the MyHT geographic areas, as identified by an advisory group with representatives from each of the health regions. Aggregate or single MyHT results are presented here, but detailed results for each of the MyHTs are available in the online Report Supplement.

10 UNIVERSITY OF MANITOBA, RADY FACULTY OF HEALTH SCIENCES
Section 1. Primary Care Networks Fall 2017

umanitoba.ca/medicine/units/mchp/ 11
Describing Patient Populations for the My Health Team Initiative Manitoba Centre for Health Policy
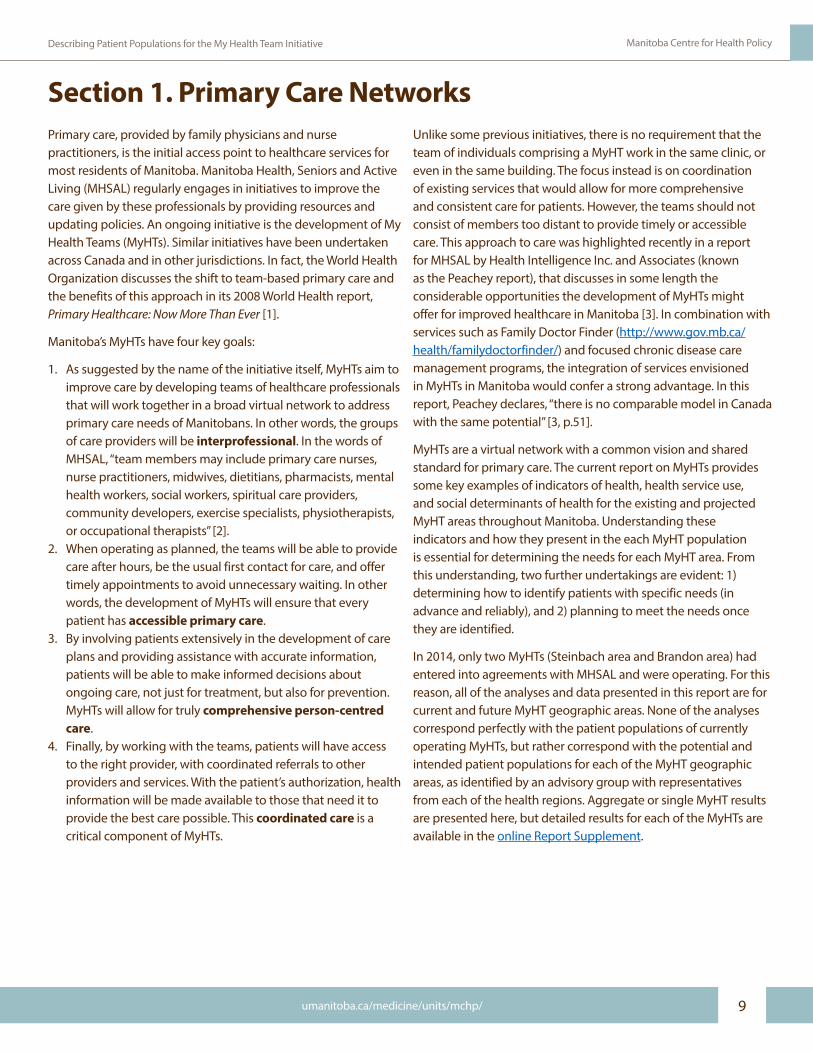
Section 2. My Health Team GeographiesKey to the implementation of MyHTs in Manitoba was defining geographic areas in which the teams would operate. Each of the health regions in the province were divided into several geographic areas that approximate the future areas for Manitoba-wide MyHTs. For example, the geographic boundaries that will be used for MyHTs in the Winnipeg Regional Health
Authority (WRHA) are based on existing service areas for WRHA program delivery known as Community Area Pairs. The other MyHT boundaries used in this report may not all be final, but they represent the best-presumed boundaries for the regional implementation of the MyHT initiative based on consultation with regional representatives.
Figure 1: Map of Proposed My Health Team Areas by Health Region in ManitobaFigure 1: Map of Proposed My Health Team Areas by Health Region in Manitoba
North (IERHA)
North (NHR)
Southeast (NHR)Southwest (NHR)
Mid (IERHA)
East (SH-SS)
North (SH-SS)
West (SH-SS)
North (PMH)
East (IERHA)
South (PMH)
Mid (PMH)
Mid (SH-SS)
West (IERHA)
South (IERHA)
Brandon (PMH)
Winnipeg
Churchill
Health Region
Winnipeg Regional Health Authority (WRHA)
Southern Health-Santé Sud (SH-SS)Prairie Mountain Health (PMH)Northern Health Region (NHR)Interlake-Eastern RHA (IERHA)
Mon équipe santé
12 UNIVERSITY OF MANITOBA, RADY FACULTY OF HEALTH SCIENCES
Section 2. My Health Team Geographies Fall 2017
Figure 2: Map of Proposed My Health Team Areas in Northern Health Region
Figure 3: Map of Proposed My Health Team Areas in Interlake-Eastern Regional Health Authority
Figure 4: Map of Proposed My Health Team Areas in Prairie Mountain Health
Figure 5: Map of Proposed My Health Team Areas in Southern Health-Santé Sud
Figure 2: Map of Proposed My Health Team Areas in Northern Health Region
North
SoutheastSouthwest
The Pas
Thompson
Snow LakeFlin Flon
Leaf Rapids
Gimli
Arborg
TeulonSelkirkStonewall
Lac du Bonnet
Winnipeg Beach
Beausejour
North
West
East
South
Mid
Figure 3: Map of Proposed My Health Team Areas in Interlake-Eastern Regional Health Authority
North
South
Mid
Brandon
Rapid City
Shoal Lake
Melita
Virden
Roblin
DauphinRussell
Neepawa
Erickson
Rossburn
Oak LakeCarberry
Grandview
Minitonas
Minnedosa
KillarneyDeloraine
Swan River
Boissevain
Souris
Birtle
Rivers
Hartney
Figure 4: Map of Proposed My Health Team Areas in Prairie Mountain Health
Figure 5: Map of Proposed My Health Team Areas in Southern Health-Santé Sud
East
North
West
Mid
Carman
MordenAltona
Morris
Gretna Emerson
Gladstone
Ste. Anne
Steinbach
Pilot Mound
Niverville
Winkler
Portage la Prairie
St. ClaudeNotre Dame de Lourdes
Mon équipe santé

umanitoba.ca/medicine/units/mchp/ 13
Describing Patient Populations for the My Health Team Initiative Manitoba Centre for Health Policy
Figure 6: Map of Proposed My Health Team Areas in Winnipeg Regional Health Authority
Southern Health-Santé Sud has a Francophone-oriented MyHT (Mon équipe santé). This MyHT is defined by patients who regularly receive care at a small set of clinics where the majority of care is provided in French:
• Centre médical Seine, located in Ste. Anne, MB• Clinique Notre-Dame Clinic, located in Notre Dame de Lourdes,
MB• Clinique médicale - Centre de bien-être St. Claude & Haywood
Wellness Centre, located in St. Claude, MB
As there is no geographic boundary for Mon équipe santé, this report does not present any residence-based results for this MyHT. The definitions of provider-based and residence-based cohort are presented in the next section.
Seven Oaks / Inkster
St. Vital / St. Boniface
River East / Transcona
St. James / Assiniboine South
Fort Garry / River Heights
Downtown / Point Douglas
Figure 6: Map of Proposed My Health Team Areas in Winnipeg Regional Health Authority
Additionally, residents of Churchill (formally part of the WRHA) were excluded from this report since planning for and providing care to the Churchill residents is currently carried out separately from the MyHT initiative.
As we turn now to the results sections of the report, it should be noted that not all of the MyHT results are presented for each analysis in the main report. Rather, results might be shown for a specific health region, a single MyHT from each health region, or as the overall average for each health region. The detailed results with data from every MyHT are presented in the Report Supplement.

14 UNIVERSITY OF MANITOBA, RADY FACULTY OF HEALTH SCIENCES
Section 2. My Health Team Geographies Fall 2017

umanitoba.ca/medicine/units/mchp/ 15
Describing Patient Populations for the My Health Team Initiative Manitoba Centre for Health Policy
Section 3. Patient Populations within the My Health Team Boundaries
In order to describe the patient population comprising each of the MyHTs, we assessed the most recent three-year period for which the wide variety of data we used were available (April 1, 2011 – March 31, 2014). Individuals must have resided in the province for a period long enough to have reliable data to characterize them. For this reason, a relatively small proportion of individuals that were not in the province for the entire three-year study period were excluded from the study. The study excludes individuals who died, moved out of the province, moved into the province, or
1. Residence-Based CohortAll Manitobans who live within the boundaries of a specific MyHT.
2. Provider-Based CohortAll Manitobans who receive the majority of their care from a primary care provider who practices within the boundaries of a specific MyHT. The provider-based cohort accounts for the fact that many Manitobans travel some distance to access primary care, and in doing so, leave the proposed boundaries for the MyHT in which they live. Because primary care providers (family physicians or nurse practitioners) act as the principal access point to a MyHT, it is important to also describe the population receiving care in a MyHT, rather than only the population that lives in that MyHT.
While the two populations are quite similar in many cases, there are some important differences between them that could have implications for MyHT planning.
• The provider-based cohort is based on an algorithm (described in detail in the Report Supplement) that requires at least three community-based visits (i.e., not in hospital) to primary care providers in a three-year period. Because a portion of Manitobans does not meet this criterion, the total number of patients for the provider-based cohort is considerably smaller than the residence-based cohort. Even where a patient has three
were born during the study period. However, since these factors can affect future planning for MyHTs, these demographic data that relate to the exclusion criteria are presented by MyHT for the whole population, not restricted to the study cohort. Personal care home (also known as nursing home) residents were also excluded from the study cohort, as their care provision is organized and delivered separately from the community-based care that the MyHTs encompass. From approximately 1.3 million Manitoba residents, about 1.15 million were part of the study cohort.
Two Different Ways to Look at the My Health Team Patient Population
visits, if they are to three different providers and none is for a complete physical, they are still not allocated to a primary care provider.
• By requiring a minimum of three visits, the provider-based cohort tends to be a little less healthy, a little older, and have a greater proportion of females than the residence-based cohort. In other words, healthy young males are less likely to see primary care providers.
• There are individuals in Manitoba for whom accurate information on place of residence is unavailable (e.g., wards of the Public Trustee), because the address on file with Manitoba Health is not their actual home. These individuals make up ~0.5% of the population, and may include a portion of children in the custody of Child and Family Services. They are excluded from the residence-based cohort, but may be included in the provider-based cohort if they meet the allocation algorithm requirements.
• Children assigned to pediatricians as their primary care provider are excluded from the provider-based cohort because these specialists are not currently included as principal access points to MyHTs. Rather, pediatricians can be included in the teams as specialists for referrals and consultations from other MyHT team members.
• The Mon équipe santé patient population can only be identified as a part of the provider-based cohort because it relies on identifying individuals that attend particular clinics. There is no residence-based cohort for Mon équipe santé.
hAlmost 1 in 3 community-dwelling Manitobans do not see a primary care provider regularly hOf those who see a primary care provider regularly, approximately 40% travel outside their
MyHT for care

16 UNIVERSITY OF MANITOBA, RADY FACULTY OF HEALTH SCIENCES
Section 3. Patient Populations within the My Health Team Boundaries Fall 2017
Figure 7 illustrates the difference between looking at the residence-based cohort versus the provider-based cohort. The ‘Live In’ column is the number of individuals in the study cohort registered with Manitoba Health with an address within the physical boundaries of a MyHT. This number represents the residence-based cohort for a MyHT. The ‘Unallocated’ and ‘Allocated’ columns break that number down into those individuals in a MyHT who meet the criteria to be assigned to a particular primary care provider (Allocated) and those who do not (Unallocated), most often because they do not have the minimum number of visits required for allocation. It is important to note that the ‘Allocated’ individuals may not be allocated to a primary care provider in the same MyHT as the one where they live. The final column, ‘Receives Care in My Health Team’, sorts Manitobans based on where their primary care providers practice. In other words, this is the number of Manitobans who are allocated to a primary care provider in the MyHT, regardless of where those individuals actually live. This number represents the provider-based cohort for a MyHT.
If we compare the ‘Live In’ numbers to the ‘Allocated’ numbers, we get a sense of the likelihood that a person in that geography has someone that we can point to as their primary care provider. Some geographies have a larger proportion of residents that
cannot be allocated to any particular provider, either because they did not need to see a provider at least three times during the study period, chose not to see a provider, or a regular provider was not available. For example, less than half of the residents of the Northern Health Region are allocated to a primary care provider. In contrast, over three quarters of Prairie Mountain Health residents are allocated to a provider.
It is not clear whether a lack of contact with a provider is a good or bad thing. Certainly, people in good health do not need to see a provider, and the number of individuals who are not allocated may represent a large portion of people who are healthy – a good news story. On the other hand, patients who saw multiple providers, or did not have access to a regular provider, are indicative of less-than-ideal quality of care [4, 5].
If we compare the ‘Allocated’ numbers to the ‘Receive Care’ numbers in Figure 7, we see that some areas have more individuals who leave to go elsewhere for care, while other areas see an influx of individuals coming for care. For example, the population receiving care in the Southern Health-Santé Sud Mid MyHT is less than half the size of the population that has been allocated (7,930 compared to 19,880), while the Downtown/Point Douglas MyHT in Winnipeg has more patients receiving care there than the number of residents who have been allocated (113,381 compared to 67,470).

umanitoba.ca/medicine/units/mchp/ 17
Describing Patient Populations for the My Health Team Initiative Manitoba Centre for Health Policy
Health Region My Health Team Areas Live In* Unallocated Allocated
East 52,168 18,870 33,298 23,200
Mid 29,746 9,866 19,880 7,930
West 48,907 16,514 32,393 34,804
North 40,201 12,972 27,229 19,345
Mon équipe santé† – – – 9,539
Overall 171,022 58,222 112,800 94,818
River East/Transcona 124,412 38,711 85,701 64,039
St. Vital/St. Boniface 115,187 30,798 84,389 103,533
Fort Garry/River Heights 119,637 36,471 83,166 84,529
St. James/Assiniboine South 88,459 24,913 63,546 72,199
Seven Oaks/Inkster 94,662 33,240 61,422 48,510
Downtown/Point Douglas 104,645 37,175 67,470 113,381
Overall 647,002 201,308 445,694 486,191
South 35,837 8,753 27,084 20,550
Brandon 44,333 7,469 36,864 49,495
Mid 31,879 9,010 22,869 20,066
North 38,009 9,641 28,368 29,131
Overall 150,058 34,873 115,185 119,242
East 23,982 6,171 17,811 16,088
South 44,098 13,155 30,943 21,555
Mid 20,545 6,663 13,882 11,001
West 25,444 7,803 17,641 11,386
North 4,551 2,780 1,771 182
Overall 118,620 36,572 82,048 60,212
Southeast 37,700 22,412 15,288 13,948
Southwest 22,364 10,370 11,994 11,817
North 7,544 5,604 1,940 1,222
Overall 67,608 38,386 29,222 26,987
1,154,310 372,095 787,450 787,450
*Residence-Based Cohort
**Provider-Based Cohort
†There is no residence-based cohort for Mon équipe santé.
Winnipeg
Prairie Mountain Health
Interlake-Eastern
Northern
Total Population
Figure 7: Population Counts for Residence-Based and Provider-Based Cohorts by Proposed My Health Team Areas in Manitoba Health Regions, 2011/12-2013/14
Location of Residence Receives Care in My Health
Team**
Southern Health-Santé Sud
Figure 7: Population Counts for Residence-Based and Provider-Based Cohorts by Proposed My Health TeamAreas in Manitoba Health Regions, 2011/12-2013/14

18 UNIVERSITY OF MANITOBA, RADY FACULTY OF HEALTH SCIENCES
Section 3. Patient Populations within the My Health Team Boundaries Fall 2017
Using the provider-based cohort, Figures 8 and 9 provide some detail about where people went for care, and where they came from. First, we can look at where people went. Did they stay in the same MyHT, go to another MyHT in the same health region, go to a MyHT in Winnipeg, or go to a MyHT in another health region? For MyHTs that are located close to Winnipeg (for example, Southern Health-Santé Sud Mid and Interlake-Eastern RHA South), there are much higher proportions of residents going for care in Winnipeg than we see in the other MyHTs (for example, Prairie Mountain Health Brandon and Northern Health Region Southwest). In Northern Health Region Southwest, most residents receive care in their geographic area. In Winnipeg Downtown/Point Douglas, about 60% of the patients go to primary care providers in the same MyHT geographic area they live in, while about 37% go to another MyHT within Winnipeg.
Second, for those people receiving care in a MyHT, where have they come from? Are the majority from the immediate geographic area, or are they from another MyHT in the same health region, or from Winnipeg, or from some other health region? The picture is very different when we look at the patient populations from this angle. In almost every MyHT, the majority of patients are from the immediate area, with smaller proportions coming from other areas. Winnipeg is the exception, where less than 40% of the residents receiving care in Downtown/Point Douglas are from the MyHT geographic area, and close to half are from another MyHT in Winnipeg. Downtown/Point Douglas also sees the largest proportion of Manitobans coming from other health regions, with about 10% coming from outside Winnipeg. There are large clinics in this area that would play a role in this.
The relationship between primary care providers and patients can play a major role in how patients travel for care. Even if patients move to different MyHT areas or even different health regions, they may continue to see the primary care provider they saw in their old place of residence, and this may account for some of the travel between areas that we see here. Continuity of care with a single provider is generally seen as a good thing for quality of primary care, even if the patient moves to another part of the city or province, or if the the provider moves locations.
Individuals in the provider-based cohort, where we allocated individuals to a primary care provider if they had at least three
0% 20% 40% 60% 80% 100%
Mid
Downtown/Point Douglas
Brandon
South
SouthwestSo
uthe
rnH
ealth
-Sa
nté
Sud
Win
nipe
gPr
airie
Mou
ntai
nH
ealth
Inte
rlake
-Ea
ster
nN
orth
ern
Same MyHT* Other MyHT same Health Region Winnipeg Other Health Region
Figure 8: Where Manitoba Residents went for Primary Care, 2011/12-2013/14Provider-based cohort
* My Health Team Area
0% 20% 40% 60% 80% 100%
Mid
Downtown/Point Douglas
Brandon
South
Southwest
Sout
hern
Hea
lth-
Sant
é Su
dW
inni
peg
Prai
rieM
ount
ain
Hea
lth
Inte
rlake
-Ea
ster
nN
orth
ern
Same MyHT* Other MyHT same Health Region Winnipeg Other Health Region
Figure 9: Where Manitoba Residents came from for Primary Care, 2011/12-2013/14Provider-based cohort
* My Health Team Area
Figure 8: Where Manitoba Residents went for Primary Care, 2011/12-2013/14Provider-based cohort
Figure 9: Where Manitoba Residents came from for Primary Care,2011/12-2013/14Provider-based cohort

umanitoba.ca/medicine/units/mchp/ 19
Describing Patient Populations for the My Health Team Initiative Manitoba Centre for Health Policy
visits in three years, may still make some visits to other providers. These other providers could be in the same MyHT, or could be in another MyHT. We examined the proportion of ambulatory visits (i.e., not in hospital) to primary care made by Manitobans outside their allocated MyHT. Figure 10 displays these proportions for Prairie Mountain Health, where Brandon sees a much lower proportion of individuals going outside the MyHT for occasional care than either the South or Mid MyHT. In terms of total numbers, out of approximately 293,000 total visits made by people who were allocated to a provider in Brandon, only about 15,000 visits were made to providers outside of the Brandon MyHT.
We also want to know how the residence-based cohorts of MyHTs are affected by individuals traveling from other regions, or by residents of the MyHT who had been allocated to a provider in another MyHT. This is the flipside of the proportions presented above. For every MyHT, we calculated the proportion of all visits inside that MyHT that came from patients whose allocated providers were in another MyHT. An interesting subset of this is the proportion for patients who live in the area, but were allocated elsewhere. Do they come back to their location of residence when they aren’t seeing their regular provider? For example, in terms of total numbers, there were approximately 304,000 visits to providers made in the Brandon MyHT, with about 26,000 visits coming from people who normally get care elsewhere. Of those 26,000 visits, 3,000 visits were made by residents of Brandon who had been allocated to a provider elsewhere.
0% 5% 10% 15% 20% 25%
South
Brandon
Mid
North
Prai
rie M
ount
ain
Hea
lth
Figure 10: Percentage of Ambulatory Visits Outside of Allocated Proposed My Health Team Area in Prairie Mountain Health, 2013/14Provider-based cohort
0% 5% 10% 15% 20% 25%
South
Brandon
Mid
North
Prai
rie M
ount
ain
Hea
lth
Living There
Living Elsewhere
Figure 11: Percentage of Ambulatory Visits to Proposed My Health Team Areas in Prairie Mountain Health for Patients Allocated Elsewhere, 2013/14Residence-based cohort
Figure 10: Percentage of Ambulatory Visits to Primary Care Outside of Allocated Proposed My Health Team Area in Prairie Mountain Health, 2013/14Provider-based cohort
Figure 11: Percentage of Ambulatory Visits to Primary Care to Proposed My Health Team Areas in Prairie Mountain Health for Patients Allocated Elsewhere, 2013/14Provider-based cohort

20 UNIVERSITY OF MANITOBA, RADY FACULTY OF HEALTH SCIENCES
Section 3. Patient Populations within the My Health Team Boundaries Fall 2017
Demographic Characteristics of My Health Team Populations
We start with the most basic demographic descriptors: age and sex. Not surprisingly, the residence-based cohort distribution of males and females is approximately 50/50 in every area. The numbers change a bit for the provider-based cohort, where only 44% of individuals are male, which is fairly consistent for all the MyHTs. The exact numbers are presented in the Report Supplement. The age distribution of individuals also changes between the residence-based and provider-based cohorts. The proportion of individuals aged 17 or younger is quite a bit smaller in the provider-based cohort, and the proportion of individuals aged 18-44 is also smaller. This is likely due to these individuals either not seeing a primary care provider frequently enough to be allocated to the provider-based cohort, or (in the case of children) they may be allocated to a pediatrician and are therefore excluded from the study.
Income, as a measure of socioeconomic status, is one of the most important social determinants of health. By linking health data with Canadian Census data, we can look at the income distribution of the MyHTs, based on the average household income of the area in which a person lives. Household income is divided into five groups with 20% of the population in each group. These groups are referred to as income quintiles. The lowest income quintile (Q1) contains the 20% of the population with the lowest average household income; the second lowest income quintile (Q2) contains the next 20% of the population, and so on. Specific MyHTs, however, have very different distributions of income.
Figure 13 presents the income distributions for each of the Winnipeg MyHTs using the residence-based cohort. The distributions for the provider-based cohort are quite similar and are presented in the Report Supplement. Downtown/Point Douglas has a very high proportion of individuals (approximately 50%) who are in the lowest income quintile. In contrast, about 30% of the St. Vital/St. Boniface, Fort Garry/River Heights, and St. James/Assiniboine South populations are in the highest income quintile.
0% 20% 40% 60% 80% 100%
River East/Transcona
St. Vital/St. Boniface
Fort Garry/River Heights
St. James/Assiniboine South
Seven Oaks/Inkster
Downtown/Point Douglas
Win
nipe
g
Q1 (Lowest) Q2 Q3 Q4 Q5 (Highest)
Figure 13: Income Quintile Distribution by Proposed My Health Team Areas in Winnipeg Regional Health Authority, 2011/12-2013/14Residence-based cohort; income quintiles determined on March 31, 2014
Figure 12: Age Distribution of Residence-Based and Provider-Based Cohorts in Manitoba, 2011/12-2013/14Age determined on March 31, 2014
Figure 13: Income Quintile Distribution by Proposed My Health Team Areas in Winnipeg Regional Health Authority, 2011/12-2013/14Residence-based cohort; income quintiles determined on March 31, 2014
0% 20% 40% 60% 80% 100%
Residence-BasedCohort
Provider-BasedCohort
≤17 18–44 45–64 65+
Figure 12: Age Distribution of Residence-Based and Provider-Based Cohorts in Manitoba, 2011/12-2013/14Age determined on March 31, 2014
umanitoba.ca/medicine/units/mchp/ 21
Describing Patient Populations for the My Health Team Initiative Manitoba Centre for Health Policy
Population Migration in My Health Teams
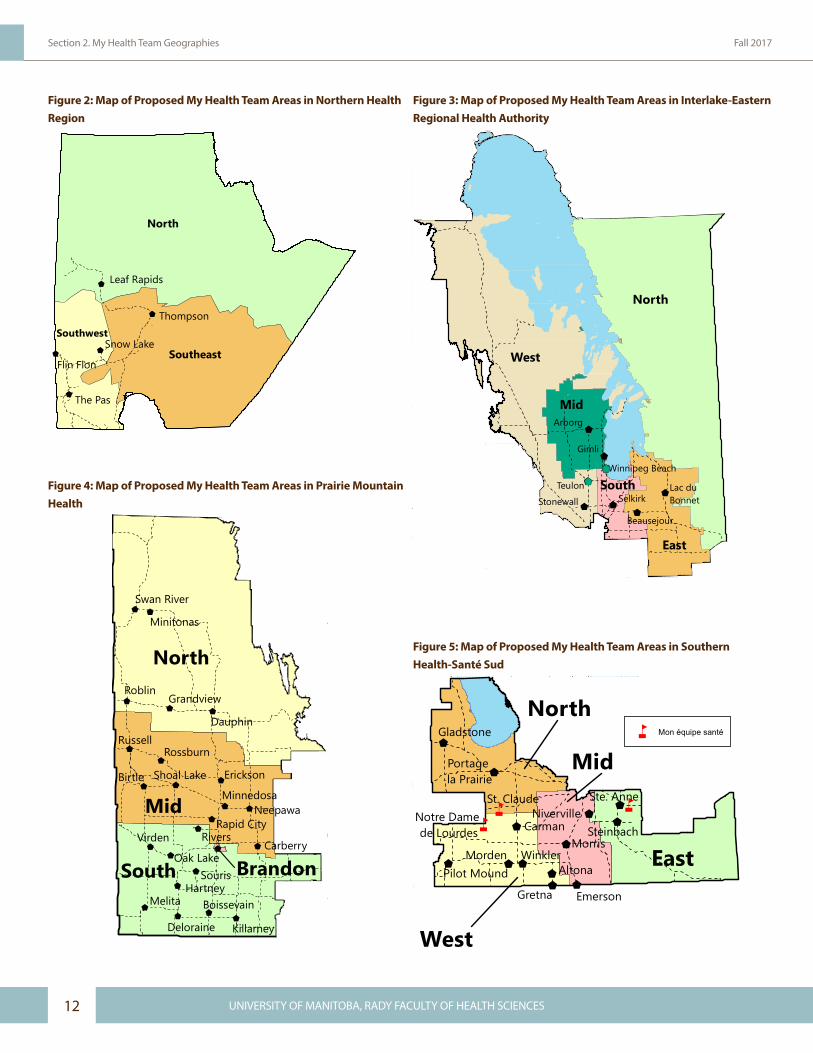
Figures 14 and 15 present a glimpse of the changes in the MyHT populations over the study period. Birth and death rates based on location of residence provide information about the delivery of care needed for these particular populations. For example, care for newborns (including vaccinations and well-baby checkups) and care provided during pregnancy need to be accounted for by the MyHT. We also know that, on average, the level of care provided for those approaching the end of life increases, whether in the community or in a nursing home.
Overall, there are more births than deaths in Manitoba, but the contrast between birth and death rates is more dramatic in some health regions (i.e., Northern Health Region, Southern Health-Santé Sud) than others.
The move-in and move-out rates give us an idea of the movement of residents from/to other areas, whether those are nearby regions, in/out of Manitoba, or in/out of Canada. My Health Team planning and primary care provision may require different approaches for less stable populations. Winnipeg has the highest overall rate for both people moving into the area and people moving out of it. Most health regions have higher move-in rates than move-out rates, with the exception of Northern Health Region and Prairie Mountain Health. The effect of migration into Manitoba is a net positive, and the demands on care providers may be affected by the relative increase in the population of newcomers.
0 10 20 30 40 50
Southern Health-Santé Sud
Winnipeg
Prairie Mountain Health
Interlake-Eastern
Northern
Live Birth RateDeath Rate
Births or Deaths per 1,000 Residents
Figure 14: Live Birth and Death Rates per 1,000 Residents by Manitoba Health Regions, 2013/14Location of residence
0 20 40 60 80 100
Southern Health-Santé Sud
Winnipeg
Prairie Mountain Health
Interlake-Eastern
Northern
Move-InMove-Out
Move-ins or Move-outs per 1,000 Residents
Figure 15: Move-In and Move-Out Rates per 1,000 Residents by Manitoba Health Regions, 2013/14
Figure 14: Live Birth and Death Rates per 1,000 Residents by Manitoba Health Regions, 2013/14Location of residence
Figure 15: Move-In and Move-Out Rates per 1,000 Residents byManitoba Health Regions, 2013/14
The Downtown/Point Douglas My Health Team in Winnipeg sees high residential mobility with 1 in 10 people moving in 2013/14.

22 UNIVERSITY OF MANITOBA, RADY FACULTY OF HEALTH SCIENCES
Section 3. Patient Populations within the My Health Team Boundaries Fall 2017
My Health Team Patient Populations: High Users of Health Services and Complex Patients
This report focuses on MyHT patients that fall into three main groups:
1. High Use of Health Services• Patients considered high users of health services such as
primary care visits or hospitalizations.
2. Medical Complexity• Patients who are medically complex, likely with multiple
conditions (chronic or otherwise) that would influence the provision of care or the need for coordinated care. While many high users may also be medically complex, and vice versa, it is also possible that a person could be distinctly a high user, with only a single medical condition or two; or that a person could be medically complex but not be a high user of services.
3. Social Complexity• Individuals who are socially complex with social factors
that influence their health and their use of healthcare services. Because of the increased likelihood of developing acute diseases and chronic conditions, these individuals may benefit from services that prevent or delay deterioration of their health, and set them on a path away from becoming medically complex or high users of health services.
These patients are the focus of the report as they are likely to benefit most from the MyHT model of care.

umanitoba.ca/medicine/units/mchp/ 23
Describing Patient Populations for the My Health Team Initiative Manitoba Centre for Health Policy
Section 4. High Use of Health Services
The primary care visit is the most frequent healthcare contact in Manitoba; there are about 4.4 million ambulatory visits (i.e., not in hospital) made each year. Here we examined the number of visits that each individual in our cohorts made during the study period (April 1, 2011 – March 31, 2014), not including pregnancy-related or well-baby visits. Some people had no visits to primary care providers during the entire study period, while others had many more than average. We used a concentration curve to show how the visits are distributed amongst the population of our residence-based cohort.
In Figure 16, everyone is sorted by the number of visits that they made to primary care providers in 2013/14, with the lowest frequency group (the people with no visits) to the far left and the group with the highest number of visits at the far right. The numbers of visits are summed for each group of individuals (i.e., those with one visit, those with two visits, those with three visits, etc.), and are graphed as the proportion of all visits in the population. As we move from the left to the right, the visits are accumulated and graphed until, when we’ve accounted for 100% of the population, 100% of all visits are also accounted for. Included in the figure is the ‘line of equality’, which runs from the bottom left to the top right. The closer the curve is to that line, the more equal the delivery of care is across the population (i.e., as if everyone in the province saw their provider the exact same number of times).
You may have seen concentration curves presented in other reports from the Manitoba Centre for Health Policy, but they are fundamentally different from these. In those cases, individuals were sorted by income, rather than by the health service itself. While those concentration curves show how the services are distributed across the income spectrum, the concentration curves in this report show how services are concentrated among individuals who use the service the most.
Ambulatory Visits to Primary Care
Looking at Figure 16, when about 13% of the population is accounted for, the line is still at 0% of visits, meaning that these people did not make a single visit to a primary care provider in 2013/14. At 50% of the population, only 14% of all visits are accounted for. Half the population, therefore, makes relatively few visits to primary care providers.
High use was defined as making ten or more visits, and this cut-off is marked on the figure. In 2013/14, about 13% of people were high users of ambulatory care visits, and they accounted for almost 45% of all visits.
h Less than 2% of Manitobans account for 30% of hospitalizations (updated November 29, 2017)
h 25% of Manitobans account for 75% of specialist visits h Primary care visits are less concentrated, but the top 20% of patients account for almost
half of all visits to primary care providers hHigh users of health services tend to be female, older than the average Manitoban, and
residing in a low-income area
0%
10%
20%
30%
40%
50%
60%
70%
80%
90%
100%
0% 10% 20% 30% 40% 50% 60% 70% 80% 90% 100%
Concentration Curve
Line of Equality
Figure 16: Concentration Curve for Ambulatory Visits to Primary Care in Manitoba, 2013/14Residence-based cohort
Cumulative Percent of People
Cum
ulat
ive
Perc
ent o
f Vis
its
High User Cutoff 10+ Visits
Figure 16: Concentration Curve for Ambulatory Visits to Primary Care in ManitobaResidence-based cohort

24 UNIVERSITY OF MANITOBA, RADY FACULTY OF HEALTH SCIENCES
Section 4. High Use of Health Services Fall 2017
Figure 17 shows that the proportions of high users of primary care ambulatory visits are fairly evenly distributed amongst each of the MyHTs in Southern Health-Santé Sud. The provider-based cohort rates are higher because the cohort is restricted to those who meet the criteria to be allocated to a primary care provider (e.g., a minimum of three visits over the three-year study period).
The rate of physician visits by high users was higher in Prairie Moutain Health than any other RHA, driven in part by the Brandon My Health Team area.
Speciality Visits for Non-Psychiatric Care
Another indicator of high use is the number of visits to specialists. In this case, we removed psychiatric visits because that aspect of care is covered in the next section. The concentration curve for specialist visits is very different from that for primary care visits, with over 40% of the population not making a single visit to a specialist. High use was defined as 5 or more visits; approximately 7% of the population met that definition, but they account for almost 40% of all specialist visits.
0% 10% 20% 30% 40% 50%
East
Mid
West
North
Mon équipe santé*So
uthe
rn H
ealth
-San
té S
ud
Residence-Based
Provider-Based
Figure 17: Percent of Individuals Defined as a High User based on Number of Ambulatory Visits to Primary Care by Proposed My Health Team Areas in Southern Health-Santé Sud, 2013/1410+ ambulatory visits to primary care in 1 year
*There is no residence-based cohort for Mon équipe santé.
0%
10%
20%
30%
40%
50%
60%
70%
80%
90%
100%
0% 10% 20% 30% 40% 50% 60% 70% 80% 90% 100%
Concentration Curve
Line of Equality
Figure 18: Concentration Curve for Specialist Visits for Non-Psychiatric Care in Manitoba, 2011/12-2013/14Residence-based cohort
Cumulative Percent of People
Cum
ulat
ive
Perc
ento
f Spe
cial
ist V
isit
s
High User Cutoff5+ Visits
Figure 17: Percent of Individuals Defined as a High User based onNumber of Ambulatory Visits to Primary Care by Proposed My Health Team Areas in Southern Health-Santé Sud, 2013/1410+ ambulatory visits to primary care in 1 year
Figure 18: Concentration Curve for Specialist Visits for Non-Psychiatric Care in ManitobaResidence-based cohort

umanitoba.ca/medicine/units/mchp/ 25
Describing Patient Populations for the My Health Team Initiative Manitoba Centre for Health Policy
High users of specialist care are concentrated in Winnipeg and in health regions close by (e.g., Interlake-Eastern RHA) where patients can most easily travel to Winnipeg for care (see Figure 19). Most specialists in Manitoba are located in Winnipeg. Any inclusion of specialist care in MyHTs would need to take this into account.
The specialist visit rate in Winnipeg is more than double the rate in rural areas.
Number of Hospitalizations and Hospital Days
Use of hospitals is much less common than primary care visits. However, both the number of hospitalizations and the number of hospital days were examined for this report. The detailed results are presented in the Report Supplement, and are for the most part quite similar across the MyHTs. Here, we present the concentration curve and the rate of high users of hospitalizations. The concentration curve for hospitalizations shows that a very small number of Manitobans (less than 2%) account for 30% of all hospitalizations.
0% 10% 20% 30% 40% 50%
Southern Health-Santé Sud
Winnipeg
Prairie Mountain Health
Interlake-Eastern
Northern
Residence-Based
Provider-Based
Figure 19: Percent of Individuals Defined as a High User based on Number of Specialist Visits for Non-Psychiatric Care by Manitoba Health Regions, 2011/12-2013/145+ Specialist Visits in 1 year
0%
10%
20%
30%
40%
50%
60%
70%
80%
90%
100%
0% 10% 20% 30% 40% 50% 60% 70% 80% 90% 100%
Concentration Curve
Line of Equality
Figure 20: Concentration Curve for Hospitalizations in Manitoba, 2011/12-2013/14
Cumulative Percent of People
Cum
ulat
ive
Perc
ent o
f Hos
pita
lizat
ions
High User Cutoff
3+ Hospitalizations
Figure 19: Percent of Individuals Defined as a High User based onNumber of Specialist Visits for Non-Psychiatric Care by Manitoba Health Regions, 2011/12-2013/145+ specialist visits in 1 year
Figure 20: Concentration Curve for Hospitalizations in ManitobaResidence-based cohort

26 UNIVERSITY OF MANITOBA, RADY FACULTY OF HEALTH SCIENCES
Section 4. High Use of Health Services Fall 2017
Rates of high users of hospitalizations are much higher in the Interlake-Eastern RHA North MyHT than in other Interlake-Eastern RHA MyHTs.
Winnipeg My Health Teams have much lower rates of hospitalizations by high users than My Health Teams in other RHAs.
Composite Index of High Use of Services
In addition to looking at individual indicators, we created a single composite index for each group. We used a method known as factor analysis to create this single score. Factor analysis is a statistical technique based on the idea that two or more indicators are correlated due to an underlying factor. Depending on the correlations among the indicators included in the analysis, factor analysis can identify either one factor or multiple factors (with each factor usually comprising a distinct subset of the variables that were included in the analysis). Every individual can be assigned a score on each factor. In this way, factor analysis can serve as a means of data reduction, taking information for individuals from multiple indicators and creating a single composite index and score. We used a theoretical cut-off of the top 5% of individuals on the composite score (a value of 1.68 or more on the factor score) to identify the more extreme individuals.
We created a single composite index of high use of health services by combining three indicators for high use: number of primary care visits, specialist visits, and hospitalizations. The actual counts of the indicators were used for the analysis (e.g., a person might have 11 primary care visits, 3 specialist visits and 1 hospitalization, and another might have 3 primary care visits, 1 specialist visit, and no hospitalizations). As explained above, the analytic method produces a single standardized score for each person, and the people who ranked in the top 5% of all Manitobans on this score were defined as high users.
Unlike the separate indicators presented earlier, to be defined as a high user using the composite index might require that a person use above average level of services on all the indicators.
0 10 20 30 40 50 60 70 80
East
South
Mid
West
NorthIn
terla
ke-E
aste
rn
Residence-Based
Provider-Based
Figure 21: Rate per 1,000 Individuals Defined as a High User based on Number of Hospitalizations by Proposed My Health Team Areas in Interlake-Eastern Regional Health Authority, 2011/12-2013/143+ Hospitalizations in 3 Years
Rate per 1,000
Figure 21: Rate per 1,000 Individuals Defined as a High User based on Number of Hospitalizations by Proposed My Health Team Areas in Interlake-Eastern Regional Health Authority, 2011/12-2013/143+ hospitalizations in 3 years

umanitoba.ca/medicine/units/mchp/ 27
Describing Patient Populations for the My Health Team Initiative Manitoba Centre for Health Policy
What are the Characteristics of High Users?
On average, a high user had just over 12 primary care provider visits, almost 6 specialist visits, and approximately 1 hospitalization in a one-year period.
Figure 22 shows the proportion of high users for each of the health regions.
High users of services are different from the average Manitoban in predictable ways. They are a much older group, with 44% aged 65 or older, and less than 25% under the age of 45. The socioeconomic status of high users tends to be lower on average than the overall residence- or provider-based cohorts, where approximately 20% of people are present in each quintile. Instead, over 23% are in the lowest income quintile, and only 17% are in the highest income quintile.
0% 5% 10% 15% 20% 25% 30%
Southern Health-Santé Sud
Winnipeg
Prairie Mountain Health
Interlake-Eastern
Northern
Residence-Based
Provider-Based
Figure 22: Percent of Individuals Defined as High User based on Composite Index by Manitoba Health Regions, 2011/12-2013-14
4%
19%
34%
44%
≤ 17 18–44 45–64 65+
Figure 23: Age Distribution of Manitoba Residents Defined as High User based on Composite Index, 2011/12-2013-14
0% 10% 20% 30% 40% 50%
Q5 (Highest)
Q4
Q3
Q2
Q1 (Lowest)
Figure 24: Income Quintile Distribution of Manitoba Residents Defined as High User based on Composite Index, 2011/12-2013-14Residence-based cohort
Figure 22: Percent of Individuals Defined as High Users based on Composite Index by Manitoba Health Regions, 2011/12-2013-14
Figure 23: Age Distribution of Manitoba Residents Defined asHigh User based on Composite Index, 2011/12-2013-14Residence-based cohort
Figure 24: Income Quintile Distribution of Manitoba ResidentsDefined as High Users based on Composite Index, 2011/12-2013-14 Residence-based cohort

28 UNIVERSITY OF MANITOBA, RADY FACULTY OF HEALTH SCIENCES
Section 4. High Use of Health Services Fall 2017
To answer this question, all visits to primary care providers were grouped into broad categories based on the diagnosis associated with the visit, as reported on the claim for services. Although this is not always perfect for each visit, these codes tend to reflect the relative proportions of care for these different conditions at the population level. For primary care providers, these diagnoses are defined by the International Classification of Diseases, version 9 (ICD-9). Diagnoses in the ICD-9 are defined by chapter, with each chapter encompassing a body system and/or related conditions. Figure 25 presents the visit rate for high users for the top ten ICD-9 chapters, and for all others.
What did High Users Visit their Doctor for?
On average, high users made just over 12 visits per year to primary care providers, with roughly 1.74 visits made for circulatory system disorders and about 1.7 made for the musculoskeletal system. Mental illness conditions make up about 1.32 visits per year. About 1.14 visits per year by high users are made for endocrine and metabolic diseases, which encompass diabetes.
ICD-9 ChapterVisit Rate per
YearPercent of All Visits
Circulatory (e.g., Hypertension) 1.74 14%
Musculoskeletal (e.g., Arthritis) 1.70 14%
Mental Illnesses (e.g., Anxiety, Depression) 1.32 10%
Endocrine & Metabolic Diseases (e.g., Diabetes) 1.14 9%
Reported Symptoms (e.g., Fever) 1.15 9%
Respiratory (e.g., Bronchitis, Influenza) 1.08 9%
Contact with Health System (e.g., General Physical Exam) 0.64 5%
Nervous (e.g., Multiple Sclerosis, Meningitis) 0.69 6%
Genitourinary (e.g., Urinary Tract Infection) 0.60 5%
Disorders of Skin (e.g., Dermatitis) 0.55 4%
All Others 1.94 15%
Total Visit Rate 12.54 -
Figure 25: Percent of Ambulatory Visits by International Classification of Diseases (ICD) Chapter for Manitoba Residents Defined as High User based on Composite Index, 2011/12-2013-14
Figure 25: Percent of Ambulatory Visits to Primary Care by International Classification of Diseases Version 9 (ICD-9) Chapter for Manitoba Residents Defined as High Users based on Composite Index, 2011/12-2013-14 Residence-based cohort

umanitoba.ca/medicine/units/mchp/ 29
Describing Patient Populations for the My Health Team Initiative Manitoba Centre for Health Policy
Section 5. Medical Complexity
We used six different indicators to measure medical complexity, of which three described complexity due to physical health conditions and three described complexity due to mental health conditions. Some individuals, of course, had both physical and mental health complexities. The medical complexity indicators for physical health included an overall measure of sickness known as Resource Utilization Bands (RUBs)1, use of multiple drugs from
1 Resource Utilization Bands (RUBs) were created using the Johns Hopkins Adjusted Clinical Group® (ACG®) Case-Mix System version 11.0.
hMedical complexity encompasses issues related to physical health and mental health hApproximately 5% of the population has been dispensed 10 or more different prescription
drugs within a one-year period hWinnipeg has higher rates of individuals defined as medically complex based on mental
health concerns compared to other health regions h People with mental health complexities are younger and poorer than people with physical
health complexities
Polypharmacy
0%
10%
20%
30%
40%
50%
60%
70%
80%
90%
100%
0% 10% 20% 30% 40% 50% 60% 70% 80% 90% 100%
Concentration Curve
Line of Equality
Figure 26: Concentration Curve for Prescription Drug Dispensations in Manitoba, 2013/14
Cumulative Percent of People
Cum
ulat
ive
Perc
ent o
f Dru
gD
ispe
nsat
ions
Medical Complexity
Cutoff 10+ Drugs
Figure 26: Concentration Curve for Prescription Drug Dispensations in ManitobaResidence-based cohort
Polypharmacy is the use of multiple prescription drugs simultaneously or within a short period of time. In this study, individuals who were prescribed multiple drugs from different classes during the study period were almost certainly being treated for several different conditions, and were considered medically complex. For this indicator of medical complexity, the annual number of different drug dispensations over the three-year study period was counted for every Manitoban. Importantly, drugs that were similar to each other were not considered ‘different’ drugs (i.e., switching from one antidepressant to another in the same class, or switching from one statin to another, did not constitute a different drug). A concentration curve for drug dispensations during 2013/14 shows that one third of Manitobans did not receive a single prescription drug dispensation during that year. Using a definition for medically complex of 10 or more different drug dispensations, about 5% of individuals account for about 27% of all unique drug dispensations (i.e., not a repeat or refill of a drug already received).
different classes (polypharmacy), or seeing multiple specialists. Indicators of medical complexity for mental health included having one or more visits to a psychiatrist, having a major mental health diagnosis, or having a substance use disorder diagnosis. We present one indicator from each category here; the full details for all indicators are available in the Report Supplement.
30 UNIVERSITY OF MANITOBA, RADY FACULTY OF HEALTH SCIENCES
Section 5. Medical Complexity Fall 2017
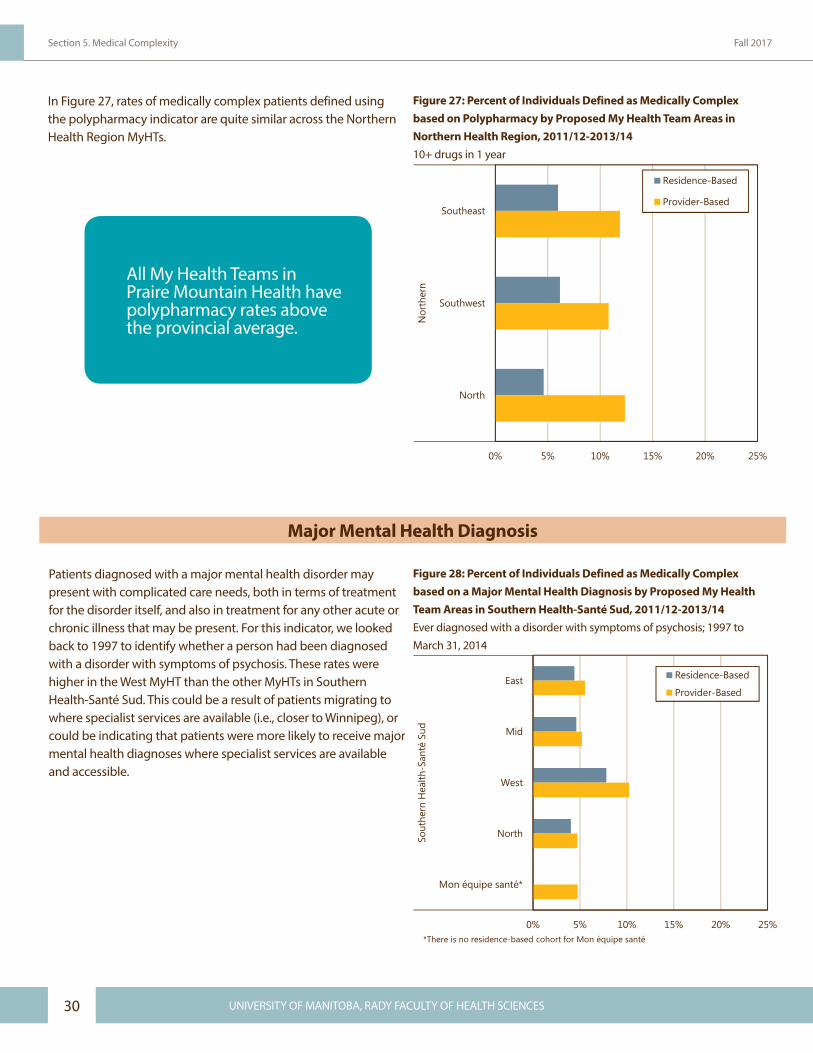
In Figure 27, rates of medically complex patients defined using the polypharmacy indicator are quite similar across the Northern Health Region MyHTs.
Major Mental Health Diagnosis
Patients diagnosed with a major mental health disorder may present with complicated care needs, both in terms of treatment for the disorder itself, and also in treatment for any other acute or chronic illness that may be present. For this indicator, we looked back to 1997 to identify whether a person had been diagnosed with a disorder with symptoms of psychosis. These rates were higher in the West MyHT than the other MyHTs in Southern Health-Santé Sud. This could be a result of patients migrating to where specialist services are available (i.e., closer to Winnipeg), or could be indicating that patients were more likely to receive major mental health diagnoses where specialist services are available and accessible.
0% 5% 10% 15% 20% 25%
Southeast
Southwest
North
Nor
ther
n
Residence-Based
Provider-Based
Figure 27: Percent of Individuals Defined as Medically Complex based on Polypharmacy by Proposed My Health Team Areas in Northern Health Region, 2011/12-2013/1410+ Drugs in 1 Year
Figure 27: Percent of Individuals Defined as Medically Complex based on Polypharmacy by Proposed My Health Team Areas in Northern Health Region, 2011/12-2013/1410+ drugs in 1 year
0% 5% 10% 15% 20% 25%
East
Mid
West
North
Mon équipe santé*
Sout
hern
Hea
lth-S
anté
Sud
Residence-Based
Provider-Based
*There is no residence-based cohort for Mon équipe santé
Figure 28: Percent of Individuals Defined as Medically Complex based on a Major Mental Health Diagnosis by Proposed My Health Team Areas in Southern Health-Santé Sud, 2011/12-2013/14Ever Diagnosed with a disorder with symptoms of psychosis; 1997 to March 31, 2014
Figure 28: Percent of Individuals Defined as Medically Complex based on a Major Mental Health Diagnosis by Proposed My Health Team Areas in Southern Health-Santé Sud, 2011/12-2013/14Ever diagnosed with a disorder with symptoms of psychosis; 1997 to March 31, 2014
All My Health Teams in Praire Mountain Health have polypharmacy rates above the provincial average.

umanitoba.ca/medicine/units/mchp/ 31
Describing Patient Populations for the My Health Team Initiative Manitoba Centre for Health Policy
Composite Indices of Medical Complexity
Factor analysis was used to create composite indices of medical complexity. Two scores were created from the factor analysis method: one that weighted the physical health indicators (RUBs, multiple specialists, and polypharmacy) highly, and one that weighted the mental health indicators (psychiatric specialist visits, substance use disorder diagnosis, and major mental health diagnosis) highly. Individuals could be defined as medically complex in both, one, or neither of these categories. The top 5% of all Manitobans on each of the composite scores were defined as medically complex based on physical health or mental health.
0% 5% 10% 15% 20% 25%
Southern Health-Santé Sud
Winnipeg
Prairie Mountain Health
Interlake-Eastern
Northern
Residence-Based
Provider-Based
Figure 29: Percent of Individuals Defined as Medically Complex based on Physical Health Composite Index by Manitoba Health Regions, 2011/12-2013-14
0% 5% 10% 15% 20% 25%
Southern Health-Santé Sud
Winnipeg
Prairie Mountain Health
Interlake-Eastern
Northern
Residence-BasedProvider-Based
Figure 30: Percent of Individuals Defined as Medically Complex based on Mental Health Composite Index by Manitoba Health Regions, 2011/12-2013-14
Figure 29: Percent of Individuals Defined as Medically Complex based on Physical Health Composite Index by Manitoba Health Regions, 2011/12-2013-14
Figure 30: Percent of Individuals Defined as Medically Complexbased on Mental Health Composite Index by Manitoba HealthRegions, 2011/12-2013-14
For the physical health medically complex individuals, the average number of different drug dispensations was 11.4, and 70% of the patients were in the RUB 4 or 5 categories (highest sickness level). For mental health medically complex patients, 34% had at least one substance use disorder diagnosis, and 63% had a major mental health diagnosis.
Figures 29 and 30 show the rates of physical health medically complex patients and mental health medically complex patients, respectively, for each health region.
32 UNIVERSITY OF MANITOBA, RADY FACULTY OF HEALTH SCIENCES
Section 5. Medical Complexity Fall 2017
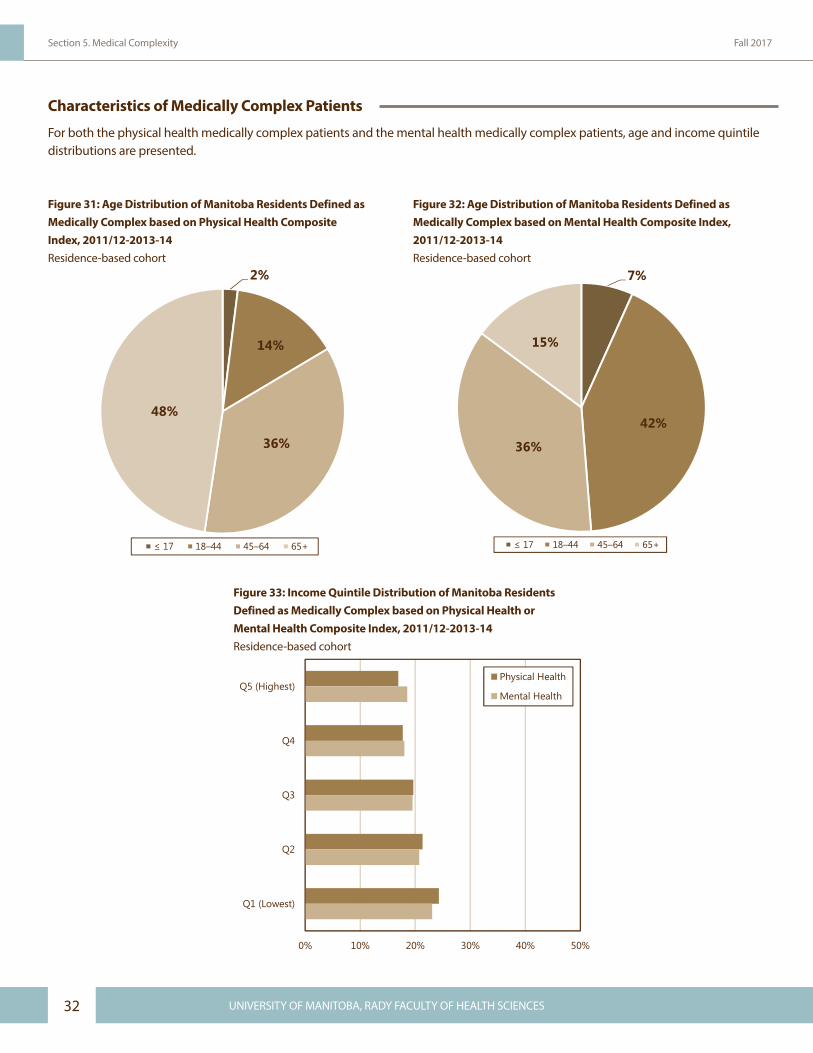
Characteristics of Medically Complex Patients
For both the physical health medically complex patients and the mental health medically complex patients, age and income quintile distributions are presented.
2%
14%
36%
48%
≤ 17 18–44 45–64 65+
Figure 31: Age Distribution of Manitoba Residents Defined as Medically Complex based on Physical Health Composite Index, 2011/12-2013-14
7%
42%
36%
15%
≤ 17 18–44 45–64 65+
Figure 32: Age Distribution of Manitoba Residents Defined as Medically Complex based on Mental Health Composite Index, 2011/12-2013-14
0% 10% 20% 30% 40% 50%
Q5 (Highest)
Q4
Q3
Q2
Q1 (Lowest)
Physical Health
Mental Health
Figure 33: Income Quintile Distribution of Manitoba Residents Defined as Medically Complex based on Physical Health or Mental Health Composite Index, 2011/12-2013-14Residence-based cohort
Figure 31: Age Distribution of Manitoba Residents Defined asMedically Complex based on Physical Health CompositeIndex, 2011/12-2013-14 Residence-based cohort
Figure 32: Age Distribution of Manitoba Residents Defined asMedically Complex based on Mental Health Composite Index,2011/12-2013-14 Residence-based cohort
Figure 33: Income Quintile Distribution of Manitoba ResidentsDefined as Medically Complex based on Physical Health orMental Health Composite Index, 2011/12-2013-14 Residence-based cohort

umanitoba.ca/medicine/units/mchp/ 33
Describing Patient Populations for the My Health Team Initiative Manitoba Centre for Health Policy
What did Medically Complex Patients Visit their Doctor for?
To answer this question, all visits to providers made by physical health medically complex patients and mental health medically complex patients were grouped separately. Figure 34 presents the visit rates for each group for the top ten diagnoses by ICD-9 chapter.
On average, Manitobans defined as medically complex for physical health conditions had just over 8 visits per year to primary care providers, with the highest numbers for circulatory conditions and musculoskeletal conditions. These are the same top two conditions as for the high users of health services. As you would expect, Manitobans defined as medically complex for mental health conditions had the highest proportion of visits for mental health conditions (1.35 visits, or 22%), followed by musculoskeletal conditions (0.65 visits, or 11%).
ICD-9 ChapterVisit Rate per
YearPercent of All Visits
Visit Rate per Year
Percent of All Visits
Circulatory 1.25 15% 0.47 8%
Musculoskeletal 1.03 12% 0.65 11%
Endocrine & Metabolic Diseases 0.86 10% 0.41 7%
Respiratory 0.77 9% 0.55 9%
Reported Symptoms 0.72 9% 0.53 9%
Mental Illnesses 0.61 7% 1.35 22%
Contact with Health System 0.55 7% 0.52 9%
Nervous 0.44 5% 0.27 5%
Genitourinary 0.39 5% 0.29 5%
Disorders of Skin 0.37 5% 0.23 4%
All Others 1.23 15% 0.79 13%
Total Visit Rate 8.24 - 6.06 -
Figure 34: Percent of Ambulatory Visits by International Classification of Diseases (ICD) Chapter for Manitoba Residents Defined as Medically Complex based on Physical Health or Mental Health Composite Index, 2011/12-2013-14
Physical Health Mental Health
Figure 34: Percent of Ambulatory Visits to Primary Care by International Classification of Diseases Version 9 (ICD-9) Chapter for Manitoba Residents Defined as Medically Complex based on Physical Health or Mental Health Composite Index, 2011/12-2013-14 Residence-based cohort

34 UNIVERSITY OF MANITOBA, RADY FACULTY OF HEALTH SCIENCES
Section 5. Medical Complexity Fall 2017
umanitoba.ca/medicine/units/mchp/ 35
Describing Patient Populations for the My Health Team Initiative Manitoba Centre for Health Policy
Section 6. Social Complexity
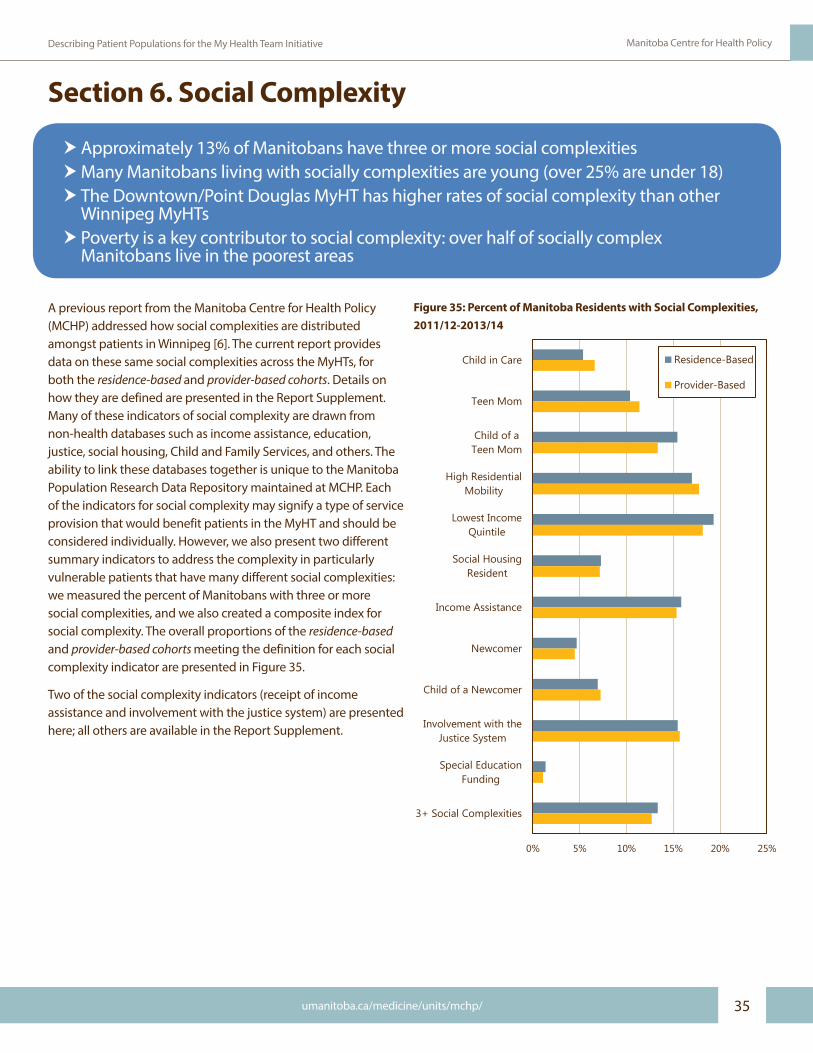
A previous report from the Manitoba Centre for Health Policy (MCHP) addressed how social complexities are distributed amongst patients in Winnipeg [6]. The current report provides data on these same social complexities across the MyHTs, for both the residence-based and provider-based cohorts. Details on how they are defined are presented in the Report Supplement. Many of these indicators of social complexity are drawn from non-health databases such as income assistance, education, justice, social housing, Child and Family Services, and others. The ability to link these databases together is unique to the Manitoba Population Research Data Repository maintained at MCHP. Each of the indicators for social complexity may signify a type of service provision that would benefit patients in the MyHT and should be considered individually. However, we also present two different summary indicators to address the complexity in particularly vulnerable patients that have many different social complexities: we measured the percent of Manitobans with three or more social complexities, and we also created a composite index for social complexity. The overall proportions of the residence-based and provider-based cohorts meeting the definition for each social complexity indicator are presented in Figure 35.
Two of the social complexity indicators (receipt of income assistance and involvement with the justice system) are presented here; all others are available in the Report Supplement.
hApproximately 13% of Manitobans have three or more social complexities hMany Manitobans living with socially complexities are young (over 25% are under 18) h The Downtown/Point Douglas MyHT has higher rates of social complexity than other
Winnipeg MyHTs h Poverty is a key contributor to social complexity: over half of socially complex
Manitobans live in the poorest areas
Figure 35: Percent of Manitoba Residents with Social Complexities,2011/12-2013/14
0% 5% 10% 15% 20% 25%
Child in Care
Teen Mom
Child of aTeen Mom
High ResidentialMobility
Lowest IncomeQuintile
Social HousingResident
Income Assistance
Newcomer
Child of a Newcomer
Involvement with theJustice System
Special EducationFunding
3+ Social Complexities
Residence-Based
Provider-Based
Figure 35: Percent of Manitoba Residents with Social Complexities, 2011/12-2013/14

36 UNIVERSITY OF MANITOBA, RADY FACULTY OF HEALTH SCIENCES
Section 6. Social Complexity Fall 2017
Receipt of Income Assistance
Using data from 1995 to 2014, all individuals in the study population who had ever received income assistance were identified. The percent of individuals who received income assistance by MyHT in Prairie Mountain Health is shown in Figure 36. At almost 25%, the North MyHT in Prairie Mountain Health had the highest rate of this indicator in the health region.
Involvement with the Justice System
Using data from 2005 to 2012, this indicator includes all individuals in the study population who had contact with the criminal justice system as a witness, a victim, or an accused person. As shown in Figure 37, rates in Interlake-Eastern RHA are highest in the North MyHT.
0% 10% 20% 30% 40% 50%
South
Brandon
Mid
North
Prai
rie M
ount
ain
Hea
lth
Residence-Based
Provider-Based
Figure 36: Percent of Individuals who have Ever Received Income Assistance by Proposed My Health Team Areas in Prairie Mountain Health, 2011/12-2013/14Income Assistance data years 1995 to March 31, 2014
0% 20% 40% 60% 80% 100%
East
South
Mid
West
North
Inte
rlake
-Eas
tern
Residence-Based
Provider-Based
Figure 37: Percent of Individuals who have been Involved with the Justice System by Proposed My Health Team Areas in Interlake-Eastern Regional Health Authority, 2011/12-2013/14Identified as a witness, victim, or accused; incidents occurring from 2005 to 2012
Figure 36: Percent of Individuals who have Ever Received IncomeAssistance by Proposed My Health Team Areas in Prairie MountainHealth, 2011/12-2013/14Income assistance data years 1995 to March 31, 2014
Figure 37: Percent of Individuals who have been Involved with the Justice System by Proposed My Health Team Areas in Interlake-Eastern Regional Health Authority, 2011/12-2013/14Identified as a witness, victim, or accused; incidents occurring from 2005 to 2012
Southern Health-Santé Sud has the lowest rates of income assistance in the province.
1 in 6 Manitobans have been involved with the justice system.

umanitoba.ca/medicine/units/mchp/ 37
Describing Patient Populations for the My Health Team Initiative Manitoba Centre for Health Policy
People with Three or More Social Complexities
For every individual in the study population, we counted the number of social complexities for which they met the definition. The rates of people with three or more social complexities in the Winnipeg MyHTs are displayed in Figure 38. The results are not surprising, with high rates in Downtown/Point Douglas. MyHT planning in this area may need to include services that address these social complexities by considering the circumstances of patients’ lives that may influence their need for care and the types of care required.
Composite Indices of Social Complexity
Factor analysis was used to create composite indices of social complexity. In this case, three separate factors emerged, but we analyzed only the first one of these. Six of the eleven social complexity indicators loaded highly on a single factor that represented socioeconomic vulnerability (income assistance, social housing resident, high residential mobility, child of a teen mom, involvement with the justice system, lowest income quintile, and teen mom). A second factor emerged that represented childhood vulnerabilities (child in care and special education funding). The last factor represented newcomer status (newcomer and child of a newcomer). Using the first factor from the factor analysis, the overall measure of socioeconomic vulnerability, we identified the most socioeconomically vulnerable Manitobans (top 5%) in the residence-based and provider-based cohorts. Their distributions across the health regions are presented in Figure 39.
0% 10% 20% 30% 40% 50%
River East / Transcona
St. Vital / St. Boniface
Fort Garry / River Heights
St. James / Assiniboine South
Seven Oaks / Inkster
Downtown / Point Douglas
Win
nipe
g
Residence-Based
Provider-Based
Figure 38: Percent of Individuals with 3+ Social Complexities by Proposed My Health Team Areas in Winnipeg Regional Health Authority, 2011/12-2013/14
0% 10% 20% 30% 40% 50%
Southern Health-Santé Sud
Winnipeg
Prairie Mountain Health
Interlake-Eastern
Northern
Residence-Based
Provider-Based
Figure 39: Percent of Individuals Defined as Socially Complex based on Composite Index by Manitoba Health Regions, 2011/12-2013-14
Figure 38: Percent of Individuals with 3+ Social Complexities byProposed My Health Team Areas in Winnipeg Regional HealthAuthority, 2011/12-2013/14
Figure 39: Percent of Individuals Defined as Socially Complex basedon Composite Index by Manitoba Health Regions, 2011/12-2013-14

38 UNIVERSITY OF MANITOBA, RADY FACULTY OF HEALTH SCIENCES
Section 6. Social Complexity Fall 2017
What are the Characteristics of Manitobans with Social Complexities?
Socially complex Manitobans are much younger than those identified as high users of health services or as medically complex. Over half are 18-44, with only 2% in the oldest age group (65+). Over a quarter are children or adolescents. Almost 60% of socially complex Manitobans are female, a disparity between sexes that is even larger than was seen for high users of health services or medically complex Manitobans.
Poverty plays a key role in social complexity, especially when we consider that two indicators are directly related to it: receipt of income assistance and residing in social housing. The income distribution across the five quintiles is very different from that seen for either high users or medically complex Manitobans, with half of all socially complex residents living in the lowest income quintile areas. Only 4% of socially complex patients are living in the highest income quintile areas.
27%
54%
17%
2%
≤ 17 18–44 45–64 65+
Figure 40: Age Distribution of Manitoba Residents Defined as Socially Complex based on Composite Index, 2011/12-2013-14
0% 10% 20% 30% 40% 50% 60%
Q1 (Lowest)
Q2
Q3
Q4
Q5 (Highest)
Figure 41: Income Quintile Distribution of Manitoba Residents Defined as Socially Complex based on Composite Index, 2011/12-2013-14Residence-based cohort
Figure 40: Age Distribution of Manitoba Residents Defined asSocially Complex based on Composite Index, 2011/12-2013-14 Residence-based cohort
Figure 41: Income Quintile Distribution of Manitoba Residents Defined as Socially Complex based on Composite Index, 2011/12-2013-14 Residence-based cohort

umanitoba.ca/medicine/units/mchp/ 39
Describing Patient Populations for the My Health Team Initiative Manitoba Centre for Health Policy
What did Socially Complex Patients Visit their Doctor for?
Figure 42 presents the visit rate for socially complex Manitobans for the top ten ICD-9 chapters, and also for all other chapters combined. On average, socially complex Manitobans made about 5.5 visits per year to primary care providers. We also present here the visit rates for a matched group of individuals not identified as socially complex. This comparison group had the same age
and sex distribution as the socially complex patients but were not identified in any of the social complexity indicators. Across the board, socially complex individuals had higher visits rates, as we might expect, which resulted in an average difference of approximately 2 visits per year. Dealing with these complexities directly may help prevent unnecessary visits and future health complications.
ICD-9 ChapterVisit Rate per Year
Percent of All Visits
Visit Rate per Year
Percent of All Visits
Mental Illnesses 0.83 15% 0.29 8%Respiratory 0.72 13% 0.48 14%Musculoskeletal 0.60 11% 0.29 8%Contact with Health System 0.59 11% 0.52 15%Reported Symptoms 0.49 9% 0.30 9%Endocrine & Metabolic Diseases 0.32 6% 0.17 5%Genitourinary 0.31 6% 0.23 7%Disorders of Skin 0.27 5% 0.22 6%Nervous 0.25 5% 0.20 6%Circulatory 0.23 4% 0.18 5%All Others 0.89 16% 0.59 17%
Total Visit Rate 5.50 - 3.48 -
*Definition of 'socially complex' is based on the composite index.
Figure 42: Percent of Ambulatory Visits by International Classification of Diseases (ICD) Chapter for Manitoba Residents who are or are not Defined as Socially Complex, 2011/12-2013-14
Socially Complex* Not Socially Complex
Figure 42: Percent of Ambulatory Visits to Primary Care by International Classification of Diseases Version 9 (ICD-9) Chapter for Manitoba Residents who are or are not Defined as Socially Complex, 2011/12-2013-14 Residence-based cohort

40 UNIVERSITY OF MANITOBA, RADY FACULTY OF HEALTH SCIENCES
Section 6. Social Complexity Fall 2017
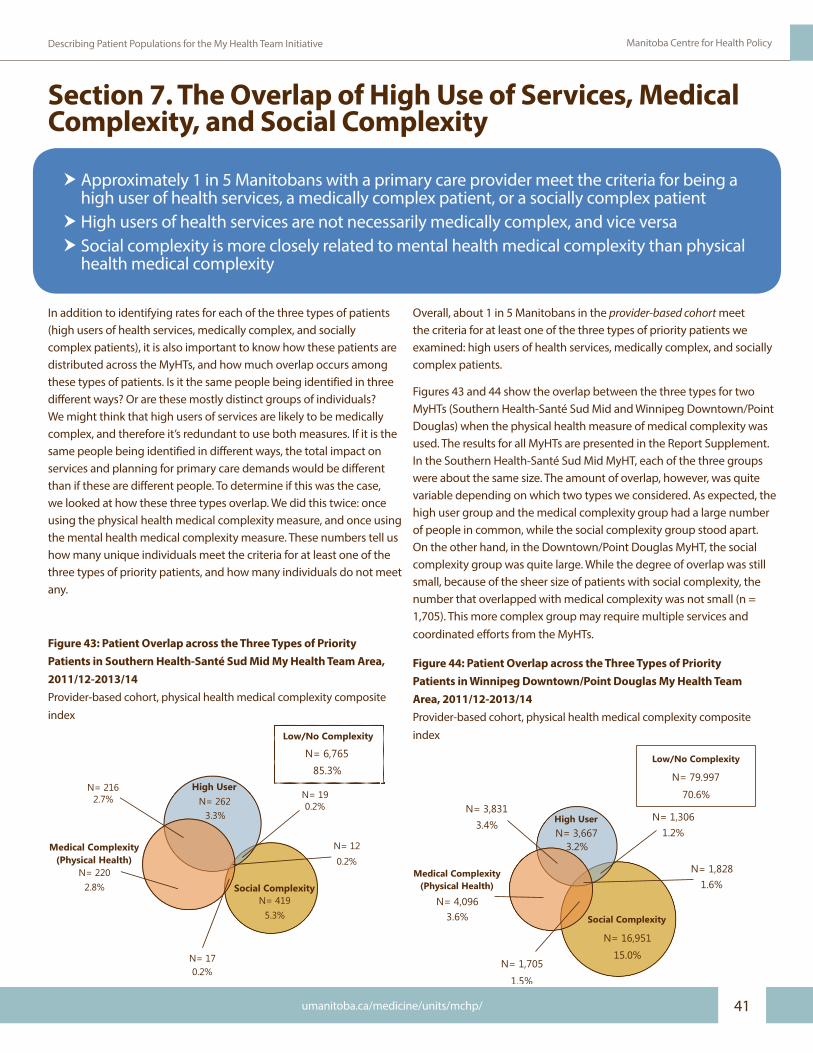
umanitoba.ca/medicine/units/mchp/ 41
Describing Patient Populations for the My Health Team Initiative Manitoba Centre for Health Policy
Figure 43: Patient Overlap across the Three Types of Priority Patients in Southern Health-Santé Sud Mid My Health Team Area, 2011/12-2013/14Provider-based cohort, physical health medical complexity composite index
Medical Complexity(Physical Health)
2.8%N= 220
Social ComplexityN= 419
5.3%
High UserN= 262
3.3%0.2%
N= 19N= 216
2.7%
Low/No Complexity
N= 6,76585.3%
N= 170.2%
N= 120.2%
Section 7. The Overlap of High Use of Services, Medical Complexity, and Social Complexity
In addition to identifying rates for each of the three types of patients (high users of health services, medically complex, and socially complex patients), it is also important to know how these patients are distributed across the MyHTs, and how much overlap occurs among these types of patients. Is it the same people being identified in three different ways? Or are these mostly distinct groups of individuals? We might think that high users of services are likely to be medically complex, and therefore it’s redundant to use both measures. If it is the same people being identified in different ways, the total impact on services and planning for primary care demands would be different than if these are different people. To determine if this was the case, we looked at how these three types overlap. We did this twice: once using the physical health medical complexity measure, and once using the mental health medical complexity measure. These numbers tell us how many unique individuals meet the criteria for at least one of the three types of priority patients, and how many individuals do not meet any.
h Approximately 1 in 5 Manitobans with a primary care provider meet the criteria for being a high user of health services, a medically complex patient, or a socially complex patient
h High users of health services are not necessarily medically complex, and vice versa h Social complexity is more closely related to mental health medical complexity than physical
health medical complexity
Figure 44: Patient Overlap across the Three Types of Priority Patients in Winnipeg Downtown/Point Douglas My Health Team Area, 2011/12-2013/14Provider-based cohort, physical health medical complexity composite index
Low/No Complexity
N= 79,997
70.6%
Medical Complexity(Physical Health)
3.6%N= 4,096
Social Complexity
N= 16,951
15.0%
High UserN= 3,667
3.2%1.2%
N= 1,306
N= 1,8281.6%
N= 3,8313.4%
N= 1,705
1.5%
Figure 43: Patient Overlap across the Three Types of Priority Patients in Southern Health-Santé Sud Mid My Health Team Area, 2011/12-2013/14Provider-based cohort, physical health medical complexity composite index
Figure 44: Patient Overlap across the Three Types of Priority Patients in Winnipeg Downtown/Point Douglas My Health Team Area, 2011/12-2013/14Provider-based cohort, physical health medical complexity composite index
Overall, about 1 in 5 Manitobans in the provider-based cohort meet the criteria for at least one of the three types of priority patients we examined: high users of health services, medically complex, and socially complex patients.
Figures 43 and 44 show the overlap between the three types for two MyHTs (Southern Health-Santé Sud Mid and Winnipeg Downtown/Point Douglas) when the physical health measure of medical complexity was used. The results for all MyHTs are presented in the Report Supplement. In the Southern Health-Santé Sud Mid MyHT, each of the three groups were about the same size. The amount of overlap, however, was quite variable depending on which two types we considered. As expected, the high user group and the medical complexity group had a large number of people in common, while the social complexity group stood apart. On the other hand, in the Downtown/Point Douglas MyHT, the social complexity group was quite large. While the degree of overlap was still small, because of the sheer size of patients with social complexity, the number that overlapped with medical complexity was not small (n = 1,705). This more complex group may require multiple services and coordinated efforts from the MyHTs.

42 UNIVERSITY OF MANITOBA, RADY FACULTY OF HEALTH SCIENCES
Section 7. The Overlap of High Use of Services, Medical Complexity, and Social Complexity Fall 2017
Figure 45: Patient Overlap across the Three Types of Priority Patients in Southern Health-Santé Sud Mid My Health Team Area, 2011/12-2013/14Provider-based cohort, mental health medical complexity composite index
Medical Complexity(Mental Health)
4.4%N= 349
Social Complexity
N= 395
5.0%
High User
N= 423
5.3% 0.3%N= 23
N= 550.7%
Low/No Complexity
N= 6,63683.7%
N= 41
0.5%
N= 80.1%
Figures 45 and 46 show the overlap between the three types of priority patients for the same MyHTs when the mental health measure of medical complexity is used. The results are a little different, in predictable ways. When examined this way, the overlap between patients with medical complexities and high use of services in the Southern Health-Santé Sud Mid MyHT is much smaller, while that between social complexity and medical complexity is larger. For the Downtown/Point Douglas MyHT, the number of patients that are medically complex and socially complex is almost twice as large (n = 3,344; 2.9%) as in the previous analysis (n=1,705; 1.5%). The number of patients that are both medically complex and high users is down by more than two thirds, from 3,831 (3.4%) to 1,205 (1.1%). This indicates that there is less overlap between complexity and high use for mental health issues than was seen for physical health issues.
By taking a look at multiple components of medical complexity, a different picture emerges of the patient populations in each of the MyHTs, and provides different and important information to consider when the teams are assembled. In particular, MyHT planners will need to consider what kinds of extra services might be most beneficial to the population at hand.
Figure 46: Patient Overlap across the Three Types of Priority Patients in Winnipeg Downtown/Point Douglas My Health Team Area, 2011/12-2013/14Provider-based cohort, mental health medical complexity composite index
Low/No Complexity
N= 75,920
67.0%
Medical Complexity(Mental Health)
7.2%N= 8,173
Social Complexity
N= 15,312
13.5%
High UserN= 6,293
5.6%1.8%
N= 2,030
N= 1,1041.0%
N= 1,2051.1%
N= 3,344
2.9%
Figure 45: Patient Overlap across the Three Types of Priority Patients in Southern Health-Santé Sud Mid My Health Team Area, 2011/12-2013/14Provider-based cohort, mental health medical complexity composite index
Figure 46: Patient Overlap across the Three Types of Priority Patients in Winnipeg Downtown/Point Douglas My Health Team Area, 2011/12-2013/14Provider-based cohort, mental health medical complexity composite index

umanitoba.ca/medicine/units/mchp/ 43
Describing Patient Populations for the My Health Team Initiative Manitoba Centre for Health Policy
Section 8. How can all of this Information be used?A lot of data were presented in this report and putting it together can be a tough task. However, there are highly relevant bits of information that can be immediately useful for planners, while the additional information could be incorporated in later plans.
The residence- and provider-based populations that are presented at the beginning of the report present two very different approaches to planning for the targeted MyHT patient populations. The immediate needs for the MyHTs are reflected in the provider-based numbers. These are the people who are seeing primary care providers and would be accessing the MyHT services in the near term. If MyHTs begin to capture the Manitobans residing in their geographic area, then the residence-based numbers will begin to play a larger role. This may mean that some MyHTs will require more services than they currently have, while others might see a relative decline in demand for services.
What may be a little more complex to incorporate is the information about Manitobans who are high users of services, medically complex, or socially complex. High users may benefit the most from coordinated care, but are certainly not the only patients who stand to gain from the implementation of MyHTs. There are distinct groups of Manitobans that are medically complex that are not (yet?) high users of services. Addressing their care needs might be a priority for MyHTs to prevent or delay them from becoming high users. In addition, the distinction between physical health medical complexity and mental health medical complexity highlights the different types of services that might be most beneficial for different patients.
Social complexities present a different challenge and a different opportunity for providing primary care. The interventions or referrals to team members that are available can have a big impact in ways that may not usually come to mind when thinking about primary care providers. The College of Family Physicians of Canada distributes the Poverty Tool, an intervention aimed at addressing the most impactful social determinant of health. The primary intervention is to ask all patients “Have you filled out and sent in your tax forms?”, and to ask patients about their lives and the circumstances under which they conduct their daily activities, not just about their physical or mental health [7]. The Manitoba College of Family Physicians has adapted the original tool and produced pamphlets and information to be used by physicians and patients to address many of the social determinants of health. Known as ‘Get your Benefits!’, the tool provides links to resources specifically designed for children, older adults, people with disabilities, people with addictions, people with mental health conditions, people living with food insecurity, people living in poor housing, newcomers, and First Nations individuals [8]. Other social determinants that we are able to measure in Manitoba (e.g., involvement with the justice system or Child and Family Services, residence in social housing, and teen parenthood) highlight the potential to benefit from coordination between primary care and other services, which can have a positive impact on patients’ lives and health. The MyHTs are a platform for this kind of coordination of care.
The data provided in this report will help in determining the immediate and future needs for specific MyHT areas. All of the data are available in greater detail in the Report Supplement.

44 UNIVERSITY OF MANITOBA, RADY FACULTY OF HEALTH SCIENCES
Section 8. How can all of this Information be used? Fall 2017

umanitoba.ca/medicine/units/mchp/ 45
Describing Patient Populations for the My Health Team Initiative Manitoba Centre for Health Policy
Reference List
[1] World Health Organization. The World Health Report 2008: Primary Health Care-Now More Than Ever. 2008. http://www.who.int/whr/2008/whr08_en.pdf. [Accessed: May 19, 2017]
[2] Manitoba Health. My Health Teams and Team-Based Care. 2017. http://www.gov.mb.ca/health/primarycare/public/myhts/teams.html. [Accessed: May 19, 2017]
[3] Health Intelligence Inc. and Associates. Provincial Clinical and Preventative Services Planning for Manitoba - Doing Things Differently and Better. January 2, 2017. https://www.gov.mb.ca/health/documents/pcpsp.pdf. [Accessed: Aug 16, 2017]
[4] Bodenheimer T, Ghorob A, Willard-Grace R, et al. The 10 building blocks of high-performing primary care. Ann Fam Med. 2014 Mar;12(2):166-71.
[5] van Walraven C, Oake N, Jennings A, et al. The association between continuity of care and outcomes: a systematic and critical review. J Eval Clin Pract. 2010 Oct;16(5):947-56.
[6] Katz A, Valdivia J, Chateau D, et al. A Comparison of Models of Primary Care Delivery in Winnipeg. 2016. http://mchp-appserv.cpe.umanitoba.ca/reference/Models%20of%20Primary%20Care_Web_final.pdf. [Accessed: May 19, 2017]
[7] Centre for Effective Practice. Poverty: A Clinical Tool for Primary Care Providers (MB). October, 2016. http://www.cfpc.ca/uploadedFiles/CPD/Poverty_flowMB%202016%20Oct%2028.pdf. [Accessed: May 19, 2017]
[8] Manitoba Health. The Get Your Benefits Project. 2017. http://gov.mb.ca/health/primarycare/providers/povertytool.html. [Accessed: May 19, 2017]
46 UNIVERSITY OF MANITOBA, RADY FACULTY OF HEALTH SCIENCES
Reference List Fall 2017

umanitoba.ca/medicine/units/mchp/ 47
Describing Patient Populations for the My Health Team Initiative Manitoba Centre for Health Policy
Appendix: Report Supplement ContentThe rates or proportions for the various indicators for each MyHT are available in downloadable Excel files. For each indicator, a list of the worksheets in the Excel file is provided. These files can be used to create figures or tables for visualization of the data. In the case that these data and/or the accompanying text are used in a presentation or publication, proper attribution of credit for the research should be included by making reference to this report.
The following supplementary data files are available:
My Health Team GeographiesMap of Proposed My Health Team Areas by Health Region in Manitoba Map of Proposed My Health Team Areas in Northern Health Region Map of Proposed My Health Team Areas in Interlake-Eastern Regional Health Authority Map of Proposed My Health Team Areas in Prairie Mountain Health Map of Proposed My Health Team Areas in Southern Health-Santé Sud Map of Proposed My Health Team Areas in Winnipeg Regional Health Authority File 1. Districts or Municipalities within Proposed My Health Team Areas in Manitoba
Patient Populations within the My Health Team BoundariesFile 2. Where Manitobans went for Primary Care File 3. Where Manitobans came from for Primary Care File 4. Proportion of Visits to Providers Outside the Allocated My Health Team File 5. Proportion of Visits to MyHT made by Patients Allocated to Another My Health Team File 6. Age Distributions of My Health Teams File 7. Sex Distributions of My Health Teams File 8. Income Distribution of My Health Teams File 9. Birth and Death Rates of My Health Teams File 10. Move-In and Move-Out Rates of My Health Teams File 11. Personal Care Home Resident Rates of My Health Teams
High Use of Health ServicesFile 12. Ambulatory Visits to Primary Care• Concentration Curve• Graph of Rates of High Users (10+ visits)• Table of Rates of High Users• Age Distribution of High Users• Sex Distribution of High Users• Income Quintile Distribution of High Users
File 13. Specialist Visits for Non-Psychiatric Care• Concentration Curve• Graph of Rates of High Users (5+ visits)• Table of Rates of High Users• Age Distribution of High Users• Sex Distribution of High Users• Income Quintile Distribution of High Users
File 14. Number of Hospitalizations• Concentration Curve• Graph of Rates of High Users (3+ hospitalizations)• Table of Rates of High Users• Age Distribution of High Users• Sex Distribution of High Users• Income Quintile Distribution of High Users
File 15. Number of Hospital Days• Concentration Curve• Graph of Rates of High Users (30+ hospital days)• Table of Rates of High Users• Age Distribution of High Users• Sex Distribution of High Users• Income Quintile Distribution of High Users
File 16. Overlap among the High Users of Services Indicators• Overlap among High Users of Services Indicators
(residence-based cohort)• Overlap among High Users of Services Indicators
(provider-based cohort)
File 17. High Users of Services Composite Index• Graph of Rates of High Users• Table of Rates of High Users• Age Distribution of High Users• Sex Distribution of High Users• Income Quintile Distribution of High Users
File 18. Proportion of Visits outside Allocated My Health Team for High Users of Services (Composite Index)

48 UNIVERSITY OF MANITOBA, RADY FACULTY OF HEALTH SCIENCES
Appendix: Report Supplement Content Fall 2017
Medical ComplexityFile 19. Polypharmacy • Concentration Curve• Graph of Rates of Medically Complex Patients (10+ Drugs)• Table of Rates of Medically Complex Patients• Age Distribution of Medically Complex Patients• Sex Distribution of Medically Complex Patients• Income Quintile Distribution of Medically Complex Patients
File 20. Major Mental Health Diagnosis• Graph of Rates of Medically Complex Patients (ever diagnosed
with a disorder with symptoms of psychosis)• Table of Rates of Medically Complex Patients• Age Distribution of Medically Complex Patients• Sex Distribution of Medically Complex Patients• Income Quintile Distribution of Medically Complex Patients
File 21. Substance Use Disorder• Graph of Rates of Medically Complex Patients (1+
hospitalization or 1+ physician visit with substance use disorder diagnosis)
• Table of Rates of Medically Complex Patients• Age Distribution of Medically Complex Patients• Sex Distribution of Medically Complex Patients• Income Quintile Distribution of Medically Complex Patients
File 22. Resource Utilization Bands (RUBs) • Graph of Rates of Medically Complex Patients (RUB 4 or 5)• Table of Rates of Medically Complex Patients• Age Distribution of Medically Complex Patients• Sex Distribution of Medically Complex Patients• Income Quintile Distribution of Medically Complex Patients
File 23. Multiple Specialists (Non-Psychiatric)• Graph of Rates of Medically Complex Patients (3+ specialists
in 1 year for those without cancer, 5+ specialists in 1 year for those with cancer)
• Table of Rates of Medically Complex Patients• Age Distribution of Medically Complex Patients• Sex Distribution of Medically Complex Patients• Income Quintile Distribution of Medically Complex Patients
File 24. Specialist Visit for Psychiatric Care• Graph of Rates of Medically Complex Patients (1+ visit)• Table of Rates of Medically Complex Patients• Age Distribution of Medically Complex Patients• Sex Distribution of Medically Complex Patients• Income Quintile Distribution of Medically Complex Patients
•
File 25. Overlap among Medical Complexity Indicators• Overlap among Medical Complexity Indicators
(residence-based cohort)• Overlap among Medical Complexity Indicators (provider-based
cohort)
File 26. Physical Health Medical Complexity Composite Index• Graph of Rates of Physical Health Medically Complex Patients• Table of Rates of Physical Health Medically Complex Patients• Age Distribution of Physical Health Medically Complex Patients• Sex Distribution of Physical Health Medically Complex Patients• Income Quintile Distribution of Physical Health Medically
Complex Patients
File 27. Mental Health Medical Complexity Composite Index• Graph of Rates of Mental Health Medically Complex Patients• Table of Rates of Mental Health Medically Complex Patients• Age Distribution of Mental Health Medically Complex Patients• Sex Distribution of Mental Health Medically Complex Patients• Income Quintile Distribution of Mental Health Medically
Complex Patients
File 28. Proportion of Visits outside Allocated My Health Team for Medically Complex Patients (Composite Index)• Visits to Providers outside Allocated My Health Team (physical
health medical complexity)• Visits to Providers outside Allocated My Health Team (mental
health medical complexity)
Social ComplexityFile 29. Child in Care• Graph of Rates of Socially Complex Patients (ever received care
from Child And Family Services)• Table of Rates of Socially Complex Patients
File 30. Teen Mom• Graph of Rates of Socially Complex Patients (ever a teen mom)• Table of Rates of Socially Complex Patients
File 31. Child of a Teen Mom• Graph of Rates of Socially Complex Patients (child of teen
mom)• Table of Rates of Socially Complex Patients
File 32. High Residential Mobility• Graph of Rates of Socially Complex Patients (3+ moves in 10
years)• Table of Rates of Socially Complex Patients

umanitoba.ca/medicine/units/mchp/ 49
Describing Patient Populations for the My Health Team Initiative Manitoba Centre for Health Policy
File 33. Lowest Income Quintile• Graph of Rates of Socially Complex Patients (live in lowest
income quintile neighbourhood)• Table of Rates of Socially Complex Patients
File 34. Social Housing Resident• Graph of Rates of Socially Complex Patients (lived in social
housing)• Table of Rates of Socially Complex Patients
File 35. Income Assistance• Graph of Rates of Socially Complex Patients (ever received
income assistance)• Table of Rates of Socially Complex Patients
File 36. Newcomer• Graph of Rates of Socially Complex Patients (newcomer)• Table of Rates of Socially Complex Patients
File 37. Child of a Newcomer• Graph of Rates of Socially Complex Patients (child of a
newcomer)• Table of Rates of Socially Complex Patients
File 38. Involvement with the Justice System• Graph of Rates of Socially Complex Patients (involved with
justice system as witness, victim, or accused)• Table of Rates of Socially Complex Patients
File 39. Special Education Funding• Graph of Rates of Socially Complex Patients (received special
education funding)• Table of Rates of Socially Complex Patients
File 40. Three or More Complexities• Graph of Rates (individuals identified as socially complex on
three or more indicators)• Table of Rates
File 41. Overlap Among Social Complexity Indicators• Overlap Among Social Complexity Indicators (residence-based
cohort)• Overlap Among Social Complexity Indicators (provider-based
cohort)
File 42. Social Complexity Composite Index• Graph of Rates of Socially Complex Patients• Table of Rates of Socially Complex Patients• Age Distribution of Socially Complex Patients• Sex Distribution of Socially Complex Patients• Income Quintile Distribution of Socially Complex Patients
File 43. Proportion of Visits outside Allocated My Health Team for Socially Complex Patients (Composite Index)
Overlap of High Use of Services, Medical Complexity, and Social ComplexityFile 44. Overlap of High Use of Services, Medical Complexity, and Social Complexity• Overlap across the Three Types of Patients based on Physical
Health Medical Complexity Composite Index (residence-based cohort)
• Overlap across the Three Types of Patients based on Physical Health Medical Complexity Composite Index (provider-based cohort)
• Overlap across the Three Types of Patients based on Mental Health Medical Complexity Composite Index (residence-based cohort)
• Overlap across the Three Types of Patients based on Mental Health Medical Complexity Composite Index (provider-based cohort)

50 UNIVERSITY OF MANITOBA, RADY FACULTY OF HEALTH SCIENCES
Fall 2017

umanitoba.ca/medicine/units/mchp/ 51
Describing Patient Populations for the My Health Team Initiative Manitoba Centre for Health Policy
Recent MCHP Publications
2017Variations in Resource Use and Costs of Hospital Care in Manitoba by Nathan Nickel, Greg Finlayson, Randy Fransoo, Roxana Dragan, Charles Burchill, Okechukwu Ekuma, Tamara Thomson, Leanne Rajotte, Joshua Ginter, Ruth-Ann Soodeen, and Susan Burchill
Factors Affecting Emergency Department Waiting Room Times in Winnipeg by Malcolm Doupe, Dan Chateau, Shelley Derksen, Joykrishna Sarkar, Ricardo Lobato de Faria, Trevor Strome, Ruth-Ann Soodeen, Scott McCulloch and Matt Dahl
2016The Mental Health of Manitoba’s Children by Mariette Chartier, Marni Brownell, Leonard MacWilliam, Jeff Valdivia, Yao Nie, Okechukwu Ekuma, Charles Burchill, Milton Hu, Leanne Rajotte and Christina Kulbaba
A Comparison of Models of Primary Care Delivery in Winnipeg by Alan Katz, Jeff Valdivia, Dan Chateau, Carole Taylor, Randy Walld, Scott McCulloch, Christian Becker and Joshua Ginter
Supportive Housing for Seniors: Reform Implications for Manitoba’s Older Adult Continuum of Care by Malcolm Doupe, Gregory Finlayson, Sazzadul Khan, Marina Yogendran, Jennifer Schultz, Chelsey McDougall and Christina Kulbaba
Cancer Data Linkage in Manitoba: Expanding the Infrastructure for Research by Lisa Lix, Mark Smith, Marshall Pitz, Rashid Ahmed, Harvey Quon, Jane Griffith, Donna Turner, Say Hong, Heather Prior, Ankona Banerjee, Ina Koseva and Christina Kulbaba
2015Care of Manitobans Living with Chronic Kidney Disease by Mariette Chartier, Allison Dart, Navdeep Tangri, Paul Komenda, Randy Walld, Bogdan Bogdanovic, Charles Burchill, Ina Koseva, Kari-Lynne McGowan and Leanne Rajotte
Long-Term Outcomes Of Manitoba’s Insight Mentoring Program: A Comparative Statistical Analysis by Chelsea Ruth, Marni Brownell, Jill Isbister, Leonard MacWilliam, Holly Gammon, Deepa Singal, Ruth-Ann Soodeen, Kari-Lynne McGowan, Christina Kulbaba and Eileen Boriskewich
Education Outcomes of Children in Care by Marni Brownell, Mariette Chartier, Wendy Au, Leonard MacWilliam, Jennifer Schultz, Wendy Guenette, Jeff Valdivia
The Cost of Smoking: A Manitoba Study by Patricia Martens, Nathan Nickel, Evelyn Forget, Lisa Lix, Donna Turner, Heather Prior, Randy Walld, Ruth-Ann Soodeen, Leanne Rajotte and Oke Ekuma
Evaluation of the Manitoba IMP℞OVE Program by Dan Chateau, Murray Enns, Oke Ekuma, Chelsey McDougall, Christina Kulbaba and Elisa Allegro
2014Physician Intergrated Network: A Second Look by Alan Katz, Dan Chateau, Bogdan Bogdanovic, Carole Taylor, Kari-Lynne McGowan, Leanne Rajotte and John Dziadek

52 UNIVERSITY OF MANITOBA, RADY FACULTY OF HEALTH SCIENCES
Fall 2017
2013The 2013 RHA Indicators Atlas by Randy Fransoo, Patricia Martens, The Need to Know Team, Heather Prior, Charles Burchill, Ina Koseva, Angela Bailly and Elisa Allegro
Who is in our Hospitals...and why? by Randy Fransoo, Patricia Martens, The Need to Know Team, Heather Prior, Charles Burchill, Ina Koseva and Leanne Rajotte
Social Housing in Manitoba: Part 1: Manitoba Social Housing in Data by Gregory Finlayson, Mark Smith, Charles Burchill, Dave Towns, William Peeler, Ruth-Ann Soodeen, Heather Prior, Shamima Hug and Wendy Guenette
Social Housing in Manitoba: Part 2: Social Housing and Health in Manitoba: A First Look by Mark Smith, Gregory Finlayson, Patricia Martens, Jim Dunn, Heather Prior, Carole Taylor, Ruth-Ann Soodeen, Charles Burchill, Wendy Guenette and Aynslie Hinds
Understanding the Health System Use of Ambulatory Care Patients by Alan Katz, Patricia Martens, Bogdan Bogdanovic, Ina Koseva, Chelsey McDougall and Eileen Boriskewich
2012A Systematic Investigation of Manitoba’s Provincial Laboratory Data by Lisa Lix, Mark Smith, Mahmoud Azimaee, Matthew Dahl, Patrick Nicol, Charles Burchill, Elaine Burland, Chun Yan Goh, Jennifer Schultz and Angela Bailly
Perinatal Services and Outcomes in Manitoba by Maureen Heaman, Dawn Kingston, Michael Helewa, Marni Brownlee, Shelley Derksen, Bodgan Bogdanovic, Kari–Lynne McGowan, and Angela Bailly
How Are Manitoba’s Children Doing? by Marni Brownell, Mariette Chartier, Rob Santos, Oke Ekuma, Wendy Au, Joykrishna Sarkar, Leonard MacWilliam, Elaine Burland, Ina Koseva, and Wendy Guenette
Projecting Personal Care Home Bed Equivalent Needs in Manitoba Through 2036 by Dan Chateau, Malcolm Doupe, Randy Walld, Ruth–Ann Soodeen, Carole Ouelette, and Leanne Rajotte
Health and Healthcare Utilization of Francophones in Manitoba by Mariette Chartier, Gregory Finlayson, Heather Prior, Kari–Lynne McGowan, Hui Chen, Janelle de Rocquigny, Randy Walld, and Michael Gousseau
The Early Development Instrument (EDI) in Manitoba: Linking Socioeconomic Adversity and Biological Vulnerability at Birth to Children’s Outcomes at Age 5 by Rob Santos, Marni Brownell, Oke Ekuma, Teresa Mayer, and Ruth–Ann Soodeen
The Epidemiology and Outcomes of Critical Illness in Manitoba by Alan Garland, Randy Fransoo, Kendiss Olafson, Clare Ramsey, Marina Yogendran, Dan Chateau, and Kari–Lynne McGowan

Manitoba Centre for Health PolicyUniversity of Manitoba, College of MedicineFaculty of Health Sciences408-727 McDermot AvenueWinnipeg, Manitoba R3E 3P5Tel: (204) 789-3819Fax: (204) 789-3910Email: [email protected]: umanitoba.ca/medicine/units/mchp