depositional model and distribution of marginal marine ... · panhandle nathan d. winters, ......
TRANSCRIPT
Depositional Model and Distribution of Marginal Marine
Sands in the Chase Group, Hugoton Gas Field, Southwest
Kansas and Oklahoma Panhandle
Nathan D. Winters, Martin K. Dubois, and Timothy R. Carr
Kansas Geological Survey at The University of Kansas1930 Constant Ave., Lawrence, KS 66047
Introduction
• The Hugoton Gas Field has produced 29 Tcf• Marginal marine sandstone facies recognized in
industry for year, but not well documented– Olson et al., 1997
• Noted that marine sandstone occur in the Chase Group and have not been published as a major reservoir facies.
• Other important reservoir lithofacies are dolomitized grainstone, carbonate packstone and grainstone.
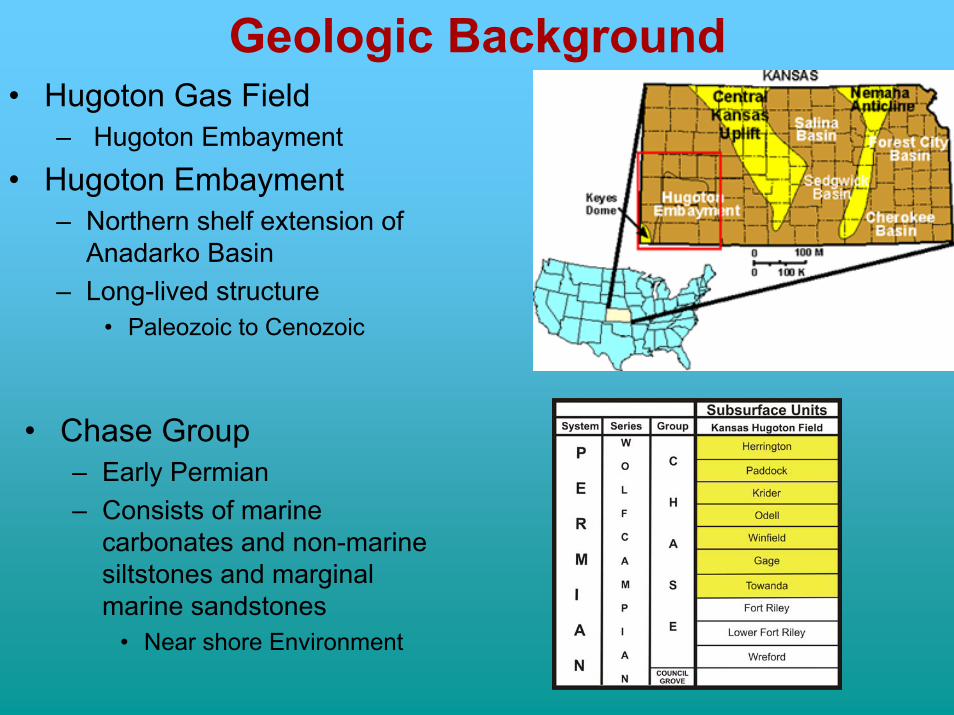
Geologic Background• Hugoton Gas Field
– Hugoton Embayment
• Hugoton Embayment – Northern shelf extension of
Anadarko Basin– Long-lived structure
• Paleozoic to Cenozoic
• Chase Group– Early Permian – Consists of marine
carbonates and non-marine siltstones and marginal marine sandstones
• Near shore Environment
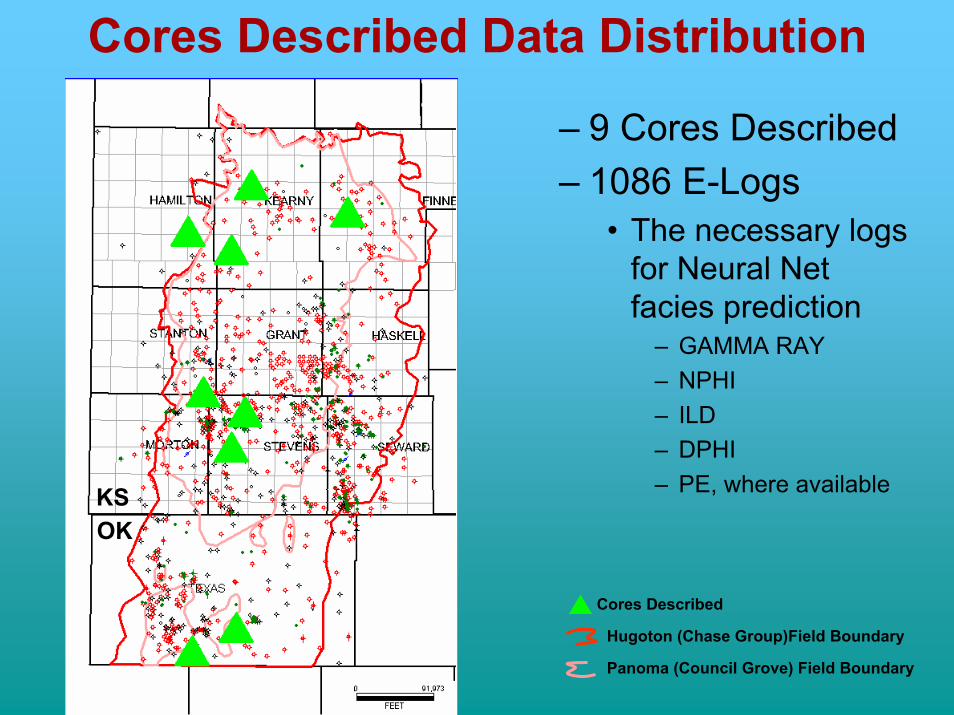
Cores Described Data Distribution
KSOK
– 9 Cores Described– 1086 E-Logs
• The necessary logs for Neural Net facies prediction
– GAMMA RAY– NPHI– ILD– DPHI– PE, where available
Cores Described
Hugoton (Chase Group)Field Boundary
Panoma (Council Grove) Field Boundary
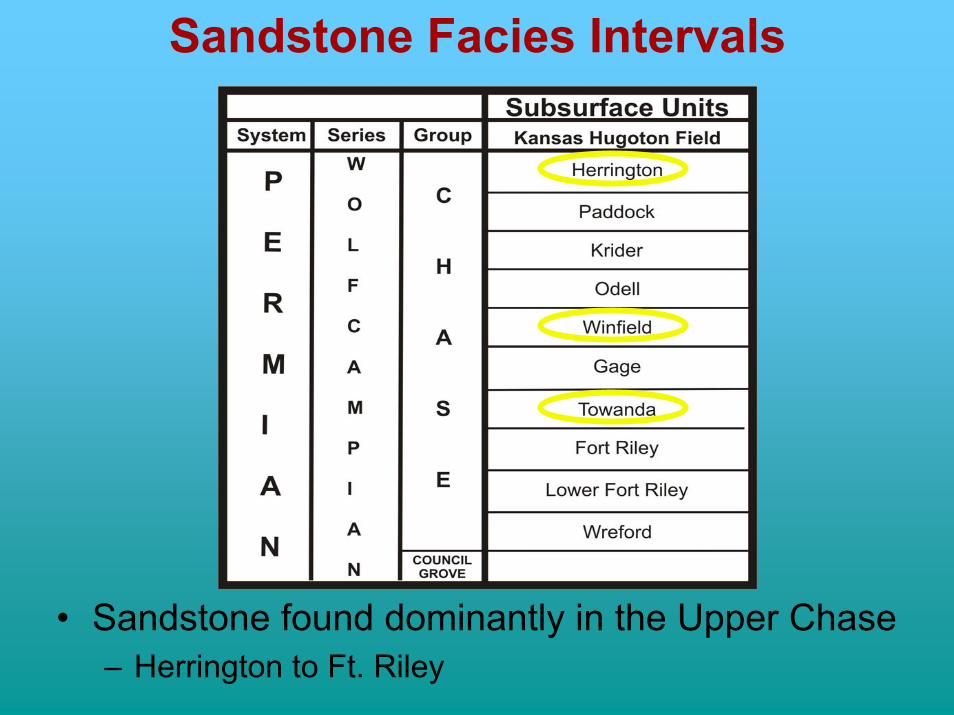
Sandstone Facies Intervals
• Sandstone found dominantly in the Upper Chase– Herrington to Ft. Riley

Approximate k and Φ by Lithofacies• Medium to coarse-grain moldic dolomite
– k ≈ 30-300md Φ ≈ 3-25%• Grainstone
– k ≈ 15-200md Φ ≈ 3-25%• Marginal Marine Sandstone
– k ≈ 10-150md Φ ≈ 15-25%• Packstone
– k ≈ 1-10md Φ ≈ 10-18%• Non-Marine Sandstone
– k ≈ 1-10md Φ ≈ 10-18%• Fine-grained moldic dolomite
– k ≈ 0.1-2md Φ ≈ 8-15%• Wackestone
– k ≈ 0.1-1md Φ ≈ 5-10%• Carbonate mudstone, Marine shale and silt, Non-Marine shaley Silt,
and Non-Marine Silt– k ≈ <0.1md Φ ≈ <8%
RESERVIOR
QUALITY
Sandstone Facies
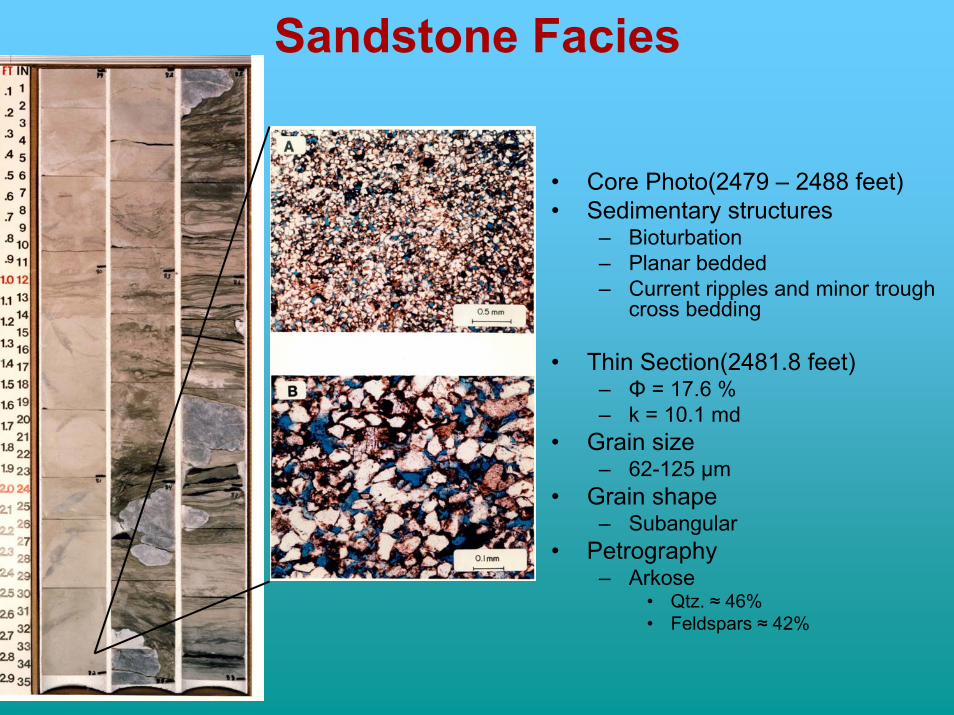
• Core Photo(2479 – 2488 feet)• Sedimentary structures
– Bioturbation– Planar bedded– Current ripples and minor trough
cross bedding
• Thin Section(2481.8 feet)– Φ = 17.6 %– k = 10.1 md
• Grain size– 62-125 µm
• Grain shape– Subangular
• Petrography– Arkose
• Qtz. ≈ 46%• Feldspars ≈ 42%
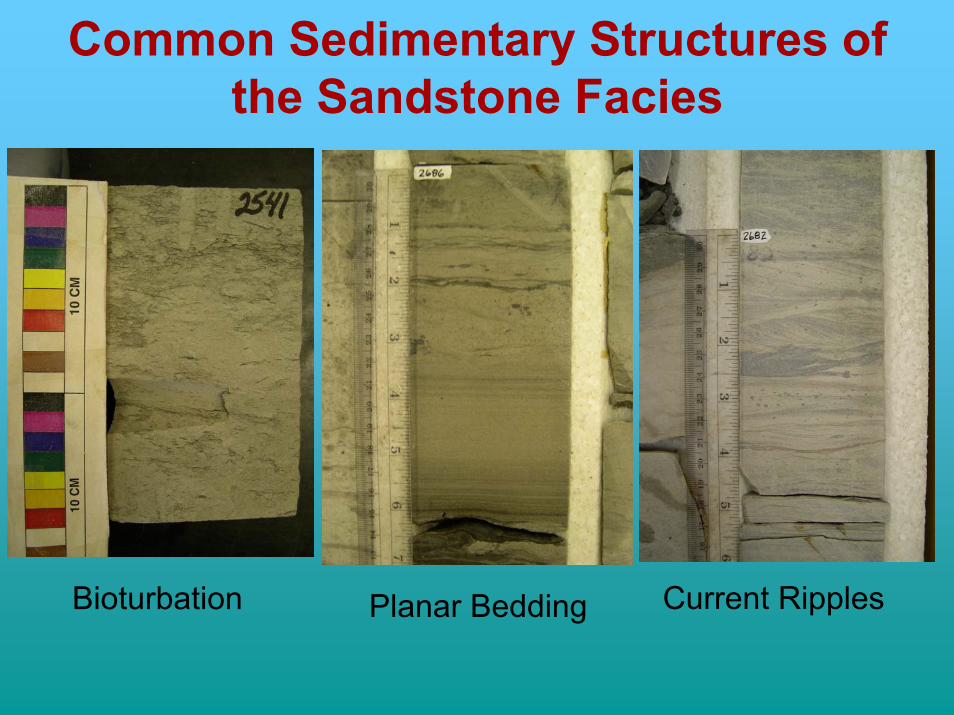
Common Sedimentary Structures of the Sandstone Facies
Current RipplesBioturbation Planar Bedding

Upper Chase Net Sand thickness
KSOK
• Net Sand thickness– 0(blue) to 85(red) feet
• Upper Chase– Ft. Riley to Herrington
• Position– Dominantly predicted
on the up dip margin of the field
– Parallels field boundary

Upper Chase Net to Gross Sand
KSOK
• Net to Gross Sandstone– 0%(blue) to 48%(red)
• Upper Chase– Ft. Riley to Herrington
• Position– Dominantly predicted
on the up dip margin of the field
– Parallels field boundary
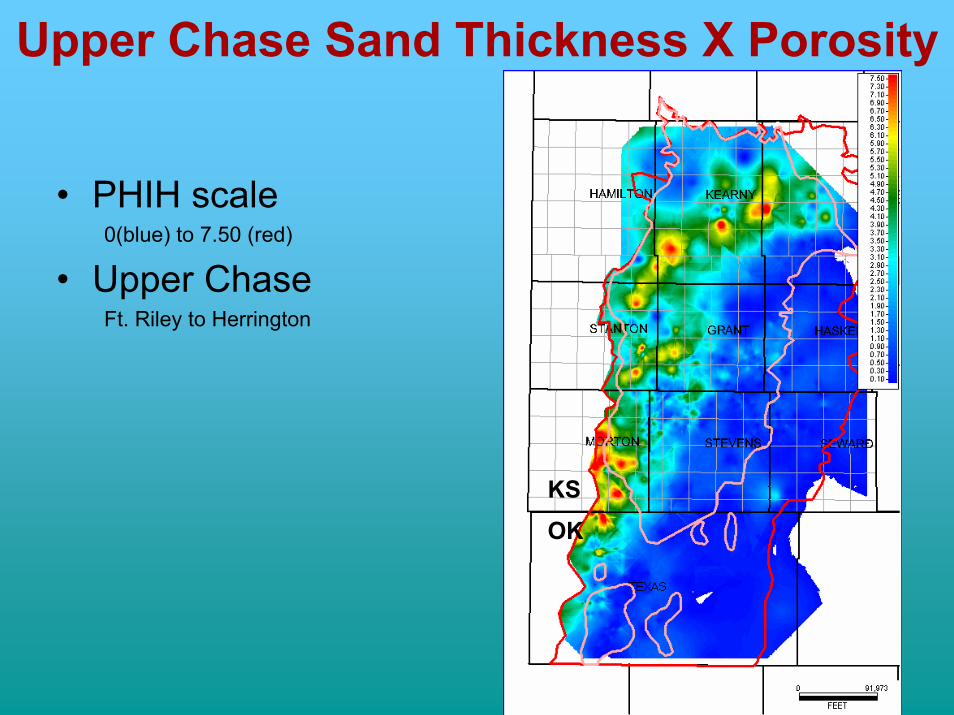
Upper Chase Sand Thickness X Porosity
• PHIH scale0(blue) to 7.50 (red)
• Upper ChaseFt. Riley to Herrington
KSOK

Upper Chase Cross Section
NW SE
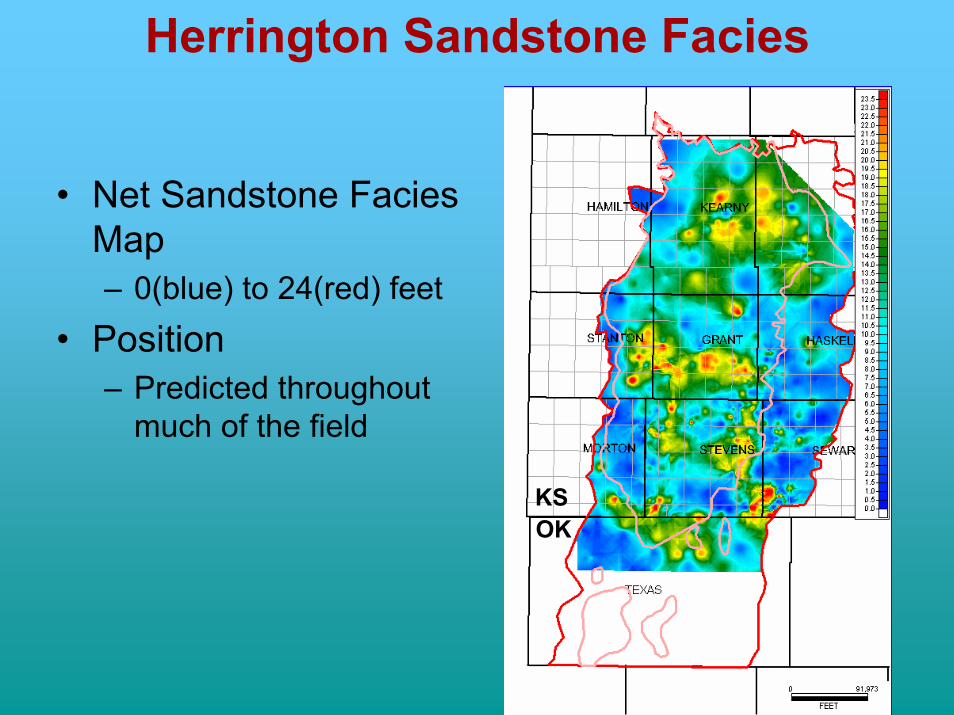
Herrington Sandstone Facies
KSOK
• Net Sandstone Facies Map– 0(blue) to 24(red) feet
• Position– Predicted throughout
much of the field
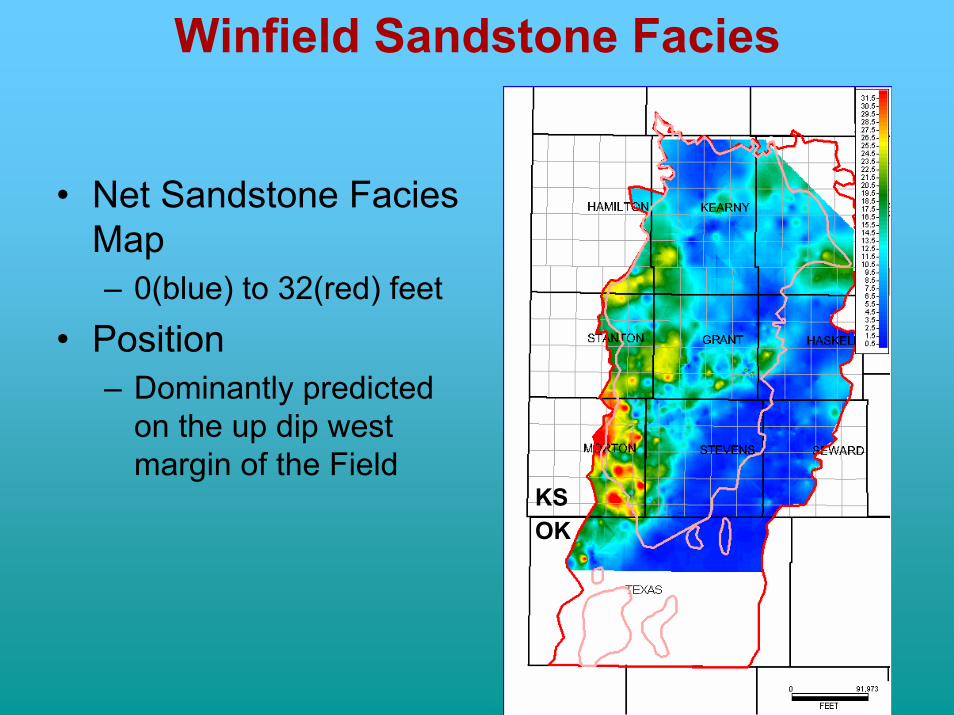
Winfield Sandstone Facies
KSOK
• Net Sandstone Facies Map– 0(blue) to 32(red) feet
• Position– Dominantly predicted
on the up dip west margin of the Field
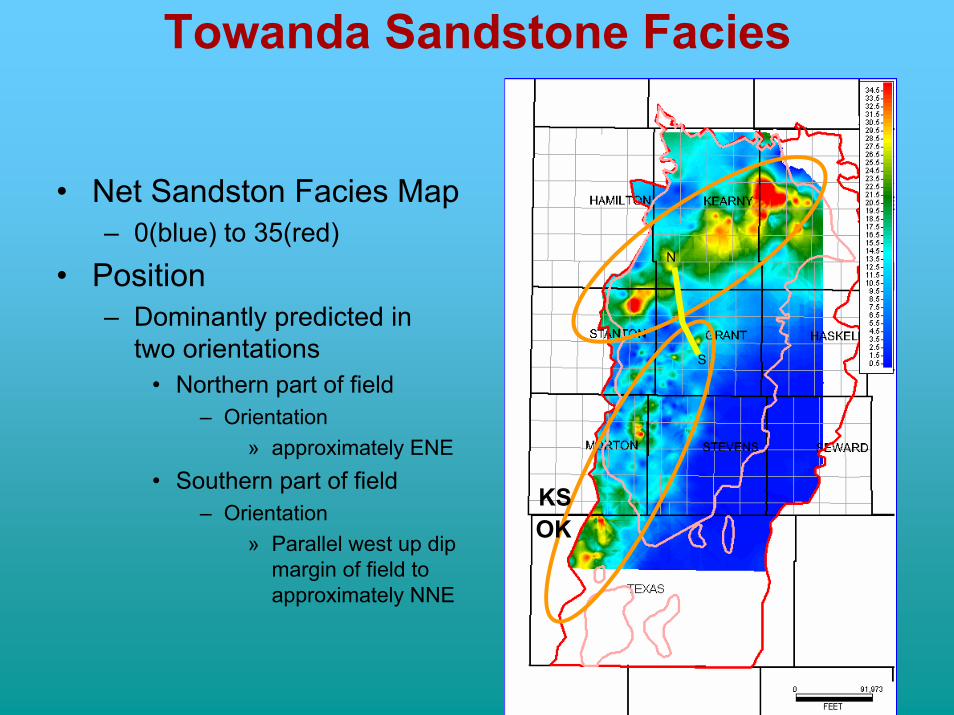
Towanda Sandstone Facies
N
S
OKKS
• Net Sandston Facies Map– 0(blue) to 35(red)
• Position– Dominantly predicted in
two orientations • Northern part of field
– Orientation» approximately ENE
• Southern part of field– Orientation
» Parallel west up dip margin of field to approximately NNE
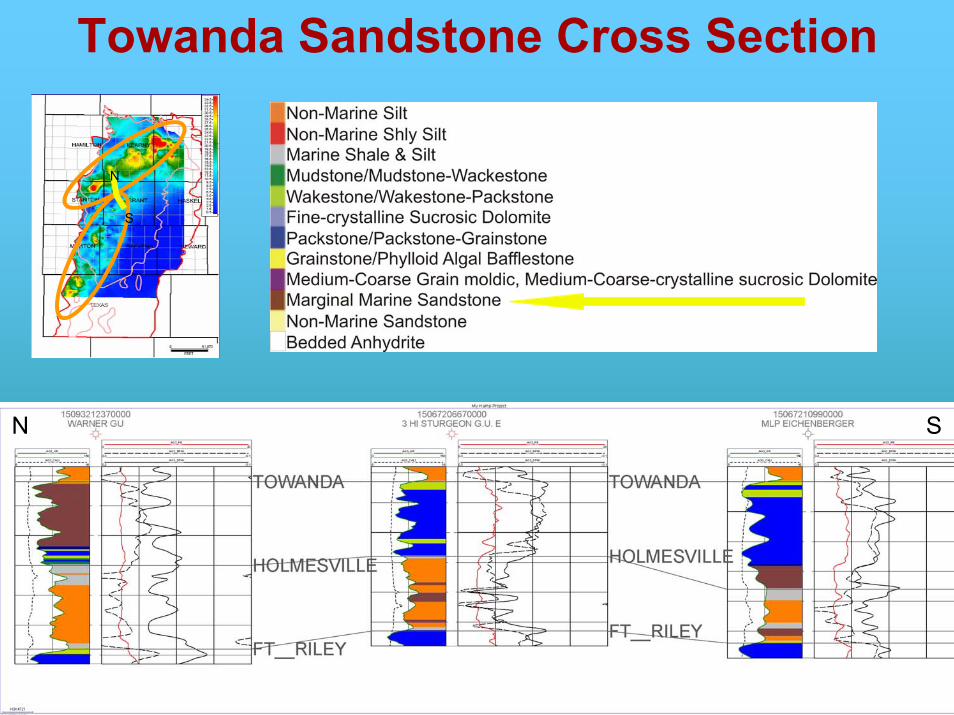
Towanda Sandstone Cross Section
N
S
N S
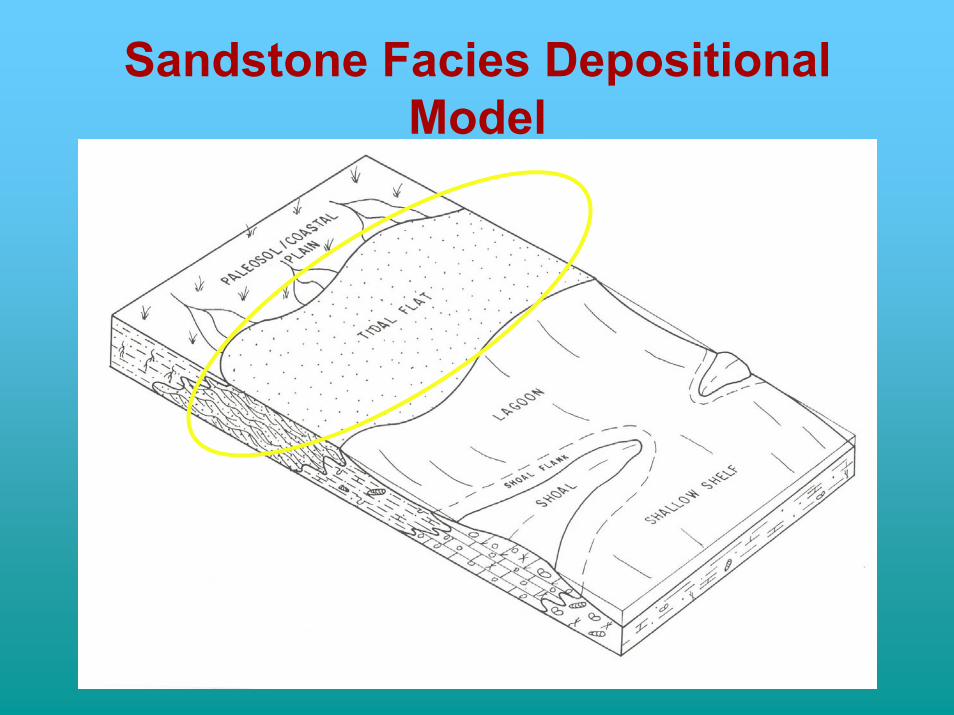
Sandstone Facies Depositional Model

Conclusions
• Upper Chase Group Sands• Dominantly predicted on the up dip west margin
• Found in three stratigraphic units– Herrington– Winfield– Towanda
• Good Reservoir Quality– k ≈ 10-150md Φ ≈ 15-25%
• Deposited in a tidal flat environment– Parallel to field boundaries
Acknowledgement
We thank our industry partners for their support of the Hugoton Asset Management Project and theirpermission to share the results of the study.
Anadarko Petroleum CorporationBP America Production Company
Cimarex Energy Co.ConocoPhillips Company
E.O.G. Resources Inc.Medicine Bow Energy Corporation
Osborn Heirs CompanyOXY USA, Inc.
Pioneer Natural Resources USA, Inc
and
GeoPLUS for the use PETRA