departmental data analysis 1 - letran calamba layout part 2... · departmental data analysis 1 ......
TRANSCRIPT
Departmental Data Analysis 1
Comparative Study on Student’s Refund for AY 2013-2016
NELLIE BETH B. GUNDRAN
Accounting Department
Background
As the Colegio embraces customer driven excellence as one of its
core values, maintaining harmonious relationship with customers is one
way to ensure customer satisfaction. The Accounting Department
established Quality Procedures and Process Maps, as well as Work
Instructions, in accordance to the Manual of Regulation for Private
Schools (MRPS), the standard that governs students refund for purposes
of computation.
As stated on the department’s QMS Manual level 3, student
refund is defined as the amount paid by the student in excess of his/her
total accountabilities during the term, the amount paid by the student
who withdraws enrollment prior to the official start of class and the
amount paid by a cash payee student who withdraws enrollment within
the allowable dropping period during the term.
In the current process, student refund shall be done upon filing
of written request for refund by the student’s parent or guardian of this
should be supported by photocopies of their two valid identification
cards.
Scope and Limitations
This study is a three-year comparative data analysis on the
student refund listing reports from the Basic Education Department and
collegiate schools.
Objectives
SUBIR VOLUME 1
This paper aimed to:
1. to categorize major causes of student refund request
2. to chart and describe the student refund trend
Presentation and Discussion of Data
Student Refund request may vary depending on the following
reasons i.e.
1. Dropping of subject/s
2. ESC/FAPE grants
a. The Educational Service Contracting scheme, or
ESC, is a program provided for by Republic Act
8545 (amending R.A. 6728), or the “Expanded
Government Assistance to Students and Teachers
in Private Education, or GASTPE. It provides
financial assistance to students’ tuition fees in
private high schools. It is geared towards reducing
the class size to manageable levels in high schools,
especially those experiencing shortage of
classrooms and teachers.
3. Check overpayment i.e.
a. SSS Check
b. Philippine Veterans (PVAO) Assistance
c. Company Educational Loan
4. Discounts i.e.,
a. Employees discount
b. Varsity discount
c. Alumni discount
d. Incentive discount
e. Academic discount and;
f. Sibling discount
5. External Organization Scholars i.e., Company Scholarship
Programs and the like
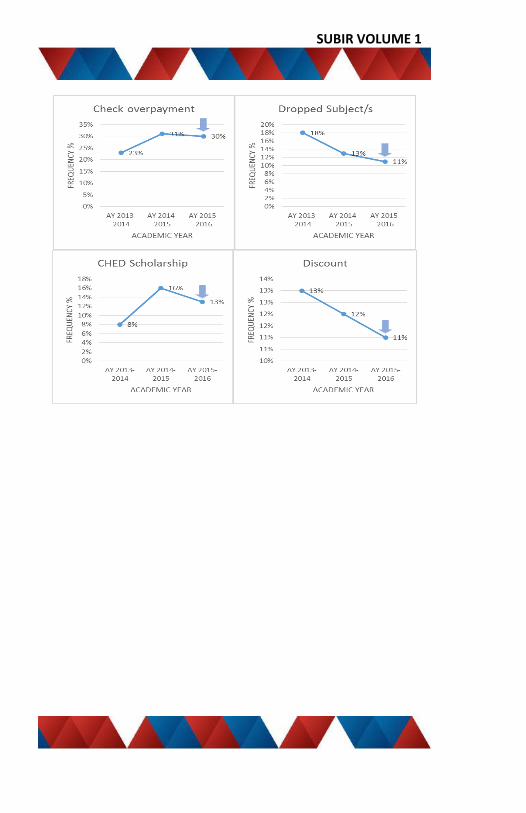
As illustrated by the chart below, refund requests from Basic
Education Department (BED) was caused by (1) Dropping* of Subjects i.e.,
All subjects, and (2) Discount** that should have been claimed, but have

Departmental Data Analysis 3
not been claimed. As per review, the main reason for such is late filing of
discounts.
Although the major causes mentioned above have been frequent
for the past three years, Figure 2 shows that, base on trend analysis, these
causes were noticed to be decreasing.
Figure 1. Weighted Ave Refund Request for Academic Year 2013-2016
Basic Education Department (BED)
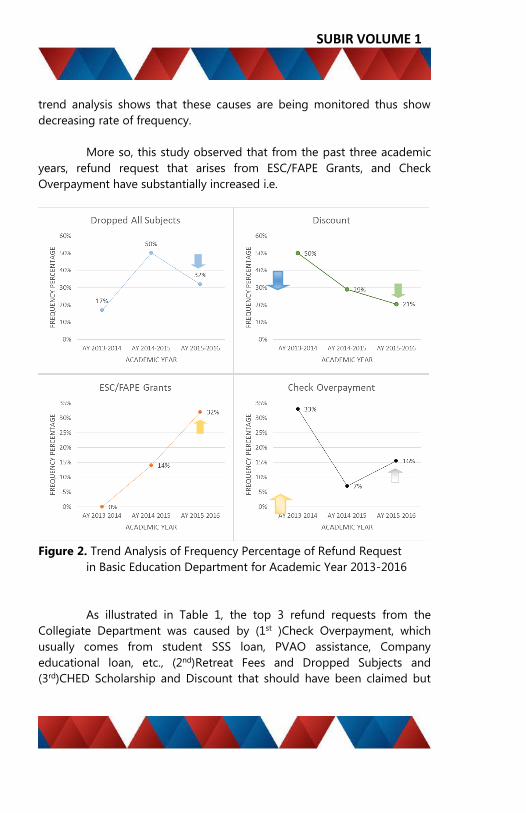
On one hand, this study observed that from the past three
academic years, (A) refund request that arises from (A1) dropping of all
subjects and; (A2) late filing of discount have substantially decreased i.e.
A1. Dropping of Subjects
a. From AY 2014-2015 of 50% to 32% AY 2015-2016
A2. Late Filing of Discount
a. From AY 2013-2014 of 50% to 29% AY 2014-2015 to 21% AY
2015-2016
As discussed on figure 1, the two major causes of refund request
are dropping of subjects and late filing of discount. However, the above
data as shown on figure 2, discussed that although these two major
causes cited in this study have been frequent for the past three years,
Causes
AY
2013-
2014
AY
2014-
2015
AY
2015-
2016
Weighted
Ave.
Dropped All
Subjects 17% 50% 32% 33%*
ESC/FAPE
Grants 0% 14% 32% 15%
Discount 50% 29% 21% 33%**
Check
Overpayment 33% 7% 16% 19%
Total 100% 100% 100% 100%
(1) Dropping of Subjects
(2) Discount**
SUBIR VOLUME 1
trend analysis shows that these causes are being monitored thus show
decreasing rate of frequency.
More so, this study observed that from the past three academic
years, refund request that arises from ESC/FAPE Grants, and Check
Overpayment have substantially increased i.e.
Figure 2. Trend Analysis of Frequency Percentage of Refund Request
in Basic Education Department for Academic Year 2013-2016
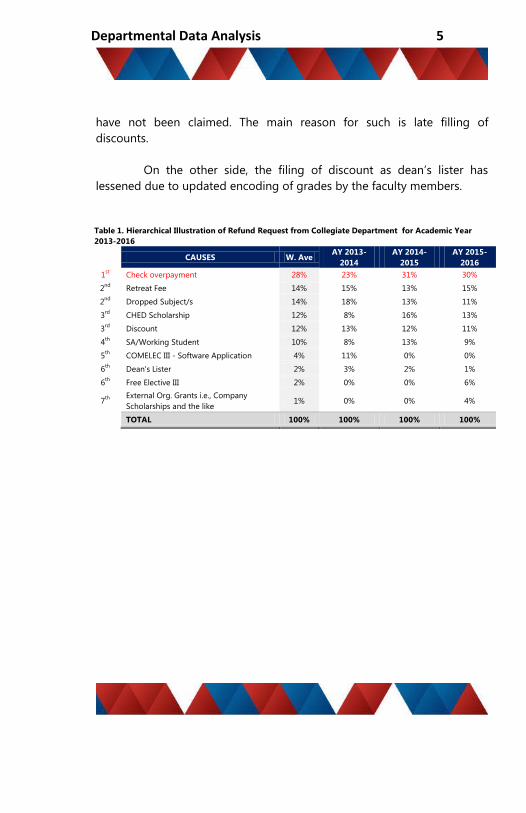
As illustrated in Table 1, the top 3 refund requests from the
Collegiate Department was caused by (1st )Check Overpayment, which
usually comes from student SSS loan, PVAO assistance, Company
educational loan, etc., (2nd)Retreat Fees and Dropped Subjects and
(3rd)CHED Scholarship and Discount that should have been claimed but
Departmental Data Analysis 5
have not been claimed. The main reason for such is late filling of
discounts.
On the other side, the filing of discount as dean’s lister has
lessened due to updated encoding of grades by the faculty members.
Table 1. Hierarchical Illustration of Refund Request from Collegiate Department for Academic Year
2013-2016
CAUSES W. Ave
AY 2013-
2014
AY 2014-
2015
AY 2015-
2016
1st Check overpayment 28% 23% 31% 30%
2nd
Retreat Fee 14% 15% 13% 15%
2nd
Dropped Subject/s 14% 18% 13% 11%
3rd
CHED Scholarship 12% 8% 16% 13%
3rd
Discount 12% 13% 12% 11%
4th
SA/Working Student 10% 8% 13% 9%
5th
COMELEC III - Software Application 4% 11% 0% 0%
6th
Dean's Lister 2% 3% 2% 1%
6th
Free Elective III 2% 0% 0% 6%
7th
External Org. Grants i.e., Company
Scholarships and the like 1% 0% 0% 4%
TOTAL 100% 100% 100% 100%
SUBIR VOLUME 1

Departmental Data Analysis 7

SUBIR VOLUME 1
Volume 1
Figure 3. Collegiate Department Refund Request for Academic Year 2013-
2016
Departmental Data Analysis 9
Conclusions
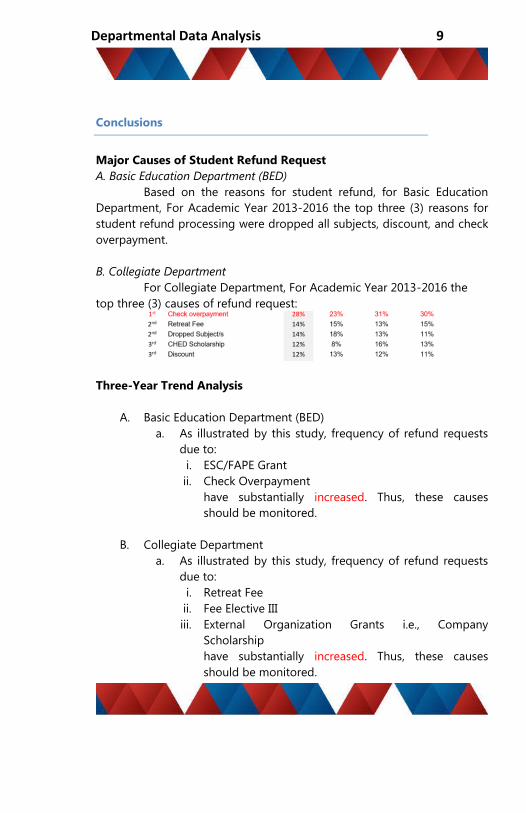
Major Causes of Student Refund Request
A. Basic Education Department (BED)
Based on the reasons for student refund, for Basic Education
Department, For Academic Year 2013-2016 the top three (3) reasons for
student refund processing were dropped all subjects, discount, and check
overpayment.
B. Collegiate Department
For Collegiate Department, For Academic Year 2013-2016 the
top three (3) causes of refund request:
Three-Year Trend Analysis
A. Basic Education Department (BED)
a. As illustrated by this study, frequency of refund requests
due to:
i. ESC/FAPE Grant
ii. Check Overpayment
have substantially increased. Thus, these causes
should be monitored.
B. Collegiate Department
a. As illustrated by this study, frequency of refund requests
due to:
i. Retreat Fee
ii. Fee Elective III
iii. External Organization Grants i.e., Company
Scholarship
have substantially increased. Thus, these causes
should be monitored.
SUBIR VOLUME 1
This study revealed that; one of the major reasons of refund
requests for both BED and Collegiate Department were discount that
should have been applied upon enrollment, but have not been processed,
Further review revealed that this was due to late filling of discounts.
Recommendations
A. Basic Education Department (BED)
1. This study suggests a further analysis discussing the reasons
behind the late filling of discounts. The policy has been amended
to address the issue, which states that ” Filing of discount is
within the enrollment period as specified by the Record’s
Office/Registrar’s Department, which means that it is from start
of enrollment until the first two weeks of classes”.
2. Further studies maybe conducted pertaining to the reasons for
dropping.
3. It is proposed that outright deduction of ESC/FAPE grants during
enrolment assessment for old student-grantee should be done.
B. Collegiate Department
1. The Accounting Department should collaborate with the Campus
Ministry Department to identify measures or procedures for
retreat fee charging during enrolment.
2. Detailed description of additional fee inclusion request by the
Academic Head, particularly on student/program that will be
affected by the request, should be forwarded ahead of time to
the Accounting Department
References Cited
Accounting Department Quality Procedures QMS Level 3
http://www.fape.org.ph/articles/view/24
http://www.gov.ph/2012/05/23/deped-ups-subsidy-for-students-in-private-
high-schools/
Departmental Data Analysis 11
Analysis of New College Students’ Source of Information
and Reasons For Applying In Letran Calamba
AILEEN KIARA V. GUARINA
Auxiliary Business Department
Background
The Auxiliary Business Department facilitates the marketing
strategies and activities of the Colegio. Throughout the academic year, the
department conducts continuous activities and produces marketing
materials that would help strengthen the visibility and image of Letran
Calamba.
One of these activities is the Career Orientation. It is a whole year
continuous activity that the Admissions and Scholarship Office (AdScO)
facilitates, wherein they visit different schools to introduce and encourage
students to enroll in Letran Calamba. Aside from this, the Colegio
constantly uses billboards, streamers, flyers or any print materials, as well
as, the social networking sites such as Facebook, Twitter, and its Website.
Moreover, through the efforts and participation of the employees,
students and alumni of the Letran Calamba in the Student Referral
Program, the Colegio aimed to reach a wide array of market. This program
is also an internal collaboration of ABD and AdScO as part of the
marketing activities for the enrollment in AY 2016-2017. New students
were given a discount of Php 1,000 upon his/her admission and at the
same time, the referrer (a person who referred the new student to enroll
at Letran) will be given a reward worth Php 1,000.
Likewise, upon admission of the newly enrolled students, they
were asked which among the activities and strategies employed by the
Colegio became their source of information and their reasons for
applying. This data analysis covered only the newly enrolled college
students for the 1st Semester of AY 2016-2017. Results of the data
gathered were summarized and analyzed to further assess the activities to
draw out implications for inputs in marketing plan.

SUBIR VOLUME 1
Objectives
This data analysis aimed to:
1. Summarize and chart the data on the sources of
information and reasons of the new college students for
applying in Letran
2. Draw out implications based on the results; and
3. Construct recommendations and create future action plan
Presentation and Discussion of Data
All new college students of AY 2016-2017 (1st Semester) were
asked their source of information and their reasons for applying in the
Colegio. The data was culled from the AdSco. The choices indicated in the
form are the following:
a. Billboards
b. Career Orientation/Talk
c. Employees of Letran
d. Faculty of Letran
e. Newspaper Ads
f. Other forms
g. Streamers
h. Students of Letran
Students were also asked to identify their reasons for choosing
to enroll in the Colegio. The data was culled from the above-mentioned
form. Below is the list of the choices:
a. Affordability
b. Alumnus
c. Availability of Program
d. Campus Environment
e. Competent Professors
f. Good Facilities
g. Prestigious School
h. Proximity
i. Recommended by

Departmental Data Analysis 13
Out of 161 applicants who answered the questionnaire, 145
enrolled in Letran Calamba for 1st Semester of AY 2016-2017.
Table 1. Percentage of Responses in Sources of Information
Table 2. Percentage of Responses in Reasons for Applying in Letran
Calamba
# Medium Percentage
1 Students of Letran 56.55%
2 Employees of Letran 11.03%
3 Faculty of Letran 6.90%
4 Career Orientation / Talk 6.21%
4 Others 6.21%
5 Newspaper Ads 5.52%
5 Billboard 5.52%
6 Streamers 2.07%
Total 100%
# Category Percentage
1 Quality Education 26.77%
2 Availability of Program 13.55%
3 Recommended by 12.26%
3 Good Facilities 12.26%
4 Campus Environment 9.68%
5 Prestigious School 8.39%
6 Affordability 7.42%
7 Proximity 3.87%
8 Alumnus 3.23%
9 Competent Professors 2.58%
Total 100%

SUBIR VOLUME 1
Conclusions and Recommendations
In line with the results of the data gathered, it primarily shows
that Letranites play a vital role in strengthening the visibility and image of
Letran into a wide array of market. It also certifies that the participation of
the students, employees and alumni in the Student Referral Program
during the enrolment period also added to the fulfillment to ABDs mission
for the Colegio.
Generally, results showed the efficacy of word-of-mouth
marketing, for 74.48% of the results is non-media. Its function
predominantly exclaims that Letranites are satisfied with the service given
by the Colegio (www.entrepreneur.com/encyclopedia/word-of-mouth-
advertising, retrieved on December 6, 2016). Their satisfaction,
recommendation and credibility as Letranites can persuade more students
to choose or enrol in Letran Calamba. Thus, the new college students’
main reason for choosing to enroll in the Colegio is because of its Quality
Education. Results validated that the Colegio is able to fulfil its mission to
its students.
Recommendation for marketing plan inputs:
1. Boost or Maximize the Use of Tri-Media - Based on the
results, the Colegio can invest more on the use of tri-media
marketing to strengthen its media marketing to reach wide
range of market. Letran Calamba could also make use of
other mediums aside from print such as television and radio
(traditional tri-media marketing). However, from time to
time, the traditional tri-media marketing (print, radio, and
television) become more expensive. Thus, the institution also
can make us of the new tri-media marketing, such as the
internet, mobile devices and digital place-based media
(http://www.mediamagnet.biz/the-new-tri-media-new-rules-
for-a-new-age, retrieved on December 6, 2016). With the
vast growth of technology and emergence of new trends in
the digital world, this is the most accessible, affordable, and
complex form of media.

Departmental Data Analysis 15
a. Internet - As people get to engage more on
cyberspace, a lot of entrepreneurs prefer to use
social media marketing because it’s free, user-friendly
and multi-functional, and most of the social networking
sites (such as Facebook, Instagram, and Twitter) are
designed for entrepreneurs for an easy business
transactions and marketing purposes
(http://www.webpagefx.com/internet-marketing/social
media-marketing-advantages-and-disadvantages.html,
retrieved by December 6, 2016).
In simple ways, the Colegio can make use
these social networking sites to strengthen its image
and visibility not just in the Laguna but also across the
country. Through creative content with a valuable
information, it can catch the attention of internet users.
Letran Calamba can make use of pictures, infographics
and videos that can be posted in all of its social media
accounts periodically.
b. Mobile Devices - Mobile devices is one of the
gadgets that users most of the time carry, especially at
the present time due to the fast innovation of smart
phones. Through this, everything is accessible for
everyone particularly for information dissemination. At
any moment, one person can receive a text message
and can instantly check it, which makes information free
flowing. Thus, most businesses such as banks,
telecommunications, and other companies also use of
this form of marketing. It can easily inform consumers
about their products and announcements in a manner
of time and wide range of receivers
(https://www.lifewire.com/advantages-and-
SUBIR VOLUME 1
disadvantages-of-mobile-marketing-2373124, retrieved
on December 6, 2016).
In line with the Career Orientation being done
by the AdScO, for every school that visit they, were able to
get each of the participants’ profile and contact number. The
Colegio employ direct marketing and periodically send a
text message to these students about promotions and
upcoming activities in the Colegio.
c. Digital-place based Media - As everything turns to be
digital, the Colegio can opt to invest in digital-place based
media for it is one of the emerging trends in marketing
(https://adexchanger.com/ad-exchange-news/digital-place-
based-advertising-primed-programmatic-growth/,) retrieved
by December 6, 2016). Over the upcoming years, malls and
other establishments will eventually outgrow in nearby areas
and cities such as Sta. Rosa and Biñan, which can be a good
location to put up advertisements.
2. Branding - Branding is one of the vital parts of a company or
any business establishment (https://www.entrepreneur.com
/article/77408, retrieved on December 7, 2016). It caters
what image it will portray to the eyes of its consumers or
target market. Other nearby schools and competitors were
able to establish their own branding such as Malayan
College, De La Salle University, San Sebastian College, FAITH,
and University of Perpetual Help. These schools were able
also to address their niche and best practices.
While Letran Calamba, is lacking in its branding and
students did not know what the Colegio known is for, Letran
does need identify its core strength as an academe to be
able to build a branding. The Colegio may coordinate with
its other campuses to create an image as one Letran
community. Perhaps, Letran can utilize the proposed
marketing plan of Dr. Nina G. San Miguel, a collaborative
marketing program of all the campuses of Letran that aimed
Departmental Data Analysis 17
to reach a larger array of market. With this program, Letran
may able to create a consistent branding with the other
campuses instead of being separate entities. Consistency in
branding is a must when it comes to marketing, for it will
help Letran to make its core identity
(http://www.wordstream.com/social-media-marketing,
retrieved on December 6, 2016).
3. Revision for the Application Form of AdSco
a. To include Internet as one of the sources of information
for Letran, since everyone can view its website
(www.letran-calamba.edu.ph) and Facebook account (I
am Letran)
b. In line with the students’ reasons for applying in Letran,
the inclusion of the Competence of the professors
contradicts the Quality of Education.
c. To analyze and review how to improve the question and
its choices given in the application form to be able to
gather better results.
4. Review and eye track the location of billboards and
streamers. This is to further assess the efficacy of these
locations such as its visibility, roads connected to the
location and if it provides valuable insights
(http://www.tobiipro.com/fields-of-use/marketing-
consumer-research/advertising/, retrieved on December 6,
2016)

SUBIR VOLUME 1
References Cited
www.entrepreneur.com/encyclopedia/word-of-mouth-advertising,
retrieved December 6, 2016
http://www.mediamagnet.biz/the-new-tri-media-new-rules-for-a-new-
age, retrieved by December 6, 2016
http://www.wordstream.com/social-media-marketing, retrieved by
December 6, 2016
https://www.lifewire.com/advantages-and-disadvantages-of-mobile-
marketing-2373124, retrieved by December 6, 2016
http://www.tobiipro.com/fields-of-use/marketing-consumer-
research/advertising/, retrieved by December 6, 2016
https://adexchanger.com/ad-exchange-news/digital-place-based-
advertising-primed-programmatic-growth/, retrieved by
December 6, 2016
https://www.entrepreneur.com/article/77408, retrieved by December 7,
2016

Departmental Data Analysis 19
Analysis of the Recognition Day Program
Evaluation Results AY 2015-2016
JORI LACE R. BASBAS AND ROSELYN A. PADILLA
Basic Education Department
Background
Every learner has strengths, abilities, and knowledge that should
be nurtured, encouraged, and celebrated. School activities and festivities,
which recognize students’ endeavor, are important in the academe to
motivate them to strive for excellence while learning inside the classroom.
Moreover, school affirmation in student performance supports their total
development and gives them a collaborative environment where they can
grow and be successful in their chosen field.
Awards given during recognition are designed to formally
recognize the outstanding performance and achievement of learners in
academics, leadership, and social responsibility, among other aspects of
student progress and development. These awards are given to encourage
learners to strive for excellence and to become proactive members of the
school and community.
With the Colegio’s endeavor to formally recognize the
outstanding performance of students, the Basic Education Department
(BED) annually holds a Recognition Ceremony for Nursery, Kindergarten
and Preparatory (NKP), Grade School, and High School students who
exemplify in the following measures: Academics, Christian Living
Education (CLE) and Character Education, Conduct, Math, Science, English,
Filipino, Computer, Arts, Sports, Service, and Attendance.
The following measures are described based on the Student
Handbook of Academic Year 2015-2016:
Academic Awards are given to those students who have no
grade below 87% in all subjects, including MAKABAYAN, no component

SUBIR VOLUME 1
grade of which is lower than 85% and must obtain a General Average of
90% and above for the particular grading period.
St. Lorenzo Ruiz Award is entitled to each grade level for a
catholic pupil who gets the highest rating in CLE and Character Education
and at least 86% in his/her conduct grade.
St. Vincent Liem dela Paz Award is entitled to each grade level
of award in Conduct.
Special Awards is given to any pupil who obtained the highest
grade in the areas of Mathematics, Science, English, Filipino, and
Computer.
Arts Award is given to students who fulfill the minimum
requirements in all subjects. S/he must have performed with distinction, as
an individual or as a member of a team capping any of the first three
places in any of the following: literature, speech, music, painting, and
sculpture as official participant of the class or school, district, regional, or
national competition. S/he must have participated with distinction as an
active member, performer, or director in school authorized drama, dance
production, or choral production as determined by the person-in-charge.
Sports Award is given to a student who meets the following
requirements:
S/he fulfils the minimum requirements prescribed in all his/her
subjects. S/he is a member of good standing in the varsity. S/he has not
been subjected to any disciplinary action regarding his/her participation in
any sports activity or competition during the academic year. As attested to
in writing by his/her coach, he/she must have performed with distinction
in a sport competition as an official participant of his/her class or school.
Service Award is given to any pupil for his/her
outstanding/distinct service rendered to the school with evident
accomplishments signed by his/her class adviser as: Barangayette or LSBO
Officer, Knights of the Altar, Mass Lector & Commentator, Class Monitor,
Peer Facilitator, Boy and Girl Scout, Class Officer, and The Page Publication
Staff.
Departmental Data Analysis 21
Attendance Award is given to any pupil who has never been
absent, late, nor cut the class during the current academic year in all-
curricular and co-curricular activities that require his/her presence
including the Field Trip, Intramurals, Recollection, Daily Morning Routine,
and Family Day Celebration.
Candidates for awards are screened based on the policy and
guidelines of the Colegio. Assessment and deliberation are conducted by
Teachers and Academic Chairs. Thus, results were discussed to the
Assistant Principal and approved by the Principal. The Basic Education
Recognition Ceremonies for AY 2015-2016 were held last March 18, 2016
for Nursery, Kinder, and Preparatory (NKP) and March 29, 2016 for Grade
School and High School.
Evaluation forms were distributed among the teachers and
Academic Chairs of the department. Feedbacks and improvements that
came from the evaluation results were helpful to let the facilitators
innovate and enhance the activities, which give importance to the effort of
our pupils such as the Recognition day.
Thus, matters which arise from this analysis pointed out areas
which needed to be given attention. It will also help in the decision
making process of the administrators and other department who will
facilitate such programs in the future.
Objectives
This paper aimed to:
1. Analyze the activity evaluation results;
2. Ascertain the observation about Recognition Day program
ceremonies; and
3. Provide recommendation and suggestions for improvement.
SUBIR VOLUME 1
Presentation and Discussion of Data
Recognition Ceremonies are spearheaded by Basic Education
Principal’s Office with the help of Academic Chairs and teachers as part of
the Recognition Committee. A total of 50 evaluation forms were given and
43 were retrieved. Table 1 summarizes the evaluation results.
Departmental Activity Evaluation Form (AR: 08-00-FO-21 rev 01
062215) was used for this data analysis. The form consists of quantitative
and qualitative areas. For the quantitative part, a five point scale was used
in answering each criterion with 5 as Excellent, 4 as Very Satisfactory, 3 as
Satisfactory, 2 as Fair, 1 as Needs Improvement and N/A for Not
Applicable.
Six criteria are rated with corresponding sub-criteria as follows:
The first criterion is (A) Quality of the event/presentation/activity which
includes (A.1) Objectives attained, (A.2) Relevance, and (A.3) Cost. Second
criterion is the (B) Participation with sub-criteria (B.1) Opportunity to gain
new information, (B.2) Engaging, and (B.3) Interactive. Third criterion is (C)
Non-technical Aspect with five sub-criteria (C.1) Registration Process, (C.2)
Audio Visual
Presentation, (C.3) Venue Set-up/Decor, (C.4) Sound System, (C.5)
Lighting. Fourth is (D) Time Management with two sub-criteria (D.1) Time
allotment, (D.2) Schedule and flow of session.
Fifth is (E) Meals with four sub-criteria (E.1) Quality, (E.2) Adequacy, (E.3)
Manner of Serving, and (E.4) Promptness of Serving and lastly, (F)
Resource Speaker
Most of the respondents rated each criterion with Excellent
(ranging from 16 to 35 out of 43 or 37%-81%). The lowest criterion rated
as excellent is the Resource Speaker, wherein mostly answered N/A or not
applicable because at that time, the Recognition only had an Emcee. The
highest criterion rated as excellent is Relevance, which indicates that
majority of the teachers and Chairs values the importance of the event.

Departmental Data Analysis 23
Table 1. Evaluation result for Recognition Program AY 2015-2016
The qualitative area of the survey was subjected to thematic
analysis. Three categories came significant in this analysis namely, (1)
Photo Documentation, (2) Logistics, and (3) Flow of the Program.
Observations, Weaknesses, and Strengths wore clustered per category.
5-
Excellent
4-Very
Satisfactory
3-
Satisfactory
2-
Fair
1-Needs
Improve-
ment
N/A- Not
Applicable
A. Quality of the
event/presentation/
activity
A.1 Objectives
attained
34
9
A.2 Relevance 35 8
A.3 Cost 27 9 1 6
B. Participation
B.1 Opportunity to
gain new
information
24
11
2
6
B.2 Engaging 25 16 2
B.3 Interactive 27 13 3
C. Non-technical Aspect
C.1 Registration
Process
20
9
1
13
C.2 Audio/Visual
Presentation
23 16 2 2
C.3 Venue Set-
up/Decor
29 12 1 1
C.4 Sound System 23 14 5 1
C.5 Lighting 23 16 1 3
D. Time Management
D.1 Time allotment
23
19
1
D.2 Schedule and flow
of session
24 19
E. Meals
E.1 Quality
23
12
4
4
E.2 Adequacy 23 11 4 5
E.3 Manner of Serving 22 12 4 5
E.4 Promptness of
Serving
22 12 4 5
F. Resource Speaker (if
applicable)
16 4 23
G. Overall Rating 29 14
SUBIR VOLUME 1
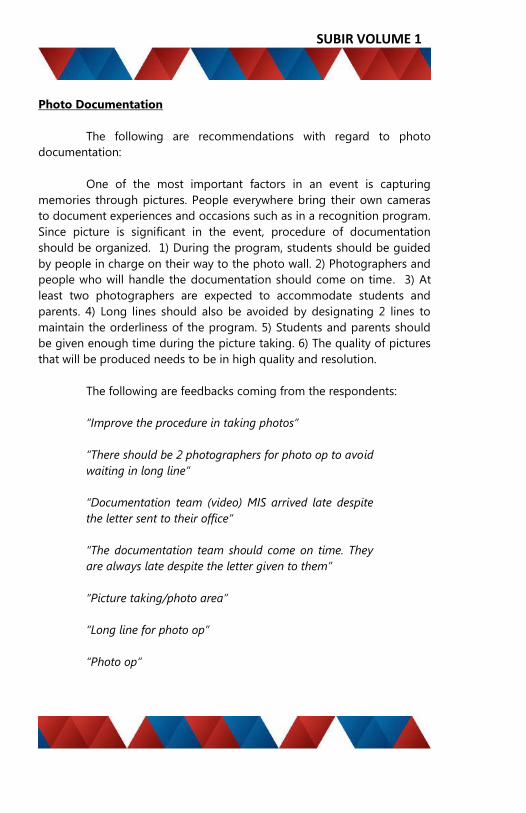
Photo Documentation
The following are recommendations with regard to photo
documentation:
One of the most important factors in an event is capturing
memories through pictures. People everywhere bring their own cameras
to document experiences and occasions such as in a recognition program.
Since picture is significant in the event, procedure of documentation
should be organized. 1) During the program, students should be guided
by people in charge on their way to the photo wall. 2) Photographers and
people who will handle the documentation should come on time. 3) At
least two photographers are expected to accommodate students and
parents. 4) Long lines should also be avoided by designating 2 lines to
maintain the orderliness of the program. 5) Students and parents should
be given enough time during the picture taking. 6) The quality of pictures
that will be produced needs to be in high quality and resolution.
The following are feedbacks coming from the respondents:
“Improve the procedure in taking photos”
“There should be 2 photographers for photo op to avoid
waiting in long line”
“Documentation team (video) MIS arrived late despite
the letter sent to their office”
“The documentation team should come on time. They
are always late despite the letter given to them”
“Picture taking/photo area”
“Long line for photo op”
“Photo op”

Departmental Data Analysis 25
Logistics
The following are recommendations with regard to logistics:
Materials needed for the program should be well coordinated
with the Budget Officer. The food should be requested in a buffet style
because diners opt to help themselves on the food being offered in a
designated table or area.
The quality of audio and sound system should be improved.
Sounds should be amplified to reach every corner of the venue and the
quality of sound produced must be clearly understood by the audience.
Budget for the purchase of additional or enhanced sound system should
be allocated for the next Recognition Program. Coordination with the MIS
and PMGSD should be established to be able to make necessary
preparations with regard to audio task.
The following are feedback coming from the respondents:
“Materials should be given on time”
“Buffet food for teachers”
“List of achievers (released by Records for the
program)”
“Microphone sounds”
“Sound system
Flow of the Program
The following are recommendations with regard to the flow of
the program:
Based on the evaluation results, it could be concluded that most
of the teachers were satisfied with the flow of the program. Although

SUBIR VOLUME 1
there were few negative comments such as long line for photo op, it can
be seen that the program was appreciated.
To take action on the comments, it is advisable to discuss the
results of the evaluation among the Basic Education Administrators. For
the next Basic Education Recognition, evaluation results of this data
analysis could be used to improve the program procedure.
The following are feedback coming from the respondents:
“Flow of program”
“Recognize the students’ works for the A.Y.”
“On time”
Conclusions
Based on the evaluation results, it could be concluded that most
of the teachers were satisfied with the flow of the program. Although
there were few negative comments, it can be seen that the program was
appreciated.
To take action on the comments, it is advisable to discuss the
results of the evaluation among the Basic Education Administrators. For
the next Basic Education Recognition, evaluation results of this data
analysis could be used to improve the program procedure. An action plan
is included for this data analysis.
References Cited
Grade School and High School Student Handbook A.Y. 2015-2016
AR:08-00-FO-21 rev 01 062215 Departmental Activity Evaluation Form.
http://www.deped.gov.ph/sites/default/files/order/2016/DO_s2016_036.pdf
Departmental Data Analysis 27
Paghayo Continuing Formation Program for Graduating
College Students of Colegio De San Juan De Letran Calamba
(Academic Years 2013-2014, 2014-2015, and 2015-2016)
ROMEO D. BANATLAO
Campus Ministry Department
Background
Letran Calamba, through the Campus Ministry Department,
facilitates the PAGHAYO annual retreat for graduating college students
held at Caleruega Retreat Center, Batulao, Nasugbu, Batangas. The three-
day retreat aims 1to prepare the students for their professional life in the
context of prayers, reflections, and community celebrations. Likewise, the
formation Program2 is a venue for commissioning and sending–off for
students to be preachers of faith, hope, and love to their future workplace.
Retreat can be the ideal venue to explore and address
fundamental life concerns and raise new approaches of profound
comprehension and commitment to new life’s directions.
Analyzing data will help the department to learn what the data
tell and will help obtain interpretation of the evaluations. The data will be
used for exploring the meaning of the programs and design concrete
actions for the improvement of the programs. Data are considered
summaries of thousand stories and personal experiences.
Objectives
1. To analyze the evaluation results of Paghayo Cantinuing
Formation Program from AY. 2013-2014 to 2014-2015, and 2015-
2016;
2. To identify the best practices of the program;
3. To verify if the set objectives of the program are met; and

SUBIR VOLUME 1
4. To craft action plans that would strengthen the areas for
improvement of the program.
Presentation and Discussion of Data
The Paghayo Continuing Formation Program is organized,
conceptualized, and implemented by the personnel of the Campus
Ministry Department in coordination with the different schools and as well
as the office of the chaplaincy of the Colegio. This Program is effective for
retreats offer a meaningful interplay between concepts and actual
experiences in life. The program is treated as a vital component of their
journey and towards personal growth.
The program is significant because it provides a shared context
for students to interact and share sacred stories and personal experiences
in a manner that bridges understanding, realizations, and dialogue.
Participants are convinced that a well-designed retreat will lead them to
personal growth.
Based on the evaluation results and the qualitative comments,
the program received a consistent excellent rating from academic years
2013-2014, 2014-2015, and 2015-2016.
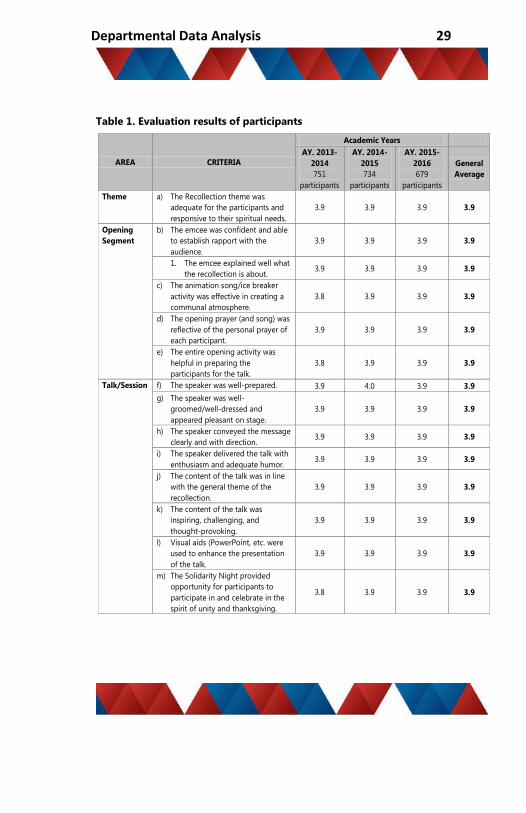
Departmental Data Analysis 29
Table 1. Evaluation results of participants
AREA CRITERIA
Academic Years
AY. 2013-
2014
751
participants
AY. 2014-
2015
734
participants
AY. 2015-
2016
679
participants
General
Average
Theme a) The Recollection theme was
adequate for the participants and
responsive to their spiritual needs.
3.9 3.9 3.9 3.9
Opening
Segment
b) The emcee was confident and able
to establish rapport with the
audience.
3.9 3.9 3.9 3.9
1. The emcee explained well what
the recollection is about. 3.9 3.9 3.9 3.9
c) The animation song/ice breaker
activity was effective in creating a
communal atmosphere.
3.8 3.9 3.9 3.9
d) The opening prayer (and song) was
reflective of the personal prayer of
each participant.
3.9 3.9 3.9 3.9
e) The entire opening activity was
helpful in preparing the
participants for the talk.
3.8 3.9 3.9 3.9
Talk/Session f) The speaker was well-prepared. 3.9 4.0 3.9 3.9
g) The speaker was well-
groomed/well-dressed and
appeared pleasant on stage.
3.9 3.9 3.9 3.9
h) The speaker conveyed the message
clearly and with direction. 3.9 3.9 3.9 3.9
i) The speaker delivered the talk with
enthusiasm and adequate humor. 3.9 3.9 3.9 3.9
j) The content of the talk was in line
with the general theme of the
recollection.
3.9 3.9 3.9 3.9
k) The content of the talk was
inspiring, challenging, and
thought-provoking.
3.9 3.9 3.9 3.9
l) Visual aids (PowerPoint, etc. were
used to enhance the presentation
of the talk.
3.9 3.9 3.9 3.9
m) The Solidarity Night provided
opportunity for participants to
participate in and celebrate in the
spirit of unity and thanksgiving.
3.8 3.9 3.9 3.9

SUBIR VOLUME 1
Legend: 0.5 – 1.4 STRONGLY DISAGREE
1.5 - 2.4 DISAGREE
2.5 - 3.4 AGREE
3.5 – 4.0 STRONGLY AGREE
Conclusions and Recommendations
The following data will ensure the constructive alignment of the
Programs objectives, major findings, conclusion, and recommendation.
AREA CRITERIA
Academic Years
AY. 2013-
2014
751
participants
AY. 2014-
2015
734
participants
AY. 2015-
2016
679
participants
General
Average
Confession
a) Sufficient information was given
regarding the Sacrament of
Reconciliation
3.9 3.9 3.9 3.9
b) Adequate time was given to prepare
for examination of conscience 3.9 3.9 3.9 3.9
c) The confessions were done in an
orderly manner. 3.9 3.9 3.9 3.9
d) The ambience during confession was
solemn and prayerful.
3.9
3.9 3.9 3.9
Holy Mass e) The Holy Mass was a fitting
culmination of the Recollection. 3.9 4.0 3.9 3.9
f) The Mass Presider was prepared and
gave a good homily. 3.9 3.9 3.9 3.9
g) Those who assisted at Mass as readers
and servers did their ministry well. 3.9 3.9 4.0 3.9
h) The Mass songs were appropriate and
inspiring. 3.9 3.9 4.0 3.9
Venue i) The venue was suitable for the activity. 3.9 3.9 3.9 3.9
j) The venue was comfortable. 3.9 3.9 3.9 3.9
k) The room/hall itself conveys a message
that a spiritual activity was going on. 3.9 3.9 3.9 3.9
l) The sound system was adequate. 3.9 3.8 3.9 3.9
m) The lighting was contributive to
creating a solemn ambiance.
3.8
3.9 3.9 3.9
n) The audio visual equipment were
functional. 3.8 3.8 3.8 3.8
The
Recollection
in General
o) The recollection was well-organized. 3.9 3.8 3.9 3.9
p) The Recollection Journal was an
adequate source of information and a
good material for reflection.
3.9 3.9 3.9 3.9
q) The recollection flowed smoothly. 3.8 3.9 3.8 3.9
r) All the activities during the recollection
were thematically linked. 3.9 3.9 3.9 3.9
s) Recollection was over-all a success. 3.9 3.9 3.9 3.9
GENERAL AVERAGE 3.9 3.9 3.9 3.9
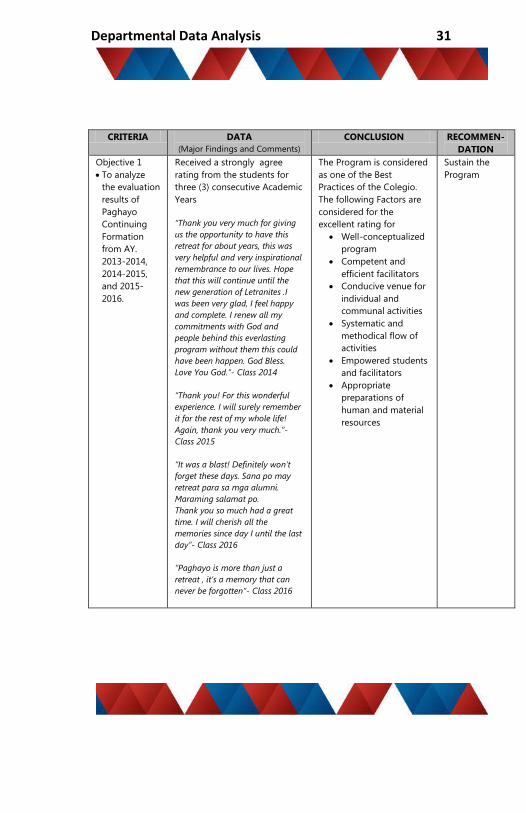
Departmental Data Analysis 31
CRITERIA DATA
(Major Findings and Comments)
CONCLUSION RECOMMEN-
DATION
Objective 1
To analyze
the evaluation
results of
Paghayo
Continuing
Formation
from AY.
2013-2014,
2014-2015,
and 2015-
2016.
Received a strongly agree
rating from the students for
three (3) consecutive Academic
Years
“Thank you very much for giving
us the opportunity to have this
retreat for about years, this was
very helpful and very inspirational
remembrance to our lives. Hope
that this will continue until the
new generation of Letranites .I
was been very glad, I feel happy
and complete. I renew all my
commitments with God and
people behind this everlasting
program without them this could
have been happen. God Bless.
Love You God.”- Class 2014
“Thank you! For this wonderful
experience. I will surely remember
it for the rest of my whole life!
Again, thank you very much.”-
Class 2015
“It was a blast! Definitely won’t
forget these days. Sana po may
retreat para sa mga alumni.
Maraming salamat po.
Thank you so much had a great
time. I will cherish all the
memories since day I until the last
day”- Class 2016
“Paghayo is more than just a
retreat , it’s a memory that can
never be forgotten”- Class 2016
The Program is considered
as one of the Best
Practices of the Colegio.
The following Factors are
considered for the
excellent rating for
Well-conceptualized
program
Competent and
efficient facilitators
Conducive venue for
individual and
communal activities
Systematic and
methodical flow of
activities
Empowered students
and facilitators
Appropriate
preparations of
human and material
resources
Sustain the
Program

SUBIR VOLUME 1
CRITERIA DATA
(Major Findings and Comments)
CONCLUSION RECOMMEN-
DATION
Objective 2
To identify
the best
practices of
the
program.
“Thank you for giving us a
memorable college life! God
bless! Please continue giving
Letranites this kind of
extraordinary experience that
will be remembered forever.”-
Class 2014
“I had a great time. I was able
to reflect and learn a lot.
Indeed, Paghayo 2015 is one
of the most memorable
experiences that I had during
my stay in Letran. This retreat
is so fun and I will forever
treasure this. Wonderful
experience. Good Job CMD!”-
Class 2015
“I will never forget those
special days I spent with my
friends, the facilitators, batch,
and the rest of the people who
are present on the retreat.
Thank you so much! So many
great memories to treasure
forever. Arriba Letran! I love
Paghayo 2016!”- Class 2016
The Paghayo
Continuing
Formation for
Graduating Students
is considered one of
the Best Practices of
the Colegio.
Sustain the
Program

Departmental Data Analysis 33
CRITERIA DATA
(Major Findings and Comments)
CONCLUSION RECOMMEN-
DATION
Objective 3
To verify if
the set
objectives of
the program
are met; and
“salamat po sa campus
ministry for serving or being
an instrument of God to the
letranites. Im so blessed and
grateful of being part of letran
community! All praises and
glory to him! Thank you very
much :) I will always miss
letran, my second family!”
Class 2014
“Thank you for giving us the
"One of the best 3 days ever.”-
Class 2015
“mas sobra akong napalapit
kay God kaya sobrang
sobrang salamat sa retreat na
ito hindi ko makakalimutan
to.”-Class 2016
“All lessons, values, and
experiences from Paghayo will
surely help me to define my
life as professionals.”- Class
2014
“Perfect experienced before I
moved out of Letran to a great
professional career.”-class
2016
“All the Recollections and
Retreats I have attended in
Letran are all worth-
remembering and uplifting”-
Class 2015
The Program is
considered as a
fitting preparation
for their professional
life and an
affirmation of their
mission as preachers
of faith, hope, and
love.
Sustain the
existing
Program
SUBIR VOLUME 1
CRITERIA DATA
(Major Findings and Comments)
CONCLUSION RECOMMEN-
DATION
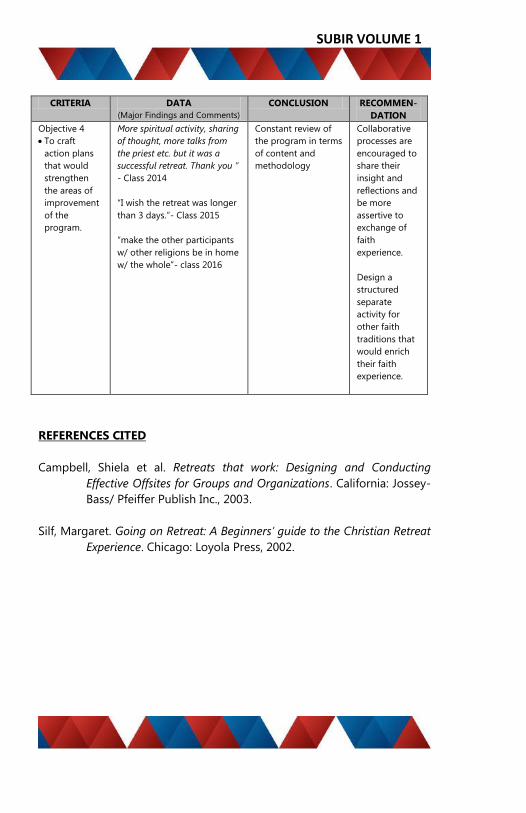
Objective 4
To craft
action plans
that would
strengthen
the areas of
improvement
of the
program.
More spiritual activity, sharing
of thought, more talks from
the priest etc. but it was a
successful retreat. Thank you ”
- Class 2014
“I wish the retreat was longer
than 3 days.”- Class 2015
“make the other participants
w/ other religions be in home
w/ the whole”- class 2016
Constant review of
the program in terms
of content and
methodology
Collaborative
processes are
encouraged to
share their
insight and
reflections and
be more
assertive to
exchange of
faith
experience.
Design a
structured
separate
activity for
other faith
traditions that
would enrich
their faith
experience.
REFERENCES CITED
Campbell, Shiela et al. Retreats that work: Designing and Conducting
Effective Offsites for Groups and Organizations. California: Jossey-
Bass/ Pfeiffer Publish Inc., 2003.
Silf, Margaret. Going on Retreat: A Beginners’ guide to the Christian Retreat
Experience. Chicago: Loyola Press, 2002.
Departmental Data Analysis 35
Training Needs Assessment for Library Services Personnel
Academic Year 2016-2017
MARIANNE G. GONZALES
Human Resource Department
Background
For a training and development to be effective, knowing what is
required – for the individual, the department, and the organization as a
whole, is a relevant requirement. Training Needs Assessment (TNA) is a
process of identifying training needs in an organization for the purpose of
improving employee job performance. In today’s changing workplace,
effective TNA is predominantly essential as new technologies and flexible
working practices are becoming widespread, leading to corresponding
changes in the skills and abilities needed.
Today’s work environment entails personnel to be skilled in
performing complex tasks in an efficient and cost-effective manner.
Librarians and library services personnel must re-assess their roles and
responsibilities as the electronic information era further direct the course
of libraries, archives, and information and media center. They have to
completely accept the fact that there is a need to realign their
competencies with the requirements of the electronic age (Fernandez and
Buenrostro Jr., 2015).
This Training Needs Assessment (TNA) was conducted to identify
competencies and training needs of the Library Services Personnel for the
purpose of enhancing employee job performance. Accordingly,
conducting training needs assessment for library staff is also one of the
suggested areas for improvement of the PACUCOA. The result of the
training needs assessment will be used as basis for crafting the Personnel
Development Plan (PDP) of the Library Services Department.

SUBIR VOLUME 1
Objectives
Generally, this assessment sought to determine training needs of
the Library Services Personnel. Specifically, it will also shed light to the
following:
1. ascertain the competencies of the library personnel that
need to be strengthened;
2. verify the degree of competency that the Library Services
Personnel currently have;
3. identify the degree of competency that the Library Services
Personnel currently needed to accomplish their work;
4. establish the degree of competency that the Library Services
Personnel believe will be required in the future to
accomplish their work; and
5. serve as basis for crafting the Personnel Development Plan
(PDP) of the Library Services Department.
Presentation and Discussion of Data
The TNA for Library Services Personnel was specially developed
to assess the degree of competencies of the said personnel in
accomplishing their work. The TNA tool is comprised of predefined
competencies, areas, and sub-areas developed by the Professional
Regulatory Board for Librarians in 2013. The core competencies were
grouped into two parts: professional and personal, patterned after the
Special Libraries Association (SLA) model. Professional competencies
include managing information resources, managing information services,
managing information tools and technologies, and managing information
organizations. Personal competencies include communication, customer
service, leadership, lifelong learning and personal growth, ethics and
values, and interpersonal. However, as per the Chief Librarian’s
recommendation, only two of the personal competencies –
communication and customer service, were included in the TNA tool.
The TNA tool is a self-assessment tool with list of core
competencies of a library personnel needed to effectively perform one’s
job. From the list of competencies, the library personnel assess the
degree of competency that they currently have, currently needed to

Departmental Data Analysis 37
accomplish their work, and they believe will be required in the future to
accomplish their work. To ensure accuracy of assessment, validation was
done by the Chief Librarian and Director of the Research Department.
Following is the rating scale used for this purpose.
Table 1. TNA for Library Services Personnel rating scale
Data collected were analyzed using percentage and weighted
mean. To determine the library personnel’s degree of competency, mean
rating was computed for each of the standard competencies. A mean
rating of 2.49 and below would mean that their competency is on Basic
and Awareness level only, thus such competency needs to be
strengthened and be included in their Personnel Development Plan (PDP).
However, as to the Chief Librarian, since most of her standard
competencies are on the advance and expert levels, those competencies
that fall on the Intermediate level will be the basis for her PDP.
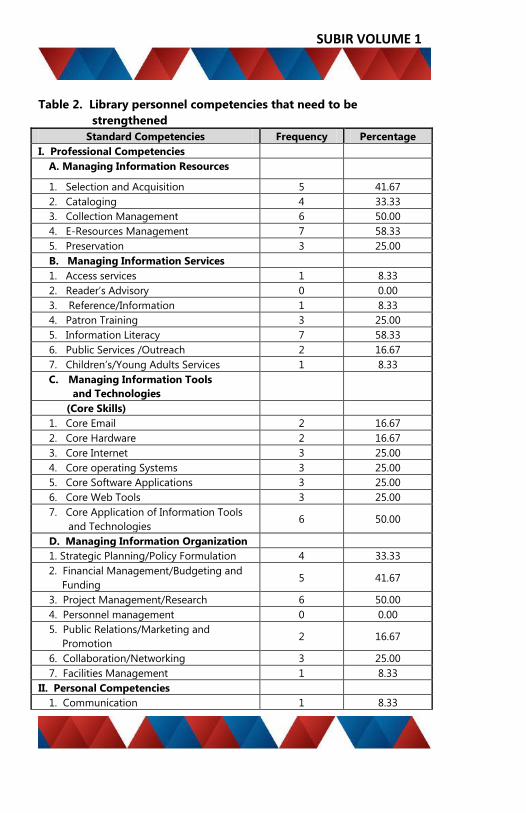
The following statements shed light on the stated objectives of
the study. Assessment of the library personnel competencies that need to
be strengthen as shown in Table 2 revealed that majority of them (58.33%)
need to further enhance their competencies on e-resources management
and information literacy under managing information resources and
managing information services respectively. This result can be attributed
to the fact that as the new millennium ushered the continuous and rapid
changes that transform information captured in print format to digital
format, the library services personnel must be adept in e-resources
management and information literacy (Fernandez and Buenrostro Jr.,
1= Awareness 2= Basic 3= Intermediate 4= Advanced 5= Expert
Knows the
concepts and
processes
Needs close and
extensive
supervision
Is familiar with
the concepts
and processes
Needs frequent
supervision
Understands the
concepts and
processes
Needs occasional
supervision
Fully
understands the
concepts and
processes
Generally needs
little or no
supervision
Has broad and
deeper
understanding of
concepts and
processes
Serves as a key
resource and
advises others

SUBIR VOLUME 1
2015). Likewise, 50% of the library personnel also need to develop their
competencies on collection management under managing information
resources, core application of information tools and technologies under
managing information tools and technologies (core skills), and project
management/research under managing information organization. As
Fernandez and Buenrostro Jr. (2015) have stated, the role of the librarian
dealing with digital resources should extend beyond the reactive librarian
to the proactive consultant and colleague. In the expanded role of
librarian as information consultant and colleague, the major value-added
contribution is the provision of a more precise and relevant search output
desired by their clients/customers.
As to other competencies under the managing information
resources, 41.67% of the library personnel need to reinforce their
competency on selection and acquisition. Moreover, four (33.33%) of the
library personnel need to be more equipped on cataloging and three
(25.00%) need to develop their competency on preservation.
On managing information services, minority of the library
personnel need to enhance their competencies on access services,
reference/information, patron training, public services/outreach, and
children’s/young adults services. This implies that majority of the library
personnel have already mastered the needed competencies under
managing information services thus they just have to continuously update
themselves on the current trends on library management.
Similarly, a small number of library personnel also need to
reinforce their managing information tools and technologies
competencies specifically on core email, core hardware, core internet, core
operating systems, core software applications, and core web tools. In the
same way, only some of the library personnel need to intensify their
managing information organization competencies as to strategic
planning/policy formulation, financial management/budgeting and
funding, public relations/marketing and promotion,
collaboration/networking, and facilities management.
Majority of the library personnel’s personal competencies, which
include communications and customer service, are already on
Departmental Data Analysis 39
Intermediate and Advanced level thus no further training is immediately
needed.
SUBIR VOLUME 1
Table 2. Library personnel competencies that need to be
strengthened
Standard Competencies Frequency Percentage
I. Professional Competencies
A. Managing Information Resources
1. Selection and Acquisition 5 41.67
2. Cataloging 4 33.33
3. Collection Management 6 50.00
4. E-Resources Management 7 58.33
5. Preservation 3 25.00
B. Managing Information Services
1. Access services 1 8.33
2. Reader’s Advisory 0 0.00
3. Reference/Information 1 8.33
4. Patron Training 3 25.00
5. Information Literacy 7 58.33
6. Public Services /Outreach 2 16.67
7. Children’s/Young Adults Services 1 8.33
C. Managing Information Tools
and Technologies
(Core Skills)
1. Core Email 2 16.67
2. Core Hardware 2 16.67
3. Core Internet 3 25.00
4. Core operating Systems 3 25.00
5. Core Software Applications 3 25.00
6. Core Web Tools 3 25.00
7. Core Application of Information Tools
and Technologies 6 50.00
D. Managing Information Organization
1. Strategic Planning/Policy Formulation 4 33.33
2. Financial Management/Budgeting and
Funding 5 41.67
3. Project Management/Research 6 50.00
4. Personnel management 0 0.00
5. Public Relations/Marketing and
Promotion 2 16.67
6. Collaboration/Networking 3 25.00
7. Facilities Management 1 8.33
II. Personal Competencies
1. Communication 1 8.33

Departmental Data Analysis 41
Standard Competencies Frequency Percentage
2. Customer Service 0 0.00
Assessing the overall degree of competency of the library
services personnel as to the skills that they currently have revealed that
their professional competencies, which include Managing Information
Resources, Managing Information Service, and Managing Information
Organization, are on the Basic level. Whereas, the overall degree of
personal competencies, which include Communication and Customer
service and professional competency on Managing Information Tools and
Technologies of the library services personnel, are classified on the
Intermediate level. This further implies that the library services personnel
recognize the need to enhance necessary skills to perform their job.
Table 3. Degree of competency that the Library Services Personnel
currently have
Standard Competencies Mean Rating Interpretation
I. Professional Competencies 2.35 Basic
A. Managing Information
Resources
B. Managing Information Service
C. Managing Information Tools and
Technologies (Core Skills)
D. Managing Information
Organization
2.08
2.43
2.58
2.29
Basic
Basic
Intermediate
Basic
II. Personal Competencies 2.92 Intermediate
A. Communication
B. Customer Service
2.58
3.25
Intermediate
Intermediate
Recognizing the need to enrich their professional and personal
competencies, the library services personnel rated their degree of
competency as Intermediate and Advanced levels for professional and
personal competencies, respectively in terms of what they currently
needed to accomplish their work. Although they are professionally and
personally competent, they are acknowledging the fact that they need

SUBIR VOLUME 1
some intervention to enable them to gain confidence in demonstrating
their competencies.
Table 4. Degree of competency that the Library Services Personnel
currently needed to accomplish their work
Standard Competencies Mean Rating Interpretation
I. Professional Competencies 3.06 Intermediate
A. Managing Information Resources
B. Managing Information Service
C. Managing Information Tools and
Technologies (Core Skills)
D. Managing Information
Organization
2.83
3.25
3.08
3.09
Intermediate
Intermediate
Intermediate
Intermediate
II. Personal Competencies 3.79 Advanced
A. Communication
B. Customer Service
3.67
3.91
Advanced
Advanced
Library services personnel are also aware that they need to
enhance and maintain high ethical, moral, and professional standards of
librarianship. Their professional and personal competencies should adapt
to the demands of their work. Acknowledging the stated fact, the library
services personnel perceived that their professional competencies should
be in Advanced level, while their personal competencies should be in
Expert level. The library services personnel believe that those stated
degrees of competencies will be required in the future to effectively
accomplish their work.
Table 5. Degree of competency that the Library Services Personnel
believe will be required in the future to accomplish their
work
Standard Competencies Mean Rating Interpretation
I. Professional Competencies 3.95 Advanced
A. Managing Information
Resources
B. Managing Information Service
C. Managing Information Tools and
Technologies (Core Skills)
D. Managing Information
Organization
3.90
4.20
3.77
3.91
Advanced
Advanced
Advanced
Advanced
II. Personal Competencies 4.68 Expert

Departmental Data Analysis 43
A. Communication
B. Customer Service
4.64
4.73
Expert
Expert
Conclusions
The Training Needs Assessment (TNA) is conducted to identify
competencies and training needs of the Library Services Personnel and
will serve as basis for developing the Personnel Development Plan of the
Library Services Department.
The results revealed that some of the librarians and library
assistants need to strengthen their professional competencies on
managing information resources, managing information tools and
technologies, managing information services, and managing information
organization. These competencies are essential skills that the librarian
and library assistants need to develop. As to personal competencies,
which include skills on communications and customer service, the library
services personnel competencies are on Intermediate and Advanced level
thus no immediate training or skills enhancement is needed.
The library services personnel acknowledge their limitations and
recognize that they need to further their professional competencies. As to
personal competencies, library services personnel should sustain their
high level of communication skills and customer service, thereby needing
only minimal interceptive assistance.
Gathered TNA result shall be the basis for developing the
Personnel Development Plan (PDP) of the Library Services Personnel
starting this academic year 2016-2017.

SUBIR VOLUME 1
References Cited
Fernandez, L.M & Buenrostro, J.C (2015). Competencies of professional
librarians in northern Luzon, Philippines: Basis for building
capacities and continuing professional development.
Needs Analysis: How to determine training needs (2015). Retrieved online
http://www.hr-guide.com/data/G510.htm
Professional Regulatory Board for Librarians. Prescription, Adoption, and
Promulgation of a National Competency – Based Standards for
Filipino Librarians. Resolution No. 03 S. 2015
Training Needs Analysis (2006). Retrieved online
http://www.london.ac.uk/fileadmin/documents/staff/staff_develo
pment/tna.pdf

Departmental Data Analysis 45
Analysis of Turn-over Rate of Letran Calamba Personnel
JELHEN F. FAYLON
Human Resource Department
Background
In human resource terms, personnel turn-over is a
measurement of how long personnel stay with the organization
and how often will have to replace them. Turn-over or Separation
is when personnel leave an organization and have to be replaced.
It cannot be avoided that some personnel will always leave the
workforce due to new job offers, pursue higher education,
relocation, and job dissatisfaction, or retirement (compulsory or
optional).
In general, organization with low turn-over is quite
productive. This is because the personnel know and trust one
anothe and are better at their specific roles than a group of
personnel that sees more turn-over would be. Personnel are likely
to be more loyal to the organization and more willing to devote
their personal energy to the job. Low turn-over makes it easier for
the organization to focus its time and energy on the business at
hand rather than adapting to new personnel. In contrast, high
turn-over means the organization is losing a relatively high
percentage of personnel each year compared with the number of
personnel that is hired and employed. This unavoidable level of
turn-over can somehow be beneficial because it brings new
people into the organization with new ideas and a fresh
perspective.
SUBIR VOLUME 1
To manage personnel turn-over, the human resource has
to monitor personnel retention and job satisfaction. With this, the
human resource can understand why personnel leave and what
information can be used to address personnel losses. Towards this
end, HRD Letran Calamba conducts an Exit Interview to all
personnel ending their contracts, applying for resignation, and
availing of compulsory and optional retirement. For this paper, the
focus is on the personnel who resigned from the Colegio for two
(2) Academic Years 2014-2015 and 2015-2016.
Objectives
Generally, this paper sought to identify and improve
personnel retention and reduce turn-over within Letran Calamba.
Specifically, it also aimed to know the following:
1. Determine the top three reasons of separation from Letran
Calamba;
2. Ascertain the top five considerations for accepting offers
of other organizations;
3. Determine the desirable and undesirable factors of job in
Letran Calamba; and
4. Provide recommendations to sustain the retention rate of
Letran Calamba
Presentation and Discussion of Data
For AY 2014-2015, the Human Resource Department
(HRD) obtained the retention rate of permanent personnel using
the formula in Table 1.
Table 1 reveals that for AY 2014-2015, the retention rate
or the number of retained personnel was 270 (91.53%), therefore
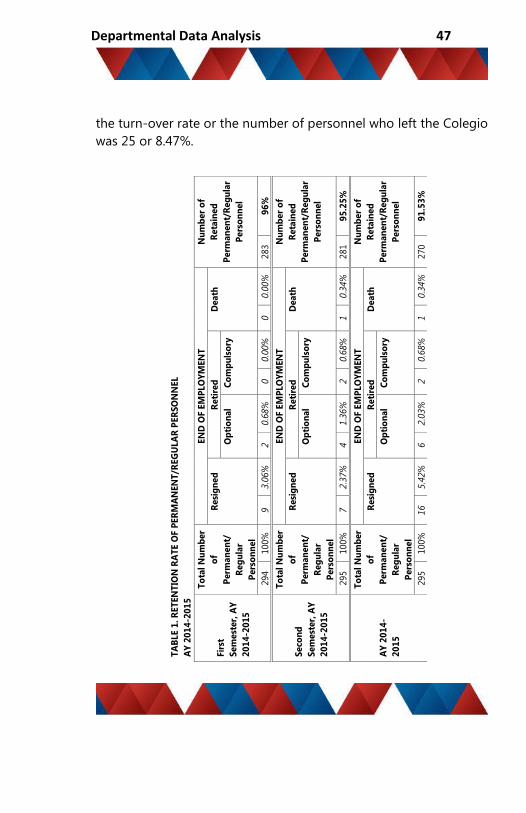
Departmental Data Analysis 47
the turn-over rate or the number of personnel who left the Colegio
was 25 or 8.47%.
T
AB
LE 1
. R
ET
EN
TIO
N R
AT
E O
F P
ER
MA
NEN
T/R
EG
ULA
R P
ER
SO
NN
EL
AY
20
14
-20
15
Fir
st
Sem
est
er,
AY
20
14
-20
15
To
tal
Nu
mb
er
of
Perm
an
en
t/
Reg
ula
r
Pers
on
nel
EN
D O
F EM
PLO
YM
EN
T
Nu
mb
er
of
Reta
ined
Perm
an
en
t/R
eg
ula
r
Pers
on
nel
Resi
gn
ed
R
eti
red
D
eath
Op
tio
nal
Co
mp
uls
ory
294
100%
9
3.0
6%
2
0.6
8%
0
0.0
0%
0
0.0
0%
283
96
%
Seco
nd
Sem
est
er,
AY
20
14
-20
15
To
tal
Nu
mb
er
of
Perm
an
en
t/
Reg
ula
r
Pers
on
nel
EN
D O
F EM
PLO
YM
EN
T
Nu
mb
er
of
Reta
ined
Perm
an
en
t/R
eg
ula
r
Pers
on
nel
Resi
gn
ed
R
eti
red
D
eath
Op
tio
nal
Co
mp
uls
ory
295
100%
7
2.3
7%
4
1.3
6%
2
0.6
8%
1
0.3
4%
281
95
.25
%
AY
20
14
-
20
15
To
tal
Nu
mb
er
of
Perm
an
en
t/
Reg
ula
r
Pers
on
nel
EN
D O
F EM
PLO
YM
EN
T
Nu
mb
er
of
Reta
ined
Perm
an
en
t/R
eg
ula
r
Pers
on
nel
Resi
gn
ed
R
eti
red
D
eath
Op
tio
nal
Co
mp
uls
ory
295
100%
16
5.4
2%
6
2.0
3%
2
0.6
8%
1
0.3
4%
270
91
.53
%

SUBIR VOLUME 1
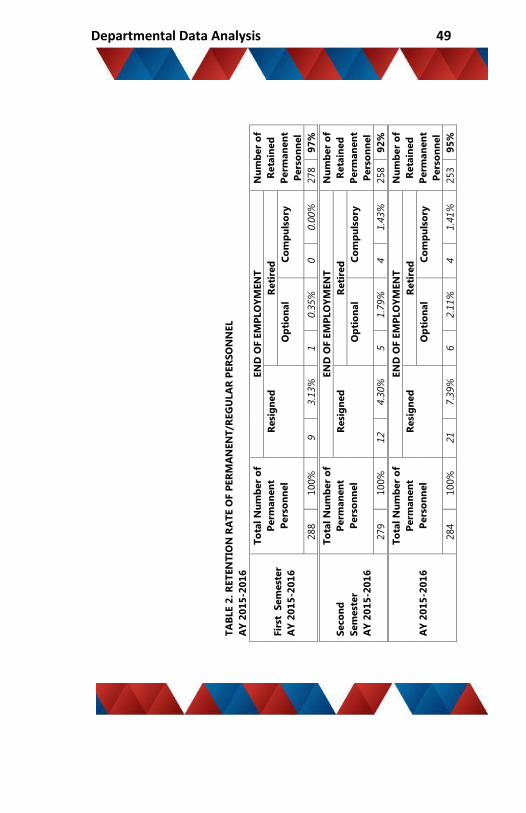
Also, using the same formula, the retention rate of
permanent personnel for AY 2015-2016 was computed based on
Table 2.
For AY 2015-2016, Table 2 shows that the turn-over rate
was 31 or 5% while the retention rate was 253 or 95%.
In this paper, the focus was based on the personnel who
voluntary resigned from the Colegio. A total of 15 out of 16
resigned personnel served as the respondents for AY 2014-2015
and 18 out of 21 resigned personnel served as the respondents for
AY 2015-2016. One personnel for AY 2014-2015 and three
personnel for AY 2015-2016 were not able to undergo the process
because they already left the country while, others have yet to
complete.
Departmental Data Analysis 49
TA
BLE 2
. R
ET
EN
TIO
N R
AT
E O
F P
ER
MA
NEN
T/R
EG
ULA
R P
ER
SO
NN
EL
AY
20
15
-20
16
Fir
st
Sem
est
er
AY
20
15
-20
16
To
tal
Nu
mb
er
of
Perm
an
en
t
Pers
on
nel
EN
D O
F E
MP
LO
YM
EN
T
Nu
mb
er
of
Reta
ined
Perm
an
en
t
Pers
on
nel
Resi
gn
ed
R
eti
red
Op
tio
nal
Co
mp
uls
ory
288
100%
9
3.1
3%
1
0.3
5%
0
0.0
0%
278
97
%
Seco
nd
Sem
est
er
AY
20
15
-20
16
To
tal
Nu
mb
er
of
Perm
an
en
t
Pers
on
nel
EN
D O
F E
MP
LO
YM
EN
T
Nu
mb
er
of
Reta
ined
Perm
an
en
t
Pers
on
nel
Resi
gn
ed
R
eti
red
Op
tio
nal
Co
mp
uls
ory
279
100%
12
4.3
0%
5
1.7
9%
4
1.4
3%
258
92
%
AY
20
15
-20
16
To
tal
Nu
mb
er
of
Perm
an
en
t
Pers
on
nel
EN
D O
F E
MP
LO
YM
EN
T
Nu
mb
er
of
Reta
ined
Perm
an
en
t
Pers
on
nel
Resi
gn
ed
R
eti
red
Op
tio
nal
Co
mp
uls
ory
284
100%
21
7.3
9%
6
2.1
1%
4
1.4
1%
253
95
%
SUBIR VOLUME 1
To gather the information, exit interview form was
developed in order to identify the factors that influence a decision
of an individual to leave Letran Calamba. These personnel can
help HRD in gathering information that would serve as a guide for
Letran Calamba to become a better institution. Aside from the exit
interview form, HRD also conducts one-on-one interview in order
to verify the answers from the personnel. It is always reiterated
that the answers and comments during interview shall be dealt
with utmost confidentiality.
Basically, the exit interview focuses on the following:
reasons for personnel separation, personnel satisfaction, and on
three factors, namely, job related, working relations, and Letran
Calamba related factors. It has a combination of open-ended and
closed-ended questions in order to get various and honest
answers.
To determine and compare the reasons for personnel
separation and satisfaction, HRD tabulated the exit interview
conducted last Academic Year 2014-2015 and 2015-2016.
For AY 2014-2015, Figure 1 shows the top three reasons
for resigning are the following: (1) to go abroad; (2) due to
personal reasons such as having more time for their family and for
personal growth; and (3) the personnel accepted another job.

Departmental Data Analysis 51
Figure 1. Reasons for resigning, AY 2014-2015
On the other hand, Figure 2 shows that for AY 2015-2016
the top three reasons for resigning are the following: (1) to go
abroad; (2) due to personal reasons like family related concerns;
and (3) the personnel accepted another job. It was clearly
determined that those three reasons are consistent in both
Academic Years 2014-2015 and 2015-2016, which is to go abroad,
wherein three went to Bahrain and two went to Korea to pursue
their teaching profession. Personal reasons such as providing
more time for family and professional growth were also
mentioned. Lastly, personnel who were resigned from the Colegio
accepted another job.

SUBIR VOLUME 1
Figure 2. Reasons for resigning, AY 2015-2016
Figure 3 shows that the top five factors that were
considered for accepting other jobs of resigned personnel for AY
2014-2015 where the following: (1) higher salary (9 or 35%); (2)
higher position (4 or 15%); (3) greater opportunity for promotion
(4 or 15%); (4) job more suited to lone of interest (3 or 11%); and
(5) more convenient location (3 or 12%)

Departmental Data Analysis 53
Figure 3. Factors considered to take other jobs, AY 2014-2015
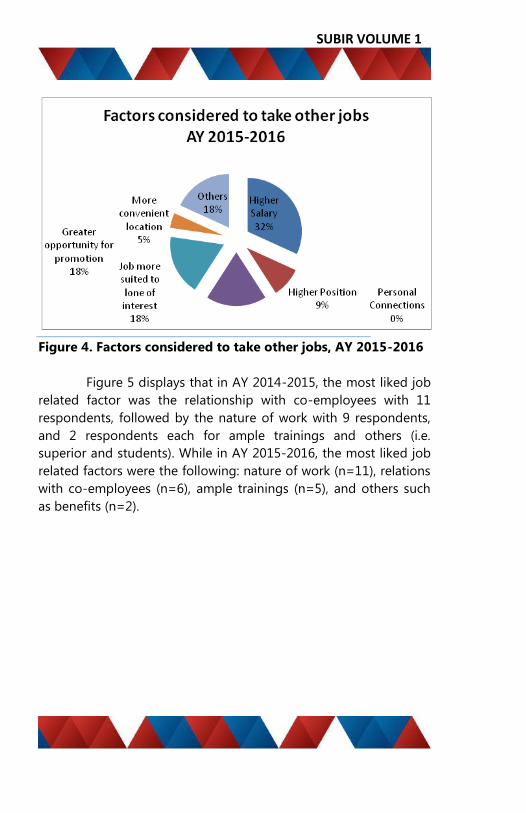
For AY 2015-2016, Figure 4 shows the top five factors that
were considered for accepting other jobs of resigned personnel
where the following: (1) higher salary (7 or 32%); (2) greater
opportunity for promotion (4 or 18%); (3) job more suited to lone
of interest (4 or 18%); (4) others such as better retirement benefits,
security of tenure, and to sustain the medical needs of immediate
family (4 or 18%); and (5) higher position (2 or 9%)
SUBIR VOLUME 1
Figure 4. Factors considered to take other jobs, AY 2015-2016
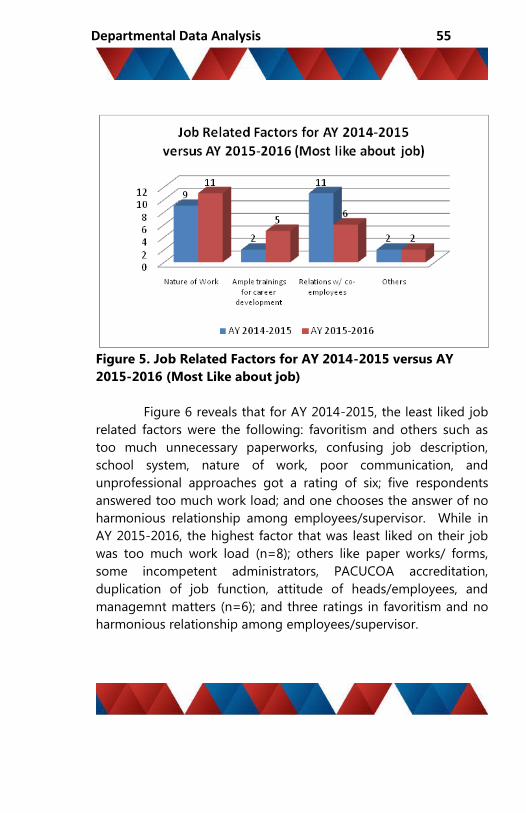
Figure 5 displays that in AY 2014-2015, the most liked job
related factor was the relationship with co-employees with 11
respondents, followed by the nature of work with 9 respondents,
and 2 respondents each for ample trainings and others (i.e.
superior and students). While in AY 2015-2016, the most liked job
related factors were the following: nature of work (n=11), relations
with co-employees (n=6), ample trainings (n=5), and others such
as benefits (n=2).
Departmental Data Analysis 55
Figure 5. Job Related Factors for AY 2014-2015 versus AY
2015-2016 (Most Like about job)
Figure 6 reveals that for AY 2014-2015, the least liked job
related factors were the following: favoritism and others such as
too much unnecessary paperworks, confusing job description,
school system, nature of work, poor communication, and
unprofessional approaches got a rating of six; five respondents
answered too much work load; and one chooses the answer of no
harmonious relationship among employees/supervisor. While in
AY 2015-2016, the highest factor that was least liked on their job
was too much work load (n=8); others like paper works/ forms,
some incompetent administrators, PACUCOA accreditation,
duplication of job function, attitude of heads/employees, and
managemnt matters (n=6); and three ratings in favoritism and no
harmonious relationship among employees/supervisor.
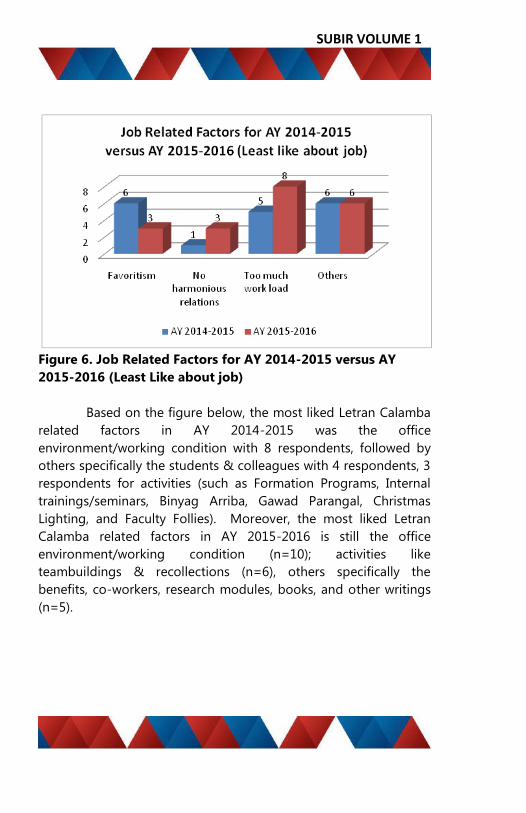
SUBIR VOLUME 1
Figure 6. Job Related Factors for AY 2014-2015 versus AY
2015-2016 (Least Like about job)
Based on the figure below, the most liked Letran Calamba
related factors in AY 2014-2015 was the office
environment/working condition with 8 respondents, followed by
others specifically the students & colleagues with 4 respondents, 3
respondents for activities (such as Formation Programs, Internal
trainings/seminars, Binyag Arriba, Gawad Parangal, Christmas
Lighting, and Faculty Follies). Moreover, the most liked Letran
Calamba related factors in AY 2015-2016 is still the office
environment/working condition (n=10); activities like
teambuildings & recollections (n=6), others specifically the
benefits, co-workers, research modules, books, and other writings
(n=5).

Departmental Data Analysis 57
Figure 7. Letran Calamba Related Factors for AY 2014-2015
versus AY 2015-2016 (Most Like about Letran
Calamba)
Based on Figure 8, the least liked Letran Calamba related
factors for AY 2014-2015 were the following: slow promotion
obtained seven responses; six respondents answered others such
as strong politics, gossips, forms, defective communication system,
unrelated/redundant paperworks, and Department Head; and five
chooses the answer of low salary. In AY 2015-2016, the highest
factor that was least liked on Letran Calamba were the following:
slow promotion (n=9); low salary (n=8); and three ratings both in
office environment/working condition and others which includes
too muck workload, changing management plans, basic pay, and
other requirements for promotion.

SUBIR VOLUME 1
Figure 8. Letran Calamba Related Factors for AY 2014-2015
versus AY 2015-2016 (Least Like about Letran
Calamba)
Conclusions
The following conclusions were revealed by the paper:
1. Based on the given data, the top three reasons of
separation from Letran Calamba were the following: (1) to
go abroad because of the rate of pay that they are going
to receive; (2) due to personal reasons such as for personal
development & family related concerns; and (3) the
personnel accepted another job. Although many things
were considered by the resigned personnel such as the
nature of work, relations with co-employees, office
environment/working conditions, benefits, and activities
but due to the demand for higher salary and personal
growth and development they tend to resign from the
Colegio. Also, almost all of the resigned personnel (or 8

Departmental Data Analysis 59
out of 15 respondents from AY 2014-2015 and 10 out of
18) respondents from AY 2015-2016 answered that the
rate of pay they received was a bit low although
acceptable. Even resigned personnel left the Colegio, they
are still recommending the Colegio to their friends as a
place to work for.
2. The top five considerations for accepting offers of other
organizations were: (1) Higher salary, (2) Higher position,
(3) Greater opportunity for promotion, (4) Job more suited
to lone of interest, and (5) More convenient location.
3. The most liked job related factors were as follows: (1) the
relationship with co-employees, (2) followed by the nature
of work, (3) ample trainings and others (i.e. superior,
students, and benefits). While the least liked job related
factors were the following: (1) too much work load; (2)
others such as too much unnecessary paperworks/forms,
confusing job description, duplication of job function,
school system, PACUCOA accreditation, nature of work,
poor communication, some incompetent administrators,
attitude of heads/employees, and unprofessional
approaches; and (3) favoritism.
4. The most liked Letran Calamba related factors were the
following: (1) office environment/working condition; (2)
others specifically the students, colleagues, benefits,
research modules, books, and other writings ; and (3)
activities (such as Formation Programs/Recollections,
Teambuildings, Internal trainings/seminars, Binyag Arriba,
Gawad Parangal, Christmas Lighting, and Faculty Follies).
SUBIR VOLUME 1
Recommendations
In line with the findings and conclusions, the following
recommendations are suggested in order to help the Colegio
maintain its personnel:
1. Emphasize the desirable aspects of the Colegio’s work
environment to future applicants;
2. Benchmark with other nearby schools on the current
salary levels ;
3. Revisit of existing salary scale of the Colegio through
the Economic Council; and
4. Continuing review of internal processes like
communication system and personnel workload/
paperworks.
References Cited
http://study.com/academy/lesson/what-is-employee-turnover-
definition-cost-reasons.html
https://www.qualtrics.com/support/research-resources/create-
employee-exit-interview-survey/

Departmental Data Analysis 61
Learning, Unlearning, and Relearning: An Evaluation of the
Departmental Data Analysis Training Series and Its Inputs to
Personnel Research Engagement
JUAN GERRICK B. MALLARI
Knowledge Management Department
Background
Research is the careful and diligent search or inquiry of new facts
or discoveries, whether to accept or reject theories in the existence of new
facts that can be used in practical application (http://www.merriam-
webster.com/dictionary/research.dov; July 26, 2016). Further, it involves
the systematic or step-by-step process of investigating the truth of a
certain phenomenon. Therefore, it is imperative that basis for process
enhancement and decision-making should be guided by research. One of
the common research undertakings in which it is embedded in Knowledge
Management Department’s departmental practices is the analyses of
department data. But before analysing, these are the questions that need
to be clarified: How do we classify data from information? What’s the
difference between knowledge and wisdom? When and how are you
going to use your data or information? Data, according to Schumaker
(2011, p. 40) as cited from Boisot and Canals (2004) is the observable,
concrete states which are products of our response to a stimuli. It involves
the use of our human senses. When we are able to interpret these
responses, then it becomes information. The value of information depends
on the need for a particular data (Choo, 1996; Schumaker, 2011, p. 40.)
Information per se, is determined by the level of importance of the data.
Hence, the use of information results to gained knowledge. Knowledge
pertains to the “how” of using information and the “when” and “why” are
you going to use knowledge is referred to as wisdom (Jifa, 2013, p. 714).
Recommendations based from the audit results of the Philippine
Quality Award Site Visit showed that the Colegio has rich sources of data
and information, which are not being utilized. Moreover, most of the non-
SUBIR VOLUME 1
teaching personnel of the Colegio are not fully engaged in research-
related activities. Thus, with the recent birth of the Knowledge
Management Department, it assists all departments in analysing their
departmental data and help promote the culture of curiosity and inquiry,
which has been set by the Research and Development Division through
the Research Department. The department conducted series of trainings
on analysing department data for employees represented by different
offices and divisions last May 12, 17, and 19, 2016. More so, it also gave
focus on enhancing the participants’ writing and grammar skills. Similarly,
a review on collecting, reviewing, and analysing departmental data
dubbed as “Learning, Unlearning, and Relearning” was organized for
selected faculty members among schools last June 3, 2016. Evaluation
Forms on Trainings/Seminars (RE:03-00-FO-14) was used to evaluate the
perception of the participants to the overall training experience. Hence,
this paper focused on the results of the evaluation tool as perceived by
the participants during their training session.
Objectives
This study was guided by the following objectives:
1. To determine the mean ratings of the activity as given by the
participants in terms of:
a. The Speaker;
b. The Presentation;
c. Venue; and
d. Training Session; and
2. To recognize the implications of the training series among
participants.
Presentation and Discussion of Data
This paper used a 5-point rating scale of interpretation:
Mean
range
Interpretation
4.51-5.00 Excellent
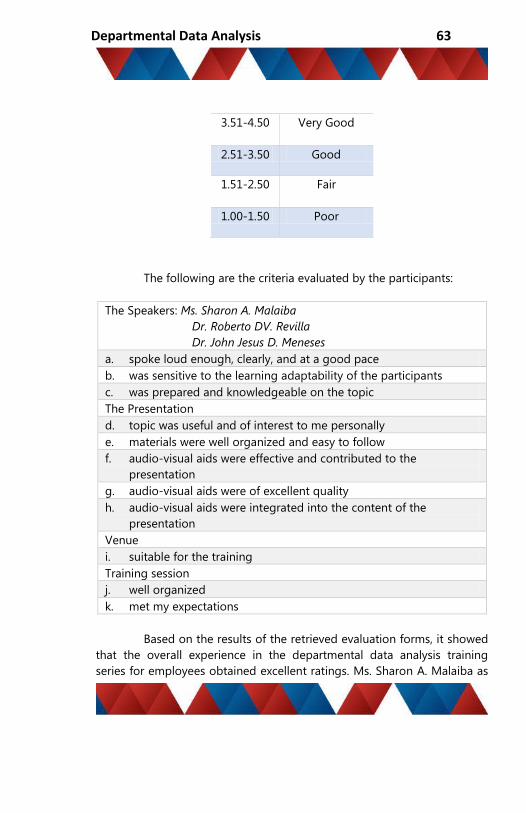
Departmental Data Analysis 63
3.51-4.50 Very Good
2.51-3.50 Good
1.51-2.50 Fair
1.00-1.50 Poor
The following are the criteria evaluated by the participants:
The Speakers: Ms. Sharon A. Malaiba
Dr. Roberto DV. Revilla
Dr. John Jesus D. Meneses
a. spoke loud enough, clearly, and at a good pace
b. was sensitive to the learning adaptability of the participants
c. was prepared and knowledgeable on the topic
The Presentation
d. topic was useful and of interest to me personally
e. materials were well organized and easy to follow
f. audio-visual aids were effective and contributed to the
presentation
g. audio-visual aids were of excellent quality
h. audio-visual aids were integrated into the content of the
presentation
Venue
i. suitable for the training
Training session
j. well organized
k. met my expectations
Based on the results of the retrieved evaluation forms, it showed
that the overall experience in the departmental data analysis training
series for employees obtained excellent ratings. Ms. Sharon A. Malaiba as

SUBIR VOLUME 1
the resource speaker received an Excellent rating of 4.97 for sharing her
knowledge and expertise in the topic. On the other hand, the presentation
also garnered an Excellent rating of 4.98. The participants viewed the topic
as useful and relevant to their department’s operations. They also find the
venue suitable for training, with an Excellent rating of 4.95. The training
session received an overall mean rating of 4.96 for being organized and
have met the set expectations. The presentation showed the highest mean
rating, while venue has the lowest mean rating still with Excellent ratings.
In a study conducted by Jehanzeb and Bashir (2013) on Training
and development program and its benefits to employee and organization: A
conceptual study, results showed that there are direct and indirect benefits
in the employee performance. Given that employees perform well, it also
improves profitability, efficiency, and output in organizational
performance.
Figure 1. Summary of evaluation from employees
Qualitative comments from the employees were also given as follows:
“Really appreciate the training given to us by KMD. We
need a lot of this.”
“another more days for training a day is not enough”
“Good job KMD! (n=2)”
4.97 4.98 4.95 4.96
1.002.003.004.005.00
Departmental Data Analysis Training
Series for Employees
The Speaker: Ms. Sharon A. Malaiba
The Presentation
Venue
Training session

Departmental Data Analysis 65
“more of these for continuous improvement of data
analysis and related skills.”
“Thank you! (n=12)”
“additional knowledge in learning research.”
“This seminar is very helpful!”
“more session please! (n=2)”
“I've learned something new!! =)”
“The training is very informative”
“the training is very relevant to the department's
operation. I appreciate it a lot.”
“Very useful. (n=2)”
In terms of the responses from the faculty members, it showed
positive results based from the garnered ratings. Prof. Roberto DV. Revilla
got the highest Excellent rating of 5.00, which reflects the participants’
appreciation of his knowledge and expertise in the topic of qualitative
research.
Meanwhile, Dr. John Jesus D. Meneses received a mean rating of
4.97 (Excellent) as viewed by the participants on his expertise in the field
of quantitative research. Both venue and training session got 4.92
(Excellent) mean ratings. Despite of the limited space, the faculty members
still viewed the venue and flow of the session conducive for the training.
Lastly, the presentation got the lowest mean rating of 4.88, still an
Excellent rate.

SUBIR VOLUME 1
Figure 1. Summary of evaluation from faculty members
Qualitative comments from the faculty members are as follows:
“time constraints”
“Congrats & keep up the good work!”
“Very informative”
“Thanks for the useful input.”
“Very good.”
A post-activity interview was also done among purposively
selected participants from the five divisions in the data analysis training
series to gained additional insights, aside from the ones mentioned in the
evaluation forms. Guide questions were lifted from Form for Capturing
Tacit Knowledge (RE:03-00-FO-19). Table 1 presents the summary of
responses from the interview:
5.00 4.97 4.88 4.92 4.92
1.00
2.00
3.00
4.00
5.00
Learning, Unlearning, and Relearning
The Speaker: Dr. Roberto DV. Revilla
The Speaker: Dr. John Jesus D. Meneses
The Presentation
Venue
Training session

Departmental Data Analysis 67
T
ab
le 1
. S
um
mary
of
inte
rvie
w r
esp
on
ses
Inte
rvie
w Q
ues
tio
ns
Aca
dem
ics
Div
isio
n
A&
P D
ivis
ion
F
inan
ce D
ivis
ion
R
&D
Div
isio
n
RE
MI D
ivis
ion
1.
Wh
at w
ent
wel
l?
Yun
g gr
amm
ar r
evie
w. K
ung
papa
no y
ung
pag
cons
truc
t ng
tam
ang
sent
ence
.
Cla
rific
atio
n sy
a sa
laha
t ng
kn
owle
dge
ko s
a re
sear
ch.
I ap
prec
iate
how
we
can
cons
truc
t dat
a an
alys
is. Y
ung
esse
nce
nya,
not
on
mer
e co
mpl
ianc
e bu
t mor
e on
an
alys
ing.
Yun
g ap
prec
iatio
n ng
pur
pose
nya
.
Com
fort
able
ang
fee
ling
sa
trai
ning
. H
indi
nak
akak
aba,
cl
assr
oom
set
ting.
Fee
ling
mo
stud
ent k
a, g
uide
d. N
agus
tuha
n ko
yun
g gr
amm
ar r
evie
w,
na-
refr
eshe
d ak
o. L
agi m
o sy
ang
gina
gam
it, p
ero
hind
i mo
alam
na
mal
i na
pala
yon
.
Oka
y na
man
. Mag
anda
sy
a na
rem
inde
r. 1
01
sya
bago
ka
mak
abuo
ng
pap
el,
alam
mo
na
pano
sya
i-co
nduc
t. W
orth
it a
ng in
puts
.
2.
Wh
at d
idn
’t g
o
wel
l or
had
u
nin
ten
ded
co
nse
qu
ence
s?
San
a yu
ng
follo
w-u
p co
nsis
tent
at c
onsu
ltatio
n sc
hedu
le. S
ana
may
as
sign
ed d
in n
a fa
culty
na
mag
ass
ist s
a re
sear
ch.
Sm
ooth
nam
an a
ng n
agin
g tr
aini
ng k
aya
lang
dur
ing
the
impl
emen
tatio
n nu
ng r
esea
rch,
su
mab
ay s
ya s
a w
ork
load
, sa
ka ti
me
cons
trai
nt f
or
com
plia
nce.
Sig
uro
kung
yun
g da
ta
anal
ysis
as
a re
quire
men
t,
kung
nee
d ba
tal
aga
ng
empl
oyee
s na
mag
ana
lyse
? N
ot o
n m
ere
com
plia
nce
kasi
to
xic
bar
in s
a w
ork
load
. P
ati
yung
ava
ilabi
lity
ng d
ata.
May
mga
big
laan
g ac
tiviti
es
durin
g th
e tr
aini
ng.
Na
kaila
ngan
pal
a pr
epar
ed k
a to
do
dat
a an
alys
is p
ero
at le
ast
nasi
mul
an m
o na
.
Con
flict
in s
ched
ule
3.
If y
ou
had
to
do
it
ove
r ag
ain
, w
hat
wo
uld
yo
u
do
dif
fere
ntl
y?
San
a m
ay s
ugge
sted
top
ics
na f
or d
ata
anal
ysis
. M
ore
on s
a pa
ano
gum
awa
ng
gra
phs,
paa
no m
ag a
naly
se.
Mor
e on
fol
low
-up
gaw
a ng
a ka
si n
g w
ork
load
and
tim
e co
nstr
aint
. Mag
anda
sig
uro
kung
tw
ice
sya
i-run
per
o di
ffer
ent t
opic
s. Y
ung
para
bag
o m
ag p
ropo
sal a
nd f
inal
. Par
ang
sa r
esea
rch
clas
s.
Sig
uro
kung
mag
cos
t be
nefit
an
alys
is a
ko, s
ana
may
1
sess
ion
lang
na
annu
al
trai
ning
. B
igge
r gr
oup.
We
can
also
invi
te e
xter
nal e
xper
ts.
Mor
e gr
amm
ar a
ctiv
ities
. Oka
y sy
ang
prim
er.
Mas
mar
amin
g ex
ampl
es,
inpu
ts.
4.
Wh
at
reco
mm
end
atio
ns
wo
uld
yo
u
mak
e to
oth
er
do
ing
sim
ilar
pro
ject
s?
Yun
nga
san
a m
ay
sugg
este
d to
pics
na
for
data
an
alys
is. M
ay c
onsu
ltatio
n sc
hedu
le. F
acul
ty n
a m
ag
act
as m
oder
ator
s. A
t sak
a in
cent
ive
para
ma-
mot
ivat
e an
g m
ga e
mpl
eyad
o m
ag
rese
arch
.
Sig
uro
dapa
t i-c
onsi
der
din
yung
will
ingn
ess
ng m
ga
part
icip
ants
. Yun
g hi
ndi s
ila
napi
litan
. Im
ulat
at i
nten
sify
ang
re
sear
ch c
ultu
re s
a at
in.
Mag
karo
on d
in s
ana
ng t
rain
ing
on r
esea
rch
pres
enta
tion
and
oral
com
mun
icat
ion.
San
a ku
ng m
agka
karo
on t
ayo
ng d
atab
ank
stor
age
ng la
hat
ng d
ata
anal
ysis
tapo
s m
ay
pers
onne
l-in-
char
ge n
a m
ag-
anal
yze
ng d
ata.
Mak
apag
-invi
te d
in n
g ex
tern
al
reso
urce
spe
aker
. Mas
oka
y an
g sm
all g
roup
, na
tutu
tuka
n.
San
a m
ay s
urve
y m
una
sa s
ched
ule
para
sa
avai
labi
lity
ng t
rain
ees.
S
ana
mas
mal
akin
g ve
nue.

SUBIR VOLUME 1
Participants who were interviewed when asked ‘what went well?’
responded that they appreciated the subject on grammar review and the
purpose of the training. It has given some clarifications with regard to
knowledge or research. However, on the part of ‘what didn’t go well?’
some mentioned conflict in the training schedule, availability of data, and
work load concerns. But when they were asked if ‘If you had to do it over
again, what would you do differently?’, some responded that if they
already have suggested topics for data analysis, more examples, grammar
activities and how to analyse and prepare graphs, more sessions as
compared to research classes of the Colegio, bigger groups, and if we can
also invite external resource person. And when they were asked ‘What
recommendations would you make to other doing similar projects?’,
participants would like to have faculty members as research moderators,
willingness and availability of the participants, bigger venue, invite
external resource speakers, and trainings on research presentation and
oral communication, and databank storage for data analysis.
Conclusions
In summary, the departmental data analysis training series for
employees and faculty members showed overall positive results. The
employees and faculty members appreciated the resource speakers with
regard to the shared knowledge and expertise. The quality of the
presentation also helps to capture the interest of the participants.
Given the limited space, the participants still viewed the venue
suitable for the training. The training session also showed positive results
in terms of organization and setting the expectations of the participants.
However, one of the qualitative comments from the faculty members
indicated ‘time constraint.’ In the study conducted by Borg (2007, p. 732),
he mentioned the factors why teachers cannot sustain their research
engagement: (1) lack of external pressures; (2) lack of time; and (3)
differences in personal disposition. In another study on research culture, it
showed that ‘investment in time’ was identified as an important criteria to
establish a research culture among schools (Ebbutt, 2001; Borg, 2007, p.
745.)

Departmental Data Analysis 69
Hence, this supports the purpose of conducting trainings among
teaching and non-teaching personnel in analyzing their departmental data
which will help personnel to become engage in doing research. A
proposed action plan was formulated to further enhance and sustain the
research capability of Letran Calamba personnel.
References Cited
Schumaker, R. P. (2014). From Data to Wisdom: The Progression of
Computational Learning in Text Mining. Communications of the
IIMA, 11(1), 4.
http://scholarworks.lib.csusb.edu/cgi/viewcontent.cgi?article=115
5&context=ciima (dov: July 28, 2016)
Jifa, G. (2013). Data, Information, Knowledge, wisdom and meta-synthesis
of wisdom-comment on wisdom global and wisdom cities.
Procedia Computer Science, 17, 713-719.
http://www.sciencedirect.com/science/article/pii/S187705091300
2251 (dov: July 28, 2016)
Borg, S. (2007). Research engagement in English language teaching.
Teaching and Teacher Education, 23(5), 731-747.
http://www.education.leeds.ac.uk/assets/files/staff/papers/Borg-
2006-TATE.pdf (dov: July 29, 2016)
Jehanzeb, K., & Bashir, N. A. (2013). Training and development program
and its benefits to employee and organization: A conceptual
study. European Journal of Business and Management, 5(2).
http://s3.amazonaws.com/academia.edu.documents/32182244/3
947-5999-1-
PB.pdf?AWSAccessKeyId=AKIAJ56TQJRTWSMTNPEA&Expires=14
79898353&Signature=GOilo4lF9wbtmgeo2r2SOlaVuiU%3D&res
ponse-content-
disposition=inline%3B%20filename%3DTraining_and_Developme
nt_Program_and_Its.pdf (dov: November 23, 2016)
SUBIR VOLUME 1
A Comparative Analysis of the AY 2013-2014 and AY 2014-
2015 Library Customer Satisfaction
LESLIE JOYCE G. LARITA
EVELYN P. NABUS, RL
Library Services Department
Background
Last Academic Years 2013-2014 and 2014-2015, the Library
Services Department (LSD) administered a satisfaction survey among
library users to assess their level of satisfaction of the library services.
Evaluating customer satisfaction in the long-term is an essential part of
quality management in libraries. According to Ball (2008), quality is
defined as “all of the characteristics and features of a product or a service,
which relate to their suitability for fulfilling fixed or given requirements”
and it is determined by the subjective evaluation of the customer. In
which, this survey is used to gather the users’ opinions and degree of
satisfaction, which then served as the basis for an analysis of strengths
and weaknesses of the services within the department.
The four (4) dimensions of Library Quality (LibQUAL) were used
as a parameter to measure the extent by which library users, in particular
the graduating students who perceived/experienced library services. It was
also used to make future improvements based on the results. Likewise,
this analysis aimed to measure and compare the results of the two
academic years on how the use of library facilities, resources, services, and
personnel fulfill the needs of the library users.
The survey questionnaire was composed of four parts: the first
part consists of 26 questions (question no. 16 same as no.14) that formed
the four dimensions, and within each dimension, questioned were
distributed as follows:
Personal Control: Six questions
Access to Information: Five questions
Library as Place: Six questions

Departmental Data Analysis 71
Affect of Service: Eight questions
The second part consists of five questions on the degree of
users’ satisfaction, while part three indicates the usage pattern of the
respondents; finally the last part consists of users’ profile, rate of the
overall quality of service, and comments and suggestions. Data collection
was scheduled before the end of second semester of AY 2013-2014 and
AY 2014-2015.
Responses were converted using the five-point Likert scale. To
determine more comprehensively the degree of perceptions of the
respondents, certain criteria were established as basis for the
interpretation of the results.
Interpretation of perceived/experience degree of satisfaction of
achieving service
Perceived degree of satisfaction Rating
Always Satisfied 5
Often Satisfied 4
Sometime Satisfied 3
Rarely Satisfied 2
Never Satisfied 1
Interpretations of perceived degree of attainment
Perceived degree Rating
Strongly agree 5
Somewhat agree 4
Neutral 3
Somewhat disagree 2
Strongly disagree 1
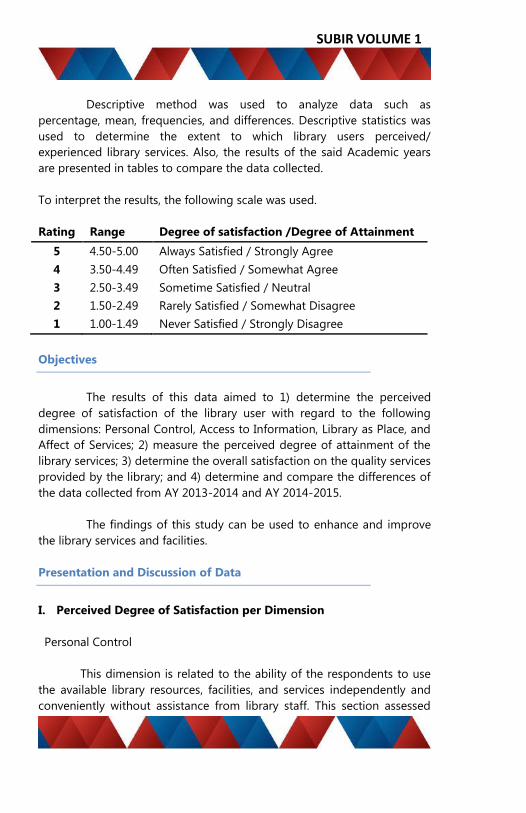
SUBIR VOLUME 1
Descriptive method was used to analyze data such as
percentage, mean, frequencies, and differences. Descriptive statistics was
used to determine the extent to which library users perceived/
experienced library services. Also, the results of the said Academic years
are presented in tables to compare the data collected.
To interpret the results, the following scale was used.
Rating Range Degree of satisfaction /Degree of Attainment
5 4.50-5.00 Always Satisfied / Strongly Agree
4 3.50-4.49 Often Satisfied / Somewhat Agree
3 2.50-3.49 Sometime Satisfied / Neutral
2 1.50-2.49 Rarely Satisfied / Somewhat Disagree
1 1.00-1.49 Never Satisfied / Strongly Disagree
Objectives
The results of this data aimed to 1) determine the perceived
degree of satisfaction of the library user with regard to the following
dimensions: Personal Control, Access to Information, Library as Place, and
Affect of Services; 2) measure the perceived degree of attainment of the
library services; 3) determine the overall satisfaction on the quality services
provided by the library; and 4) determine and compare the differences of
the data collected from AY 2013-2014 and AY 2014-2015.
The findings of this study can be used to enhance and improve
the library services and facilities.
Presentation and Discussion of Data
I. Perceived Degree of Satisfaction per Dimension
Personal Control
This dimension is related to the ability of the respondents to use
the available library resources, facilities, and services independently and
conveniently without assistance from library staff. This section assessed
Departmental Data Analysis 73
the users’ perceived degree of satisfaction with the convenience, usability,
and availability of library resources.
The attribute “OPAC’s are usable and updated” (mean=14.36 and 24.33) was rated the highest in terms of degree of satisfaction by the
respondents in this dimension. This shows that respondents used OPAC
before retrieving books needed on the shelves. On the other hand, this
item has a difference of -0.03, which shows that in AY 2014-2015 there
was a decrease in its degree of satisfaction. This may be congruent with
the Client Satisfaction Survey Result in which a comment stated that the
OPAC is not easy to use or they lack of knowledge on how to use it. These
findings are similar to the study of Thanuskodi (2012), in which 95% of the
respondents’ reasons on why they never use the OPAC is due to their lack
of knowledge in using it.
Likewise, results show that the attribute concerning internet
facilities (mean= 13.8 and 23.93), was rated the lowest. The availability of
electronic resources and internet accessibility within the library is essential
but the slow internet connection affects the delivery of quality service
among library users. On the other hand, an increase of 0.13 was seen in
the degree of satisfaction in AY 2014-2015. This may be due to the
increase in the available computer units which the students can use. This
result is also parallel to the study of Devi and Singh (n.d.) that 47.56% of
the respondents were partially satisfied with the internet facilities in
Manipur University Library. Majority of their respondents answered that
the most common problem cited was slow internet speed followed by the
limited number of computers. These findings were agreed and congruent
to the comments and suggestions of the graduating students.
_______________________________
Mean Scores of 1AY 2013-2014 and 2AY 2014-2015
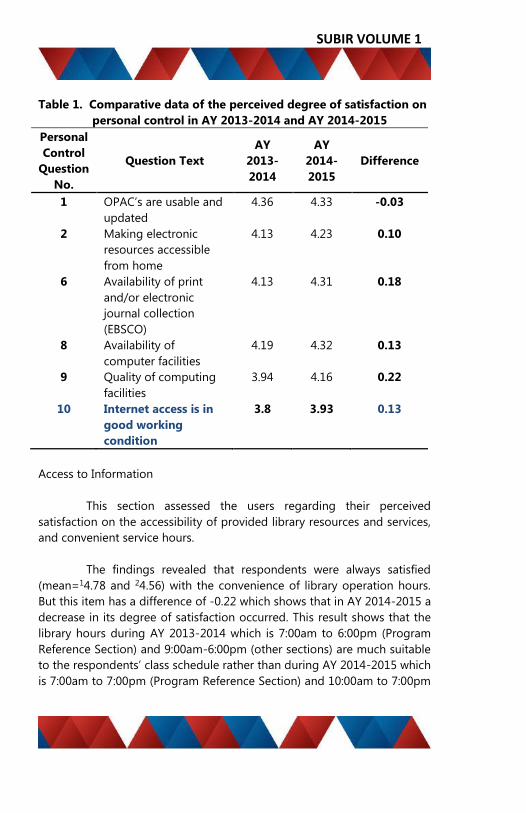
SUBIR VOLUME 1
Table 1. Comparative data of the perceived degree of satisfaction on
personal control in AY 2013-2014 and AY 2014-2015
Personal
Control
Question
No.
Question Text
AY
2013-
2014
AY
2014-
2015
Difference
1 OPAC’s are usable and
updated
4.36 4.33 -0.03
2 Making electronic
resources accessible
from home
4.13 4.23 0.10
6 Availability of print
and/or electronic
journal collection
(EBSCO)
4.13 4.31 0.18
8 Availability of
computer facilities
4.19 4.32 0.13
9 Quality of computing
facilities
3.94 4.16 0.22
10 Internet access is in
good working
condition
3.8 3.93 0.13
Access to Information
This section assessed the users regarding their perceived
satisfaction on the accessibility of provided library resources and services,
and convenient service hours.
The findings revealed that respondents were always satisfied
(mean=14.78 and 24.56) with the convenience of library operation hours.
But this item has a difference of -0.22 which shows that in AY 2014-2015 a
decrease in its degree of satisfaction occurred. This result shows that the
library hours during AY 2013-2014 which is 7:00am to 6:00pm (Program
Reference Section) and 9:00am-6:00pm (other sections) are much suitable
to the respondents’ class schedule rather than during AY 2014-2015 which
is 7:00am to 7:00pm (Program Reference Section) and 10:00am to 7:00pm
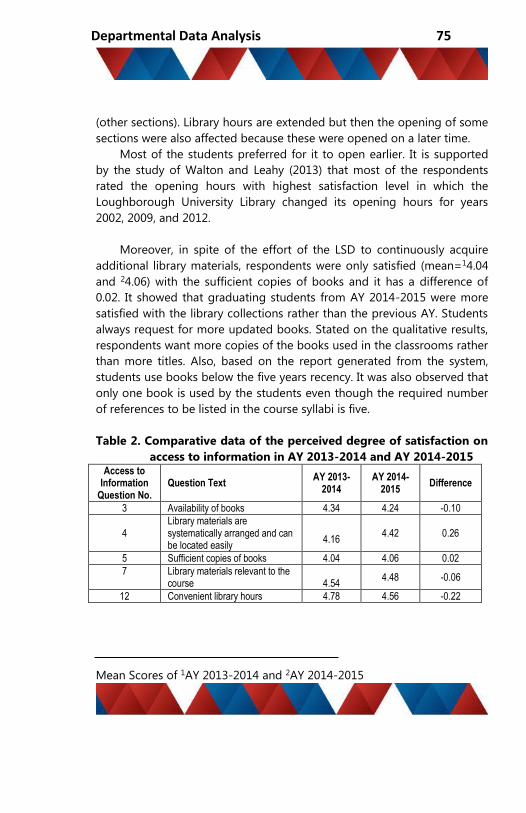
Departmental Data Analysis 75
(other sections). Library hours are extended but then the opening of some
sections were also affected because these were opened on a later time.
Most of the students preferred for it to open earlier. It is supported
by the study of Walton and Leahy (2013) that most of the respondents
rated the opening hours with highest satisfaction level in which the
Loughborough University Library changed its opening hours for years
2002, 2009, and 2012.
Moreover, in spite of the effort of the LSD to continuously acquire
additional library materials, respondents were only satisfied (mean=14.04
and 24.06) with the sufficient copies of books and it has a difference of
0.02. It showed that graduating students from AY 2014-2015 were more
satisfied with the library collections rather than the previous AY. Students
always request for more updated books. Stated on the qualitative results,
respondents want more copies of the books used in the classrooms rather
than more titles. Also, based on the report generated from the system,
students use books below the five years recency. It was also observed that
only one book is used by the students even though the required number
of references to be listed in the course syllabi is five.
Table 2. Comparative data of the perceived degree of satisfaction on
access to information in AY 2013-2014 and AY 2014-2015 Access to
Information Question No.
Question Text AY 2013-
2014 AY 2014-
2015 Difference
3 Availability of books 4.34 4.24 -0.10
4 Library materials are systematically arranged and can be located easily
4.16
4.42 0.26
5 Sufficient copies of books 4.04 4.06 0.02
7 Library materials relevant to the course
4.54
4.48 -0.06
12 Convenient library hours 4.78 4.56 -0.22
Mean Scores of 1AY 2013-2014 and 2AY 2014-2015

SUBIR VOLUME 1
Library as Place
This dimension is about the physical facilities, equipment, and
library environment. This section asked the users’ perceived degree of
satisfaction with regards to the service level of the library as a space for
learning, studying, or researching.
Findings revealed that respondents were always satisfied with the
following attributes: lighting and ventilation (mean=14.75 and 24.61),
signages (mean=14.74 and 24.53), and provision of laptop area
(mean=14.63 and 24.52).
In AY 2013-2014, the attributes which obtained the highest and
lowest mean scores are the following: Library is a place conducive to study
(mean=4.80) and There are places where to use a laptop computer within
the library building (mean=4.63), respectively.
While in AY 2014-2015, results show that the library being well-
lighted and ventilated obtained the highest mean score (4.61); the lowest
mean score is 4.43, which is the comfortable furniture. Based on the
results of these 2 academic years, the 6 items in this dimension had
decrease in the degree of satisfaction in AY 2014-2015, it validated the
qualitative data that stated that the library has to improve its facilities,
provide more seats in the laptop area and to have spacious library. The
findings agree with the study by Norliya (2009) which showed that based
on the mean score of 3.50 and above, the respondents are satisfied with
the lighting, the washrooms, convenient location, and security/safety and
that they consider the library as a good place to concentrate on their
studies and work. This shows that these attributes affect the delivery of
quality library services and it proves that the library environment plays a
vital role in studying and research preparation of the library users.
__________________________
Mean Scores of 1AY 2013-2014 and 2AY 2014-2015, and 3 Statements no. 14 and
no. 16 were the same in the questionnaire. The researcher did not include
statement no. 16 in the results and discussion (Table 7) to avoid confusion.

Departmental Data Analysis 77
The attribute with the highest number of difference (-0.32) is the
“Library is a place conducive to study”. In AY 2013-2014, this attribute has
the highest mean score of 4.80, while in AY 2014-2015 it has a mean score
of 4.48. This may be affected by the increase of number of students who
stay in the library premises during their free time due to the areas, which
enables students to use their laptops and do their academic requirements.
In line with this, group discussions are inevitable inside the library
premises, which results to an increase in the noise, therefore, affects the
other users of the library.
Table 3. Comparative data of the perceived degree of satisfaction on library as
place in AY 2013-2014 and AY 2014-2015 Library as Place
Question No.
Question Text AY 2013-
2014 AY 2014-
2015 Difference
11 The library is well lighted and well ventilated
4.75 4.61 -0.14
13 Signage are clear and helpful 4.74 4.53 -0.21
14 Sufficient seating capacity3 4.71 4.48 -0.23
15 There are places where to use a laptop computer within the library building
4.63 4.52 -0.11
17 Comfortable furniture 4.68 4.43 -0.25
18 Library is a place conducive to study 4.80 4.48 -0.32
Affect of Service
This dimension is about the library staff’s attitude towards the users
and their willingness to help and respond to users’ needs. This section
probed on the respondents’ perceived degree of satisfaction with regards
to the aforementioned.
Results show that the respondents were always satisfied with the
library staff are knowledgeable (mean=1 4.71and 24.52).
__________________________
Mean Scores of 1AY 2013-2014 and 2AY 2014-2015
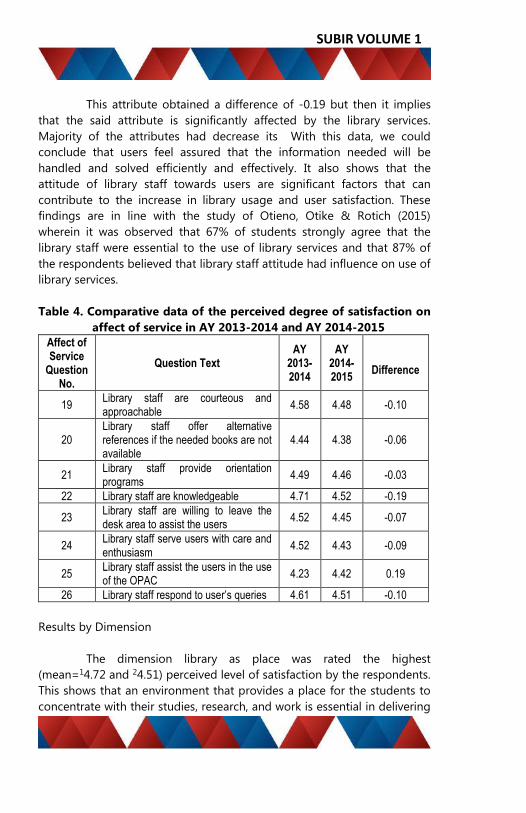
SUBIR VOLUME 1
This attribute obtained a difference of -0.19 but then it implies
that the said attribute is significantly affected by the library services.
Majority of the attributes had decrease its With this data, we could
conclude that users feel assured that the information needed will be
handled and solved efficiently and effectively. It also shows that the
attitude of library staff towards users are significant factors that can
contribute to the increase in library usage and user satisfaction. These
findings are in line with the study of Otieno, Otike & Rotich (2015)
wherein it was observed that 67% of students strongly agree that the
library staff were essential to the use of library services and that 87% of
the respondents believed that library staff attitude had influence on use of
library services.
Table 4. Comparative data of the perceived degree of satisfaction on
affect of service in AY 2013-2014 and AY 2014-2015
Affect of Service
Question No.
Question Text AY
2013-2014
AY 2014-2015
Difference
19 Library staff are courteous and approachable
4.58 4.48 -0.10
20 Library staff offer alternative references if the needed books are not available
4.44 4.38 -0.06
21 Library staff provide orientation programs
4.49 4.46 -0.03
22 Library staff are knowledgeable 4.71 4.52 -0.19
23 Library staff are willing to leave the desk area to assist the users
4.52 4.45 -0.07
24 Library staff serve users with care and enthusiasm
4.52 4.43 -0.09
25 Library staff assist the users in the use of the OPAC
4.23 4.42 0.19
26 Library staff respond to user’s queries 4.61 4.51 -0.10
Results by Dimension
The dimension library as place was rated the highest
(mean=14.72 and 24.51) perceived level of satisfaction by the respondents.
This shows that an environment that provides a place for the students to
concentrate with their studies, research, and work is essential in delivering
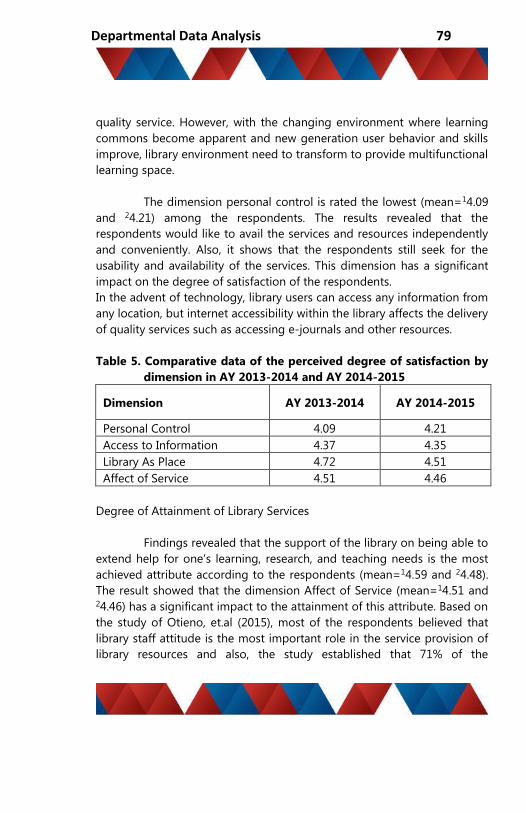
Departmental Data Analysis 79
quality service. However, with the changing environment where learning
commons become apparent and new generation user behavior and skills
improve, library environment need to transform to provide multifunctional
learning space.
The dimension personal control is rated the lowest (mean=14.09
and 24.21) among the respondents. The results revealed that the
respondents would like to avail the services and resources independently
and conveniently. Also, it shows that the respondents still seek for the
usability and availability of the services. This dimension has a significant
impact on the degree of satisfaction of the respondents.
In the advent of technology, library users can access any information from
any location, but internet accessibility within the library affects the delivery
of quality services such as accessing e-journals and other resources.
Table 5. Comparative data of the perceived degree of satisfaction by
dimension in AY 2013-2014 and AY 2014-2015
Dimension AY 2013-2014 AY 2014-2015
Personal Control 4.09 4.21
Access to Information 4.37 4.35
Library As Place 4.72 4.51
Affect of Service 4.51 4.46
Degree of Attainment of Library Services
Findings revealed that the support of the library on being able to
extend help for one’s learning, research, and teaching needs is the most
achieved attribute according to the respondents (mean=14.59 and 24.48).
The result showed that the dimension Affect of Service (mean=14.51 and 24.46) has a significant impact to the attainment of this attribute. Based on
the study of Otieno, et.al (2015), most of the respondents believed that
library staff attitude is the most important role in the service provision of
library resources and also, the study established that 71% of the

SUBIR VOLUME 1
respondents experienced that it was significant to have approachable
library staff.
On the other hand, the issuance of referral letters to library users
for access to other library institution obtained a mean score of 14.18 and
the ability of the library to update its clientele on library holdings and
concerns (mean=24.35) are given the lowest perceived degree of
attainment. Even though the library has already exerted effort to promote
library resources such as new acquisition, print journals, online journal,
and non-print resources, and provide referral letters for an interlibrary
service still has the lowest perceived degree of attainment.
Likewise, the item “The library provides me referral letter to other
library institution” had a difference of 0.21, which occurred an increase of
degree of attainment. This result validates the data of Summary of
issuance of referral letters, in AY 2013-2014, 115 library users requested
referral letters, while in AY 2014-2015 there were only 114 library users. It
shows that the library users are more satisfied in the services in AY 2014-
2015 even though there were lesser number of library users who
requested.
Table 6. Comparative data of the perceived degree of attainment of
library service in AY 2013-2014 and AY 2014-2015
Question No.
Question Text AY
2013-2014
AY 2014-2015
Difference
27 The library keeps me updated in my field of interest.
4.21 4.35 0.14
28 The library helps me choose reliable information 4.41 4.41 0
29 The library provides me referral letter to other library institution
4.18 4.39 0.21
30 In general, I am satisfied with the way the library deal with me and my needs
4.56 4.46 -0.10
31 In general, I am satisfied with the support library is extending for my learning, research, and teaching needs
4.59 4.48 -0.11
_________________
Mean Scores of 1AY 2013-2014 and 2AY 2014-2015

Departmental Data Analysis 81
Quality of Service Provided by the Library
A greater number of respondents (48.75%1 and 50.85%2) find the
quality of the services the library delivered as moderately good. In AY
2014-2015, 1 (0.31%) of the respondents rated the library services as
moderately poor. With this result, the library staff encouraged and
planned for interactive promotional activities to provide to the library
users especially to the students who are doing their research works, thus
these promotional activities will be more appreciated and be beneficial to
them.
Table 7. Comparative data of overall rates on the quality of service provided by the
library in AY 2013-2014 and AY 2014-2015
Rate of Quality Service Frequency Percentage
AY 2013-2014 AY 2014-2015 AY 2013-2014 AY 2014-2015
Extremely Good 31 115 38.75% 35.38%
Moderately Good 39 179 48.75% 50.85%
Good 10 30 1.25 9.23%
Extremely Poor 0 0 0 0%
Moderately Poor 0 1 0 0.31%
Poor 0 0 0 0%
Comments and Suggestions
Qualitative results were grouped based on the following
dimensions: Personal Control (4 and 8) Access to Information (5 and 10)
Library as Place (2 and 4) and Affect of Service (2).
Majority of the comments included the need for a reliable and
consistent internet service and the updated and sufficient copies of
collections. Other comments included the need for additional computer
units and space for laptop usage.
________________
Mean Scores 1AY 2013-2014 and 2AY 2014-2015

SUBIR VOLUME 1
Here are the sample comments of the graduating students:
“Library is very organized”
“Continuous looking for excellent book”
“More internet accessibility within the library premises”
“Need faster internet connection”
“It will be helpful if internet connection will be improved”
“Make more space for the laptop users inside the library”
“more seats in the laptop area”
“Enhance OPAC”
“Library staff are approachable to the students keep it up! :)”
“More books for the hospitality industry must be provided,
computer systems should also be updated must be provided
to provide better service”

Departmental Data Analysis 83
Figure 1. Comparative Data of Qualitative Results in AY 2013-2014
and AY 2014-2015
Conclusions and Recommendations
This study presented information on the library users’ satisfaction
towards the library services, space, and collection. The study found that
library users were satisfied regarding the services, facilities as well as the
collection. Also, the graduating students were highly satisfied with the
library staff who are knowledgeable and can respond to their queries.
Based on the qualitative data, the graduating students admitted
that the library is an essential facility and conducive for learning. The study
concluded that the library users are dependable on the library staff
services for the delivery of library services and the quality and quantity of
the collections and facilities. It is hoped that the information gathered
through this study will be used as for the improvement of library services,
and serve as a contribution to the body of knowledge in the area of user
satisfaction on libraries’ contribution and their services to users.
Moreover, findings of the survey shall be discussed to the library
staff during meetings to address the issues and concerns. The LSD should
coordinate and inform the concerned departments regarding the results
like internet access and facilities. The LSD should develop a program that
enhances students’ research skills and strengthen the discussion and
explanation about the Online Public Access Catalogue thru Destiny Library
Manager. Faculty members shall recommend other books listed in the
syllabus to their students as reference for the certain subject. Lastly,
comments and suggestions of the graduating students will motivate and
it will give encouragement and appreciation to the work of the library staff
to provide them better quality services.

SUBIR VOLUME 1
References
Ball, R. (n.d.). User satisfaction – the key to a library’s success. Retrieved on
November 29, 2016 from
http://skryba.inib.uj.edu.pl/wydawnictwa/e05/ball-n.pdf.
Devi, T. P. & Singh, Y. H. (n.d.). Internet users: a study of Manipur
university library. Retrieved on November 29, 2016 from
http://crl.du.ac.in/ical09/papers/index_files/ical-
94_160_346_1_RV.pdf.
Norliya, A.K. (2009). Evaluating users’ satisfaction on academic library
performance. Malaysian Journal of Library & Information Science,
14(2): 101-115 Retrieved from
http://9icsts2014.um.edu.my/filebank/published_article/2396/750
.pdf.
Otieno, P.O, Otike, J. & Rotich, D. (2015). The effect of library staff attitude
to work on the use of information services in public university
libraries in Kenya. Asia Pacific Journal of Education, Arts and
Sciences, 2 (4). Retrieved from http://apjeas.apjmr.com/wp-
content/uploads/2015/11/APJEAS-2015-2.4.1.12.pdf.
Thanuskodi, S. (2012). Use of online public access catalogue at Annamalai
university library. International Journal of Information Science,
2(6): 70-74.doi: 10.5923/j.ijis.20120206.01
Walton, G. & Leahy, F. (2013). Loughborough university library users’
satisfaction survey: 2012. Retrieved from
http://www.lboro.ac.uk/media/wwwlboroacuk/content/library/
downloads/
surveyresults/Library%20general%20user%20survey%20%282012
%29.pdf.
Departmental Data Analysis 85
Importance and Value of Library Services: Users Perception
EVELYN P. NABUS, RL
LESLIE JOYCE LARITA
Library Services Department
Background
The Library Services Department (LSD) has conducted satisfaction
survey since 2008 to assess the perceive degree of satisfaction of the
users. Qualitative and quantitative results for the last two years has been
analyzed and acted upon.
This academic year, LSD once again administered a survey last
March 2016 to graduating students to measure the quality of services
delivered and the level of importance of the services. This survey
concentrate on the performance, important, and value of the services as
perceive by the users, compare to the previous survey, wherein user
satisfaction was assessed.
The survey questionnaire was customized focused on the specific
services delivered. The questionnaire was shown to Research Department
Director for checking and validation.
The questionnaire used was composed of six parts with two open
ended questions. The following were asked:
1. Performance of the services delivered;
2. Important of the services delivered;
3. Reasons in using the library;
4. Materials/facilities used in the library;
5. Usage pattern.
The respondents were mainly limited to graduating students for
the reason that they were the ones who practically availed the listed
SUBIR VOLUME 1
services. Roughly, 75% (480) of graduating students (644) took the survey.
The study used the stratified non-random sampling to identify the
respondents.
The results were analyzed using descriptive statistics such as
frequency and percentages.
Objectives
The results of this data aims to 1) assess how this group of
respondents perceived the performance of the library services provided; 2)
determine the level of importance of the services provided to the clients;
3) establish the reason in using the library; and 4) discover what
sources/facilities are being used to satisfy the respondents needs.
Presentation and Discussion of Data
Library Usage Pattern
Users visit in the library differ from each other. This statement
proves to be true with the different findings of the study. Walton and
Leahy (2012) study revealed that 44% of the respondents, which is a large
percentage, visit the library weekly compare to 16% who visit on daily
basis. In the study conducted by Shrestha (2008) wherein the respondents
were from three different colleges in Nepal, the findings revealed that
28% of the students from three colleges visits their respective library on
daily basis, and majority (38%) of them visiting it weekly. On the other
hand, the study conducted by Ijiekhuamhen, Aghojare, and Omosekejimi,
(2015) revealed that majority (71%) of the respondents visit the library
every day, 7% once a week, and the others (22%) once a month or twice a
week.
In this study, users were asked how often they use the library to
determine their familiarization with the library services provided. The
results shown in Figure 1, 57% of the respondents visit the library in
weekly basis. However, 6% say that, they visit the library less than once a
month. The findings of this study support the findings of Walton and
Leahy and Shrestha.
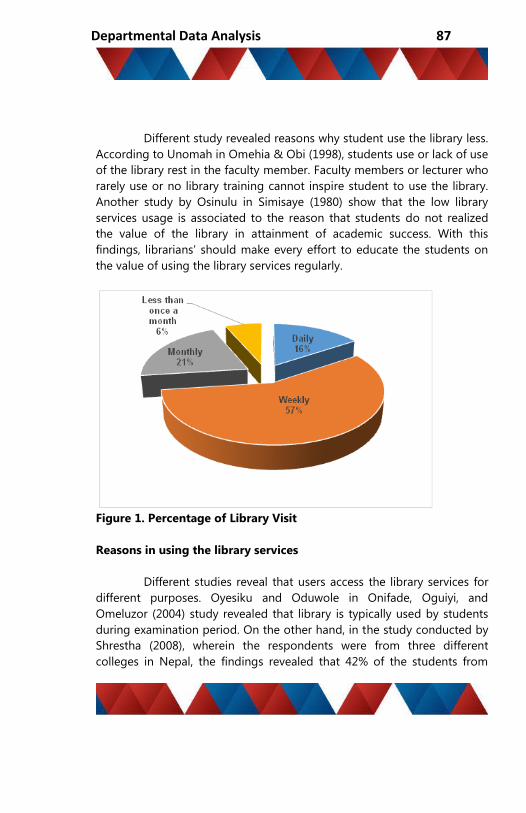
Departmental Data Analysis 87
Different study revealed reasons why student use the library less.
According to Unomah in Omehia & Obi (1998), students use or lack of use
of the library rest in the faculty member. Faculty members or lecturer who
rarely use or no library training cannot inspire student to use the library.
Another study by Osinulu in Simisaye (1980) show that the low library
services usage is associated to the reason that students do not realized
the value of the library in attainment of academic success. With this
findings, librarians’ should make every effort to educate the students on
the value of using the library services regularly.
Figure 1. Percentage of Library Visit
Reasons in using the library services
Different studies reveal that users access the library services for
different purposes. Oyesiku and Oduwole in Onifade, Oguiyi, and
Omeluzor (2004) study revealed that library is typically used by students
during examination period. On the other hand, in the study conducted by
Shrestha (2008), wherein the respondents were from three different
colleges in Nepal, the findings revealed that 42% of the students from

SUBIR VOLUME 1
these colleges visit their respective library to do assigned readings and
27% to update their knowledge. The study of Ijiekhuamhen, Aghojare, and
Omosekejimi (2015) shows that 92% of the respondents purpose in using
the library is due to the availability of the internet and 56% to
borrow/return library materials.
In this study, the top three reasons of the respondents in using
the library in descending order as shown in figure below are: doing
research, for assignment, and borrowing books. For the reason that the
respondents were graduating students, it is evident that they use the
library for writing their research paper.
Figure 2. Reasons in using the library
I. Materials /Facilities use in the library
Different materials or facilities are used to satisfy the purpose or
reason of the user in using the library services. In the study of Mwatela
(2013), in which the respondent were divided in four groups, the findings
revealed that majority of them used print materials and small percentage
used E-resources. Another study conducted by Shrestha (2008), wherein
the respondents were from three different colleges in Nepal, the findings
revealed that 35% of the students used the particular library to borrow
books, and 29% used electronic resources.

Departmental Data Analysis 89
In this study, the respondents were asked what
materials/facilities they used when visiting the library, to establish if their
purpose or reason in using the library were satisfy. Books was the top
most materials use by the respondents, followed by research papers and
computers, while print journals/magazines, electronic resources, and
newspaper clippings were the least materials used by the respondents as
shown in Figure 3. This finding agrees with the study of Mwatela (2013)
and Shrestha (2008), wherein majority of the students use books or
printed materials rather than electronic resources.
It can be concluded that most of the review of related literature
by the respondents was derived from books, and available research paper
(thesis) in the library since the top reason of the respondent for using the
library was doing research, as shown in Figure 2. With these findings, the
librarian should collaborate with the research department.
Figure 3. Materials/facilities used in the library

SUBIR VOLUME 1
Perceived Performance of the Library Services
The degree of performance of the library services varies on the
users actual services received.
In this study, users were asked to rate the performance of the
library services. The findings show that out of 480 respondents, 70% rated
excellence the lighting and ventilation of the library. This finding
corroborates with the study of Johari and Zainab (2007). In the study,
students are very satisfied with the library ambience such as, the library is
spacious, comfortable, and have no difficulty in finding a place to sit. This
findings is also congruent with the previous results of the Letran Library
Satisfaction.
With the result, it can be concluded that library as place is an
essential elements in the learning and research purposes of the users.
In all services provided, two services got the least percentage of
excellence rating from the respondents, with only 45% rating for
computers or “excellent” and only 41% of the respondents rated Internet
access as excellent. For computers, 45% and Internet access 41% of
respondents. Also, 1% and 5% of respondents rated this service poor
respectively. Internet access is a recurring findings in the institutional
Clients Satisfaction Survey and Library Satisfaction Survey for the last two
years. Even though we upgraded our computer facilities last year and
additional bandwidth was subscribe by the MISD, still Internet access is
slow in the library.
The overall perceived performance of the library services
provided was excellence.
Table 1. Perceived performance of the library services
Services Excellence Good Fair Poor N/A
f % f % f % f % f %
Lighting and
ventilation
337 70 129 27 11 2 2 0.4 1 0.2
Reader’s
Services
325 68 152 32 3 1 0 0 0 0

Departmental Data Analysis 91
Collections 287 60 166 35 26 5 1 0.2 0 0
Orientation 275 57 180 38 24 5 0 0 0 0
Referral 270 56 185 39 19 4 3 1 1 0.2
Hours of
Operation
264 55 172 36 14 3 0 0 0 0
Online
Database
248 52 186 39 43 9 3 1 0 0
Computers 218 45 200 42 56 12 5 1 1 0.2
Internet
Access
199 41 188 39 69 14 24 5 0 0
Overall
Rating
277 58 190 40 13 3 0 0 0 0
Level of importance of the library services
Since the library is the central learning place in the institution, it
plays an important role in supporting the learning, teaching, and research
needs of the academic community. The respondents were asked to rate
the level of importance of the library services to them.
The findings show that all library services provided were very
important to the majority (78%) of respondents.
Out of 480 respondents, 80% rated Internet access very
important. The result of this study confirmed the statement of Misra and
Satyanarayan in Devi and Singh (2001) that with the emerging of
technology, a vast of information is available on the web that can support
the research activity of the students. The findings of Devi and Singh (nd)
indicated that internet is very useful in meeting the needed information of
the respondents on their research requirements.
In all services provided, 61% of the respondents rated
magazines/journals as very important, and 58% gave the same rating to
newspaper clippings. These findings agree with the result of the study
conducted by Walton (2012), wherein print journals and newspaper

SUBIR VOLUME 1
clippings rank the lowest level of importance to the respondents. The low
importance of newspaper clippings could be expected, as students are not
familiar with the service. The results in Table 2 validate the results in
Figure 3, wherein the same materials were least used.
With the findings, it can be concluded that students were not
informed where to get needed and reliable related studies for their
Review of Related Literature or Chapter 2 of the research paper. Also, the
librarian should promote journals articles and newspaper clippings as one
resources for literature readings.
Table 2. Level of Importance of the Services
Services
Very important (N=480)
Important (N=480)
Somewhat
important (N=480)
Not Important (N=480)
NA (N=480)
f % f % f % f % f %
Reading areas 388 81 83 17 8 2 1 0.2 0 0
Internet Access 382 80 88 18 9 2 1 0.2 0 0
Reader’s Services 381 79 94 20 5 1 0 0 0 0
Laptop/Drawing Areas
377 79 86 18 16 3 1 0.2 0 0
Research Assistance
369 77 100 21 11 2 0 0 0 0
Computers 367 76 105 22 8 2 0 0 0 0
Online Databases 364 76 107 22 9 2 0 0 0 0
Orientation 338 70 129 27 13 3 0 0 0 0
Referral 307 64 156 33 12 3 1 0.2 4 1
Magazines and Journals
292 61 168 35 20 4 0 0 0 0
Newspaper Clippings
277 58 171 36 31 6 1 0.2 0 0
Overall Rating 375 78 98 20 7 1 0 0 0 0
II. Open ended questions
Respondent were ask about what they value most in the library.
The following were their responses:
The service and the books
aircon

Departmental Data Analysis 93
General Collection Section and College Program
Reference (n=2)
books
I don't have idea!
Best place to study and to borrow books
Books, best place to study
Books
The internet connection, the books, and the lighting
and ventilation
hmmmm. The quiet place.
The books that I borrowed and respect on the
employees/staff inside the library
Books, computers, table, seats and air-conditioning
Everything (n=2)
Books and the internet
Access for education
Book, facilities, aircon and computer
The books, internet, tables and chairs (study area), and
research papers
Based on the comments, the respondents’ value most about the
library focused on the resources, especially books and library as place.
These comments were in line with the respondents’ suggestion in the
study conducted by Norliya and Khasiah (2006), wherein library must
provide updated collections. The findings of Shrestha (2008) shows that
56% of the respondents was motivated with the collections in different
format, while 25% by the quiet place. The groupings of the comments is
shown in the figure.
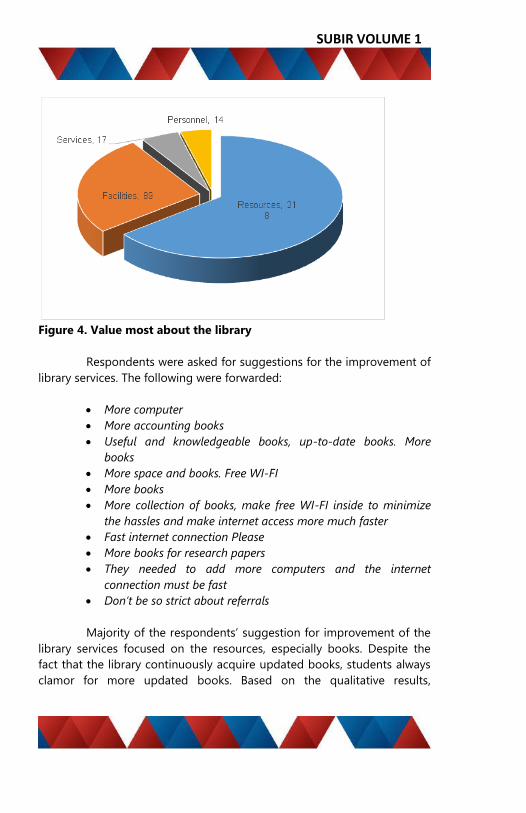
SUBIR VOLUME 1
Figure 4. Value most about the library
Respondents were asked for suggestions for the improvement of
library services. The following were forwarded:
More computer
More accounting books
Useful and knowledgeable books, up-to-date books. More
books
More space and books. Free WI-FI
More books
More collection of books, make free WI-FI inside to minimize
the hassles and make internet access more much faster
Fast internet connection Please
More books for research papers
They needed to add more computers and the internet
connection must be fast
Don’t be so strict about referrals
Majority of the respondents’ suggestion for improvement of the
library services focused on the resources, especially books. Despite the
fact that the library continuously acquire updated books, students always
clamor for more updated books. Based on the qualitative results,

Departmental Data Analysis 95
respondents want more copies of the books used in the classrooms rather
than more titles.
For facilities improvement, respondents’ suggestions focused on
the faster internet connection and additional computers. These findings
validate the previous result in Table 2, wherein internet access and
computer were very important to the students. The groupings of the
suggested improvement are shown in the figure.
Figure 5. Suggestions for Improvement
III. Conclusions
Brophy (2006) stated that performance measures are essential to
library management. It is important that there is definite objective of what
library really wants to achieve for improvement of services. Also, using
different measuring assessment tools provides a clear view of the
importance of library services to users.
SUBIR VOLUME 1
Based on the findings, it can be concluded that majority of the
respondents used books for their writing of research paper and
computers to access online resources or website. Internet access and
computers are the top very important for the respondents. Thus, the need
to continuously improve and upgrade the library facilities and collection is
very vital.
IV. Recommendations
It is recommended that during research class, the teachers
should stress use of journals/magazine as possible materials that student
researcher can use for their review of related literature. Librarian should
promote newspaper clippings as possible research materials. Findings on
facilities can be communicated to concerned department for possible
action. Lastly, faculty members should recommend different books listed
in the syllabus to the students as references for the subject being taught.
References
Brophy, Peter. (Ed). (2006). Measuring Library Performance: Principles and
Techniques. London, UK: Facet Publishing.
Devi, T. P. & Singh, Y. H. (n.d.). Internet users: a study of Manipur
University Library. Retrieved on November 29, 2016 from
http://crl.du.ac.in/ical09/papers/index_files/ical-
94_160_346_1_RV.pdf
Ijiekhuamhen, O.P., Aghojare, B., and Omosekejimi, A.F. (2015). Assess
users’ satisfaction on academic library performance: a study.
International Journal of Academic Research and Reflection. 3(4)
67-77. Retrieved on November 29, 2016 from
http://www.idpublications.org/wp-
content/uploads/2015/05/ASSESS-USERS%E2%80%99-
SATISFACTION-ON-ACADEMIC-LIBRARY-PERFORMANCE-A-
STUDY.pdf
Johari, R. and Zainab, A.N. (2007). Measuring the Library Service
Performance Using SERVPERF. ICOLIS. Kuala Lumpur. Retrieved
Departmental Data Analysis 97
on November 29, 2016 from
http://dspace.fsktm.um.edu.my/xmlui/bitstream/handle/1812/26
8/19MY_Roslah_OK.pdf?sequence=1
Misra J. & Satyanarayana N. (2001). Users of Internet in the University
Library : A Case Study. ILA BULL., 37 (4)
Mwatela, W.M. (2013) Factors Influencing Utilization of Library Services
and Resources: The Case of University of Nairobi Mombasa
Campus Library. Unpublished Research Project. Retrieved
on November 29, 2016 from
http://erepository.uonbi.ac.ke/bitstream/handle/11295/63088/M
watela%2cWilly%20M_%20Factors%20influencing%20utilization
%20of%20library%20services%20and%20resources%20the%20ca
se%20of%20university%20of%20nairobi%20mombasa%20campu
s%20library.pdf?sequence=3&isAllowed=y
Onifade, F.N., Ogbuiyi, S.U. and Omeluzor, S.U. (2013). Library Resources
and Service Utilization by Postgraduate Students in Nigerian
Private University. International Journal of Library and
Information Science. 5 (9) DOI: 10.5897/IJLIS2012.054
Retrieved on November 29, 2016 from
http://www.academicjournals.org/article/article1379701165_Onif
ade%20et%20al.pdf
Osinulu, L.E. (1998). Library Use in Ogun State University: A Survey.
Gateway Journal, 1 (2), 81-87. Retrieved on November 29, 2016
from
http://digitalcommons.unl.edu/cgi/viewcontent.cgi?article=2060
&context=libphilprac
Oyesiku F.A, Oduwole, A.A. (2004). Use of an Academic Library : A Survey
on the Olabisi Onabanjo University Libraries. Lagos J. Inform. Sci.
2:96-101
SUBIR VOLUME 1
Shrestha, N. (2008). A Study on Student Use of Library Resources and Self
–Efficacy. Katmandu, Nepal. Unpublished Research Paper (Thesis)
Retrieved on November 29, 2016 from
http://eprints.rclis.org/22623/1/NinaShrestha.pdf
Simisaye, A.O. (2012). Faculty Use of University Library Resources: A Study
of Tai Solarin University of Education, Ijagun, Ogun State, Nigeria.
Library Philosophy and Practice. Retrieved on November 29,
2016 from
http://digitalcommons.unl.edu/cgi/viewcontent.cgi?article=2060
&context=libphilprac
Unomah, J. I (1998). Students Use of Academic Libraries in Nigeria: The
Example of Two Universities. Nigerian Library and Information
Science Review. 8 (2) 51-57. Retrieved on November 29, 2016
from http://www.webpages.uidaho.edu/~mbolin/omehia-obi-
okon.htm
Walton, G. and Leahy, F. (2012). Loughborough University Library Users’
Satisfaction Survey 2012. Retrieved on November 29, 2016 from
http://www.lboro.ac.uk/media/wwwlboroacuk/content/library/do
wnloads/surveyresults/Library%20general%20user%20survey%20
%282012%29.pdf

Departmental Data Analysis 99
Analysis of Submitted Requisitions (PSRF) for A.Y. 2015-2016
MONETTE K. BAYLON, CPA
Management Accounting and Finance Services Department
Background
One of the critical offices in Management Accounting and
Finance Services Department is the Budget Office that handles all the
requisitions of the Colegio. The office is responsible for maintaining and
controlling the resources of Letran Calamba. The myriad needs of the
institution are being addressed through the use of requisition form
commonly known as “Purchase/Service Requisition Form (PSRF)”.
Requisition includes, but not limited to, goods and services indicated in
PSRF for the Colegio’s operations and/or other legal purposes. These
requisitions will undergo several processes such as budget clearance,
MAFSD Director pre-approval, and VP for Finance approval. Hence, there
is a need to monitor the status of each requisition of all the
departments/offices as to compliance with the required lead time set by
MAFSD. Analyzing these requisitions will benefit the Colegio as the
Budget Officer will be able to discuss well the status to the requestors
enabling them to be more knowledgeable of their various requests.
Knowing this process will contribute to effective management of
the institution’s operation. According to Koontz & O’Donell (2015),
controlling is the measurement and correction of performance activities in
order to make sure that the objectives and plans desired to obtain them
as being accomplished.
Objectives
This paper aimed to:

SUBIR VOLUME 1
1. Identify and assess the percentage of requisitions that complied
with the required timetable for A.Y. 2015-2016; and
2. Identify reasons for non-compliance of requestors with required
lead time.
Departmental Data Analysis 101
Presentation and Discussion of Data
For Academic Year 2015-2016, the Budget Office received a total
of 3,036 PSRFs, out of which, 62% (1,894) was submitted on-time and 38%
(1,142) was submitted late. This figure pertains to the requisitions of all
the departments/offices of the institution. Table 1 on the next page shows
the detailed statistics on requisitions (PSRF) that complied with the
required timetable.
The table shows that there are 25 departments/offices with more
than 50% of on-time requisition, while 11 departments/offices manifested
less than 50% of on-time requisition.
The top three departments/offices that complied with the lead
time are the Medical and Dental Clinic, Accounting Department, and
Management Accounting and Finance Services Department with
percentages of 95, 94, and 92, respectively.
The requestors were not able to comply with the required lead
time set by MAFSD due to some common reasons as indicated below:
1. Memo was finalized late;
2. The schedule was finalized late;
3. Late request due to finalization of program details;
4. The office overlooked the request;
5. The communication was received late; and
6. Confirmation of the target schools was late.

SUBIR VOLUME 1
Table 1. Statistics on requisitions (PSRF) that complied with the
required timetable
Percentage
Department On-Time Urgent/ Rush/ Late
Clinic 95% 5%
Accounting 94% 6%
MAFSD 92% 8%
Auxiliary 85% 15%
MISD 85% 15%
Records 84% 16%
STHM 83% 17%
Library 82% 18%
PMGSD 78% 22%
QMPD 74% 26%
Registrar 69% 31%
Finance 68% 32%
CES 67% 33%
BED-HS 65% 35%
BED-GS 65% 35%
CMD 63% 37%
CAD 63% 37%
SN 60% 40%
SEAS 58% 42%
RD 56% 44%
HRD 56% 44%
SE 55% 45%
KMD 54% 46%
Guidance 53% 47%
SCST 51% 49%
OVPA 43% 58%
StADD 42% 58%
RDD 40% 60%
SBMA 39% 61%
Athletics 38% 62%
Admissions 35% 65%
GSPS 33% 67%
OVPAP 20% 80%
Rector's 19% 81%

Departmental Data Analysis 103
Percentage
Department On-Time Urgent/ Rush/ Late
REMI 13% 87%
RelEd 10% 90%
It can be noticed that the first four reasons of the requestors can
be resolved through proper monitoring of activities and consistent
reminder of the requisition lead times. However, the fifth reason is
uncontrollable if the communications came from external organization
and the sixth reason is obviously beyond the control of the requestor as
he/she is only dependent with the schedules given by other schools.
The MAFSD strives to improve its process to deliver services
effectively and efficiently. This is true with the recently concluded review
of requisition quality policies and procedures. It was deliberated among
MAFSD personnel that certain lead times can be shorten like requests of
cash allowance, courier, Letran token, notarization, and materials/supplies
as per Quality Procedure of Requisition (FD:05-00-QP-04).
During the budget hearing, the Budget Officer also personally
gave a letter to the departments heads on the status of their submitted
requisitions indicating their compliance with the required lead times. The
revised timetable of requisition was also indicated in the letter so the
requestors will be more aware and may use it for future reference.
Conclusions
The data presented shows that 71.43% (25/35) of the total
number of Letran’s departments/offices were able to submit more than
half of their requisitions on-time. However, the remaining 28.57% (10/35)
was unable to comply with the required lead times. This small percentage
of non-compliance may still affect the operation of MAFSD. There are
regular schedules of processing the requests but the occurrence of
rush/urgent requisition may result to late delivery of goods/services. As

SUBIR VOLUME 1
such, it hampers the process of requisition which may also result to
dissatisfied clients.
Recommendations
Proper assessment of each lead time should be conducted every
academic year by the offices of MAFSD such as the Purchasing Office,
Cashier’s Office, Payroll Office, and General Finance Services Office. The
revised lead times should be consistently reminded to the Letran
community. Also, calendared activities should be strictly monitored by the
departments/offices.
With this scenario, the requestors may get their requests
effectively and efficiently.
References Cited
Koontz, H. & O’Donnell, C. (2015). Principles of Management. Retrieved
from http://www.managementstudyguide.com/management_
functions.htm 05 December 2016.

Departmental Data Analysis 105
Analysis of Promissory Note on Back Account
MELINDA S. TANDANG
Management Accounting and Finance Services Department
Background
A culture of conscience, discipline, and excellence is the principle
lived by the Colegio. Hence, providing quality education that is accessible
to all is given an utmost importance for the development of locally and
globally competitive individuals in the future.
Since the Colegio is an educational institution, the primary
source of its fund is from the tuition fees being paid by the students, but
given the economic crisis THE country is facing in, some students were not
able to settle their tuition fees on the set deadline. Thus, this resulted to
the emergence of their back accounts. In line with this, the Colegio gives
consideration to those students who cannot comply with the needed
amount for enrollment. They extend their consideration to the parents
and guardians by implementing the promissory note process every
enrollment period to ensure the attainment of the objective in providing
quality education for all. As stated in the Policy on Promissory Note (FD-
05-00-QP-02) page 3 of 4, paragraph 5.1b.2 “The parent/legal guardian is
required to pay at least half of their back account balance. When payment
is less than the half of the balance, parent/legal guardian should proceed
first to MAFSD for clearance”.
Thus, this paper discussED a descriptive analysis of the
promissory note processes from AY 2014-2015 and AY 2015-2016.
Objectives

SUBIR VOLUME 1
The main objective of this paper was to provide a descriptive
analysis of the implementation of the Promissory Note Quality Procedure
for back account from AY 2014-2015 and AY 2015-2016.
Specifically, it aimed to:
1. Identify and assess the compliance of Basic Education and
Collegiate students on paying 50% of their back account for
Academic Years 2014-2015 and 2015-2016.
2. Determine the trend on the total number of students who
complied with the policy on Promissory Note.
Presentation and Discussion of Data
Last July 2013, the Management Accounting and Finance
Services Department (MAFSD) started to implement its policy in the
promissory note process, which required the students to settle 50% of
their back account. This, had been implemented as it was observed that
there was an increase in the account receivables of the students. Also, this
is a way of ensuring that quality education will be provided by the Colegio
for its stakeholders.
For Academic Year 2014-2015, a total of 416 students with back
account had undergone with the process of promissory note during the
enrollment on June 2014. Among the 416 students, 30 students (7.21%)
were able to comply with the said policy and 386 students (92.79%) were
not able to comply. Table 1 provides the summary of the said data.
Table 1. Summary of students with back account for AY 2014-2015
On the other hand, a total of 346 students had undergone the
process of promissory note for the Academic Year 2015-2016 enrollment.
Number Percentage Number Percentage Number Percentage
Basic Education 5 16.67% 110 28.50% 115 27.64%
College 25 83.33% 276 71.50% 301 72.36%
Total 30 100.00% 386 100.00% 416 100.00%
With 50% and above payment With below 50% paymentDepartment
Total
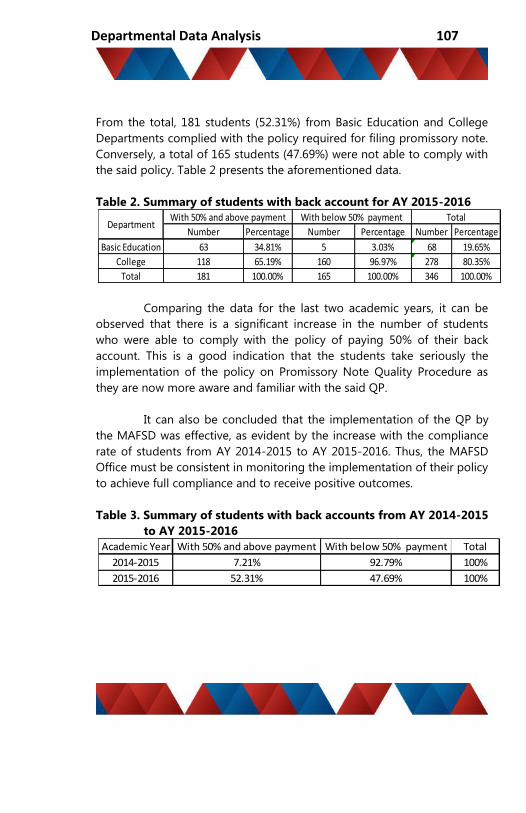
Departmental Data Analysis 107
From the total, 181 students (52.31%) from Basic Education and College
Departments complied with the policy required for filing promissory note.
Conversely, a total of 165 students (47.69%) were not able to comply with
the said policy. Table 2 presents the aforementioned data.
Table 2. Summary of students with back account for AY 2015-2016
Comparing the data for the last two academic years, it can be
observed that there is a significant increase in the number of students
who were able to comply with the policy of paying 50% of their back
account. This is a good indication that the students take seriously the
implementation of the policy on Promissory Note Quality Procedure as
they are now more aware and familiar with the said QP.
It can also be concluded that the implementation of the QP by
the MAFSD was effective, as evident by the increase with the compliance
rate of students from AY 2014-2015 to AY 2015-2016. Thus, the MAFSD
Office must be consistent in monitoring the implementation of their policy
to achieve full compliance and to receive positive outcomes.
Table 3. Summary of students with back accounts from AY 2014-2015
to AY 2015-2016
Number Percentage Number Percentage Number Percentage
Basic Education 63 34.81% 5 3.03% 68 19.65%
College 118 65.19% 160 96.97% 278 80.35%
Total 181 100.00% 165 100.00% 346 100.00%
DepartmentWith 50% and above payment With below 50% payment Total
Academic Year With 50% and above payment With below 50% payment Total
2014-2015 7.21% 92.79% 100%
2015-2016 52.31% 47.69% 100%

SUBIR VOLUME 1
Conclusions
From the analyzed and findings derived, it can be concluded that
the students are now more aware of the new policies and procedures in
settling their outstanding back accounts. This is evident with the increase
in the compliance rate of the students on the policy of Promissory Note
Quality Procedure.
Consequently, this increase is very significant for the Colegio as
this signifies an excellent cooperation between the school administration
and the stakeholders in the objective of providing quality education for
the development of locally and globally competitive individuals.
Recommendations
MAFSD may continuously strengthen its policies and procedures
through strict implementation of securing back account’s promissory
note. This will benefit the Colegio and the parents/guardian in such a way
that the former will decrease its receivables and the latter will be able to
settle their accounts in their most convenient way through time-to-time
coordination with MAFSD.
MAFSD should also ensure that all students with outstanding
back accounts will secure promissory note and will comply with the proper
policies and procedures. Constantly monitoring the status of the file
promissory notes of those students with back accounts should also be
made.
Departmental Data Analysis 109
Suppliers’ Evaluation Analysis
JOSEPH ELIAS C. DE GRANO
Management Accounting and Finance Services Department
Background
To ensure that the performance of the accredited suppliers of the
Colegio is being monitored, the Purchasing Office of the Management
Accounting and Finance Services Department is conducting an evaluation
after each requested item and service has been served. Each supplier will
be evaluated by the End Users and the Purchasing Officer. The result that
will be gathered from both parties will be summarized and assessed as to
the performance of the suppliers. Also, this served as the basis for the
issuance of Supplier’s Action Plan through which the suppliers provide a
course of action to address their negative evaluation findings.
Consequently, this paper sought to discuss a descriptive analysis
of the suppliers’ performance for AY 2014-2015 and AY 2015-2016.
Objectives
The main objective of this paper was to provide a descriptive
analysis of the results of the suppliers’ evaluation for the past two
academic years, 2014-2015 and 2015-2016.
Specifically, it aimed to:
1. Analyze the results of the suppliers’ evaluation based on the
assessment of the End Users and the Purchasing Office;
2. Make sense of the qualitative comments of the end users; and
3. Ascertain if there is an improvement on the performance of the
suppliers that were given a Supplier Action Plan last AY 2014-2015.

SUBIR VOLUME 1
Presentation and Discussion of Data
End-User Evaluation Results
For AY 2014-2015, a total of 94 suppliers were evaluated by the
end users. Among the 94 suppliers, 44 suppliers (46.81%) got an
”excellent” rating, 47 suppliers (50%) got a “very good” rating, 2 suppliers
(2.13%) got a “good” rating, and only 1 supplier (1.06%) got a “fair” rating.
Summarized below are the results of the said data.
Table 1. Summary of suppliers’ evaluation by end User for AY 2014-
2015
Evaluation Number Percentage
Excellent 44 46.81
Very Good 47 50.00
Good 2 2.13
Fair 1 1.06
Total 94 100
Comparatively, a total of 105 suppliers were evaluated by the
end users for AY 2015-2016. There are 55 suppliers (52.38%) who were
given “excellent” ratings, 46 suppliers (43.81%) who were given “very
good” ratings, 3 suppliers (2.86%) who were given “good” ratings, and 1
supplier (0.95%) who was given a “fair” rating. Analyzing the given data, it
can be concluded that there is a significant increase in the number of
suppliers that were given “excellent” ratings from AY 2014-2015 (46.81%)
to AY 2015-2016 (52.38%). This is clearly a good indication that the
suppliers take seriously their oath in providing quality products and
services that will gain satisfaction from the end users of the Colegio. Table
2 presents the summary of suppliers’ evaluation by end users for AY 2015-
2016.

Departmental Data Analysis 111
Table 2. Summary of suppliers’ evaluation by end user for AY 2015-
2016
Evaluation Number Percentage
Excellent 55 52.38
Very Good 46 43.81
Good 3 2.86
Fair 1 0.95
Total 105 100
Consequently, there are suppliers who consistently received
“excellent” ratings from the end users for the past two academic years.
Table 3 shows the list of the said suppliers.
Table 3. List of suppliers who consistently received “excellent” ratings
from the end users for the past two academic years
Supplier Rating
Advance Computer Forms, Inc. Excellent
All Around Services & Merchandising Corp. Excellent
Alpha Laboratory Calamba Philippines Corp. Excellent
CGPS Enterprises Excellent
Copylandia Office Systems Corp. Excellent
DCK Omnibus Trading Excellent
DJ’s Educational Tours Excellent
Gakken Philippines, Inc. Excellent
Grandeur Security Services Corporation Excellent
Infinite Horizons Travel and Tours Excellent
La Limariza Printing Press Excellent
Le Voyageur International Travel Excellent
Aside from the numerical rating given to the suppliers,
comments from the end users were also consolidated. It is of utmost
importance to consider such feedbacks to ensure the quality of products
and services and to prevent possible problems that may occur. Thus, a
thematic analysis was made with regard to the comments received from
the end users. Based on the thematic analysis, a total of four themes were
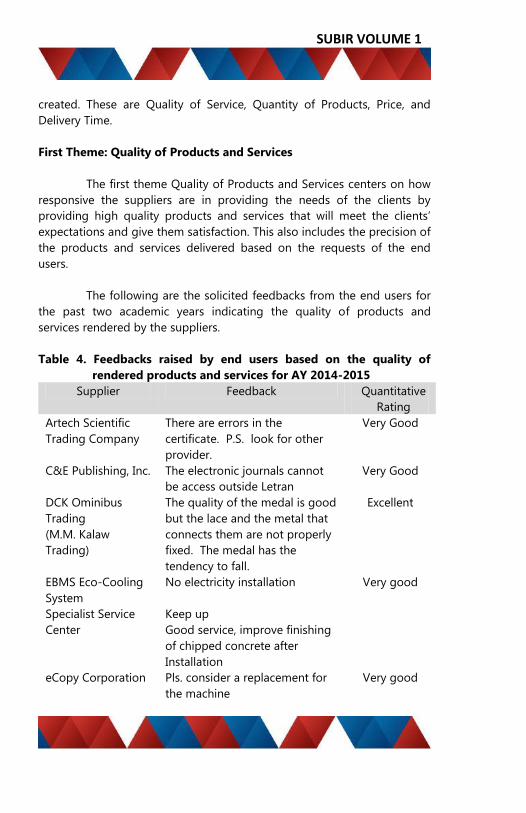
SUBIR VOLUME 1
created. These are Quality of Service, Quantity of Products, Price, and
Delivery Time.
First Theme: Quality of Products and Services
The first theme Quality of Products and Services centers on how
responsive the suppliers are in providing the needs of the clients by
providing high quality products and services that will meet the clients’
expectations and give them satisfaction. This also includes the precision of
the products and services delivered based on the requests of the end
users.
The following are the solicited feedbacks from the end users for
the past two academic years indicating the quality of products and
services rendered by the suppliers.
Table 4. Feedbacks raised by end users based on the quality of
rendered products and services for AY 2014-2015
Supplier Feedback Quantitative
Rating
Artech Scientific
Trading Company
There are errors in the
certificate. P.S. look for other
provider.
Very Good
C&E Publishing, Inc. The electronic journals cannot
be access outside Letran
Very Good
DCK Ominibus
Trading
(M.M. Kalaw
Trading)
The quality of the medal is good
but the lace and the metal that
connects them are not properly
fixed. The medal has the
tendency to fall.
Excellent
EBMS Eco-Cooling
System
No electricity installation Very good
Specialist Service
Center
Keep up
Good service, improve finishing
of chipped concrete after
Installation
eCopy Corporation Pls. consider a replacement for
the machine
Very good
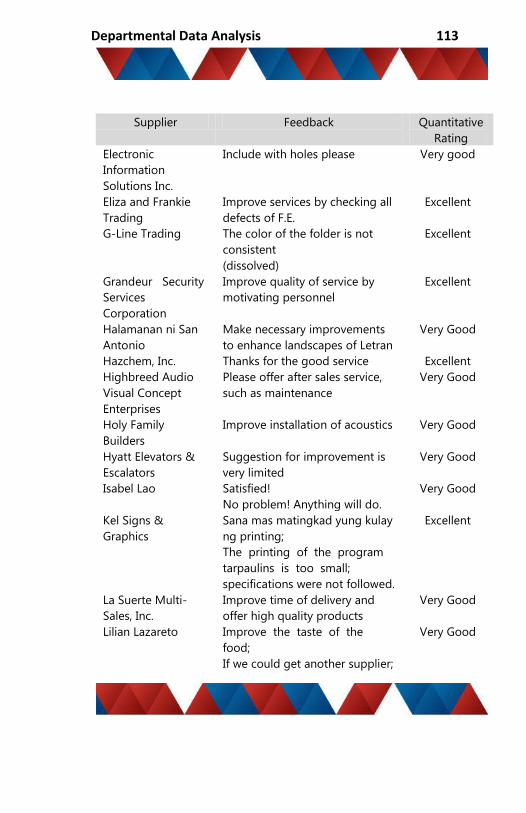
Departmental Data Analysis 113
Supplier Feedback Quantitative
Rating
Electronic
Information
Solutions Inc.
Include with holes please Very good
Eliza and Frankie
Trading
Improve services by checking all
defects of F.E.
Excellent
G-Line Trading The color of the folder is not
consistent
(dissolved)
Excellent
Grandeur Security
Services
Corporation
Improve quality of service by
motivating personnel
Excellent
Halamanan ni San
Antonio
Make necessary improvements
to enhance landscapes of Letran
Very Good
Hazchem, Inc. Thanks for the good service Excellent
Highbreed Audio
Visual Concept
Enterprises
Please offer after sales service,
such as maintenance
Very Good
Holy Family
Builders
Improve installation of acoustics Very Good
Hyatt Elevators &
Escalators
Suggestion for improvement is
very limited
Very Good
Isabel Lao Satisfied!
No problem! Anything will do.
Very Good
Kel Signs &
Graphics
Sana mas matingkad yung kulay
ng printing;
The printing of the program
tarpaulins is too small;
specifications were not followed.
Excellent
La Suerte Multi-
Sales, Inc.
Improve time of delivery and
offer high quality products
Very Good
Lilian Lazareto Improve the taste of the
food;
If we could get another supplier;
Very Good
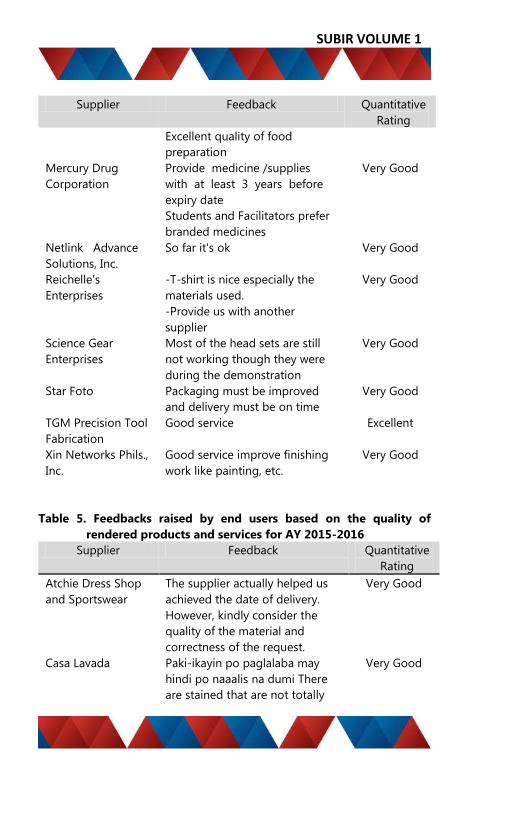
SUBIR VOLUME 1
Supplier Feedback Quantitative
Rating
Excellent quality of food
preparation
Mercury Drug
Corporation
Provide medicine /supplies
with at least 3 years before
expiry date
Students and Facilitators prefer
branded medicines
Very Good
Netlink Advance
Solutions, Inc.
So far it's ok Very Good
Reichelle's
Enterprises
-T-shirt is nice especially the
materials used.
-Provide us with another
supplier
Very Good
Science Gear
Enterprises
Most of the head sets are still
not working though they were
during the demonstration
Very Good
Star Foto Packaging must be improved
and delivery must be on time
Very Good
TGM Precision Tool
Fabrication
Good service Excellent
Xin Networks Phils.,
Inc.
Good service improve finishing
work like painting, etc.
Very Good
Table 5. Feedbacks raised by end users based on the quality of
rendered products and services for AY 2015-2016
Supplier Feedback Quantitative
Rating
Atchie Dress Shop
and Sportswear
The supplier actually helped us
achieved the date of delivery.
However, kindly consider the
quality of the material and
correctness of the request.
Very Good
Casa Lavada Paki-ikayin po paglalaba may
hindi po naaalis na dumi There
are stained that are not totally
Very Good

Departmental Data Analysis 115
Supplier Feedback Quantitative
Rating
removed.
DCK Omnibus
Trading
Please look for and personalized
ribbon (medals) with Letran
marks
Very Good
Electronic
Information
Solutions, Inc.
Too thin and soft. Improve it
next time.
Good
Infinite Horizons
Travel and Tours
Very reliable Excellent
Isabel Lao Thank you very much!;
Very good service;
Please provide additional/new
menu;
Thanks!!! God bless;
Introduce new variety of foods
and drinks;
Walang katumbas;
Thank you po :);
Masarap po;
Salamat po;
Excellent
Kel Signs &
Graphics
Sana magdeliver kayo sa school
hindi puro pick-up;
They should see or the MAFSD
should refer to the size of the
tarp written in PSRF or the file
name of the requested size of
tarp and not on the size of the
saved document. The employee
of the Kel Signs & Graphics will
adjust it as I experienced with
this supplier when I ordered tarp
for personal use. Sorry but 2
times happened that we ordered
Very Good
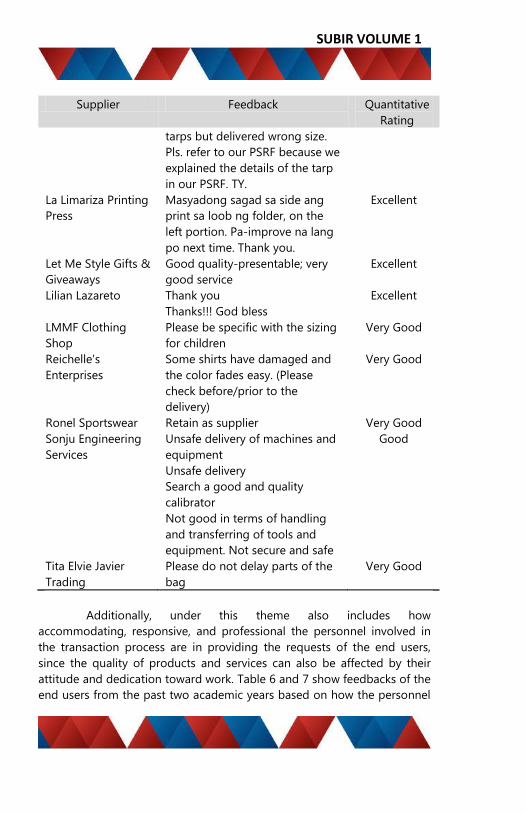
SUBIR VOLUME 1
Supplier Feedback Quantitative
Rating
tarps but delivered wrong size.
Pls. refer to our PSRF because we
explained the details of the tarp
in our PSRF. TY.
La Limariza Printing
Press
Masyadong sagad sa side ang
print sa loob ng folder, on the
left portion. Pa-improve na lang
po next time. Thank you.
Excellent
Let Me Style Gifts &
Giveaways
Good quality-presentable; very
good service
Excellent
Lilian Lazareto Thank you
Thanks!!! God bless
Excellent
LMMF Clothing
Shop
Please be specific with the sizing
for children
Very Good
Reichelle's
Enterprises
Some shirts have damaged and
the color fades easy. (Please
check before/prior to the
delivery)
Very Good
Ronel Sportswear Retain as supplier Very Good
Sonju Engineering
Services
Unsafe delivery of machines and
equipment
Unsafe delivery
Search a good and quality
calibrator
Not good in terms of handling
and transferring of tools and
equipment. Not secure and safe
Good
Tita Elvie Javier
Trading
Please do not delay parts of the
bag
Very Good
Additionally, under this theme also includes how
accommodating, responsive, and professional the personnel involved in
the transaction process are in providing the requests of the end users,
since the quality of products and services can also be affected by their
attitude and dedication toward work. Table 6 and 7 show feedbacks of the
end users from the past two academic years based on how the personnel

Departmental Data Analysis 117
involved in the process responded and rendered the requested item or
service.
Table 6. Feedbacks raised by end users based on how the personnel
involved in the process responded and rendered the
requested item or service for AY 2014-2015
Supplier Feedback Quantitative
Rating
All Around
Services &
Merchandising Corp.
Improve quality of service by
motivating personnel
Excellent
Casa Lavada Very accommodating, supplies
delivered on time
Very Good
DJ's Educational
Tours
They are kind providers.
Sensitive to customer needs;
Very accommodating;
The provider sees to it that the
needs of the clients are
provided.
Excellent
Gakken Philippines,
Inc.
Gakken representative is very
kind. He explains the status of
the machine.
Excellent
Grandeur Security
Services Corporation
Improve quality of service by
motivating personnel
Excellent
La Limariza Printing
Press
Mr. Ramil is very
accommodating. He adjusts his
timeline based on the required
task
Excellent
Le Voyageur
International Travel
Please consider the needs of
others first before enjoying the
places visited
Excellent
Lilian Lazareto Waiters were kind and
accommodating;
The waiters are not well-
groomed.
Very Good

SUBIR VOLUME 1
Supplier Feedback Quantitative
Rating
Septillion Builders Poor delivery of services, lack
monitoring of their personnel
Fair
Table 7. Feedback raised by end users based on how the personnel
involved in the process responded and rendered the
requested item or service for AY 2015-2016
Supplier Feedback Quantitative
Rating
Atchie Dress
Shop and
Sportswear
The supplier actually helped us
achieved the date of delivery.
However, kindly consider the
quality of the material and
correctness of the request.
Very Good
Casa Lavada Paki-ikayin po paglalaba may hindi
po naaalis na dumi There are
stained that are not totally
removed.
Very Good
CDM Trading During the 1st photo shoot, 4
makeup artists used only one hair
iron until the 4th day which caused
delay.
During the 2nd photo shoot, a
commotion happened between
their two personnel; one of the said
personnel displayed
unprofessionalism, he arrived late
and left early CDM Management
decided on a retake issue without
informing the photo shoot in-
charge which caused
noncompliance in the procedure
and miscommunication. Selected
formal shots were not given proper
assistance during the shoot.
Photographers deployed during
Good
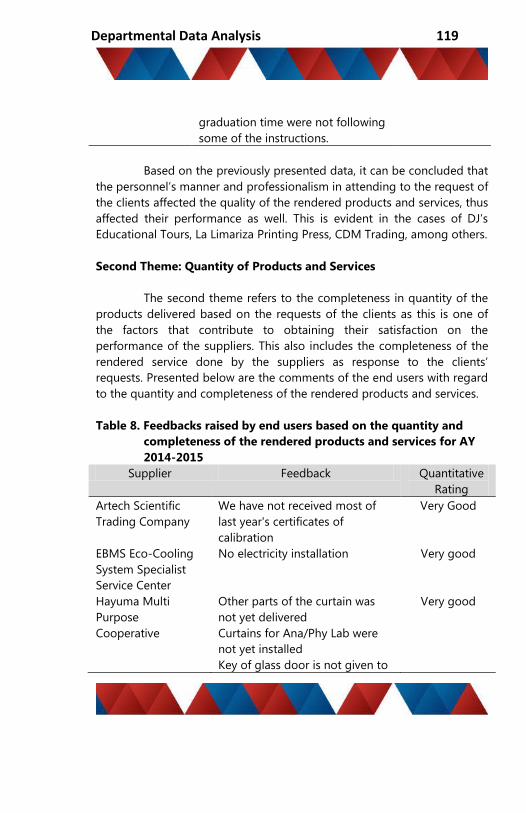
Departmental Data Analysis 119
graduation time were not following
some of the instructions.
Based on the previously presented data, it can be concluded that
the personnel’s manner and professionalism in attending to the request of
the clients affected the quality of the rendered products and services, thus
affected their performance as well. This is evident in the cases of DJ’s
Educational Tours, La Limariza Printing Press, CDM Trading, among others.
Second Theme: Quantity of Products and Services
The second theme refers to the completeness in quantity of the
products delivered based on the requests of the clients as this is one of
the factors that contribute to obtaining their satisfaction on the
performance of the suppliers. This also includes the completeness of the
rendered service done by the suppliers as response to the clients’
requests. Presented below are the comments of the end users with regard
to the quantity and completeness of the rendered products and services.
Table 8. Feedbacks raised by end users based on the quantity and
completeness of the rendered products and services for AY
2014-2015
Supplier Feedback Quantitative
Rating
Artech Scientific
Trading Company
We have not received most of
last year's certificates of
calibration
Very Good
EBMS Eco-Cooling
System Specialist
Service Center
No electricity installation Very good
Hayuma Multi
Purpose
Cooperative
Other parts of the curtain was
not yet delivered
Curtains for Ana/Phy Lab were
not yet installed
Key of glass door is not given to
Very good

SUBIR VOLUME 1
SEAS office; tables and curtain
rods is not yet delivered at c310
Table 9. Feedbacks raised by end users based on the quantity and
completeness of the rendered products and services for AY
2015-2016
Supplier Feedback Quantitative
Rating
CDM Trading Some graduates received
incomplete graduation rite photos
(said issue was observed last year
and was communicated prior the
graduation events).
Good
Tita Elvie Javier
Trading
Please do not delay the parts of
the bag.
Very Good
Third Theme: Price or Cost of the Products and Services
Aside from high quality and completeness, one factor that is of
utmost importance for customer satisfaction is the price or cost of the
products and services. Hence, suppliers must ensure to suffice the needs
of the clients by offering and providing their requests that are within the
allotted budget. Table 10 provides the data regarding the feedbacks of
the end users on the price or cost of the products and services for the
past two academic years.
Table 10. Feedback raised by end users on the price or cost of
products and services for AY 2014-2015
Supplier Feedback Quantitative
Rating
EBMS Eco-Cooling
System Specialist
Service Center
More discounts and free
training for technicians
Very good
Greenpole Industrial &
Trading Corp.
Product too expensive Very Good
Manuel Lara (JRL
Enterprises)
Thanks for the good service
might need recheck prices
for recyclable
Excellent

Departmental Data Analysis 121
TGM Precision Tool
Fabrication
Good price Excellent
Table 11. Feedback raised by end users on the price or cost of
products and services for AY 2015-2016
Supplier Feedback Quantitative
Rating
Humil International
Corporation
Too much high cost of
service provided.
Very Good
Fourth Theme: Delivery Time
Delivery Time refers to how immediate the suppliers respond and
provide the requested items and services of their clients on the date
needed. It also refers on how they adjust their timeline to meet the
requests of the clients within the set time frame. Suppliers gain high rate
of customer satisfaction if products and services are provided on time.
Presented below are the feedbacks raised by the end users on the delivery
time of the suppliers.
Table 12. Feedback raised by end users on the delivery time of the
suppliers for AY 2014-2015
Supplier Feedback Quantitative
Rating
Artech Scientific
Trading Company
They should promptly
issue certificate and
calibration
Very Good
Artline Printing &
Publishing
On-time delivery of Nexo
journals in time for
PACUCOA visit. Thank you!
Excellent
DCK Ominibus Trading
(M.M. Kalaw Trading)
Additional Recognition
medals have been delivered
on time. Thank you Mrs.
Kalaw
Excellent
Gakken Philippines, Late delivery of the drum Excellent

SUBIR VOLUME 1
Inc.
Gomeco Metal
Corporation
Matagal puntahan ang
client kahit super need na
ang service nila
Very Good
Hayuma Multi
Purpose Cooperative
Should be on time on the
specific date needed.
Very Good
Holy Family Builders Check how to improve
timeframe of delivering
project
Very Good
La Limariza Printing
Press
On time delivery
Late delivery
Mr. Ramil is very
accommodating. He adjusts
his timeline based on the
required task
Excellent
La Suerte Multi-Sales,
Inc.
Improve time of delivery
and offer high quality
products
Very Good
Laguna Well Drilling
and Construction
Thank for accommodating
repair ahead of DP
Excellent
Lilian Lazareto The delivery of the lunch
(3rd day) was late.
Very Good
Reichelle's Enterprises Please deliver the items on
time Late delivery - Thanks!
Very Good
Silverstar Pest
Management Services
Ensure to respond
immediately to the request
of Letran for revisit
Very Good
Star Foto Packaging must be
improved and delivery must
be on time
Very Good
Tita Elvie Javier
Trading
Very late delivery Very Good

Departmental Data Analysis 123
Table 13. Feedback raised by end users on the delivery time of the
suppliers for AY 2015-2016
Supplier Feedback Quantitative
Rating
Atchie Dress Shop
and Sportswear
The supplier actually helped us
achieved the date of delivery.
Very Good
Eyelectric
Incorporated
Late delivery Very Good
Humil International
Corporation
Service not provided on-time
(License)
Very Good
Isabel Lao
They delivered the food early.
Good job.
Very on time and delicious
food
Excellent
Kel Signs & Graphics
Thank you for immediately
looking into our request! :)
Very Good
La Limariza Printing
Press
Masyadong sagad sa side ang
print sa loob ng folder, on the
left portion. Pa-improve na
lang po next time. Thank you.
Excellent
Lilian Lazareto
Food delivered on time
Please deliver needed
materials ahead of time.
Excellent
LMMF Clothing Shop
Please deliver on time
Delivery should be done on
time
The polo shirts were not
delivered on the time that
supplier promised.
Very Good
Mercury Drug
Corporation
Suggest to purchase
medicine/supplies on time.
Date needed: Sept 23, 2015,
while received items last Oct. 1
Thanks po.
Very Good
Sonju Engineering Should calibrate within office Good
SUBIR VOLUME 1
Supplier Feedback Quantitative
Rating
Services hours
Was delivered late
Based on the thematic analysis done, it is noticeable that
although “excellent” and “very good” ratings were given to some
suppliers, it does not assert that they will not receive comments or
feedbacks for improvement of the quality of products and services they
have delivered and rendered. This is shown in the cases of All Around
Services & Merchandising Corp., Artech Scientific Trading Company, C&E
Publishing. Inc.,DCK Omnibus Trading, among others. One factor that may
had influenced this scenario is the form used by the end users in
evaluating the performance of the suppliers. Since the criteria in the
evaluation tool are too general, an inconsistency between the quantitative
rating and the qualitative comment was formed. Moreover, this caused
the end users to be effusive in giving their feedbacks and insights
In connection with this, the Purchasing Office released a
Supplier Action Plan to suppliers who received comments or complaints
from the end users. As previously stated, this action plan seeks to ensure
that the suppliers will address their respective findings and guarantee
their commitment for the improvement of their performance by providing
specific courses of actions.
Last AY 2014-2015, a total of 12 suppliers was issued a Supplier
Action Plan. Consequently, the Purchasing Office monitored the
compliance of the said suppliers to ensure that there is an improvement
on their performance. Table 14 provides data regarding the evaluation of
the said suppliers for AY 2015-2016.
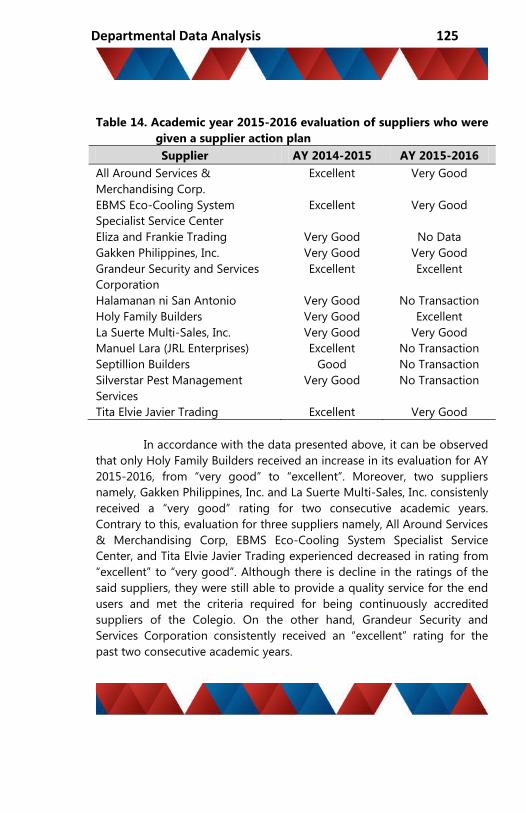
Departmental Data Analysis 125
Table 14. Academic year 2015-2016 evaluation of suppliers who were
given a supplier action plan
Supplier AY 2014-2015 AY 2015-2016
All Around Services &
Merchandising Corp.
Excellent Very Good
EBMS Eco-Cooling System
Specialist Service Center
Excellent Very Good
Eliza and Frankie Trading Very Good No Data
Gakken Philippines, Inc. Very Good Very Good
Grandeur Security and Services
Corporation
Excellent Excellent
Halamanan ni San Antonio Very Good No Transaction
Holy Family Builders Very Good Excellent
La Suerte Multi-Sales, Inc. Very Good Very Good
Manuel Lara (JRL Enterprises) Excellent No Transaction
Septillion Builders Good No Transaction
Silverstar Pest Management
Services
Very Good No Transaction
Tita Elvie Javier Trading Excellent Very Good
In accordance with the data presented above, it can be observed
that only Holy Family Builders received an increase in its evaluation for AY
2015-2016, from “very good” to “excellent”. Moreover, two suppliers
namely, Gakken Philippines, Inc. and La Suerte Multi-Sales, Inc. consistenly
received a “very good” rating for two consecutive academic years.
Contrary to this, evaluation for three suppliers namely, All Around Services
& Merchandising Corp, EBMS Eco-Cooling System Specialist Service
Center, and Tita Elvie Javier Trading experienced decreased in rating from
“excellent” to “very good”. Although there is decline in the ratings of the
said suppliers, they were still able to provide a quality service for the end
users and met the criteria required for being continuously accredited
suppliers of the Colegio. On the other hand, Grandeur Security and
Services Corporation consistently received an “excellent” rating for the
past two consecutive academic years.

SUBIR VOLUME 1
Conversely, evaluation for suppliers such as Halamanan ni San
Antonio, JRL Enterprises, and Septillion Builders were not provided since
there were no transactions made for AY 2015-2016. With regard to
Silverstar Pest Management Services, their contract with the Colegio was
for two years; thus evaluation for their performance for the previous
academic year was not provided. Consequently, transactions were made
with Eliza and Frankie Trading, but there was no evaluation made for their
performance; thus no data was presented above.
Comparing the evaluation of the aforementioned suppliers for
two consecutive academic years, it can be inferred that the Purchasing
Office was able to strictly monitor the performance of the said suppliers as
they were able to dutifully complied with the agreed upon action plan;
hence delivering a quality service to the end users.
Purchasing Officer Evaluation Results
Aside from the assessment of the end users, assessment of the
Purchasing Officer is also an important factor in the over-all performance
evaluation of the accredited suppliers of the Colegio. Unlike with the two-
criteria assessment tool used by the end users in evaluating the suppliers,
the assessment tool used by the Purchasing Officer is more analytic and
provides more thorough evaluation of the suppliers.
For AY 2014-2015, a total of 113 suppliers were evaluated by the
Purchasing Officer. From the total number, 82 suppliers (72.57%) obtained
“excellent” ratings, while 30 suppliers (26.55%) were rated “very good.” A
lone supplier (0.88%) was given a good rating. Table 15 summarizes these
data.
Table 15. Summary of purchasing officer’s evaluation for AY 2014-
2015
Evaluation Number Percentage
Excellent 82 73
Very Good 30 26
Good 1 1
Total 113 100
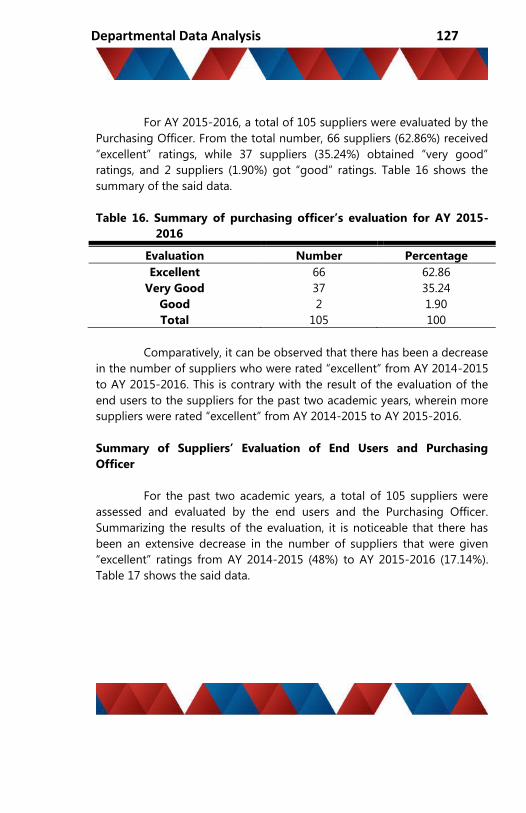
Departmental Data Analysis 127
For AY 2015-2016, a total of 105 suppliers were evaluated by the
Purchasing Officer. From the total number, 66 suppliers (62.86%) received
“excellent” ratings, while 37 suppliers (35.24%) obtained “very good”
ratings, and 2 suppliers (1.90%) got “good” ratings. Table 16 shows the
summary of the said data.
Table 16. Summary of purchasing officer’s evaluation for AY 2015-
2016
Evaluation Number Percentage
Excellent 66 62.86
Very Good 37 35.24
Good 2 1.90
Total 105 100
Comparatively, it can be observed that there has been a decrease
in the number of suppliers who were rated “excellent” from AY 2014-2015
to AY 2015-2016. This is contrary with the result of the evaluation of the
end users to the suppliers for the past two academic years, wherein more
suppliers were rated “excellent” from AY 2014-2015 to AY 2015-2016.
Summary of Suppliers’ Evaluation of End Users and Purchasing
Officer
For the past two academic years, a total of 105 suppliers were
assessed and evaluated by the end users and the Purchasing Officer.
Summarizing the results of the evaluation, it is noticeable that there has
been an extensive decrease in the number of suppliers that were given
“excellent” ratings from AY 2014-2015 (48%) to AY 2015-2016 (17.14%).
Table 17 shows the said data.
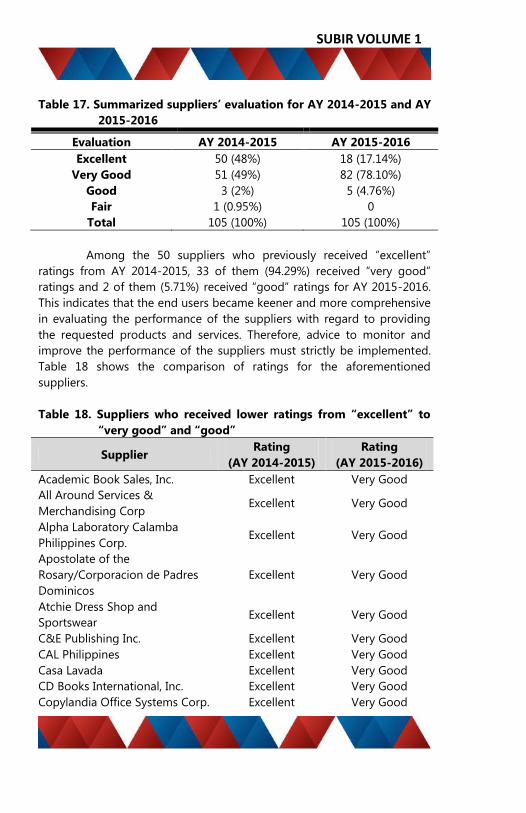
SUBIR VOLUME 1
Table 17. Summarized suppliers’ evaluation for AY 2014-2015 and AY
2015-2016
Evaluation AY 2014-2015 AY 2015-2016
Excellent 50 (48%) 18 (17.14%)
Very Good 51 (49%) 82 (78.10%)
Good 3 (2%) 5 (4.76%)
Fair 1 (0.95%) 0
Total 105 (100%) 105 (100%)
Among the 50 suppliers who previously received “excellent”
ratings from AY 2014-2015, 33 of them (94.29%) received “very good”
ratings and 2 of them (5.71%) received “good” ratings for AY 2015-2016.
This indicates that the end users became keener and more comprehensive
in evaluating the performance of the suppliers with regard to providing
the requested products and services. Therefore, advice to monitor and
improve the performance of the suppliers must strictly be implemented.
Table 18 shows the comparison of ratings for the aforementioned
suppliers.
Table 18. Suppliers who received lower ratings from “excellent” to
“very good” and “good”
Supplier Rating
(AY 2014-2015)
Rating
(AY 2015-2016)
Academic Book Sales, Inc. Excellent Very Good
All Around Services &
Merchandising Corp Excellent Very Good
Alpha Laboratory Calamba
Philippines Corp. Excellent Very Good
Apostolate of the
Rosary/Corporacion de Padres
Dominicos
Excellent Very Good
Atchie Dress Shop and
Sportswear Excellent Very Good
C&E Publishing Inc. Excellent Very Good
CAL Philippines Excellent Very Good
Casa Lavada Excellent Very Good
CD Books International, Inc. Excellent Very Good
Copylandia Office Systems Corp. Excellent Very Good
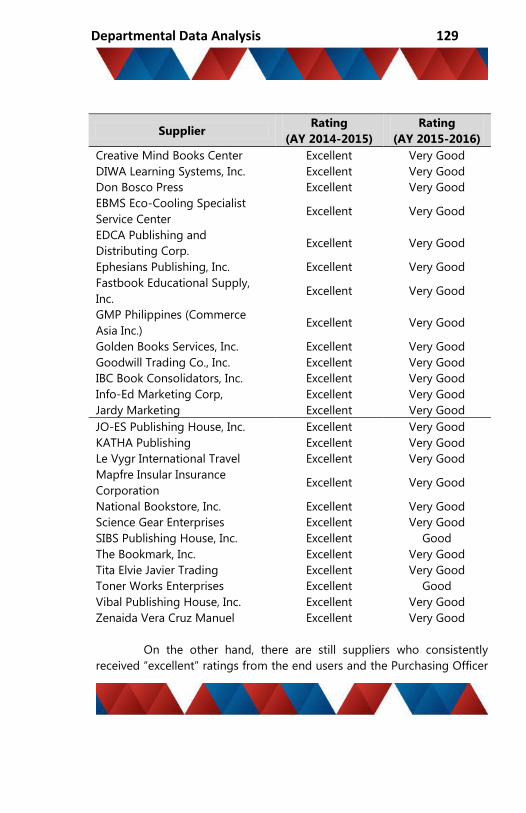
Departmental Data Analysis 129
Supplier Rating
(AY 2014-2015)
Rating
(AY 2015-2016)
Creative Mind Books Center Excellent Very Good
DIWA Learning Systems, Inc. Excellent Very Good
Don Bosco Press Excellent Very Good
EBMS Eco-Cooling Specialist
Service Center Excellent Very Good
EDCA Publishing and
Distributing Corp. Excellent Very Good
Ephesians Publishing, Inc. Excellent Very Good
Fastbook Educational Supply,
Inc. Excellent Very Good
GMP Philippines (Commerce
Asia Inc.) Excellent Very Good
Golden Books Services, Inc. Excellent Very Good
Goodwill Trading Co., Inc. Excellent Very Good
IBC Book Consolidators, Inc. Excellent Very Good
Info-Ed Marketing Corp, Excellent Very Good
Jardy Marketing Excellent Very Good
JO-ES Publishing House, Inc. Excellent Very Good
KATHA Publishing Excellent Very Good
Le Vygr International Travel Excellent Very Good
Mapfre Insular Insurance
Corporation Excellent Very Good
National Bookstore, Inc. Excellent Very Good
Science Gear Enterprises Excellent Very Good
SIBS Publishing House, Inc. Excellent Good
The Bookmark, Inc. Excellent Very Good
Tita Elvie Javier Trading Excellent Very Good
Toner Works Enterprises Excellent Good
Vibal Publishing House, Inc. Excellent Very Good
Zenaida Vera Cruz Manuel Excellent Very Good
On the other hand, there are still suppliers who consistently
received “excellent” ratings from the end users and the Purchasing Officer

SUBIR VOLUME 1
for the past two academic years, indicating their commitment in attaining
quality standards in rendering their products and services for the benefit
of the Colegio. Table 19 shows the list of the said suppliers.
Table 19. List of suppliers who consistently received “excellent”
ratings from end users and Purchasing Officer for the past
two academic years
Supplier Rating
DJ's Educational Tours Excellent
F & J de Jesus, Inc. Excellent
Forefront Book Co., Inc. Excellent
Grandeur Security Services Corporation Excellent
Infinite Horizons Travel and Tours Excellent
Isabel Lao Excellent
Lilian Lazareto Excellent
Neil Castle Print Services Excellent
Phoenix Educational Systems Inc. Excellent
Phoenix Publishing House Excellent
Conclusions
Based on the results of the evaluation for the past two academic
years, majority of the accredited suppliers were still able to meet the set
standards of the clients despite the lower ratings received by some
suppliers. This indicated that they were still able to satisfy the end users in
providing quality products and services to the Colegio.
Relative to this, one factor that may have greatly affected the
suppliers’ evaluation result for AY 2015-2016 is the implementation of
monthly evaluation of end users a the performance of the suppliers with
regard to the products and services they rendered. This is in contrast with
the end user evaluation for the past years, which was done every end of
the academic year. With this new policy, suppliers were evaluated more
sternly as the end users became more thorough and perceptive in
assessing their performance. Therefore, suppliers should be more
committed in providing quality products and services with their clients to
adhere with the set criteria and standards.

Departmental Data Analysis 131
Moreover, it can also be concluded that the Purchasing Office
was able to strictly monitor the performance of the suppliers especially
those who were given a Supplier Action Plan last AY 2014-2015. Those
said suppliers were able to dutifully comply with the agreed upon action
plan in improving their performance for AY 2015-2016. Thus, continuous
implementation of the said action plan could be of great help in providing
a more quality service that will satisfy the standards of the end users.
Recommendations
In the light of the findings and conclusions derived, the following
recommendations were drawn for the continuous improvement of the
evaluation process of the Purchasing Office with the accredited suppliers
of the Colegio:
1. Revise the existing evaluation form utilized by the end users in
assessing the performance of the suppliers to provide a more
analytic and comprehensive evaluation this AY 2016-2017;
2. Revise the existing evaluation tool utilized by the Purchasing
Officer and align its criteria with the evaluation tool used by the
end users to provide a more reliable evaluation; and
3. Conduct a Focus Group Discussion among end users to solicit an
in-depth view of the suppliers’ performance, identify strengths
and weakness, and be able to address issues properly.

SUBIR VOLUME 1
Effectiveness of Integrated Letran School System in the
Colegio
ELA ROSE B. NAGPALA
Management Information System Department
Background
The Letran School System (LSS) is an integrated school system
that caters most of the Colegio’s core processes, particularly in the
Academic and Financial areas. It is designed using a System Development
Lifecycle (SDLC) and Rapid Application Development (RAD) Approach. It
is vital for the department because it is one of the major functions of the
Management Information System and to the Colegio as well, since almost
most the processes of the Departments/Offices were already incorporated
in the LSS. All active personnel of the Colegio are directly and indirectly
using the LSS, as well as its clientele, such as students, parents, and
alumni.
The LSS is being utilized all over the Colegio since 2005. It is
recognized and applied by the end-users (students and personnel of the
Colegio) since it is customized to the Quality Procedures (QPs) and
Process Maps and Work Instructions (PWs) of every department/office.
Several school systems are being widely used worldwide, but
what makes the LSS unique is that it is customized to the needs of the
Colegio and has a front-end maintenance that makes the end-user
independent in managing the system. System enhancement is being
done to continuously attain high level of productivity and vigorously assist
in the decision support system from micro to macro level of the
institution.

Departmental Data Analysis 133
Objectives
Generally, this analysis aimed to determine the effectiveness of
the Integrated Letran School System in the Colegioin terms of people,
process and technology.
Specifically, it also intends to answer the following:
1. What are the challenges encountered in the implementation of
LSS and how are they addressed?
2. What are the common feedbacks and observations in the
implementation of LSS and how they are treated?
3. What are the factors that sustain the utilization of LSS and how
they are maintained?
4. What are the identified strengths and weaknesses of LSS and
how they are considered?
5. What are the outcomes of having an assessment in the
effectiveness of Integrated Letran School System in the Colegio?
Presentation and Discussion of Data
1. What are the challenges encountered in the implementation of
LSS and how they are addressed?
People –Since the initial information system developed on 2005
were the enrolment system and assessment and billing system was
observed that most of the LSS users were not willing to embrace the new
system due to the following reasons:
a. Used to manual process;
b. Unlike excel that can be easily changed;
c. They are not ready to give up their usual process
d. Check and balance approach is not welcome
e. Defining the new system as an additional workload.

SUBIR VOLUME 1
This is in congruent with the study of (Buencillo 2005) – MM-ITM
with the title Students Information Management System of Colegio de
San Juan de Letram( SIMS-CSJL).
Process - During the client requirement specification (CRS)
meetings, most processes are not yet clearly defined, since automation
requires the whole flow of the entire process including the conditions,
filtering, and criteria. Most of the identified processes were the basic need
of the students such as enrolment, adjustment, and faculty loading,
sectioning and room loading for the schools. Some procedures were
defined through continuous simulation of different scenarios that were
encountered by the students such as overloading, pre-requisites, and
simultaneous enrolment. Most of the identified process/procedures were
not yet supported with complete documentation.
One example of the usual process done by the students is the
enrolment. All course offerings were posted in a bulletin board, and the
students will just manually copy their schedule in their advising slip and
proceed to their respective advisers for their chosen courses evaluation
and approval. Once signed as approved by the adviser, the advising slip
will be forwarded to the MIS Department (formerly EDP Department) for
encoding and printing.
There were also forms for every services rendered by offices.
Technology - The IT infrastructure before were just a local area
network that supports the main building, specifically the Cashier Office
and the MIS Department. The cabling of all the offices was then assessed
for recommendation based on the needs per department/office.
Since the ITCC building as well as the IT Surfing laboratories was
newly constructed and utilized, enrolment was done in that building.
2. What are the common feedbacks and observations in the
implementation of LSS and how they are treated?

Departmental Data Analysis 135
People
a. Users tend to disown some of the tasks in a process.
b. It is hard for the users to admit some of the tasks done that
sometimes resulted to wrong output.
c. Process owners were still not completely identified.
d.
Process
a. Process per system module was not yet clearly defined.
b. Based on the processes identified during the initial CRS, it
was commonly observed that one process is dependent to
another process.
Technology
a. There are instances that network downtime is evident.
b. Difficulty in installing updates per system/module.
3. What are the factors that sustain the utilization of LSS and how
they are maintained?
People
a. The Finance Division, in coordination with the MIS
Department, tapped IT experts in the field of project
management.
b. The IT expert trained aspiring systems analysts and system
developers.
c. Continuous end-user’s training
Process
a. Assistance were given in defining accordingly the processes
involve per system module during CRS meeting.
b. Proper documentation were encouraged.
c. Evaluation of implemented process were done through
feedback mechanism.

SUBIR VOLUME 1
Technology
a. Continuous testing in a test Live database is implemented.
b. System Launcher and System Audit Trailing were also
introduced.
c. Server time is implemented in the whole Letran School
System.
4. What are the identified strengths and weaknesses of LSS and
how they are considered?
People
a. Dependent Employees. Productivity of a personnel is
affected. This is a strength to all those who can perform
more efficiently and effectively due to the availability of
data. On the other hand, this can be a weakness to all those
who continuously depend on the system output.
b. Changes in the Organizational Structure. Re-alignment of
personnel requires re—orientation of the LSS being handled
by the personnel’s post.
c. The end-users willingness and cooperation in terms of the
confidentiality of access is also the major strength and also
the major weakness of the school system.
Process
a. In terms of process, system integration provides information
support from the rank and file up to the executive level.
b. Garbage-in will always be garbage-out.
Technology
a. Real-time data is implemented in the whole school system.
b. Network downtimes are a factor that may entails delay in
the update of the whole school system.
c. Security of the system from user access and database
maintenance and monitoring.
Departmental Data Analysis 137
5. What are the outcomes of having an assessment in the
effectiveness of Integrated Letran School System in the Colegio?
a. In terms of people, it reminds and re-orients the
implementers, the needs for improvement both for the
developers, analysts and the system owners.
b. In terms of process, revisiting the policies and procedures in
relation to the MIS systems Helpdesk requisitions as well as
the feedback through evaluation both from system owners
and end-users maintains and support the purpose of having
an integrated school system.
c. In terms of technology, it was also observed through MIS
systems Helpdesk requisitions the need for improvement
both for network, back-up storage and installed
applications.
Conclusions
Implementation of Integrated Letran School System plays a
major role in the operations of the Colegio. It serves as the Enterprise
Resource Planning since it provides start-to-end processes that include
more than half of the services. The implementation of the integration of
all processes considering its common feedbacks, observations, strengths,
weaknesses and how it is sustained by the project developers,
implementers and end-users play a vital role in the Colegio’s operations.
Therefore, the integrity of the whole output of the system should always
be considered and maintained. Enhancement in all areas should always be
monitored in people, process and technology. In this integrated school
system, dependencies are present and whatever is the input it will be
processed and from that activity, the system will based its output. As the
saying goes, Garbage In-Garbage Out.
Awareness of all the involved users and implementers should be
the priority. Realizing every detail of the system will surely provide
continuous support to the academe.
SUBIR VOLUME 1
References Cited
Systems Evaluation (2014-2015, 2015-2016)
Interview with the MIS Director
MIS Systems Helpdesk Requisitions (2014-2015, 2015-2016)
MM-ITM SIMS-CSJL 2005
Departmental Data Analysis 139
Analysis on Letran Calamba Grade School and High School
Alumni Who Continued Studies In Higher Level
(Academic Years 2010-2011 – 2015-2016)
GLORIA C. BATOON
Alumni Office, Academics Division
Background
In the Philippine Education System, education is given
importance, which can be seen by sending children to formal school to
attend pre-school, primary, secondary (Junior and Senior High School),
and tertiary/higher education. Per se, it is interesting to note that the first
21 or 22 years of the lives of every individual are spent in schools,
colleges, and/or universities.
It can be said that having good education can lead to a better,
more rewarding, fulfilling, and prosperous life, not only for the individuals
but also for the community. In going to school, students learn the real
world they live in and also the necessities to succeed in life. Teenagers
are forever being told that they need good education so that they can
have the career they want. It is important to remember that schooling, no
matter how long it may be, lasts for a just a few short years compared to
the rest of years of life ahead. It is better to sacrifice a little bit of fun now
in order to find happiness in later life (Retrieved from
http://www.scholaradvisor.com/essay-examples/ benefits-of-going-to-
school/ on 12 December 2016). To be able to fulfill one’s dream, take one
step at a time, and the first step has got to be through education
(Retrieved from http://www.indigenous.gov.au/david-peachey-shares-
importance-of-going-to school/ on 12 December 2016).
As such, the Colegio, through the Alumni Office, includes in its
key performance indicators (KPIs) the tracking of its Grade School and
High School graduates who continued studies in higher level. The data
from this study may elicit significant information that the Colegio may

SUBIR VOLUME 1
consider in motivating the graduates to continue higher studies in the
secondary (Junior and Senior High School) and tertiary/higher education.
Objectives
1. To present the percentage of the grade school and high school
graduates who continued studies in higher level; and
2. To suggest plan of actions using the available data that may help
the Colegio in some ways.
Presentation and Discussion of Data
As shown in Table 1/Figure 1, all Grade School alumni from AYs
2010-2011 to 2014-2015 continued their studies in High School level.
Moreover, it shows that 85% or more of the graduates continued their
higher studies in Letran Calamba.
Table 1/Figure 1 also reveals that for AY 2015-2016, only 86% of
the graduates were tracked but all of them continued their high school
education. Compared with 85%-87% for the last five years, only 78% of
AY 2015-2016 graduates continued their high school education in the
Colegio. The tracking of the remaining 14% is in progress.
The drop in the percentage of graduates who patronized Letran
Calamba Grade School is a good area for study on retention trend in the
Colegio. Similarly, the other schools where the Letran Grade School
alumni transferred (Table 2) will what factors were considered.
The KPI for the last six years is to maintain the percentage rating
of previous years target of 100%. Although the tracking for AY 2015-2016
is still ongoing, the Colegio expects that all Grade School alumni continue
with their High School education. The BED Records Office may follow-up
the graduates to know the reasons for absence of request of school
records.

Departmental Data Analysis 141
Table 1. Grade School Alumni who Continued Studies in Higher Level,
AYs 2010-2011 – 2015-2016
Academic
Year
Number
of
Graduates
Continued Studies in Higher Level
Letran
Calamba
Other
Schools
No Data
Yet
f % f % f %
2010-2011 127 110 87 17 13 - -
2011-2012 127 108 85 19 15 - -
2012-2013 120 102 85 18 15 - -
2013-2014 110 95 86 15 14 - -
2014-2015 134 114 85 20 15 - -
2015-2016 128 100 78* 10 8* 18 14
*Total = 86%
Figure 1. Grade School Alumni who Continued Studies in Higher
Level, AYs 2010-2011 – 2015-2016
Considering that 8%-15% of the Grade School alumni continued
their High School education in other schools, Table 2 shows the list of 42
schools where those other graduates enrolled. More graduates continued
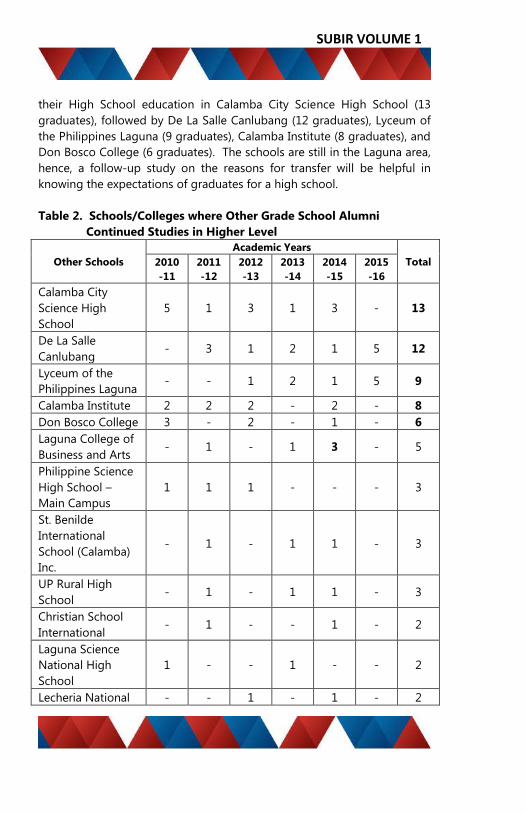
SUBIR VOLUME 1
their High School education in Calamba City Science High School (13
graduates), followed by De La Salle Canlubang (12 graduates), Lyceum of
the Philippines Laguna (9 graduates), Calamba Institute (8 graduates), and
Don Bosco College (6 graduates). The schools are still in the Laguna area,
hence, a follow-up study on the reasons for transfer will be helpful in
knowing the expectations of graduates for a high school.
Table 2. Schools/Colleges where Other Grade School Alumni
Continued Studies in Higher Level
Other Schools
Academic Years
Total 2010
-11
2011
-12
2012
-13
2013
-14
2014
-15
2015
-16
Calamba City
Science High
School
5 1 3 1 3 - 13
De La Salle
Canlubang - 3 1 2 1 5 12
Lyceum of the
Philippines Laguna - - 1 2 1 5 9
Calamba Institute 2 2 2 - 2 - 8
Don Bosco College 3 - 2 - 1 - 6
Laguna College of
Business and Arts - 1 - 1 3 - 5
Philippine Science
High School –
Main Campus
1 1 1 - - - 3
St. Benilde
International
School (Calamba)
Inc.
- 1 - 1 1 - 3
UP Rural High
School - 1 - 1 1 - 3
Christian School
International - 1 - - 1 - 2
Laguna Science
National High
School
1 - - 1 - - 2
Lecheria National - - 1 - 1 - 2

Departmental Data Analysis 143
Other Schools
Academic Years
Total 2010
-11
2011
-12
2012
-13
2013
-14
2014
-15
2015
-16
HS
St. Scholastica’s
College 1 - 1 - - - 2
Affordable
Philippine
Education Center
- - - 1 - - 1
Asian Computer
College (Mayapa) - 1 - - - - 1
Canada - - 1 - - - 1
Canossa Academy - - 1 - - - 1
Caritas Don Bosco
School - - - 1 - - 1
Castor Alviar
National High
School
- 1 - - - - 1
Don Manuel
Rivera Memorial
National HS
- - - - 1 - 1
Green Fields
Integrated School
of Laguna
- - - 1 - - 1
Holy Spirit
Academy of Laoag 1 - - - - - 1
Immaculate
Conception
Catholic School-
Calamba
1 - - - - - 1
Integrated
Montessori
Center(Taguig
City)
- 1 - - - - 1
Italy - 1 - - - - 1

SUBIR VOLUME 1
Other Schools
Academic Years
Total 2010
-11
2011
-12
2012
-13
2013
-14
2014
-15
2015
-16
Liceo De Bay - - - 1 - - 1
Los Baños
National High
School (Poblacion)
- - - - 1 - 1
Mabuhay City
Academy Inc. - - - - 1 - 1
Makiling National
High School - 1 - - - - 1
Maranatha
Christian Academy
(Calamba City)
- 1 - - - - 1
Mary Belle
Montessori - - 1 - - - 1
Mary Help of
Christians College-
Salesian Sisters,
Inc.
- - - - 1 - 1
Pedro Guevara
Memorial National
High School
- 1 - - - - 1
Philippine High
School for the Arts - - 1 - - - 1
San Sebastian
College-Recoletos - - - 1 - - 1
St. John Colleges 1 - - - - - 1
St. Joseph College
- Olongapo Inc. - - - 1 - - 1
St. Vincent College - - 1 - - - 1
System Plus
Computer College
(Caloocan)
- 1 - - - - 1
The Philippines
School 1 - - - - - 1
University of
Perpetual Help - - 1 - - - 1
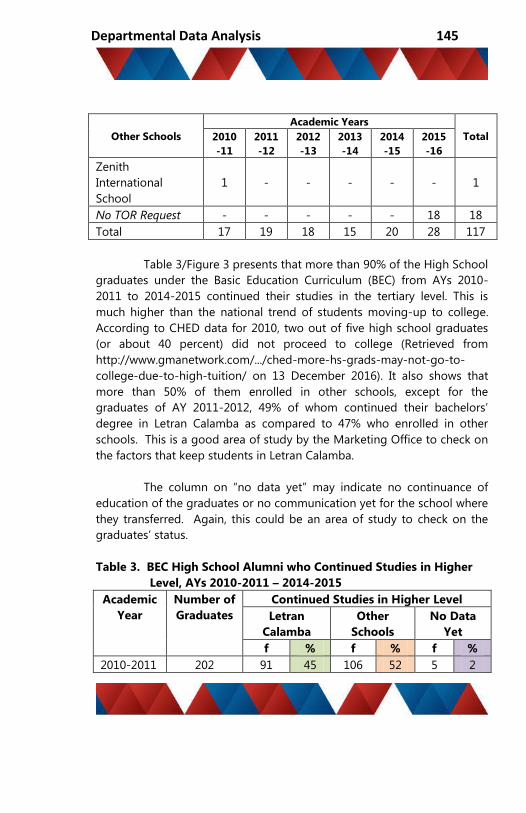
Departmental Data Analysis 145
Other Schools
Academic Years
Total 2010
-11
2011
-12
2012
-13
2013
-14
2014
-15
2015
-16
Zenith
International
School
1 - - - - - 1
No TOR Request - - - - - 18 18
Total 17 19 18 15 20 28 117
Table 3/Figure 3 presents that more than 90% of the High School
graduates under the Basic Education Curriculum (BEC) from AYs 2010-
2011 to 2014-2015 continued their studies in the tertiary level. This is
much higher than the national trend of students moving-up to college.
According to CHED data for 2010, two out of five high school graduates
(or about 40 percent) did not proceed to college (Retrieved from
http://www.gmanetwork.com/.../ched-more-hs-grads-may-not-go-to-
college-due-to-high-tuition/ on 13 December 2016). It also shows that
more than 50% of them enrolled in other schools, except for the
graduates of AY 2011-2012, 49% of whom continued their bachelors’
degree in Letran Calamba as compared to 47% who enrolled in other
schools. This is a good area of study by the Marketing Office to check on
the factors that keep students in Letran Calamba.
The column on “no data yet” may indicate no continuance of
education of the graduates or no communication yet for the school where
they transferred. Again, this could be an area of study to check on the
graduates’ status.
Table 3. BEC High School Alumni who Continued Studies in Higher
Level, AYs 2010-2011 – 2014-2015
Academic
Year
Number of
Graduates
Continued Studies in Higher Level
Letran
Calamba
Other
Schools
No Data
Yet
f % f % f %
2010-2011 202 91 45 106 52 5 2
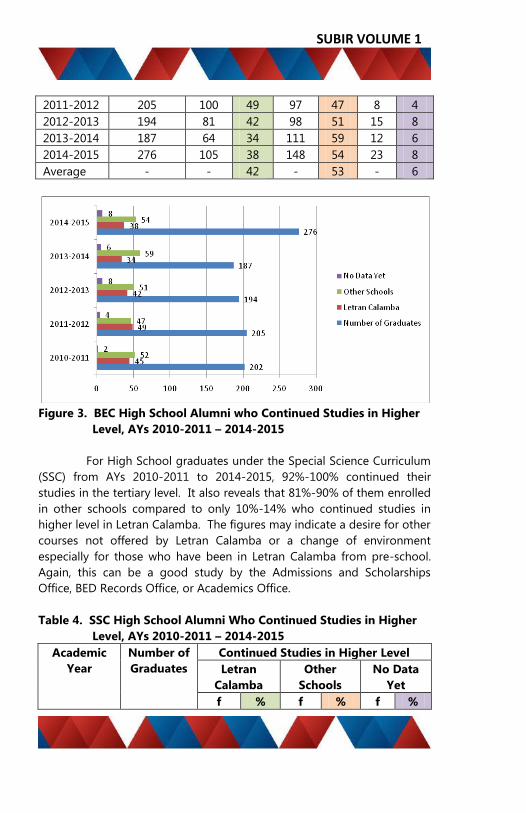
SUBIR VOLUME 1
2011-2012 205 100 49 97 47 8 4
2012-2013 194 81 42 98 51 15 8
2013-2014 187 64 34 111 59 12 6
2014-2015 276 105 38 148 54 23 8
Average - - 42 - 53 - 6
Figure 3. BEC High School Alumni who Continued Studies in Higher
Level, AYs 2010-2011 – 2014-2015
For High School graduates under the Special Science Curriculum
(SSC) from AYs 2010-2011 to 2014-2015, 92%-100% continued their
studies in the tertiary level. It also reveals that 81%-90% of them enrolled
in other schools compared to only 10%-14% who continued studies in
higher level in Letran Calamba. The figures may indicate a desire for other
courses not offered by Letran Calamba or a change of environment
especially for those who have been in Letran Calamba from pre-school.
Again, this can be a good study by the Admissions and Scholarships
Office, BED Records Office, or Academics Office.
Table 4. SSC High School Alumni Who Continued Studies in Higher
Level, AYs 2010-2011 – 2014-2015
Academic
Year
Number of
Graduates
Continued Studies in Higher Level
Letran
Calamba
Other
Schools
No Data
Yet
f % f % f %
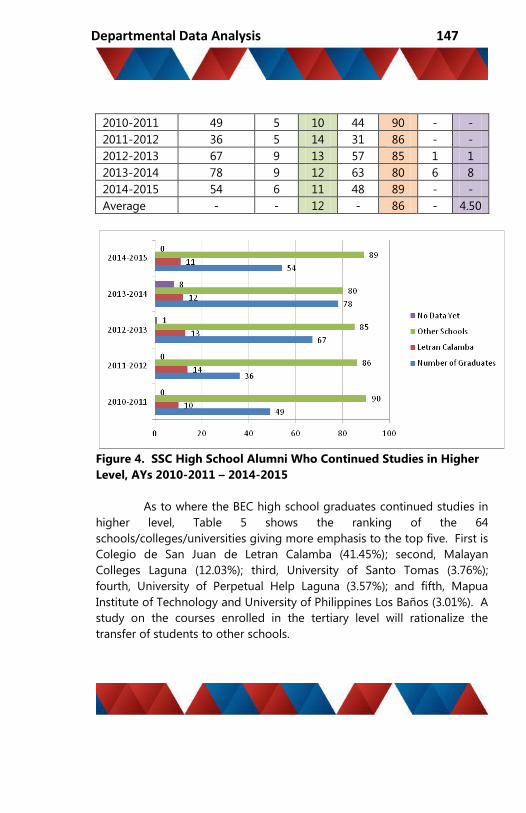
Departmental Data Analysis 147
2010-2011 49 5 10 44 90 - -
2011-2012 36 5 14 31 86 - -
2012-2013 67 9 13 57 85 1 1
2013-2014 78 9 12 63 80 6 8
2014-2015 54 6 11 48 89 - -
Average - - 12 - 86 - 4.50
Figure 4. SSC High School Alumni Who Continued Studies in Higher
Level, AYs 2010-2011 – 2014-2015
As to where the BEC high school graduates continued studies in
higher level, Table 5 shows the ranking of the 64
schools/colleges/universities giving more emphasis to the top five. First is
Colegio de San Juan de Letran Calamba (41.45%); second, Malayan
Colleges Laguna (12.03%); third, University of Santo Tomas (3.76%);
fourth, University of Perpetual Help Laguna (3.57%); and fifth, Mapua
Institute of Technology and University of Philippines Los Baños (3.01%). A
study on the courses enrolled in the tertiary level will rationalize the
transfer of students to other schools.

SUBIR VOLUME 1
Table 5. Schools/Colleges/Universities where BEC High School
Alumni Continued Studies in Higher Level, AYs 2010-2011 –
2014-2015
SCHOOLS/
COLLEGES/
UNIVERSITIES
Academic Year
TOTAL % Rank 10
-
11
11
-
12
12
-
13
13
-
14
14
-
15
Colegio de San Juan
de Letran Calamba 91
10
0 80 64
10
5 440 41.35 1st
Malayan Colleges
Laguna 25 17 22 31 33 128 12.03 2nd
University of Santo
Tomas 12 13 1 3 11 40 3.76 3rd
University of Perpetual
Help System Laguna 12 7 8 8 3 38 3.57 4th
Mapua Institute of
Technology 3 9 10 1 9 32 3.01
5th University of the
Philippines Los Baños 7 7 9 1 8 32 3.01
Lyceum of the
Philippines Laguna 5 5 5 2 8 25 2.35 6th
De La Salle Lipa 7 2 3 4 5 21 1.97 7th
De La Salle
Dasmariñas 2 3 1 8 6 20 1.88 8th
Far Eastern University 4 4 5 2 3 18 1.69 9th
San Beda College
Alabang 1 10 2 2 15 1.41 10th
PATTS College of
Aeronautics 3 1 1 5 4 14 1.32 11th
De La Salle - College
of Saint Benilde 3 2 2 5 1 13 1.22 12th
Lyceum of the
Philippines Manila 1 5 6 12 1.13 13th
Centro Escolar
University 2 2 2 5 11 1.03
14th
De La Salle University 2 1 4 2 2 11 1.03
De La Salle Health
Sciences Institute 1 1 4 2 1 9 0.85
15th Polytechnic University
of the Philippines, Sto.
Tomas Campus
1 1 3 4 9 0.85
University of Perpetual 1 1 5 7 0.66 16th
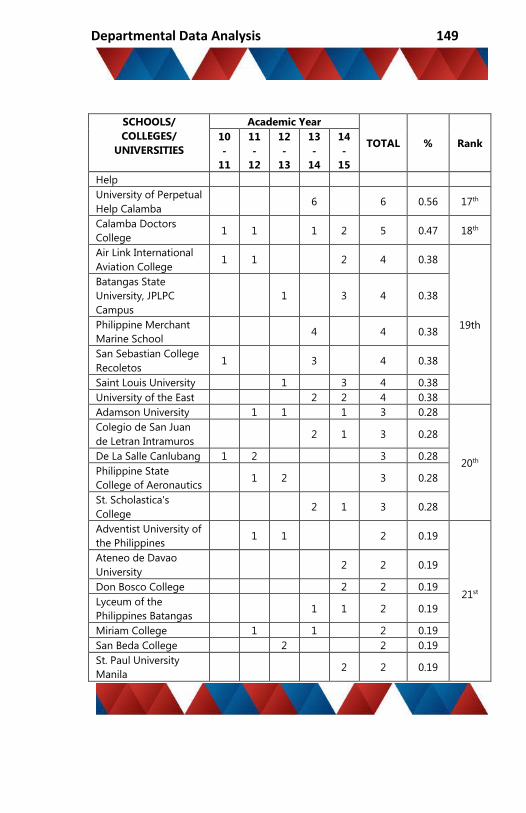
Departmental Data Analysis 149
SCHOOLS/
COLLEGES/
UNIVERSITIES
Academic Year
TOTAL % Rank 10
-
11
11
-
12
12
-
13
13
-
14
14
-
15
Help
University of Perpetual
Help Calamba 6 6 0.56 17th
Calamba Doctors
College 1 1 1 2 5 0.47 18th
Air Link International
Aviation College 1 1 2 4 0.38
19th
Batangas State
University, JPLPC
Campus
1 3 4 0.38
Philippine Merchant
Marine School 4 4 0.38
San Sebastian College
Recoletos 1 3 4 0.38
Saint Louis University 1 3 4 0.38
University of the East 2 2 4 0.38
Adamson University 1 1 1 3 0.28
20th
Colegio de San Juan
de Letran Intramuros 2 1 3 0.28
De La Salle Canlubang 1 2 3 0.28
Philippine State
College of Aeronautics 1 2 3 0.28
St. Scholastica's
College 2 1 3 0.28
Adventist University of
the Philippines 1 1 2 0.19
21st
Ateneo de Davao
University 2 2 0.19
Don Bosco College 2 2 0.19
Lyceum of the
Philippines Batangas 1 1 2 0.19
Miriam College 1 1 2 0.19
San Beda College 2 2 0.19
St. Paul University
Manila 2 2 0.19

SUBIR VOLUME 1
SCHOOLS/
COLLEGES/
UNIVERSITIES
Academic Year
TOTAL % Rank 10
-
11
11
-
12
12
-
13
13
-
14
14
-
15
University of the
Philippines Diliman 1 1 2 0.19
West Bay Colleges Inc.
Alabang 2 2 0.19
Allied Health Sciences
in Nursing 1 1 0.09
22nd
AMA 1 1 0.09
Arellano University 1 1 0.09
Asian Institute of
Maritime Studies 1 1 0.09
Camarines Sur
Polytechnic College 1 1 0.09
Center For Culinary
And Arts 1 1 0.09
De La Salle University
Araneta 1 1 0.09
Emilio Aguinaldo
College 1 1 0.09
I Academy, Makati 1 1 0.09
IKON College 1 1 0.09
Inter-Global College
Foundation, Inc. 1 1 0.09
Laguna College of
Business and Arts 1 1 0.09
Laguna State
Polytechnic University 1 1 0.09
Magsaysay Culinary
School 1 1 0.09
Pamantasan ng
Cabuyao 1 1 0.09
Pamantasan ng
Lungsod ng Maynila 1 1 0.09
Philippine Military
Academy 1 1 0.09
Philippine School of
Interior Design 1 1 0.09
Philippine Marine
Institute 1 1 0.09

Departmental Data Analysis 151
SCHOOLS/
COLLEGES/
UNIVERSITIES
Academic Year
TOTAL % Rank 10
-
11
11
-
12
12
-
13
13
-
14
14
-
15
San Pedro College of
Business
Administration
1 1 0.09
SOFA Design Institute 1 1 0.09
System Plus College 1 1 0.09
Trace College 1 1 0.09
Abroad 6 1 1 1 5 14 1.32 -
no TOR request 5 8 15 12 23 63 5.92 -
TOTAL 202 205 194 187 276 1064 100.00 -
For SSC High School graduates who continued their studies in
higher level, Table 6 shows the ranking of the 39
schools/colleges/universities highlighting the top five. First is the
University of the Philippines Los Baños (34.28%); second, University of
Santo Tomas (13.78%); third, Colegio de San Juan de Letran Calamba
(12.01%); fourth, Malayan Colleges Laguna (5.65%); and fifth, University of
the Philippines Diliman (4.24%). Again, a study on their baccalaureate
degrees will reveal the reasons for the transfer.
Table 6. Schools/Colleges/Universities where SSC High School Alumni
Continued Studies in Higher Level, AYs 2010-2011 – 2014-
2015
SCHOOLS/
COLLEGES/
UNIVERSITIES
Academic Year
TOTAL % Rank 10
-
11
11
-
12
12
-
13
13
-
14
14
-
15
University of the
Philippines Los Baños 24 10 23 22 18 97 34.28 1st
University of Santo
Tomas 3 4 12 13 7 39 13.78 2nd
Colegio de San Juan de
Letran Calamba 5 5 9 9 6 34 12.01 3rd
Malayan Colleges
Laguna 2 2 3 7 2 16 5.65 4th

SUBIR VOLUME 1
SCHOOLS/
COLLEGES/
UNIVERSITIES
Academic Year
TOTAL % Rank 10
-
11
11
-
12
12
-
13
13
-
14
14
-
15
University of the
Philippines Diliman 1 3 2 1 5 12 4.24 5th
Mapua Institute of
Technology 2 1 5 2 10 3.53 6th
De La Salle Dasmariñas 1 2 2 5 1.77 7th
De La Salle University 1 4 5 1.77
Centro Escolar
University 1 1 1 1 4 1.41
8th
San Beda College 1 1 2 4 1.41
Ateneo de Manila
University 2 1 3 1.06
9th
De La Salle - College of
Saint Benilde 2 1 3 1.06
De La Salle Lipa 2 1 3 1.06
Far Eastern University 2 1 3 1.06
University of Perpetual
Help System Laguna 1 1 1 3 1.06
University of the
Philippines Manila 1 1 1 3 1.06
De La Salle Health
Sciences 2 2 0.71
10th
Lyceum of the
Philippines - Laguna 1 1 2 0.71
Maritime Academy of
Asia and the Pacific 1 1 2 0.71
Philippine State College
of Aeronautics 1 1 2 0.71
Saint Louis University 2 2 0.71
Calamba Doctors'
College 1 1 0.35
11th
Cavite State University 1 1 0.35
City College of Calamba 1 1 0.35
De La Salle University
Araneta 1 1 0.35
De La Salle Canlubang 1 1 0.35
De La Salle University
Science & Technology 1 1 0.35
Laguna State
Polytechnic University 1 1 0.35
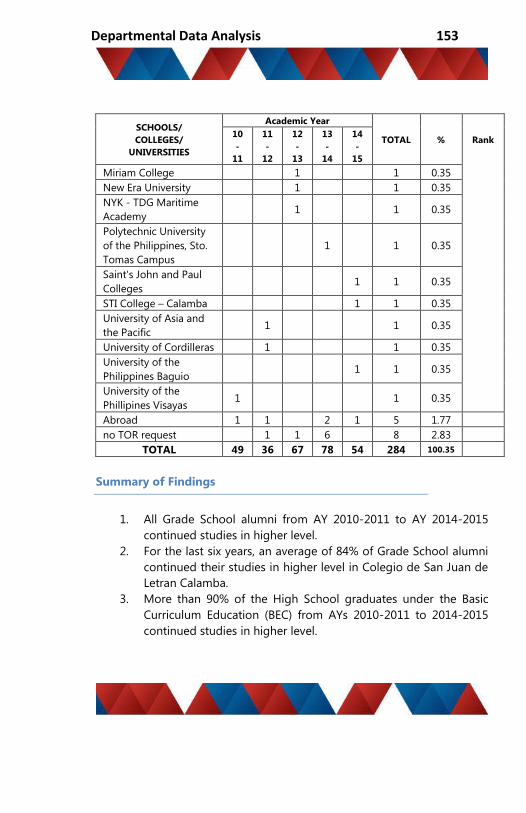
Departmental Data Analysis 153
SCHOOLS/
COLLEGES/
UNIVERSITIES
Academic Year
TOTAL % Rank 10
-
11
11
-
12
12
-
13
13
-
14
14
-
15
Miriam College 1 1 0.35
New Era University 1 1 0.35
NYK - TDG Maritime
Academy 1 1 0.35
Polytechnic University
of the Philippines, Sto.
Tomas Campus
1 1 0.35
Saint's John and Paul
Colleges 1 1 0.35
STI College – Calamba 1 1 0.35
University of Asia and
the Pacific 1 1 0.35
University of Cordilleras 1 1 0.35
University of the
Philippines Baguio 1 1 0.35
University of the
Phillipines Visayas 1 1 0.35
Abroad 1 1 2 1 5 1.77
no TOR request 1 1 6 8 2.83
TOTAL 49 36 67 78 54 284 100.35
Summary of Findings
1. All Grade School alumni from AY 2010-2011 to AY 2014-2015
continued studies in higher level.
2. For the last six years, an average of 84% of Grade School alumni
continued their studies in higher level in Colegio de San Juan de
Letran Calamba.
3. More than 90% of the High School graduates under the Basic
Curriculum Education (BEC) from AYs 2010-2011 to 2014-2015
continued studies in higher level.

SUBIR VOLUME 1
4. An average of 53% of the BEC graduates for the last five years
continued their studies in higher level in other
schools/colleges/universities.
5. For High School graduates under the Special Science Curriculum
(SSC) from AYs 2010-2011 to 2014-2015, 92%-100% continued
studies in higher level.
6. An average of 86% of the SSC graduates for the last five years
continued their studies in higher level in other
schools/colleges/universities.
7. Suggested follow-up studies on the data will help the Colegio in
furthering its interests and thrusts.
Conclusions
1. Majority of the grade school and high school graduates
continued their studies in higher level, hence, Letranites and their
parents/guardians give importance to education.
2. Majority of the grade school alumni continued their high school
in the Colegio, hence, they continue to patronize the Letran
Calamba education.
3. Majority of the high school graduates continued their studies in
higher level in other schools/colleges/universities, thus, Letran
Calamba became a school feeder to other institutions.
4. The data gathered provide baseline data for use by the BED
Records Office, Admissions and Scholarships Office,
Principal/Dean’s Office, or other concerned offices.
Recommendations
1. The BED Records Office and the Alumni Office must continue
tracking the alumni to achieve the target key performance
indicators with regard to continued studies in higher level and
the reasons for the change of school or patronage of Letran
Calamba.
2. Findings of this study may be considered for a full-blown
research, which may assist other departments/offices such as
Auxiliary/Marketing, Admissions, Basic Education, Academics,
Departmental Data Analysis 155
and others in achieving their key performance indicators or
departmental projects and activities, if applicable.
3. As the KPI of maintaining percentage rating of 100% is
unrealistic, the department and division should review the set
target for the next or succeeding academic year/s.
References Cited
http://www.scholaradvisor.com/essay-examples/benefits-of-going-to-
school/ Retrieved on 12 December 2016
http://www.sindigenous.gov.au/david-peachey-shares-importance-of-
going-to school/ Retrieved on 12 December 2016
http://www.gmanetwork.com/.../ched-more-hs-grads-may-not-go-to-
college-due-to-high-tuition/ Retrieved on 13 December 2016
SUBIR VOLUME 1
Analysis of Schools’ Syllabi Submittal
JEJOMAR T. VICENCIO
Academics Division
Background
The syllabus is a descriptive summary of topics and teaching-
learning strategies and assessment to be covered in a course or subject
and is prepared by the Departmental Syllabus Committee. The review of
the syllabus intends to facilitate its development and enhancement so as
to standardize the basics for effective teaching and learning activities and
assessment tasks. The syllabus serves as the blueprint for the course
expectations, requirements, ground rules, readings, assignments, exams,
and learning projects.
The respective Academic Head’s offices are required to submit
the soft copies of all approved OBE Syllabus per program/cluster to the
Office of the Vice President for Academics not later than one week after
the distribution of course outline to the students. This is part of the
operational plan and accomplishment report under Key Result Area (KRA),
quality instructional programs and Key Performance Indicator (KPI) on
percentage of on-time and approved OBE Syllabi per level.
According to the article of “The Purposes of a Syllabus” by Jay
Parkes and Mary B. Harris of the University of New Mexico (2002), there
are three major roles that syllabi may serve with subsequent implications
for syllabus content. These significant functions comprise (a) serving as a
contract, (b) serving as a permanent record, and (c) serving as an aid to
student learning.
Objectives
This paper aims to:
1. Determine the status of on-time syllabus submittal of the
departments in 1st semester AY 2016 – 2017 in terms of KPI
target;
2. Review the status of syllabi submittal in the first semester 2016 –
2017 at the start of the Second semester AY 2016 – 2017;
Departmental Data Analysis 157
3. Determine the status of syllabi submittal of departments due for
accreditation visit in February 2017; and
4. Analyze the factors affecting the on-time and delayed submittal
of the syllabus.
Presentation and Discussion of Data
Some of the stated roles and purposes of the syllabus in the
article of “The Purposes of a Syllabus” by Jay Parkes and Mary B. Harris
(2002), which have contributed to this concern on syllabi, are the
following:
(a) As a contract – the syllabus is a formal agreement between the
students and the instructors, it includes a clear and accurate
delineation and responsibilities for various tasks such as policies
on attendance, assignments, examinations, and grading systems
among others.
(b) As a permanent record – the syllabus is useful as a permanent
record of most academic programs and institutions that choose
to undergo accreditation reviews by professional organizations.
(c) As an aid to student learning – a well-designed syllabus can
provide information that assists students to become more
effective learners in areas that go beyond the opportunity of
their courses. Equally important is the description of how the
course will develop the student’s life.
Letran Calamba is an educational institution that provides quality
instruction to the students in the form of Outcomes-Based Education
(OBE), through which the necessary knowledge, skills, and behavior, which
the global community requires are met. The instruction requires the
department to form syllabus committees to ensure that a fair review,
design, and assessment of the content of each syllabus considered the
current demand of the profession or discipline vis-à-vis the set Mission,
Vision, Quality Objectives, Program Educational Objectives (PEO), Program
Outcomes (PO), and Graduate Attributes (GA). In terms of the
SUBIR VOLUME 1
accreditation efforts of the Colegio through PACUCOA, each academic
program is acknowledged to pursue and meet the expectations of
excellence. This will ensure the delivery of quality education and services
to the students and stakeholders to sustain their needs to reach maximum
potential in their chosen career or field. The syllabus may be considered as
an evidence of knowledge of pedagogy and fairness in evaluation of
students’ learning. On-time and complete submittal of syllabi will aid the
respective area and core area specifically the programs under
accreditation in preparing for the supporting evidences and exhibits for
the accreditation visit. Lastly, a detailed syllabus can play an essential role
in authenticating what a specific course contains. In some universities and
colleges, they use it when students request to transfer credits or
equivalency from one institution to another.
Last May 2016, a meeting with the Academic Heads and
Chairs/Co-Chairs was done and it was agreed that the Syllabus Committee
shall be formed per cluster/program to review the current syllabi or
develop new ones in the case of new courses or absence of the required
syllabi. The effectivity of the syllabi shall be for 3 years, although
enhancement may be done as required. A communication was circulated
to the parties concerned dated June 02, 2016 about the new timeline to
be followed just to provide the transition stage for the full implementation
of the revised QP and in preparation for the Quality Visit. Prior to the
implementation, the OVPA filed the DRF to the QPMD to promote more
concise and clear process/procedure and which took effect on June 22,
2016 in full-force. The deadline set in all levels was August 09 & 10,
2016.
Table 1 shows that the Basic Education Department got the
highest number of on-time submission of syllabi and they hit the target of
90% although the SHS had 76.92% submittal only and 0% submittal in
Religious Education Christian Living Education (CLE). On the other hand,
the collegiate schools garnered only an overall rating of 34% versus the
90% target, a deficit of (56%). It must be noted that SBMA, SCST, and
SEAS were not able to submit any syllabus on-time. Similarly, no on-time
syllabi were made by the GSPS versus the 70% target.

Departmental Data Analysis 159
Table 1. On time submission of OBE Syllabus per Level
Schools &
Department
Total No.
of
Course
Syllabi
No. of
Syllabi
Submitted
on time
Percentage
(%)
of on time
Submission
KPI
Target
GSPS Masteral 31 0 0 70%
GSPS Doctoral 6 0 0
Overall GSPS 37 0 0
SBMA 54 0 0
90%
SCST 42 0 0
SE 112 93 83.04
SEAS 124 0 0
SN 16 7 43.75
STHM 31 27 87.10
RED College 4 2 50
Overall College 383 129 34
BED GS 54 54 100
90% BED JHS BEC 54 53 98.15
BED JHS SSC 63 62 98.41
SHS 13 10 76.92
RED CLE 15 0 0
Overall BED 199 179 90
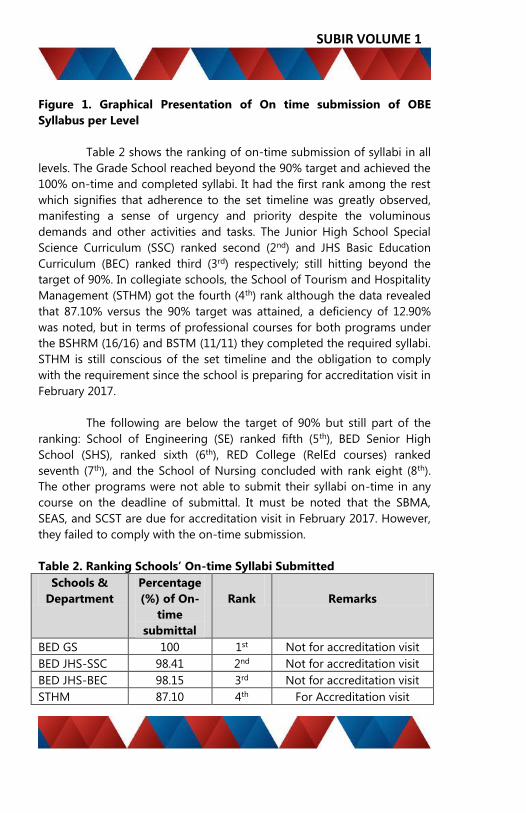
SUBIR VOLUME 1
Figure 1. Graphical Presentation of On time submission of OBE
Syllabus per Level
Table 2 shows the ranking of on-time submission of syllabi in all
levels. The Grade School reached beyond the 90% target and achieved the
100% on-time and completed syllabi. It had the first rank among the rest
which signifies that adherence to the set timeline was greatly observed,
manifesting a sense of urgency and priority despite the voluminous
demands and other activities and tasks. The Junior High School Special
Science Curriculum (SSC) ranked second (2nd) and JHS Basic Education
Curriculum (BEC) ranked third (3rd) respectively; still hitting beyond the
target of 90%. In collegiate schools, the School of Tourism and Hospitality
Management (STHM) got the fourth (4th) rank although the data revealed
that 87.10% versus the 90% target was attained, a deficiency of 12.90%
was noted, but in terms of professional courses for both programs under
the BSHRM (16/16) and BSTM (11/11) they completed the required syllabi.
STHM is still conscious of the set timeline and the obligation to comply
with the requirement since the school is preparing for accreditation visit in
February 2017.
The following are below the target of 90% but still part of the
ranking: School of Engineering (SE) ranked fifth (5th), BED Senior High
School (SHS), ranked sixth (6th), RED College (RelEd courses) ranked
seventh (7th), and the School of Nursing concluded with rank eight (8th).
The other programs were not able to submit their syllabi on-time in any
course on the deadline of submittal. It must be noted that the SBMA,
SEAS, and SCST are due for accreditation visit in February 2017. However,
they failed to comply with the on-time submission.
Table 2. Ranking Schools’ On-time Syllabi Submitted
Schools &
Department
Percentage
(%) of On-
time
submittal
Rank
Remarks
BED GS 100 1st Not for accreditation visit
BED JHS-SSC 98.41 2nd Not for accreditation visit
BED JHS-BEC 98.15 3rd Not for accreditation visit
STHM 87.10 4th For Accreditation visit

Departmental Data Analysis 161
*100
SE 83.04 5th Not for accreditation visit
BED SHS 76.92 6th Not for accreditation visit
RED College 50 7th Not for accreditation visit
SN 43.75 8th Not for accreditation visit
SBMA 0 N/A For Accreditation visit
SCST 0 N/A For Accreditation visit
SEAS 0 N/A For Accreditation visit
GSPS 0 N/A Not for accreditation visit
RED CLE 0 N/A Not for accreditation visit
*professional courses
Table 3 shows that 5 out of 14 completed their syllabi in BED GS,
BED JHS-SSC, BED JHS-BEC, BED SHS, and SN. Majority of the completed
syllabi are from the BED and one from the collegiate schools. The schools
that were able to submit less than 10% of deficiencies are SE (2.58%),
Figure 2. Graphical Presentation of Ranking of Percentage with On-time
syllabi per Level
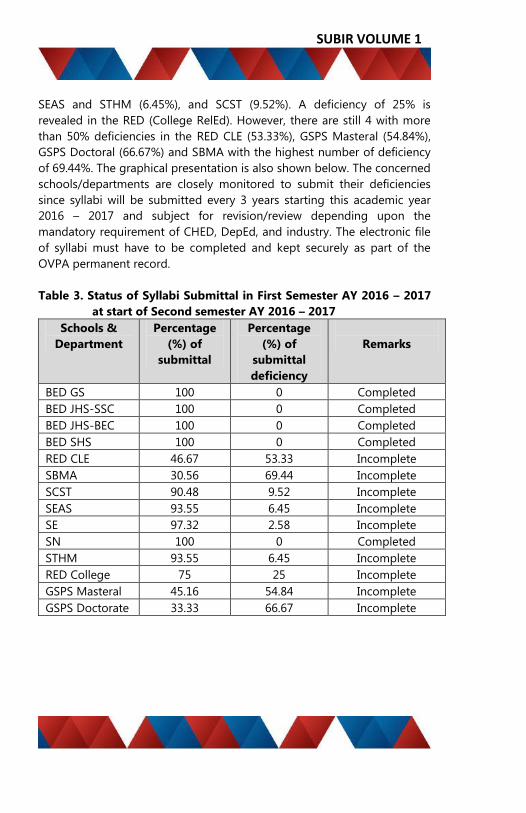
SUBIR VOLUME 1
SEAS and STHM (6.45%), and SCST (9.52%). A deficiency of 25% is
revealed in the RED (College RelEd). However, there are still 4 with more
than 50% deficiencies in the RED CLE (53.33%), GSPS Masteral (54.84%),
GSPS Doctoral (66.67%) and SBMA with the highest number of deficiency
of 69.44%. The graphical presentation is also shown below. The concerned
schools/departments are closely monitored to submit their deficiencies
since syllabi will be submitted every 3 years starting this academic year
2016 – 2017 and subject for revision/review depending upon the
mandatory requirement of CHED, DepEd, and industry. The electronic file
of syllabi must have to be completed and kept securely as part of the
OVPA permanent record.
Table 3. Status of Syllabi Submittal in First Semester AY 2016 – 2017
at start of Second semester AY 2016 – 2017
Schools &
Department
Percentage
(%) of
submittal
Percentage
(%) of
submittal
deficiency
Remarks
BED GS 100 0 Completed
BED JHS-SSC 100 0 Completed
BED JHS-BEC 100 0 Completed
BED SHS 100 0 Completed
RED CLE 46.67 53.33 Incomplete
SBMA 30.56 69.44 Incomplete
SCST 90.48 9.52 Incomplete
SEAS 93.55 6.45 Incomplete
SE 97.32 2.58 Incomplete
SN 100 0 Completed
STHM 93.55 6.45 Incomplete
RED College 75 25 Incomplete
GSPS Masteral 45.16 54.84 Incomplete
GSPS Doctorate 33.33 66.67 Incomplete
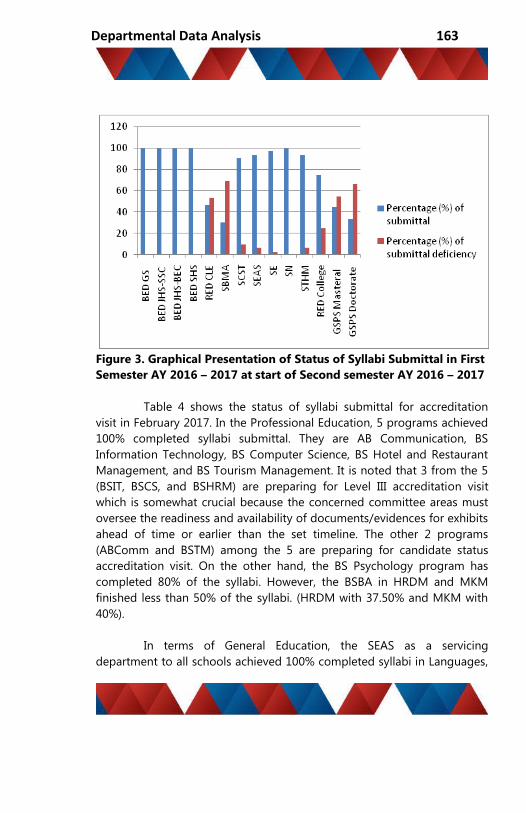
Departmental Data Analysis 163
Figure 3. Graphical Presentation of Status of Syllabi Submittal in First
Semester AY 2016 – 2017 at start of Second semester AY 2016 – 2017
Table 4 shows the status of syllabi submittal for accreditation
visit in February 2017. In the Professional Education, 5 programs achieved
100% completed syllabi submittal. They are AB Communication, BS
Information Technology, BS Computer Science, BS Hotel and Restaurant
Management, and BS Tourism Management. It is noted that 3 from the 5
(BSIT, BSCS, and BSHRM) are preparing for Level III accreditation visit
which is somewhat crucial because the concerned committee areas must
oversee the readiness and availability of documents/evidences for exhibits
ahead of time or earlier than the set timeline. The other 2 programs
(ABComm and BSTM) among the 5 are preparing for candidate status
accreditation visit. On the other hand, the BS Psychology program has
completed 80% of the syllabi. However, the BSBA in HRDM and MKM
finished less than 50% of the syllabi. (HRDM with 37.50% and MKM with
40%).
In terms of General Education, the SEAS as a servicing
department to all schools achieved 100% completed syllabi in Languages,
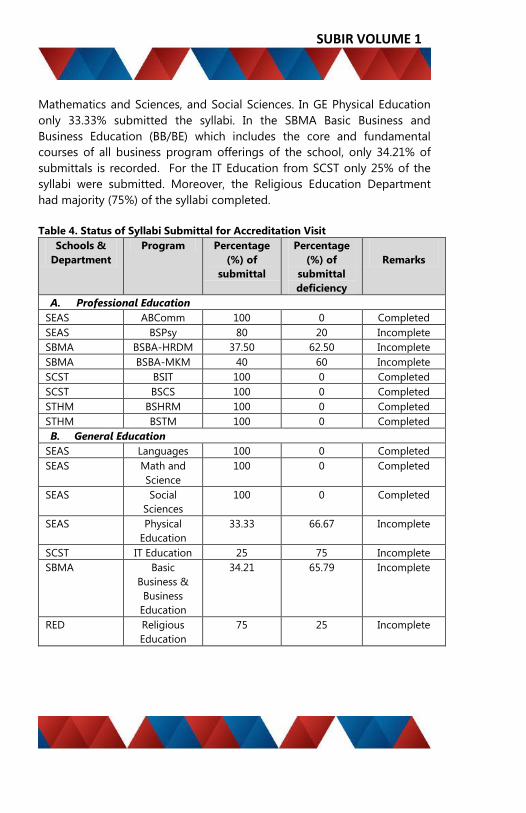
SUBIR VOLUME 1
Mathematics and Sciences, and Social Sciences. In GE Physical Education
only 33.33% submitted the syllabi. In the SBMA Basic Business and
Business Education (BB/BE) which includes the core and fundamental
courses of all business program offerings of the school, only 34.21% of
submittals is recorded. For the IT Education from SCST only 25% of the
syllabi were submitted. Moreover, the Religious Education Department
had majority (75%) of the syllabi completed.
Table 4. Status of Syllabi Submittal for Accreditation Visit
Schools &
Department
Program Percentage
(%) of
submittal
Percentage
(%) of
submittal
deficiency
Remarks
A. Professional Education
SEAS ABComm 100 0 Completed
SEAS BSPsy 80 20 Incomplete
SBMA BSBA-HRDM 37.50 62.50 Incomplete
SBMA BSBA-MKM 40 60 Incomplete
SCST BSIT 100 0 Completed
SCST BSCS 100 0 Completed
STHM BSHRM 100 0 Completed
STHM BSTM 100 0 Completed
B. General Education
SEAS Languages 100 0 Completed
SEAS Math and
Science
100 0 Completed
SEAS Social
Sciences
100 0 Completed
SEAS Physical
Education
33.33 66.67 Incomplete
SCST IT Education 25 75 Incomplete
SBMA Basic
Business &
Business
Education
34.21 65.79 Incomplete
RED Religious
Education
75 25 Incomplete

Departmental Data Analysis 165
Figure 4. Graphical Presentation of Status of Syllabi Submittal for
Accreditation Visit (A. Professional Education)
Figure 5. Graphical Presentation of Status of Syllabi Submittal for
Accreditation Visit (B. General Education)
SUBIR VOLUME 1
To come up with data analysis that will fully assist the in-
charge/parties concerned on the development of certain duties/office
functions, the department assistant conducted an interview among
selected faculty members on the causes of on-time and delayed
submission of the syllabi.
Based on the interview, the following are the contributing and
impeding factors affecting on-time submittal of syllabi:
Contributing factors consist of the following:
Assignments of courses depend on the faculty’s expertise;
Having common time to convene and discuss during the
scheduled syllabi committee conference.
Use of spare time to discuss and collaborate on how to integrate
new trends in syllabus making (usually during scheduled out of
town seminar/conference.
Set deadline by the OVPA; faculty manages time to review and
take appropriate action accordingly prior to submission.
Posting of chairs’ announcement in the faculty room to remind
the faculty.
Consistent monitoring of the submittal by the Chairs and Admin
Assistant prior to the set deadline.
Strict implementation of deadline of submittal by the Chairs/Co-
Chairs.
Willingness of the Academic Heads/Chairs/Co-Chairs to assist
faculty members, and mentor the new ones in preparing and
enhancing the syllabi.
The following are the impeding factors to the on-time submittal of the
syllabus:
Faculty 1
Deferment of instructional materials needed, limited budget to
comply with the minimum requirements/standards of CHED
which have to be integrated in the syllabi, and limited
references in the library.

Departmental Data Analysis 167
Faculty 2
Lack of readiness on how to make necessary actions on the
revisions of the syllabi
Semestral demands of modification in the syllabus like
Integration of values inculcation that will have to be manifested
by the students, making rubrics that should be reflected on the
last part of the syllabi, and changes in the teaching learning
activities (TLA) and assessment tasks that may cause repetition of
activities.
Faculty 3
Difficulty of faculty to secure the signature of the Chief Librarian
due to unavailable references in the library
Faculty 4
Ineffective communication process
Faculty 5
Lack of time to revise necessary changes in the topics that will
have to be integrated in the syllabus.
Wrong use of format even though the syllabi are almost done;
need to transfer to the latest version or format of the syllabus.
Lack of available resources in the library
Faculty 6
New procedure for new faculty. Lack of proper orientation, lack
of time, lack of references in the library, delay of release from the
library, lack of common time of faculty who teaches the same
subject to meet and discusses their syllabus.
Faculty 7
Process of communication delays submittal although there are
lots of means on how to reach. Many tasks of the faculty, and
unable to use their social media or email.

SUBIR VOLUME 1
Faculty 8
Cascading of information is not properly executed by the
department.
Faculty 9
Difficulty of getting references from the library services
department.
Faculty 10
Delayed composition of the syllabi committee might be a reason
for the delay of modification of syllabi and uncommon time to
convene with their respective syllabi committee.
Conclusions
To sum it up, majority of the schools were not able to meet the
KPI target of prompt submittal except for the Basic Education Department
with an overall rating of 90% against 90% divisional target. It is noted that
the programs under SEAS (AB Communication and BS Psychology), SBMA
(BSBA in HRDM and MKM), and SCST (BSIT and BSCS) which are
scheduled for PACUCOA accreditation visit in February 2017 were not able
to meet the departmental and divisional target of on-time submittal.
As to the status of syllabi submittal verified last November 30,
2016, there are 5 programs with 100% completed syllabi in Basic
Education Department (GS, JHS-SSC, JHS-BEC, and SHS) and in the
Collegiate (SN). The remaining 9 programs revealed deficiencies of less
than 10% (SE, SEAS, STHM, and STHM); 25% in RED (College RelEd); and
more than 50% in RED CLE (BED), GSPS Masteral, GSPS Doctoral, and
SBMA.
With regard to the status of syllabi of programs for accreditation
visit in February 2017, the Professional Education programs under AB
Communication, BS Information Technology, BS Computer Science, BS
Hotel and Restaurant Management and BS Tourism Management attained
100% complete syllabi while the BS Psychology garnered 80%, BSBA
Marketing Management 40%, and BSBA Human Resource Development
Management with only 37.50%. On the other hand, in General Education,
only 3 clusters completed the submittal from SEAS (Languages, Math and
Departmental Data Analysis 169
Sciences, and Social Sciences). The rest had deficiencies ranging from 25%
to 75%.
In terms of factors affecting the on-time submittal of syllabi
based on selected interview among faculty members, despite their
multiple duties and responsibilities, they still manifest a sense of
responsibility and discipline to contribute to the achievement of the
respective department. However, the impeding factors affecting submittal
revealed that majority cited the lack of references from the Library and the
process of communication within the department.
If the pattern of submittal is not arrested in the college, the same
problem and issues will occur.
Recommendations
1. The academic schools should analyse the root-cause of not-
attaining the prompt submittal of the syllabi. (i.e. a timeline for
submission of electronic copies for submittal in cooperation of
teachers)
2. The academic departments must prepare the syllabi on-time
considering the review and approval of parties concerned.
3. BED should sustain the prompt submittal of syllabi by tapping on
their strengths and lessening the weakness.
4. The general education syllabi have to be prepared early so as not
to affect the overall syllabi submittal of programs.
5. The Library should provide a list of references for each
school/department per program/cluster to aid them in utilizing
all references in order to meet the departmental and divisional
KPI target and also to comply with accreditation standards and
requirements.
6. The concerned department should plan earlier the composition
of the syllabi committee and secure the common time for the
committee to discuss the content of the syllabi through the help
of technology (i.e. online conference in social media, group chat
SUBIR VOLUME 1
in messenger) or other ways of communication as agreed by the
committee.
Reference
http://jan.ucc.nau.edu/~coesyl-p/syllabus_cline_article_2.pdf
Departmental Data Analysis 171
Trend Analysis of Faculty Development Activities
(AY 2014-2015 to AY 2016-2017)
RODELYN A. BADULIS
Academics Division
Background
The Faculty Development Activities (FDA) aims to provide a
venue for faculty to improve one’s career and vocation as a teacher. The
Colegio, guided by its Institutional Principles, provides a development
plan through FDA to support personal and teaching effectiveness of
faculty members and for the benefits of the students as well.
All full time faculty members in the Collegiate and Basic Education
Department (BED) are covered by FDA. The activities that can be applied
for FDA are the following:
1. Graduate studies (one FDA unit for every graduate unit enrolled).
The program must be aligned with the personnel development
plan of the faculty.
2. Academic Consultation and/or Section Advising
3. Research Related activities such as Research Project, Instructional
Materials
4. Community and Extension Services
In the Academic Consultation and Section Advising, all FT faculty
are mandated to conduct these activities every semester.
The permanent faculty members receive corresponding payment
based on the activity applied and the approved faculty load equivalency.
The probationary and full-time substitute faculty members shall be given
merit through the faculty merit system under Human Resource
Department (HRD). The faculty Load Equivalency is the load equivalent to
the approved FDA to be rendered by a qualified full time faculty member
in addition to a regular load assignment of 18 hours or units. A maximum

SUBIR VOLUME 1
load of six hours/units per semester is credited to FDA that is not under
the personnel development program and fund assistance or scholarship
program of Human Resource Department (HRD) or external agency,
including research assistance under the Research Department (RD) and
Graduate Research (AR:00-00-QP-02 Faculty Development Activities for
BED and College, page 1).
All full-time faculty members shall accomplish the FDA
application form (AR:00-00-FO-07) within one month after the start of the
semester. Only complete application shall be processed by the Office of
the VP for Academics (OVPA), for the final approval, who shall then make
the endorsement to the VP for Finance for corresponding remuneration
(for permanent faculty) or HRD for inclusion in the faculty merit system
(for probationary faculty). For a complete application, FDA form must be
properly filled out, with necessary attachment such as HRD endorsement
for Graduate Studies, approved Research Topic Proposal Form (RE:00-00-
FO-14), etc., reviewed by their respective Chair/Co-Chairs, and endorsed
by their Academic Head. Application that fails to satisfy all the
requirements will be returned to the concerned faculty member through
the Academic Heads and/or Chairs/Co-Chair who shall inform them of the
deficiency noted by the VP for Academics (VPA) as indicated in the FDA
Application Assessment Report (AR:00-00-159). The submission of
application after the set deadline must be justified for reconsideration.
Also, the faculty must have successfully submitted the accomplishment
report of the previously approved FDA before applying in the succeeding
semester/AY.
Towards the end of AY 2015-2016, the OVPA reviewed the
process of FDA application and the submission of FDA accomplishment
reports to address the issues and concerns that were observed by the
office during the said year. Such concerns were mostly related to the
quality of application and accomplishment report submitted to OVPA. In
view of the OVPA’s continuous effort to gradually build a culture of quality
output, the office set a clear standards and guidelines of the application
process as well as the submission of the accomplishment report through
the revision of AR:00-00-QP-02 Faculty Development Activities for College
and BED and AR:00-00-FO-07 in preparation for AY 2016-2017. This aim
to establish common understanding of the step by step process of FDA

Departmental Data Analysis 173
between the faculty and all offices concerned since it involves different
processes depending on the activity that the faculty would want to apply.
The process improvement addressed the following:
• Clarified the process involving the concerned offices such as
HRD, CES, and RD in the processing of Graduate Studies
certification, CES Activities, and Research Project
• Clarified process and timeline of FDA application and
accomplishment report submission
• Added provision on the non-completion of FDA on-time.
Objectives
This paper aimed to:
1. Determine the number of faculty who satisfied the application
requirements on-time from AY 2014-2015 to AY 2016-2017.
2. Determine the distribution of involvement of full-time faculty in
Faculty Development Activity from AY 2014-2015 to AY 2016-
2017.
3. Analyze the three-year trend of on-time submission and faculty
involvement in FDA activities from AY 2014-2015 to AY 2016-
2017.
Presentation and Discussion of Data
The OVPA, as the supervising office, monitors the whole process
of FDA and coordinates with the various departments such as Academic
Heads’ Office, Community and Extension Office (CES), Research
Department (RD), Human Resource Department (HRD), and Payroll Office.
The monitoring includes the on-time submission of application,
conformance to the FDA quality procedure, coordination with various
offices to ensure the processes are properly implemented, and provision
of necessary assistance and appropriate action if needed.

SUBIR VOLUME 1
Quality submission of FDA application is vital in meeting the
objectives of the activity applied and approved. It is also vital on the part
of the students who will need academic consultation in the early part of
the semester. The faculty, on the other hand, should have at least 2 hours
of academic consultation with the students every week of the whole
semester. As to the other FDA activities such as research, the duration of
research depends on the evaluation of the Research Department.
Table 1 below shows the total number of full time faculty per
department, academic year, and semester who had approved FDA for the
past three years. It also shows the total number and percentage of faculty
who submitted their FDA application to OVPA within the set deadline or
one month after the start of classes. For AY 2014-2015, the collegiate
classes started on June 23, 2014 (1st semester) and November 12, 2014
(2nd semester); for AY 2015-2016 the 1st semester began on June 22, 2015
while the 2nd semester was on November 11, 2015, and for the 1st
semester of AY 2016-2017 the classes began on June 13, 2016 and
November 7, 2016 for 2nd semester. Moreover, for BED, the classes for AY
2014-2015 began on June 16, 2014, June 8, 2015 for AY 2015-2016, and
June 06, 2016 for the current Academic Year.
In every year performance, the BED had the most number of
faculty with FDA and also the top department that was able to have the
approval of FDA on-time. The SE and BED had more than 50% of the
faculty who satisfied the requirements of on-time submission per
Academic Year for the last 3 years.
Overall, it was in the 1st semester of AY 2016-2017 when the
highest number of faculty (76%) who satisfied the application
requirements on-time was observed and the lowest was 26% in the 2nd
Semester of AY 2015-2016. The highest percentage of on-time submission
per department was 100% and the lowest was 0%. Among all the
collegiate departments, SE got the overall highest percentage of 81% and
69% of quality submission of FDA application in 1st semester and 2nd
semester, respectively, average of the last 3 years. However, SN got the
overall lowest average of on –time submission in the 1st semester and RED
in the 2nd semesters.
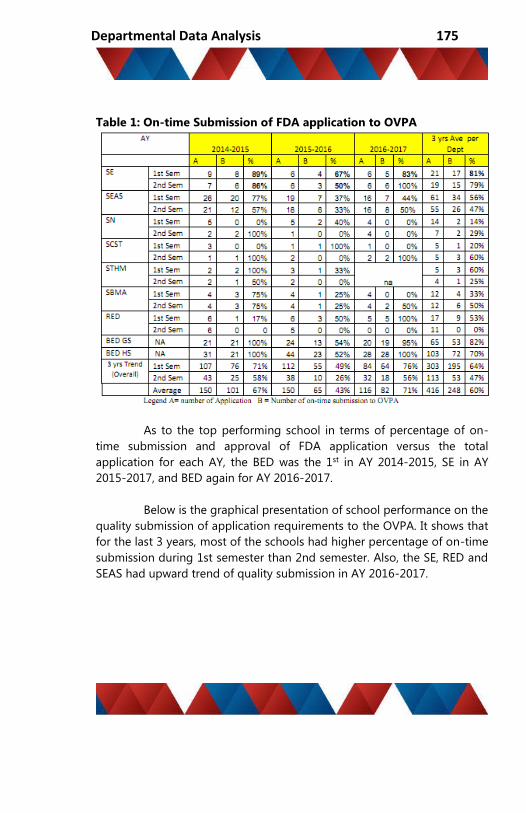
Departmental Data Analysis 175
Table 1: On-time Submission of FDA application to OVPA
As to the top performing school in terms of percentage of on-
time submission and approval of FDA application versus the total
application for each AY, the BED was the 1st in AY 2014-2015, SE in AY
2015-2017, and BED again for AY 2016-2017.
Below is the graphical presentation of school performance on the
quality submission of application requirements to the OVPA. It shows that
for the last 3 years, most of the schools had higher percentage of on-time
submission during 1st semester than 2nd semester. Also, the SE, RED and
SEAS had upward trend of quality submission in AY 2016-2017.

SUBIR VOLUME 1

Departmental Data Analysis 177
Table 2 shows the total number of quality submission of all
faculty with FDA, in 3 years performance, that were approved before the
set deadline. In a three-year trend, the 1st semester had the higher quality
submission that was approved on time than 2nd semester. It was in AY
2015-2016 when the lowest on-time submission of all application was
observed in both semester. However, in AY 2016-2017, the on-time
approval was set higher than the average performance of AY 2014-2015.
Tables 2.1, 2.1.1, 2.2, 2.2.1 2.3, 2.3.1 show the distribution of the
involvement of faculty (in percentage and graphical presentation) per
semester and AY in the different areas of FDA. All faculty members with
FDA are required to have Academic Consultation activity while other
activities are optional. The research project is being monitored by
Research Department and should follow the process in the quality
procedures of research under FDA, the CES activity follows the CES
implementation of extension activities under CES Office, for the graduate
studies the alignment with the Personnel Development Program of faculty
is being checked by the HRD, while the OVPA as the process owner of
FDA coordinates with all these departments to ensure that all
requirements and procedure are followed prior to the approval of the
VPA.

SUBIR VOLUME 1
In the AY 2014-2015 (Table 2.1), there were 13 or 12% of the
total faculty with approved graduate studies in the 1st semester and 11 or
12% in the 2nd semester. For Research Project, there were 30 or 28%
involved in research activity during the 1st semester and 25 or 26% of total
faculty with FDA in the 2nd semester. As to the CES involvement of faculty,
there were 8 faculty with extension activities or 7% in the 1st semester and
5 faculty or 5% in the 2nd semester. As to the other activities such as
Alumni Moderatorship, Substitution, Review Class, and Mentoring, there
were 54 faculty or 50% involved in FDA other activities in the 1st semester
and 49 or 52% in the 2nd semester.
The BED High School had the highest number of faculty with
approved graduate studies (7 or 29%) in AY 2014-2015 as well as the
department with highest number of faculty (11 or 35%) involved in
research project. For CES activities, the Nursing got the highest number
with CES involvement (3 or 60%) while the BED got 26 or 84% of their
faculty involved in other FDA activities.
Among the collegiate departments, only 4 departments had
faculty enrolled in graduate studies and SEAS had the most number or
12% of faculty with FDA. In research project, SE got 7 or 78% involvement.
As to the extension activities, only SBMA did not have faculty
representative in extension services in both semesters.

Departmental Data Analysis 179
The table below is the graphical presentation of the involvement
of faculty in FDA for AY 2014-2016 per department and semester.

SUBIR VOLUME 1
In the AY 2015-2016 (Table 2.2), there were 11 or 10% of the
total faculty with approved graduate studies in the 1st semester and 2nd
semester. For Research Project, there were 12 or 11% involved in research
activity during the 1st semester and 15 or 14% of total faculty in the 2nd
semester. As to the CES involvement of faculty there were 16 faculty with
extension activities or 14% in the 1st semester and 14 faculty, or 13% in
the semester. As to the other activities such as Alumni Moderatorship,
Substitution, Review Class, there were 52 faculty or 49% involved in FDA
other activities in the 1st semester and 50 or 53% in the 2nd semester.
In total, the BED Grade School had the highest number of faculty
with approved graduate studies (7 or 29%) in AY 2015-2016 while the BED
High School got the highest number of faculty involved in research
project (8 or 18%), extension activities (6 or 14%), and other FDA activities
(31 or 70%)
Among the collegiate departments, only the SEAS and RED had
faculty involved in graduate studies. In research project, only SE, SEAS,
and STHM had research activities. While for the extension activities, the
RED and SE did not have faculty representative in extension services.

Departmental Data Analysis 181
Table 2.2.1 is the graphical presentation of the distribution of
activities among the faculty with approved FDA in AY 2016-2017.

SUBIR VOLUME 1
In both semesters of AY 2016-2017 (Table 2.3), there were 12 or
14% of the total faculty with approved graduate studies and 2 or 2%
involved in research activities. As for the CES, 4 or 5% were involved in
extension activities in the 1st semester, and 3 or 4% in the 2nd semester.
While for the other activities such as Alumni Moderatorship, Substitution,
Review Class, there were 45 faculty or 54% involvement in the 1st semester
and 45 or 53 % in the 2nd semester.
Among the three departments (SEAS, BED GS, BED HS) with
applied graduate studies, the BED Grade School has the highest number
of faculty pursuing graduate studies (6 or 30%). In research involvement,
only one faculty from SEAS and one from SBMA are having research
activity in the current year. As to the CES activity, only SEAS, SN, and
SBMA are having involvement in extension projects. Majority of the BED
faculty from GS and HS, with 85% to 96% respectively, are involved in
other FDA activities such as substitution, mentoring, etc.

Departmental Data Analysis 183
The table below is the graphical presentation of faculty
involvement in FDA activities in AY 2016-2017.
Table 2.3.1 AY 2016-2017 Distribution of Faculty Involvement in FDA
Table 3 shows the three-year trend of quality FDA application,
research activity, graduates studies, CES and other FDA activities. The
highest percentage of FDA research activity was recorded in AY 2014-
2015 and went down in AY 2015-2016 and AY 2016-2017. While it is
noticeable that in AY 2015-2016, a sudden decrease of on-time
submission was recorded compared to AY 2014-2015, the CES activity was
at its peak in AY 2015-2016 and had a sudden down trend in AY 2016-
2017. As to the graduate studies, the AY when the faculty had the most
number of application was in AY 2016-2017.
The AY 2016-2017, in the average, has the highest number of
FDA approval within the set deadline.

SUBIR VOLUME 1
Table 3. On-Time Submission and Faculty Involvement
The graph below shows the downtrend performance of on time
submission and approval of FDA applications from AY 2014-2015 to AY
2015-2016 and upward trend from AY 2015-2016 to AY 2016-2017. The
faculty involvement in FDA research continued to decrease from AY 2014-
2015 to 1st Semester of AY 2016-2017. The other FDA activities had
almost the same number of faculty participation, same with graduate
studies, while the extension activities had its peak in 1st Semester AY
2015-2016.
Since FDA application passes trough different processes and
secures signature of the respective process owner, prior to the final
approval of the VPA, the office recognizes the importance of documenting
the reasons for non-approval and returning of application to the

Departmental Data Analysis 185
respective Dean’s Office that were submitted to OVPA. Those were the
following:
• Accomplishment Report on Research Project and CES activities
• HR Endorsement of Graduate Studies
• Incomplete details of application (i.e # of units being applied not
indicated)
• No attached requirements (i.e registration form for graduate
studies, accomplished make up form, ect)
• Wrong form
• Wrong use of form
The documented FDA transactions and the OVPA observations
became the bases of the course of actions made to improve the
application process and approval of FDA and later on to continue improve
culture of quality submission. After the 1st semester of AY 2015-2016, the
OVPA reviewed the quality procedure of FDA and integrated the
observations noted. In May 2015, the revised QP was approved and made
effective in June 2016 for AY 2016-2017. The FDA Application Form
(AR:00-00-FO-07) was also revised accordingly and added additional
details that would guide the faculty when applying the FDA as well as
signatories when reviewing the application.
In January 2015, the OVPA released a memorandum (AR:00-00-
ME-02 dated January 02, 2016) that contained step by step guide of the
submission of the 2nd semester accomplishment report (for AY 2015-2016)
and for the FDA application in the succeeding semester (1st semester Ay
2016-2017). The OVPA also strengthened the coordination and
communication efforts with the other concerned offices.
With regard to the downtrend involvement of the faculty in
research activity, the following were the solicited reasons during the
random inquiries of the Administrative Assistant of the OVPA to the
faculty who conducted research activity under FDA:

SUBIR VOLUME 1
1. Rigorous requirements of research which overlapped with
teaching requirements
2. Full teaching load
3. Other workload assignments of faculty such as modertorship, etc
As to the downtrend involvement of faculty in CES
moderatorship, the rigorous requirements of CES moderators specifically
the submission of accomplishment reports was the main reason for them
not to choose CES moderatorship as FDA activity in the succeeding
semesters.
Table 2 shows the drastic increase of the average number of on-
time submission and approval of FDA from AY 2015-2016 (43%) to AY
2016-2017 (71%). The AY 2016-2017 set the highest record of on-time
submission for the last 3 years.
Conclusions
1. Overall, it was in the 1st semester of AY 2016-2017 when the
highest number of faculty (76%) who satisfied the application
requirements on-time was observed and the lowest was 26% in
the 2nd Semester of AY 2015-2016.
2. Among all the collegiate departments, SE got the overall highest
percentage of 81% and 79% of quality submission of FDA
application in 1st semester and 2nd semester, respectively, the
average for the last 3 years.
3. Among all the departments, the BED had the most number of
faculty with FDA and also the top department that was able to
have the approval of FDA on-time.
4. In AY 2016-2017, the on-time approval is set higher than the
average performance for the last two years.
5. There was a downtrend performance of on time submission and
approval of FDA application from AY 2014-2015 to AY 2015-2016
and upward trend from AY 2015-2016 to Ay 2016-2017.
6. The faculty involvement in FDA research continued to decrease
from AY 2014- 2015 to 1st Semester of AY 2016-2017. The other
FDA activities had almost the same number of faculty
Departmental Data Analysis 187
participation, same with graduate studies, while the extension
activities had its peak in 1st Semester AY 2015-2016.
7. The downtrend of research and CES involvement of faculty is due
to rigorous requirements of research that overlap with teaching
requirements and full faculty load assignment.
8. The OVPA’s effort to address the downtrend submission and
approval of FDA in AY 2015-2017 was successfully addressed in
AY 2016-2017 despite the strict implementation of no processing
of incomplete application details/requirements and the setting of
quality documentation practice. The drastic increase in the
average number of the on-time submission and approval of FDA
from AY 2015-2016 (43%) to AY 2016-2017 (71%) was evident in
Table 2 (page 7).
9. The AY 2016-2017 set the highest record of on-time submission
for the last 3 years.
Recommendations
The following are recommended:
1. That the OVPA will continue to strengthen the communication
and coordination efforts to further improve the FDA process.
2. To have a mechanism that would collect feedback from the
faculty and clients (for Academic consultation) that may be used
in the evaluation and improvement of the process.
To further study the balance of faculty workload, who, at the
same time given other activities such as research or moderatorship.
References Cited
AR:00-00-QP-02 Faculty Development Activities for BED and College, page
1 FDA Approved Application, AY 2014-2015
SUBIR VOLUME 1
FDA Approved Application, AY 2015-2016
FDA Approved Application, AY 2016-2017 AR:00-00-LB-04, AY 2015-2016
AP:03-00-FO-01 rev4 060115 Document Request Form (DRF) Transaction
No.665 (FO) AP:03-00-FO-01 rev4 060115 Document Request
Form (DRF) Transaction No.690 (QP)

Departmental Data Analysis 189
Data Analysis of the Graduation Rate of School of Education
Arts and Sciences of Colegio de San Juan de Letran Calamba
JENNIFER R. DORADO
Registrar’s Department
Background
Education is one of the cornerstones of development, particularly
in a country where majority of the population is of school age.
(http://www.gmanetwork.com/news/story/534610/scitech/science/a-look-
at-dropout-rates-in-the-philippines#sthash.eS4YRxHc.dpuf)
In private HEIs, the number of graduates produced increased by
0.48% from 289,317 in AY 2009-2010 to 290,696 in AY 2010-2011
(http://www.ched.gov.ph/index.php/higher-education-in-numbers/
graduates/). As per the Commission on Higher Education (CHED),
graduation rate refers to the percentage of 1st year baccalaureate students
who are able to graduate on time. The rate is defined as the percentage of
enrollees at the beginning year in a given school year that reached the
final year of the college level and graduated on time.
To monitor the Colegio’s graduation rates, the Registrar’s
Department analyzes the graduation rate of the Colegio by focusing on
the School of Education, Arts, and Sciences (SEAS) program offerings from
Academic Year 2012 to 2016.
It also intends to monitor the movement of the students (shifting
to another program, transferring to other school, or on-leave) within the
number of years prescribed for their respective programs. The results can
be used to recommend departmental intervention programs to improve
the graduation rate of the Colegio.
Objectives
SUBIR VOLUME 1
1. To determine the trend in graduation rates of School of
Education, Arts, and Sciences program offerings of Colegio de
San Juan de Letran Calamba from Academic Year 2012 to 2016.
2. To determine the average graduation rate of the School of
Education, Arts, and Sciences program offerings of the Colegio in
the past five years.
3. To identify the factors affecting the students who were not able
to graduate on time based on secondary records.
Presentation and Discussion of Data
The analysis focused on the graduation rate or survival rate of
Letran first year students for Academic Year 2008-2009 to Academic Year
2012-2013 of the following program offerings of the School of Education,
Arts, and Sciences of Colegio de San Juan de Letran Calamba:
Bachelor of Arts in Communication (ABCOMM);
Bachelor of Science in Psychology (BSPSY);
Bachelor of Elementary Education w/ Specialization in Early
Childhood Education (BEED);
Bachelor of Secondary Education major in English (BSE-Eng); and
Bachelor of Secondary Education major in Math (BSE-Math).
In preparing this report, the following system generated reports
were utilized:
Enrollment list from Academic Year 2008-2009 to Academic Year
2012-2013;
List of Dismissed Students from Academic Year 2008-2009 to
Academic Year 2015-2016;
List of Graduates from the year 2012 to 2016;
List of Shiftees from Academic Year 2008-2009 to Academic Year
2015-2016;
List of Students who filed for Leave of Absence from Academic
Year 2008-2009 to Academic Year 2015-2016; and
Academic Evaluation Report.
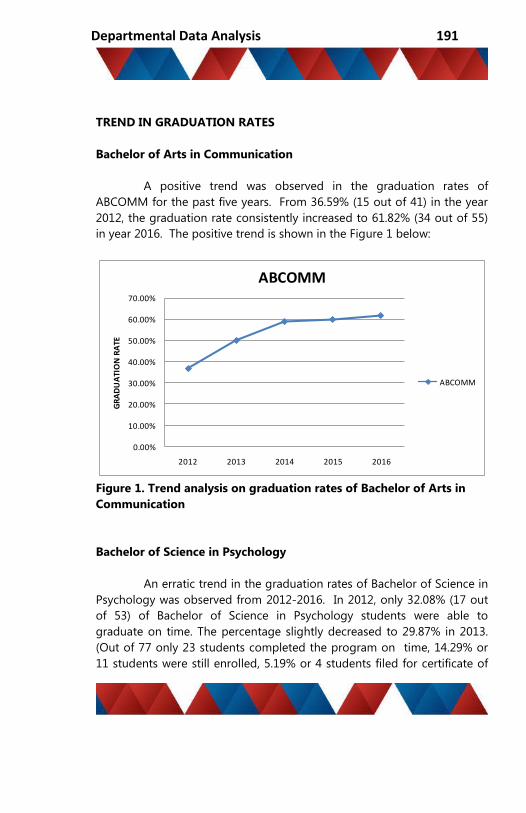
Departmental Data Analysis 191
TREND IN GRADUATION RATES
Bachelor of Arts in Communication
A positive trend was observed in the graduation rates of
ABCOMM for the past five years. From 36.59% (15 out of 41) in the year
2012, the graduation rate consistently increased to 61.82% (34 out of 55)
in year 2016. The positive trend is shown in the Figure 1 below:
0.00%
10.00%
20.00%
30.00%
40.00%
50.00%
60.00%
70.00%
2012 2013 2014 2015 2016
GR
AD
UA
TIO
N R
ATE
ABCOMM
ABCOMM
Figure 1. Trend analysis on graduation rates of Bachelor of Arts in
Communication
Bachelor of Science in Psychology
An erratic trend in the graduation rates of Bachelor of Science in
Psychology was observed from 2012-2016. In 2012, only 32.08% (17 out
of 53) of Bachelor of Science in Psychology students were able to
graduate on time. The percentage slightly decreased to 29.87% in 2013.
(Out of 77 only 23 students completed the program on time, 14.29% or
11 students were still enrolled, 5.19% or 4 students filed for certificate of

SUBIR VOLUME 1
eligibility to transfer, 6.49% or 5 students shifted to another course and
49.35% or 34 students stopped schooling without filed application for
leave of absence (LOA) ). A significant increase in the graduation rate was
observed in 2014, having 32 or 62.75% graduates (32 out of 51).
However, it fluctuated to 59.46% (44 out of 74) on the following year and
rose again on the next year to 80.49% (33 out of 41) in 2016. The erratic
trend is shown in the Figure 2 below.
0.00%
10.00%
20.00%
30.00%
40.00%
50.00%
60.00%
70.00%
80.00%
90.00%
2012 2013 2014 2015 2016
GR
AD
UA
TIO
N R
ATE
BSPSY
BSPSY
Figure 2. Trend analysis on graduation rates of Bachelor of Science in
Psychology
Bachelor of Elementary Education w/ Specialization in Early
Childhood Education
In 2012, no Bachelor of Elementary Education w/ Specialization in
Early Childhood Education student was able to graduate on time because
of failures and academic deficiencies. The percentage increased to 25% (1
out of 4) in 2013 and further rose to 66.67% (6 out of 9) in 2014.
However, it declined in 2015 and 2016 to 28.57% (2 out of 7) and 16.67%
(1 out of 6), respectively. The trend is shown in Figure 3 next page.
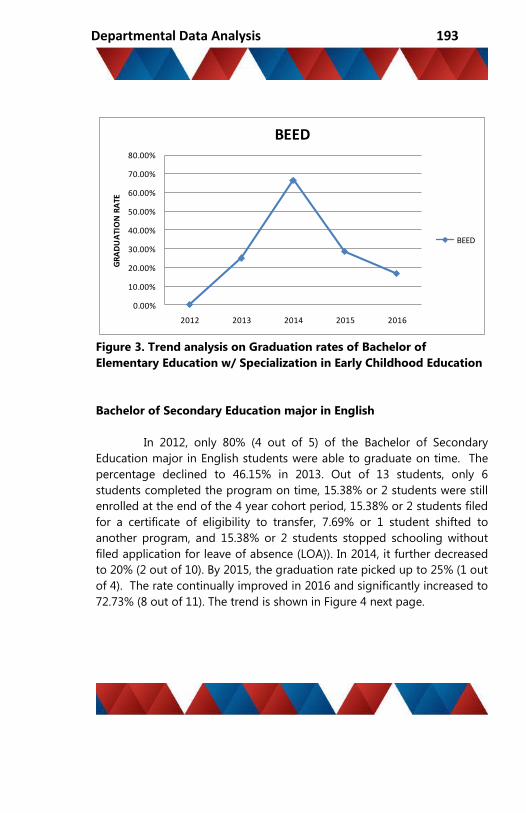
Departmental Data Analysis 193
0.00%
10.00%
20.00%
30.00%
40.00%
50.00%
60.00%
70.00%
80.00%
2012 2013 2014 2015 2016
GR
AD
UA
TIO
N R
ATE
BEED
BEED
Figure 3. Trend analysis on Graduation rates of Bachelor of
Elementary Education w/ Specialization in Early Childhood Education
Bachelor of Secondary Education major in English
In 2012, only 80% (4 out of 5) of the Bachelor of Secondary
Education major in English students were able to graduate on time. The
percentage declined to 46.15% in 2013. Out of 13 students, only 6
students completed the program on time, 15.38% or 2 students were still
enrolled at the end of the 4 year cohort period, 15.38% or 2 students filed
for a certificate of eligibility to transfer, 7.69% or 1 student shifted to
another program, and 15.38% or 2 students stopped schooling without
filed application for leave of absence (LOA)). In 2014, it further decreased
to 20% (2 out of 10). By 2015, the graduation rate picked up to 25% (1 out
of 4). The rate continually improved in 2016 and significantly increased to
72.73% (8 out of 11). The trend is shown in Figure 4 next page.

SUBIR VOLUME 1
0.00%
10.00%
20.00%
30.00%
40.00%
50.00%
60.00%
70.00%
80.00%
90.00%
2012 2013 2014 2015 2016
GR
AD
UA
TIO
N R
ATE
BSE-ENGLISH
BSE-ENGLISH
Figure 4. Trend analysis on graduation of Bachelor of Secondary
Education major in English
Bachelor of Secondary Education major in Math
A total of 66.67% (4 out of 6) of Bachelor of Secondary Education
major in Math students were able to graduate on time last 2012. The
percentage decreased to 50% (1 out of 2) in 2013 and 2014. Unfortunately
in 2015, there was no graduate in the said program since there was also
no enrollee in 2011. Come 2016, the graduation rate rose to 66.67% (2
out of 3). The trend is shown in Figure 5 next page.
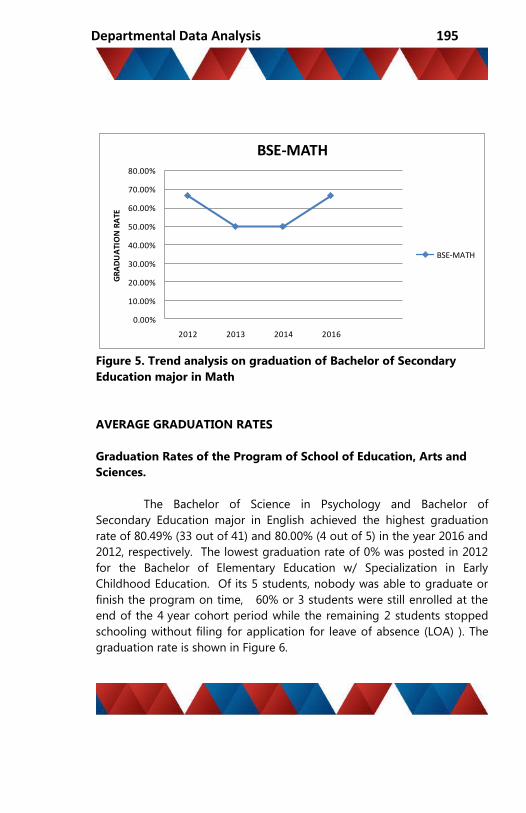
Departmental Data Analysis 195
0.00%
10.00%
20.00%
30.00%
40.00%
50.00%
60.00%
70.00%
80.00%
2012 2013 2014 2016
GR
AD
UA
TIO
N R
ATE
BSE-MATH
BSE-MATH
Figure 5. Trend analysis on graduation of Bachelor of Secondary
Education major in Math
AVERAGE GRADUATION RATES
Graduation Rates of the Program of School of Education, Arts and
Sciences.
The Bachelor of Science in Psychology and Bachelor of
Secondary Education major in English achieved the highest graduation
rate of 80.49% (33 out of 41) and 80.00% (4 out of 5) in the year 2016 and
2012, respectively. The lowest graduation rate of 0% was posted in 2012
for the Bachelor of Elementary Education w/ Specialization in Early
Childhood Education. Of its 5 students, nobody was able to graduate or
finish the program on time, 60% or 3 students were still enrolled at the
end of the 4 year cohort period while the remaining 2 students stopped
schooling without filing for application for leave of absence (LOA) ). The
graduation rate is shown in Figure 6.

SUBIR VOLUME 1
0%
10%
20%
30%
40%
50%
60%
70%
80%
90%
2012 2013 2014 2015 2016
GR
AD
UA
TIO
N R
ATE
School of Education Arts and Sciences
ABCOMM
BSPSY
BEED
BSE-ENGLISH
BSE-MATH
Figure 6. Graduation Rates of the Program of School of Education,
Arts and Sciences.
Comparison of Program Average Graduation Rates
On the average, among the program offerings of the SEAS, the
BSE Math has the highest graduation rate with 58.34% followed by
Bachelor of Arts in Communication with 53.48%, Bachelor of Science in
Psychology with 52.93%, and Bachelor of Secondary Education major in
English with 48.78%. Bachelor of Elementary Education w/ Specialization
in Early Childhood Education got the lowest graduation rate with 27.38%
(Table 1).
Table 1. Comparison of Program Average Graduation Rates
Course Average
ABCOMM 53.48%
BSPSY 52.93%
BEED 27.38%
BSE-ENGLISH 48.78%
BSE-MATH 58.34%
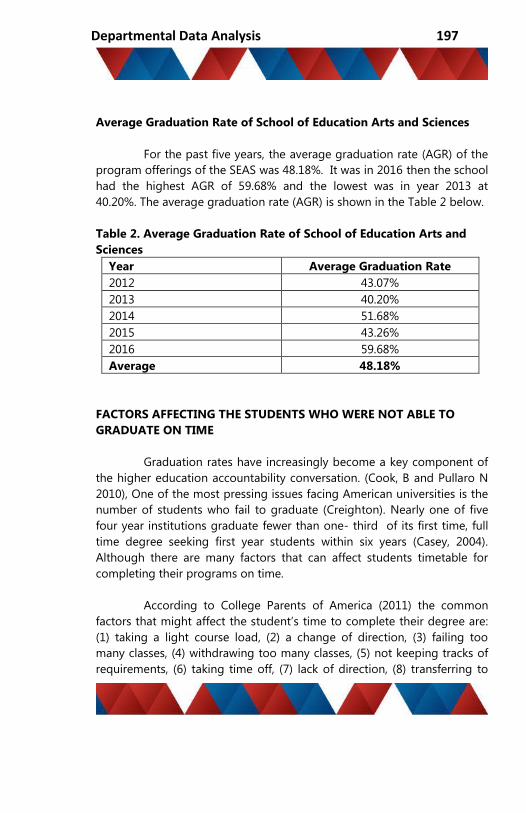
Departmental Data Analysis 197
Average Graduation Rate of School of Education Arts and Sciences
For the past five years, the average graduation rate (AGR) of the
program offerings of the SEAS was 48.18%. It was in 2016 then the school
had the highest AGR of 59.68% and the lowest was in year 2013 at
40.20%. The average graduation rate (AGR) is shown in the Table 2 below.
Table 2. Average Graduation Rate of School of Education Arts and
Sciences
Year Average Graduation Rate
2012 43.07%
2013 40.20%
2014 51.68%
2015 43.26%
2016 59.68%
Average 48.18%
FACTORS AFFECTING THE STUDENTS WHO WERE NOT ABLE TO
GRADUATE ON TIME
Graduation rates have increasingly become a key component of
the higher education accountability conversation. (Cook, B and Pullaro N
2010), One of the most pressing issues facing American universities is the
number of students who fail to graduate (Creighton). Nearly one of five
four year institutions graduate fewer than one- third of its first time, full
time degree seeking first year students within six years (Casey, 2004).
Although there are many factors that can affect students timetable for
completing their programs on time.
According to College Parents of America (2011) the common
factors that might affect the student’s time to complete their degree are:
(1) taking a light course load, (2) a change of direction, (3) failing too
many classes, (4) withdrawing too many classes, (5) not keeping tracks of
requirements, (6) taking time off, (7) lack of direction, (8) transferring to
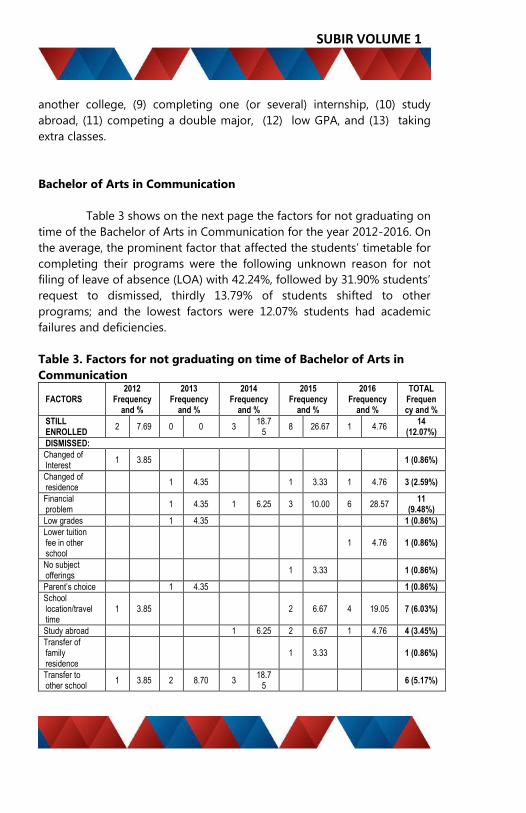
SUBIR VOLUME 1
another college, (9) completing one (or several) internship, (10) study
abroad, (11) competing a double major, (12) low GPA, and (13) taking
extra classes.
Bachelor of Arts in Communication
Table 3 shows on the next page the factors for not graduating on
time of the Bachelor of Arts in Communication for the year 2012-2016. On
the average, the prominent factor that affected the students’ timetable for
completing their programs were the following unknown reason for not
filing of leave of absence (LOA) with 42.24%, followed by 31.90% students’
request to dismissed, thirdly 13.79% of students shifted to other
programs; and the lowest factors were 12.07% students had academic
failures and deficiencies.
Table 3. Factors for not graduating on time of Bachelor of Arts in
Communication
FACTORS 2012
Frequency and %
2013 Frequency
and %
2014 Frequency
and %
2015 Frequency
and %
2016 Frequency
and %
TOTAL Frequency and %
STILL ENROLLED
2 7.69 0 0 3 18.7
5 8 26.67 1 4.76
14 (12.07%)
DISMISSED:
Changed of Interest
1 3.85 1 (0.86%)
Changed of residence
1 4.35 1 3.33 1 4.76 3 (2.59%)
Financial problem
1 4.35 1 6.25 3 10.00 6 28.57 11
(9.48%)
Low grades 1 4.35 1 (0.86%)
Lower tuition fee in other school
1 4.76 1 (0.86%)
No subject offerings
1 3.33 1 (0.86%)
Parent’s choice 1 4.35 1 (0.86%)
School location/travel time
1 3.85 2 6.67 4 19.05 7 (6.03%)
Study abroad 1 6.25 2 6.67 1 4.76 4 (3.45%)
Transfer of family residence
1 3.33 1 (0.86%)
Transfer to other school
1 3.85 2 8.70 3 18.7
5 6 (5.17%)
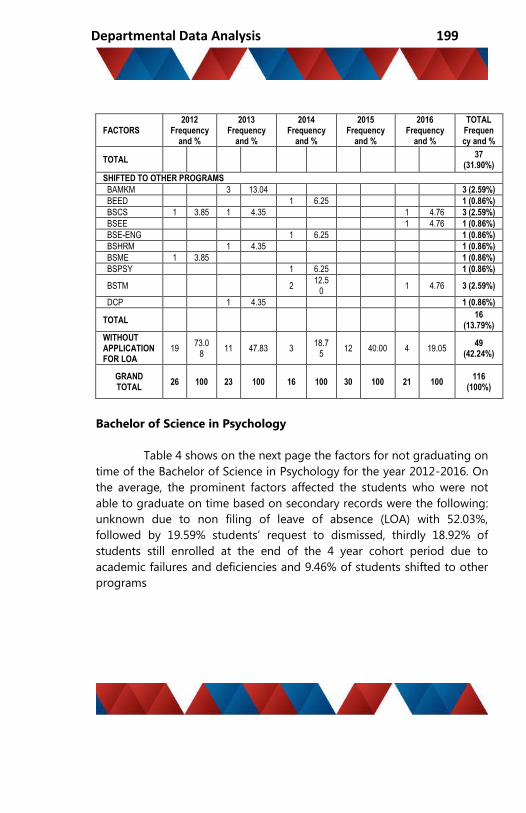
Departmental Data Analysis 199
FACTORS 2012
Frequency and %
2013 Frequency
and %
2014 Frequency
and %
2015 Frequency
and %
2016 Frequency
and %
TOTAL Frequency and %
TOTAL 37
(31.90%)
SHIFTED TO OTHER PROGRAMS
BAMKM 3 13.04 3 (2.59%)
BEED 1 6.25 1 (0.86%)
BSCS 1 3.85 1 4.35 1 4.76 3 (2.59%)
BSEE 1 4.76 1 (0.86%)
BSE-ENG 1 6.25 1 (0.86%)
BSHRM 1 4.35 1 (0.86%)
BSME 1 3.85 1 (0.86%)
BSPSY 1 6.25 1 (0.86%)
BSTM 2 12.5
0 1 4.76 3 (2.59%)
DCP 1 4.35 1 (0.86%)
TOTAL 16
(13.79%)
WITHOUT APPLICATION FOR LOA
19 73.0
8 11 47.83 3
18.75
12 40.00 4 19.05 49
(42.24%)
GRAND TOTAL
26 100 23 100 16 100 30 100 21 100 116
(100%)
Bachelor of Science in Psychology
Table 4 shows on the next page the factors for not graduating on
time of the Bachelor of Science in Psychology for the year 2012-2016. On
the average, the prominent factors affected the students who were not
able to graduate on time based on secondary records were the following:
unknown due to non filing of leave of absence (LOA) with 52.03%,
followed by 19.59% students’ request to dismissed, thirdly 18.92% of
students still enrolled at the end of the 4 year cohort period due to
academic failures and deficiencies and 9.46% of students shifted to other
programs

SUBIR VOLUME 1
Table 4. Factors for not graduating on time of Bachelor of Science in
Psychology FACTORS
2012 Frequency
and %
2013 Frequency
and %
2014 Frequency
and %
2015 Frequency
and %
2016 Frequency
and %
TOTAL Frequency and %
STILL ENROLLED
6 16.67 11 20.37 4 21.05 2 6.45 5 62.50 28
(18.92%)
DISMISSED:
Changed of Interest
1 12.50 1 (0.68%)
Changed of residence
1 3.23 1 (0.68%)
Financial problem
1 2.78 1 1.85 1 5.26 2 6.45 5 (3.38%)
Go abroad/travel
1 5.26 1 (0.68%)
Low grades 1 3.23 1 (0.68%)
Moved to Manila
2 10.53 1 12.50 3 (2.03%)
School location/travel time
1 2.78 1 5.26 1 12.50 3 (2.03%)
Study abroad 1 1.85 1 (0.68%)
Transfer of family residence
1 1.85 1 (0.68%)
Transfer to other school
2 5.56 1 1.85 1 5.26 8 12
(8.11%)
TOTAL 29
(19.59%)
SHIFTED TO OTHER PROGRAMS
BAMKM 1 3.23 1 (0.68%)
BAHRDM 1 2.78 2 6.45 3 (2.03%)
BEED 1 5.26 1 3.23 2 (1.35%)
BSGC 1 3.23 1 (0.68%)
BSIT 1 3.23 1 (0.68%)
BSHRM 2 3.70 2 (1.35%)
BSTM 3 5.56 1 5.26 4 (2.70%)
TOTAL 14
(13.79%) WITHOUT APPLICATION FOR LOA
25 69.44 34 62.96 7 36.84 11 35.48 77
(52.03%)
GRAND TOTAL
36 100 54 100 19 100 31 100 8 100 148
(100%)
Bachelor of Elementary Education w/ Specialization in Early
Childhood Education

Departmental Data Analysis 201
Table 5 shows on the next page the factors for not graduating on
time of the Bachelor of Elementary Education w/ Specialization in Early
Childhood Education for the year 2012-2016. On the average, the highest
factors that affected the students’ timetable for completing their
programs were the following: students who stopped schooling without
filed application for leave of absence (LOA) with 42.86%, students still
enrolled at the end of the 4 year cohort period due to academic failures
and deficiencies with 38.10%, 14.28% of students request to dismissed
and 4.76% shifted to another program.
Table 5. Factors for not graduating on time of Bachelor of
Elementary Education w/ Specialization in Early Childhood Education FACTORS
2012 Frequency
and %
2013 Frequency and %
2014 Frequency and %
2015 Frequency and %
2016 Frequency and %
TOTAL Frequency and %
STILL ENROLLED
3 60.00 0 0 0 0 3 60 2 40 8
(38.10%)
DISMISSED:
Financial problem 2 40 2 (9.52%)
School location/travel time
1 20 1 (4.76%)
TOTAL 3
(14.28%)
SHIFTED TO OTHER PROGRAMS
BSE-ENG 1 20 1 (4.76%)
WITHOUT APPLICATION FOR LOA
2 40.00 3 100 3 100 1 20 9
(42.86%)
GRAND TOTAL 5 100 3 100 3 100 5 100 5 100 21
(100.00%)
Bachelor of Secondary Education major in English
Table 6 shows on the next page the factors for not graduating on
time of the Bachelor of Secondary Education major in English for the year
2012-2016. On the average, the highest factors affected the students’ who
were not able to graduate on time based on secondary records were
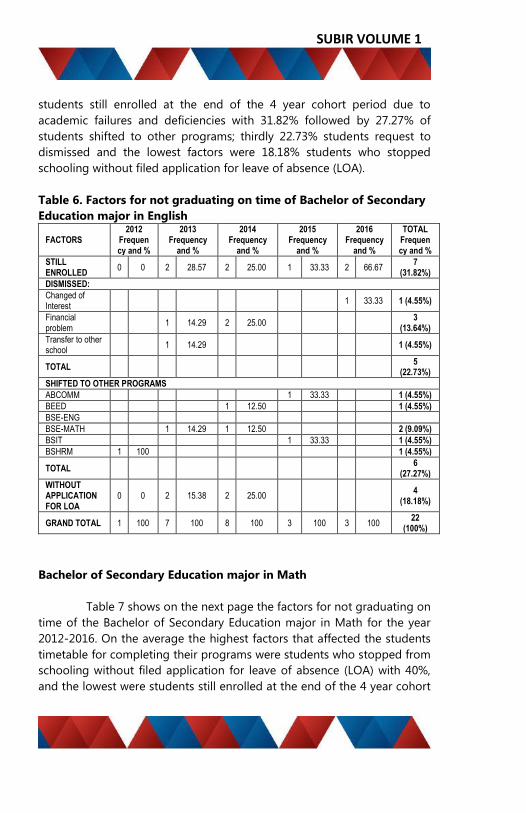
SUBIR VOLUME 1
students still enrolled at the end of the 4 year cohort period due to
academic failures and deficiencies with 31.82% followed by 27.27% of
students shifted to other programs; thirdly 22.73% students request to
dismissed and the lowest factors were 18.18% students who stopped
schooling without filed application for leave of absence (LOA).
Table 6. Factors for not graduating on time of Bachelor of Secondary
Education major in English
FACTORS 2012
Frequency and %
2013 Frequency
and %
2014 Frequency
and %
2015 Frequency
and %
2016 Frequency
and %
TOTAL Frequency and %
STILL ENROLLED
0 0 2 28.57 2 25.00 1 33.33 2 66.67 7
(31.82%)
DISMISSED:
Changed of Interest
1 33.33 1 (4.55%)
Financial problem
1 14.29 2 25.00 3
(13.64%)
Transfer to other school
1 14.29 1 (4.55%)
TOTAL 5
(22.73%)
SHIFTED TO OTHER PROGRAMS
ABCOMM 1 33.33 1 (4.55%)
BEED 1 12.50 1 (4.55%)
BSE-ENG
BSE-MATH 1 14.29 1 12.50 2 (9.09%)
BSIT 1 33.33 1 (4.55%)
BSHRM 1 100 1 (4.55%)
TOTAL 6
(27.27%)
WITHOUT APPLICATION FOR LOA
0 0 2 15.38 2 25.00 4
(18.18%)
GRAND TOTAL 1 100 7 100 8 100 3 100 3 100 22
(100%)
Bachelor of Secondary Education major in Math
Table 7 shows on the next page the factors for not graduating on
time of the Bachelor of Secondary Education major in Math for the year
2012-2016. On the average the highest factors that affected the students
timetable for completing their programs were students who stopped from
schooling without filed application for leave of absence (LOA) with 40%,
and the lowest were students still enrolled at the end of the 4 year cohort
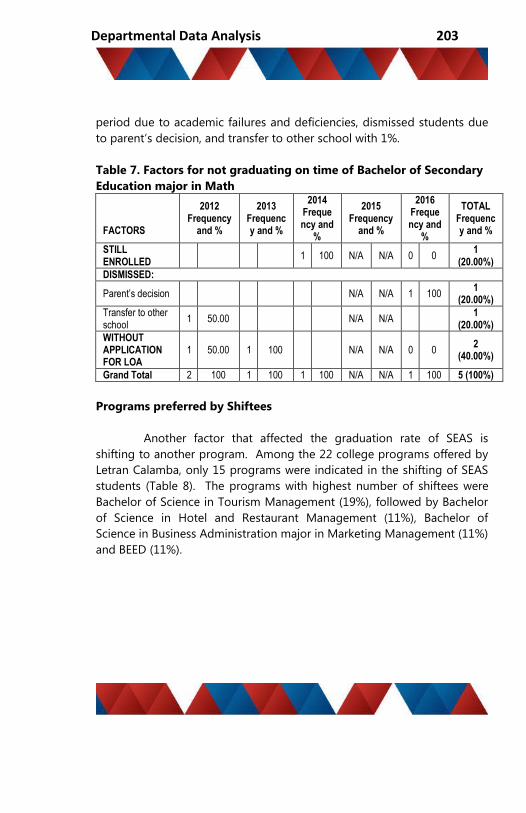
Departmental Data Analysis 203
period due to academic failures and deficiencies, dismissed students due
to parent’s decision, and transfer to other school with 1%.
Table 7. Factors for not graduating on time of Bachelor of Secondary
Education major in Math
FACTORS
2012 Frequency
and %
2013 Frequency and %
2014 Frequency and
%
2015 Frequency
and %
2016 Frequency and
%
TOTAL Frequency and %
STILL ENROLLED
1 100 N/A N/A 0 0 1
(20.00%)
DISMISSED:
Parent’s decision N/A N/A 1 100 1
(20.00%)
Transfer to other school
1 50.00 N/A N/A 1
(20.00%)
WITHOUT APPLICATION FOR LOA
1 50.00 1 100 N/A N/A 0 0 2
(40.00%)
Grand Total 2 100 1 100 1 100 N/A N/A 1 100 5 (100%)
Programs preferred by Shiftees
Another factor that affected the graduation rate of SEAS is
shifting to another program. Among the 22 college programs offered by
Letran Calamba, only 15 programs were indicated in the shifting of SEAS
students (Table 8). The programs with highest number of shiftees were
Bachelor of Science in Tourism Management (19%), followed by Bachelor
of Science in Hotel and Restaurant Management (11%), Bachelor of
Science in Business Administration major in Marketing Management (11%)
and BEED (11%).

SUBIR VOLUME 1
Table 8. Programs preferred by Shiftees PROGRAM
ABCOM BSPSY BEED BSE-ENG BSE-MATH
Total
AB COM 0 0% 0 0% 0 0% 1 17% 0 0% 1 3%
BAMKM 3 19% 1 7% 0 0% 0 0% 0 0% 4 11%
BAHRDM 0 0% 3 21% 0 0% 0 0% 0 0% 3 8%
BSCS 3 19% 0 0% 0 0% 0 0% 0 0% 3 8%
BSEE 1 6% 0 0% 0 0% 0 0% 0 0% 1 3%
BSE-ENG 1 6% 0 0% 1 100 0 0% 0 0% 2 5%
BSE MATH
0 0% 0 0% 0 0% 2 33% 0 0% 2 5%
BEED 1 6% 2 14% 0 0% 1 17% 0 0% 4 11%
BSGC 0 0% 1 7% 0 0% 0 0% 0 0% 1 3%
BSIT 0 0% 1 7% 0 0% 1 17% 0 0% 2 5%
BSHRM 1 6% 2 14% 0 0% 1 17% 0 0% 4 11%
BSTM 3 19 4 29% 0 0% 0 0% 0 0% 7 19%
BSPSY 1 6% 0 0% 0 0% 0 0% 0 0% 1 3%
BSME 1 6% 0 0% 0 0% 0 0% 0 0% 1 3%
DCP 1 6% 0 0% 0 0% 0 0% 0 0% 1 3%
Total 16 100% 14 100% 1 100% 6 100% 0 0% 37 100%
Student’s Reasons for Shifting
Based on the secondary data of the Registrar’s office from
Academic Year 2008 – 2009 to Academic Year 2012-2013, 73% of the
SEAS students shifted to other program because of their personal issues
specifically their change of interest (32%) and personal interest/choice
(41%) of their academic programs. This confirm the statement of Pegano
(2015), “That half (50%) of her respondents pointed out to personal issues
specifically personal choice/interest and change of interest as the cause of
shifting, dropping out with leave of absence, and transferring.)”

Departmental Data Analysis 205
Table 9. Reasons for Shifting
Conclusions and Recommendations
Conclusions
1. Among the programs of offering of the School of Education, Arts
and Sciences, majority of BSE-Math (58.34%), Bachelor of Arts in
Communication (53.48%) and Bachelor of Science in Psychology
(52.93%) students graduated on time while Bachelor of
Elementary Education w/ Specialization in Early Childhood
Education got the lowest graduation rate with 27.38%.
2. In 2016, the School of Education, Arts and Sciences had the
highest average graduation rate of 59.68% and the lowest was in
year 2013 with 40.20%. Only 2 among the 5 years of study did
majority of students graduate on time.
3. The major factors that affected the students who were not able
to graduate on time based on secondary records, were unknown
CATEGORIES ABCOMM BSPSY BEED BSE-ENG BSE-MATH
TOTAL
PERSONAL ISSUES
Change of Interest
3 19% 4 29% 1 100% 4 67% 0 0 12 32%
Personal Interest / Choice
6 38% 7 50% 0 0 2 33% 0 0 15 41%
Total 9 56% 11 79% 1 100% 6 100% 0 0 27 73%
LIFE ISSUES
Parents Choice / Decision
5 31% 1 0 0 0 0 0 0 0 6 16%
Sick 1 6% 0 0 0 0 0 0 0 0 1 3%
Job Opportunities 0 0 1 0 0 0 0 0 0 0 1 3%
Total 6 38% 2 0 0 0 0 0 0 0 8 22%
ACADEMIC ISSUES
Failing grades/Difficulty of the previous program
1 6% 1 7 0 0 0 0 0 0 0 0
Total 1 6% 1 7 0 0 0 0 0 0 2 5%
GRAND TOTAL 16 100% 14 100%
1 100% 6 100% 0 0 37 100
SUBIR VOLUME 1
(without filed application for leave of absence with 45.19%,
student dismissal due to financial problem and transfer to other
school with 24.36%, academic failures and deficiencies with
18.59% and shifted to other programs with 11.86%.
Recommendations
1. Academic heads should intensify the monitoring of students at
risk of dropping out by provide them with interventions such as
counseling, academic consultation, academic advising and
expanded tutoring services.
2. Academic heads should follow up the students who stopped
schooling without filed application for leave of absence with
coordination with the Guidance and Counseling office.
3. The school must improve its scholarship program in order to
help those who meet financial difficulties in the course of their
study.
4. The Admission and Guidance and Counseling office must provide
career orientation so that the students can be well guided and
oriented on their preferred career or program of study before
they enroll in order to minimize shifting of programs in the
middle of the academic year.
5. Academic heads should strengthen the early intervention,
beginning in the first year and effective instruction practices by
monitoring student academic progress in school.
6. Academic heads should strictly monitor the academic
consultation and advising to assist students who are at risk.
7. A Comprehensive guidance and counseling program must be
planned to address the needs of students in all areas of
academics, personal, social and career development
8. Collaborative efforts on how to improve the graduation rate
must be done by the Dean, Program Chairs, faculty members,
and support services.

Departmental Data Analysis 207
References Cited
WWW Sites (World Wide Web)
Carey, K. (2004). A matter of degrees: Improving four-year colleges and
universities. Washington, DC, Education Trust.
http://edtrust.org/wp-content/uploads/2013/10/highered.pdf (November
21, 2016)
College Parents of America (2011), Why Your College Student Might not
Graduate in Four Years. Jan. 21, 2011, from College Parents of
America
http://www.collegeparents.org/blog/2010/12/12/reasons-why-
your-college-student-might-not-graduate-four-years (July 16,
2016)
Cook, Bryan. and Pullaro Natalie. (2010), College Graduation Rates: Behind
the Numbers
http://www.acenet.edu/news-room/Documents/College-Graduation-
Rates-Behind-the-Numbers.pdf (November 21, 2016)
Creighton, Linda M. Factors Affecting the Graduation Rates of University
Students from Underrepresented Populations
http://files.eric.ed.gov/fulltext/EJ987305.pdf (November 21, 2016)
http://www.ched.gov.ph/index.php/higher-education-in-
numbers/graduates/
(July 15, 2016)
http://www.gmanetwork.com/news/story/534610/scitech/science/a-look-
at-dropout-rates-in-the-philippines#sthash.eS4YRxHc.dpuf
(November 21, 2016)
SUBIR VOLUME 1
Unpublished Thesis
Pegano, Elizabeth B. (2015), A Student Integration Framework for Potential
Shiftees, Drop-outs, and Transferees of Colegio de San Juan de
Letran Calamba

Departmental Data Analysis 209
Barangay Letran the Official Newsletter (AY 2014-2015)
ALYSSA CAMILLE N. AZANZA
Research and Development Division
Background
Barangay Letran is the official newsletter of Colegio de San Juan
de Letran Calamba. It is composed of articles and photos from different
offices and departments. The said newsletter is distributed in the whole
Colegio.
A newsletter can be a vital tool in sending a message and
provide awareness to its intended audience (extension-purdue-
edu/extmedia/FNR/.FNR-269-w.pdf, May 17, 2016). The articles in
Barangay Letran cover the events and accomplishments of the Colegio.
Through Barangay Letran, members of the Letran community are
informed of the events within the Colegio. The Research and
Development Division edits, designs, and packages the whole newsletter.
Barangay Letran started as an institutional newsletter. It comes
out every semester and aims to promote familial spirit among members of
Letran community through communication exchange of information that
is why the newsletter is named as such. The first issues of Barangay Letran
was published by the Office of the Secretary-General.
The first few issues of Barangay Letran are printed in regular
paper and are in black and white. In 2003, the newsletter started to be
printed in glossy paper and in full color. In 2005, Barangay Letran was
titled as the flagship newsletter and was under the Publications Office. In
2008, Barangay Letran was named as the flagship magazine under the
Alumni and Public Affairs. Now, it is under the management of the
Research and Development Division.
SUBIR VOLUME 1
Barangay Letran is also used as an information tool in the
Colegio. As the newsletter contains reports and achievements of the
departments, Barangay Letran becomes a tool for information
dissemination. It is also used for marketing wherein if people outside the
Letran community get to read Bangay Letran, they will have an overview
on what the Colegio is like.
After Barangay Letran has been circulated, an evaluation form
will be accomplished by the departments and offices of the Colegio. The
results of the evaluation will be summarized, which will serve as a basis of
assessment of the feedbacks for the current Barangay Letran issue and the
improvement of upcoming issues.
Objectives
This paper aimed to:
1. Analyze the evaluation results of Barangay Letran, and
2. Create an action plan for the future Barangay Letran issues.
Presentation and Discussion of Data
For Academic Year 2014-2015, the theme of the newsletter is
“Tayo na sa Tahanan ni Juan” as it features success stories of Letran
Calamba alumni, students, and
offices.
The Barangay Letran evaluation form (RE:00-00-FO-02) was
circulated among the offices of the Colegio. Out of the 38 evaluation
forms distributed, 32 were retrieved. Barangay Letran was evaluated based
on consistency, credibility, clarity, content, and credibility.

Departmental Data Analysis 211
Figure 1. Barangay Letran Evaluation Form RE:00-00-FO-02
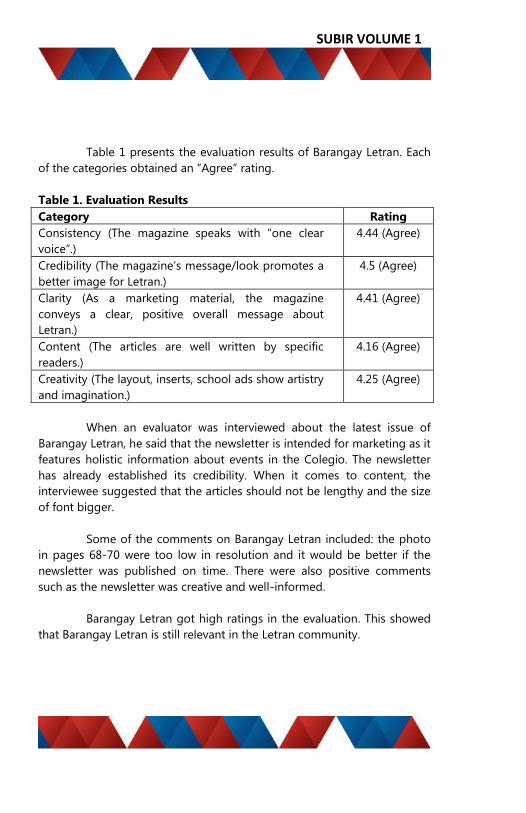
SUBIR VOLUME 1
Table 1 presents the evaluation results of Barangay Letran. Each
of the categories obtained an “Agree” rating.
Table 1. Evaluation Results
Category Rating
Consistency (The magazine speaks with “one clear
voice”.)
4.44 (Agree)
Credibility (The magazine’s message/look promotes a
better image for Letran.)
4.5 (Agree)
Clarity (As a marketing material, the magazine
conveys a clear, positive overall message about
Letran.)
4.41 (Agree)
Content (The articles are well written by specific
readers.)
4.16 (Agree)
Creativity (The layout, inserts, school ads show artistry
and imagination.)
4.25 (Agree)
When an evaluator was interviewed about the latest issue of
Barangay Letran, he said that the newsletter is intended for marketing as it
features holistic information about events in the Colegio. The newsletter
has already established its credibility. When it comes to content, the
interviewee suggested that the articles should not be lengthy and the size
of font bigger.
Some of the comments on Barangay Letran included: the photo
in pages 68-70 were too low in resolution and it would be better if the
newsletter was published on time. There were also positive comments
such as the newsletter was creative and well-informed.
Barangay Letran got high ratings in the evaluation. This showed
that Barangay Letran is still relevant in the Letran community.

Departmental Data Analysis 213
Conclusions and Recommendations
From the evaluation results and the qualitative comments, it
could be concluded that most of the readers of Barangay Letran were
satisfied of the publication. Although there were a few negative
comments, it can be seen that the Letran community reads and
appreciates Barangay Letran.
Based on this data analysis, it is recommended that the
upcoming Barangay Letran issues should have better quality photos and
articles that best fit the theme of the newsletter.
It is also recommended to revisit the Barangay Letran Evaluation
Form to review if there is the need to change or update the form.
To take an action on the comments, it is advisable to discuss the
results of the evaluation among the editorial board. For the upcoming
issues of Barangay Letran, the evaluation results could be used to improve
the features and design (visuals included) of this publication material.
References Cited
(extension-purdue-edu/extmedia/FNR/.FNR-269-w.pdf) retrieved
May 17, 2016.

SUBIR VOLUME 1
Seminar/Workshop on Teaching Rizal Course
ELIZABETH B. PEGANO
Research and Development Division
Background
Dr. Jose Rizal is the national hero of the Republic of the
Philippines. As Filipino, it is vital to learn the biography of the heroes who
fought for the country. The Republic Act No. 1425 of June 12, 1956 is an
act to include in the curricula of all public and private schools, colleges,
and universities courses on the Life, Works, and Writings of Dr. Jose Rizal,
particularly the novels Noli Me Tangere and El Filibusterismo
(www.gov.ph/1956/06/12/republic-act-no-1425/ retrieved June 17, 2016).
The Commission on Higher Education (CHEd) circulated a Memorandum
Order No. 59, series of 1996, stating Life and Works of Rizal as one of the
two mandated subjects to be included in the college curriculum
(ched.gov.ph, retrieved June 17, 2016).
The said Rizal course aims to teach the life and works of Rizal
among students so that they can apply these in their daily living. Rizal’s
influence to the Filipino people during his time up to the present
generations continuously serves as an inspiration on how Rizal loved his
country.
Data were gathered from the accomplished copies of evaluation
form and attendance sheets accomplished by the attendees.
Reported results of this training included the faculty acquiring
additional knowledge on teaching Rizal course, motivating students of the
course, and inspiring teachers to develop effective methodologies and
strategies in teaching Rizal’s life and works.

Departmental Data Analysis 215
Objectives
This paper aimed to:
1. Analyze the evaluation results of training on Teaching Rizal
course;
2. Ascertain the effectiveness or efficacy of the training in terms of:
a. Impact on Participants;
b. Speaker Competencies; and
b. Logistics;
3. Recommend effective methodologies and strategies so as to
improve teaching Rizal course.
Presentation and Discussion of Data
The seminar/workshop or training on Rizal course was organized
by the Research and Development Division, Research Department, and
Knowledge Management Department in coordination or collaboration
with the School of Educations, Arts, and Sciences (specifically, the Social
Sciences Cluster).
Out of 30 schools invited, only 16 schools attended/participated.
The total number of attendees were 37 within CALABARZON Region.
Table 1 shows the summary of schools and number of attendees during
the said training course.
Gulamhussein (2013) conducted a research entitled “Teaching
the Teachers: Effective Professional Development in an Era of High Stake
Accountability.” Teachers could not only provide basic knowledge in
teaching effective methodology, but also search for professional growth
to enhance the knowledge that can contribute to student learning.
Teachers need to learn and adopt new techniques for instructions through
regular practice and training as part of their professional development.

SUBIR VOLUME 1
Table 1. Total Number of Schools and Participants
No. Name of Schools Number of
Attendees
1 Calamba Doctors College – Calamba City 2
2 Canossa College – Calamba City 1
3 Colegio de San Juan de Letran Calamba –
Calamba City 13
4 DualTeach Canlubang – Calamba City 2
5 FAITH – Tanauan, Batangas 1
6 Imus Institute of Science and Technology – Imus
Cavite 4
7 International Peace Leadership College – Tanay
Rizal 2
8 Kolehiyo ng Lungsod ng Lipa – Lipa City 1
9 Lyceum of the Philippines University Batangas –
Batangas City 1
10 Lyceum of the Philippines University Laguna –
Calamba City 1
11 Pamantasan ng Cabuyao – Cabuyao City 2
12 Paref Southridge School – Muntinlupa City 2
13 Rogationist College – Silang Cavite 1
14 San Pablo Colleges – San Pablo City 1
15 Southbay Montessori – Sta. Cruz, Laguna 1
16 University of Perpetual help System Dalta - Las
Piñas City 2
Total 16 Schools 37
Attendees
Table 2 presents the evaluation results (with the attendees as
raters or evaluators). There were three categories. These are Impact on
Participants, Speaker Competencies, and Logistics. Each of these
categories obtained a “Very Good” rating. Overall, the Rizal training
received an average rating of (4.24) “Very Good.”
Schreiber, Paul, and Shibley, (2012) developed Public Speaking
Competence Rubric as the standards for evaluating a variety of
Departmental Data Analysis 217
presentation at every level of mastery. There are 11 speaking
competencies the speaker should possess. First, the topic should be suited
to the attendees and be discussed clearly by the speaker. Second, orient
the attendees about the speakers and topics emphasizing the knowledge
and experience, which the attendees get interesting. Memorable
information from the speaker that attendees can relate to their own lives
or field of experience. Third, main points of the speaker deliberately
organized, directed, and cleared to the attendees. Fourth, all supporting
materials should be credible and clearly cited. Fifth, the topic discussed by
the speaker should have a conclusion at the end. Sixth, the words to be
used should be adequate and clear to understand. Seventh,
communication and vocal expressions should be natural, clear, and
audible. Eighth, speaker demonstrates good personality, posture, gesture,
facial expressions, avoiding destructive mannerism and maintaining eye
contact.
High level of poise and confidence can boost the total
personality. Ninth, presentation shows the importance of the topic to the
audience with shared experiences related to values, beliefs, and attitudes.
Tenth, high quality of visual presentation is very useful in discussing the
topics related to the topics. Lastly, the eleventh, convincing power of the
speaker to the audience can contribute solutions to the problem in a
compelling and clear manner.
These implied that the speakers possessed public speaking
competence since they got the highest rating in the three sub-categories
under speaker competencies except for clarity of presentation showed
lowest rating 3.86 (very good) and participation of audience during event
was rated 3.64 (very good) under the impact on participants. This is
opposed to Schreiber et al. (2012), stated that the main points of the
speakers were deliberately organized, directed, and cleared to the
attendees. Nevertheless, the speakers were rated very good. The
evaluation results also revealed that the attendees gained more
knowledge/ideas in teaching Rizal course from the experts/speakers.

SUBIR VOLUME 1
Table 2. Evaluation Results of the Attendees
A. Impact on Participants Rating
1. Interest in the topic 4.14 Very Good
2. Participation during event 3.64 Very Good
3. Knowledge gained from the activity 4.00 Very Good
Average 3.93 Very Good
B. Speaker Competencies
1. Expertise/Authority on the topic 4.57 Excellent
2. Preparedness of the speaker 4.57 Excellent
3. Ability to answer questions 4.43 Very Good
4. Clarity of Presentation 3.86 Very Good
Average 4.36 Very Good
C. Logistics
1. Adequacy of the venue 4.69 Excellent
2. Quality of presentation equipment 4.08 Very Good
3. Quality of other materials (e.g. tables and
chairs)
4.69 Excellent
4. Food 4.21 Very Good
5. Facilitator’s assistance 4.46 Very Good
Average 4.43 Very Good
Overall Average 4.24 Very Good
Legend: Excellent 4.51-5.00 Very Good 3.51-4.50 Good 2.51-3.50
Fair 1.51-2.50 Poor 1.00-1.50
The qualitative comments on the resource speakers included
those that said the training was very much appreciated by the attendees
because of the informative knowledge imparted to them.
Comments on the resource speaker (Dr. Paul Dumol and Dr.
Camposano)
“Informative and excellent speaker. God bless!”
“I learned more knowledge about Rizal life and works.”
“Thank you very much! God bless!”
“They are both good.”
“Excellent”

Departmental Data Analysis 219
Out of 37 attendees, only four noted negative comments about
the training. These are the following comments:
“The contents of the training are not in congruence with its title,
Training on Teaching Rizal Course.”
“No training is done.”
“We are expecting teaching strategies and there is none.”
“The seminar was not able to meet all the objectives. I was
looking for the workshop and training/learning more effective
practices and strategies in teaching the course. I am quite
disappointed.”
The rest of the attendees were appreciative and thankful. Most of
them asked for a follow-up seminar. Some attendees suggested that the
speaker should provide handouts and a longer time for interaction. A Rizal
training course should also include High School Faculty who handle a
related subject.
Overall comments on the training:
“Very informative and very relevant.”
“Over-all very good.”
“An education of Rizal as a subject the research and presentation
of both speakers are indeed very useful, informative and
beneficial especially in teaching the course.”
“I personally would like to make things clear. The title of today’s
event is Training Workshop on Teaching Rizal Course. I was
looking for suggestions, steps or methods in teaching Rizal. But I
acknowledge and I admire the two speakers in their lectures.”
“Hope there will be next time. Focusing on the methods and
techniques in teaching the course. God bless and
congratulations.”
“Highly recommended.”
“Highly recommended to have seminar on Rizal’s Teaching in
High School/College education.”
“Thank you very much! God bless!”

SUBIR VOLUME 1
“Sana longer time is given to the plenary sessions because
insights and studies of speaker like them will help us to properly
treat/tackle the subject in the right context. Thank you for your
invitation. Keep up.”
“Sana notes from the speakers have been provided too or
included in the kit.”
“Have another Rizal Teaching Seminar.”
Conclusions
Based on the evaluation results and the qualitative comments,
the attendees were satisfied with resource speakers and the training
conducted on teaching Rizal course. Majority of the attendees were able
to meet their expectations of the training that it could be applied to their
students on teaching Rizal course. Role play or simulation as a technique
could be considered by the faculty.
As for recommendations, feeder schools could be invited to
increase the number of attendees. Also, during registration, copy of the
handouts could be distributed to the attendees. Longer time allocation for
the interaction between the attendees and speaker must be considered as
well. Finally, new teaching methodologies and strategies must be
proposed; faculty must apply creative techniques so students would go
beyond paper-and-pencil technique. Students must also role play or act
out the Life, Works, and Writing of Rizal every end of the periodical period
(prelim, midterm, and finals) in the classroom settings. Or, situational
scenario could be given among the students so they could relate their
daily experiences on the Life, Works, and Writing of Rizal. Glover (2014)
stated that role play is one technique of learning that allows students to
explore situational or realistic scenarios by interacting with their other
classmates. Students can create situations based on their own learning
and understanding in a different point of view. Proposed methodologies
and strategies could be used by the faculty in classroom settings or
applied in bigger venues.
For the next round of seminar on teaching Rizal course, the high
school faculty in (Grade 9 and Grade 10) from CALABARZON area, who

Departmental Data Analysis 221
teach El Filibusterismo and Noli Me Tangere, which are integrated in the
Filipino subjects, could be invited.
References Cited
(www.gov.ph/1956/06/12/republic-act-no-1425/) retrieved June 17, 2016.
Commission on Higher Education (CHEd) pursuant a Memorandum Order
No. 59, series
of 1996, (ched.gov.ph) retrieved June 17, 2016.
Gulamhussein, Allison, 2013 “Teaching the Teachers: Effective Professional
Development in an Era of High Stake Accountability”
http://www.centerforpubliceducation.org/Main-
Menu/Staffingstudents/Teaching-the-Teachers-Effective-
Professional-Development-in-an-Era-of-High-Stakes-
Accountability/Teaching-the-Teachers-Full-Report.pdf retrieved
August 25, 2016.
Schreiber, L., Paul, G. & Shibley, L. R., 2012 Public Speaking Competence
Rubric
https://courses.lumenlearning.com/publicspeaking/chapter/spea
king-competencies/ retrieved September 2, 2016
Glover, Ian, 2014 Role-play: An Approach to Teaching and Learning
https://blogs.shu.ac.uk/shutel/2014/07/04/role-play-an-approach-to-
teaching-and-learning/ retrieved December 7, 2016

SUBIR VOLUME 1
Assessment of the 7S Implementation in Colegio de San Juan
de Letran Calamba, AY 2015-2016
MARINELA L. QUINTO
Quality Management and Planning Department
Background
5S is one of the quality tools to achieve performance excellence.
It is used to establish and maintain a quality environment that helps in
reducing waste and maintain a high degree of cleanliness and orderliness
in the work place (Hoissen, 2011). It intends to organize, order, clean,
standardize and continuously improve a work area. The name “5S” was
derived from five Japanese words namely, Seiri, Seiton, Seiso, Seiketsu,
and Shitsuke, which when translated mean Sort, Set in Order, Shining,
Standardize, and Sustain, respectively.
Sort helps to categories items into “necessary,” “unnecessary,
“and “not necessary now but may be needed in the future.” It intends to
remove all unnecessary items. Set establishes locations and quantities
needed for efficient operation. Shine represents cleaning through
inspection. Standardize implements visual displays and controls. Sustain
helps to keep the organization effort in place through training and total
employee involvement (Ab Aziz, Jaafar, and Mat, 2015).
Recognizing the importance of reducing waste and optimizing
productivity through maintaining an orderly workplace, the Colegio,
through the Quality Management and Planning Department and Property
Management and General Services Department, implemented the
modified 5S or the 7S Methodology in AY 2014-2015. Letran Calamba
observes the mantra of 7S i.e. “A place for everything and everything in its
place.” This method encourages the personnel to improve their working
conditions and help them to learn to reduce waste, streamlined services,
and optimize efficiencies (AP:03-00-QP-16 7S Methodology).
7S refers to Sort, Set in Order, Systematize, Standardize, Maintain
Safety, Promote Security, and Sustain Self-Discipline.
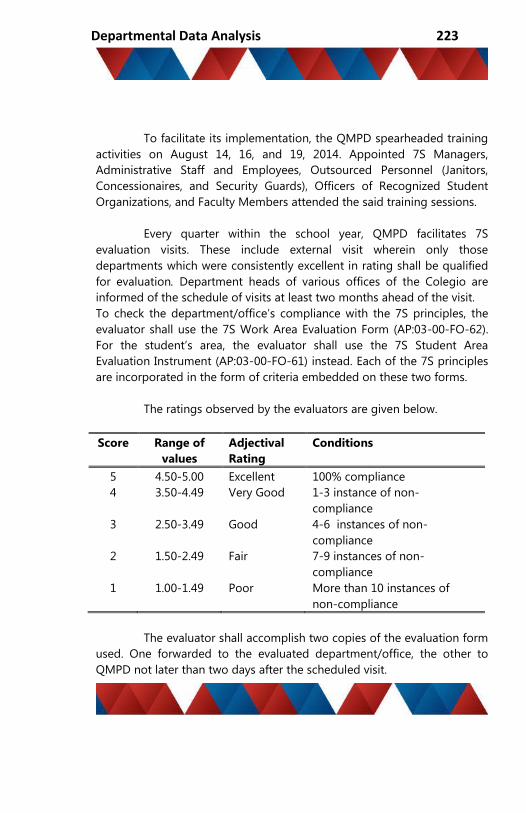
Departmental Data Analysis 223
To facilitate its implementation, the QMPD spearheaded training
activities on August 14, 16, and 19, 2014. Appointed 7S Managers,
Administrative Staff and Employees, Outsourced Personnel (Janitors,
Concessionaires, and Security Guards), Officers of Recognized Student
Organizations, and Faculty Members attended the said training sessions.
Every quarter within the school year, QMPD facilitates 7S
evaluation visits. These include external visit wherein only those
departments which were consistently excellent in rating shall be qualified
for evaluation. Department heads of various offices of the Colegio are
informed of the schedule of visits at least two months ahead of the visit.
To check the department/office’s compliance with the 7S principles, the
evaluator shall use the 7S Work Area Evaluation Form (AP:03-00-FO-62).
For the student’s area, the evaluator shall use the 7S Student Area
Evaluation Instrument (AP:03-00-FO-61) instead. Each of the 7S principles
are incorporated in the form of criteria embedded on these two forms.
The ratings observed by the evaluators are given below.
Score Range of
values
Adjectival
Rating
Conditions
5 4.50-5.00 Excellent 100% compliance
4 3.50-4.49 Very Good 1-3 instance of non-
compliance
3 2.50-3.49 Good 4-6 instances of non-
compliance
2 1.50-2.49 Fair 7-9 instances of non-
compliance
1 1.00-1.49 Poor More than 10 instances of
non-compliance
The evaluator shall accomplish two copies of the evaluation form
used. One forwarded to the evaluated department/office, the other to
QMPD not later than two days after the scheduled visit.
SUBIR VOLUME 1
Result of the evaluation visits are then reported to the top
management by the Quality Management Representative.
In AY 2015-2016, four 7S audits were conducted. Announced
visits were scheduled on July 13, 2015 and January 26, 2016 and an
unannounced visit was scheduled on October 26, 2015. Only qualifying
departments were visited on April 19, 2016, unannounced. External
auditors were invited to facilitate the said audits.
Objectives
With the background previously given, this paper intends to
address the following objectives:
1. To analyze the performance of departments in all the scheduled
7S audit visits;
2. To compare the results of announced and unannounced 7S Audit;
3. To identify the created changes in student and work areas of the
four audit cycles;
4. To summarize the items left unaddressed by the departments and
offices; and
5. To determine possible implications of the findings to the Letran
system.
Presentation of Data
As previously mentioned, evaluators shall use either or both
evaluation forms (AP:03-00-FO-61 and AP:03-00-FO-62) as tool/s for
audit. For this series of evaluation visits, the evaluators used the 7S
Student Area Evaluation Instrument (FO-61) for faculty rooms, classrooms
and laboratories and the 7S Work Area Evaluation Form (FO-62) for the
offices. Data were mainly extracted from submitted forms for AY 2015-
2016.

Departmental Data Analysis 225
A. Performance of Departments
On July 13, 2015 7S Audit.
Generally, the Colegio achieved a general mean rating of 4.08
(Very Good). The Research and Development topped the First 7S
Audit, with a mean rating of 4.61. It was followed by Administration
and Planning Division and Religious Education, Mission, and Identity
Division with 4.32 and 4.26, respectively. Meanwhile, the Academics
Division and Finance Division got 3.94 and 3.91, respectively. LCFEA
got a mean rating of 3.45. Figure 1 shows the evaluation result.
Figure 1. Evaluation Result, July 13, 2015
Academics Division, Finance Division and LCFEA reached a mean
rating lower than 4.0 and were the least among the divisions of the
Colegio. Academics division has considerably large area of
responsibility as the schools were under their care. Two of these
schools, identified below, did not meet the required lower control
limit and thus may have affected the generated mean rating. PMGSD,
however, was in-charge of and was partly responsible for overall

SUBIR VOLUME 1
property-related concerns of the Colegio. And since the former was
under the Finance Division, its mean rating was thus influenced.
LCFEA, on the other hand, was not being strictly urged to conform in
the Colegio’s quality management system. Proper observance of 7S
principles may have been prioritized less.
The following departments and offices received an excellent rating:
1. Knowledge Management Department (mean = 4.84);
2. School of Computer Studies and Technology (mean = 4.80);
3. Athletics and Sports Office(mean = 4.73);
4. Office of the Vice President for Administration and Planning
(mean = 4.69);
5. Research Department (mean = 4.67);
6. Registrar's Department (mean = 4.64);
7. Admissions and Scholarships Office (mean = 4.53); and
8. Accounting Department (mean = 4.51).
The following departments were given Corrective Action Notification
for not meeting the required lower control limit i.e. 3.50.
1. School of Engineering (mean = 3.41);
2. Property Management and General Services Department (mean
= 3.37);
3. Safety and Security Office (mean = 3.16); and
4. School of Business, Management, and Accountancy (mean =
3.05).
Issuance of Corrective Action Notification challenges the concerned
departments to perform well for the next evaluation visit by presenting
that the previously recorded findings were addressed. Recipients of CAN
could positively view this as room for improvement and, in turn, develop a
greater sense of commitment to the 7S mantra.
On October 26, 2015 7S Audit.
Generally, the Colegio achieved a general mean rating of 3.87
(Very Good). It was 0.21 lower than the July 2015 7S Audit results.

Departmental Data Analysis 227
Once again, the Research and Development topped the 2nd 7S
Audit, with a mean rating of 4.40. It was followed by Finance Division and
Administration and Planning Division with 4.18 and 4.15, respectively.
Meanwhile, the REMI Division and Academics Division got 4.11 and 4.03,
respectively. LCFEA got a mean rating of 2.36. Figure 2 shows the
evaluation result.
Figure 2. Evaluation Result, October 26, 2015
Finance Division has made a big improvement from being one of
the least ranks to top 2. Evaluators noted the progress of the departments
under the division indicating almost all observations from previous visit
were properly addressed. Most of the offices impressed the evaluators by
taking the initiative to make improvements in the workplace that were not
identified during the last 7S visit. LCFEA, despite receiving
recommendations from the assigned evaluator, failed to improve its
rating. Generally, LCFEA is composed of members that were also occupied
with work as officers, others as faculty members. Also, LCFEA has just
transferred for renovation purposes and thus have not managed to put
things in proper places by the time of the visit.
SUBIR VOLUME 1
The following departments and offices received an excellent rating:
1. School of Computer Studies and Technology (4.91);
2. Medical and Dental Clinic (4.85);
3. Auxiliary Business Department (4.78);
4. Accounting Department (4.62);
5. Knowledge Management Department (4.58); and
6. Guidance and Counseling Services Office (4.54).
The evaluating rating of the following department slide down from
Excellent to Very Good.
1. Registrar's Department (0.71; from 4.64 to 3.93);
2. Admissions and Scholarships Office (0.65; from 4.53 to 3.88);
3. Office of the Vice President for Administration and Planning
(0.57; from 4.69 to 4.12);
4. Research Department (0.19; from 4.67 to 4.48); and
5. Athletics and Sports Office (0.49; from 4.73 to 4.24).
Also, the following evaluation result of the following departments
improved from Good to Very Good.
1. School of Business, Management, and Accountancy (0.96; from
3.05 to 4.01);
2. Safety and Security Office (0.54; from 3.16 to 3.70); and
3. Property Management and General Services Department (0.9;
from 3.37 to 4.27).
Only the School of Engineering (mean=2.99) achieved below
rating. Evaluation result for SE has been affected by the accumulation of
findings from each laboratory within their premises. Though the deans,
the employees and the faculty members have embraced the 7S mantra,
the students have found to be unsupportive of observing 7S principles in
their respective classrooms.

Departmental Data Analysis 229
On January 26, 2016 7S Audit.
Generally, the Colegio achieved a general mean rating of 4.38
(Very Good). It was 0.52 higher than the October 2015 7S Audit results.
Once again, the Research and Development topped the 3rd 7S
Audit, with a mean rating of 4.88. It was followed by Finance Division and
Academics Division with 4.61 and 4.59, respectively. Meanwhile, the REMI
Division and Administration and Planning Division got 4.58 and 4.52,
respectively. LCFEA got a mean rating of 3.13.
Figure 3 shows the evaluation result.
Figure 3. Evaluation Result, January 26, 2016
Figures 2 and 3 obviously show that all divisions improved
implying total adherence of administrations, employees, faculty and
students in maintaining order in their respective work area.
On April 19, 2016 7S Audit.

SUBIR VOLUME 1
Only those departments with consistent excellent ratings were
audited. Generally, the Colegio achieved a general mean rating of 4.68
(Excellent). The Accounting Department topped the 4th 7S audit, with a
mean rating of 4.70 (Excellent). Knowledge Management Department and
School of Computer Studies and Technology got a rating of 4.69 and 4.66,
respectively.
Given the fact that more than one department performed
excellently during the first series of audits and were qualified to be
candidates for the annual quality award, the Colegio are deemed
responsive to the call for cleanness and order.
B. Comparative Data of Announced and Unannounced Visit
Figure 4 shows the comparative data of announced visit
scheduled on July 13, 2015 and January 26, 2016 and unannounced visits
scheduled on October 26, 2015 and April 19, 2016.
Generally, an average of 0.09 increase is noted from the results
of announced versus the unannounced visit. Only the Office of the Letran
Calamba Employees Association had a decrease of 0.16.
Figure 4. Comparative data of announced and unannounced 7S Audit,
AY 2015-2016
Departmental Data Analysis 231
Moreover, the performance of the following departments has
decreased from announced to unannounced visit.
1. Athletics and Sports Office (from 4.45 to 4.18; 0.28↓);
2. Registrar's Department (from 4.41 to 4.19; 0.23↓);
3. Knowledge Management Department (from 4.89 to 4.67; 0.22↓);
4. Office of the Vice President for Administration and Planning
(from 4.53 to 4.36; 0.17↓);
5. LeCFEA (from 3.29 to 3.13; 0.16↓); and
6. Community and Extension Services Department (from 4.15
to 4.04; 0.11↓).
Also, the following evaluation result of the following
departments improved from Very Good to Excellent based on announced
and unannounced ratings.
1. School of Business, Management, and Accountancy (from 3.77
to 4.50; 0.73↑);
2. School of Engineering (from 4.07 to 4.74; 0.66↑);
3. School of Nursing (from 4.37 to 4.92; 0.56↑);
4. Library Services Department (from 4.38 to 4.93; 0.55↑);
5. Graduate School and Professional Services (from 4.42 to 4.92;
0.50↑);
6. Management Information Systems Department (from 4.14 to
4.63; 0.49↑); and
7. Basic Education Department (from 4.10 to 4.53; 0.43↑).
Having been excellent, these departments were expected to
motivate other departments through sharing of best 7S practices while
maintaining individual dedication for cleanness ad order.
SUBIR VOLUME 1
C. Created changes in Student and Work Areas
Following are the core created changes in student and work
areas brought by the implementation of 7S in Letran Calamba in AY 2015-
2016.
On Student Areas.
1. Cabinets and drawers are properly labeled (Set in Order).
2. A designated place for personal blessings was arranged (Set in
Order).
3. Cleanliness was maintained. Dusts and dirt were frequently
removed and cleaned (Systematize).
4. Damaged/defective equipment was reported for repair,
replacement, and disposal (Standardize).
5. Signages were made visible (Standardize).
6. Labeling were standardized (Standardize).
7. Wires were arranged (Maintain Safety).
8. Obstructing items were removed from the doors (Maintain
Safety).
9. Defective sockets and plugs were reported and removed
(Maintain Safety).
On Work Areas.
1. Cabinets, Bins, Trays, and Bookshelves were labeled (Set in
Order).
2. Supplies and equipment were labeled (Set in Order).
3. Equipment, documents, and furniture for disposal were tagged
(Set in Order).
4. Large things (sofa, tables, and water containers) were set in
place (put out of the way) (Set in Order).
5. Personal items were put in a designated place (Set in
Order).
6. Removes masking/scotch tape sticked on walls/drawers
(Systematize).
7. Maintains cleanliness of the work area (removes dust and dirt)
(Systematize).

Departmental Data Analysis 233
8. Old and dirty curtains were replaced (Systematize).
9. Maintenance or repair of broken floor tile, walls, etc. were
requested and acted upon (Systematize).
10. Clean hour were periodically conducted and monitored
(Systematize).
11. 7S materials were posted on bulletin board (Systematize).
12. Consistent filing/labeling system is implemented (Systematize).
13. Labels or locators for specific areas were made (Systematize).
14. Damaged cabinets were fixed (Systematize).
15. Metal detectors were checked every month (Systematize).
16. Frequent reminder on fire extinguisher replacement, repair,
maintenance etc was made (Maintain Safety).
17. Exit labels/signages were provided (Maintain Safety).
18. Wires were arranged (Maintain Safety).
19. Alternative exit in case of emergency was designated (Maintain
Safety).
20. Obstruction from the fire exit was removed (Maintain Safety).
21. Locks on exit windows were limited (Maintain Safety).
22. Damaged sockets/plugs were replaced (Maintain Safety).
23. Insect repellants such as Baygon and Raid are no longer used
(Maintain Safety).
24. Building layout/emergency or evacuation plans were posted
(Maintain Safety).
D. Unaddressed Findings of Departments and Offices
Following are the core findings in student and work areas which were
left unaddressed in AY 2015-2016.
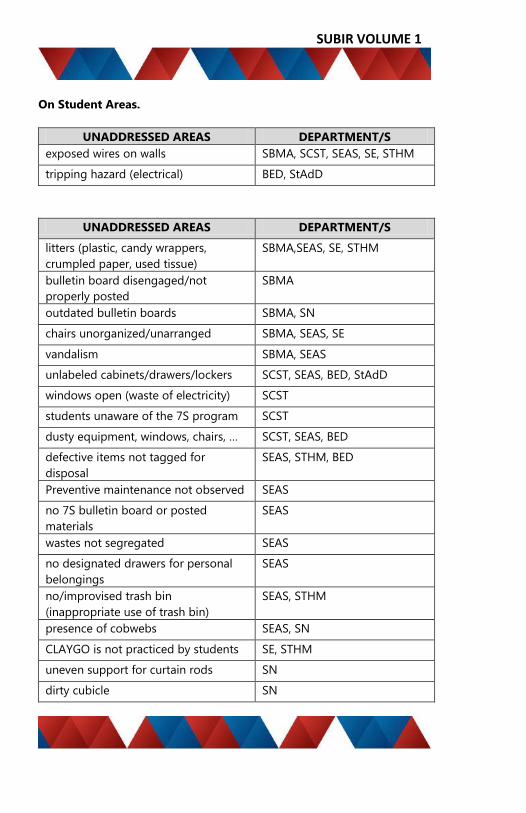
SUBIR VOLUME 1
On Student Areas.
UNADDRESSED AREAS DEPARTMENT/S
exposed wires on walls SBMA, SCST, SEAS, SE, STHM
tripping hazard (electrical) BED, StAdD
UNADDRESSED AREAS DEPARTMENT/S
litters (plastic, candy wrappers,
crumpled paper, used tissue)
SBMA,SEAS, SE, STHM
bulletin board disengaged/not
properly posted
SBMA
outdated bulletin boards SBMA, SN
chairs unorganized/unarranged SBMA, SEAS, SE
vandalism SBMA, SEAS
unlabeled cabinets/drawers/lockers SCST, SEAS, BED, StAdD
windows open (waste of electricity) SCST
students unaware of the 7S program SCST
dusty equipment, windows, chairs, … SCST, SEAS, BED
defective items not tagged for
disposal
SEAS, STHM, BED
Preventive maintenance not observed SEAS
no 7S bulletin board or posted
materials
SEAS
wastes not segregated SEAS
no designated drawers for personal
belongings
SEAS
no/improvised trash bin
(inappropriate use of trash bin)
SEAS, STHM
presence of cobwebs SEAS, SN
CLAYGO is not practiced by students SE, STHM
uneven support for curtain rods SN
dirty cubicle SN

Departmental Data Analysis 235
UNADDRESSED AREAS DEPARTMENT/S
materials not properly placed in order SN
no knowledge of 7S BED
water flow box dirty BED
needs discipline of students using the
area
StAdD
locker not utilized StAdD
On Work Areas.
UNADDRESSED AREAS DEPARTMENT/S
Assorted files (cluttered, not
organized)
OVPAP,SEAS, SBMA, SE, SN,
BED, REGD, BELRC, Technical
Library, OVPF, PMGSD, SSO,
LCFEA
Label of key box OVPAP-Information Office
no turnover letters PMS Equipment
Maintenance
OVPAP Information Office,
MDC, OVPA, STAdD
UNADDRESSED AREAS DEPARTMENT/S
wires and cables as tripping hazard,
or exposed on walls
OVPAP-Information office,
OVPA, SBMA,SCST, SN, STHM,
REGD, LSD, Technical Library,
RD, KMD, PMGSD, SSO, MISD,
LCFEA
personal things (e.g. bags, sandals,
etc) on/under the table/work station
OVPAP-Information Office,
HRD, GSPS, SBMA,SN,BED,
LSD, Graduate Library, OVPRD,
KMD, StAdD, GSPO, AsPO,
AdSCO
(open/unlabeled/empty) fire hose
cabinet/fire equipment
HRD, SN
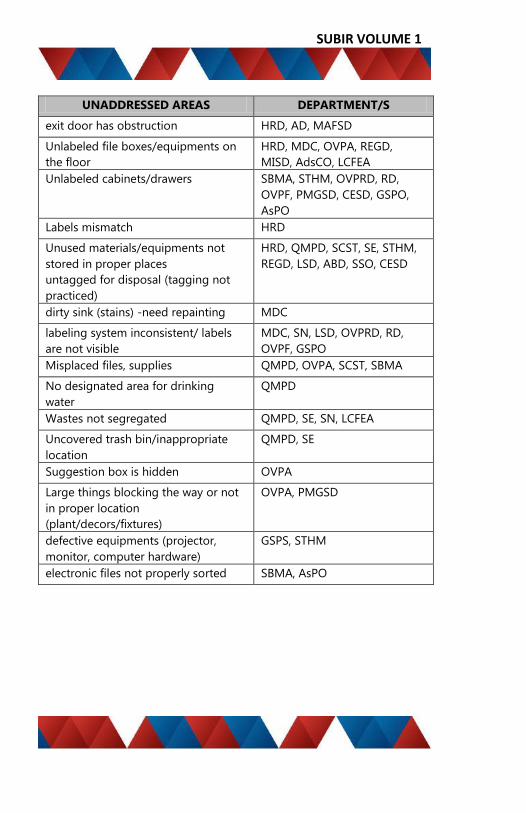
SUBIR VOLUME 1
UNADDRESSED AREAS DEPARTMENT/S
exit door has obstruction HRD, AD, MAFSD
Unlabeled file boxes/equipments on
the floor
HRD, MDC, OVPA, REGD,
MISD, AdsCO, LCFEA
Unlabeled cabinets/drawers SBMA, STHM, OVPRD, RD,
OVPF, PMGSD, CESD, GSPO,
AsPO
Labels mismatch HRD
Unused materials/equipments not
stored in proper places
untagged for disposal (tagging not
practiced)
HRD, QMPD, SCST, SE, STHM,
REGD, LSD, ABD, SSO, CESD
dirty sink (stains) -need repainting MDC
labeling system inconsistent/ labels
are not visible
MDC, SN, LSD, OVPRD, RD,
OVPF, GSPO
Misplaced files, supplies QMPD, OVPA, SCST, SBMA
No designated area for drinking
water
QMPD
Wastes not segregated QMPD, SE, SN, LCFEA
Uncovered trash bin/inappropriate
location
QMPD, SE
Suggestion box is hidden OVPA
Large things blocking the way or not
in proper location
(plant/decors/fixtures)
OVPA, PMGSD
defective equipments (projector,
monitor, computer hardware)
GSPS, STHM
electronic files not properly sorted SBMA, AsPO

Departmental Data Analysis 237
UNADDRESSED AREAS DEPARTMENT/S
needs refresher about 7S;
minimal/negligible amount of time
and resources for 7S implementation
SBMA, LCFEA
Unupdated bulletin boards/outdated
memos, announcements still posted
SBMA, LSD, RD
Back-up all documents to a hard drive
/offsite
SEAS, MISD, GSPO
No 7S collaterals displayed on
bulletin board
SEAS, STHM, BELRC, LCFEA
incomplete clean up day monitoring/
uncollected
SE, REGD, PMGSD, MAFSD
drainage area with stagnant water SE
dusty machines, cabinets, windows,
tables, chairs, floor area
SE, BELRC, RD, KMD, AD, ABD,
OVPREMI, AsPO
presence of cobwebs SN, BELRC
dirty cubicle SN
traces of tapes on wall/window glass STHM, CAD
teachers are unaware of the clean-up
hour monitoring chart
BED
worn-out labels LSD
dying plant near the pantry station BELRC
keep safe confidential files/files not
for public viewing
OVPRD, GSPO, LCFEA
materials on the floor RD, SSO
computer not locked/ logged off KMD, AsPO
no standard for cabinet/drawer
capacity
KMD
processes such as Photocopying are
not known to all staff
AD
no designated place to store other SSO, CAD

SUBIR VOLUME 1
UNADDRESSED AREAS DEPARTMENT/S
materials
emergency response team and maps
not displayed
SSO
no presented documents on
debriefing or orientation of personnel
SSO
no business continuity plan MISD
not fire proof storage room MAFSD
phone calls unanswered within 3 rings MAFSD
no record for authorized person who
can modify
AsPO
no fixed asset movement AsPO
dirty water flow RED
Other findings were considered ‘out of the department’s control’,
as stated on most of submitted 7S Audit Feedback (AP:03-00-FO-76)
forms. Since PMGSD co-manages the implementation of 7S in the
Colegio, it is partly held responsible in ensuring that recommendations on
property-related findings are acted upon by the concerned department.
What follows were areas remained unaddressed that were clustered for
coordination with PMGSD.
On Student Areas.
UNADDRESSED AREAS DEPARTMENT/S
on general properties
platform safeguard removed, broken,
misaligned
SBMA
broken floor tiles/wall/window glass SBMA, SEAS, SE, SN, STHM
ceiling drained with rainwater/ have
stains/ open
SBMA, SEAS, BED
damaged chairs/tables/drawers SEAS, STHM, BED, StAdD
on safety/emergency devices
outdated/expired fire extinguisher SEAS, BED
no fire exit SEAS, SE (CPE lab), BED
no/missing fire extinguisher SEAS

Departmental Data Analysis 239
no proper ventilation SEAS
inappropriate location for fire
extinguisher
SEAS
doors have no signage, other
signages (caution, wet floor)
SEAS, STHM
On Work Areas.
UNADDRESSED AREAS DEPARTMENT/S
on general properties
2nd floor has no aircon MDC
no signage on doors or areas (other than
the exit)/rooms (storage, restroom)
HRD, MDC, OVPA, SN, STHM,
REGD, PMGSD, CAD, LCFEA
broken floor tile, walls, window etc. (out of
department's control)
MDC, STHM, LSD, PMGSD, MISD,
OVPREMI
poor ventilation/lighting SEAS, REGD, AD, ABD, CAD
open ceiling SE
water dripping from tube extended from the
roof
HRD
uncovered walkway CAD
damaged drawers/chairs/tables HRD, GSPS, SCST, STHM, LSD,
BELRC, Graduate Library, PMGSD,
CMD, CAD
unsafe aluminum material above the door OVPRD, RD
on safety /emergency devices
No fire exit OVPAP, OVPAP-Information
Office
Inappropriate location for fire extinguisher OVPA, STHM, CESD
expired/unmaintained/unupdated fire
extinguisher
BED, REGD, OVPF
No/missing/insufficient fire extinguisher GSPS, STHM, ABD, OVPREMI
no safety plans SE
no fire exit signage RD, SSO, CESD, AsPO
signages not visible BELRC
unreplaced/unfixed light switch, electrical
outlets, plugs, open sockets
OVPRD, KMD, SSO, CAD

SUBIR VOLUME 1
E. Implications of Analysis to the Existing Letran 7S System
The assessment of the 7S Implementation in the Colegio for AY 2015-
2016 uncovers both asset and downside of the four audit cycles. The
following were the implications drawn from the analysis:
1. Some progresses have not been recorded though noticed.
Utilization of the use of the evaluation forms as tools for audit is
encouraged both for the evaluator and the evaluated office for
7S implementation, AY 2016-2017.
2. Property-related concerns have consistently become a significant
demand for most offices. The Colegio, as support for 7S
implementation, may take into account discussing this issue in
planning for the allocation of funds for the next school year.
3. Findings may be clustered as to what department or division may
the evaluated office coordinate with for addressing particular
concerns (i.e. electrical wirings, damaged equipments, chemical
spills, emergency devices, property management, etc.). This leads
to cooperation and removes individuality, if there is.
Conclusions and Recommendations
The following were drawn from the 7S findings:
1. The Colegio’s rating in 7S implementation is maintained at Very
Good from June 2015 to April 2016. It could be deduced that the
departments took the challenge of maintaining the areas clean
and orderly seriously. Positive results also led to achievement of
higher levels of accreditation and passing the Philippine Quality
Award and Global Performance Excellence Award standards.
2. Performance ratings of the department increase by 0.09 from
announced to unannounced visit. It could be deduced that the
7S principles have been embraced and implemented by the
stakeholders beyond compliance level.
Departmental Data Analysis 241
Analysis shows that the Colegio gave its full support and
commitment to observe the 7S mantra. In fact, this has led the first series
of audits to conclude with satisfying results. However, the Colegio’s aim
for continual improvement calls for new ideas and strategies in the form
of recommendations or suggestions. Some were as follow:
1. Activities such as but not limited to mentoring or coaching and
reorientation that may improve the performance of LCFEA and
Academics Division may be crafted.
2. Unaddressed items will be communicated to the concerned
departments and offices. Also, it will be given to 7S Auditors for
audit in AY 2016-2017.
References
Hossein Hojjati, S. M. (2011). Implementing 5S System in Persia Noor
Factory. International Journal of Industrial Engineering, 18(8),
425-431.
Wan Asri Wan Ab Aziz, Nurlidaini Jaafar, and Azman Che Mat (2015).
Implementation of 5s Practices At 3k Elite Schools In
Terengganu. Academic Journal, 4(1), 62

SUBIR VOLUME 1
Evaluation of Student Research Colloquia (AY 2015-2016) as a
Research Dissemination Strategy
MARIA MORENA M. TAMAYO
Research Department
Background
Dissemination of research findings is a significant step in the
research process. Research dissemination involves communication of
investigation results and innovations. Effective communication is
important to effectively disseminate research outcomes (Crosswaite &
Curtis, 2016). The main objective of research dissemination is to increase
awareness leading to research utilization. According to Brigham Research
Institute (n.d.), creating a sound research dissemination strategy results in
increased research awareness, which helps to maximize the utilization of
research outcomes.
Research outcomes, when properly communicated, could trigger
policy makers to improve current practices. In the Colegio, the Student
Research Unit (SRU) of the Research Department (RD) disseminates
research outcomes through the conduct of annual Student Research
Colloquium. Student Research Colloquium is an academic activity wherein
student-researchers share the results of research studies to the academic
community. This activity aims to provide proper forum for the
dissemination of significant research findings and to serve as a venue for
the academic community to critique relevant research outcomes. In this
manner, research outcomes of the students become more worthwhile, as
these are communicated to the stakeholders.
Yearly, RD selects student-researchers to present research
outcomes during the Research Colloquium. Presenters are determined
based on the final defense grades obtained by the students. The top two
groups who got the highest final defense grade excluding re-defense
group per program are selected as presenters except for SE and SCST
Programs). Each group are given 15 minutes to present their research
studies. The target audiences are the incoming student researchers the
following academic year including respective faculty members, program

Departmental Data Analysis 243
chairs, and academic head of the Colegio. An open forum type of
discussion ensues after the research presentation. There will be no invited
reactors for this colloquium. In addition, student research colloquium
usually coincides with the selection of best research but in no way will it
influence the process. Those who would present during the colloquium do
not automatically qualify as awardees for best research paper. Student
research colloquium is held before the 2nd semester ends (Handbook for
Student Research, 2015).
Student Research Colloquium for AY 2015-2016 was conducted
on March 8, 2016, 8 a.m. to 1:30 p.m. in parallel sessions. A total of 21
groups from the School of Tourism and Hospitality Management (STHM),
School of Business, Management, and Accountancy (SBMA), School of
Nursing (SN), and School of Education, Arts, and Sciences (SEAS)
presented their research outcomes. RD conducted an evaluation after the
said activity. The student-researchers under the STHM and SBMA
presented their research outcomes at room M301 (Session A), while
student-researchers under the SN and SEAS had their research
presentation at NSL3 (Session B).
In light of this, the AY 2015-2016 Student Research Colloquium,
as a dissemination strategy, was evaluated to ascertain the perception of
the participants whether the said activity met its objectives. Brigham
Research Institute (n.d.) noted that evaluation of dissemination strategies
can give a clear understanding of its effectiveness as well as identifying
the barriers to properly communicate research results. Research
dissemination is done for the purpose of dissemination for awareness,
understanding, and action
(http://www.innovations.ac.uk/btg/resources/publications/dissemination.p
df, Retrieved on July 29, 2016).

SUBIR VOLUME 1
Objectives
This study generally aimed to analyze the perception of the
participants on the Student Research Colloquium for AY 2015-2016.
Specifically, this study intended to:
analyze the feedback of the participants on the conduct of
Student Research Colloquium; and
outline action plans to improve the conduct of Student Research
Colloquium, as a research dissemination strategy.
Presentation and Discussion of Data
The RD personnel distributed the evaluation form to the
participants of the Student Research Colloquium. The criteria being
evaluated were attainability of the objectives, clarity of the presentation,
ability to answer questions, adequacy of the venue, quality of presentation
equipment, quality of other equipment (tables, chairs, and sound system)
using the 5-point scale rating (Likert scale).
The participants were also asked to write their comments and
suggestions in the evaluation form.
Feedback of the Participants
There were a total of 182 and 96 participants in Session A and B,
respectively. Attendees included administrators and administrative staff,
presenters, faculty members, employees, parents, and students.
Mean range Interpretation
1.00-1.50 Poor
1.51-2.50 Fair
2.51-3.50 Good
3.51-4.50 Very Good
4.51-5.00 Excellent
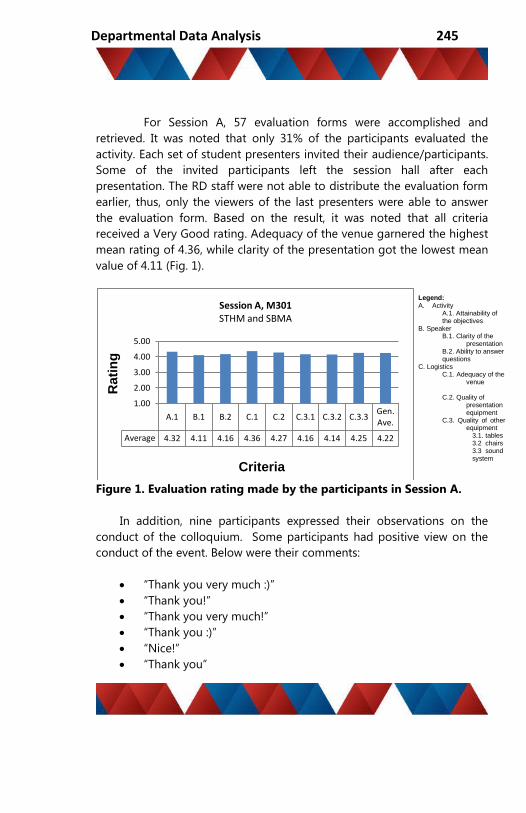
Departmental Data Analysis 245
For Session A, 57 evaluation forms were accomplished and
retrieved. It was noted that only 31% of the participants evaluated the
activity. Each set of student presenters invited their audience/participants.
Some of the invited participants left the session hall after each
presentation. The RD staff were not able to distribute the evaluation form
earlier, thus, only the viewers of the last presenters were able to answer
the evaluation form. Based on the result, it was noted that all criteria
received a Very Good rating. Adequacy of the venue garnered the highest
mean rating of 4.36, while clarity of the presentation got the lowest mean
value of 4.11 (Fig. 1).
Figure 1. Evaluation rating made by the participants in Session A.
In addition, nine participants expressed their observations on the
conduct of the colloquium. Some participants had positive view on the
conduct of the event. Below were their comments:
“Thank you very much :)”
“Thank you!”
“Thank you very much!”
“Thank you :)”
“Nice!”
“Thank you”
A.1 B.1 B.2 C.1 C.2 C.3.1 C.3.2 C.3.3Gen.Ave.
Average 4.32 4.11 4.16 4.36 4.27 4.16 4.14 4.25 4.22
1.00
2.00
3.00
4.00
5.00
Rati
ng
Criteria
Session A, M301STHM and SBMA
Legend: A. Activity
A.1. Attainability of the objectives
B. Speaker B.1. Clarity of the
presentation B.2. Ability to answer questions
C. Logistics C.1. Adequacy of the
venue
C.2. Quality of presentation equipment
C.3. Quality of other equipment
3.1. tables 3.2 chairs 3.3 sound system

SUBIR VOLUME 1
Such comments indicate that these participants appreciate the way
research outcomes were disseminated to the stakeholders. Moreover,
other participants gave suggestions for further improvement of the
activity:
“Lakasan po yung aircon ang init :)”
“Lakasan pa po yung aircon dahil summer na at sobrang init. “
“Chairs must be comfortable to audience and safe. (Baka po
magtaob yung seat ng audience)”
For Session A, it could be noted that the venue is the utmost
concern of the participants. Hence, physical structure should be given
extra consideration when planning for a research conference.
For Session B, 36 out of 96 participants accomplished the
evaluation forms. It was observed that only 38% of the participants
accomplished the evaluation form. Only the participants of the last
presenters evaluated the activity.
In this session, the conduct of the activity also got a general
rating of Very Good. It showed that the quality of the presentation
equipment obtained the highest rating of 4.62 (Excellent). However, it was
noted that adequacy of the venue received a very low rating of 3.97 (Fig.
2), although it was still got a Very good rating.
A.1 B.1 B.2 C.1 C.2 C.3.1 C.3.2 C.3.3Gen.Ave
Average 4.58 4.50 4.53 3.97 4.62 4.28 4.20 4.37 4.37
1.00
2.00
3.00
4.00
5.00
Rat
ing
Criteria
Session B, NSL3SN and SEAS
Legend: A. Activity
A.1. Attainability of the objectives
B. Speaker B.1. Clarity of the
presentation B.2. Ability to answer
questions C. Logistics
C.1. Adequacy of the venue
C.2. Quality of presentation equipment
C.3. Quality of other equipment 3.1. tables 3.2 chairs 3.3 sound system
Departmental Data Analysis 247
Figure 2. Evaluation rating made by the participants in Session B.
Some of the participants appreciated the effort of conducting the activity.
Here are the qualitative feedbacks of the participants towards the
preparation and conduct of the activity. Positive feedbacks are as follows:
Excellent and good job!
Thank you po :) Sa opportunity upang ipresenta at ibahagi ang
aming kakayahan, mga natutunan at ang aming pinaghirapan
Further, venue was the main concern of the participants. NSL3 is
smaller compared to M301. The low evaluation rating in the venue was
affirmed by the qualitative response of the participants. They suggested
for a larger venue to accommodate more audience. Below are the
comments:
Bigger Venue
Different Venue
Bigger room from other students to observe and longer time to
encourage question and answers particularly from students or
future researchers
To a larger venues so that interested school or program can
participate to attend/ to presentation. Thank you po so much for
the support in this dept.
Include foods next time :)
The objective is to just disseminate/ showcase research outputs/
topics - however, some persons in the open forum did scrutinize
the said outputs. Constructive indeed, but the presenters were
somehow fried in front of the many. Overall, a very meaningful
program.
The research colloquium should be formal, intimate, and, well-
prepared. Let the student-researchers feel that their efforts were
worth showcasing to a larger audience.
The revised title should be written in the program

SUBIR VOLUME 1
Figure 3 showed the summary of evaluation of the two sessions.
Overall, the evaluation rating was Very Good with a mean score of 4.30.
The participants agreed that objective of the activity was met as
manifested in the evaluation. Also, quality of presentation equipment was
appreciated by the attendees. These two criteria received the highest
rating of 4.45. Moreover, the general average on adequacy of the venue
obtained the lowest rating of 4.16, although this criterion received the
highest rating in Session A.
Figure 3. Summary of Evaluation.
The objectives of the Student Research Colloquium were to
provide proper forum for the dissemination of significant research
Legend: A. Activity
A.1. Attainability of the objectives B. Speaker
B.1. Clarity of the presentation B.2. Ability to answer questions
C. Logistics C.1. Adequacy of the venue C.2. Quality of presentation equipment C.3. Quality of other equipment
3.1. tables 3.2 chairs 3.3 sound system
Departmental Data Analysis 249
findings and to serve as a venue for the academic community to critique
relevant research outcomes. The colloquium was able to create awareness
and understanding among the participants.
Dissemination for action is the next thing to be considered. It
pertains to a change of practice resulting from the adoption of research
project’s concepts or approaches. In this regard, the target audience shall
include those who are in a position to “influence” and “bring about
change” within their organisations
(http://www.innovations.ac.uk/btg/resources/publications/dissemination.p
df, Retrieved on July 29, 2016).
Conclusions
Given the quantitative and qualitative feedbacks, it is noteworthy
that the conduct of the Student Research Colloquium was perceived to be
Very Good. It could be concluded that the objectives of the Student
Research Colloquium were achieved. The presenters were able to present
publicly their research outputs for a wider dissemination of significant
research findings. For the colloquium to be more effective, adequacy of
the venue has to be considered. Careful scheduling of the activity is
necessary to secure an appropriate venue.
Recommendations
To address the concerns raised by the participants, RD recommended
the following to further improve the conduct of Student Research
Colloquium.
1. Report the feedbacks relative to air condition and fixtures status
to Property Management and General Services Department for
appropriate action.
2. Schedule of colloquium should not overlap with other
institutional activities so that bigger venue could be utilized.
SUBIR VOLUME 1
3. If the budget would permit, food for the audience could be
considered.
4. Orient the student-presenters that there will be an open forum
during the colloquium. Inform them to be prepared and get
ready for the possible questions.
5. Schedule of colloquium should not be coincided with other
institutional activities like Intrams and Foundation Week so that
potential audience could attend the colloquium.
6. Double check the program before finalization to ensure that
updated title is reflected in the program.
7. Review and revise the evaluation tool to ensure that the
instrument is appropriate in the activity.
Literature Cited
Birgham Research Institute (n.d.). Research Dissemination Best Practices
Resource Document. Patient-Centered Comparative Effectiveness
Research Center (PCERC).http://bwhresearch.org/wp-
content/uploads/2015/10/PCERC-Dissemination-Best-Practices-
Resource-Document.pdf
Crosswaite, C. and Curtice. L. (2016). Health Promotion International. Vol 9
(4).
http://heapro.oxfordjournals.org/
Creating an Effective Dissemination Strategy.
http://www.innovations.ac.uk/btg/resources/publications/dissemination.p
df
Handbook for Student Research (2015). Colegio de San Juan de Letran
Calamba.

Departmental Data Analysis 251
Evaluation of the Conduct of the Student Research Defense
(Proposal and Final Oral Defense, A.Y. 2015-2016)
JENNIFER V. TABUZO
Research Department
Background
Research investigates ideas and discovers valuable knowledge.
Good research reflects a genuine intention to investigate the truth, based
on available information. It provides a comprehensive overview of an issue
and discusses its context (Litman, 2012).
Research has to undergo the scrutiny of the experts to validate
its significance. The primary goal of evaluating research outcomes is to
provide useful feedback. Evaluation is the systematic acquisition and
assessment of information to provide valuable feedback (Trochim, 2006).
According to Langfeldt (2001), research outcomes are evaluated by the
researchers that are competent in the field under review.
Oral defense serves as a venue to examine the research
outcomes of the students. Graham and Graham (n.d), stated that the oral
defense provides the researchers the opportunity to present the highlight
of their research in a professional manner. Likewise, it gives the evaluator
the chance to query on any areas that are not clear to them.
The Research Department (RD) organizes the Research Defense
for the student-researchers. The oral defense is done through panel
evaluation. The Proposal Defense is conducted towards the end of the first
semester and student-researchers are required to finish the proposal
stage of their research paper, while the Final Oral Defense is conducted
towards the end of the second semester and the student-researchers
need to pass the final oral defense and submit the terminal requirements
as pre-requisite of the final grade. The RD convenes a panel of three
members to evaluate the proposal and the final research papers
submitted by the students. The Research Moderators facilitate and

SUBIR VOLUME 1
monitor the conduct of the defense. Each group is given one hour to
present and defend their proposal.
The RD designed an evaluation tool to assess the conduct of the
Research Defense. The evaluation tool consisted of items relative to the
attainment of objectives, scheduling of the defense, clarity and
implementation of the policies, and performance of the implementers.
Likewise, the tool had a provision for the student-researchers to write
their comments and suggestions. The evaluation forms were given to the
student-researchers immediately after the oral defense. Analysis of such
data is necessary to ascertain the student-researchers’ feedback. It could
serve as a basis for crafting action plan to further improve the conduct of
the oral defense.
Objectives
This study generally aimed to determine the student-researchers’
perception on the conduct of the proposal and final oral defense.
Specifically, this study intended to:
Analyze the feedback of the student-researchers on the
conduct of the proposal and final oral defense; and
Outline action plans to improve the conduct of the proposal
and final oral defense
Presentation and Discussion of Data
Conduct of the Proposal Defense
The Proposal Defense was conducted on October 5, 2015 to
December 8, 2015. Out of the 207 groups of student-researchers who
defended the research proposals, 185 groups (89.37%) got an approved
rating, 20 groups (9.66%) got a re-defense status, and 2 groups (0.97%)
did not submit their manuscript.
The conduct of the Proposal Defense was generally rated as
Excellent. Table 1 revealed that among the criteria, the research
moderators’ adequacy of the services provided to the students (4.84),

Departmental Data Analysis 253
responsiveness to the needs of the students (4.82), and professional
dealing with the students (4.80) had the top three highest mean scores.
The role of the research moderators is vital, as they act as liaison
between the RD and the students. The RD gives orientation to the
moderators before the start of the oral defense, for them to be
knowledgeable of the RD policies. The Student Research Unit (SRU) officer
closely coordinates with the research moderators regarding the details of
the research defense. Part of the functions of the moderators is to clarify
the comments of the panel of evaluators and explain it clearly to the
student-researchers.
Table 1. Students’ evaluation on the conduct of the Proposal Defense
Evaluation criteria Mean Rating Interpretation
Objectives of the activity
Objectives are well
understood
4.65
Excellent
Objectives were attained 4.69 Excellent
Schedule
The schedule is posted at
least three days prior
the
actual activity
The schedule is well
disseminated through
RD bulletin board and I
am Letran page
4.79
4.71
Excellent
Excellent
Guidelines/Policies
Clarity of guidelines and
policies
4.66 Excellent
Effective implementation
of the guidelines and
policies
4.62 Excellent
Implementers
RD Staff
Responsiveness to the
needs of the students
4.65 Excellent
Adequacy of services 4.65 Excellent

SUBIR VOLUME 1
Evaluation criteria Mean Rating Interpretation
provided
Professional dealing with
the students
Research Moderator
4.68 Excellent
Responsiveness to the
needs of the students
4.80 Excellent
Adequacy of services
provided
4.82 Excellent
Professional dealing with
the students
4.84 Excellent
Some students were grateful on the assistance provided to them
by the research moderators. They were appreciative of their moderators
for assisting them during the research defense. They stated:
“……thank you for all your guidance. We learned a lot of things in
writing the manuscript.”
“Thank you for being our guide”
“He is a very good moderator, he even accommodates us after
his class hours.”
The research moderators exhibited professional dealing with the
student-researchers. According to ACCA (2015), professionalism and
integrity are essential attributes of a true professional. An essential part of
being a professional is being able to maintain standards. A true
professional acts in a responsible manner in whatever situation that
he/she might be encountered.
The implementation of policies and guidelines got the lowest
rating. Although the rating is excellent (4.62), still there is a need to
determine the factors affecting the effective implementation of policies
and guidelines. Seemingly, there are student-researchers that were not
fully clarified about the RD guidelines even if the guidelines on the
conduct of the research defense were presented to them during the
orientation. One student-researcher commented:
Departmental Data Analysis 255
“Please make the guidelines stated on the handbook more
specific because it's too confusing.”
The RD allotted one class meeting to orient the student-
researchers on the guidelines and procedures of the oral defense. The RD
policies and guidelines are being reviewed annually, however a comment
on the lack of specificity on the guidelines could prompt the RD to further
review the guidelines written in the handbook.
Conduct of the Final Oral Defense
The Final Oral defense was conducted on February 3, 2016 to
April 25, 2016. Defense results showed that out of 207 groups of student-
researchers, 187 groups (90.34%) passed, 18 groups (8.70%) got a re-
defense status, and 2 groups (0.97%) did not submit their final manuscript.
The student-researchers rated the conduct of the Final Oral
Defense as Excellent. The top three criteria (Table 2) which got the highest
mean rating are the research moderators’ adequacy of the services
provided to the students (4.83), responsiveness to the needs of the
students (4.80), and professional dealing with the students (4.79). The
result is the same as the evaluation results of the conduct of the Proposal
Defense. This suggests that the research moderators performed well, and
that the student-researchers value the assistance provided to them by the
moderators. According to PennState (2012), being responsive to the
needs of the students is one of the key elements in providing quality
service to the students. Likewise, giving students clear directions on how
to address their queries is necessary.
Some student-researchers noted the good attributes of the
panelists. Such included:
“Great set of panellists”
“Stay professional, keep it up”
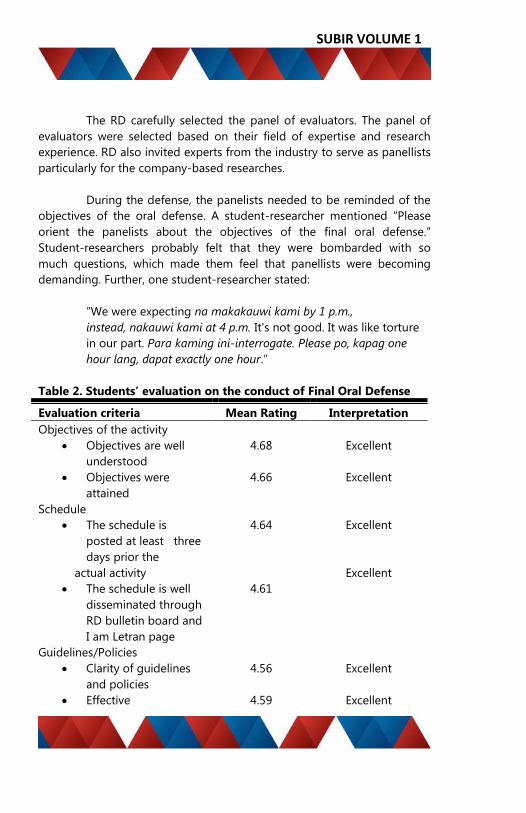
SUBIR VOLUME 1
The RD carefully selected the panel of evaluators. The panel of
evaluators were selected based on their field of expertise and research
experience. RD also invited experts from the industry to serve as panellists
particularly for the company-based researches.
During the defense, the panelists needed to be reminded of the
objectives of the oral defense. A student-researcher mentioned “Please
orient the panelists about the objectives of the final oral defense.”
Student-researchers probably felt that they were bombarded with so
much questions, which made them feel that panellists were becoming
demanding. Further, one student-researcher stated:
“We were expecting na makakauwi kami by 1 p.m.,
instead, nakauwi kami at 4 p.m. It's not good. It was like torture
in our part. Para kaming ini-interrogate. Please po, kapag one
hour lang, dapat exactly one hour.”
Table 2. Students’ evaluation on the conduct of Final Oral Defense
Evaluation criteria Mean Rating Interpretation
Objectives of the activity
Objectives are well
understood
4.68
Excellent
Objectives were
attained
4.66 Excellent
Schedule
The schedule is
posted at least three
days prior the
actual activity
The schedule is well
disseminated through
RD bulletin board and
I am Letran page
4.64
4.61
Excellent
Excellent
Guidelines/Policies
Clarity of guidelines
and policies
4.56 Excellent
Effective 4.59 Excellent

Departmental Data Analysis 257
Evaluation criteria Mean Rating Interpretation
implementation of the
guidelines and
policies
Implementers
RD Staff
Responsiveness to the
needs of the students
4.63 Excellent
Adequacy of services
provided
4.63 Excellent
Professional dealing
with the students
Research Moderator
4.60 Excellent
Responsiveness to the
needs of the students
4.80 Excellent
Adequacy of services
provided
4.83 Excellent
Professional dealing
with the students
4.79 Excellent
Meanwhile, student-researchers recognized the efforts of the RD.
Some of them commented:
“Thank you for a well-organized final oral defense.”
“Very good!”
“Thank you (n=7)”
“Our group appreciated the seminars conducted for the
student research”

SUBIR VOLUME 1
On the other hand, it could be noted that among the criteria, the
clarity of guidelines and policies got the lowest mean rating (4.56). In
terms of scheduling the defense, one commented that “the researchers
must be informed of the time of defense.” Although there were
mechanisms whereby the RD communicated the schedule of the defense,
yet other students were unaware of their defense schedule. The RD posted
the schedule of the defense in the RD bulletin board and uploaded it in
the I am Letran FB page. The students were given the orientation that they
need to check the schedule of the defense in the RD bulletin board and FB
page, from time to time.
Conclusions
Based the findings, the following conclusions were deduced:
1. The objective of the Research Defense was understood and
attained.
2. There is a need to strengthen the dissemination of schedule of
the defense.
3. Not all student-researchers clearly understood the Research
Defense policies and guidelines
4. The implementers (i.e. RD staff and research moderators)
manifested professionalism. Likewise, they provided adequate
service and were responsive to the needs of the student-
researchers.
Recommendation
To further improve the conduct of Student Research defense, the
following recommendations are forwarded:
1. There is a need to have a thorough orientation of the student-
researchers through the moderators regarding specific
procedures on the conduct of the defense and defense schedule.
2. The RD should forward the feedback relative to the facilities and
fixtures to the Property Management and General Services
Department, for appropriate action.
Departmental Data Analysis 259
3. There is a need to revisit and/or revise the evaluation form for
the defense.
Literature Cited
ACCA (2015).Ten Ways to be Professional. Retrieved from
http://www.accaglobal.com/pk/en/student/sa/professional-skills/10-ways-
to-be-professional.html
Langfeldt. L. (2001). Decision-making in expert panels evaluating research:
Constraints, processes and bias. Retrieved from
http://www.nifu.no/files/2012/11/NIFUrapport2002-6.pdf
Litman, T (2012). Evaluating Research Quality. Retrieved from
http://www.vtpi.org/resqual.pdf
PennState (2012). Customer Service in Higher Education. Retrieved from
https://dus.psu.edu/mentor/2012/06/customer-service-in-higher-
education/.
Trochim, W. (2006). Introduction to Evaluation. Retrieved from
http://www.socialresearchmethods.net/kb/intreval.php
SUBIR VOLUME 1
CSJLC Graduates Employability: A Tracer Report on Bachelor of
Science in Business Administration major in Marketing
Management Bachelor of Science in Business Administration
major Human Resource Development Management from
Academic Years
2006-2007 to 2015-2016
MARIFE M. MAGSINO
MARIFE P. SARMIENTO
ALMA GRACE Y. CID
School of Business, Management and Accountancy and
Auxiliary Business Department
Background
The strength of any academic program lies in the employability
and involvement in the community of its graduates. As such it is
imperative that the career that the alumni pursued be established
including the level their involvement of involvement. In this respect, the
Alumni Office which is under the Office of the Vice President for
Academics and serves as the link between the Colegio and its graduates,
tracks and gather information on their whereabouts.
Alumni tracking pertains to tracing the destination of the
graduates after they left the Colegio with emphasis on their employability
that will gauge the success of Letran Calamba. The tracking also shows the
involvement of graduates in the Colegio’s departmental/institutional
activities and as well as their community/professional engagements to
determine if the service to community or profession has taken roots. This
tracking is facilitated through the accomplishment of the Alumni
Profile/Tracking Form. The alumni data are then organized according to
the three applicable key performance indicators (KPI's) of the Alumni
Office, such as:
1. Percentage of college graduates per school employed/self-
employed within one year as determined through tracer studies
2. Percentage of graduates employed in related field within one
year after graduation
Departmental Data Analysis 261
3. Percentage of college graduates per school with
leadership/supervisory roles in their workplace/community within
two years after graduation
For accreditation purposes, those who were covered by the ATR
are graduates of BSBA major in Marketing Management from 2011 to
2015, and BS Commerce major in Marketing (former nomenclature of
BSBA-MKM) 2006 to 2010 including those who completed the course
after 2010. In 2007 complying with CMO No. 39 series of 2006, the
Colegio applied for change in nomenclature of BS Commerce major in
Marketing to BS Business Administration major in Marketing Management
(BSBA-MKM). The first graduation of BSBA – MKM was in 2011.
Also included in the ATR are graduates of BSBA major in Human
Resource Development Management (BSBA-HRDM) from 2011 to 2015.
Since the adoption of CMO No. 39 series of 2006, specialization tract in
Human Resource Development Management was included. The first
batch graduates in 2011.
Overtime, some data could indicate the impact of the curriculum
program over the career/professional status of graduates. The attainment
of the program educational objectives is part of the alumni tracer three to
five years after graduation.
Objectives
This paper aimed to:
1. Find out the employability of Colegio de San Juan de Letran
Calamba graduates.
2. Provide an opportunity to examine if the jobs of the alumni are
related to their field.
3. Determine the graduates’ job and level position through
leadership/ supervisory roles in the workplace/community

SUBIR VOLUME 1
Presentation and Discussion of Data
The data of the alumni tracer report came from the Alumni Office
in coordination with the School of Business, Management and
Accountancy. There is a total of four hundred sixty eight (468) BSBA –
MKM / BSC-Marketing graduates within a span of ten (10) years from
2006-2007 to 2015-2016. And there were one hundred seventy-one (171)
BSBA-HRDM graduates from 2006-2007 to 2015-2016.
Bachelor of Science in Business Administration major in Marketing
Management (BSBA-MKM)
The number of graduates per academic year ranged from 16 to
74. As shown in Table 1, about 85% graduated from AY 2010-2011 to
2015-2016. About 84% of the graduates are BSBA-MKM.
Table 1. Composition of Marketing Graduates
Year Graduated
Number of Graduates % of
Graduates
Traced
BSBA-MKM
BSC - Marketing
Total No. %
2015-2016 73 1 74 16% 15 20%
2014-2015 74 74 16% 51 69%
2013-2014 72 1 73 16% 40 55%
2012-2013 73 73 16% 57 78%
2011-2012 62 1 63 13% 38 60%
2010-2011 37 6 43 9% 31 72%
2009-2010 16 16 3% 2 13%
2008-2009 10 10 2% 5 50%
2007-2008 19 19 4% 4 21%
2006-2007 23 23 5% 2 9%
391 77 468 100% 245 52%
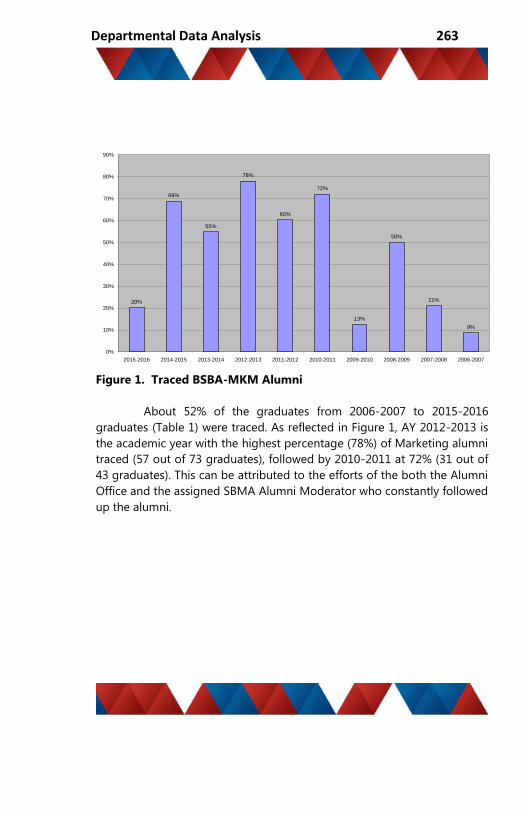
Departmental Data Analysis 263
Figure 1. Traced BSBA-MKM Alumni
About 52% of the graduates from 2006-2007 to 2015-2016
graduates (Table 1) were traced. As reflected in Figure 1, AY 2012-2013 is
the academic year with the highest percentage (78%) of Marketing alumni
traced (57 out of 73 graduates), followed by 2010-2011 at 72% (31 out of
43 graduates). This can be attributed to the efforts of the both the Alumni
Office and the assigned SBMA Alumni Moderator who constantly followed
up the alumni.
20%
69%
55%
78%
60%
72%
13%
50%
21%
9%
0%
10%
20%
30%
40%
50%
60%
70%
80%
90%
2015-2016 2014-2015 2013-2014 2012-2013 2011-2012 2010-2011 2009-2010 2008-2009 2007-2008 2006-2007

SUBIR VOLUME 1
Figure 2. Employment Status of BSBA – MKM Graduates
About 80% of those traced were employed either in domestic
and multinational corporations or managing their own businesses. Data in
Figure 2 shows a high employability rating of the BSBA – MKM graduates
ranging from 50% to 100%. About 91% of them were able to land a job
within one year after graduation. It is noteworthy to mention that 2015-
2016 graduates were employed within six month after graduation (Figure
3). Among those who were traced, an average of 78% are performing
program related work (Figure 4) in marketing and logistics.
73% 75%
68%
82%
89%87%
100% 100%
75%
50%
27% 25%
33%
18%
11%13%
0% 0%
25%
50%
0%
20%
40%
60%
80%
100%
120%
2015-2016 2014-2015 2013-2014 2012-2013 2011-2012 2010-2011 2009-2010 2008-2009 2007-2008 2006-2007
Employed/Self Employed
Not Employed

Departmental Data Analysis 265
Figure 3. Employability of BSBA – MKM
Figure 4. BSBA – MKM in Related Field
100% 100%
93%
83%
88% 89%
100%
80%
100% 100%
0% 0%
7%
17%
12% 11%
0%
20%
0% 0%0%
20%
40%
60%
80%
100%
120%
2015-2016 2014-2015 2013-2014 2012-2013 2011-2012 2010-2011 2009-2010 2008-2009 2007-2008 2006-2007
Employed within 1 year
Employed after 1 yr
100%
76%
85%
74%
71%
74%
100% 100%
67%
100%
0%
24%
15%
26%
29%
26%
0% 0%
33%
0%0%
20%
40%
60%
80%
100%
120%
2015-2016 2014-2015 2013-2014 2012-2013 2011-2012 2010-2011 2009-2010 2008-2009 2007-2008 2006-2007
Related
Not Related
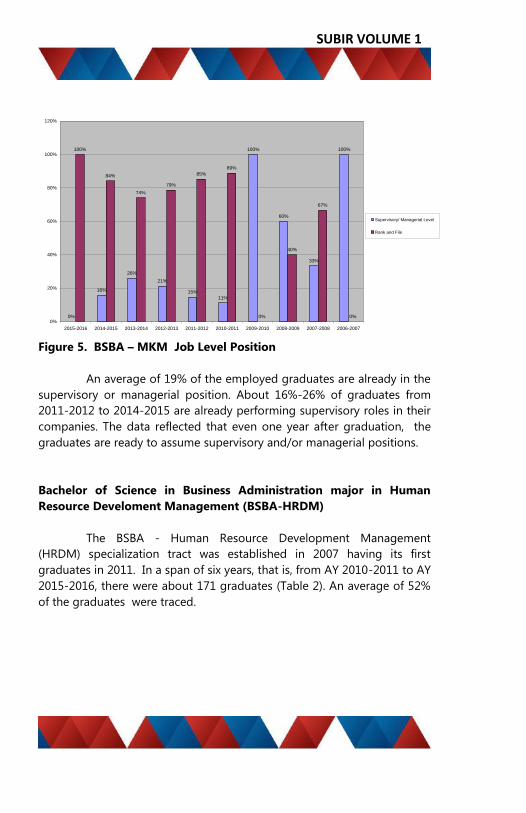
SUBIR VOLUME 1
Figure 5. BSBA – MKM Job Level Position
An average of 19% of the employed graduates are already in the
supervisory or managerial position. About 16%-26% of graduates from
2011-2012 to 2014-2015 are already performing supervisory roles in their
companies. The data reflected that even one year after graduation, the
graduates are ready to assume supervisory and/or managerial positions.
Bachelor of Science in Business Administration major in Human
Resource Develoment Management (BSBA-HRDM)
The BSBA - Human Resource Development Management
(HRDM) specialization tract was established in 2007 having its first
graduates in 2011. In a span of six years, that is, from AY 2010-2011 to AY
2015-2016, there were about 171 graduates (Table 2). An average of 52%
of the graduates were traced.
0%
16%
26%
21%
15%
11%
100%
60%
33%
100%100%
84%
74%
79%
85%
89%
0%
40%
67%
0%0%
20%
40%
60%
80%
100%
120%
2015-2016 2014-2015 2013-2014 2012-2013 2011-2012 2010-2011 2009-2010 2008-2009 2007-2008 2006-2007
Supervisory/ Managerial Level
Rank and File
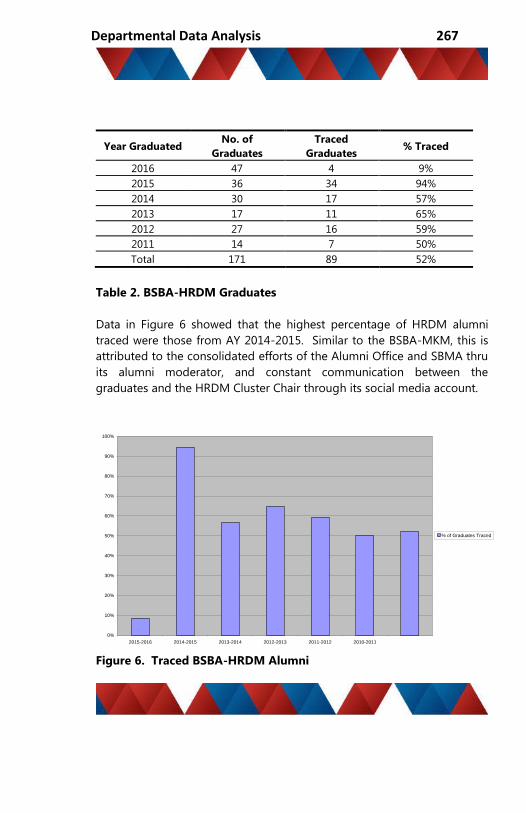
Departmental Data Analysis 267
Year Graduated No. of
Graduates
Traced
Graduates % Traced
2016 47 4 9%
2015 36 34 94%
2014 30 17 57%
2013 17 11 65%
2012 27 16 59%
2011 14 7 50%
Total 171 89 52%
Table 2. BSBA-HRDM Graduates
Data in Figure 6 showed that the highest percentage of HRDM alumni
traced were those from AY 2014-2015. Similar to the BSBA-MKM, this is
attributed to the consolidated efforts of the Alumni Office and SBMA thru
its alumni moderator, and constant communication between the
graduates and the HRDM Cluster Chair through its social media account.
Figure 6. Traced BSBA-HRDM Alumni
0%
10%
20%
30%
40%
50%
60%
70%
80%
90%
100%
2015-2016 2014-2015 2013-2014 2012-2013 2011-2012 2010-2011
% of Graduates Traced
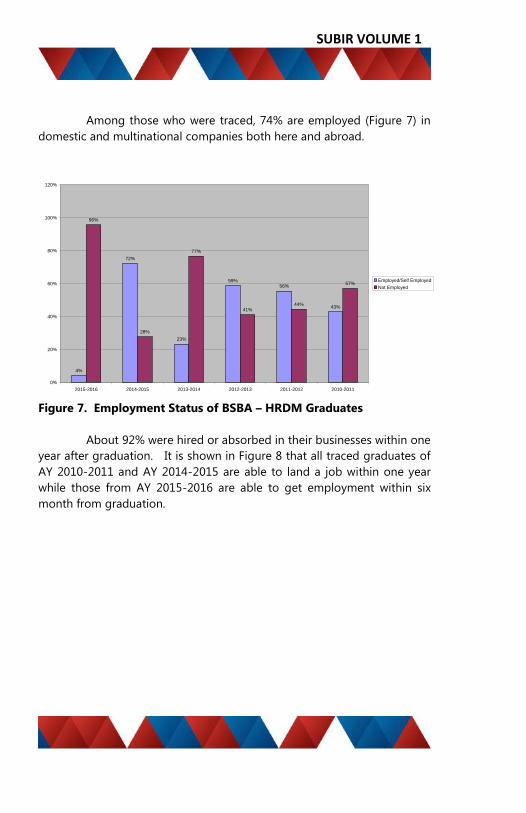
SUBIR VOLUME 1
Among those who were traced, 74% are employed (Figure 7) in
domestic and multinational companies both here and abroad.
Figure 7. Employment Status of BSBA – HRDM Graduates
About 92% were hired or absorbed in their businesses within one
year after graduation. It is shown in Figure 8 that all traced graduates of
AY 2010-2011 and AY 2014-2015 are able to land a job within one year
while those from AY 2015-2016 are able to get employment within six
month from graduation.
4%
72%
23%
59%56%
43%
96%
28%
77%
41%44%
57%
0%
20%
40%
60%
80%
100%
120%
2015-2016 2014-2015 2013-2014 2012-2013 2011-2012 2010-2011
Employed/Self Employed
Not Employed

Departmental Data Analysis 269
Figure 8. Employability of BSBA – HRDM Graduates
An average of 56% of those employed BSBA-HRDM graduates are doing
HR and HR related functions here in the Philippines and abroad. To name
a few, some are HR officers in Canada and Abu Dhabi which shows that
the BSBA – HRDM graduates are globally competitive. Other positions
where BSBA-HRDM graduates are engaged into include HR recruitment
assistants, HR assistants/ staff, HR manager, corporate trainers, operations
manager, in process checkers, administrative assistants and payroll staff.
Those who are doing non-HR functions are account officers, stewardess,
CSR officer, bank staff/ teller, corporate treasurer/ secretary, and
marketing executives while some are managing their own businesses. It is
observed that the graduates of AY 2014-2015 have the highest HR related
work (Figure 9).
100% 100%
71%
90%87%
100%
0% 0%
29%
10%13%
0%0%
20%
40%
60%
80%
100%
120%
2015-2016 2014-2015 2013-2014 2012-2013 2011-2012 2010-2011
Employed within 1 year
Employed after 1 yr

SUBIR VOLUME 1
Figure 9. BSBA-HRDM Employment in Related Field
Data in Figure 10 showed that although majority of the
graduates are still in the rank and file positions, it is noted that recent
graduates are also ready to assume supervisory roles. 12% of AY 2014-
2015 graduates are already performing supervisory and/or managerial
functions.
50%
81%
57%
60%
33%
67%
50%
19%
43%
40%
67%
33%
0%
10%
20%
30%
40%
50%
60%
70%
80%
90%
2015-2016 2014-2015 2013-2014 2012-2013 2011-2012 2010-2011
Related
Not Related

Departmental Data Analysis 271
Figure 5. BSBA – HRDM Job Level Position
Conclusions and Recommendations
Based on the data gathered and presented it can be concluded that:
1. More than 70% of the traced alumni for BSBA-MKM and BSBA-
HRDM programs are employed.
2. More than 70% and 60% of employed traced alumni for BSBA-
MKM and BSBA-HRDM, respectively, are performing functions
related to their programs which are evident on the kind of
positions that they have in the companies.
3. Majority of the alumni of BSBA-MKM and BSBA-HRDM
graduates hold rank and file position in the companies. However,
those who have graduated for at least one year are ready to
assume supervisory positions as observed in the AY 2014-2015
graduates with 12%-16% in the supervisory and/or managerial
positions.
0%
12%14%
10%7%
33%
100%
88%86%
90%93%
67%
0%
20%
40%
60%
80%
100%
120%
2015-2016 2014-2015 2013-2014 2012-2013 2011-2012 2010-2011
Supervisory/ Managerial Level
Rank and File
SUBIR VOLUME 1
With these findings, the following recommendations are forwarded:
1. There is a need to continually strengthen the tracking of alumni
because the data gathered can be used by the department in
improving its instruction.
2. The delivery of instruction will be strengthened especially on
building skills and values required in securing jobs related to the
graduates’ field.
3. Continuous cooperation between and the department, alumni
office and the alumni should be nurtured to continually update
the alumni database.

Departmental Data Analysis 273
A Comparative Analysis of the School of Computer Studies
and Technology Software Expo Students Seminar for
Academic Year 2013 – 2014 and 2014 – 2015
MARIA LUISA E. REYES
School of Computer Studies and Technology
Background
Software Expo is a co-curricular activity of the School of
Computer Studies and Technology (SCST) showcasing the students’
learning through software output from the following courses: C
Programming, Introduction to Information Technology, Visual Basic
Programming, Webpage Development, Database Enabled, Digital Design,
Adobe After Effects, and Object Oriented Programming. In addition, quiz
bee and programming contests are activities during the second day of the
software expo, which intends to measure the capability of the
department’s best students. Furthermore, the last activity of the three day
event is a number seminar for students.
Yearly, SCST ensures that there will be seminars for the students,
which intend to expose the students to industry set up and to a have
additional and updated knowledge on technology trends. In addition to
this, the objective of this activity is to motivate and inspire the students to
do their best in their academic endeavours. Usually, this activity is held in
Letran Calamba gymnasium to cater to the whole student population of
SCST. The committee invites competent guest speakers from industry to
share their expertise on topics based on the theme the committee
selected. The first thing that SCST considers is the theme of the activity.
They think of a theme that will give a big impact, trending and that will
get the interest of the students enrolled in computer technology.
For AY 2013 – 2014, the theme was “Mobile Technology Shift for
Borderless Opportunities” and the resource speakers were Mr. Pao Deveza

SUBIR VOLUME 1
from Smart Communication for first and second year students and Ms.
Rita Maquincio, our industry partner from ESET, for third and fourth year
levels. For AY 2014 – 2015, “SELFIE – Software Enthusiast, Leaders of
Innovative Multimedia Computing” was the selected theme and the
resource speakers were Mr. Mark Aquino from Experts Academy and Ms.
Irene C. Taguinod, a faculty member from AMA, Quezon City.
The number of attendees in the seminar during AY 2013 – 2014
is significantly higher than on AY 2014 – 2015. 404 students out of 497
enrolled which is 81.29% evaluated the seminar on AY 2013 – 2014 while a
students’ lower response during AY 2014 – 2015. Only 198 students out
of 433 enrolled which is 45.73% participated in the seminar for AY 2014 –
2015.
These seminars and trainings help the students to learn not from
the book but from the experiences of the speakers. They got the chance
to meet different personalities that will introduce them to the world of
careers and professionalism. In view of this, this study intends to find out
the result of the previous seminars held as well as find ways on it can be
improved.
Objectives
This paper aimed to:
1. Analyze and compare the evaluation results of the Software Expo
students’ training for the last two academic years 2013 – 2014
and 2014 – 2015.
2. Determine if the objectives of the activity were attained.
3. Recommend suggestion for the improvement of students’
seminar for the next Software Expo.
Presentation and Discussion of Data
Table 1 shows that there were 497 students enrolled last AY 2013
– 2014, while 433 students on AY 2014-2015. It can be noted that there
were 404 students or 81.29% who attended the seminars for AY 2013 –
2014. This considered a good students attendance turn out. However, for
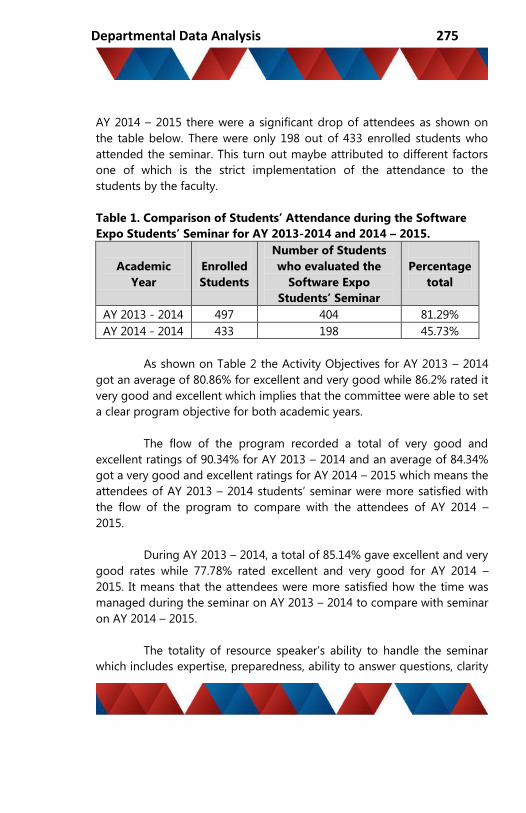
Departmental Data Analysis 275
AY 2014 – 2015 there were a significant drop of attendees as shown on
the table below. There were only 198 out of 433 enrolled students who
attended the seminar. This turn out maybe attributed to different factors
one of which is the strict implementation of the attendance to the
students by the faculty.
Table 1. Comparison of Students’ Attendance during the Software
Expo Students’ Seminar for AY 2013-2014 and 2014 – 2015.
Academic
Year
Enrolled
Students
Number of Students
who evaluated the
Software Expo
Students’ Seminar
Percentage
total
AY 2013 - 2014 497 404 81.29%
AY 2014 - 2014 433 198 45.73%
As shown on Table 2 the Activity Objectives for AY 2013 – 2014
got an average of 80.86% for excellent and very good while 86.2% rated it
very good and excellent which implies that the committee were able to set
a clear program objective for both academic years.
The flow of the program recorded a total of very good and
excellent ratings of 90.34% for AY 2013 – 2014 and an average of 84.34%
got a very good and excellent ratings for AY 2014 – 2015 which means the
attendees of AY 2013 – 2014 students’ seminar were more satisfied with
the flow of the program to compare with the attendees of AY 2014 –
2015.
During AY 2013 – 2014, a total of 85.14% gave excellent and very
good rates while 77.78% rated excellent and very good for AY 2014 –
2015. It means that the attendees were more satisfied how the time was
managed during the seminar on AY 2013 – 2014 to compare with seminar
on AY 2014 – 2015.
The totality of resource speaker’s ability to handle the seminar
which includes expertise, preparedness, ability to answer questions, clarity
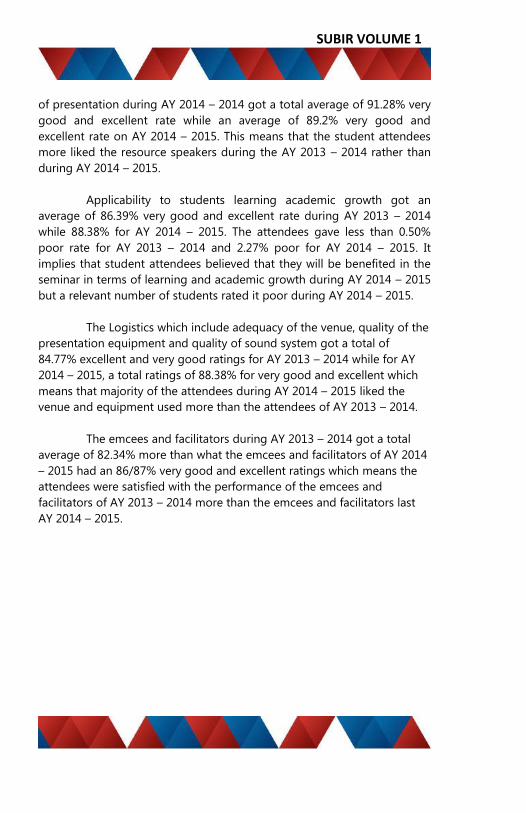
SUBIR VOLUME 1
of presentation during AY 2014 – 2014 got a total average of 91.28% very
good and excellent rate while an average of 89.2% very good and
excellent rate on AY 2014 – 2015. This means that the student attendees
more liked the resource speakers during the AY 2013 – 2014 rather than
during AY 2014 – 2015.
Applicability to students learning academic growth got an
average of 86.39% very good and excellent rate during AY 2013 – 2014
while 88.38% for AY 2014 – 2015. The attendees gave less than 0.50%
poor rate for AY 2013 – 2014 and 2.27% poor for AY 2014 – 2015. It
implies that student attendees believed that they will be benefited in the
seminar in terms of learning and academic growth during AY 2014 – 2015
but a relevant number of students rated it poor during AY 2014 – 2015.
The Logistics which include adequacy of the venue, quality of the
presentation equipment and quality of sound system got a total of
84.77% excellent and very good ratings for AY 2013 – 2014 while for AY
2014 – 2015, a total ratings of 88.38% for very good and excellent which
means that majority of the attendees during AY 2014 – 2015 liked the
venue and equipment used more than the attendees of AY 2013 – 2014.
The emcees and facilitators during AY 2013 – 2014 got a total
average of 82.34% more than what the emcees and facilitators of AY 2014
– 2015 had an 86/87% very good and excellent ratings which means the
attendees were satisfied with the performance of the emcees and
facilitators of AY 2013 – 2014 more than the emcees and facilitators last
AY 2014 – 2015.
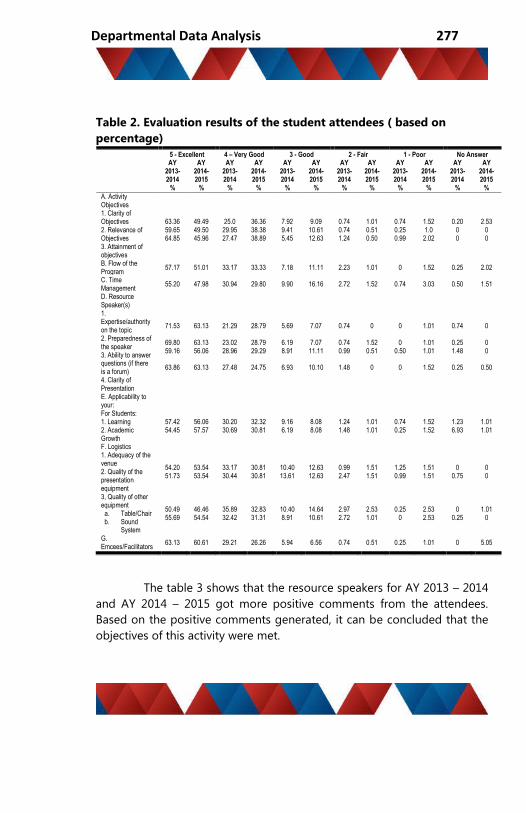
Departmental Data Analysis 277
Table 2. Evaluation results of the student attendees ( based on
percentage)
The table 3 shows that the resource speakers for AY 2013 – 2014
and AY 2014 – 2015 got more positive comments from the attendees.
Based on the positive comments generated, it can be concluded that the
objectives of this activity were met.
5 - Excellent 4 – Very Good 3 - Good 2 - Fair 1 - Poor No Answer
AY
2013- 2014
AY 2014- 2015
AY 2013- 2014
AY 2014- 2015
AY 2013- 2014
AY 2014- 2015
AY 2013- 2014
AY 2014- 2015
AY 2013- 2014
AY 2014- 2015
AY 2013- 2014
AY 2014- 2015
% % % % % % % % % % % %
A. Activity Objectives 1. Clarity of Objectives 2. Relevance of Objectives 3. Attainment of objectives
63.36 59.65 64.85
49.49 49.50 45.96
25.0 29.95 27.47
36.36 38.38 38.89
7.92 9.41 5.45
9.09 10.61 12.63
0.74 0.74 1.24
1.01 0.51 0.50
0.74 0.25 0.99
1.52 1.0 2.02
0.20
0 0
2.53
0 0
B. Flow of the Program
57.17 51.01 33.17 33.33 7.18 11.11 2.23 1.01 0 1.52 0.25 2.02
C. Time Management
55.20 47.98 30.94 29.80 9.90 16.16 2.72 1.52 0.74 3.03 0.50 1.51
D. Resource Speaker(s) 1. Expertise/authority on the topic 2. Preparedness of the speaker 3. Ability to answer questions (if there is a forum) 4. Clarity of Presentation
71.53
69.80 59.16
63.86
63.13
63.13 56.06
63.13
21.29
23.02 28.96
27.48
28.79
28.79 29.29
24.75
5.69
6.19 8.91
6.93
7.07
7.07 11.11
10.10
0.74
0.74 0.99
1.48
0
1.52 0.51
0
0 0
0.50 0
1.01
1.01 1.01
1.52
0.74
0.25 1.48
0.25
0 0 0
0.50
E. Applicability to your: For Students: 1. Learning 2. Academic Growth
57.42 54.45
56.06 57.57
30.20 30.69
32.32 30.81
9.16 6.19
8.08 8.08
1.24 1.48
1.01 1.01
0.74 0.25
1.52 1.52
1.23 6.93
1.01 1.01
F. Logistics 1. Adequacy of the venue 2. Quality of the presentation equipment 3, Quality of other equipment
a. Table/Chair b. Sound
System
54.20 51.73
50.49 55.69
53.54 53.54
46.46 54.54
33.17 30.44
35.89 32.42
30.81 30.81
32.83 31.31
10.40 13.61
10.40 8.91
12.63 12.63
14.64 10.61
0.99 2.47
2.97 2.72
1.51 1.51
2.53 1.01
1.25 0.99
0.25 0
1.51 1.51
2.53 2.53
0
0.75 0
0.25
0 0
1.01 0
G. Emcees/Facilitators
63.13 60.61 29.21 26.26 5.94 6.56 0.74 0.51 0.25 1.01 0 5.05

SUBIR VOLUME 1
Some of the comments of the students were “The speaker is very
knowledgeable to the topic .”. This comment implies that authority of
the resource person on the topic. Another comment given by the students
is “Very nice speech especially when it come to our future.” This shows
that the speakers did not just focus on the content of their topic but
instead gave direction on where the student’s future can be headed.
Another student commented that “Sana next software expo
ganito ka interesadong topic and itackle sa seminar and Very interesting
topic and I want more to hear.” This kind of comment is a boost to the
moreale of the department because it is an implication of a job well done.
Similarly, for AY 2014 – 2015 some of the positive comments
mentioned by the students are “I’ve learned many lesson to success. I
liked it.” This comment implies that the speaker of the seminar was
effective in imparting the knowledge to the students. It was also
commented by the student that “It is like I can be successful.” This
somehow shows the positive effect of the conducted seminar to the
students because it uplifted the perception of student to him/herself.
Another comment was “It is very helpful. Nice job so clear”. Hearing this
from the student make the department to strive more in providing more
seminar that would uplift the student’s level of learning.
However, for AY 2013 – 2014, there were comments from the
faculty members regarding the conducted seminar. One of which is “the
energy level of the second speaker were lightly went down.” This may be
attributed to the fact the first speaker was very energetic and since the
second speaker is not that highly energetic there have been comparison
but as mentioned both have expertise on their chosen topic.
Unfortunately, the organizer for both AY 2013 – 2014 and AY
2014 – 2015 got many negative comments than the positive comments.
The negative comments are related to food, venue, prizes and projectors.
Some of these negative comments like the availability of projectors can
easily be remedied by the department. However, comments on providing
food/snack and prizes cannot be immediately addressed by the
department.

Departmental Data Analysis 279
Table 3. Positive and Negative Comments of the students’ seminar
attendees for AY 2013 -2014 and AY 2014 - 2015
Comments related to
AY 2013 - 2014 AY 2014 - 2015 Positive Comments Negative
Comments Positive
Comments Negative
Comments Resource Speakers
Good delivery of the topic
Be more lively and discussion was not clear
I’ve learned many lesson to success
More questions
Keep up the good work
Manage your time I liked it . It is like I can be successful
Ok lang
Good job Good for new learning
Come incorrect information about the regime of Marcos
Nice one I gained knowledge
Mejo boring yung speaker
Excellent! A very good speaker and taught a lot. I really like this kind of seminar. It is very helpful.
So inspiring! Nice! More! The speaker is very knowledgeable to the topic
Keep up the good work
Very good Good Very nice speech especially when it comes to our future
Clear
Sana next software expo ganito ka interesadong topic ang itackle sa seminar
Nice and very friendly
Good work Thank you Well explained Thank you for coming (have learned many things)
Nice job so clear
Thank you for visiting here in Letran and share about IPV6 Migration and Transformation
Very good

SUBIR VOLUME 1
Comments related to
AY 2013 - 2014 AY 2014 - 2015 Positive Comments Negative
Comments Positive
Comments Negative
Comments Thank you for coming here in Letran we learned a lot in your presentation
Very interesting topic and I want more to hear
Entertaining question
Organizers Thank you for letting us experience this event “Till next time”
Foods!! Keep up the good work
Would be more interesting seminar if the entire BSCS dept were together not just first and second year
Success Chuck Norris is not satisfied
I like the seminar
More activities and more fun next time
Thank you! Free snacks! The seminar were presented smoothly
More prizes
The seminar is very helpful
Snacks Keep up the good work. Be on time in dismissal
No breaktime?
God bless! Thank you
Medyo kula pos a mga upuan at maliit ang venue
Ang lamig ng aircon
Food? Snacks
The seminar is very helpful
Snacks for the next seminar please
Free food while the program is ongoing
God bless! Thank you
Please give snacks if there are seminars
No food no breaktime
Walang pagkain Meryenda po para sa lahat
NA .. Nakakagutom Nakakgutom Clean the speaker Clean the projector Clearer display
please
Excellent but was unsatisfying
Not connected comments
More power to smart payagan nyo na kaming 3rd year mag enrol
I miss my dad for this
GG well played
Departmental Data Analysis 281
Conclusions
Based on the evaluation result and qualitative comments it can
be concluded that:
1. The students had learned many things that will give them idea of
what lies ahead of them after graduation.
2. The resource speakers’ sharing of experiences in industry set up
somewhat exposed the students to do their best for the
application of all what they have learned from school.
3. It also revealed that selecting resource speaker is not the only
important thing to be considered in organizing seminar but also
to give consideration on the venue, the equipment to be used
and the comfort of the attendees as well.
With these findings, the following recommendations are to be
considered:
1. There is a need to intensify the selection of seminar resource
speakers to have well experienced personality in industry and an
expert in the field of Technology.
According to Clive Cochrane, the following research findings
listed below are to be considered to meet the expectation of
students and to facilitate learning in seminar the speaker should:
- Develop clear aims and objectives for each seminar.
- Aim to achieve the objectives.
- Create a good learning atmosphere.
- Encourage social interaction between students in the
seminar.
- Be well organized.
- Link theory with practice where appropriate.
- Encourage all students to participate.
- Enhance student understanding on the topic.
SUBIR VOLUME 1
- Encourage and stimulate participation among students.
- Provide information/learning material in advance of the
seminar.
2. A bigger venue and a good quality of equipment to be used
will be given consideration during planning. According to
Clive Cochrane, the learning environment and facilities are
also a big factor for a successful seminar even the students
value the knowledge that they will get from attending it.
This means that we should give consideration not only for
the selection of speakers but also for the comfort of the
attendees as well.
3. Strengthen the students participation and attendance during
this kind of activity through the help of the faculty members
and section advisers.
4. To make an ideal evaluation instrument for all the Software
Expo activities. The software expo has selected activities like,
programming contest, exhibit, quiz bee, student seminar
and conference with parents and guardians of students. The
only available evaluation instrument in the SCST is the
evaluation of seminar. It is suggested to recommend the use
of ideal instrument for other software expo activities.
Reference Cited
Cochrane, Clive, The attitudes of undergraduate information management
students to seminars: A qualitative and a quantitative analysis.
Retrieved from
http://web.a.ebscohost.com/ehost/detail/detail?vid=10&sid=a4ef
70ab-f1a1-4f93-
8d1296f06186c406%40sessionmgr4006&hid=4002&bdata=JnNp
dGU9ZWhvc3QtbGl2ZQ%3d%3d#AN=1462877&db=aph

Departmental Data Analysis 283
Data Analysis on the Turn-Over Rate of Faculty of
School of Education, Arts, and Sciences
GERALDINE L. DELA VEGA
School of Education, Arts, and Sciences
Background
Sufficient faculty bandwidth ensures adequate manpower
support for each School and their respective departments. This also
secures that all classes in the Colegio are handled accordingly by a
delegated faculty-in-charge. The School of Education, Arts, and Sciences
hosts the biggest headcount of faculty members in the Colegio’s college
level, and most of the time, is at a higher risk on teacher shortage. Such
shortages may cause deeper implications to actual school operations,
eventually affecting the class level.
This study focuses on the attrition trends among and within the
Faculty of the School of Education, Arts, and Sciences. It examines the
increase (and vice versa) of the turnover rate, and investigates on the
factors which might have affected such. Further, it also presents
implications on manpower and faculty bandwidth, correspondent to each
of the year covered. Data were gathered from secondary sources using
the Exit Interview Form (AP:02-00-FO-16) of the Human Resource
Department. Finally, it will attempt to provide recommendations that
could effectively manage engagement among current faculty members,
thus encouraging retention and loyalty to the Institution.
Objectives
1. Determine the SEAS turn-over rate of the SEAS faculty per year
for the past five (5) years
2. Analyse the recurring trend/s of turn-over rates
3. Ascertain on historical factors that might have affected attrition
based on HR exit interviews
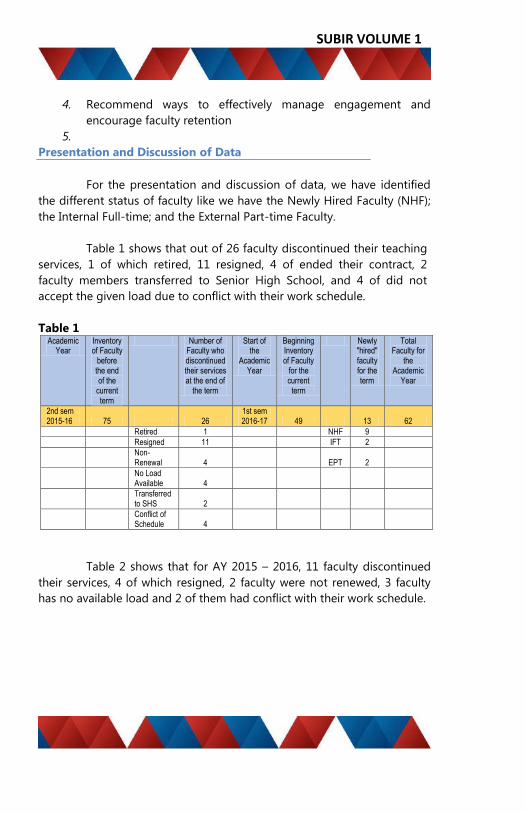
SUBIR VOLUME 1
4. Recommend ways to effectively manage engagement and
encourage faculty retention
5.
Presentation and Discussion of Data
For the presentation and discussion of data, we have identified
the different status of faculty like we have the Newly Hired Faculty (NHF);
the Internal Full-time; and the External Part-time Faculty.
Table 1 shows that out of 26 faculty discontinued their teaching
services, 1 of which retired, 11 resigned, 4 of ended their contract, 2
faculty members transferred to Senior High School, and 4 of did not
accept the given load due to conflict with their work schedule.
Table 1
Table 2 shows that for AY 2015 – 2016, 11 faculty discontinued
their services, 4 of which resigned, 2 faculty were not renewed, 3 faculty
has no available load and 2 of them had conflict with their work schedule.
Academic Year
Inventory of Faculty
before the end of the
current term
Number of Faculty who discontinued their services at the end of
the term
Start of the
Academic Year
Beginning Inventory of Faculty
for the current term
Newly "hired" faculty for the term
Total Faculty for
the Academic
Year
2nd sem 2015-16 75 26
1st sem 2016-17 49 13 62
Retired 1 NHF 9
Resigned 11 IFT 2
Non-Renewal 4
EPT 2
No Load Available 4
Transferred to SHS 2
Conflict of Schedule 4

Departmental Data Analysis 285
Table 2.
Table 3 shows that for AY 2014 – 2015, out of 26 who did not
continue their teaching services, 1 was retired, 13 resigned, 4 faculty
contracts were not renewed, 6 faculty discontinued due to lack of
available toad, and 2 of had conflict with their work schedule
Table 3
.
Academic Year
Inventory of Faculty
before the end of the
current term
Number of Faculty who discontinued their services at the end of the
term
Start of the
Academic Year
Beginning Inventory of Faculty for the current
term
Newly "hired" faculty for the term
Total Faculty for the
Academic Year
2nd sem 2014-15 70 11
1st sem 2015-16 59 22 81
Retired 0 NHF 9
Resigned 4 IFT 7
Non-Renewal 2 EPT 6
No Load Available 3
Transferred to SHS 0
Conflict of Schedule 2
Academic Year
Inventory of Faculty before the end of the
current term
Number of Faculty who discontinued their services at the end of
the term
Start of the
Academic Year
Beginning Inventory of Faculty for the current
term
Newly "hired" faculty for the term
Total Faculty for the
Academic Year
2nd sem 2013-14
74 26 1st sem 2014-15
48 30 78
Retired 1 NHF 6
Resigned 13 IFT 16
Non-Renewal 4 EPT 8
No Load Available
6
Transferred
to SHS 0
Conflict of Schedule
2

SUBIR VOLUME 1
Table 4 shows that 1 faculty retired, 6 faculty resigned, another 6
faculty were not given load, thus their contracts were not renewed, and 2
had conflict with their schedule. Thus, a total of 15 faculty discontinued
their teaching services in the Colegio.
Table 4
Table 5 shows the number of faculty turn-over rate of SEAS for
the past five (5) academic years and specifies the detailed status per
faculty to show the trend of hiring. The different status and reason for the
discontinued teaching is also reflected in the said matrix.
Table 5
Academic Year
Inventory of Faculty
before the end of the
current term
Number of Faculty who discontinued their services at the end of the
term
Start of the
Academic Year
Beginning Inventory of Faculty for the current
term
Newly "hired" faculty for the term
Total Faculty for the
Academic Year
2nd sem 2012-13
77 15 1st sem 2013-14
62 16 78
Retired 1 NHF 1
Resigned 6 IFT 10
Non-Renewal 6 EPT 5
No Load Available
0
Transferred
to SHS 0
Conflict of Schedule
2
Academic Year
Inventory of Faculty
before the end of the
current term
Number of Faculty who discontinued their services at the end of the
term
Start of the
Academic Year
Beginning Inventory of Faculty for the current
term
Newly "hired" faculty for the term
Total Faculty for the
Academic Year
2nd sem 2011-12
83 22 1st sem 2012-13
68 14 82
Retired 0 NHF 5
Resigned 5 IFT 3
Non-Renewal 7 EPT 6
No Load Available
7
Transferred
to SHS 0
Conflict of Schedule
3

Departmental Data Analysis 287
Below are the reasons gathered for the resignations, as well as
the measures that are being done by the Colegio to retain as much
qualified faculty members for each Academic Year.:
2013
Reasons for leaving:
Cannot work with superiors who are one sided and use politics to
avoid admitting mistakes
Higher salary offered in another school/company
Employee Recommendations:
If only superiors would humble themselves and admit their
faults/mistake and avoid politicizing
Reasonable teaching and administrative schedule, as well as
lesser paper works so that once can give more time to my own
families
2014
Reasons for Leaving
Better opportunities in other school (lesser load; higher pay;
more time)
Teaching abroad/other school
Family reason
Higher salary offered from another school/company
Employee Recommendations
Reinstatement of my film subject and information and discussion
about the teaching of subjects especially
Open forum and take action in concerns regarding the current
administration and system
2015
Reasons for Leaving
Felt the lack professional growth. After returning from the
exchange program, was eager to share my experiences for the

SUBIR VOLUME 1
growth of the Colegio, however was not given any chance to do
so.
Family reason
High salary offered from another school/company
Health reason
2016
Reasons for Leaving
Management could have explained/discussed their plans for
probationary instructors. was recently hired but the possibility of
not having teaching loads for the next years due to K to 12
program, was never discussed during the hiring process.
Higher position in a foundation
High salary offered from another school/company
Family reason
Conclusion
Most of those who resigned have other personal reasons other
than employment concerns. These include family reasons,
change of residence and health concerns.
Most of the external faculty part-timers who decided not to
continue with their contracts had had conflicts with their own
schedules outside the Colegio.
Other faculty members were not renewed based on the lack of
available load and unavailabilty of courses offered.
After evaluation of performance and behaviour, there were
faculty members whose employement contracts were not
renewed.
Most of the the faculty members who decided to discontinue
their services were vying for better opportunities outside the
Colegio.
Some of the reasons stated tackled the lack of effective
communication between and among SEAS management and
faculty members.
Reasons, such as the lack of providing employement
expectations for faculty members, affect the employee’s
motivation to pursue a career in the Colegio.
Departmental Data Analysis 289
Recommendations
Considering that some of the reasons for leaving were to find
better opportunities outside the Colegio, it is recommended that
we re-assess our salary scale and ranking for our faculty
members.
Further, a more structured communication program between and
among SEAS management (deans, department chairs, etc.), is
recommended to further strengthen employee relations. This will
allow opportunities for both parties to forecast their future in the
Colegio, as well as provide a meaningful venue for leaders to
examine the current needs and challenges of their faculty
members.
One notable reason stated in the reasons for leaving was the
need to further encourage faculty members who would want to
intiate newer methodologies and approaches in teaching based
on a Colegio-sponsored program. Having an aligned
communication/coaching program between management and
faculty members will ensure that faculty members are given the
appropriate academic freedom for their classes, thus
encouraging a healthier venue for professional growth and
student development.
Some of the faculty discontinued their teaching in the Colegio
for greener pasture, thou it may sound a cliché but it’s the reality.
Teachers look for other opportunities with higher compensation,
wherein this issue, I think we should review our salary scale and
at the same time we may do benchmarking on other institutions
if our scale is really not competitive from theirs.
It is also recommended that SEAS management cultivate a
culture that encourages faculty members to participate in
faculty/employee activities, so as to inspire participating
members and imbibe fun, association, teamwork and the
Dominican culture.
SUBIR VOLUME 1
School of Engineering Board Exam Result Data Analysis
MARY KIMBERLY M. MOLINA
School of Engineering
Background
Passing the licensure examinations given by the Professional
Regulation Commission (PRC) can be one of the greatest professional
achievements in a college graduate’s life. The examination is intended to
prove the graduates’ knowledge, progress, skills and qualifications in a
particular profession. Moreover, the performance of the graduates in an
institution who take the licensure examination determines the quality of
education the school provides, which eventually guarantees the efficiency
and effectiveness of its graduate’s application of the things he or she has
learned in his or her chosen profession or career
(https://www.ijlter.org/index.php/ijlter/article/viewFile/676/295, 2016
November 11)
In the Colegio, board examination result is one of the key
performance indicators of different School such as School of Business,
Management and Accountancy, School of Education, Arts and Sciences,
School of Nursing and School of Engineering. Each Schools has its target
board exam passing percentage as per declared in its yearly
accomplishment report. The target of the School of Engineering is to
obtain 50% of NPP.
It has been observed that every year there are two batches of
Electrical Engineering, Electronics Engineering and Mechanical
Engineering graduates who are willing to take the board exam, which
would grant them the title of “Registered Electrical Engineer” “Electronics
Engineer” and “Mechanical Engineer”. The results of the board exam
might influence the School of Engineering number of enrollees as well as
the confidence of the future engineering board examiners. Moreover,
obtaining 100% passing percentage for all of the examinees is one of the
school’s biggest accomplishments that may help the school to promote
itself and be listed as one of the Schools who have an excellent
performance in terms of board program. This is a sign that quality
education is rendered by the school. This data analysis focused on School
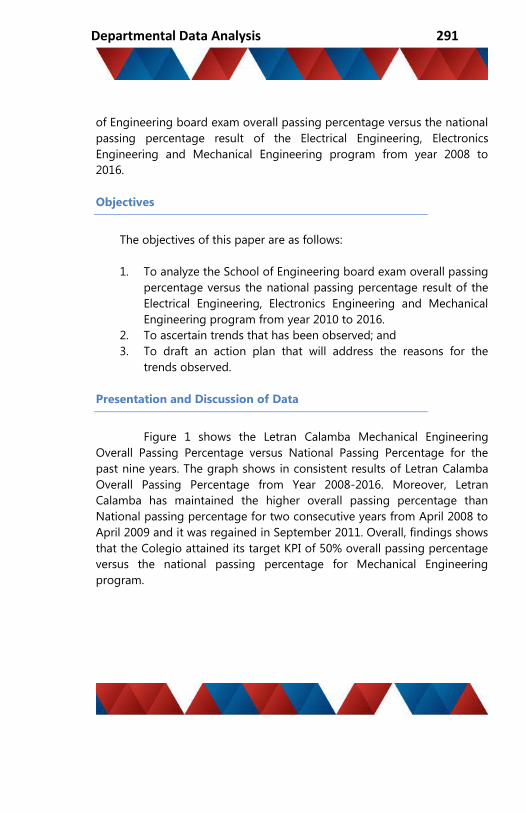
Departmental Data Analysis 291
of Engineering board exam overall passing percentage versus the national
passing percentage result of the Electrical Engineering, Electronics
Engineering and Mechanical Engineering program from year 2008 to
2016.
Objectives
The objectives of this paper are as follows:
1. To analyze the School of Engineering board exam overall passing
percentage versus the national passing percentage result of the
Electrical Engineering, Electronics Engineering and Mechanical
Engineering program from year 2010 to 2016.
2. To ascertain trends that has been observed; and
3. To draft an action plan that will address the reasons for the
trends observed.
Presentation and Discussion of Data
Figure 1 shows the Letran Calamba Mechanical Engineering
Overall Passing Percentage versus National Passing Percentage for the
past nine years. The graph shows in consistent results of Letran Calamba
Overall Passing Percentage from Year 2008-2016. Moreover, Letran
Calamba has maintained the higher overall passing percentage than
National passing percentage for two consecutive years from April 2008 to
April 2009 and it was regained in September 2011. Overall, findings shows
that the Colegio attained its target KPI of 50% overall passing percentage
versus the national passing percentage for Mechanical Engineering
program.
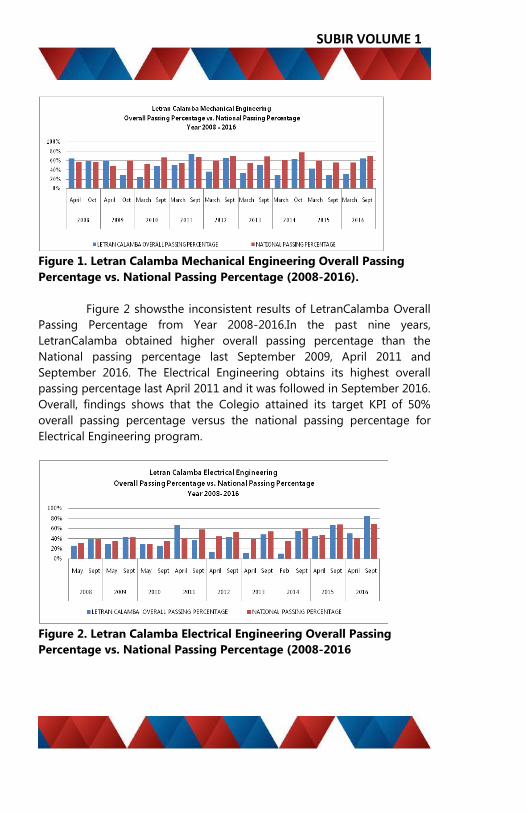
SUBIR VOLUME 1
Figure 1. Letran Calamba Mechanical Engineering Overall Passing
Percentage vs. National Passing Percentage (2008-2016).
Figure 2 showsthe inconsistent results of LetranCalamba Overall
Passing Percentage from Year 2008-2016.In the past nine years,
LetranCalamba obtained higher overall passing percentage than the
National passing percentage last September 2009, April 2011 and
September 2016. The Electrical Engineering obtains its highest overall
passing percentage last April 2011 and it was followed in September 2016.
Overall, findings shows that the Colegio attained its target KPI of 50%
overall passing percentage versus the national passing percentage for
Electrical Engineering program.
Figure 2. Letran Calamba Electrical Engineering Overall Passing
Percentage vs. National Passing Percentage (2008-2016
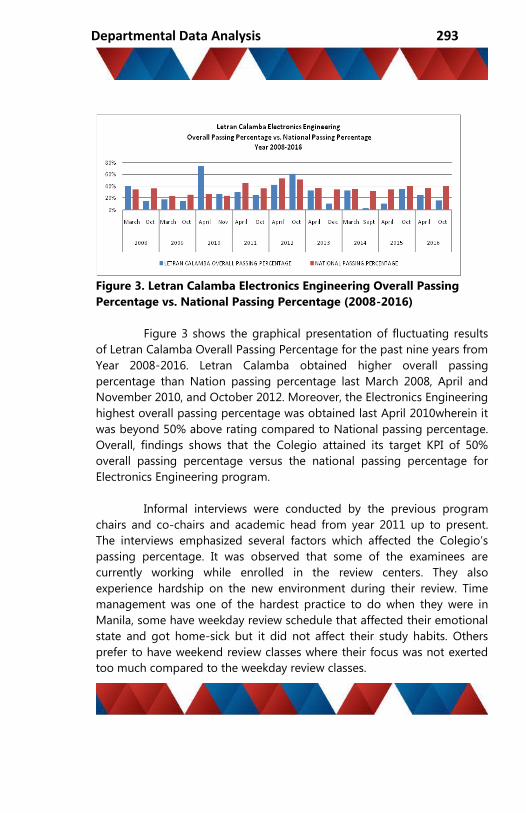
Departmental Data Analysis 293
Figure 3. Letran Calamba Electronics Engineering Overall Passing
Percentage vs. National Passing Percentage (2008-2016)
Figure 3 shows the graphical presentation of fluctuating results
of Letran Calamba Overall Passing Percentage for the past nine years from
Year 2008-2016. Letran Calamba obtained higher overall passing
percentage than Nation passing percentage last March 2008, April and
November 2010, and October 2012. Moreover, the Electronics Engineering
highest overall passing percentage was obtained last April 2010wherein it
was beyond 50% above rating compared to National passing percentage.
Overall, findings shows that the Colegio attained its target KPI of 50%
overall passing percentage versus the national passing percentage for
Electronics Engineering program.
Informal interviews were conducted by the previous program
chairs and co-chairs and academic head from year 2011 up to present.
The interviews emphasized several factors which affected the Colegio’s
passing percentage. It was observed that some of the examinees are
currently working while enrolled in the review centers. They also
experience hardship on the new environment during their review. Time
management was one of the hardest practice to do when they were in
Manila, some have weekday review schedule that affected their emotional
state and got home-sick but it did not affect their study habits. Others
prefer to have weekend review classes where their focus was not exerted
too much compared to the weekday review classes.
SUBIR VOLUME 1
The examinees also emphasized that the passing percentage
were influenced by the coverage of examination, format of questions, and
degree of difficulty of the exams. There were situational questions in
professional subjects included on the exam and some topics were not
given emphasis during the review. The examinees also focused on the
presumed difficult subject at the expense of the other subjects.
Moreover, the incorporation of in-house review to the curriculum
helped the examinees to refresh their minds on the topics during their
early years in College. The Zero Based Grading System was also
implemented in the In-house review and the examinees that performed
well in the review center tend to have a high possibility in passing the
board exam. However, some of the examinees for the Electronics
Engineering have difficulty in areas which covered the current trends in
Electronics Engineering that was not discussed in the courses during
college.
Conclusions
The analysis has shown fluctuating results of the School of
Engineering overall passing percentage versus the national passing
percentage. The gathered data from informal interviews of the program
chairs and co-chairs from year 2011up to present shows that the passing
percentage were influenced by the following factors such as reviewer’s
study habit, In-house review performance during college, review center
performances review center visitation and program curriculum. These
factors affect the confidence of the examinees to perform better or less in
taking the board exams.
The reviewer’s study habit should be enhanced during their early
years in college. It will adapt by the examinees and improve their board
exam performances. In-house review was offered on the last year in
college along with their thesis. This can be a factor on how well a student
can manage to perform well on both courses. Some examinees might not
exert effort on performing well in the In-house review due to the thinking
that they will be having their review after they graduated. There are a lot
of review centers which offers different kind of review sessions. The review
Departmental Data Analysis 295
sessions may be during weekdays or weekends. The examinees have their
rights to choose which review center they prefer to attend. During the
review, the examinees that prefer to have weekdays review have to rent an
apartment near the review centers where they might encounter emotional
difficulties such as home-sickness. Moreover, a week prior to the
scheduled board exam, the academic head together with the respective
program chairs and co-chairs conduct a review center visitation to
observe the performance of the examinees. This visitation boosts the
confidence of the examinees to perform better.
The findings were also indicative of the need for the faculty
members handling the courses which are the focused areas in the board
exam to keep on improving the content of the subject being delivered to
the students, the teaching strategy that would lead to better retention
and provide comprehensive evaluation through exercises and board type
examination. The Colegio must also enhance learning facilities and
reading material on the latest trends related on the courses. Moreover, a
research should be conducted related on the Table of Specifications used
by the PRC in making board questions and implement the results in the
future.
Moreover, the data analysis shows that the School of Engineering
attained its target KPI of 50% Colegio’s overall passing percentage versus
the national passing percentage from the previous years. This indicates
that the efforts given by the School of Engineering reflect on the
attainability to meet its target KPI for the institution.
References Cited
Baang, M. A. Investigating the Macro Perspective Affecting the Passing Rate in
Board Examinations: A Take-off Point in Designing a Causal Model.
International Journal of Learning, Teaching and Educational Research, Vol.
15 (Issue No.4), pp. 108-120. Retrieved from:
https://www.ijlter.org/index.php/ijlter/article/viewFile/676/295