department of corrections-prison population growth · sentenced to probation and treatment instead...
TRANSCRIPT
A REPORTTO THE
ARIZONA LEGISLATURE
Debra K. DavenportAuditor General
Performance Audit
Department of Corrections—Prison Population Growth
Performance Audit Division
September • 2010REPORT NO. 10-08

The Auditor General is appointed by the Joint Legislative Audit Committee, a bipartisan committee composed of five senators and five representatives. Her mission is to provide independent and impartial information and specific recommendations to improve the operations of state and local government entities. To this end, she provides financial audits and accounting services to the State and political subdivisions, investigates possible misuse of public monies, and conducts performance audits of school districts, state agencies, and the programs they administer.
The Joint Legislative Audit Committee
Audit Staff
Copies of the Auditor General’s reports are free.You may request them by contacting us at:
Office of the Auditor General2910 N. 44th Street, Suite 410 • Phoenix, AZ 85018 • (602) 553-0333
Additionally, many of our reports can be found in electronic format at:
www.azauditorv.gov
Representative Judy Burges, Chair
Representative Tom BooneRepresentative Cloves Campbell, Jr.Representative Rich CrandallRepresentative Kyrsten SinemaRepresentative Kirk Adams (ex officio)
Senator Thayer Verschoor, Vice Chair
Senator John HuppenthalSenator Richard MirandaSenator Rebecca RiosSenator Bob Burns (ex officio)
Dale Chapman, Director and Contact Person
Jeremy Weber, Team LeaderKerry Howell

2910 NORTH 44th STREET • SUITE 410 • PHOENIX, ARIZONA 85018 • (602) 553-0333 • FAX (602) 553-0051
MELANIE M. CHESNEY DEPUTY AUDITOR GENERAL
DEBRA K. DAVENPORT, CPA AUDITOR GENERAL
STATE OF ARIZONA OFFICE OF THE
AUDITOR GENERAL
September 30, 2010
Members of the Arizona Legislature
The Honorable Janice K. Brewer, Governor
Mr. Charles L. Ryan, Director Department of Corrections
Transmitted herewith is a report of the Auditor General, A Performance Audit of the Department of Corrections—Prison Population Growth. This report is in response to a November 3, 2009, resolution of the Joint Legislative Audit Committee. The performance audit was conducted as part of the sunset review process prescribed in Arizona Revised Statutes §41-2951 et seq. I am also transmitting within this report a copy of the Report Highlights for this audit to provide a quick summary for your convenience.
As outlined in its response, the Department of Corrections agrees with all of the findings and plans to implement all of the recommendations directed at it.
My staff and I will be pleased to discuss or clarify items in the report.
This report will be released to the public on October 1, 2010.
Sincerely,
Debbie Davenport Auditor General
Attachment

Alternatives to imprisonment
Expanding the prison system
The State’s population has doubled in about the last 30 years, but the State’s prison population has increased tenfold, from 3,377 inmates in June 1979 to 40,477 inmates in June 2010. Arizona’s prison growth rate exceeded that of every other western state between 2000 and 2008. In 2008, 1 in every 170 Arizonans was in prison, compared to 1 in 749 in 1980.
2010September • Report No. 10 - 08
Department of Corrections—Prison Population Growth
Our Conclusion
Arizona’s prison population has grown significantly in the last 30 years and is expected to continue growing. The State has addressed this growth by constructing new prison facilities and contracting with private prisons, among other things. The State has several options for addressing this growth in the future. The State could continue to build prisons and/or contract for private prisons. The State could also consider diverting more nonviolent, low-risk offenders from prison or reducing their time in prison, and expanding the use of nonprison alternatives for these offenders, such as home arrest. In addition, using more nonprison alternatives for parole violators could also reduce the prison population.
REPORT HIGHLIGHTSPERFORMANCE AUDIT
Significant growth in prison population and spending
The growth in prison population has come at a substantial cost. The Legislature has appropriated nearly $949 million in State General Fund monies to the Department of Corrections (Department) for fiscal year 2011. This represents 11.2 percent of the State General Fund budget and trails only K-12 education and healthcare appropria-tions.
To address prison population growth, the State has constructed new prison facilities, expanded existing prison facilities by adding new and temporary prison beds, and contracted with private prisons for more beds. However, the Department expects the prison population to continue to increase, growing to nearly 50,000 inmates by 2016. Although under revision as of September 2010, the Department’s plan proposes to add another 6,500 private prison beds at an estimated cost of about $640.7 million through 2017. The plan also calls for more state construction to add another 2,000
beds at an estimated cost of $334.1 million through 2017.
Private prisons cost slightly more—According to a 2009 department report, the State paid more per inmate in private prisons than for equivalent services in state facilities. After adjusting costs to make the expenditures comparable, the State paid private prisons $55.89 for each medium-custody inmate per day compared to a daily cost of $48.13 per medium-custody inmate in state facilities. The State also paid private prisons slightly more for each minimum-custody prisoner.
State laws largely determine how long an offender is imprisoned. Before 1978, judges had broad discretion in sentencing defendants. However, Arizona’s presumptive sentencing system requires judges to impose a “presumptive” sentence prescribed by statute for a given offense. The sentence may be increased or decreased based on mitigating and aggravating factors.
Further, Arizona began adopting mandatory sentences in 1978, that require
harsher penalties for certain offenders, such as repeat or violent offenders. Arizona also adopted “truth in sentencing” in 1993, which abolished discretionary parole and requires all inmates to serve at least 85 percent of their sentences in prison. Although truth in sentencing requires inmates to serve more of their sentences, other law changes shortened sentences for some offenders, which has contributed to some inmates serving less time in prison.

Department of Corrections—Prison Population Growth
REPORT HIGHLIGHTS
PERFORMANCE AUDIT
September 2010 • Report No. 10 - 08
A copy of the full report is available at:www.azauditor.govContact person:
Dale Chapman (602) 553-0333
Expanding diversion—The Legislature could consider diverting some additional low-risk offenders from prison to nonprison alternatives. Statute requires some drug offenders to be sentenced to probation and treatment instead of prison, and this approach could be considered for other nonviolent, low-risk offenders. According to a 2006 Arizona Supreme Court report, diverting 1,072 offenders to probation and treatment in fiscal year 2005 avoided an estimated $11.7 million in net costs. Depending on how diversion is expanded, sentencing law changes may be needed.
Expanding early release—Currently, some nonviolent, low-risk offenders who make satisfactory progress on their corrections plans, maintain behavior, and meet other criteria may be released 3 months earlier than their sentences require. During those 3 months, they receive treatment, transitional housing, education, and other services. At the end of the 3 months, they are placed on regular community supervision. Most inmates successfully complete the 3-month supervised release.
The Legislature could consider other alternatives for expanding early release. This could include revising the truth-in-sentencing laws to reduce the amount of time nonviolent, low-risk offenders serve. Mississippi reinstated parole for such offenders and, as a result, has avoided prison costs of about $37 to $42 per inmate per day. The Mississippi Department of Corrections also reported that between January 31, 2009 and January 31, 2010, the state’s prison population decreased by 1,360 inmates when an increase of 1,000 inmates was expected. The Legislature could also authorize earned time credits for inmates, which reduce inmate sentences. These credits can be earned for completing education, vocational training, and/or treatment.
Nonprison alternatives such as drug treatment, home arrest, and day reporting centers—Another approach would be to expand drug treatment alternatives beyond drug court. Some states, notably Texas, have created secure facilities to provide treatment to drug offenders. As a result, Texas has reduced its prison costs.
Arizona law allows home arrest with electronic monitoring for a small number of nonviolent, first-time offenders. According to a Florida study, home arrest costs a fraction of the cost of imprisonment. Expanding this program in Arizona, which would
require legislative action, could potentially reduce prison costs.
Day reporting centers are nonprison alternatives that blend high supervision levels with intensive services and programming. A 2005 Georgia State University study reported that offenders completing a day reporting center program had a lower recidivism rate than those not completing or not in the program. Georgia Department of Corrections officials reported that its day reporting centers cost $16.50 daily per inmate as compared to $48 per inmate, per day in prison. Although a 1999 study showed that Maricopa County’s day reporting center program was no more effective at reducing recidivism for repeat DUI offenders than probation, it was more cost-effective. Maricopa County ended its day reporting center program in 2002.
Reducing parole violation revocations—Parolees returned to prison on revocation typically serve about 3 months, which costs about $1,222, compared to $774 for one who remains in the community. In some cases, the Department uses graduated sanctions, such as reprimands and increased supervision, before it revokes parole. However, it lacks nonprison facilities to also use as a graduated sanction. Other states use nonprison facilities to house parole violators, including residential treatment facilities, day reporting centers, halfway houses, and assessment centers. Texas uses secure facilities to provide treatment programs and confine parole violators. Such facilities cost about $35 to $41 per offender per day compared to $47.50 per offender per day in a Texas prison.
Options—The Legislature could:
• Continue to expand the prison system. If it decides to expand, the Legislature should consider directing the Department to further study state costs for building and operating new prisons compared to contracting with private prisons.
• Consider diverting more nonviolent, low-risk of-fenders from prison and/or reducing the time they serve.
• Consider directing the Department and/or the courts to further study the use and costs of non-prison alternatives for nonviolent, low-risk offenders.
• Consider expanding nonprison alternative sanc-tions for parole violators.

Introduction & Scope 1
Chapter 1: Arizona’s prison population and corrections spending have grown significantly 3
Arizona’s prison population has grown considerably and may continue growing 3
Arizona has expanded prison system to accommodate growth 8
Prison population growth results from both policy and social factors 13
Arizona has increased corrections spending to help keep pace with growth 14
Chapter 2: Option 1—Expanding prison system to address prison population growth 17
Continued expansion will require significant spending 17
State should further study cost-effectiveness of privately operated prisons compared to state-operated prisons 19
Chapter 3: Option 2—Diverting more nonviolent, low-risk offenders or reducing the time they serve to address prison population growth 23
Arizona laws largely determine prison sentences 23
Office of the Auditor General
TABLE OF CONTENTS
page v
TABLE OF CONTENTS
continued

Chapter 3 (Continued)
Sentencing laws have affected State’s prison population 25
Other potential sentencing law changes have been under study for many years 27
Options to divert nonviolent, low-risk offenders from prison or reduce time they serve could be expanded 28
Permanent sentencing commission could review sentencing policies and laws 34
Chapter 4: Option 3—Expanding use of nonprison alternatives to slow or reverse prison population growth 37
Arizona uses probation as nonprison alternative 37
Nonprison alternatives could take several forms 40
State should further study expansion of nonprison alternatives,including costs and needed legislative action 45
Chapter 5: Option 4—Reducing revocations from parole violations 47
Most inmates serve part of sentence in community 47
Parole violations contribute to prison population growth 48
Expanding range of nonprison alternatives for parole violators could help reduce prison population growth 49
Expanding alternatives for parole violations would require action 52
TABLE OF CONTENTS
page vi
State of Arizona

Office of the Auditor General
page vii
TABLE OF CONTENTS
continued
Chapter 6: Recommendations for legislative and department consideration 53
Appendix A: Data and methodology a-i
Appendix B: References b-i
Agency Response
Tables
1 Number and Percentage of Total Inmates by Crime CategoryCalendar Years 1989, 1999, and 2009(Unaudited) 5
2 Arizona Prison Capacity and PopulationJune 30, 2010(Unaudited) 12
3 Estimated Prison Construction and PrivatizationCosts for 8,500 Projected BedsFiscal Years 2012 through 2017(Unaudited) 18
4 Comparison of Department Calculationsfor Actual and Adjusted Private PrisonPer Capita Rates and State Prison Per Capita CostsFiscal Year 2009(Unaudited) 20
5 Median Sentence Lengths for Admitted Offendersby Offense Type, in YearsCalendar Years 1990, 1993, 1996, 1999,2002, 2005, and 2008(Unaudited) 27

State of Arizona
TABLE OF CONTENTS
concluded
page viii
Figures
1 Arizona Prison PopulationFiscal Years 1979 through 2010(Unaudited) 4
2 Comparison of Western States’ Average AnnualPrison Population GrowthDecember 31, 2000 to December 31, 2008(Unaudited) 7
3 Arizona Prison Complex LocationsFiscal Year 2010 9
4 Comparison of State General Fund Expenditures for Fiscal Year 1979and Appropriations for Fiscal Year 2011(Unaudited) 16

INTRODUCTION& SCOPE
The Office of the Auditor General has conducted a performance audit of the Department of Corrections (Department) pursuant to a November 3, 2009, resolution of the Joint Legislative Audit Committee. This audit, conducted as part of the sunset review process prescribed in Arizona Revised Statutes (A.R.S.) §41-2951 et seq., focuses on prison population growth and options for addressing this growth. The Office of the Auditor General will issue two additional reports, one of which will address the 12 statutory sunset factors.
This report discusses prison population growth in Arizona and the resultant growth in state spending on corrections (see Chapter 1, pages 3 through 16). It offers various options for legislative and department consideration to address this growth, including:
• Continuing to expand the prison system to address anticipated growth in the prison population (see Chapter 2, pages 17 through 21);
• Diverting more nonviolent, low-risk offenders from prison and/or reducing the time they serve—alternatives that may require changes to the State’s sentencing laws (see Chapter 3, pages 23 through 35);
• Expanding the use of nonprison alternatives for nonviolent, low-risk offenders (see Chapter 4, pages 37 through 46); and
• Reducing admissions from parole revocations by expanding nonprison options for responding to offenders who violate the conditions of their community supervision (see Chapter 5, pages 47 through 52).
This audit was conducted in accordance with generally accepted government auditing standards. Those standards require that we plan and perform the audit to obtain sufficient, appropriate evidence to provide a reasonable basis for our findings and conclusions based on our audit objectives. We believe that the evidence obtained provides a reasonable basis for our findings and conclusions based on our audit objectives.
The Auditor General and staff express appreciation to the Department’s Director and staff for their cooperation and assistance throughout the audit.
Office of the Auditor General
page 1

State of Arizona
page 2

Arizona’s prison population and corrections spending have grown significantly
Arizona’s prison population has grown significantly, leading to increased spending on corrections. Specifically, Arizona’s prison population has grown from 3,377 inmates in fiscal year 1979 to 40,477 inmates in fiscal year 2010 and is expected to continue growing. Several factors have contributed to Arizona’s prison population growth, including the State’s general population growth, sentencing policies, and social factors such as crime and unemployment. As a result of the increase, the State has expanded its prison system and appropriated a correspondingly greater portion of State General Fund monies to corrections—11.2 percent in fiscal year 2011, compared with expenditures of 4.3 percent in fiscal year 1979. This substantial increase means that less funding is available for other priorities.
Arizona’s prison population has grown considerably and may continue growing
Arizona has not only experienced significant prison population growth since fiscal year 1979, but this growth is expected to continue into the future. The growth rate in Arizona’s prison population has outpaced the growth rate in most other states and, based on Department of Corrections (Department) and state budget office projections, is projected to grow annually through 2016 to potentially 49,700 inmates.
Arizona’s prison population has grown by more than 37,000 inmates since fiscal year 1979—As shown in Figure 1 (see page 4) and according to department data, the State’s prison population grew from 3,377 inmates as of June 30, 1979, to 40,477 inmates as of June 30, 2010—an average increase of approximately 1,200 inmates per fiscal year. According to department data, annual admissions to Arizona’s prison system have consistently exceeded releases.
From fiscal years 1979 through 2010, Arizona’s prison population has increased by approximately 1,200 inmates annually.
Office of the Auditor General
page 3
Chapter 1

Although the State’s general population has also increased, the State’s prison population has grown even faster. Specifically, according to Arizona Department of Economic Security estimates, Arizona’s general population more than doubled between fiscal years 1980 and 2008. During this same time, the State’s prison population increased more than tenfold. As a result, while 1 in every 749 persons in Arizona was in prison as of June 30, 1980, 1 in every 170 Arizonans was in prison as of June 30, 2008.
In addition to this growth, the demographics of Arizona’s prison population have changed. Specifically, auditors’ analysis of department annual reports and data highlighted the following changes in the prison population:
• Various categories of offenders have increased—Although Arizona’s prison population consists of inmates sentenced to prison for a wide variety of crimes, as shown in Table 1 (see page 5), certain categories of criminal offense have increased as a percentage of the prison population. For example, the number of imprisoned drug offenders increased from 1,975, or 15.6 percent of the prison population as of June 30, 1989, to 8,271, or 20.5 percent of the prison population as of December 31, 2009. The number of persons imprisoned for assaults has also increased, from 989, or 7.8 percent of the prison population as of June 30, 1989, to 4,875, or 12.1 percent of the prison population as of December 31, 2009.
Drug offenders accounted for 20.5 percent of the prison population as of December 31, 2009.
State of Arizona
page 4
Figure 1: Arizona Prison PopulationFiscal Years 1979 through 2010(Unaudited)
Source: Auditor General staff analysis of the Department’s March 2010 Two-Year Prison Population Trend Report and the ADC Institutional Capacity Committed Population report for June 30, 2010.
0
5,000
10,000
15,000
20,000
25,000
30,000
35,000
40,000
45,000
Num
ber
of I
nmat
es
Fiscal YearFiscal Year
Num
ber
of In
mat
es

Office of the Auditor General
page 5
June 30, 1989 June 30, 1999 December 31, 2009
Number Percent Number Percent Number Percent Crimes Against Persons
Homicide 1,144 9.1% 2,090 8.1% 3,406 8.4% Kidnapping 276 2.2 443 1.7 1,232 3.1 Sexual Assault 785 6.2 1,460 5.7 2,151 5.3 Robbery 1,170 9.3 2,014 7.8 3,454 8.6 Assault 989 7.8 3,118 12.1 4,875 12.1
4,364 34.54 9,125 35.34 15,118 37.5
Property Crimes
Arson 50 0.4 69 0.3 88 0.2 Burglary 1,899 15.0 2,395 9.3 2,948 7.3 Theft/Larceny 1,565 12.4 2,404 9.3 4,477 11.1 Forgery-Fraud 459 3.6 1,000 3.9 1,610 4.0 Other1 507 4.0 634 2.5 167 0.4
4,480 35.44 6,502 25.24 9,290 23.0
Morals-Decency Crimes
Drugs 1,975 15.6 5,575 21.6 8,271 20.5 Sex Offenders 641 5.1 1,286 5.0 1,906 4.7 Other2 99 0.8 197 0.8 427 1.1
2,715 21.5 7,058 27.34 10,604 26.3 Public Order Crimes
DUI 621 4.9 1,238 4.8 2,135 5.3 Other3 280 2.2 808 3.1 2,803 6.9
901 7.1 2,046 7.9 4,938 12.2 Miscellaneous Crimes 180 1.4
1,103 4.3
390 1.0
Total Crimes 12,640 100.0%4 25,834 100.0% 40,340 100.0%
Table 1: Number and Percentage of Total Inmates by Crime CategoryCalendar Years 1989, 1999, and 2009(Unaudited)
1 Other Property Crimes can include criminal damage, criminal littering or pollution, and unlawful failure to return rented property.
2 Other Morals-Decency Crimes can include domestic violence, child or adult abuse, prostitution, and public display of obscene materials.
3 Other Public Order Crimes can include disorderly conduct, stalking, rioting, smuggling, and weapons offenses.
4 Amounts do not total due to rounding.
Source: Auditor General staff analysis of department annual reports for fiscal years 1989 and 1999 (data as of June 30) and prison population data obtained from the Department’s Adult Inmate Management System as of December 31, 2009.
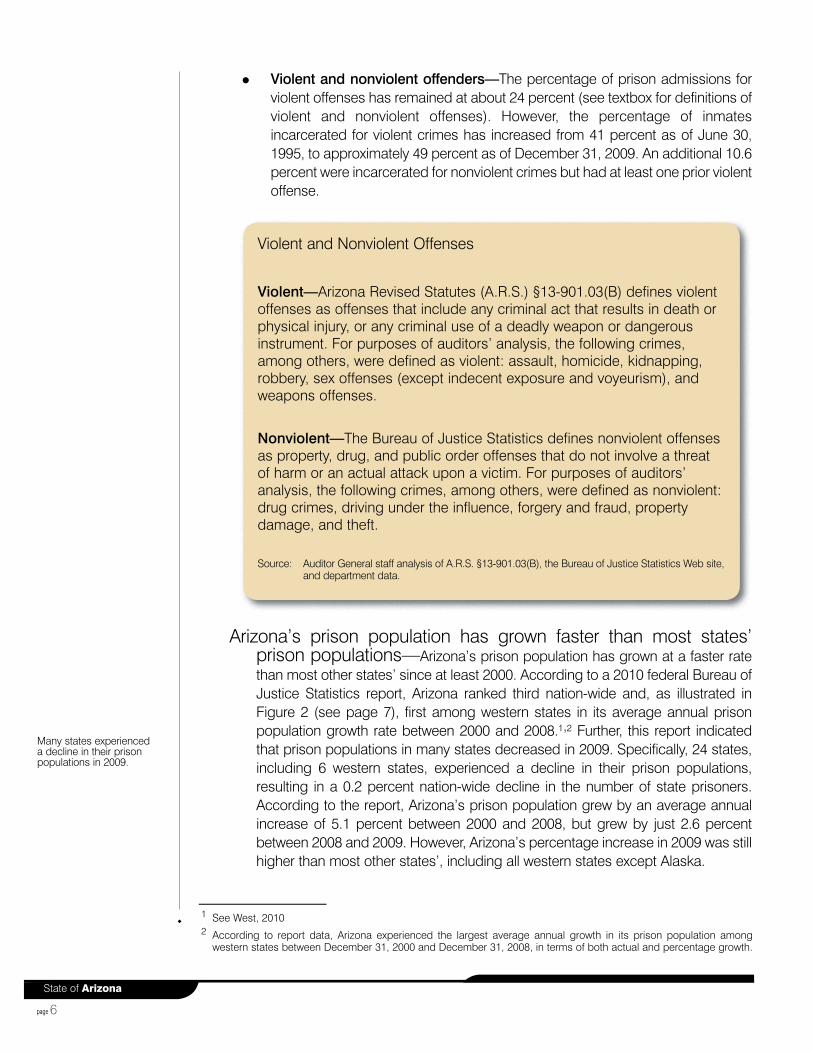
• Violent and nonviolent offenders—The percentage of prison admissions for violent offenses has remained at about 24 percent (see textbox for definitions of violent and nonviolent offenses). However, the percentage of inmates incarcerated for violent crimes has increased from 41 percent as of June 30, 1995, to approximately 49 percent as of December 31, 2009. An additional 10.6 percent were incarcerated for nonviolent crimes but had at least one prior violent offense.
Arizona’s prison population has grown faster than most states’ prison populations—Arizona’s prison population has grown at a faster rate than most other states’ since at least 2000. According to a 2010 federal Bureau of Justice Statistics report, Arizona ranked third nation-wide and, as illustrated in Figure 2 (see page 7), first among western states in its average annual prison population growth rate between 2000 and 2008.1,2 Further, this report indicated that prison populations in many states decreased in 2009. Specifically, 24 states, including 6 western states, experienced a decline in their prison populations, resulting in a 0.2 percent nation-wide decline in the number of state prisoners. According to the report, Arizona’s prison population grew by an average annual increase of 5.1 percent between 2000 and 2008, but grew by just 2.6 percent between 2008 and 2009. However, Arizona’s percentage increase in 2009 was still higher than most other states’, including all western states except Alaska.
1 See West, 20102 According to report data, Arizona experienced the largest average annual growth in its prison population among
western states between December 31, 2000 and December 31, 2008, in terms of both actual and percentage growth.
Many states experienced a decline in their prison populations in 2009.
State of Arizona
page 6
Violent and Nonviolent Offenses
Violent—Arizona Revised Statutes (A.R.S.) §13-901.03(B) defines violent offenses as offenses that include any criminal act that results in death or physical injury, or any criminal use of a deadly weapon or dangerous instrument. For purposes of auditors’ analysis, the following crimes, among others, were defined as violent: assault, homicide, kidnapping, robbery, sex offenses (except indecent exposure and voyeurism), and weapons offenses.
Nonviolent—The Bureau of Justice Statistics defines nonviolent offenses as property, drug, and public order offenses that do not involve a threat of harm or an actual attack upon a victim. For purposes of auditors’ analysis, the following crimes, among others, were defined as nonviolent: drug crimes, driving under the influence, forgery and fraud, property damage, and theft.
Source: Auditor General staff analysis of A.R.S. §13-901.03(B), the Bureau of Justice Statistics Web site, and department data.

A 2010 Pew Center on the States (Pew) report described the reasons for many states’ 2009 prison population decline.1,2 According to the report, an important contributor to prison population declines nation-wide was that “states began to realize they could effectively reduce their prison populations and save public funds, without sacrificing public safety. In the past few years, several states, including those with the largest population declines, have enacted reforms designed to get taxpayers a better return on their public safety dollars.” However, the report cautioned that it is too soon to say whether the 2009 decline will be temporary or the beginning of a downward trend.
Arizona’s prison population expected to grow—Both state budget offices—the Joint Legislative Budget Committee (JLBC) and the Governor’s Office of Strategic Planning and Budgeting (OSPB)—and the Department have projected that Arizona’s prison population will continue growing based upon historical growth trends. According to OSPB’s General Fund Executive Budgets and JLBC’s
1 Pew, 20102 The Pew Center on the States is a division of the Pew Charitable Trusts, a nonprofit organization that seeks to identify
and advance solutions to critical issues facing states. According to the Pew report, 26 states experienced a decline in their prison populations in 2009.
Office of the Auditor General
page 7
Figure 3: Comparison of Western States’ Average Annual Prison Population Growth December 31, 2000, to December 31, 2008 (Unaudited)
2.1%
2.3%
2.3%
2.3%
2.7%
3.0%
3.5%
3.7%
4.1%
5.1%
Hawaii1
Washington
New Mexico
Alaska1
Wyoming
Nevada
Idaho
Oregon
Colorado
Arizona
1
1
Figure 2: Comparison of Western States’ Average Annual Prison Population GrowthDecember 31, 2000 to December 31, 2008(Unaudited)
1 Numbers for Alaska and Hawaii include total jail and prison populations because they form one integrated system in these states.
Source: Auditor General staff analysis of state prison population data reported in the Bureau of Justice Statistics’ Prisoners at Yearend 2009—Advanced Counts.
0.8%
1.7%
1.9%
2.1%
2.3%
2.3%
2.3%
2.7%
3.0%
3.5%
3.7%
4.1%
5.1%
California
Montana
Utah
Hawaii1
Washington
New Mexico
Alaska1
Wyoming
Nevada
Idaho
Oregon
Colorado
Arizona
1
1

Appropriations Reports for fiscal year 2010, the prison population was expected to grow by 150 or 151 inmates per month, respectively, in fiscal year 2010. The OSPB and JLBC reports projected growth of 114 or 126 inmates per month, respectively, in fiscal year 2011. The Department previously projected growth of 151 inmates per month for November 2009 through December 2016, but it has revised its projections downward to reflect the OSPB projected growth of 114 inmates per month beginning in August 2010. However, none of these projections predicted the significant slowing in prison population growth for fiscal year 2010. According to department records, the State’s prison population experienced a net increase of only 65 inmates in fiscal year 2010, growth that fell substantially below projections. Department staff reported that this less-than-expected increase in the prison population is based on decreased prison admissions from Maricopa County, although they have been unable to determine the exact cause for this decrease. The Department is continuing to research this unexpected small increase in the State’s prison population for fiscal year 2010 to determine whether this was a 1-year anomaly or whether it should revise its longer-term growth forecasts. If the growth that occurred in fiscal year 2010 is an anomaly and the previously projected growth at 114 inmates per month resumes, this would result in a state prison population of nearly 49,700 inmates by December 31, 2016.
Arizona has expanded prison system to accommodate growth
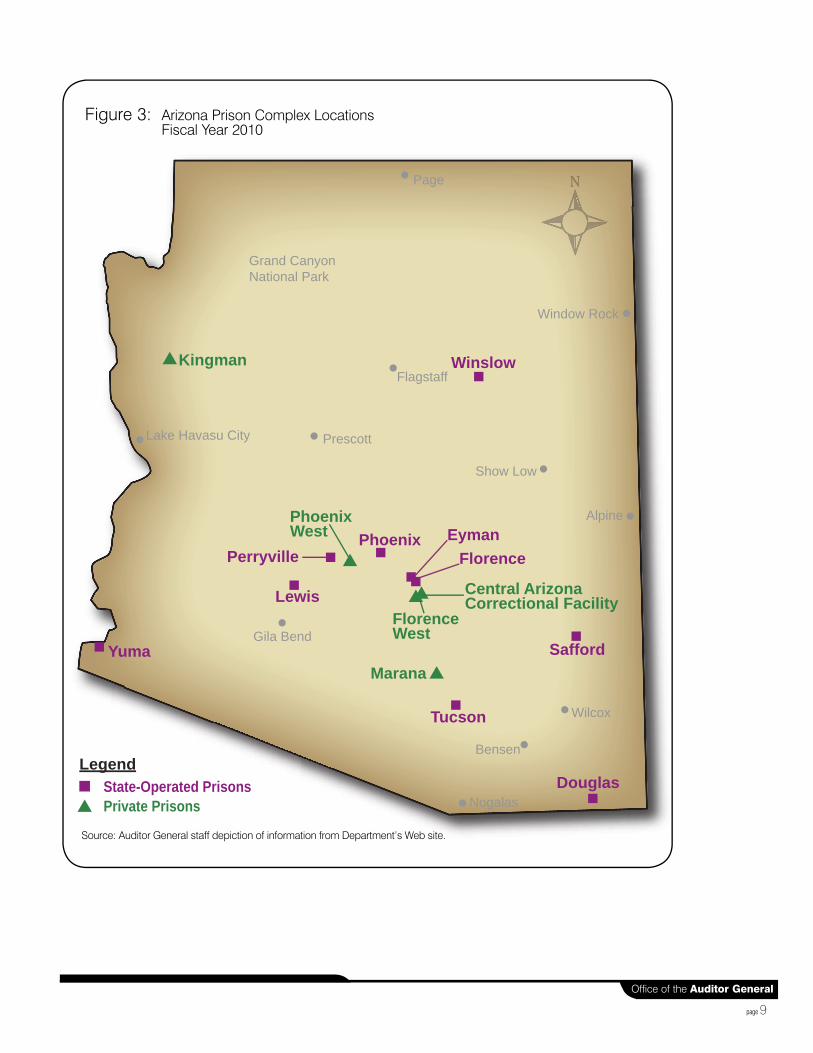
The State has significantly expanded its prison system to accommodate the growth in the prison population. As of June 30, 2010, the State operated 10 prison complexes with a total capacity of more than 33,400 beds and contracted with 5 in-state private prisons and 1 out-of-state private prison for 7,440 additional beds (see Figure 3, page 9, for a map of the prison locations in Arizona). These 40,840 beds represent nearly a nine-fold increase from the approximately 4,730 beds the Department operated prior to 1980.
The State has expanded the prison system in the following ways:
• Arizona has constructed several new prison complexes adding thousands of beds—According to information provided by Department of Corrections and Arizona Department of Administration (ADOA) staff, the State added six new prison complexes and expanded its four existing prison complexes between 1981 and 2004. These new and expanded complexes cost the State at least $561 million to build and added more than 22,100 beds to the state system.1
The Department gained an additional 300 beds in February 2010 when the Eagle Point facility, which is part of the Lewis prison complex and formerly housed juveniles under the jurisdiction of the Arizona Department of Juvenile
1 The $561 million figure does not include the costs to build six units within the prison complexes because these costs were not available from ADOA.
Arizona’s prison population may grow to nearly 49,700 inmates by the end of 2016.
State of Arizona
page 8
Office of the Auditor General
page 9
PerryvillePhoenix
Winslow
Lewis
Yuma
Douglas
Tucson
Safford
EymanFlorence
PhoenixWest
FlorenceWest
Central ArizonaCorrectional Facility
Marana
Kingman
State-Operated PrisonsPrivate Prisons
Legend
Page
Flagstaff
Window Rock
Prescott
Alpine
Wilcox
Bensen
Nogalas
Gila Bend
Lake Havasu City
Show Low
Grand CanyonNational Park
Figure 3: Arizona Prison Complex Locations Fiscal Year 2010
Source: Auditor General staff depiction of information from Department’s Web site.
Corrections, was transferred to its control. The Department reported that it spent more than $107,100 preparing the Eagle Point facility for its use.
According to the ADOA, construction was completed in early 2010 on another 4,000 beds in new buildings at existing prison complexes as authorized by Laws 2007, Ch. 261. The Department received funding in fiscal year 2011 to begin filling these beds. According to the ADOA, this expansion cost almost $194 million. Although the new buildings were designed to house 4,000 inmates, according to department officials, the necessary infrastructure was included to accommodate an additional 1,000 beds should they be needed.
• Arizona has contracted for thousands of private prison beds—The Department began contracting for beds in private prisons in fiscal year 1994 and, as of June 30, 2010, contracted for a total of 5,680 beds in 5 private prisons in Arizona. The State plans to expand its use of in-state private prison beds. Specifically, Laws 2009, 3rd S.S., Ch. 6, §37, requires the Department to contract for an additional 5,000 private prison beds. Although the Department had issued a request for proposals for these beds, according to department officials, as of September 2010, the request for proposals had been canceled and was in the process of being revised for re-issuance.
The Department has also used private facilities in other states, but this policy is changing. As of December 31, 2009, the Department had contracted for nearly 4,500 beds at three privately operated facilities in Colorado and Oklahoma. However, the State has decided to discontinue out-of-state prison contracts. As a result, the Department began moving prisoners housed at the out-of-state facilities back into the State in March 2010. As of June 30, 2010, there were still 1,765 inmates housed at a private facility in Oklahoma, but the Department plans to return all of these prisoners to in-state facilities by November 2010.
From fiscal year 1993 through fiscal year 2010, the Department reported that it spent more than $731.5 million to contract for private prison beds.1
• Department has added temporary beds to existing prison facilities—Despite the extensive expansion of Arizona’s prison system, the State has been unable to keep pace with prison population growth. According to a department official, the Department first used temporary beds—that is, beds in excess of what a facility is designed or rated to house—in July 1982 when the prison population exceeded the rated bed capacity. The Department has added these temporary beds by double bunking occupied single cells, adding more beds to occupied dormitories, and adding beds in prison spaces not designed to house inmates. For example, at the Eyman prison complex, the Department has added double bunks to maximum security cells originally designed for single occupancy and has expanded lower custody units that were designed for 24
1 This total does not include private prison contract costs for fiscal years 2002 through 2004 and includes only a part of those costs for fiscal year 2005 because the JLBC Appropriations Reports that the Department used to compile this information did not separately account for these costs in those years.
The Department contracted for 5,680 beds in 5 private prisons as of June 30, 2010.
State of Arizona
page 10
Office of the Auditor General
page 11
inmates to hold 48 beds. At the Perryville prison complex, which houses most of the State’s female inmates, the Department temporarily converted serving kitchens to 56-bed dorms and former programming rooms into cells that hold 8 to 10 inmates in bunk beds. According to department officials, alternative spaces are only occasionally used for temporary beds and on an emergency basis, although they have been used for extended periods of time.
Department officials also reported that, although the use of temporary beds is less costly than constructing new ones, it carries several disadvantages. According to the Department, the primary costs associated with temporary beds are for providing food and healthcare to the inmates. However, adding temporary beds increases capacity beyond what industry standards have deemed safe.1 This increase, in turn, can create overcrowded conditions at prisons, which can lead to additional stress for staff, inmates, and the physical plant facilities. For instance, according to department officials, the kitchen and restroom facilities and the state prisons’ electricity, water, and sewer systems were built to accommodate only these prisons’ design capacities. When capacity is exceeded, problems can arise with these systems. For example, according to the Department, the growing inmate population at the Perryville prison complex increased demand for food service from the complex’s central kitchen, which was originally designed in 1981 to supply 3,600 meals per day. A department official explained that, as of July 2010, the Perryville prison’s central kitchen was producing 10,200 meals per day for the Perryville complex alone and an additional 2,100 meals for the Phoenix prison complex. The official further stated that the prolonged overuse of Perryville’s kitchen has resulted in the need for significant upgrades to the facility’s physical structure as well as the plumbing, electricity, and other equipment in order to be in compliance with building and health codes.
Table 2 (see page 12) shows the number of beds each prison complex was rated to accommodate, the total bed capacity, and the inmate population as of June 30, 2010, at both state-operated and privately operated facilities. For example, the Florence prison complex was rated to hold 3,692 inmates, but had a total operating capacity of 4,439 inmates as of June 30, 2010. The total operating capacity includes temporary beds. However, as of June 30, 2010, the Florence prison complex had 4,495 inmates.2
1 The American Correctional Association (ACA) sets prison capacity design standards to safeguard the life, health, and safety of staff and offenders. Although the State’s prisons are not certified by the ACA, the Department reported that it builds prisons with these standards in mind.
2 As indicated in Table 2 (see page 12), the Florence prison complex inmate population as of June 30, 2010, included inmates placed in special use beds that are not reflected in the prison’s total operating capacity, but that the Department uses for temporary placements due to sickness and other reasons.
Use of temporary beds can stress the prison system.

State of Arizona
page 12
1 The total operating capacity includes temporary beds, but does not include special use beds, which are beds where inmates stay temporarily for various reasons such as detention or sickness. The Department does not include these beds in its operating capacity because there must be general population beds available for these inmates when released from detention or the sick ward.
2 The inmate population as of June 30, 2010, includes inmates housed in special use beds, as described in footnote 1, as well as inmates who are under the jurisdiction of the Department but were outside of the prisons because of reasons such as a court date or hospital stay.
3 For prisons where the total inmate population exceeds total operating capacity, some inmates were in special use beds.
4 The operating capacities of the Perryville and Phoenix prisons include beds used during the intake process. All prison admissions must pass through one of these two facilities before being assigned a permanent bed. Because of these intake beds, the percentage of capacity reached appears lower than actual conditions at the facility.
Source: Auditor General staff analysis of the Department’s ADC Institutional Capacity Committed Population report for June 30, 2010.
Rated Capacity
Total Operating Capacity1
Inmate Population2
% Total Operating Capacity Reached3
State Prisons Douglas 2,055 2,684 2,663 99% Eyman 4,588 5,252 5,530 105 Florence 3,692 4,439 4,495 101 Lewis 4,952 5,356 5,256 98 Perryville4 3,002 3,958 3,454 87 Phoenix4 563 714 539 75 Safford 1,486 1,934 1,934 100 Tucson 3,932 4,572 4,608 101 Winslow 1,754 1,890 1,896 100 Yuma 2,448 2,604 2,695 103
State Bed Totals 28,472 33,403 33,070 99
PPrivate Prisons
Central Arizona Correctional Facility
1,000 1,280 1,272 99
Florence West 600 750 743 99 Great Plains-Cornel, OK 1,760 1,760 1,765 100 Kingman 2,542 2,650 2,650 100 Marana 450 500 490 98 Phoenix West 400 500 487 97
Private Bed Totals 6,752 7,440 7,407 100
Total Prison System 35,224 40,843 40,477 99
Table 2: Arizona Prison Capacity and PopulationJune 30, 2010(Unaudited)

Prison population growth results from both policy and social factors
Various factors contribute to growth in prison populations. According to an August 2005 Vera Institute of Justice report (Vera report) that studied the impact of state-level sentencing and corrections policies between 1975 and 2002, these policies and social factors affect states’ incarceration rates.1,2 The incarceration rate is the number of inmates per 100,000 residents. An increase in the incarceration rate would indicate a growing prison population. The Vera report identified a number of social factors associated with the size or growth of incarceration rates. For example, states with larger minority populations, more state revenue per capita, a higher rate of arrests for drug offenses, and more law enforcement personnel per capita had higher incarceration rates, while states with higher personal income per capita and more generous welfare benefits had lower incarceration rates. States with higher property crime rates experienced larger growth in incarceration rates. In addition, the Vera report found that higher levels of unemployment, greater increases in unemployment, higher levels of income inequality, and larger youth populations were also associated with larger growth in incarceration rates, but the size of minority populations was not related to growth. The Vera report also found that some state sentencing policies can affect incarceration rates. For example, states with more provisions for increasing sentences for drug offenses (such as drug sales near a school, offenses involving minors, or weapon use), had higher incarceration rates, as did states with more mandatory sentencing laws (laws requiring courts to impose incarceration for a specific offense and/or a longer prison term). See Chapter 3 (pages 23 through 35) for more information on Arizona’s sentencing laws and their effect on the State’s incarceration rate and prison population.
Further, Arizona’s incarceration rate has continued to increase despite the fact that Arizona’s crime rate has generally declined since the mid-1990s. According to crime rate data compiled by the Bureau of Justice Statistics, while Arizona had 1 crime for every 12 residents in 1995, the figure had dropped to 1 for every 22 residents in 2008. A 2010 Arizona Prosecuting Attorneys’ Advisory Council report suggested the drop in the crime rate could be due to the State’s increased imprisonment rate.3 However, literature auditors reviewed indicates that the effect of incarceration on crime is limited compared to the combined effect of other factors (such as increased law enforcement, employment, and education) and diminishes as prison populations grow.4 In addition, although Arizona’s crime rate has dropped, the State has one of the highest reported crime rates in the nation despite also having one of the highest incarceration rates (see textbox, page 14).
1 See Stemen, Rengifo, & Wison, 20052 The Vera Institute of Justice (Vera) is a nonpartisan, nonprofit center for justice policy and practice. According to its
Web site, Vera combines expertise in research, demonstration projects, and technical assistance to help leaders in government and civil society improve the systems people rely on for justice and safety.
3 See Fischer, 20104 See Stemen, 2007; Liedka, Piehl, & Useem, 2006
Arizona’s crime rate has generally declined since the mid-1990s.
page 13
Office of the Auditor General

According to auditors’ analysis of Federal Bureau of investigation (FBI) data, Arizona had one of the top five highest reported crime rates among all 50 states, the District of Columbia, and Puerto Rico in 2006 through 2008.1
Arizona has increased corrections spending to help keep pace with growth
Regardless of the reasons for the increased prison population, the growth has led to substantially increased corrections spending, which accounted for $1 in every $8.77 of State General Fund estimated operating expenditures in fiscal year 2010. To accommodate the growth in Arizona’s prison population, the Legislature has significantly increased State General Fund spending on corrections operations. In fact, the Legislature has appropriated nearly $949 million in State General Fund monies to the Department for fiscal year 2011, a significant increase from the $41.4 million spent in fiscal year 1979 for corrections. However, the Department has implemented several cost-saving measures to keep per-inmate costs low, helping to avoid even greater correctional expenses.
Department operations compose 11.2 percent of State General Fund appropriations—The Legislature has significantly increased the amount of State General Fund monies it spends on department operations. According to JLBC data, State General Fund corrections operating expenditures totaled more than $41.4 million in fiscal year 1979. For fiscal year 2011, the Legislature has appropriated nearly $949 million in State General Fund monies to the Department, including $58 million in startup and operational costs, which will cover the first year of operations for the 4,000 new inmate beds the State added in 2010.
1 Auditors compared estimated state crime rates reported by the FBI in its annual Crime in the United States publications for 2006 through 2008. The FBI develops the estimated crime rates based on crimes reported as part of the FBI’s Uniform Crime Reporting (UCR) Program. The UCR Program collects crime statistics on eight crime categories: murder and nonnegligent manslaughter, forcible rape, robbery, aggravated assault, burglary, larceny-theft, motor vehicle theft, and arson (however, arson is not included in the estimated state crime rates for 2006 through 2008 because of insufficient data). Arizona ranked second after the District of Columbia in 2006, third in 2007, and fifth in 2008.
For fiscal year 2011, the Legislature has appropriated nearly $949 million in State General Fund monies to the Department.
State of Arizona
page 14
Arizona’s incarceration rate
A 2009 Pew report reviewed state incarceration rates for 2007 and reported that Arizona had the highest incarceration rate among western states and tied with South Carolina to rank ninth nation-wide, behind the District of Columbia and seven other states.
Source: Auditor General staff review of the Pew Center on the State’s 1 in 31: The Long Reach of American Corrections report.
Office of the Auditor General
page 15
According to JLBC reports and as shown in Figure 4 (see page 16), this increase has meant that spending on the Department constitutes a greater portion of available State General Fund monies, thus impacting monies that are available for other state priorities. Specifically, the Department’s fiscal year 2011 State General Fund appropriation accounts for 11.2 percent of all State General Fund appropriations for the fiscal year, which is more than double the 4.3 percent of State General Fund operating monies spent on corrections in fiscal year 1979. For fiscal year 2011, corrections will be the third largest State General Fund operating expense, trailing only K-12 education and health. By contrast, university spending has decreased from nearly 19.1 percent of State General Fund operating expenditures in fiscal year 1979 to only about 10.5 percent of State General Fund appropriations in fiscal year 2011. In fiscal year 2011, for every State General Fund operating dollar appropriated to the Department, $0.94 was appropriated to the universities.
Department has kept per-inmate daily costs low—Even though state spending on the Department’s operations has increased significantly, the Department has taken steps to keep the per-inmate daily cost (per capita rate) low. In fact, although the per capita rate increased from $42.46 per day in fiscal year 1986 (the earliest year data was available) to $64.96 per day in fiscal year 2009, it actually decreased to $32.98 per day when adjusted for inflation. A department letter prepared in response to a request for information from the Commission on Privatization and Efficiency—a commission the Governor established to identify state services and agencies whose functions can be eliminated, consolidated, streamlined, or outsourced to achieve greater operational efficiency—noted several ways in which the Department has kept per capita rates low. According to this letter, the Department has contracted for services (such as food, health, and work-based education) with private organizations and community colleges; downsized administrative office staff; placed responsibility for more costs on the inmates; taken advantage of volunteer support; replaced typical mattresses with ones made from recycled materials; and used inmate labor and inmate-produced products whenever feasible, among numerous other efficiencies. The Department’s ability to keep its per-inmate costs low has helped the State to avoid even higher spending on department operations in light of the significant prison population growth.
Prison per capita costs have decreased when adjusted for inflation.

State of Arizona
page 16
Figure 4: Comparison of State General Fund Expenditures for Fiscal Year 1979and Appropriations for Fiscal Year 2011(Unaudited)
1 In fiscal year 1979, incarcerated juveniles not convicted as adults were housed under the Department of Corrections; in fiscal year 2011, they are housed in the Arizona Department of Juvenile Corrections. The adult corrections portion of fiscal year 1979 was less than 4.3 percent of the State General Fund.
2 The Arizona Health Care Cost Containment System (AHCCCS) is the State’s Medicaid agency.
Source: Auditor General staff analysis of the JLBC General Fund Operating Budget Spending Fiscal Years 1979 -2011 report and the fiscal year 2011 Appropriations Report.
1
2
4.30%
4.84%
19.06%
25.93%
45.86%
Fiscal Year 1979 Expenditures
Department of Corrections1
Total Health Services (includes AHCCCS)
Universities/Regents
All Other Agencies
Department of Education (K-12)
10.50%
11.19%
15.69%
21.42%
41.19%
Fiscal Year 2011 Appropriations
1
2

Option 1—Expanding prison system to address prison population growth
One option to address Arizona’s prison population growth is to continue expanding the prison system. Specifically, the Legislature could consider constructing new prison facilities and/or contracting for more private beds. Based on the Department of Corrections’ (Department) proposed plan for expanding the prison system to meet expected growth using a combination of state and private facilities, this option could cost an estimated $975 million between fiscal years 2012 and 2017, and actual costs could be higher. If the Legislature decides to continue expanding the prison system, it should consider directing the Department to further study and analyze the costs for the State to build and operate prison facilities compared to contracting with private prisons to determine which option would be more cost-effective while still ensuring public safety.
Continued expansion will require significant spending
As discussed in Chapter 1, the Department has projected that the State’s prison population could reach nearly 50,000 inmates by December 31, 2016, based on a growth rate of 114 inmates per month (see Chapter 1, page 8). Based on the projected growth, the Department estimates that the State will need 8,500 new beds—in addition to the 4,000 new beds that became operational in fiscal year 2011—and has developed a plan to meet this demand. The proposed plan recommends adding both state-operated and private beds because statute requires the Department to consider contracting for private prisons before expanding or constructing new minimum- or medium-security prison facilities for certain offenders. As illustrated in Table 3 (see page 18), the plan could cost approximately $975 million for construction and operating costs between fiscal years 2012 and 2017 and includes the following:
• Private prison beds—The Department’s plan recommends an additional 6,500 private prison beds for minimum- and medium-custody level male inmates. This
Expanding the prison system to meet expected prison population growth could cost approximately $975 million between fiscal years 2012 and 2017.
Office of the Auditor General
page 17
Chapter 2
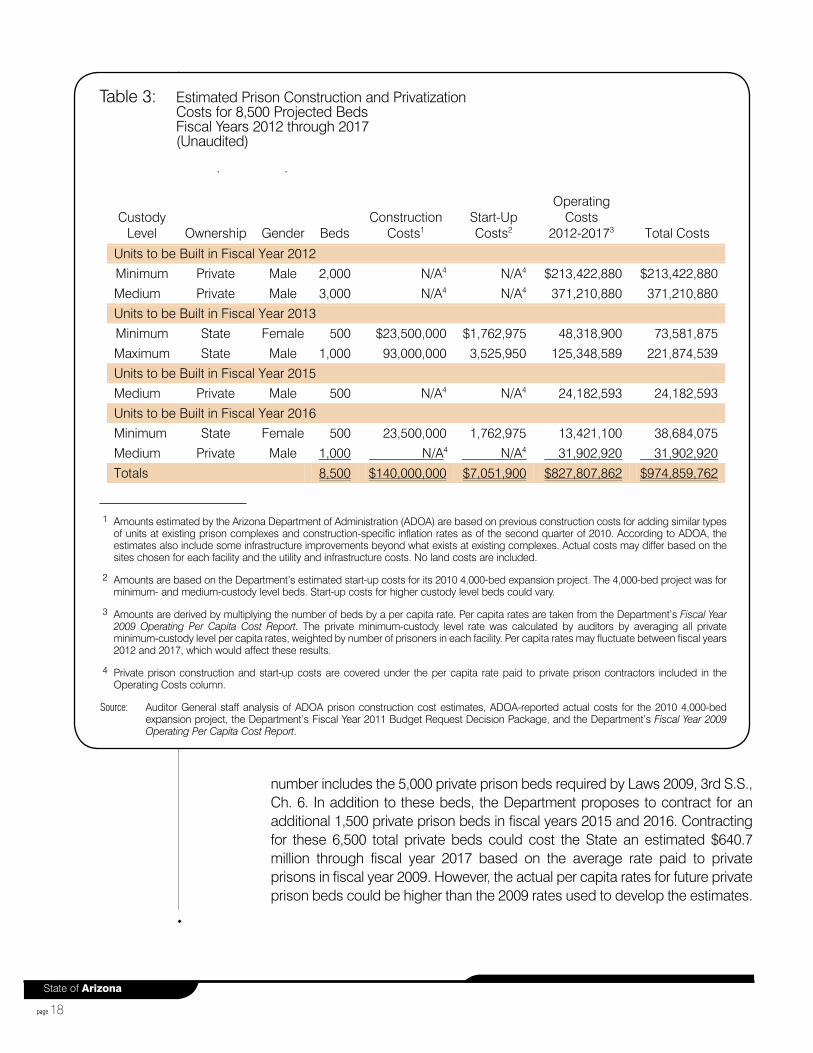
number includes the 5,000 private prison beds required by Laws 2009, 3rd S.S., Ch. 6. In addition to these beds, the Department proposes to contract for an additional 1,500 private prison beds in fiscal years 2015 and 2016. Contracting for these 6,500 total private beds could cost the State an estimated $640.7 million through fiscal year 2017 based on the average rate paid to private prisons in fiscal year 2009. However, the actual per capita rates for future private prison beds could be higher than the 2009 rates used to develop the estimates.
State of Arizona
page 18
1 Amounts estimated by the Arizona Department of Administration (ADOA) are based on previous construction costs for adding similar types of units at existing prison complexes and construction-specific inflation rates as of the second quarter of 2010. According to ADOA, the estimates also include some infrastructure improvements beyond what exists at existing complexes. Actual costs may differ based on the sites chosen for each facility and the utility and infrastructure costs. No land costs are included.
2 Amounts are based on the Department’s estimated start-up costs for its 2010 4,000-bed expansion project. The 4,000-bed project was for minimum- and medium-custody level beds. Start-up costs for higher custody level beds could vary.
3 Amounts are derived by multiplying the number of beds by a per capita rate. Per capita rates are taken from the Department’s Fiscal Year 2009 Operating Per Capita Cost Report. The private minimum-custody level rate was calculated by auditors by averaging all private minimum-custody level per capita rates, weighted by number of prisoners in each facility. Per capita rates may fluctuate between fiscal years 2012 and 2017, which would affect these results.
4 Private prison construction and start-up costs are covered under the per capita rate paid to private prison contractors included in the Operating Costs column.
Source: Auditor General staff analysis of ADOA prison construction cost estimates, ADOA-reported actual costs for the 2010 4,000-bed expansion project, the Department’s Fiscal Year 2011 Budget Request Decision Package, and the Department’s Fiscal Year 2009 Operating Per Capita Cost Report.
Table 3: Estimated Prison Construction and Privatization Costs for 8,500 Projected BedsFiscal Years 2012 through 2017(Unaudited)
( )
Custody
Level
Ownership
Gender
Beds
Construction
Costs1
Start-Up Costs2
Operating Costs
2012-20173
Total Costs
Units to be Built in Fiscal Year 2012
Minimum Private Male 2,000 N/A4 N/A4 $213,422,880 $213,422,880
Medium Private Male 3,000 N/A4 N/A4 371,210,880 371,210,880
Units to be Built in Fiscal Year 2013
Minimum State Female 500 $23,500,000 $1,762,975 48,318,900 73,581,875
Maximum State Male 1,000 93,000,000 3,525,950 125,348,589 221,874,539
Units to be Built in Fiscal Year 2015
Medium Private Male 500 N/A4 N/A4 24,182,593 24,182,593
Units to be Built in Fiscal Year 2016
Minimum State Female 500 23,500,000 1,762,975 13,421,100 38,684,075
Medium Private Male 1,000 N/A4 N/A4 31,902,920 31,902,920
Totals 8,500 $140,000,000 $7,051,900 $827,807,862 $974,859,762

• State-operated beds—The Department’s plan also recommends constructing additional facilities, either by expanding existing prison facilities or by constructing new facilities, to add 2,000 beds, including 1,000 maximum-custody level beds for male inmates and 1,000 minimum-custody level beds for female inmates. According to the Department’s plan, these beds would become available in fiscal years 2013 and 2016. Adding these beds could cost at least $334.1 million to construct and operate through fiscal year 2017. Again, however, actual costs could be higher. For example, both Arizona Department of Administration and department officials reported that the estimated construction costs for the proposed state-operated facilities—estimated to be $140 million of the $334.1 million—are conservative because they are based on estimated 2010 costs, and actual costs will depend on when and where the facilities will be built. Costs are highly dependent on the location chosen for the facilities, and it is possible that additional monies could be needed to account for higher construction costs in various parts of the State, land costs, or costs to expand waste and water treatment facilities at existing prison complexes.
Although auditors used different per capita rates for the private and state-operated beds in developing the cost estimates, the stated costs represent different custody level beds and bed activation years and should not be used to compare the costs of private versus state-operated prisons. Moreover, these estimates are largely based on the number of needed beds identified in the Department’s bed plan and operating costs reported in its Fiscal Year 2009 Operating Per Capita Cost Report. As of September 2010, department officials reported that they were in the process of updating both of these documents. Consequently, the projected bed need and cost estimates could change
State should further study cost-effectiveness of privately operated prisons compared to state-operated prisons
Part of the deliberations about adding capacity is determining whether the State should contract with private prisons for additional beds or construct and operate its own prisons. As discussed in Chapter 1 (see pages 3 through 16), the State has pursued both of these options to help meet the prison housing demands that the State’s growing prison population has required. Although statute requires the Department to consider contracting for private prisons before expanding or constructing prison facilities for certain offenders and allows the Department to enter into private prison contracts, statute also stipulates that such contracts offer "cost savings" to the State. However, department analysis of private prison and state prison costs indicated that it may be more costly to house inmates in private prisons. Specifically, according to the Department’s Fiscal Year 2009 Operating Per Capita Cost Report, the State paid private prisons a higher per inmate rate than it spent on equivalent services at state-operated facilities in fiscal year 2009. After adjusting state and private rates to make them more comparable, the Department’s study found that rates paid to private facilities were higher for both minimum- and medium-custody
Projected bed need and estimated costs for these beds could change.
Office of the Auditor General
page 19
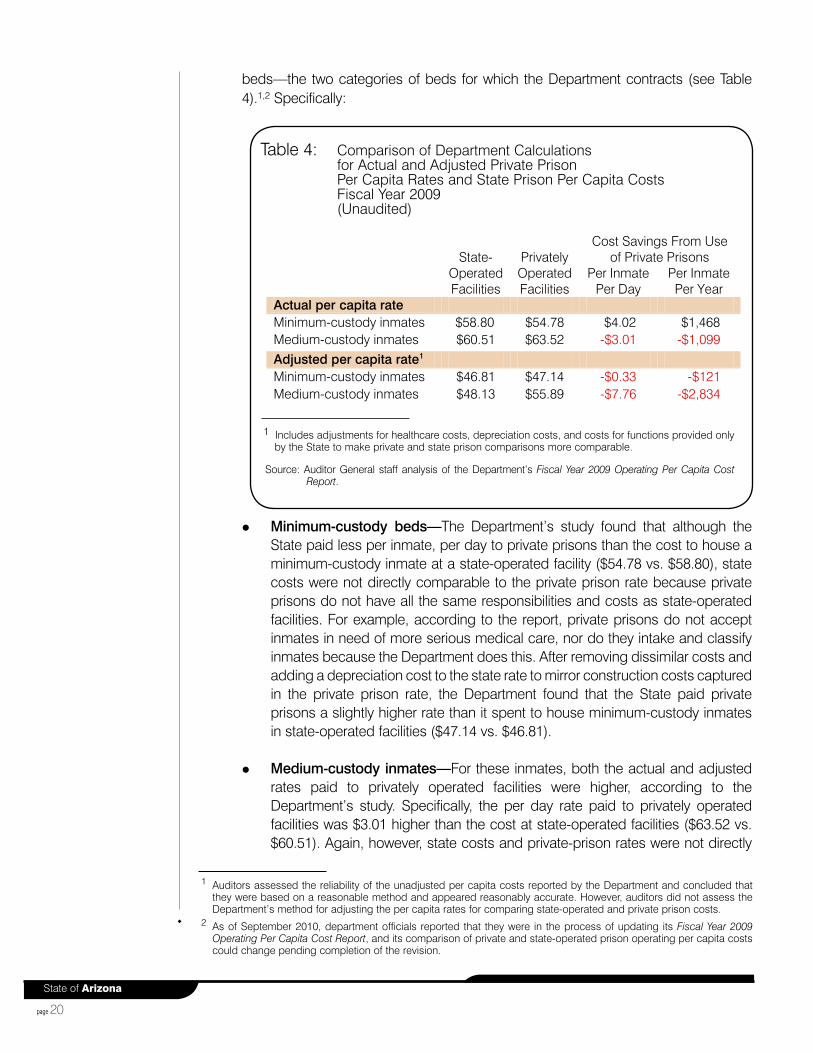
beds—the two categories of beds for which the Department contracts (see Table 4).1,2 Specifically:
• Minimum-custody beds—The Department’s study found that although the State paid less per inmate, per day to private prisons than the cost to house a minimum-custody inmate at a state-operated facility ($54.78 vs. $58.80), state costs were not directly comparable to the private prison rate because private prisons do not have all the same responsibilities and costs as state-operated facilities. For example, according to the report, private prisons do not accept inmates in need of more serious medical care, nor do they intake and classify inmates because the Department does this. After removing dissimilar costs and adding a depreciation cost to the state rate to mirror construction costs captured in the private prison rate, the Department found that the State paid private prisons a slightly higher rate than it spent to house minimum-custody inmates in state-operated facilities ($47.14 vs. $46.81).
• Medium-custody inmates—For these inmates, both the actual and adjusted rates paid to privately operated facilities were higher, according to the Department’s study. Specifically, the per day rate paid to privately operated facilities was $3.01 higher than the cost at state-operated facilities ($63.52 vs. $60.51). Again, however, state costs and private-prison rates were not directly
1 Auditors assessed the reliability of the unadjusted per capita costs reported by the Department and concluded that they were based on a reasonable method and appeared reasonably accurate. However, auditors did not assess the Department’s method for adjusting the per capita rates for comparing state-operated and private prison costs.
2 As of September 2010, department officials reported that they were in the process of updating its Fiscal Year 2009 Operating Per Capita Cost Report, and its comparison of private and state-operated prison operating per capita costs could change pending completion of the revision.
State of Arizona
page 20
1 Includes adjustments for healthcare costs, depreciation costs, and costs for functions provided only by the State to make private and state prison comparisons more comparable.
Source: Auditor General staff analysis of the Department’s Fiscal Year 2009 Operating Per Capita Cost Report.
Table 4: Comparison of Department Calculations for Actual and Adjusted Private PrisonPer Capita Rates and State Prison Per Capita Costs Fiscal Year 2009(Unaudited)
State-Operated Facilities
Privately Operated Facilities
Cost Savings From Use of Private Prisons
Per Inmate
Per Day Per Inmate Per Year
Actual per capita rate Minimum-custody inmates $58.80 $54.78 $4.02 $1,468 Medium-custody inmates $60.51 $63.52 -$3.01 -$1,099 Adjusted per capita rate1 Minimum-custody inmates $46.81 $47.14 -$0.33 -$121 Medium-custody inmates $48.13 $55.89 -$7.76 -$2,834
comparable for the reasons described above. After making the adjustments, the difference grew to $7.76 ($55.89 vs. $48.13).
Other studies auditors reviewed were consistent with the Department’s analysis. These studies indicated that costs savings from contracting with private prisons in place of state-operated prisons are not guaranteed. For example, a 2009 University of Utah review of eight studies comparing private and state prison costs found that results were mixed. Specifically, four studies identified private prison cost savings ranging from 4.6 percent to 15.2 percent, two studies found no difference in costs, and two studies—including a 2006 study the Department commissioned—found that costs of private prisons were 10.0 to 14.2 percent higher.1 In addition to prison operational costs, consideration should be given to whether the State can construct new prisons at a lower cost. According to a 2001 U.S. Department of Justice report, evidence suggested that private companies can construct new facilities faster and cheaper than the public sector.2 Additionally, this report noted that there is no consensus among academics and professionals in the field regarding the potential cost savings that private prisons can offer. Therefore, if the Legislature decides to expand the prison system, it should consider directing the Department to further study and analyze the costs for the State to build and operate prison facilities compared to contracting with private prisons to determine which option would be more cost-effective while still ensuring public safety.
1 See Lundahl et al., 20082 See Austin and Coventry, 2001
Studies have indicated that contracting with private prisons does not guarantee cost savings.
Office of the Auditor General
page 21

State of Arizona
page 22

Option 2—Diverting more nonviolent, low-risk offenders or reducing the time they serve to address prison population growth
A second option for addressing projected prison population growth is to divert more nonviolent, low-risk offenders from prison or reduce the time they serve—alternatives that may require changes to the State’s sentencing laws. Arizona’s sentencing laws largely dictate prison sentences and have contributed to the growth that has occurred to date in the prison population. The Legislature has studied changing these laws several times, and an ad hoc committee in the House of Representatives is addressing the subject again in 2010. Although some steps have been taken to divert nonviolent, low-risk offenders from prison and reduce the time they serve, the Legislature could consider expanding these efforts. Establishing a permanent sentencing commission to periodically review Arizona’s sentencing laws and help monitor the State’s prison population would be a way to provide ongoing attention to this area.
Arizona laws largely determine prison sentences
Arizona’s sentencing laws largely determine prison sentences. Since 1978, Arizona has enacted several sentencing laws to provide equity in the sentencing process and harsher penalties for certain crimes, and to ensure that offenders serve most of the sentence imposed. These laws include presumptive sentencing, which requires that judges impose certain sentences based on the felony offense; mandatory sentencing, which provides for harsher penalties for certain offenses; and truth in sentencing, which dictates how long a sentenced offender must serve. Specifically:
• Presumptive sentencing—Arizona’s presumptive sentencing system, which became effective in 1978, requires judges to impose a statutorily defined sentence for a given offense. Prior to this change, judges had broad discretion in determining sentences, which resulted in sentencing disparities for similar crimes. Presumptive sentencing was adopted to provide more equitable
Office of the Auditor General
page 23
Chapter 3

State of Arizona
page 24
punishment for similar offenders who commit similar crimes. Under the State’s presumptive sentencing system, felony offenses are assigned to one of six classes depending on their seriousness, with class 1 being the most serious and class 6 the least serious. Judges are required to impose a recommended, or “presumptive,” sentence for a given offense class, but may give shorter or longer sentences within a statutorily defined range based on mitigating or aggravating circumstances. According to a 2005 Vera Institute of Justice report (Vera report), nine states, including Arizona, adopted some form of presumptive sentencing between 1975 and 2002.1 In contrast, between 1980 and 2002, 17 other states adopted sentencing guidelines rather than presumptive sentencing.2
Although presumptive sentencing does not preclude judges from sentencing eligible offenders to probation rather than prison time, it largely shifts discretion in determining sentence lengths to the Legislature, which determines sentence length in statute, and to prosecutors, who determine which violations to charge. Prosecutors can also offer plea bargains that reduce the seriousness or number of charges against the defendant in exchange for a guilty plea.
• Mandatory sentences—Arizona also began adopting mandatory sentence provisions in 1978 that provide for harsher penalties for certain groups of offenders, such as repeat offenders, violent offenders, sex offenders, and certain DUI and drug offenders. Mandatory sentencing provisions require the judge to send the offender to prison (i.e., make the offender ineligible for probation) and/or to lengthen the presumptive sentence for the offense (see the textbox below for an example of how mandatory sentences can affect sentencing). However, the judge can apply a mandatory sentence only when the prosecutor presses charges that require a mandatory penalty. According to the
1 See Stemen, Rengifo, & Wilson, 20052 According to the Vera report, sentencing guidelines are a system of multiple recommended sentences and dispositions
and a set of procedures designed to guide judicial sentencing decisions and sentencing outcomes that account for the severity of the offense and prior criminal history. Guidelines can be presumptive, which requires judges to impose a sentence within a range or provide written justification for imposing some other sentence (which sentence can be appealed), or voluntary, which does not require judges to impose the sentence recommended by the guidelines.
Presumptive sentencing shifts discretion from judges to the Legislature and prosecutors.
Example of how mandatory sentencing can affect sentence length:
A person convicted of robbery, a class 4 felony offense, can either be sentenced to probation or sent to prison for 2.5 years, the presumptive sentence for a class 4 felony. However:
• If the offender had a prior felony conviction (regardless of what it was), the prosecutor could press charges that invoke the repetitive offender mandatory sentence depending on when the prior offense occurred. If proven, the offender would be ineligible for probation and the imposed presumptive sentence would increase from 2.5 to 4.5 years.
• If the offender used or threatened to use a gun during the robbery, the prosecutor could invoke the dangerous offender mandatory sentence. If proven, the offender would be ineligible for probation and the imposed presumptive sentence would increase from 2.5 to 6 years.

Vera report, all 50 states had adopted various mandatory sentencing laws by 2002.
• Truth in sentencing—In 1993, Arizona adopted truth-in-sentencing laws that abolished discretionary release by a parole board for any offense committed after 1993 and require offenders to serve at least 85 percent of their sentences before becoming eligible for community supervision (the 85 percent requirement applies to both violent and nonviolent offenders).1 Prior to this change, prisoners were required to serve at least 67 to 75 percent of their sentences (depending on the offense), but typically became eligible for parole after serving one-half or two-thirds of their sentences.2 Truth in sentencing was adopted to promote truth and accountability in sentencing by requiring offenders to serve the majority of their sentence. According to the Vera report, 17 states had abolished discretionary parole release by 2002, while 33 states still had it.3 In addition, according to a 1999 Bureau of Justice Statistics report, most states had laws requiring offenders to serve a specific percentage of their sentences.4 According to this report, by 1998, 27 states required violent offenders to serve at least 85 percent of their sentences. However, the report noted that only a few states—such as Florida, Mississippi, and Ohio—also required nonviolent offenders to serve a substantial portion of their sentences, similar to Arizona.
Sentencing laws have affected State’s prison population
Arizona’s sentencing laws affect the State’s prison population by determining who goes to prison and how long they stay. Prison population growth is essentially a function of prison admissions and length of stay. In Arizona, the combination of sentencing laws has contributed to increased prison admissions, but the actual time inmates served has decreased.
Specifically, consistent with national trends, Arizona’s imprisonment rate has steadily increased since adopting presumptive sentencing. However, the rate of increase slowed after abolishing discretionary parole when the State made various sentencing changes in 1993. These results are consistent with the Vera report, which found that states that controlled sentencing decisions through presumptive sentencing but did not control release decisions by abolishing discretionary parole release—such as Arizona between 1978 and 1993—had higher incarceration rates.5 In contrast, the
1 Parole is a period of conditional supervised release outside of prison before an entire prison term is completed. It is granted by the Arizona Board of Executive Clemency after the inmate has served a portion of his or her sentence and has applied for release on parole. Parole eligibility dates are calculated in accordance with the provisions of the committing offense and the laws in effect at the time the offense was committed. Only inmates who committed offenses before January 1, 1994, are eligible for parole. Community supervision is a portion of a felony sentence and is served consecutive to the inmate’s period of imprisonment. The term of community supervision is a period equal to 1 day for every 7 days of the sentence and is imposed on the convicted person by the court at the time of sentencing. Community supervision replaced parole after truth in sentencing was adopted.
2 Alternatives to Sentencing Workgroup, 20053 See Stemen, Rengifo, & Wilson, 20054 See Ditton & Wilson, 19995 See Stemen, Rengifo, Wilson, 2005
According to a 1999 Bureau of Justice Statistics report, only a few states required nonviolent offenders to serve a substantial portion of their sentences, similar to Arizona.
Office of the Auditor General
page 25

report found that states that controlled both sentencing and release decisions through presumptive sentencing and abolishing discretionary parole, such as Arizona after 1993, had lower incarceration rates and smaller growth in incarceration rates.
The Vera report also found that states with more mandatory sentences have higher incarceration rates. The report noted that mandatory sentencing laws may not lead directly to increased incarceration, but likely act as proxies for a state’s general approach to sanctioning offenders. Specifically, mandatory sentences may lead to higher incarceration rates because they can provide prosecutors additional leverage in plea bargains.1 Literature further suggests that mandatory sentences are applied only in a few cases and are instead used by prosecutors to obtain a conviction through plea bargaining that does not have a mandatory penalty attached.2 In Oregon, for example, incarceration rates have increased, but more offenders were convicted for nonmandatory offenses while convictions under mandatory sentencing statutes have declined.3 Although a 1992 Department of Corrections (Department) study reported that mandatory sentencing had caused a buildup of longer-term offenders in the prison system, a 2010 Arizona Prosecuting Attorneys’ Advisory Council report indicated that only 25 percent of the prison population was incarcerated with mandatory or flat term sentences as of September 30, 2009.4,5,6
Finally, although it was thought that truth in sentencing would require inmates to serve longer in prison, other changes instituted when Arizona adopted truth in sentencing have diminished its expected impact. Specifically, when Arizona adopted the 85 percent truth-in-sentencing requirement in 1993, it also shortened sentences for nondangerous offenders without two or more prior felony convictions. As shown in Table 5 (see page 27), auditors’ analysis of department admissions data indicates that median sentence lengths have generally decreased for several nonviolent and violent crimes (except for homicide, manslaughter, and sexual assault) since adopting truth in sentencing. However, although median sentence lengths for several nonviolent crimes have decreased, truth in sentencing has meant that actual time served in prison for nonviolent offenses has not changed appreciably. According to auditors’ analysis of inmates released from prison between 1990 and 2009, inmates sentenced for nonviolent offenses committed before 1994 served a median of 2 years in prison, while inmates sentenced for nonviolent offenses committed in or after 1994 served a median of 1.9 years. In contrast, the actual time served for violent offenses has decreased from a median of 4.8 years for offenses committed before 1994 to a median of 2.6 years for offenses committed in or after 1994. Thus, for offenders sentenced under truth in sentencing, the typical violent offender spends only a few months longer in prison than the typical nonviolent offender.
1 Merritt, Fain, & Turner, 20062 Ulmer, Kurlychek, & Kramer, 2007; Tonry, 20093 Merritt, Fain, & Turner, 20064 See Fischer & Thaker, 19925 See Fischer, 20106 Flat term sentences are a form of mandatory sentencing that require the offender to serve 100 percent of the imposed
sentence.
Since adopting truth in sentencing, the median time violent offenders serve in prison is only a few months longer than the median time nonviolent offenders serve in prison.
State of Arizona
page 26

Other potential sentencing law changes have been under study for many years
The Legislature has been studying whether to change Arizona’s sentencing laws as far back as 1991, and an ad hoc committee in the House of Representatives (House) studied this issue in 2009 and 2010. Various organizations have issued reports calling for changes that would address the State’s growing prison population and set up other ways to equitably hold offenders accountable for their crimes. For example:
• In a 1991 report that the Arizona Legislative Council commissioned, the Institute for Rational Public Policy recommended that the Legislature repeal all mandatory sentencing provisions, replace presumptive sentences with presumptive guidelines, and create a sentencing commission to establish the guidelines.1
• In 2004, Families Against Mandatory Minimums recommended that the Legislature give judges authority to set aside mandatory prison sentences, make drug court an option for all nonviolent offenders with underlying substance abuse problems, provide alternatives to prison for drunk drivers, make probation
1 Institute for Rational Public Policy, 1991
Office of the Auditor General
page 27
Table 5: Median Sentence Lengths for Admitted Offenders by Offense Type, in Years1 Calendar Years 1990, 1993, 1996, 1999,2002, 2005, and 2008(Unaudited)
1 The analysis includes admissions resulting from new court commitments, except for inmates sentenced to life in prison.
Source: Auditor General staff analysis of department prison admissions data.
1990 1993 1996 1999 2002 2005 2008
Violent Crimes
Assault 5.00 5.00 3.50 3.50 3.00 3.00 3.50
Homicide 15.00 15.00 17.25 16.00 16.00 14.50 16.00 Manslaughter 7.50 9.00 10.00 10.50 10.50 10.50 10.50 Robbery 7.00 7.00 5.00 5.00 5.00 5.00 7.00 Sex Offender 10.00 10.00 10.00 6.00 5.00 6.00 5.00 Sexual Assault 10.00 10.00 7.50 10.00 8.00 10.00 10.00 Weapons Offense 4.00 4.00 2.50 2.50 2.50 2.50 2.50
NNonviolent Crimes
Burglary 5.00 5.00 3.00 3.00 2.50 2.50 2.50 Drugs 5.00 4.00 2.50 2.50 3.00 2.50 2.50 DUI 0.50 0.50 0.33 0.33 0.33 0.33 0.33 Forgery-Fraud 5.00 5.00 2.50 2.50 2.50 2.50 2.50 Theft 4.00 5.00 2.75 2.50 2.25 1.75 1.75

a sentencing option for more nonviolent offenders, and use alternatives to prison for probation violators.1,2
• In 2005, the Alternatives to Sentencing Workgroup formed by the House and comprising nine house members made similar recommendations, which included allowing judges to ignore mandatory penalties for some offenders, creating a sentencing commission, reforming truth-in-sentencing laws for nonviolent first-time offenders, and expanding the use of alternatives to prison such as treatment, drug courts, and electronic monitoring.3,4
The House is again reviewing the need for sentence reform. In 2009, it formed an ad hoc Committee on Sentencing comprising six house members to “review and assess Arizona’s sentencing laws and evaluate the purpose, history, and evidence of effectiveness of the laws regarding criminal sentencing.” The committee is charged with reporting its findings and recommendations for improving Arizona’s sentencing laws to the Speaker of the House on or before November 1, 2010. Since its formation, the committee has held two meetings, one in December 2009 and the other in May 2010. At these meetings, the committee has received testimony from various stakeholders regarding Arizona’s prison population, the impact of mandatory sentences and truth in sentencing, and areas in which the Legislature could make changes to reduce the prison population. Members of the committee have also met with stakeholder groups and received and reviewed applicable literature.
Options to divert nonviolent, low-risk offenders from prison or reduce time they serve could be expanded
Although Arizona voters and the Legislature have taken steps to divert some nonviolent, low-risk offenders from prison or reduce the time served in prison, the Legislature could consider expanding these efforts to further address prison population growth, some of which may require changes to the State’s sentencing laws. Specifically, Arizona voters passed Proposition 200 in 1996, which requires some nonviolent drug offenders to be sentenced to probation and treatment rather than prison. The Legislature could consider expanding this program by diverting more nonviolent, low-risk offenders to nonprison alternatives (see Chapter 4, pages 37 through 46, for more information). Additionally, the Legislature established an early release program in 2003 for nonviolent, low-risk offenders and could consider other early release options, such as reducing the time served requirement for nonviolent, low-risk offenders and establishing earned time credits.
1 See Greene & Pranis, 20042 Families Against Mandatory Minimums is a nonpartisan, nonprofit organization that promotes judicial sentencing
discretion.3 Alternatives to Sentencing Workgroup, 20054 With regard to its recommendation to reform truth-in-sentencing laws for nonviolent first-time offenders, the Workgroup’s
report did not include specific criteria for defining nonviolent first time offenders, although it stated the recommendation particularly applied to women offenders.
A House of Representatives ad hoc committee reviewed Arizona’s sentencing laws during 2009 and 2010.
State of Arizona
page 28

If the Legislature expands diversion or early release options, it also should consider taking the following steps:
1. Further defining diversion and/or early release eligibility criteria for other nonviolent, low-risk offenses in statute; and/or
2. Ensuring the use of valid and reliable risk assessment tools in determining offender eligibility for these options.
Diversion opportunities could be expanded to more nonviolent, low-risk offenders—In 1996, Arizona voters passed Proposition 200, adding Arizona Revised Statutes (A.R.S.) §13-901.01, which requires nonviolent persons convicted of a first or second offense for the personal possession or use of drugs to be sentenced to probation and mandatory treatment. According to a 2004 Vera report, Arizona’s law was the nation’s first successful effort to replace incarceration with treatment for some substance-abusing offenders.1 According to a 2006 Arizona Supreme Court report, an estimated 1,072 offenders were diverted to probation and treatment in fiscal year 2005, resulting in an estimated $11.7 million in net costs avoided.2,3 The Legislature could consider this same approach for other nonviolent, low-risk offenders, particularly those whose crimes are related to substance abuse. As illustrated in Table 1 (see page 5), offenders convicted of property crimes, such as burglary, theft, and fraud, made up 23 percent of the inmate population as of December 31, 2009, and these crimes are often associated with drugs.
Expanding diversion may require sentencing law changes—In order to divert more nonviolent, low-risk offenders from prison, the Legislature may need to consider revising some of the State’s sentencing laws. Specifically, the Legislature could consider revising some sentencing laws to allow nonviolent, low-risk offenders to be diverted to nonprison alternatives. Revising these laws would allow judges to consider individual cases in determining whether prison or some alternative such as treatment would be more appropriate for the offender. Other states have taken steps to divert a wider range of nonviolent, low-risk offenders from prison. For example:
• Similar to Arizona, Hawaii passed legislation in 2002 requiring probation with treatment for first-time, nonviolent offenders convicted of drug possession or use. However, Hawaii later expanded the availability of diversion to treatment for first-time, nonviolent drug offenders with prior nondrug convictions in 2004 and for first-time property offenders whose offense was committed in response to substance abuse problems in 2006.
1 See Wool & Stemen, 20042 Arizona Supreme Court, Administrative Office of the Courts, Adult Probation Services Division, 2006 3 The estimate is based on marginal costs (department costs to house, feed, and supervise one additional inmate) for
state-operated prisons, the full per capita costs for private prisons, and probation costs. It assumes that one-third of the diverted offenders would have been sent to state-operated prisons and two-thirds would have been sent to private prisons. The estimated net costs avoided had all diverted offenders been sent to state-operated prisons was more than $1.4 million. The estimated net costs avoided had they all been sent to private prisons was approximately $16.9 million.
Arizona law diverts some nonviolent drug offenders to probation and treatment.
Office of the Auditor General
page 29
• Florida passed legislation in 2009 that requires courts to sentence nonviolent, low-risk offenders to a new diversion program unless they pose a risk to the public. This law is not limited to drug offenders.
• New York passed legislation in 2009 that reformed its drug laws. These reforms included providing discretion to judges to place convicted drug offenders into treatment; diverting people who have committed crimes other than a drug offense but whose crime was related to substance abuse; and providing diversion eligibility to some second-time repeat offenders.
If the Legislature decides to divert more offenders to alternatives other than prison, it could consider expanding the availability of these alternatives. Chapter 4 discusses potential nonprison alternatives that the Legislature might consider in more detail (see pages 37 through 46).
Legislature could consider expanding early release alternatives—The Legislature enacted Laws 2003, Ch. 256, which established an early release program for nonviolent, low-risk drug offenders who make satisfactory progress in their individualized corrections plans, maintain civil behavior, and meet other criteria. Inmates who participate in this program are released 3 months earlier than they otherwise would be under truth in sentencing and receive a variety of services, including substance abuse treatment, transitional housing, education and employment services, help in accessing social services, and mentoring relationships. At the end of the 3 months, they are placed on regular community supervision to complete the remaining 15 percent of their sentence. According to department reports, the number of participating inmates grew from approximately 500 offenders in calendar year 2005 to approximately 1,000 offenders in fiscal year 2009, and most participants successfully complete the 3-month early supervised release and continue their term of community supervision (896 inmates successfully completed the supervised early release during fiscal year 2009, while only 72 inmates did not complete it). In addition, A.R.S. §31-285 requires the program to result in a cost reduction of at least $17 per inmate, per day.
In April 2010, the Legislature amended A.R.S. §31-281 to expand program eligibility to include all nonviolent, low-risk offenders who have not been convicted of a sexual offense, arson, or driving under the influence. The Department expects the number of eligible offenders to double based on this law change.
The Legislature could consider other alternatives for expanding early release to reduce the amount of time nonviolent, low-risk offenders serve in prison. There is always a risk that an offender will commit new crimes once released from prison. However, according to a 2002 Bureau of Justice Statistics study, the deterrent effect of incarceration on recidivism is mixed.1 The study, which measured recidivism rates for prison inmates from 15 states who were released in 1994, found that recidivism rates (measured as rearrest within 3 years of release) did not
1 See Langan & Levin, 2002
The Legislature enacted a 3-month early release program for certain nonviolent, low-risk offenders.
State of Arizona
page 30

Office of the Auditor General
page 31
differ significantly for anyone serving less than 5 years in prison.1 However, there was a significant reduction in recidivism for inmates serving more than 5 years. The study also found no evidence that spending time in prison raises the recidivism rate. A 2008 National Council on Crime and Delinquency review of more than 12-peer reviewed articles or reports on early release programs and their effect on recidivism found no significant difference in rates of recidivism among accelerated release and full-term prisoners, and, in some cases, early release prisoners had lower recidivism rates.2 These results have led at least one group of advocates to conclude that modest changes in the length of stay, such as reducing it by a few months, likely would have no impact on recidivism rates or aggregate level crime rates.3
Additional alternatives that the Legislature might consider for early release include:
• Reducing time served requirements for nonviolent offenders—The Legislature could consider revising truth-in-sentencing laws to reduce the amount of time that nonviolent, low-risk offenders must serve in prison. As previously discussed (see page 25), truth-in-sentencing laws that most states adopted generally focused on violent offenders, and only a few states required both violent and nonviolent offenders to serve a substantial portion of their sentences, similar to Arizona. At least one of these states has revised its policy for nonviolent offenders. Like Arizona, Mississippi abolished discretionary parole as a release mechanism and required all offenders to serve 85 percent of their sentences when it adopted truth in sentencing in 1995. However, in 2001, it reinstated parole eligibility for first-time, nonviolent offenders and, in 2008, expanded eligibility to all offenders never convicted of a violent crime or a crime with an enhanced penalty regardless of the number of prior convictions. These inmates are eligible for parole after serving 25 percent of their sentence (although there are minimum-time-served requirements for inmates with shorter sentences). The law took effect in July 2008, and was applied retroactively for nonviolent offenses committed after June 30, 1995. According to a 2010 Pew Center on the States report, 3,076 prisoners were released between July 2008 and August 2009.4 These inmates served a median of 13 months’ less time in prison than they would have under the previous truth-in-sentencing requirements. According to Mississippi Department of Corrections staff, this has resulted in costs savings—its parole costs were $1.55 per day in fiscal year 2009 while its prison costs were between $36.67 and $41.61 per day. Moreover, the Mississippi Department of Corrections reported that between January 31, 2009 and January 31, 2010, the state’s prison population decreased by 1,360, although it had been expected to increase by 1,000 before revising the truth-in-sentencing laws.
1 The analysis included only offenders leaving prison for the first time since the beginning of their sentence. It excluded offenders who left prison in 1994 but who had previously been released under the same sentence and had returned to prison for violating the conditions of release.
2 See Guzman, Krisberg, & Tsukida, 20083 Austin & Fabelo, 20044 See Pew Center on the States, 2010
Mississippi has revised its truth-in-sentencing laws for nonviolent offenders.
State of Arizona
page 32
Arizona could potentially realize a reduction in its prison population and corrections spending if it similarly revised its truth-in-sentencing requirements. The Legislature could reinstate discretionary parole release for nonviolent offenders similar to Mississippi. However, as noted previously, the 2005 Vera report suggested that reestablishing discretionary parole could lead to higher incarceration rates.1 Alternatively, the Legislature could reduce the 85 percent time-served requirement for nonviolent, low-risk offenders. For example, if the Legislature reduced the time served requirements for nonviolent, low-risk offenders to 50 percent instead of 85 percent, actual time served would be reduced by 10.5 months based on a 2.5-year sentence. For every day that an inmate spends on community supervision (parole) rather than prison, the State would save an estimated $4.62, which represents the difference between the daily marginal cost of housing an inmate in a state-operated prison compared to supervising an inmate on parole in fiscal year 2009.
• Creating earned time credits—Another approach would be for the Legislature to authorize earned time credits for inmates. According to a 2009 National Conference of State Legislatures report, earned time credits are reductions to the portion of a sentence that must be served in prison that inmates can earn for completing education, vocational training, treatment, or work programs or participating in other productive activities.2 Earned time credits are different from, and can be offered in addition to, “good time” credits that are given for following prison rules (such as the credits that allow Arizona offenders to serve 15 percent of their sentences on community supervision). According to the report, at least 31 states offer earned time credits to inmates. Earned time credits are usually made available to lower-risk offenders, and the typical range for a credit is between 30 and 120 days. For example, Kansas offers a 60-day earned time credit for successfully completing substance abuse treatment, a general education diploma, a technical or vocational training program, or any program that the secretary of corrections believes will reduce an inmate’s risk of violating release conditions. Texas offers 10 to 30 days for each month an inmate works or participates in educational, vocational, or rehabilitation programs while in prison.
Legislative options may require further action—If the Legislature expands diversion or early release options, it should also consider taking the following steps:
• Defining offender eligibility—Similar to A.R.S. §13-901.01, which requires diversion for first or second drug use or possession offenses, the Legislature could consider further defining diversion and/or early release eligibility criteria for other nonviolent, low-risk offenses in statute. Other states have made other crimes eligible for diversion, including first-time property offenders whose offense involved substance abuse, low-level offenders whose drug and
1 See Stemen, Rengfio, & Wilson, 20052 See Lawrence, 2009
According to the National Conference of State Legislators, 31 states offer earned time credits that reduce the time inmates who participate in rehabilitative and productive activities serve in prison.

alcohol use contributed to the criminal activity, and other nonviolent, low-risk offenders.
• Ensuring the use of valid and reliable risk assessment tools—In addition to or instead of defining offender eligibility in law, the Legislature could consider ensuring the use of a valid and reliable risk assessment tool to determine offender eligibility for diversion and/or early release. According to a 2007 report prepared for the Crime and Justice Institute and the National Institute of Corrections, assessing an offender’s level of risk and criminogenic needs through both the use of an actuarial tool and sound professional judgment is important for determining an offender’s suitability for diversion.1 Additionally, according to the Justice Policy Institute, a growing number of states are beginning to use actuarial risk and needs assessments in various parts of the criminal justice system.2 For example, according to a 2007 evaluation, Virginia uses an actuarial risk assessment in conjunction with the state’s voluntary sentencing guidelines to divert 25 percent of nonviolent, prison-bound offenders with the lowest risk of recidivating.3 Finally, both the county probation departments and the Department have developed risk assessment tools. The county probation departments use the offender screening tool (OST) to assess a defendant’s risk of reoffending and criminogenic needs and make diversion recommendations in the pre-sentencing reports prepared for the judges. They also use the field reassessment offender screening tool (FROST) to reassess probationers. The Department has developed a tool for assessing an offender’s risk of recidivism that it uses to determine initial supervision levels for inmates released to the community, to help determine eligibility for the 3-month early release program, and to rank offenders for in-prison programming (see text- box, page 34). The Department also uses the FROST to determine community supervision levels. According to Administrative Office of the Courts and department officials, these tools may be appropriate for determining offender eligibility for expanded diversion and/or early release options.
Based on the Department’s assessment of offender risk, auditors identified a number of inmates in the prison population on December 31, 2009, who appear to be at a lower risk for committing new felony offenses. Specifically, auditors identified 3,538 inmates (nearly 9 percent of the prison population) who have never been sentenced to prison for a violent offense, whose recidivism risk scores are 3 or less (considered lower risk by the Department), and who were incarcerated for less serious offenses (offense classes 4, 5, or 6). Crimes for which these offenders were convicted include drug offenses, burglary, driving under the influence, forgery/fraud, and theft. Although the number of offenders is a relatively small percentage of the overall prison population, consistently diverting even a small number of low-risk offenders from prison could have a significant impact on the prison population over time. It could also reduce prison costs. Estimated marginal prison costs for the
1 See Warren, 20072 Justice Policy Institute, 20103 See Kleiman, Ostrom, & Cheesman, 2007
Auditors identified 3,538 nonviolent inmates who appear to be at a lower risk for committing new felony offenses.
page 33
Office of the Auditor General
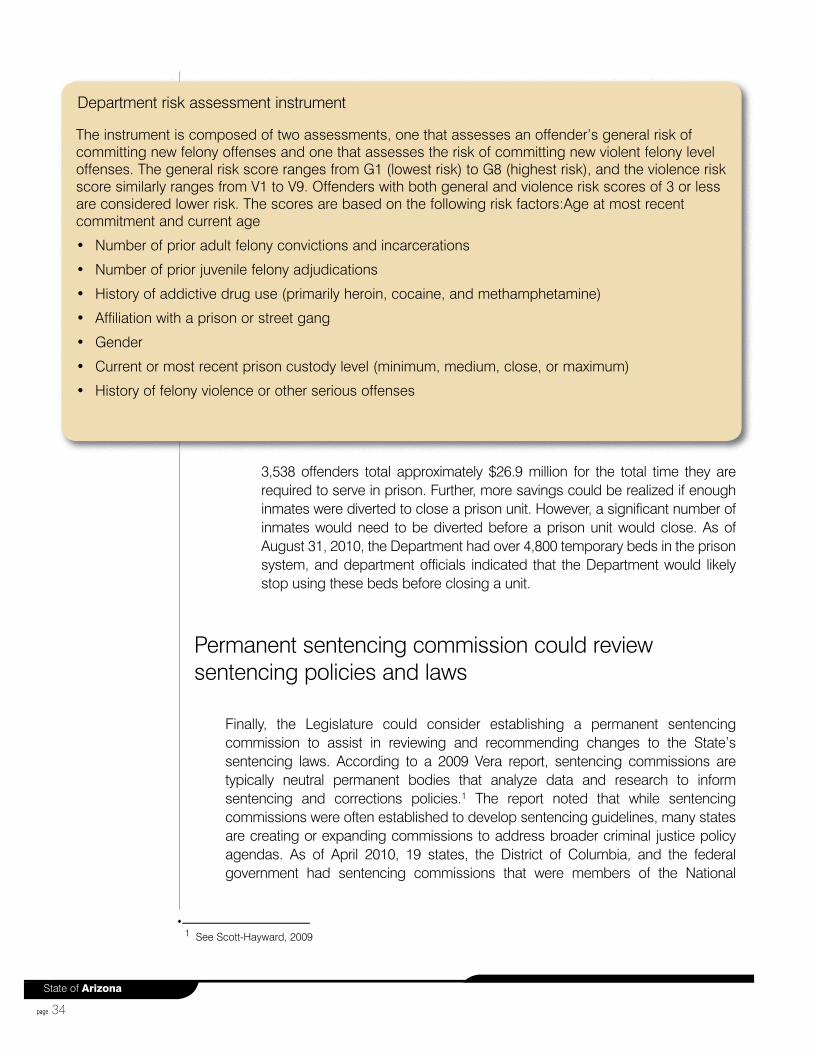
State of Arizona
page 34
3,538 offenders total approximately $26.9 million for the total time they are required to serve in prison. Further, more savings could be realized if enough inmates were diverted to close a prison unit. However, a significant number of inmates would need to be diverted before a prison unit would close. As of August 31, 2010, the Department had over 4,800 temporary beds in the prison system, and department officials indicated that the Department would likely stop using these beds before closing a unit.
Permanent sentencing commission could review sentencing policies and laws
Finally, the Legislature could consider establishing a permanent sentencing commission to assist in reviewing and recommending changes to the State’s sentencing laws. According to a 2009 Vera report, sentencing commissions are typically neutral permanent bodies that analyze data and research to inform sentencing and corrections policies.1 The report noted that while sentencing commissions were often established to develop sentencing guidelines, many states are creating or expanding commissions to address broader criminal justice policy agendas. As of April 2010, 19 states, the District of Columbia, and the federal government had sentencing commissions that were members of the National
1 See Scott-Hayward, 2009
Department risk assessment instrument
The instrument is composed of two assessments, one that assesses an offender’s general risk of committing new felony offenses and one that assesses the risk of committing new violent felony level offenses. The general risk score ranges from G1 (lowest risk) to G8 (highest risk), and the violence risk score similarly ranges from V1 to V9. Offenders with both general and violence risk scores of 3 or less are considered lower risk. The scores are based on the following risk factors:Age at most recent commitment and current age
• Number of prior adult felony convictions and incarcerations
• Number of prior juvenile felony adjudications
• History of addictive drug use (primarily heroin, cocaine, and methamphetamine)
• Affiliation with a prison or street gang
• Gender
• Current or most recent prison custody level (minimum, medium, close, or maximum)
• History of felony violence or other serious offenses

Association of Sentencing Commissions, and at least 4 other states had adopted sentencing commissions as well.
Sentencing commissions in other states perform a variety of functions. For example, Virginia tasked its sentencing commission with developing discretionary sentencing guidelines; developing an offender risk assessment instrument for assessing felons’ risk to the public; preparing guidelines for sentencing courts to use in determining appropriate candidates for alternative sanctions; monitoring sentence lengths, crime trends, correctional facility population trends, and correctional resources; and making recommendations regarding correctional capacity and resource needs. Washington’s sentencing commission is similarly responsible for evaluating sentencing policies and practices and recommending modifications to the governor and legislature. It conducts ongoing research of recidivism, disparities in sentencing, prison and jail capacity, deterrence, drug policy, and sentence enhancements for weapons-related crime.
Arizona has made some efforts to establish a sentencing commission in the past. Laws 2002, Ch. 311, created a temporary sentencing commission charged with reviewing the State’s sentencing practices and making recommendations for changes by December 31, 2003. The commission was also charged with reviewing class 6 felonies and considering whether any should be repealed or reclassified. This commission comprised 27 members representing all three branches of government, various members of the criminal justice system, and the community. However, the commission disbanded before submitting its final report. The Legislature establishing a permanent sentencing commission (with a similar membership to ensure all criminal justice stakeholders’ participation) is one option for taking long-term action in this area. Possible functions or responsibilities of a state sentencing commission could include reviewing and recommending changes to the State’s sentencing laws, determining eligibility criteria for diversion, recommending guidelines for determining appropriate candidates for alternative sanctions, and monitoring reform results to ensure they are having the intended effect.
Office of the Auditor General
page 35

State of Arizona
page 36
Option 3—Expanding use of nonprison alternatives to slow or reverse prison population growth
A third option for addressing prison population growth is to expand the use of nonprison alternatives for nonviolent, low-risk offenders—a step that, similar to revising sentencing laws, could limit or reverse growth in the number of inmates. Like all states, Arizona uses probation as an alternative to prison. Auditors identified both counties and other states that have expanded their nonprison alternatives to include forms of substance abuse treatment (in addition to drug court), home arrest with electronic monitoring, or day reporting centers. Arizona could use similar alternatives in lieu of prison sentences or in conjunction with earlier release from prison. Although the Department of Corrections (Department) and the courts have statutory authority to establish nonprison alternatives, the Legislature could consider directing the Department and/or courts to further study the use and costs of nonprison alternatives to identify the right mix of these alternatives for Arizona. Additionally, depending on whether the Legislature provides funding for expanded nonprison alternatives and which alternatives are expanded, some statutes will need to be revised, such as the home arrest statute.
Arizona uses probation as nonprison alternative
Similar to other states, many Arizona felony offenders are sentenced to probation in lieu of prison or as part of their sentence. Although probation serves as an alternative to prison, probationers who violate the terms of their probation can be sent to prison or jail, and, according to the Department, approximately 14 percent of fiscal year 2010 prison admissions were probation violators. Additionally, in some cases, probationers also participate in drug court programs, which provide monitoring and
Approximately 14 percent of prison admissions in fiscal year 2010 were probation violators.
Office of the Auditor General
page 37
Chapter 4

drug treatment services, and impose other requirements on offenders charged with or convicted of drug- or alcohol-related crimes.
Probation serves as nonprison alternative—Like all states, Arizona uses probation as an alternative to prison. Probation is a criminal sentence in which an offender agrees to fulfill certain court-mandated conditions and remains in the community under supervision instead of serving time in jail or prison. These conditions typically include a probation officer’s supervision, fines, participation in treatment programs, community service, restitution, or other activities. Arizona has three types of probation: standard, intensive, and administrative (see textbox). The State’s adult probation system is decentralized and operates under the jurisdiction of Arizona counties, each of which maintains a separate probation department.
Arizona courts sentence the majority of felony offenders to probation for at least part of their sentence, and many offenders sentenced to probation also serve some time in jail or prison. A felony offender is eligible for probation if a sentence of probation is not prohibited by law. According to the Arizona Superior Court’s case activity report for fiscal year 2009, approximately 44 percent of the State’s felony cases resulted in a sentence of only probation, 20 percent resulted in probation with jail time, and 4
percent resulted in probation with prison time. As of May 31, 2010, almost 84,500 offenders were involved with the probation system (see textbox).
Probation violations can lead to jail or prison—If a probationer violates the court’s conditions, the court can revoke probation and impose a new sentence sending the probationer to jail or prison. According to the Department, probation violators accounted for approximately 14 percent of prison admissions in fiscal year 2010, and, based on auditors’ analysis, almost 8 percent of the prison population
State of Arizona
page 38
Probation types
Standard Probation—Offenders placed on standard probation are under the care and control of the court and are supervised by probation officers. Offenders typically must report to a probation officer, maintain employment, pay fees or fines, and pay restitution.
Intensive Probation—Offenders placed on intensive probation are those who would otherwise have been sent to prison at initial sentencing or for a technical violation of standard probation. Offenders must comply with strict control, surveillance, and supervision of their movement and activities in the community.
Administrative Probation—Offenders on administrative probation are not directly supervised by probation officers because of incarceration in jail or prison, having absconded or been deported, or being placed on unsupervised probation at sentencing.
Probation Populations as of May 31, 2010
Standard 44,189 Intensive 2,226 Administrative 38,053 Total 84,468
Source: Auditor General staff analysis of Fiscal Year 2010 Monthly Statistics, Statewide Population obtained from the Administrative Office of the Courts Web site; see http:/www.azcourts.gov/apsdMonthlyStatistics.aspx
as of December 31, 2009, consisted of inmates who had violated the terms of their probation.
In 2008, the Legislature took action to reduce the number of probation revocations by providing Arizona counties with a financial incentive to keep offenders on probation. Laws 2008, Ch. 298, requires the Legislature to appropriate funding to counties that reduce their total probation revocations and probation revocation rates for new felony offenses using fiscal year 2008 revocation rates as a benchmark. Specifically, the law requires the Legislature to appropriate 40 percent of any cost savings resulting from reduced probation revocations and reduced probation revocation rates for new felony offenses to eligible counties beginning in fiscal year 2011. Statute also requires counties to use these monies to provide substance abuse treatment and other risk reduction programs and interventions for probationers, and to provide grants to nonprofit victims’ services groups that partner with the county probation departments to assist victims and increase restitution payments collected from probationers. In fiscal year 2009, according to the Joint Legislative Budget Committee, eight counties met both reduction requirements resulting in a cost savings of just over $6 million, of which approximately $2.4 million should be allocated to the counties for fiscal year 2011. However, because of budget considerations, the Legislature passed Laws 2010, 7th S.S., Ch. 6, §29, which suspends the requirement to allocate the funding to the counties in fiscal year 2011.
Probation can involve drug court—Some probationers also participate in drug court programs. Drug courts are voluntary programs that combine the efforts of judges, probation departments, and treatment providers into a coordinated intervention for offenders charged with or convicted of drug-related crimes. Drug courts provide supervision, drug testing, and treatment services such as counseling and education, and participants must follow certain rules such as abstaining from drugs and alcohol. Arizona has adult drug courts in nine counties, and the Superior Court in which the programs operate determines program eligibility.1 According to the Fiscal Years 2009-2011 Master List of State Government Programs, there were 1,154 adult participants sentenced to drug court and 389 drug court graduates in fiscal year 2009. Some counties also have similar programs for offenders convicted of driving under the influence or domestic violence or who have mental health issues. The literature on the overall effectiveness of drug courts is mixed, suggesting that its success may be limited to specific interventions, outcomes, or participants.2 However, researchers have evaluated individual drug courts in Coconino and Yuma Counties and identified several positive outcomes, including lower recidivism and drug-use rates. Additionally, a 2005 U.S. Government Accountability Office evaluation of eight drug court programs, including Maricopa County’s drug court, found that while recidivism was reduced, other results, such as treatment outcomes and cost reductions,
1 These counties are Cochise, Coconino, Gila, Maricopa, Navajo, Pima, Pinal, Yavapai, and Yuma.2 See Banks & Gottfredson, 2003; Gottfredson, Najaka, & Kearley, 2003; Shaffer, 2006; Wilson et al., n.d.
Drug courts are voluntary programs that coordinate interventions for offenders charged or convicted of drug-related crimes.
Office of the Auditor General
page 39

were mixed.1 In addition, this evaluation found that drug court programs tend to be more expensive than conventional case processing.
Nonprison alternatives could take several forms
In addition to probation, auditors identified a number of counties and other states that have implemented other nonprison alternatives in an effort to reduce their prison populations. Advocates suggest that providing nonprison alternatives provides several benefits. This section discusses three of these alternatives and any recognized costs and benefits: (1) expanding treatment alternatives in conjunction with or beyond drug courts, (2) expanding home arrest with electronic monitoring, and (3) establishing day reporting centers. These or other alternatives could be used in lieu of prison sentences or in conjunction with earlier release from prison.
Nonprison alternatives may offer benefits other than reducing prison populations—In addition to potentially reducing or slowing prison population growth, nonprison alternatives may provide other benefits. Specifically, keeping offenders in the community rather than behind bars allows them to maintain family ties, be employed, and perhaps regain their place in the community.2 Advocates of alternative sanctions also argue that nonprison alternatives are an effective solution that reduces crime and recidivism and are a better investment for tax- payer dollars.3 However, the scientific research does not fully support this claim. Specifically, testimony presented on July 10, 2009, before the United States Sentencing Commission on the effectiveness of alternative sanctions concluded that no definitive statements can be made on the comparative effectiveness of alternative sanctions to incarceration, but a recent meta-study suggested there is promise.4 Despite the mixed effects for alternatives, some states are using alternative sanctions, especially for low-risk offenders.
Substance abuse treatment could be expanded—Some states, such as Texas, Virginia, Vermont, and Kansas, have expanded substance abuse treatment alternatives beyond drug courts in an effort to reduce prison admissions and prevent recidivism. For example:
• Texas—Texas has received national attention for its efforts to divert some offenders from prison to treatment alternatives. According to a 2007 Council of State Governments Justice Center report, in 2007, the state projected a need for 14,000 additional prison beds by 2012.5 Building and operating new prison facilities to meet this growth was estimated to cost $523 million for fiscal years 2008 and 2009 alone. Instead of building new prison facilities, the Texas
1 U.S. Government Accountability Office, 20052 Demlietner, 20053 Drake, Aos, & Miller, 20094 See Byrne, 2009; Also see Drake, Aos, & Miller, 20095 Council of State Governments Justice Center, 2007
Some states are using nonprison alternatives, especially for low-risk offenders.
State of Arizona
page 40
Legislature appropriated $241 million to expand substance abuse treatment and prison diversion programs in order to address two of the state’s contributing factors to prison population growth—substance abuse and probation and parole revocations. According to a 2009 Council of State Governments Justice Center report, this expansion included 800 residential treatment beds and 3,000 outpatient treatment slots for probationers; 2,200 treatment slots for jail and prison inmates; and 1,250 transitional treatment center beds for offenders transitioning from institutional treatment programs.1 In addition to these programs, Texas also funded 1,500 beds as part of a residential treatment program for probationers and parolees who violate the conditions of their supervision because of substance abuse problems. This program includes 6 months of treatment in a secure facility, followed by 3 months in a transitional treatment center, and 3 to 9 months of outpatient counseling.
These treatment and diversion programs have helped Texas reduce its prison population. According to a March 2010 Council of State Governments Justice Center presentation to the Texas House Corrections Committee, Texas’ year-end 2009 prison population was about 1,000 inmates fewer than in September 2007 and about 9,000 inmates fewer than it had been projected to be. Moreover, according to prison population projections Texas’ Legislative Budget Board released for fiscal years 2010 through 2015 in June 2010, the state’s prison population is expected to remain below its prison operational capacity through fiscal year 2015, assuming no additional changes to its treatment and diversion programs. Because of the reduced prison population, Texas has been able to cancel contracts with county jails to house prisoners, which has resulted in annual savings of approximately $36 million. Additionally, according to the March 2010 presentation, offenders diverted from prison represent $292 million in avoided annual incarceration costs; about 2,000 more low-risk offenders had been released on parole one year after the reform, but parole revocations had declined by 27 percent since 2006; and the felony probation population has increased by about 8 percent since before the reform, but the yearly probation revocation rate has stayed about the same at 7.5 percent.
Arizona could consider expanding substance abuse treatment alternatives, either by expanding the use of drug courts and/or establishing additional substance abuse treatment alternatives. These additional alternatives could include counseling services, in-patient beds, and secure residential treatment beds.
Home arrest with electronic monitoring could be expanded—The use of home arrest with electronic monitoring for nonviolent, low-risk offenders is almost nonexistent in Arizona (see textbox for definitions, page 42). Although Arizona Revised Statutes (A.R.S.) §41-1604.13 allows the Board of Executive Clemency to release certain nonviolent, first-time offenders to home arrest with electronic monitoring, statute limits its use to persons who committed offenses
1 Council of State Governments Justice Center, 2009.
Texas has expanded substance abuse treatment and prison diversion programs to address prison population growth.
Office of the Auditor General
page 41

before 1994. According to a department official, only three inmates were serving time on home arrest as of June 30, 2010.
Some states that use home arrest with electronic monitoring have reduced corrections spending without negatively impacting recidivism. For example:
• Florida—Florida began using home arrest with electronic monitoring in 1983 as an alternative to parole for offenders who needed more intensive supervision after prison as well as for offenders who violated conditions of their probation and would otherwise be sent to prison. According to the Florida Department of Corrections (FDOC), the program is less expensive than prison and allows offenders to remain active community members who can work to assist their families and pay victim restitution. Further, according to a 2000 FDOC study, offenders on home arrest did not pose any greater risk to the community than probationers—both groups had reoffense rates of about 15 percent after 2 years.
In an effort to reduce state spending on prison costs, a 2009 Florida Office of Program Policy Analysis and Government Accountability (OPPAGA) report recommended the state expand various alternative sanctions, including home arrest. The report estimated that about 350 additional offenders projected to be sentenced to prison for probation violations might be eligible for home arrest with electronic monitoring and other nonprison sanctions. OPPAGA said if this were the case, the state would save $5.7 million annually because the average cost to incarcerate an inmate in Florida is $16,410 per year, whereas the cost to monitor an inmate on home arrest in the state is only $2,730 to $5,285 per year, depending on the type of electronic monitoring device used.
According to the Florida Department of Corrections, Florida’s home arrest program is less expensive than prison.
State of Arizona
page 42
Home Arrest—A sanction that requires inmates to remain at their place of residence at all times except for movement outside the residence for mandated reasons, such as employment or drug screening. In Arizona, home arrest is conditioned on electronic monitoring surveillance, participation in employment and other beneficial activities, and submission to alcohol and drug tests.
Electronic Monitoring (EM)—A sanction that typically requires offenders to wear a wrist or ankle bracelet or global positioning unit, use voice verification systems, or wear or breathe into alcohol testing devices. EM may be passive, such as requiring an offender to answer the telephone and verify his/her presence at home, or active, emitting a constant signal to a home-monitoring device that communicates the inmate’s location to a central computer. Although often used with home arrest, EM is also used with other forms of offender supervision such as probation or parole.
Source: Auditor General staff review of A.R.S. §41-1604.13(D) and the National Law Enforcement and Corrections Technology Center October 1999 bulletin.

• Mississippi—A judge can sentence offenders in Mississippi to home arrest with electronic monitoring, or the Mississippi Department of Corrections (MDOC) can place offenders on this sanction after they are sentenced to prison. In fiscal year 2009, nearly 1,200 offenders were serving time on home arrest in the state at a cost savings of nearly $29 per offender per day (prison costs an average of $40.68 per day whereas home arrest costs $11.74 per day in Mississippi). MDOC officials believe home arrest is a safe and effective program and told auditors they are actively trying to expand the program to alleviate pressure on the prison system.
Expanding home arrest in Arizona has been considered in recent years. The January 2009 Appropriations Chairmen Budget Options report for fiscal years 2009 and 2010 proposed revising eligibility criteria to expand the State’s home arrest program. The Department reported in April 2009 that almost 2,500 offenders—935 inmates who were incarcerated at the time, plus an additional 1,522 offenders the Department estimated would be admitted in fiscal year 2010—would likely be eligible for home arrest based on the proposed criteria at the time. The actual number of eligible inmates would depend on the criteria adopted. In addition to the offense date requirement, statute limits eligibility to inmates who have served at least 6 months of their sentence; were convicted of a class 4, 5, or 6 felony that did not involve intentionally or knowingly inflicting serious physical injury or using or exhibiting a deadly weapon or dangerous instrument; were not convicted of a sexual offense; have not previously been convicted of a felony; have violated parole by committing a violation that was not chargeable or indictable as a criminal offense; and are eligible for work furlough or parole.
Placing more inmates on home arrest with electronic monitoring could reduce costs. According to department estimates, home arrest could cost approximately $19 per inmate, per day, including $7.50 for monitoring equipment. Although this estimate is higher than the marginal cost of $12.60 to house, feed, and supervise an additional inmate in prison, statute requires offenders to pay some home arrest costs. Specifically, A.R.S. 41-1604.13(D) requires that offenders on home arrest pay an electronic monitoring fee of between $1 per day and the total cost of electronic monitoring and a home arrest supervision fee of at least $65 per month if they have the ability to pay these fees. Depending on the amount offenders pay, the daily cost of the program could be less than the marginal cost of a day in prison. In addition, more savings could be realized if enough inmates were diverted to close a prison unit. However, a significant number of inmates would need to be diverted before a prison unit would close. As of August 31, 2010, the Department had over 4,800 temporary beds in the prison system, and department officials indicated that the Department would likely stop using these beds before closing a unit.
Day reporting centers could be used—Many states and/or counties use day reporting centers to reduce jail and prison populations and associated costs (see
Expanding home arrest in Arizona has been considered.
Office of the Auditor General
page 43
State of Arizona
page 44
textbox for definition).1 Georgia reported lower recidivism rates for offenders who participated in day reporting centers rather than being incarcerated. Specifically:
• Georgia—Georgia, which began using day reporting centers in 2001, had 13 day reporting centers state-wide as of August 2010. According to a Georgia Department of Corrections (GDOC) official, a judge can sentence offenders to these centers at initial sentencing or if they violate the conditions of their probation. A 2005 Georgia State University study on a day reporting center in Atlanta reported that offenders who completed the day reporting center program had a recidivism rate of 9 percent compared to a rate of 31 percent for offenders who did not complete the program and 20 percent for a comparison group of released parolees.2,3 Further, Georgia has experienced a significant per-inmate cost reduction by using the centers. According to GDOC officials, Georgia’s day reporting centers only cost $16.50 per inmate, per day compared to the $48-per-inmate-per-day cost of prison. GDOC officials were unable to give estimates for the start-up costs associated with the centers because they already owned many of the buildings and furniture used for the centers prior to their opening. However, these officials did mention that construction and start-up costs are relatively low, especially in comparison to prison construction and start-up costs because the facilities are “basically a blend of office and classroom space,” which “are relatively inexpensive to accommodate with furniture, fixtures, and equipment, unlike [their] incarceration facilities.”
1 According to a 1995 report by the National Institute of Justice, there were 114 day reporting centers in 22 states as of mid-1994. Although auditors did not determine whether these states continued to have day reporting centers, auditors identified at least 10 states that had day reporting centers as of May 2010: Georgia, Illinois, Kansas, Nebraska, New Jersey, Oregon, Pennsylvania, South Carolina, Utah, and West Virginia: see Parent et al., 1995.
2 See Finn, 20053 Recidivism numbers are based on a review of offenders discharged from either the day reporting center or the comparison
parole center between April 2001 and April 2003, beginning from their referral date through September 15, 2004.
Day reporting centers—A nonprison alternative that blends high levels of supervision with intensive services and programming. Offenders typically report to the centers during the day but sleep at home and are responsible for providing their own meals and means of transportation to and from the centers. According to a 1995 National Institute of Justice report that surveyed 114 day reporting centers in 22 states (all of the centers that existed at the time), the centers have strict requirements for monitoring the whereabouts and behavior of participating offenders, and most centers’ surveillance policies include graduated phases of supervision, frequent on-site contact, close monitoring of offenders when off-site, and vigilant surveillance of certain behaviors such as drug use.
Although day reporting centers are commonly used for nonviolent offenders who need substance abuse treatment, some states have also used them for arson, sex or weapons offenses, and other violent offenses.
Source: Auditor General review of the literature on day reporting centers; see Parent et al., 1995; Parent and Corbett, 1996; Craddock, 2000; Martin, Lurigio, and Olson, 2003.

Office of the Auditor General
page 45
In Arizona, day reporting centers have been used at the county level. According to a 1995 National Institute of Justice (Institute) report, Maricopa County (County) began using day reporting centers in 1992 after a federal court ordered the County to reduce its jail population.1 Although the Institute noted that no formal impact evaluation had been completed on the County’s day reporting center program, it reported that the return rate for participants returned to jail for serious rule violations was quite low, especially compared to the return rate for intensive supervision programs. Further, according to the report, county staff estimated that the program had saved the equivalent of 35,426 days in jail between the time it opened the centers in 1992 and the time the report data was collected in 1994. Based on county-reported per diem costs for jail and day reporting centers ($37 and $16, respectively), the Institute suggested that day reporting centers represented a significant potential cost savings, but that evaluative research was needed to draw any conclusions about program effectiveness. A 1999 study on the effectiveness of the County’s day reporting center program in reducing DUI recidivism for repeat DUI offenders found that, although the program was no more effective at reducing recidivism than a standard probation program, it was more cost-effective and helped reduce pressure on the county jail system.2 However, the study noted that the day reporting center program offered general substance abuse treatment rather than alcohol-specific treatment, which could have affected the results. According to Maricopa County probation staff, the County stopped using its centers in May 2002. Staff report that the program was discontinued because county judges and prosecutors deemed fewer and fewer probationers eligible for the program and because of budget considerations.
State should further study expansion of nonprison alternatives, including costs and needed legislative action
Although the Department and the courts have statutory authority to establish nonprison alternatives, further study should be conducted to identify the best mix of alternatives. A.R.S. §41-1613 authorizes the Department to establish and operate community correctional centers to provide housing, supervision, counseling, and other correctional programs for persons in prison or on community supervision. According to department officials, these centers could include day reporting centers, work release centers, residential treatment centers, and halfway houses. Similarly, A.R.S. §12-299.01 authorizes the county courts to establish and operate community punishment programs for probationers that include noncustodial programs such as house arrest, electronic monitoring, and drug and alcohol outpatient treatment; residential programs such as restitution centers, halfway houses, and inpatient drug or alcohol treatment; and individualized services, such as counseling and education.
1 See Parent et al., 19952 Jones and Lacey, 1999
Maricopa County used day reporting centers from 1992 to 2002.
State of Arizona
page 46
The Legislature could consider directing the Department and/or the courts to conduct a study to identify the best mix of nonprison alternatives for Arizona, which could be used in lieu of prison or in conjunction with earlier release, as well as develop recommendations for nonprison alternatives. For example, before Washington invested in nonprison alternatives, it commissioned a study of numerous evidence-based programs for adult corrections, juvenile corrections, and crime prevention to determine what evidenced-based alternatives could be used to reduce the need for prison but still be fiscally sound and reduce future crime.1 The study recommended that Washington adopt a moderate-to-aggressive portfolio of evidenced-based options, which, if successfully implemented, would reduce future prison construction significantly. Specifically, the study projected that Washington could save about $2 billion and crime rates would be reduced. Cost benefits are a mix of savings from lower incarceration rates and cost avoidance based on fewer crimes committed in the future. The Legislature could also consider directing the Department and the courts to monitor the cost and impact of any or all of the new programs.
The costs of implementing alternatives would also need to be considered, including startup costs. However, these costs could be lessened by requiring offenders to pay some costs, especially for alternatives that allow them to work, such as home arrest with electronic monitoring, and by using other funding sources or cost-saving measures. For example, according to the National Institute of Justice’s 1995 review of Maricopa County’s day reporting center program, the County reallocated resources and developed new funding options to pay for the program.2 Specifically, Maricopa County raised the charge for housing a federal inmate from $38 per day to $78 per day and received legislative approval to use funds from a 1986 bond issue for day reporting center facility acquisition. In addition, $150,000 in Bureau of Justice Assistance money was also applied to the project. Since the 1986 bond issue could be used only to improve the physical plant and not to support the program, the County offered free rent in their buildings to treatment providers in exchange for slots in the treatment programs for day reporting center offenders.
Depending on whether the Legislature provides funding for expanded nonprison alternatives and which alternatives are expanded, some statutes will need to be revised. For example, the Legislature would need to revise statute to expand eligibility for the home arrest program.
1 See Aos, Miller, & Drake, 20062 See Parent et al., 1995
Further study could identify the best mix of nonprison alternatives for Arizona.

Option 4—Reducing revocations from parole violations
A fourth option available for reducing prison population growth is to reduce prison admissions that result from offenders who violate the terms of their community supervision (commonly referred to as parole). After serving at least 85 percent of their sentences in prison, most Arizona inmates are conditionally released to the community under Department of Corrections (Department) supervision. Released inmates spend a median of about 5 months on community supervision. However, their parole can be revoked and they can be returned to prison for violating the conditions of their release, such as missing appointments with parole officers, using illegal substances, or engaging in criminal behavior. These violations accounted for 15 percent of the State’s prison admittances in fiscal year 2010. Although the Department has developed policies and procedures to address parole violations, expanding the Department’s alternatives for responding to them may help reduce prison admissions and associated costs. These include nonprison alternatives, such as those mentioned in Chapter 4 (see pages 37 through 46), residential treatment facilities, or other secure facilities. The Department has authority to establish alternative sanctions for parole violators and is in the process of studying potential options. Once it completes its study, the Department should present its findings to the Governor and Legislature for consideration and expand its use of nonprison sanctions in accordance with the direction it receives from state policymakers.
Most inmates serve part of sentence in community
Most inmates serve about 15 percent or less of their sentence in the community under department supervision. As discussed in Chapter 3 (see pages 23 through 35), Arizona abolished discretionary parole as a release mechanism for offenses committed after 1993 and requires offenders to serve at least 85 percent of their sentence before becoming eligible for release to the community. Although release eligibility depends on prisoner behavior and other factors, department staff indicated
Most Arizona inmates serve about 15 percent or less of their sentence on community supervision.
Office of the Auditor General
page 47
Chapter 5
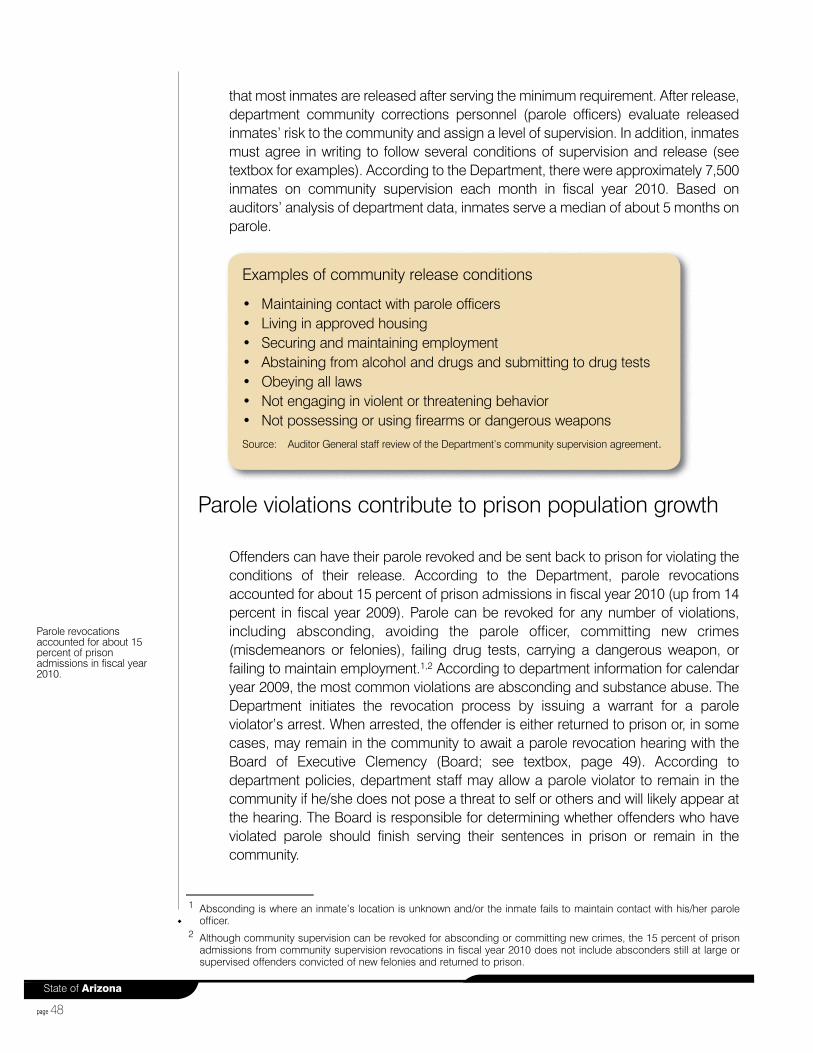
that most inmates are released after serving the minimum requirement. After release, department community corrections personnel (parole officers) evaluate released inmates’ risk to the community and assign a level of supervision. In addition, inmates must agree in writing to follow several conditions of supervision and release (see textbox for examples). According to the Department, there were approximately 7,500 inmates on community supervision each month in fiscal year 2010. Based on auditors’ analysis of department data, inmates serve a median of about 5 months on parole.
Parole violations contribute to prison population growth
Offenders can have their parole revoked and be sent back to prison for violating the conditions of their release. According to the Department, parole revocations accounted for about 15 percent of prison admissions in fiscal year 2010 (up from 14 percent in fiscal year 2009). Parole can be revoked for any number of violations, including absconding, avoiding the parole officer, committing new crimes (misdemeanors or felonies), failing drug tests, carrying a dangerous weapon, or failing to maintain employment.1,2 According to department information for calendar year 2009, the most common violations are absconding and substance abuse. The Department initiates the revocation process by issuing a warrant for a parole violator’s arrest. When arrested, the offender is either returned to prison or, in some cases, may remain in the community to await a parole revocation hearing with the Board of Executive Clemency (Board; see textbox, page 49). According to department policies, department staff may allow a parole violator to remain in the community if he/she does not pose a threat to self or others and will likely appear at the hearing. The Board is responsible for determining whether offenders who have violated parole should finish serving their sentences in prison or remain in the community.
1 Absconding is where an inmate’s location is unknown and/or the inmate fails to maintain contact with his/her parole officer.
2 Although community supervision can be revoked for absconding or committing new crimes, the 15 percent of prison admissions from community supervision revocations in fiscal year 2010 does not include absconders still at large or supervised offenders convicted of new felonies and returned to prison.
State of Arizona
page 48
Examples of community release conditions
• Maintaining contact with parole officers• Living in approved housing• Securing and maintaining employment• Abstaining from alcohol and drugs and submitting to drug tests• Obeying all laws• Not engaging in violent or threatening behavior• Not possessing or using firearms or dangerous weapons
Source: Auditor General staff review of the Department’s community supervision agreement.
Parole revocations accounted for about 15 percent of prison admissions in fiscal year 2010.
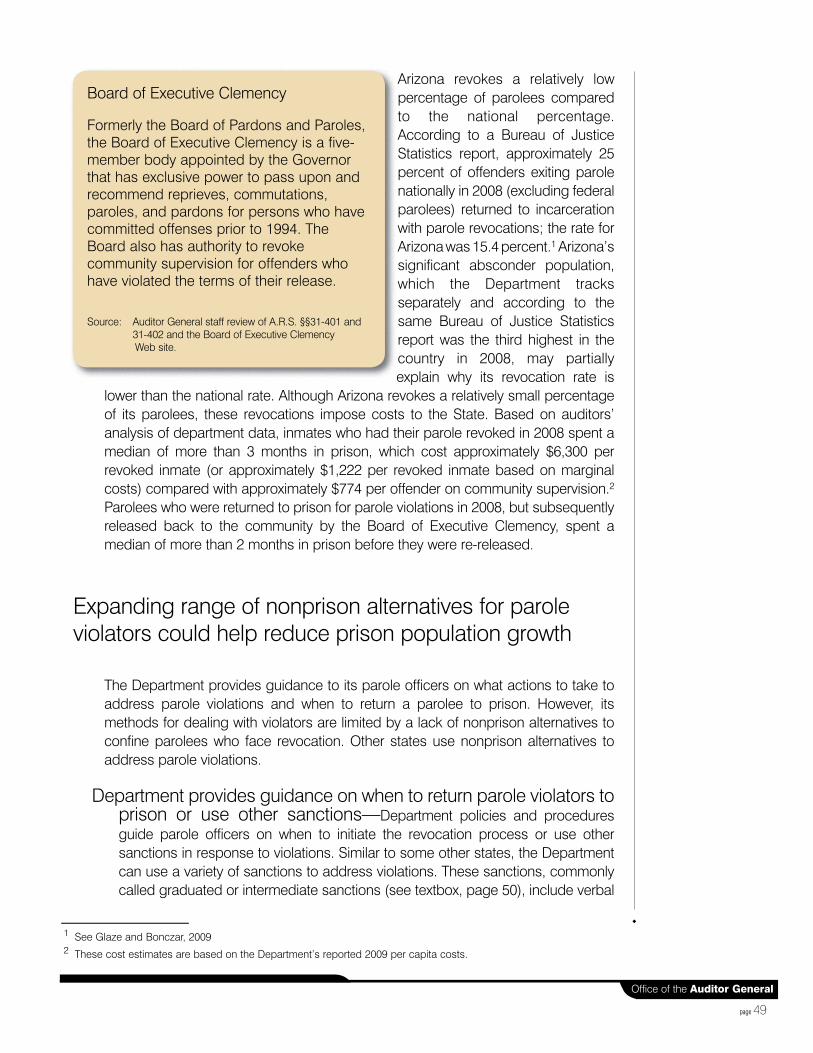
Arizona revokes a relatively low percentage of parolees compared to the national percentage. According to a Bureau of Justice Statistics report, approximately 25 percent of offenders exiting parole nationally in 2008 (excluding federal parolees) returned to incarceration with parole revocations; the rate for Arizona was 15.4 percent.1 Arizona’s significant absconder population, which the Department tracks separately and according to the same Bureau of Justice Statistics report was the third highest in the country in 2008, may partially explain why its revocation rate is
lower than the national rate. Although Arizona revokes a relatively small percentage of its parolees, these revocations impose costs to the State. Based on auditors’ analysis of department data, inmates who had their parole revoked in 2008 spent a median of more than 3 months in prison, which cost approximately $6,300 per revoked inmate (or approximately $1,222 per revoked inmate based on marginal costs) compared with approximately $774 per offender on community supervision.2
Parolees who were returned to prison for parole violations in 2008, but subsequently released back to the community by the Board of Executive Clemency, spent a median of more than 2 months in prison before they were re-released.
Expanding range of nonprison alternatives for parole violators could help reduce prison population growth
The Department provides guidance to its parole officers on what actions to take to address parole violations and when to return a parolee to prison. However, its methods for dealing with violators are limited by a lack of nonprison alternatives to confine parolees who face revocation. Other states use nonprison alternatives to address parole violations.
Department provides guidance on when to return parole violators to prison or use other sanctions—Department policies and procedures guide parole officers on when to initiate the revocation process or use other sanctions in response to violations. Similar to some other states, the Department can use a variety of sanctions to address violations. These sanctions, commonly called graduated or intermediate sanctions (see textbox, page 50), include verbal
1 See Glaze and Bonczar, 20092 These cost estimates are based on the Department’s reported 2009 per capita costs.
Office of the Auditor General
page 49
Board of Executive Clemency
Formerly the Board of Pardons and Paroles, the Board of Executive Clemency is a five-member body appointed by the Governor that has exclusive power to pass upon and recommend reprieves, commutations, paroles, and pardons for persons who have committed offenses prior to 1994. The Board also has authority to revoke community supervision for offenders who have violated the terms of their release.
Source: Auditor General staff review of A.R.S. §§31-401 and 31-402 and the Board of Executive Clemency Web site.
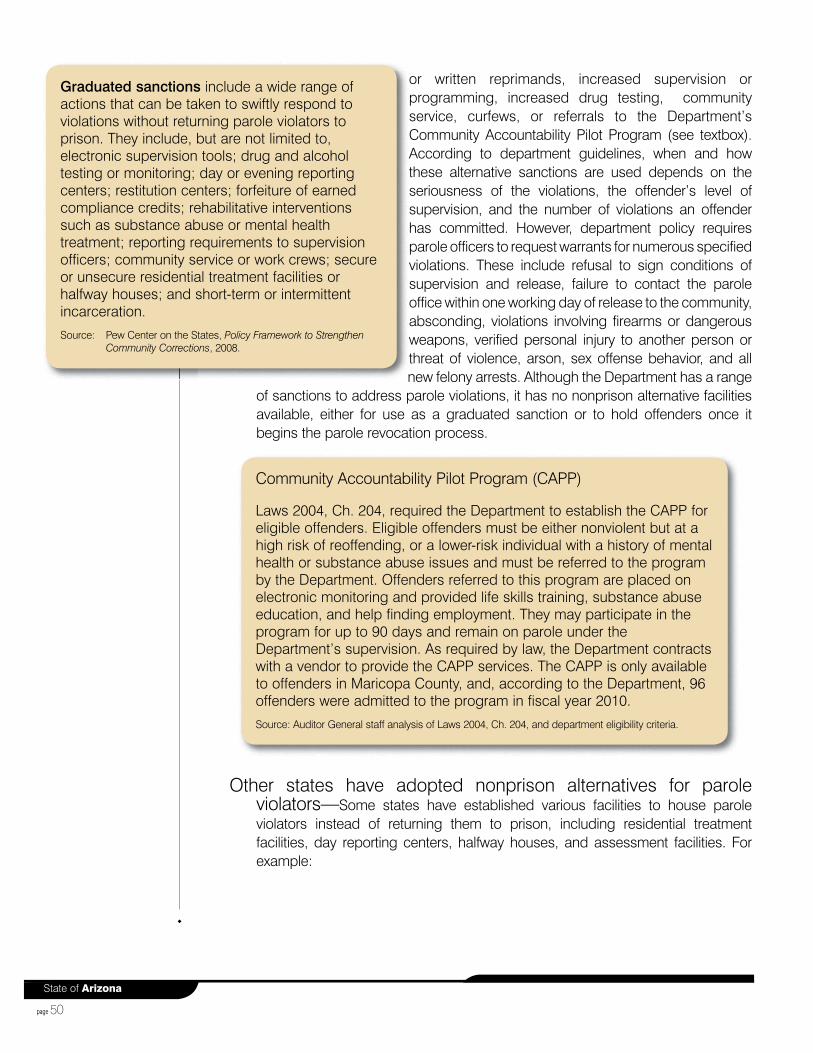
or written reprimands, increased supervision or programming, increased drug testing, community service, curfews, or referrals to the Department’s Community Accountability Pilot Program (see textbox). According to department guidelines, when and how these alternative sanctions are used depends on the seriousness of the violations, the offender’s level of supervision, and the number of violations an offender has committed. However, department policy requires parole officers to request warrants for numerous specified violations. These include refusal to sign conditions of supervision and release, failure to contact the parole office within one working day of release to the community, absconding, violations involving firearms or dangerous weapons, verified personal injury to another person or threat of violence, arson, sex offense behavior, and all new felony arrests. Although the Department has a range
of sanctions to address parole violations, it has no nonprison alternative facilities available, either for use as a graduated sanction or to hold offenders once it begins the parole revocation process.
Other states have adopted nonprison alternatives for parole violators—Some states have established various facilities to house parole violators instead of returning them to prison, including residential treatment facilities, day reporting centers, halfway houses, and assessment facilities. For example:
State of Arizona
page 50
Community Accountability Pilot Program (CAPP)
Laws 2004, Ch. 204, required the Department to establish the CAPP for eligible offenders. Eligible offenders must be either nonviolent but at a high risk of reoffending, or a lower-risk individual with a history of mental health or substance abuse issues and must be referred to the program by the Department. Offenders referred to this program are placed on electronic monitoring and provided life skills training, substance abuse education, and help finding employment. They may participate in the program for up to 90 days and remain on parole under the Department’s supervision. As required by law, the Department contracts with a vendor to provide the CAPP services. The CAPP is only available to offenders in Maricopa County, and, according to the Department, 96 offenders were admitted to the program in fiscal year 2010.
Source: Auditor General staff analysis of Laws 2004, Ch. 204, and department eligibility criteria.
Graduated sanctions include a wide range of actions that can be taken to swiftly respond to violations without returning parole violators to prison. They include, but are not limited to, electronic supervision tools; drug and alcohol testing or monitoring; day or evening reporting centers; restitution centers; forfeiture of earned compliance credits; rehabilitative interventions such as substance abuse or mental health treatment; reporting requirements to supervision officers; community service or work crews; secure or unsecure residential treatment facilities or halfway houses; and short-term or intermittent incarceration.
Source: Pew Center on the States, Policy Framework to Strengthen Community Corrections, 2008.

• As discussed in Chapter 4 (see pages 37 through 46), Texas has expanded its use of substance abuse treatment and prison diversion programs, which has helped reduce its prison population and the number of parole revocations. According to a 2009 Council of State Governments Justice Center report, this expansion of programs accompanied an emphasis on releasing more eligible inmates on parole and allocating resources toward addressing their needs once on parole.1 This included expanding Texas’ use of intermediate sanction facilities for parole violators. Intermediate sanction facilities are secure facilities used to sanction parole violators instead of revoking them to prison. Parole violators are confined in these facilities for an average of 60 days. According to the Texas Legislative Budget Board Criminal Justice Uniform Cost Report, Fiscal Years 2006—2008, in fiscal year 2008, intermediate sanction facilities cost between $35.45 per day (privately contracted) and $41.29 per day (state-run), compared with the average cost of $47.50 per day for incarceration in a Texas state prison.
• New Jersey uses nonprison facilities to house parole violators awaiting parole revocation hearings. According to a 2010 Sentencing Project report, in July 2008, New Jersey began using regional assessment centers for parole violators, which are designed to confine up to 45 people at a time for 15 to 30 days of lockdown.2,3 During their confinement, violators are assessed for their mental health, social, familial, and economic needs, and risk to reoffend. These assessments help the parole board make more informed decisions, which has resulted in fewer revocations. The 2010 Sentencing Project report also noted that of the 810 parolees assessed at these centers by February 2009, only 46 percent were returned to prison, compared to a return rate of 81 percent before their use. Additionally, according to the New Jersey State Parole Board’s fiscal year 2009 annual report, an additional review of 181 parolees who continued on parole after being assessed in the centers found that 73.4 percent of them either successfully completed parole or, if still on parole, had not committed additional violations at the time of the review. The remainder eventually returned to prison. Finally, according to this annual report and a New Jersey parole official, the centers saved New Jersey an estimated $10 million in fiscal year 2009 because of decreased parole revocations and its use of regional assessment centers to hold parole violators rather than county jails.
Arizona could use similar facilities as a graduated sanction or as holding facilities for parole violators awaiting a revocation hearing. In addition, the nonprison alternatives discussed in Chapter 4 (see pages 37 through 46), such as day reporting centers and home arrest with electronic monitoring, could also be used for parole violators.
1 Council of State Governments Justice Center, 20092 See Greene & Mauer, 20103 The Sentencing Project is a criminal justice policy research and advocacy firm.
New Jersey uses regional assessment centers for parolees facing revocation.
Office of the Auditor General
page 51
Expanding alternatives for parole violations would require action
As discussed in Chapter 4 (see pages 37 through 46), statute authorizes the Department to establish and operate community correctional centers to provide housing, supervision, counseling, and other correctional programs for offenders on community supervision. According to department officials, the Department previously used such centers but stopped doing so in the 1980s because of funding limitations. Department officials indicated that they are in the process of studying potential options for expanding the use of nonprison sanctions for parole violators. The Department should complete this study and present its findings to the Governor and Legislature for consideration. The Department should then expand its use of nonprison sanctions in accordance with the direction it receives from state policymakers.
Finally, if additional nonprison sanctions are implemented, the Department should incorporate their use in its community supervision policies and procedures. Other states have incorporated the use of formal sanction grids into their parole procedures. For example, Ohio has used its Progressive Sanction Grid to provide guidance in imposing sanctions based on offender risk and violation severity since 2005.1 In 2008, California began using the Parole Violation Decision Making Instrument, a computer-based instrument that identifies a range of recommended responses to each parole violation based on the offender’s risk level and the severity of the violation.2
1 See Martin & Van Dine, 20082 See Murphy & Turner, 2010
The Department is studying options for expanding alternative sanctions for parole violators.
State of Arizona
page 52

Recommendations for legislative and department consideration
The Legislature could consider a number of options for addressing Arizona’s growing prison population. These options are not mutually exclusive and include the following:
• Option 1: The Legislature could continue to expand the prison system, either by constructing new prison facilities and/or contracting for more private beds. If the Legislature decides to expand the prison system, it should consider directing the Department of Corrections (Department) to further study and analyze the costs for the State to build and operate prison facilities compared to contracting with private prisons to determine which option would be more cost-effective while still ensuring public safety.
• Option 2: The Legislature could consider diverting more nonviolent, low-risk offenders from prison and/or reducing the time they serve—alternatives that may require changes to the State’s sentencing laws. Specifically:
° Similar to Arizona Revised Statutes (A.R.S.) §13-901.01, which requires nonviolent persons convicted of a first or second offense for the personal possession or use of drugs to be sentenced to probation and mandatory treatment, the Legislature could consider revising statute to expand diversion opportunities to other nonviolent, low-risk offenders, particularly those whose crimes are related to substance abuse. In order to divert more nonviolent, low-risk offenders from prison, the Legislature may need to consider revising some of the State’s sentencing laws.
° The Legislature could consider expanding early release options, such as reducing the time served requirement for nonviolent, low-risk offenders and establishing earned time credits. These options would also require changes to the State’s sentencing laws.
° If the Legislature expands diversion or early release options, it should also consider taking the following steps:
Office of the Auditor General
page 53
Chapter 6

· Further defining diversion and/or early release eligibility criteria for other nonviolent, low-risk offenders in statute, and/or
· Ensuring the use of valid and reliable risk assessment tools to determine offender eligibility for diversion and/or early release.
° The Legislature could consider establishing a permanent sentencing commission to assist in reviewing and recommending changes to the State’s sentencing laws. Other possible functions this commission could perform include determining eligibility criteria for diversion, recommending guidelines for determining appropriate candidates for alternative sanctions, and monitoring reform results to ensure they are having the intended effect. If the Legislature establishes a sentencing commission, it should consider including representatives from all criminal justice system stakeholders.
• Option 3: The Legislature could consider using more nonprison alternatives for nonviolent, low-risk offenders. This could include:
° Expanding substance abuse treatment alternatives by expanding the use of drug courts and/or establishing additional substance abuse treatment alternatives. This might include providing additional counseling services, in-patient beds, and secure residential treatment beds.
° Expanding the use of home arrest with electronic monitoring.
° Establishing day reporting centers.
These or other alternatives could be used in lieu of prison sentences or in conjunction with earlier release. The Legislature could consider directing the Department and/or the courts to further study nonprison alternatives and develop recommendations for expanding their use, which should include an evaluation of the costs of these alternatives. Additionally, the Legislature could direct the Department and the courts to monitor the cost and impact of any nonprison alternatives established. Depending on whether the Legislature provides funding for expanded nonprison alternatives and which alternatives are expanded, some statutes will need to be revised, such as the home arrest statute.
• Option 4: Expanding nonprison alternatives for parole violators would require the following actions:
° The Department should complete its study of potential options for expanding the use of nonprison alternatives for parole violators and present its findings to the Governor and Legislature for consideration. The Department should then expand its use of nonprison sanctions in accordance with the direction it receives from state policymakers.
State of Arizona
page 54

Office of the Auditor General
page 55
° If nonprison alternatives or sanctions are implemented, the Department should incorporate the use of these additional sanctions in its community supervision policies and procedures.

State of Arizona
page 56
Data and methodology
Auditors used various methods to study the issues addressed in this report. These methods included interviewing Department of Corrections (Department) officials and staff, Arizona Department of Administration (ADOA) staff, Joint Legislative Budget Committee (JLBC) and Governor’s Office of Strategic Planning and Budget staff, and various stakeholders; reviewing JLBC reports; reviewing statutes, department orders, director’s instructions, department guidelines regarding supervising parole violators, and other department documentation; reviewing Arizona crime data for 1960 through 2008 obtained from the Bureau of Justice Statistics Web site, national crime data for 2006 through 2008 obtained from the Federal Bureau of Investigation Web site, and Arizona population estimates from the Arizona Department of Economic Security Web site; calculating Arizona’s imprisonment rate for fiscal years 1980 through 2008; and attending and/or reviewing the minutes of the December 2009 and May 2010 Arizona House of Representatives Study Committee on Sentencing. In addition, auditors used the following data and methods:
• Data Sources—Auditors obtained the following data downloads from the Department’s Adult Inmate Management System (AIMS):
° One-day census of all Arizona prison inmates as of December 31, 2009;
° All inmates admitted to Arizona prisons between January 1, 1985 and June 30, 2009; and
° All Arizona prison inmates released between January 1, 1990 and December 31, 2009.
• Data validation—To validate the AIMS data, auditors assessed the Department’s internal controls by reviewing applicable policies and procedures and interviewing various staff and management responsible for the data. Auditors also tested a sample of records in the data against inmates’ hard copy files to validate specific fields used in auditors’ analyses. This test work included 10 inmate
Office of the Auditor General
page a-i
APPENDIX A
records from the one-day census data and 27 records from release data. Auditors found some errors in some of the data fields. However, auditors either did not use those fields or determined that these errors would not be material to overall conclusions. In general, auditors concluded that the AIMS data was sufficiently reliable for audit purposes
• Data analysis—Auditors analyzed the AIMS data to determine the demographic makeup of the prison population as of December 31, 2009; identify nonviolent inmates as of December 31, 2009, who appeared to be at lower risk for committing new felony offenses; review sentence lengths for admitted offenders over time; determine the length and percentage of time served by violent and nonviolent inmates released before and under Arizona’s truth-in-sentencing laws; determine the percentage of violent and nonviolent prison admissions over time; determine the length of time offenders spend on community supervision; and determine the length of time offenders who have had their parole revoked spend in prison.
• Review of department reports (unaudited)—To obtain and review historical Arizona State prison population, cost, and sentencing guideline information, auditors reviewed several department reports. These reports included per capita reports, bed plan reports, a 1992 sentencing report, a 2006 recidivism report, annual reports from fiscal years 1983 through 2003, daily count sheets, Corrections at a Glance reports, inmate admittance and release reports, and a 2010 prison population trend report. Auditors also assessed the reliability of the per capita costs reported in the Department’s Fiscal Year 2009 Operating Per Capita Cost Report by reviewing the report for mathematical accuracy and internal consistency and reconciling a sample of reported costs to the Arizona Financial Information System. Auditors concluded that the report is based on reasonable methodology, appears to be materially mathematically accurate and internally consistent, and overall appears reasonably accurate. The test work was limited to the unadjusted per capita costs.
• Observation of prison facilities—Auditors conducted observations at the following three prison facilities: Arizona State Prison Complex (ASPC) Perryville in Goodyear, which holds most of the State’s female prisoners; Phoenix West, a privately operated specialty DUI prison for minimum-security male inmates located in Phoenix; and ASPC Eyman in Florence, which holds male prisoners in medium, maximum, and close custody.
• Analysis of prison construction costs—Auditors developed cost estimates for expanding the State’s prison system using a combination of state and private facilities to meet projected prison population growth between fiscal years 2012 and 2017. This included an analysis of ADOA prison construction cost estimates, ADOA-reported actual costs for the 2010 4,000-bed expansion project, the
State of Arizona
page a-ii

Department’s Fiscal Year 2011 Budget Request Decision Package, and the Department’s Fiscal Year 2009 Operating Per Capita Cost Report.
• Literature review—Auditors reviewed literature and other reports on prison population growth and its causes, privatization of prisons, incarceration and crime, nonprison alternatives, and other states’ efforts to address prison population growth. Auditors also reviewed prior studies and reports on Arizona’s prison population and sentencing policies. See Appendix B, pages b-i through b-iv, for references cited in the report.
• Other state information—In addition to reviewing literature and other reports regarding other states’ efforts to address prison population growth, auditors also interviewed representatives, obtained information, and/or reviewed the Web sites of nine states. These states were selected based on actions taken to address prison population growth. States reviewed were Florida, Georgia, Hawaii, Mississippi, New York, New Jersey, Texas, Vermont, and Virginia.
page a-iii
Office of the Auditor General

State of Arizona
References
Alternatives to Sentencing Workgroup. (2005). Final report. Phoenix, AZ: Arizona House of Representatives.
Aos, S. Miller, M, & Drake, E. (2006). Evidence-based public policy options to reduce future prison construction, criminal justice costs, and crime rates. Olympia, WA: Washington State Institute for Public Policy.
Arizona Supreme Court, Administrative Office of the Courts, Adult Probation Services Division. (2006). Drug Treatment and Education Fund: Report detailing fiscal year 2005. Phoenix, AZ: Author.
Austin, J., & Coventry, G. (2001). Emerging issues on privatized prisons. Washington, D.C.: U.S. Department of Justice, Office of Justice Programs, Bureau of Justice Assis tance.
Austin, J., & Fabelo, T. (2004). The diminishing returns of increased incarceration: A blue print to improve public safety and reduce costs. Washington, D.C.: The JFA Institute.
Banks, D., & Gottfredson, D.C. (2003). The effects of drug treatment and supervision on time to rearrest among drug treatment court participants. Journal of Drug Issues, 385-412.
Bryne, J.M. (2009, July 10). A review of the evidence on the effectiveness of alternative sanctions and an assessment of the likely impact of Federal Sentencing Guideline reform on public safety [Written Testimony before the United States Sentencing Commission]. New York, NY: Regional Hearings, U.S. Court of International Trade Ceremonial Courtroom.
Council of State Governments, Justice Center. (2009). Justice reinvestment in Texas: As sessing the impact of the 2007 Justice Reinvestment Initiative. Lexington, KY: Author.
Council of State Governments, Justice Center. (2007). Justice reinvestment state brief: Texas. Lexington, KY: Author.
Craddock, A. (2000). Exploratory analysis of client outcomes, costs, and benefits of day reporting centers-Final Report. Terre Haute, IN: Indiana State University, Department of Criminology.
Office of the Auditor General
page b-i
APPENDIX B
Demleitner, N.V. (2005). Smart public policy: Replacing imprisonment with targeted non prison sentences and collateral sanctions. Stanford Law Review, 58, 339-360.
Ditton, P., & Wilson, D.J. (1999), Bureau of Justice Statistics special report: Truth in sentencing in state prisons [NCJ 170032]. Washington, D.C.: U.S. Department of Justice, Office of Justice Programs, Bureau of Justice Statistics.
Drake, E.K., Aos, S. & Miller, M.G. (2009). Evidence-based public policy options to reduce crime and criminal justice costs: Implications in Washington State. Victims and Of fenders, 4, 170-196. doi: 10.1080/15564880802612615
Finn, M.A. (2005). Atlanta Day Reporting Center outcome evaluation. Atlanta, GA: Georgia Day Reporting Center Executive Committee.
Fischer, D. R. (2010). Prisoners in Arizona: A profile of the inmate population. Phoenix, AZ: Arizona Prosecuting Attorneys' Advisory Council.
Fischer, D.R., & Thaker, A. (1992). Mandatory sentencing study. Phoenix, AZ: Arizona De partment of Corrections.
Glaze, L.E., & Bonczar, T.P. (2009). Probation and parole in the United States, 2008. Wash ington, D.C.: U.S. Department of Justice, Office of Justice Programs, Bureau of Justice Statistics.
Gottfredson, D.C., Najaka, S.S., & Kearley, B. (2003). Effectiveness of drug treatment courts: Evidence from a randomized trial [Electronic version]. Criminology & Public Policy, 2(2), 171-196.
Greene, J., & Mauer, M. (2010). Downscaling prisons: Lessons from four states. Washing ton, D.C.: Justice Strategies & The Sentencing Project.
Greene, J., & Pranis, K. (2004). Arizona prison crisis: A call for smart on crime solutions. Washington, D.C.: Families Against Mandatory Minimums.
Guzman, C., Krisberg, B., & Tsukida. (2008). Accelerated release: A literature review. Focus: Views from the National Council on Crime and Delinquency. Retrieved July 21, 2010 from, http://www.nccd-crc.org/nccd/pubs/2008_focus_ac celeratedRlease.pdf
Institute for Rational Public Policy, Inc. (1991). Arizona criminal code and corrections study: Final report to the Legislative Council. Phoenix, AZ: State of Arizona, Legislative Council.
Jones, R.K., & Lacey, J.H. (1999). Final report: Evaluation of a day reporting center for repeat DWI offenders [DOT HS 808 989]. Washington, D.C.: U.S. Department of Transportation National Highway Traffic Safety Administration.
Justice Policy Institute. (2010). How to safely reduce prison populations and support people returning to their communities. Retrieved July 21, 2010, from, http://www.justicepolicy.org/images/upload/10-06_FAC_ForImmediateRelease_PS- AC.pdf
Kleiman, M, Ostrom, B.J., & Cheesman, F.L. (2007). Using risk assessment to inform sen encing decisions for nonviolent offenders in Virginia. Crime & Delinquency, 53(1), 106-132.
State of Arizona
page b-ii

Langan, P.A., & Levin, D.J. (2002). Bureau of Justice Statistics special report: Recidivism of prisoners released in 1994 [NCJ 193427]. Washington, D.C.: U.S. Department of Justice, Office of Justice Programs, Bureau of Justice Statistics.
Lawrence, A. (2009). Cutting corrections costs: Earned time policies for state prisoners. Denver, CO: National Conference of State Legislatures.
Liedka, R.V., Piehl, A.M., & Useem, B. (2006). The crime-control effect of incarceration: Does scale matter? [Electronic version]. Criminology & Public Policy, 5(2), 245- 276.
Lundahl, B.W, Kunz, C., Brownell, C., Harris, N., & Van Vleet, R. (2009). Prison privatization: A meta-analysis of cost and quality of confinement indicators. Research on Social Work Practice, 19(4), 383-394.
Martin, B., & Van Dine, S. (2008). Examining the impact of Ohio's progressive sanction grid: Final report. Ohio Department of Rehabilitation and Correction, Bureau of Research, Office of Policy and Offender Reentry.
Martin, C., Lurrigio, A.J., & Olson, D.E. (2003). An examination of rearrests and reincarcerations among discharged day reporting center clients. Federal Probation 67(1), 24-30.
Merritt, N., Fain, T., & Turner, S. (2006). Oregon's get tough sentencing reform: A lesson in justice system adaptation. Criminology and Public Policy, 5(1), 5-36.
Murphy, A., & Turner, S. (2010). Parole violation decision-making instrument (PVDMI) process evaluation. University of California, Irvine, Center for Evidence-Based Corrections.
Parent, D., Byrne, J., Tsarfaty, V., Valade, L., & Esselman, J. (1995). Day reporting centers: Volume 1. Washington, D.C.: U.S. Department of Justice, Office of Justice Pro grams, National Institute of Justice.
Parent, D. G., & Corbett, R.P. (1996). Day reporting centers: An evolving intermediate sanction. Federal Probation, 60(4), 51-55.
Pew Center on the States. (2010). Prison count 2010: State population declines for the first time in 38 years. Washington, D.C.: Pew Charitable Trusts.
Pew Center on the States. (2009). One in 31: The long reach of American corrections. Washington, D.C.: Pew Charitable Trusts.
Pew Center on the States. (2008). Policy framework to strengthen community corrections. Washington, D.C.: Pew Charitable Trusts.
Scott-Hayward, C.S. (2009). The fiscal crisis in corrections: Rethinking policies and prac tices. New York: Vera Institute of Justice.
Shaffer, D.K. (2006). Reconsidering drug court effectiveness: A meta-analytic review. Un published doctoral dissertation, University of Cincinnati.
Stemen, D. (2007). Reconsidering incarceration: New directions for reducing crime. New York: Vera Institute of Justice.
Stemen, D., Rengifo, A., Wilson, J. (2005). Of fragmentation and ferment; The impact of state sentencing policies on incarceration rates. New York: Vera Institute of Justice.
page b-iii
Office of the Auditor General
State of Arizona
Tonry, M. (2009). The mostly unintended effects of mandatory penalties: Two centuries of consistent findings. Crime and Justice, 38, 65-114.
Ulmer, J.T., Kurlychek, M.C., & Kramer, J.H. (2007). Prosecutorial discretion and the impo sition of mandatory minimum sentences. Journal of Research in Crime and Delin quency, 44(4), 427-458. doi: 10.1177/0022427807305853.
United States Government Accountability Office. (2005). Adult drug courts: Evidence indicates recidivism reductions and mixed results for other outcomes. Washington, D.C.: Author.
Warren, R.K. (2007). Evidence-based practice to reduce recidivism: Implications for state judiciaries. Washington, D.C.: United States Department of Justice, National Institute of Corrections.
West, H.C. (2010). Prisoners at yearend 2009—Advanced counts [NCJ 230189]. Washington, D.C.: U.S. Department of Justice, Office of Justice Programs, Bureau of Justice Statistics.
Wilson, D.B., Mitchell, O., MacKenzie, D. (n.d.) Drug court effects on recidivism [in-press draft]. Administration of Justice, George Mason University, Manassas, VA.
Wool, J., & Stemen, D. (2004). Changing fortunes or changing attitudes? Sentencing and corrections reforms in 2003. New York: Vera Institute of Justice.
page b-iv

AGENCY RESPONSE


Performance Audit Division reports issued within the last 24 months
Future Performance Audit Division reports
Office of Pest Management—Regulation
09-09 Arizona Department of Juvenile Corrections—Suicide Prevention and Violence and Abuse Reduction Efforts
09-10 Arizona Department of Juvenile Corrections—Sunset Factors
09-11 Department of Health Services—Sunset Factors
10-01 Office of Pest Management—Restructuring
10-02 Department of Public Safety—Photo Enforcement Program
10-03 Arizona State Lottery Commission and Arizona State Lottery
10-04 Department of Agriculture— Food Safety and Quality
Assurance Inspection Programs 10-05 Arizona Department of Housing10-06 Board of Chiropracitc Examiners10-07 Department of Agriculture—
Sunset Factors
08-05 Arizona Biomedical Research Commission
08-06 Board of Podiatry Examiners09-01 Department of Health Services,
Division of Licensing Services—Healthcare and Child Care Facility Licensing Fees
09-02 Arizona Department of Juvenile Corrections—Rehabilitation and Community Re-entry Programs
09-03 Maricopa County Special Health Care District
09-04 Arizona Sports and Tourism Authority
09-05 State Compensation Fund09-06 Gila County Transportation
Excise Tax09-07 Department of Health Services,
Division of Behavioral Health Services—Substance Abuse Treatment Programs
09-08 Arizona Department of Liquor Licenses and Control