department environment and natural resources · on january 18, 2011, governor daugaard submitted a...
TRANSCRIPT
DEPARTMENT of ENVIRONMENT and NATURAL RESOURCES
PMB 2020 JOE FOSS BUILDING 523 EAST CAPITOL
PIERRE, SOUTH DAKOTA 57501-3182
www.state.sd.us/denr
June 2, 2011
James B. Martin Regional Administrator U.S. Environmental Protection Agency, Region 8 1595 Wynkoop Street Denver, CO 80202-1129
Dear Mr. Martin:
On March 24, 20 II, EPA notified the Governor of South Dakota that EPA revised the sulfur dioxide National Ambient Air Quality Standard and initial area designations are due by June 3, 2011. EPA revised the primary sulfur dioxide standard by adding a I-hour average concentration.
On January 18, 2011, Governor Daugaard submitted a letter to you designating the Secretary of the Department of Environment and Natural Resources as his designee for submitting designations and other matters which involves South Dakota's Air Quality Program. In that capacity, I recommend EPA designate all counties in South Dakota as attaining the I-hour sulfur dioxide standard (see Attachment A) based on the attached supportive document. Attachment B provides the technical analysis for designating all of South Dakota's counties in attainment. Attachment C provides a copy of the Air Quality System AMP450 repOli showing the yearly 99th
percentile concentrations for each site and includes the one year of data collected near the Big Stone Power Plant in Roberts County.
Thank you for the opportunity to propose designations for the revised primary sulfur dioxide standard and I look forward to your concurrence. If you have questions, please contact Brian Gustafson at 605-773-3151.
~, Steven M. Pi mer Secretary
Attachments
RECEIVED cc: Monica Morales, EPA Region 8 U.S. EPA Region 8
RA's Office
JUN 07 2011

.~.
Attachment A South Dakota Area Designations I-hour Sulfur Dioxide Standard
Desi2Dated Area Desi2nation Type Classification Type Aurora County Attainment Beadle County Attainment Bennett County Attainment Bon Homme County Attainment Brookin2s County Attainment Brown County Attainment Brule County Attainment Buffalo County Attainment Butte County Attainment Campbell County Attainment Charles County Attainment Clark County Attainment Clay County Attainment Codin2ton County Attainment Corson County Attainment Custer County Attainment Davison County Attainment Day County Attainment Deuel County Attainment Dewey County Attainment Dou21as County Attainment Edmunds County Attainment Fall River County Attainment Faulk County Attainment Grant County Attainment Gregory County Attainment Haakon County Attainment Hamlin County Attainment Hand County Attainment Hanson County Attainment Hardin2 County Attainment HU2hes County Attainment Hutchinson County Attainment Hyde County Attainment Jackson County Attainment Jerauld County Attainment Jones County Attainment Kin2sbury County Attainment Lake County Attainment
A-I

Desi2l1ated Area Designation Type Classification Type Lawrence County Attainment Lincoln County Attainment Lyman County Attainment Marshall County Attainment McCook County Attainment McPherson County Attainment Meade County Attainment Mellette County Attainment Miner County Attainment Minnehaha County Attainment Moody County Attainment Pennington County Attainment Perkins County Attainment Potter County Attainment Roberts County Attainment Sanborn County Attainment Shannon County Attainment Spink County Attainment Stanley County Attainment Sully County Attainment Todd County Attainment Tripp County Attainment Turner County Attainment Union County Attainment Walworth County Attainment Yankton County Attainment Ziebach County Attainment
A-2

Attachment B Determining Area Designations
1. Air Monitoring
Sulfur dioxide I-hour concentrations in South Dakota are low statewide. The highest design value concentration was recorded at the SD School Site in Sioux Falls at 19% ofthe new I-hour standard. The Badlands and Wind Cave sites have the lowest design value concentrations at 8% of the standard. The concentrations in South Dakota are low for several reasons. First, the state's population and sulfur dioxide emissions from area sources are low. Second, all but five sources with Title V air quality permits in the state emit sulfur dioxide emissions less than 100 tons per year. Finally, sulfur dioxide emissions from area sources will continue to decline because of the move to ultra low sulfur fuels that began in 2010.
Table B-1 displays the three year calculated design value concentration for each site. The design value concentration for the SD School, Wind Cave, and Badlands Sites used data from 2008 to 2010. Both Union County sites have only two years of data. Roberts County only has 13 months of data.
hi B 1 S' D . V.a ues I c . Sout ota~a e - - lte eSll(n oncentrations In hDak
I
Site County 99th Percentile 3-Year Avera~e Attainment SD School Minnehaha 2008 - 27 parts per billion 14 parts per billion Yes
2009 - 10 parts per billion 2010- 5 parts per billion
Badlands Jackson 2008 - 5 parts per billion 6 parts per billion Yes 2009 - 5 parts per billion 2010- 9 parts per billion
Wind Cave Custer 2008 - 3 parts per billion 6 parts per billion Yes 2009 - 10 parts per billion 2010- 5 parts per billion
UC#l Union 2009 - 10 parts per billion 11 parts per billion I
2010 - 12 parts per billion UC#2 Union 2009 - 6 parts per billion 7 parts per billion I
2010- 9 parts per billion Big Stone II Roberts 2001 - 5 parts per billion 10 parts per billion I
2002 - 14 parts per billion _ Not comparable to the standard because there is less than 3 years of data.
The sulfur dioxide I-hour concentrations collected in the state during the years of2001 to 2002 and 2008 to 2010 demonstrate there were no I-hour concentrations exceeding the new primary standard as calculated following the form of the standard. The highest three year average was recorded at the SD School Site with a three year average concentration level of 14 parts per billion.
Figure B-1 provides a graph comparison of the design values for each site compared to the I-hour sulfur dioxide standard. Although the Big Stone II, Union County #1 and Union County #2 Sites do not have three years of data, the two year average of the 99th percentile is provided for comparison purposes.
B-1

Figure B-1 - Data Compared to the I-hour Sulfur Dioxide Standard
Ic=J 3-Year A-.erage -Standard I
80
70 r:::: 60
~A
11
H 6 6
I II I I I
-0
50iii ... <Il 40
11. 30
~ III 2011.
710 I I I0
SO School Badlands Wind Ca-.e UC#1 UC#2
Sites
The Badlands and Wind Cave sites represent rural areas consisting mainly of rangeland and forested areas in the western half of South Dakota while the Union County sites represent the farming area in the eastern half of South Dakota. The SD School Site represents South Dakota's largest populated area in the Sioux Falls Metropolitan Statistical Area (MSA). The Big Stone II site represents sulfur dioxide concentrations near South Dakota's largest emitting sulfur dioxide source. Based on the monitoring data which reflects the potential highest and lowest sulfur dioxide concentrations in the state, South Dakota is attaining the I-hour sulfur dioxide National Ambient Air Quality Standard in every county in the state.
2. Air Modeling
EPA's Memorandum from Stephen D. Page to Regional Air Division Directors, I-X, dated March 24, 2011, indicates EPA may initially designate an area as attainment if it is clear it meets the new sulfur dioxide National Ambient Air Quality Standards (NAAQS). EPA further states it does not believe it would be appropriate to designate areas as attainment without appropriate refined dispersion modeling and where available, air quality monitoring data indicating no violations of the NAAQS. DENR agrees modeling may be used as a tool by states but disagrees it is the only tool to demonstrate attainment for the following reasons:
1. DENR recently used AERMOD to model the impacts of an existing coal-fired electric power plant using sulfur dioxide emissions being reported to EPA in accordance with the Acid Rain Program. A receptor was placed on two ambient air quality monitoring sites to compare hourly monitoring data to the hourly modeling data. This comparison assumed no other sulfur dioxide emitting sources were impacting the monitors. In realty, if the model was accurate, the modeling results would be less than the monitoring results. The comparison indicated AERMOD may over-predict the concentrations of sulfur dioxide greater than a factor of two (see Appendix D for analysis).
B-2

2. In accordance with 40 CFR Part 51, Appendix W, uncertainties and accuracy of the models are discussed. As noted in section 9.1.2, Studies of Model Accuracy, "(1) Models are more reliable for estimating longer time-averaged concentrations than for estimating short-term concentrations at specific locations; and (2) the models are reasonably reliable in estimating the magnitude of highest concentrations occurring sometime, somewhere within an area. For example, errors in highest estimated concentrations of ± 10 to 40 percent are found to be typical, i.e., certainly well within the often quoted factor-of-two accuracy that has long been recognized for these models. However, estimates of concentrations that occur at a specific time and site are poorly correlated with actually observed concentrations and are much less reliable."
3. EPA did not provide states or the public an opportunity to comment on EPA's new policy of placing more confidence on a model for designations than ambient air quality monitoring. In the proposed rule, EPA stated it would use monitoring for designation purposes but in the final rule it required modeling for attainment designations. This flip flop was initiated by one city and three states suggesting the use of modeling for designations. If you tum this around, 47 states and the rest of the nation's cities agreed monitoring should be used for designations.
4. This flip flop is also contrary to EPA's previous decisions, court cases, and rule: a. On page 26382 of the Federal Register, Vol. 43, No. 118, June 19,1972, EPA states in the
preamble to the 1977 PSD rules, " ...EPA intends that monitoring should generally focus on obtaining data necessary for required review against NAAQS. Although the increment consumption must of necessity be tracked through the use of modeling, EPA does not intend that there be no "real world" checks on the accuracy of modeling."
b. In Alabama Power Co. v. Costle C.A.D.C. 1979, the U.S. Court of Appeals, District of Columbia Circuit states, "We discern from the statute a technology-forcing objective. Congress intended that monitoring would impose a certain discipline on the use of modeling techniques, which would be the principal device relied upon for the projection of the impact on air quality of emissions from a regulated source. This projects that the employment of modeling techniques be held to earth by a continual process of confirmation and reassessment, a process that enhances confidence in modeling, as a means for realistic projection of air quality."
c. This is further emphasized by EPA's current rules under the Prevention of Significant Deterioration program. In accordance with 40 CFR §52.21 (m)(2), if the Administrator believes it is necessary, the owner or operator shall conduct ambient air quality monitoring, " ... to determine the effect emissions from the stationary source or modification may have, or are having, on air quality in any area." Even after a PSD source has demonstrated it is can construct and operate and not cause a violation of the National Ambient Air Quality standard or PSD increment using modeling, EPA may require a source to conduct monitoring to ensure the modeling provided realistic results and no violations will occur.
Historically, both Congress and EPA intended for monitoring to be the real determination on if an area is attaining the National Ambient Air Quality Standards. If EPA wants to use modeling as the only tool to designate areas attaining or not attaining the I-hour sulfur dioxide standard, the actual requirement to use modeling should have been proposed in the rule to allow everyone an opportunity to comment on this decision. DENR believes monitoring provides the reality check both Congress and EPA believe are necessary for states to demonstrate an area is attaining or not attaining the standard and should be used for the I-hour sulfur dioxide standard.
B-3

3. Sulfur Dioxide Monitoring Network in South Dakota
The first sampling effort in South Dakota to collect hourly sulfur dioxide data was near the Big Stone Power Plant. The monitoring location for sulfur dioxide was based on modeling indicating the area of highest concentrations near the facility and in South Dakota. A continuous 12-month period of air monitoring was completed in the years of 2001 and 2002 as part of a Prevention of Significant Deterioration permit application. Sulfur dioxide levels were low with a 99th percentile I-hour average concentration level of 10 parts per billion.
DENR operates a network of air monitoring sites which began collecting hourly sulfur dioxide data in 2002. The first site was established at the Hilltop Site in Sioux Falls. The monitor was later moved to the SD School Site and continues today. In 2005, two more locations were added at the Badlands and Wind Cave National Parks. In 2009, two more locations were added in Union County.
The current sampling network includes sites in several counties around the state with goals of high concentration, population, source impact, background and regional transport. See Figure B-2 for a map of the state showing the counties with sulfur dioxide air monitoring data.
Figure B-2 - South Dakota Counties with Sulfur Dioxide Data
Legend
3 Years of Data 0 2 Years of Data _ 1 Year of Data 0 No Sampling
B-4

4. South Dakota's Population and Sulfur Dioxide Emissions
If EPA still wishes to use a policy of using modeling for designation purposes, the final rule on page 35551 states, " ...we believe that for a short-term I-hour standard it is more technically appropriate, efficient, and effective to use modeling as the principle means of assessing compliance for medium to larger source, and to rely more on monitoring for groups of small sources and sources not as conductive to modeling."
Sulfur dioxide emissions from Title V major sources throughout South Dakota are low to medium with one source that could be considered large. Table B-2 provides a list of the top 10 major sources emitting sulfur dioxide in calendar year 2009 and represents 75% of the state's total emissions from permitted sources.
# County 1 Grant 2 Pennington 3 Pennington 4 Brookings 5 Sioux Falls 6 Brookings 7 Spink 8 Turner 9 Minnehaha 10 Codington
Table B-2 - Top 10 Sulfur Dioxide Emitters in South Dakota (tons per year) Facility
Otter Tail Power Company - Big Stone I Black Hills Corporation - Ben French GCC Dacotah South Dakota State University John Morrell & Company Valero Renewable Fuels Company Redfield Energy Great Plains Ethanol Sioux Falls Water Reclamation Facility Glacial Lakes Energy
TonslYear 11,651
823 285 183 170 85 42 21 13 11
13,284 17,826
Top 10 Total =
Total for Entire State
South Dakota has counties with low population and no large sources of sulfur dioxide emissions as can be seen in Table B-2. The sulfur dioxide concentrations in these areas would be similar to the concentrations South Dakota is experiencing at its Badlands, Wind Cave, and Union County monitoring sites depending on what rural area one is located. DENR believes these sites meet EPA's requirement that monitoring should be used for designation purposes, not modeling.
South Dakota has other counties with low population and several sources of sulfur dioxide that would not be considered large sources of sulfur dioxide emissions (see Attachment E). These counties would have concentrations somewhere in between the concentrations at the rural sites and SD School Site. DENR believes these sites meet EPA's requirement that monitoring should be used for designation purposes, not modeling.
The largest city in South Dakota is Sioux Falls with a population ofless than 153,888. The largest of the three MSAs in the state includes the city of Sioux Falls and includes the counties of Minnehaha, Lincoln, McCook, and Turner. The combined 2010 Census population for the Sioux Falls MSA is 228,261. Table B-3 provides a list of the top 10 most populated counties in the state and the largest city within the county. The largest populated area in South Dakota has sources of sulfur dioxide
B-5

emissions that would not be considered large sources of sulfur dioxide. DENR believes even this site meets EPA's requirement that monitoring should be used for designation purposes, not modeling.
~ hie B-3 - ~ H:IgJhest opu ation C a ota a en Pl' ountles In. SouthD k
County Population PopulationNumber Lar~est City Minnehaha 169,468 Sioux Falls 153,8881 Pennington Rapid City 67,956100,9482
44,828 153,888Lincoln Sioux Falls 3 26,091Brown 36,531 Aberdeen4 22,056Brookings 31,965 Brookings5
27,227 Watertown 21,482Codington6 25,434 Sturgis 6,627Meade7 24,097 Spearfish 10,494Lawrence8 22,438 14,454YanktonYankton9
15,25419,504 MitchellDavison10
Grant County has the highest emission total for sulfur dioxide in South Dakota and the emissions are generated by the Big Stone I Power Plant. DENR does not believe modeling is necessary even at this site since modeling was used to detennine the location of highest concentrations and an ambient air monitor was located at the modeling site in Roberts County and recorded concentrations just over 13% of the I-hour sulfur dioxide standard. In addition, sulfur dioxide emissions will be lowered from Big Stone I once the control equipment required by the Regional Haze Program is installed. Therefore, even Grant County should be designated attainment based on monitoring results.
B-6

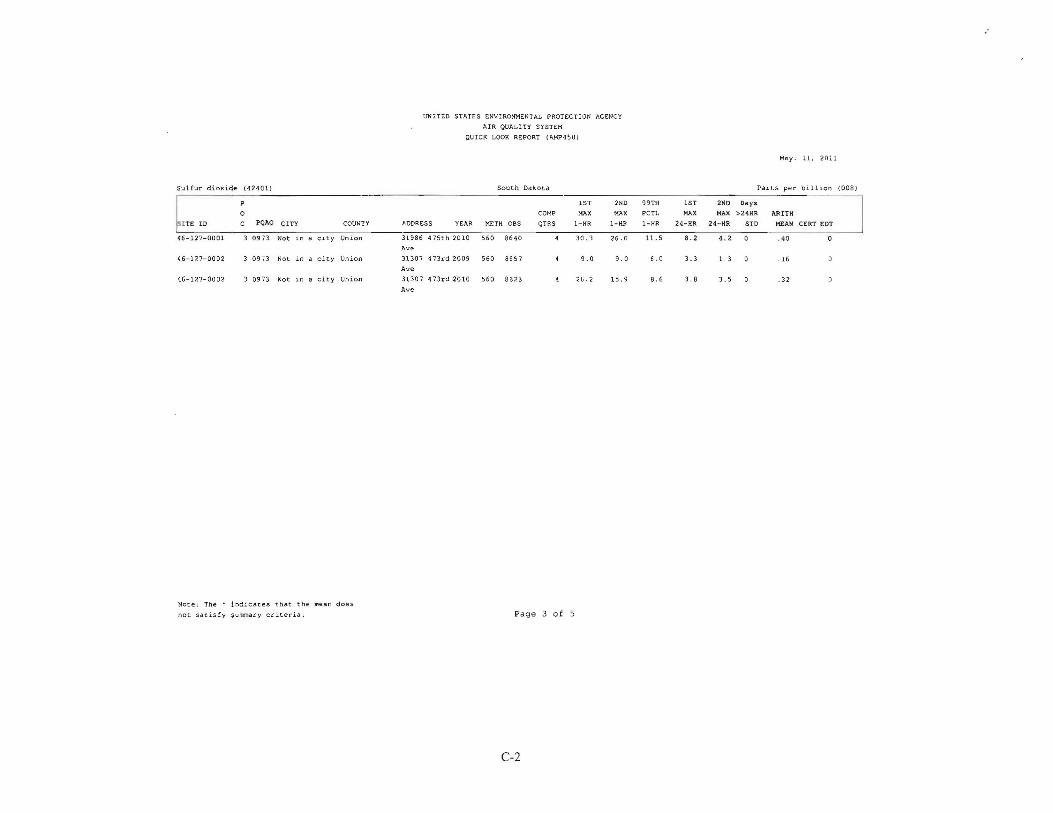
Attachment C Air Quality System Report AMP450
UNITED STATES ENVIRONMENTAL PROTECTION
AIR QUALITY SYSTEM
QUICK LOOK REPORT (AMP450)
AGENCY
May 11, 2011
Sulfur dioxid~ (42401)
P
0
IrE 1D c PQAO CITY
46-033-0132 3 0973 Not in a city
46-033-0132 3 0973 Not in a city
46-033-0132 3 0973 Not in a city
46-071-0001 3 0973 NOt if'l a city
46-071-0001 3 0973 Not in a ci ty
46-071-0001 3 0973 Not in a city
16-099-0008 3 0973 Sioux falls
46-099-0008 3 0973 Sioux falls
46-099-0008 3 0973 Sioux Falls
46-109-4003 3 0973 Not in a city
46-109-4003 3 0973 Not in a city
46-127-0001 3 0973 Not in a city
COUNTY
Cugter
Custer
Custer
Jackson
Jackson
Jack.son
~innehaha
Hi nnehaha
Minnehaha
Roberts
Robert.s
Union
ADDRESS YEAR
WIND CAVE 200S
NATIONAL
PARK, SOUTH
DAKOTA
WIND CAVE 2009
NATIONAL
PARK, SOUTH
DAKOTA
WIND CAVE 2010
NA.TIONAL
PARK, SOUTH
DAKOTA
BADLANDS PO .2008
BOX 6
HEADQUARTER
5
BADLANDS PO 2009
BOX 6
HEADQUARTER
S
BADLANDS PO 2010
BOX 6
HEADQUARTER
5
2001 E 8th 2008
St
2001 88th 2009
St
2001 E 8th 2010
St
482ND AVE 2001
48.2ND AVE 2002
319B6 475th 2009
Ave
South Dakota
COMP
METH aBS QTRS
060 8678 4
060 6487 3
060 8640 4
060 8616 4
060 8645 4
060 8307 4
060 8095 3
060 8184 4
060 8678 4
060 1390 0
060 6935 3
560 8589 4
15T
MAX
I-HR
4.0
32.0
16.0
7.0
7.0
17.0
31.0
18.0
6.0
5.0
28.0
10.5
2ND
MAX
I-HR
4.0
20.0
10.0
6.0
6.0
11. 0
30.0
14.0
6.0
5.0
20.0
10.0
99TH perL
I-HR
3.0
10.0
5.0
5.0
5.0
9.0
27.0
10.0
5.0
5.0
14 .0
9.6
15T
MAX
24-HR
1.4
5.7
2.8
6 0
3.2
3.7
10.0
2. B
1.9
.7
5.3
4.3
2ND
MAX
24-HR
1.3
3.0
2.6
5.0
2.9
3.3
B.9
2.3
1.7
.7
4.0
3.5
Parts per
Days
>24HR ARITH
STD MEAN
0 .23
0 .53"
0 .12
0 1. 28
0 . B4
0 1. 04
0 .89
0 .20
0 .25
0 .04 •
0 .19*
0 .22
bililon
CERr EDT
N
N
N
(008)
Note; The"
not satisfy
iQdicates that the
summary criterla.
mean does Page 2 of 5
C-l
,.
UNITED STi\TES ~NV!RONMENrAL PROTECTION AGE:NCY
AIR QUALITY SYSTEM
QUICK LOOt< R~PORT (A.HP450)
May. 11, 2011
Sulfur dioxide (42401) South Dakotd: PartS per billion (008)
p 1ST 2NO 99T~ 1ST 2ND Days
0 COMP MAX MAX PCrL MAX MAX >24HR ARItH
IrE ID c PQAO crry COUNTY ADDRE:SS YEAR METH OBS QTRS l-KR 1-Hl' 1-KR 24-HR 24-HR STD MEAN CERT EDT
3 0973 Not in .a C1ty Union 31986 475th 2010 560 8640 4 30.3 26.0 11.5 8.2 4.2 0 .40 Ave
46-127-0002 3 0973 Not in a city Onion 31307 473rd 2009 560 8657 4 9.0 9.0 6.0 3.3 1.3 0 .16 Ave
46-127-0002 3 0973 Not 1n a city Union 31307 473rd 2010 560 8628 26.2 15.9 8.6 3.8 3.5 0 .32• Ave
Note: The .. indicaces. that the mean does
not sacisfy ~ul1Lq:ary criteria. Page 3 of 5
C-2

Attachment D AERMOD Modeling Accuracy
This analysis was taken from DENR's section 4.4.1 - Modeling Accuracy of the Statement of Basis for Hyperion Energy Center's extension request for it Prevention of Significant Deterioration air quality permit #28.0701-PSD.
4.4.1 Model Accuracy
The modeling analysis indicates Hyperion will not cause or contribute to a violation of the new I-hour sulfur dioxide National Ambient Air Quality Standard; but the analysis does show the modeled concentration plus the background monitoring concentration is within 2 percent of the new I-hour sulfur dioxide National Ambient Air Quality Standard. Therefore, DENR considered several factors involving how realistic the models predict the concentration and what facility or facilities is contributing to the modeling concentration.
The high modeled sulfur dioxide concentrations are located in the southeast corner of the modeling domain. The facility contributing to the high modeled concentration for sulfur dioxide (greater than 90% contribution) is the MidAmerican George Neal facilities in Iowa. During these periods when MidAmerican George Neal is the majority contributor, Hyperion's contribution is less than 1%.
In accordance with 40 CFR Part 51, Appendix W, uncertainties and accuracy of the models are discussed. As noted in section 9.1.2, Studies of Model Accuracy, "(1) Models are more reliable for estimating longer time-averaged concentrations than for estimating short-term concentrations at specific locations; and (2) the models are reasonably reliable in estimating the magnitude of highest concentrations occurring sometime, somewhere within an area. For example, errors in highest estimated concentrations of ± 10 to 40 percent are found to be typical, i.e., certainly well within the often quoted factor-of-two accuracy that has long been recognized for these models. However, estimates of concentrations that occur at a specific time and site, are poorly correlated with actually observed concentrations and are much less reliable."
To determine if the AERMOD is correctly quantifying the sulfur dioxide concentration, DENR conducted a screening test to determine if AERMOD would meet a minimum operational performance for the I-hour sulfur dioxide National Ambient Air Quality Standard. DENR used the fractional bias procedure identified in EPA's Protocol for Determining the Best Performing Model (EPA - 454/R-92025). DENR modeled MidAmerican George Neal facilities actual emissions from March 31, 2009 through March 31, 2010, at two receptor points in South Dakota using the two meteorological data sets for Union County. The two receptor points used were the location of the two sulfur dioxide monitoring stations currently being operated by DENR in Union County. The modeled results were then compared to the monitored results using the screening approach specified in EPA's protocol. Since the new I-hour sulfur dioxide National Ambient Air Quality standard represents a new form of a standard, DENR compared both the highest 25 hourly readings and the highest 25 readings representing the form of the standard (e.g., highest 25 daily I-hour values).
Figure 4-1 shows a graphical representation of the screening test. As identified in the protocol "Models that plot close to the center (0,0) are relatively free from bias, while models that plot further
0-1

away from the center tend to over or under-predict. Values equal to -0.67 are equivalent to overpredictions by a factor of two while values equal to +0.67 are equivalent to under-predictions by a factor of two. As the graph indicates, AERMOD over-predicts the concentrations of sulfur dioxide with five of the eight scenarios indicating the model would over-predict the concentrations greater than a factor of two.
Figure 4-1 - Screening Test
- Under-predicts '---- -impacts
~...........
~ ~ -
~.~ -1.5 -I 45
~M 1 1.5
~ ............
/ 1000r-pre~IImpacts I
Bias of Average
• UCSF #1 Standard • UCSF #1 Hourly • UCSF #2 Standard • UCSF #2 Hourly
• UCSC #1 Standard. UCSC #1 Hourly • UCSC #2 Standard. UCSC #2 Hourly
Based on the analysis, the model is over-predicting the impact MidAmerican George Neal will have on the sulfur dioxide concentrations in the modeling domain. If it is over-predicting MidAmerican George Neal it is also likely over-predicting all of the sources in the area including Hyperion. Since the approved models are inherently conservative, DENR believes actual monitoring data will be lower then what is being predicted by the models.
D-2

Attachment E South Dakota's Sulfur Dioxide Emissions
From National Emission Inventory
Table E-I contains sulfur dioxide emissions data from the National Emission Inventory (NEI) for 2002 and 2009. The 2002 NEI was included because the inventory included a calculation of emission from area and fugitive sources of sulfur dioxide. Union County is shown as the fourth highest county with sulfur dioxide emissions even though there are no existing Title V sources in the county that emits sulfur dioxide emissions in that quantity. DENR investigated this further and found the sulfur dioxide emissions in the 2002 NEI inventory are the result of coal burning. There is no coal burning facility in Union County. Therefore, the information for Union County is inaccurate. The 2009 emissions are from Title V sources only.
Table E-l- Sulfur Dioxide Emissions in 2002 and 2009
County 2002 NEI Emissions
(tons) 2009 Title V Source Emissions
(tons) Grant 11,918.8 11,652.0 Minnehaha 3,320.1 182.4 Pennington 2,738.6 1,118.1 Union 1,531.7 0.0 Brookings 1,237.7 267.5 Codington 904.6 11.5 Brown 680.6 2.9 Yankton 603.2 0.2 Davison 431.2 1.1 Lincoln 295.3 0.9 Beadle 290.8 0.3 Lake 263.1 2.4 Hutchinson 202.7 0.0 Lawrence 179.5 2.3 Spink 160.2 41.7 Roberts 158.1 0.1 Bon Homme 143.2 0.1 Marshall 140.4 0.0 Meade 135.7 0.0 Kingsbury 134.7 0.2 Day 131.9 0.0 Charles Mix 128.5 0.0 Moody 111.2 0.0 McCook 108.6 0.0 Clay 107.3 1.0 Turner 99.7 23.4 Clark 98.1 1.0 Edmunds 91.7 8.9
£-1

County 2002 NEI Emissions
(tons) 90.6 90.3 87.9 87.3 85.2 83.1 80.4 76.1 74.7 72.8 72.7 68.7 68.2 66.4 65.8 63.9 63.4
2009 Title V Source Emissions (tons)
0.0 0.0 0.0 0.0 2.5 0.0 0.0 0.0 0.0 0.0 0.0 0.0 2.3 0.5 0.0 0.0 0.0 0.0 0.0 0.0 0.0 0.0 0.0 0.0 0.0 0.0 0.0 0.0 0.0 0.0 0.1 0.0 0.0 0.0 0.0 0.0 0.0
Fall River Tripp Hamlin Hand Deuel Custer Perkins Sanborn Hughes Lyman Potter Miner Butte Walworth Gregory Brule Faulk Douglas 59.2
56.1 55.2 54.8 52.5 51.0 50.1 44.7 44.0 41.6 36.2 35.5 33.6 32.6 30.8 29.9 22.8 15.7 13.7 11.1
McPherson Haakon Hanson Sully Aurora Corson Jackson Campbell Todd Jones Bennett Jerauld Hyde Dewey Shannon Stanley Mellette Ziebach Harding Buffalo 9.1
28,425 0.0
13,323Statewide Total
£-2