demographics in texas and the 2020 census
TRANSCRIPT

Demographics in Texas and the 2020 Census
County Treasurers' Association of Texas (CTAT)San Marcos, TexasApril 24, 2021

Redistricting Dates
• Apportionment File sent to POTUS on 12/31/2020- now by April 30, 2021
• Redistricting Data File (Public Law 94-171 File) received by the Governor no later than April 1, 2021 - now by September 30, 2021
• PL 94-171 released to states in groups of 8 states per week, with one week prior notice
• PL 94-171 File to include: • Race, Hispanic origin, 18 and older, occupancy status,
and group quarters by type.• Data available at WWW.CENSUS.GOV/RDO
2

3
Population Growth and Projected Congressional Seats of Select States
2010Population
2020 Population
NumericChange
2010‐2020
PercentChange
2010‐2020
ProjectedCongressional Seats Added
United States 308,745,538 329,484,123 20,738,585 6.7%
Texas 25,145,561 29,360,759 4,215,198 16.8% 3
Florida 18,801,310 21,733,312 2,932,002 15.6% 2
North Carolina 9,535,483 10,600,823 1,065,340 11.2% 1
Arizona 6,392,017 7,421,401 1,029,384 16.1% 1
Colorado 5,029,196 5,807,719 778,523 15.5% 1
Oregon 3,831,074 4,241,507 410,433 10.7% 1
Montana 989,415 1,080,577 91,162 9.2% 1
California 37,253,956 39,368,078 2,114,122 5.7% ‐1
Minnesota 5,303,925 5,657,342 353,417 6.7% ‐1
Source: U.S. Census Bureau. 2010 Census Count, 2019 Population Estimates; Projected Seats‐ Brookings Institute.

4
U.S. Estimated Population 2020: 329,484,123
Texas Estimated Population 2020:29,360,759
Source: U.S. Census Bureau, 2020 Vintage population estimatesNote: These data are not from the 2020 Census, and estimates based indicators of population growth since the 2010 Census
Texas makes up 8.9% of the total U.S. population in 2020
Texas accounted for 32.4% of the total growth between 2019 and 2020.
5
Pecos
Brewster
Webb
Hudspeth
Presidio Terrell
Reeves
Val Verde
Crockett
Duval
Harris
Hill
Frio
Bell
Kenedy
Kerr
Starr
Polk
Clay
Jeff Davis
Irion
Uvalde
Sutton
Hall
Ellis
Dallam
Gaines
Bexar
Hidalgo
Leon
Hale
Bee
Hartley
Upton
Kinney
Erath
Brazoria
King
Oldham
Zavala
Dimmit
Jack Kent
Gray
Cass
Kimble
Lynn Wise
Lamb Floyd
Andrews
Terry
Coke
Llano Milam
Travis
Ector
Knox
Falls
Collin
Nueces
Ward
Bowie
Kleberg
Foard
Culberson
Edwards
La Salle
Tyler
Medina
Hunt
Rusk
Liberty
Smith
Mills
Lee
Matagorda
Jones
Burnet
Nolan
Potter
Zapata
Cottle
Taylor
Coryell Reagan Houston
Motley
Brown
Young
Maverick
Lamar
Real
Martin
Coleman
Garza
Dallas
Jasper
Fisher
Tom Green
Moore
Baylor
Deaf Smith
Archer
Scurry
Mason
Cooke
Navarro
Parker
Castro
Brooks
Atascosa
Hardin
DeWitt
Lavaca
Bailey
Donley
Bosque El Paso
Denton
Goliad
Wharton
Fannin
Runnels
Concho
Tarrant
Hays Fayette
Carson
Schleicher
Crosby
Crane
Borden
Calhoun
Gillespie
Haskell
Newton
Live Oak
Jefferson
McMullen
Jim Hogg
Randall
Sterling
Briscoe
Shelby
Mitchell
Parmer
Victoria
Wilson
Roberts
Menard
San Saba
Howard
Wood
Panola
Grayson
Trinity
Bastrop
Walker
Midland
Gonzales
Hockley
Anderson
Dickens
Swisher
Winkler
Dawson
Cherokee
Wheeler
Willacy
Grimes
Harrison
Colorado
Red River
Eastland
Lubbock
Williamson
Hemphill
Refugio
Karnes Jackson
McCulloch
Ochiltree
Wilbarger
Austin
Sherman
McLennan
Hansford
Blanco
Callahan Loving
Yoakum
Angelina
Lipscomb
Stephens
Hopkins
Palo Pinto
Stonewall
Montague
Hamilton
Bandera
Jim Wells
Cochran
Limestone
Fort Bend
Kaufman
Armstrong
Freestone Comanche
Montgomery
Glasscock
Kendall
Henderson
Galveston
Comal
Johnson Van Zandt
Wichita
Chambers
Titus
Robertson
Brazos
Hutchinson
Sabine
Upshur
Waller
Shackelford Hood
Childress
Burleson
Nacogdoches
Collingsworth
Lampasas
Throckmorton
Hardeman
Guadalupe Caldwell
Aransas
Marion
San Patricio
Madison
San Jacinto
Delta
Orange
Rains
Gregg
San Augustine
Morris
Franklin
Somervell
Rockwall
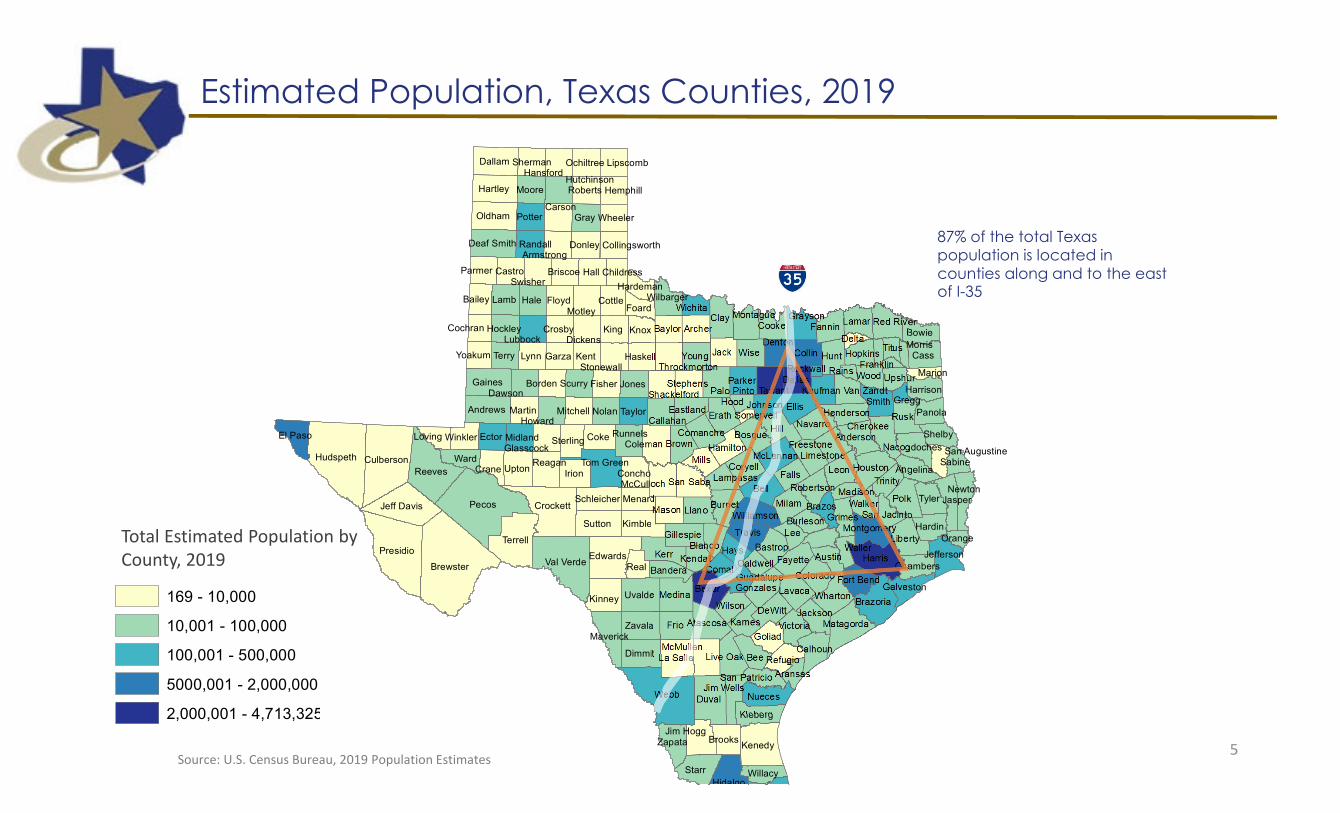
169 - 10,000
10,001 - 100,000
100,001 - 500,000
5000,001 - 2,000,000
2,000,001 - 4,713,325
Estimated Population, Texas Counties, 2019
Source: U.S. Census Bureau, 2019 Population Estimates
Total Estimated Population by County, 2019
87% of the total Texas population is located in counties along and to the east of I-35
6
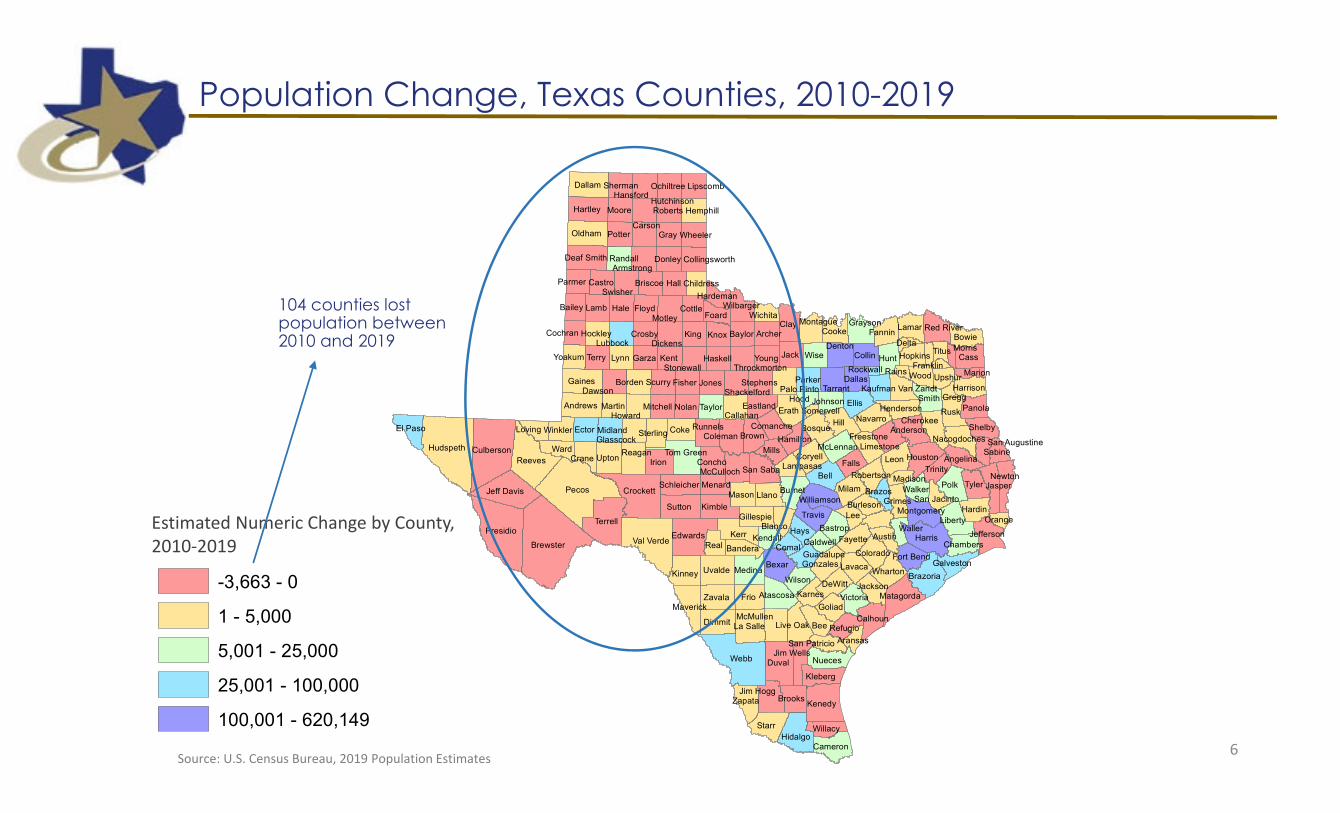
Population Change, Texas Counties, 2010-2019
Source: U.S. Census Bureau, 2019 Population Estimates
-3,663 - 0
1 - 5,000
5,001 - 25,000
25,001 - 100,000
100,001 - 620,149
Pecos
Brewster
Webb
Hudspeth
Presidio Terrell
Reeves
Val Verde
Crockett
Duval
Harris
Hill
Frio
Bell
Kenedy
Kerr
Starr
Polk
Clay
Jeff Davis
Irion
Uvalde
Sutton
Hall
Ellis
Dallam
Gaines
Bexar
Hidalgo
Leon
Hale
Bee
Hartley
Upton
Kinney
Erath
Brazoria
King
Oldham
Zavala
Dimmit
Jack Kent
Gray
Cass
Kimble
Lynn Wise
Lamb Floyd
Andrews
Terry
Coke
Llano Milam
Travis
Ector
Knox
Falls
Collin
Nueces
Ward
Bowie
Kleberg
Foard
Culberson
Edwards
La Salle
Tyler
Medina
Hunt
Rusk
Liberty
Smith
Mills
Lee
Matagorda
Jones
Burnet
Nolan
Potter
Zapata
Cottle
Taylor
Coryell Reagan Houston
Motley
Brown
Young
Maverick
Lamar
Real
Martin
Coleman
Garza
Dallas
Jasper
Fisher
Tom Green
Moore
Cameron
Baylor
Deaf Smith
Archer
Scurry
Mason
Cooke
Navarro
Parker
Castro
Brooks
Atascosa
Hardin
DeWitt
Lavaca
Bailey
Donley
Bosque El Paso
Denton
Goliad
Wharton
Fannin
Runnels
Concho
Tarrant
Hays Fayette
Carson
Schleicher
Crosby
Crane
Borden
Calhoun
Gillespie
Haskell
Newton
Live Oak
Jefferson
McMullen
Jim Hogg
Randall
Sterling
Briscoe
Shelby
Mitchell
Parmer
Victoria
Wilson
Roberts
Menard
San Saba
Howard
Wood
Panola
Grayson
Trinity
Bastrop
Walker
Midland
Gonzales
Hockley
Anderson
Dickens
Swisher
Winkler
Dawson
Cherokee
Wheeler
Willacy
Grimes
Harrison
Colorado
Red River
Eastland
Lubbock
Williamson
Hemphill
Refugio
Karnes Jackson
McCulloch
Ochiltree
Wilbarger
Austin
Sherman
McLennan
Hansford
Blanco
Callahan Loving
Yoakum
Angelina
Lipscomb
Stephens
Hopkins
Palo Pinto
Stonewall
Montague
Hamilton
Bandera
Jim Wells
Cochran
Limestone
Fort Bend
Kaufman
Armstrong
Freestone Comanche
Montgomery
Glasscock
Kendall
Henderson
Galveston
Comal
Johnson Van Zandt
Wichita
Chambers
Titus
Robertson
Brazos
Hutchinson
Sabine
Upshur
Waller
Shackelford Hood
Childress
Burleson
Nacogdoches
Collingsworth
Lampasas
Throckmorton
Hardeman
Guadalupe Caldwell
Aransas
Marion
San Patricio
Madison
San Jacinto
Delta
Orange
Rains
Gregg
San Augustine
Morris
Franklin
Somervell
Rockwall
Estimated Numeric Change by County, 2010‐2019
104 counties lost population between 2010 and 2019

Pecos
Brewster
Webb
Hudspeth
Presidio
Culberson
Terrell
Reeves
Val Verde
Crockett
Duval
Harris
Hill
Frio
Bell
Kenedy
Kerr Edwards
Starr
Polk
Clay
Jeff Davis
Irion
Uvalde
Sutton
Hall
Ellis
Dallam
Gaines
Bexar
Hidalgo
Leon
Hale
Bee
Hartley
Upton
Kinney
Erath
Brazoria
King
Oldham
Zavala
Dimmit
Jack Kent
La Salle
Tyler
Gray
Cass
Medina
Kimble
Lynn Wise Hunt
Rusk
Lamb Floyd
Andrews
Liberty
Terry
Coke
Llano Milam
Travis
Ector
Smith
Knox
Mills
Lee
Falls
Collin
Nueces
Jones
Ward
Burnet
Nolan
Potter
Cottle
Taylor
Coryell
Bowie
Motley
Young
Lamar
Real
Martin
Garza
Dallas Fisher
Moore
Kleberg
Cameron
Baylor
Deaf Smith
Archer
Scurry
Mason
Cooke
Navarro
Parker
Castro
Hardin
Donley
El Paso
Denton
Goliad
Fannin
Schleicher
Gillespie
Shelby
Menard
Foard
Wood
Panola
Harrison
Eastland
Bandera
Matagorda
Zapata
Reagan Houston
Brown
Maverick
Coleman
Jasper
Tom Green
Brooks
Atascosa DeWitt
Lavaca
Bailey
Bosque
Wharton
Runnels
Concho
Tarrant
Hays Fayette
Carson
Crosby
Crane
Borden
Calhoun
Haskell
Newton
Live Oak
Jefferson
McMullen
Jim Hogg
Randall
Sterling
Briscoe
Mitchell
Parmer
Victoria
Wilson
Roberts
San Saba
Howard
Grayson
Trinity
Bastrop
Walker
Midland
Gonzales
Hockley
Anderson
Dickens
Swisher
Winkler
Dawson
Cherokee
Wheeler
Willacy
Grimes
Colorado
Red River
Lubbock
Williamson
Hemphill
Refugio
Karnes Jackson
McCulloch
Ochiltree
Wilbarger
Austin
Sherman
McLennan
Hansford
Blanco
Callahan
Loving
Yoakum
Angelina
Lipscomb
Stephens
Hopkins
Palo Pinto
Stonewall
Montague
Hamilton
Jim Wells
Cochran
Limestone
Fort Bend
Kaufman
Armstrong
Freestone Comanche
Montgomery
Glasscock
Kendall
Henderson
Galveston
Comal
Johnson
Van Zandt
Wichita
Chambers
Titus
Robertson
Brazos
Hutchinson
Sabine
Upshur
Waller
Shackelford Hood
Childress
Burleson
Nacogdoches
Collingsworth
Lampasas
Throckmorton
Hardeman
Guadalupe
Caldwell
Aransas
Marion
San Patricio
Madison
San Jacinto
Washington
Delta
Orange
Rains
Gregg
San Augustine
Morris
Franklin
Camp
Somervell
Rockwall
7
Percent Population Change, Texas Counties, 2010-2019
Source: U.S. Census Bureau, 2019 Population Estimates
-33% - -5%
-4% - 0%
1% - 15%
16% - 31%
32% - 106%
Estimated Percent Change by County, 2010‐2019
Suburban ring counties are among the fastest growing

8
Daily Growth and Components of Change, Texas, 2018‐2019
Added 367,215 between July 1, 2018 and July 1, 2019
• About 1,006 people per day
• About 483 persons per day from natural increase (more births than deaths)
• About 523 per day from net migration (178 international and 345 domestic migrants per day)
Natural Increase48%Domestic
Migration34%
International Migration
18%
Source: US Census Bureau, 2019 Population Estimates

9
213,651 208,964 205,795 213,541 214,380 212,021 209,690 190,951 175,878
70,535 76,954 82,44995,661 110,155 111,983 110,417
104,976
65,044
117,615145,513
110,614
163,160174,200
125,80079,163
82,569
125,660
0
50,000
100,000
150,000
200,000
250,000
300,000
350,000
400,000
450,000
500,000
2011 2012 2013 2014 2015 2016 2017 2018 2019
Natural Increase International Migration Domestic Net Migration
Components of Population Change, 2010-2019
Source: US Census Bureau, 2019 Vintage population estimates
Migration and natural increase contribute about equally to population growth in Texas

Source: U.S. Census Bureau, State to State Migration Flows, 2019; for infographic: https://demographics.texas.gov/Infographics/2020/TexasNetMigration
10

County US Rank 2019 Population Estimate Population Change 2018‐2019
Percent of Change from Natural Increase
Percent of Change from Domestic
Migration
Percent of Change from International
Migration
Harris 3 4,713,325 33,280 116.5% ‐91.5% 74.8%Collin 4 1,034,730 30,423 20.8% 65.6% 13.5%Denton 5 887,207 28,466 19.8% 74.0% 5.8%Travis 6 1,273954 27,382 32.7% 51.0% 15.7%
Williamson 9 590,551 24,088 15.3% 81.0% 3.3%Fort Bend 10 811,688 23,607 24.4% 57.1% 18.5%Bexar 11 2,003,554 22,367 56.0% 33.5% 10.5%Tarrant 12 2,102,515 21,069 65.1% 12.1% 23.0%
Montgomery 16 607,391 17,621 18.3% 76.2% 5.3%Comal 46 156,209 8,068 4.3% 94.2% 1.1%
Kaufman 49 136,154 7,875 9.4% 90.5% ‐0.1%Bell 53 362,924 7,527 48.3% 49.8% 1.5%Hays 54 230,191 7,485 19.9% 76.8% 2.8%
Hidalgo 74 868,707 6,409 147.6% ‐47.4% ‐0.3%Dallas 77 2,635,516 6,166 345.9% ‐395.5% 149.9%
Top Counties for Numeric Growth in Texas, 2018-2019
Harris, Dallas, and Hidalgo Counties had negative net migration
Source: US Census Bureau, 2018 Population Estimates

Top Counties for Percent Growth in Texas, 2018‐2019*
County100 US Rank 2019 Population Estimate
Population Change
2018‐2019
Percent PopulationChange
2018‐2019
Percent of PopulationChange from
Natural Increase
Percent of Population Change from Domestic Migration
Percent of Population Change from International Migration
Kaufman 2 136,154 7,875 6.1% 9.4% 90.5% ‐0.1%Comal 4 156,209 8,068 5.4% 4.3% 94.2% 1.1%
Rockwall 6 104,915 4,369 4.3% 9.8% 88.6% 1.5%Williamson 9 590,551 24,088 4.3% 15.3% 81.0% 3.3%Kendall 14 47,431 1,828 4.0% 0.6% 97.9% 1.5%Andrews 18 18,705 694 3.9% 14.0% 84.0% 2.0%Chambers 20 43,837 1,610 3.8% 17.8% 80.1% 2.2%Parker 25 142,878 4,808 3.5% 8.2% 90.9% 0.7%Hays 28 230,191 7,485 3.4% 19.9% 76.8% 2.8%
Denton 32 887,207 28,466 3.3% 19.8% 74.0% 5.8%Ellis 34 184,826 5,820 3.3% 16.0% 83.2% 0.7%Waller 36 55,246 1,734 3.2% 20.0% 78.4% 1.4%Gaines 37 21,492 672 3.2% 46.0% 43.9% 10.0%Collin 49 1,034,730 30,423 3.0% 20.8% 65.6% 13.5%
*Among counties with populations of 10,000 or more in 2018Source: US Census Bureau, 2019 Population Estimates

Rank Name April 1, 2010 July 1, 2018 July 1, 2019NumericChange
Percent Change
1 Dallas‐Fort Worth‐Arlington, TX 6,366,537 7,455,756 7,573,136 1,206,599 19.02 Houston‐The Woodlands‐Sugar Land, TX 5,920,487 4,849,209 7,066,141 1,145,654 19.43 Phoenix‐Mesa‐Chandler, AZ 4,193,129 4,849,209 4,948,203 755,074 18.04 Atlanta‐Sandy Springs‐Alpharetta, GA 5,286,718 6,976,147 6,020,364 733,646 13.95 Washington‐Arlington‐Alexandria, DC‐VA‐MD‐WV 5,649,688 5,945,303 6,280,487 630,799 11.26 Miami‐Fort Lauderdale‐Pompano Beach, FL 5,566,274 6,143,837 6,166,488 600,214 10.87 Seattle‐Tacoma‐Bellevue, WA 3,439,808 3,935,179 3,979,845 540,037 15.78 Austin‐Round Rock‐Georgetown, TX 1,716,323 2,165,497 2,227,083 510,760 29.89 Orlando‐Kissimmee‐Sanford, FL 2,134,399 2,574,838 2,608,147 473,748 22.210 Riverside‐San Bernardino‐Ontario, CA 4,224,948 4,612,542 4,650,631 425,683 10.111 Denver‐Aurora‐Lakewood, CO 2,543,608 2,931,665 2,967,239 423,631 16.712 Tampa‐St Petersburg‐Clearwater, FL 2,783,485 3,154,649 3,194,831 411,346 14.813 San Antonio‐New Braunfels, TX 2,142,520 2,512,379 2,550,960 408,440 19.114 San Francisco‐Oakland‐Berkeley, CA 4,335,593 4,726,314 4,731,803 396,210 9.115 Charlotte‐Concord‐Gastonia, NC‐SC 2,243,963 2,592,950 2,636,883 392,920 17.5
13Source: US Census Bureau, 2019 Vintage Population Estimates
Top 15 Metros in Numeric Growth, 2010-2019

14
1969 and before
1970‐1989
1990‐2009
2010‐2019
Source: U.S. Census Bureau, American Community Survey, 5‐Year Sample 2014‐2019
Percent of Housing Stock Built in Select Periods, Census Tracts, Texas, 2014-2019

15
NH White, 45%
NH Black, 12%
NH Asian, 4%
NH Other, 2%
Hispanic, 38%
20102,064,657 601,726 522,136 497,006 164,795
53.6%
15.6% 13.6% 12.9%
4.3%
0.0%
10.0%
20.0%
30.0%
40.0%
50.0%
60.0%
0
500,000
1,000,000
1,500,000
2,000,000
2,500,000
Hispanic NH Black NH White NH Asian NH Other
Share of Contribution to Total Population Change, 2010‐2019
Numeric Change, 2010‐2019
NH White41%
NH Black12%
Hispanic 40%
NH Asian5%
NH Other2%
2019
86.4% of growth has been from minority groups
Race/Ethnic Composition, Texas, 2010-2019
Source: US Census Bureau 2019 Population Estimates

Annual Shares of Recent Immigrants to Texas by World Area of Birth, 2005-2015
16Source: US Census Bureau, American Community Survey, 1‐Year PUMS
44.1%
50.6%
69.4%
35.8%
33.0%
17.3%
7.1%
7.3%
7.8%
13.1%
9.1%
5.5%
2015
2010
2005
Latin America Asia Europe Africa and Other
Estimated number of international migrants to Texas
101,588
77,702
98,194

17

18
Unauthorized immigrant population trends for Texas

19
Median Age and Change for Select States and the US, 2010 and 2018
31
34.8 35.236.8 37.9 38.2 38.3 39 39.4
42.2 42.8 42.8 4344.9
1.8 1.2
‐1.8
1.6 2.0 1.0 1.7 1.0 0.31.5 1.3
5.9
1.9 2.2
‐10
0
10
20
30
40
50
1‐Apr‐10 1‐Jul‐18 Change Median Age

20
Total Fertility Rate for Select States, 2008‐2018
2.59
2.36
2.08
1.88
2.15
1.77
2.031.87
1.73
1.67 1.63
1.45
1.2
1.3
1.4
1.5
1.6
1.7
1.8
1.9
2
2.1
2.2
2.3
2.4
2.5
2.6
2.7
Utah Texas Total United States New York California Massachusetts
2008 2009 2010 2011 2012 2013 2014 2015 2016 2017 2018

21
0.01 0.01 0.00 0.01 0.01< 1 year5 years10 years15 years20 years25 years30 years35 years40 years45 years50 years55 years60 years65 years70 years75 years80 years85 plus
Male Female
US Population Pyramid, 2010 and 2018
0.01 0.01 0.00 0.01 0.01< 1 year5 years10 years15 years20 years25 years30 years35 years40 years45 years50 years55 years60 years65 years70 years75 years80 years85 plus
Male Female
2010 2018
Source: US Census Bureau, 2010 Census and 2018 Population Estimates

0.01 0.01 0.00 0.01 0.01< 1 year5 years10 years15 years20 years25 years30 years35 years40 years45 years50 years55 years60 years65 years70 years75 years80 years85 plus
Male Female
22
Texas Population Pyramid, 2010 and 2018
Source: US Census Bureau, 2010 Census and 2018 Population Estimates
0.01 0.01 0.00 0.01 0.01< 1 year5 years10 years15 years20 years25 years30 years35 years40 years45 years50 years55 years60 years65 years70 years75 years80 years85 plus
Male Female
2010 2018

23
Texas White (non‐Hispanic) and Hispanic Populations by Age, 2019
0
50,000
100,000
150,000
200,000
250,000
Popu
latio
n
Age
White (non‐Hispanic)
Hispanic
Source: Texas Demographic Center, 2018 Population Estimates

24
0.0
5.0
10.0
15.0
20.0
25.0
30.0
2006 2008 2010 2012 2014 2016 2018
Total Hispanic White Black Asian
Crude Birth Rates by Race/Ethnicity, Texas, 2006-2018
Source: Centers for Disease Control and Prevention, National Center for Health Statistics, National Vital Statistics Report

25
250,000 200,000 150,000 100,000 50,000 0 50,000 100,000 150,000 200,000 250,000< 1 year
5 years
10 years
15 years
20 years
25 years
30 years
35 years
40 years
45 years
50 years
55 years
60 years
65 years
70 years
75 years
80 years
85 plus
White Male White Female
Texas Population Pyramid by Race/Ethnicity, 2019
Source: US Census Bureau, 2019 Population Estimates

26
250,000 200,000 150,000 100,000 50,000 0 50,000 100,000 150,000 200,000 250,000< 1 year
5 years
10 years
15 years
20 years
25 years
30 years
35 years
40 years
45 years
50 years
55 years
60 years
65 years
70 years
75 years
80 years
85 plus
Hispanic Male Black Male Asian Male Other Male
Hispanic Female Black Female Asian Female Other Female
Texas Population Pyramid by Race/Ethnicity, 2019
Source: US Census Bureau, 2019 Population Estimates

27
250,000 200,000 150,000 100,000 50,000 0 50,000 100,000 150,000 200,000 250,000< 1 year
5 years
10 years
15 years
20 years
25 years
30 years
35 years
40 years
45 years
50 years
55 years
60 years
65 years
70 years
75 years
80 years
85 plus
White Male Hispanic Male Black Male Asian Male Other Male
White Female Hispanic Female Black Female Asian Female Other Female
Texas Population Pyramid by Race/Ethnicity, 2019
Source: US Census Bureau, 2019 Population Estimates

28
84.6%
68.3%
94.4%91.2% 89.4%
30.8%
16.1%
39.4%
25.7%
60.6%
0.0%
10.0%
20.0%
30.0%
40.0%
50.0%
60.0%
70.0%
80.0%
90.0%
100.0%
Total Hispanic NH White Black Asian
High School and Above Bachelor's Degree and Above
Educational Attainment by Race/Ethnicity Adults Aged 25 Years and Older, Texas, 2019
Source: US Census Bureau American Community Survey, 2019 1‐Year Estimates

Percent of Civilian Labor Force by Occupation, Texas, 2007, 2017 and 2017‐2017 Change
Source: US Census Bureau, American Community Survey, 1‐Year Sample, 2007, 2017
9.3%
4.3% 4.3%
7.8%
3.8%
12.6%
10.4%
4.9%5.5%
7.0%
3.4%
11.8%
1.0% 0.5%1.2%
‐0.8% ‐0.4% ‐0.8%Managementoccupations
Business and financialoperationsoccupations
Healthcarepractitioners and
technical occupations
Construction andextractionoccupations
Installation,maintenance, andrepair occupations
Production,transportation, andmaterial movingoccupations
2007 2017 Change

Percent Distribution of Educational Attainment of Persons Aged 25 Years and Older, Texas, 2008, 2011, and 2015
20.4% 18.9% 17.6%
25.4% 25.5% 25.3%
28.8% 29.1% 28.7%
17.1% 17.7% 18.7%
8.3% 8.7% 9.7%
0%
10%
20%
30%
40%
50%
60%
70%
80%
90%
100%
2008 2011 2015
Percent
Year
Graduate orProfessional Degree
Bachelor Degree
Some College orAssociate Degree
High School orEquivelent
Less than HighSchool
42.9%
57.1%
45.8%
54.2%
Source: US Census Bureau, American Community Survey, 1‐Year Samples, 2008‐2015

11.8% 12.2% 6.7%
36.5% 33.6%
29.6%
14.2% 23.9%
27.6%27.5%
36.3%
15.9%
32.2%
22.7% 24.0%
22.4%
57.7%
37.2%
13.2% 15.0%
0%
10%
20%
30%
40%
50%
60%
70%
80%
90%
100%
Black Asian Non‐HispanicWhite
Hispanic All Other
Bachelor,Graduate,ProfessionalDegreeSome College orAssociateDegree
High School orEquivelant
Less than HighSchool
Educational Attainment of Persons Age 25 Years and Older by Race/Ethnicity, Texas, 2015
Source: US Census Bureau, American Community Survey, 1‐Year Sample, 2015
35.9%
69.4 %

Percent of the Population Aged‐25 Years and Older with a Bachelor’s Degree or Higher by Race/Ethnicity, Texas, 2007 and 2017
32
33.3%
18.0%
10.7%
52.8%
38.6%
24.2%
14.5%
59.2%
0%
10%
20%
30%
40%
50%
60%
70%
White, NH Black Hispanic Asian
2007 2017
Source: US Census Bureau, ACS 1‐Year Estimates, 2007, 2017
53%
62%
38%
64%Change in percent

33
Percent of Households with Broadband Internet, Census Tracts, Texas, 2014‐2019

34
Percent of Households with Broadband Internet, Census Tracts, Texas, 2014‐2019
Source: U.S. Census Bureau, American Community Survey, 5‐Year Sample 2014‐2019

35
Projected Population, 2010‐2050, Texas
40.5
54.4
29.7
34.9
40.7
47.3
20
25
30
35
40
45
50
55
Millions
0.5 Migration
1.0 Migration
2010‐2015 Migration
Source: Texas Demographic Center, 2014 and 2018 Population Projections

Source: Texas Demographic Center, 2018 Population Projections
Projected Population Change, Texas Counties, 2020-2050

Source: Texas Demographic Center, 2018 Population Projections
Projected Percent Population Change, Texas Counties, 2020-2050

38
Projected Population by Race and Ethnicity, Texas 2010‐2050
Source: Texas Demographic Center 2018 Population Projections
13.5
6.0
20.2
5.8
1.80
5
10
15
20
25
2010 2015 2020 2025 2030 2035 2040 2045 2050
Millions
NH White NH Black Hispanic NH Asian NH Other

Projected Population Change and Percent of Total Change by Race/Ethnicity, Texas, 2010-2030
39
1,376,711 1,436,158 4,992,028 1,466,352 477,642
14.1% 14.7%
51.2%
15.0%
4.9%
0.0%
10.0%
20.0%
30.0%
40.0%
50.0%
60.0%
0
1,000,000
2,000,000
3,000,000
4,000,000
5,000,000
6,000,000
NH White NH Black Hispanic NH Asian NH Other
Numeric Change Percent of Total Population ChangeSource: Texas Demographic Center 2018 Population Projections
