demographic statistics bulletin 2015
TRANSCRIPT

DEMOGRAPHIC
STATISTICS
BULLETIN
2015
1
A Publication of Demographic Statistics Division

i
TABLE OF CONTENTS
Contents TABLE OF CONTENTS ..................................................................................................................................... i
LIST OF TABLES ............................................................................................................................................. ii
LIST OF FIGURES .......................................................................................................................................... iii
PREFACE ....................................................................................................................................................... iv
EXECUTIVE SUMMARY ................................................................................................................................. v
CHAPTER 1: NIGERIA DEMOGRAPHIC PROFILE ........................................................................................... 1
1. Overview........................................................................................................................................... 1
1.2 Sex Ratio ............................................................................................................................................. 1
CHAPTER 2: FERTILITY .................................................................................................................................. 3
2.1 Fertility.......................................................................................................................................... 3
CHAPTER 3: MORBIDITY ............................................................................................................................... 4
3.0 Introduction ...................................................................................................................................... 4
3.1 Case Rates and Reporting of Notifiable Diseases ............................................................................. 4
CHAPTER 4: MORTALITY .............................................................................................................................. 8
4.1 Maternal Mortality ...................................................................................................................... 8
4.2 Infant and Under Five Mortality .................................................................................................. 8
REFERENCES .................................................................................................................................................. 9

ii
LIST OF TABLES
Table 1: Case Rates of Reported Notifiable Diseases by Sex in Nigeria, 2010-2015 .................................. 5
Table 2: Case Fatality Rates of Notifiable Diseases By Sex, 2010-2015 ...................................................... 6
iii
LIST OF FIGURES
Figure 1: Nigeria Population and Specific Population Groups, 2006-2015................................................. 1
Figure 2: Nigeria Population By Age Groups and Sex, 2006-2015 .............................................................. 2
Figure 3: Total Fertility Rate By State ..........................................................................................................
3

iv
PREFACE
This Bulletin is the second in the series and sheds light on some selected measures of demographic change
with a brief reflection on the sources of the data, analysis and interpretation. It featured some
demographic indicators derived from the compiled health records of births, deaths, and diseases from
2010 to 2015 in the 36 states of the Federation but excluding the FCT, Abuja.
The current edition demonstrates how available data can be used to measure the reality of demographic
situation in Nigeria. While the study demonstrates what is possible when all needed data is available, it
also raised concerns on the imperative for better record keeping at health facilities nation-wide,
strengthening the capacity of health record-keepers and creating stronger statistical synergy between
reporting institutions.
This Bulletin continues to build on the foundation of the earlier and maiden edition and will focus mainly
on few selected demographic indicators namely population, fertility, morbidity, mortality and other
reproductive health-related issues that are of pressing public concern in Nigeria.
The Bureau remains resolutely committed to promoting and sustaining a public culture that appreciates
the inherent value in the use of demographic statistics for planning and decision-making; and the
expectation that development policies can be better identified, targeted, monitored and evaluated with
evidence-based data collected from a well-designed statistical inquiry.
Dr. Yemi Kale
Statistician General/CEO
National Bureau of Statistics
November 2016

v
EXECUTIVE SUMMARY
Timely, reliable, comparable and accurate information on demographic conditions is a key ingredient in
national development planning. This edition of the NBS’ Demographic Statistics Bulletin provides
information on some selected demographic indicators relating to population, fertility, morbidity, and
mortality.
The data used for this edition of the Bulletin are updates of births, deaths and diseases’ records obtained
mostly from State Ministries of Health (SMoH) and Health Management Boards (HMB) in the 36 states of
the Federation but excluding the FCT, Abuja for the period 2010-2015. The computation of some
indicators, especially those, requiring the total population or any subset of it were carried out using the
projected population estimates of each specific year from the published figures of the 2006 Population
and Housing Census (NPopC, 2006).
Of the 36 states visited for the data updates, only 80.6 percent provided data that covered all the
referenced periods. Three states, Akwa Ibom, Niger and Ogun did not provide any data at all throughout
the periods under review. Abia, Adamawa, Gombe, Kaduna, Kano, Katsina and Oyo provided data, which
covered some one or two years of the periods reviewed.
Sex ratio dropped from 103 men per 100 women in 2006 to 102 men per 100 women in 2015. This is
understandable considering that sex ratios generally vary because of different patterns of mortality and
migration for males and females within a population.
The total fertility rate in 2015 was 5.5 births per women or 5,500 births per 1000 women. This simply
means that if the 2015 age-specific rates continued unchanged, women in Nigeria would have on the
average 5.5 children each during their childbearing years.
As noted in the maiden edition, some challenges; though quite persistent and recurring were observed
during the conduct of this study. As always, appropriate record-keeping culture remained a number one
daunting challenge among health facilities visited, which resulted in actual data gaps. In addition,
institutional synergy between health care facilities and their supervising ministries appears less than
desirable and lastly, data recording and record-keeping systems in most states’ health facilities are quite
inadequate to effectively support robust reporting of demographic events. It is our hope that future
editions of this Bulletin will continue to improve in content presented herein until the desired highest
quality threshold is achieved.

1
Nigeria Demographic Profile Chapter 1 Demography is the study of human population.
Demographic statistics provide planning information on
population and various demographic events such as births,
deaths, diseases, marriages and
divorces categorized by age, gender, marital status,
and educational attainment. Other derivative indicators
such as total fertility rate, life expectancy at birth,
agedependency ratios, crude rates of births, deaths and
population growth as well as establishing scientific basis
for monitoring and evaluating impacts of population with
focus on population size, growth, distribution, processes,
structure and other dynamics.
1. Overview
Nigeria, ranked tenth in the world, is among the most populous and fastest growing countries in
Africa. In 2015, the population was estimated at 183 million people. Of which, 49.5 percent are
women and 50.5 percent are men. International migration, so far, plays very negligible role in
determining the actual population of Nigeria, whereas, past fertility and mortality trends seem
to have contributed significantly to the very high rate of population growth, which at the moment
is estimated at 3.28 percent per annum. Figure 1 shows the projected population of Nigeria from
Figure 1: Nigeria Population and Specific Population Groups, 2006-2015 ratios
generally vary because of different patterns of mortality and migration for males and
2006-2015 .
1.2 Sex Ratio
In 2006, Nigeria
sex ratio was 103
men per 100
women, this
dropped to 102
per 100 men
women in 2015.
The drop, is
largely
explained, by the
sex that fact
-
20,000,000
40,000,000
60,000,000
80,000,000
100,000,000
120,000,000
140,000,000
160,000,000
180,000,000
200,000,000
2006 2007 2008 2009 2010 2011 2012 2013 2014 2015
Year
Total Population Children < 15 years Youth 15-39 years Adults 40-59 years Elderly 60+ years

2
females within a population. From Figure 1 and 2, the trend emerging clearly shows that the population of the country is growing steadily since 2006 and will continue to grow for many years to come.
Figure 2: Nigeria Population By Age Groups and Sex, 2006-2015

3
2.1 Fertility
Fertility understood in terms of child bearing, refers to the number of children ever born. It
depends on many factors and social circumstances, such as cultures, traditions, education and
the overall level of development of a particular society or community. Also, the age of entry into
a union and the availability of contraception are two key proximate determinants of fertility. The
per woman (or 5,500 Figure 3: Total Fertility Rate By State births per 1000 women).
This simply means that, if the 2015 age-specific rates remained the same, then all women in
Nigeria would have, on the average, 5.5 children each during their childbearing years. Figure 3
gives a breakdown of the total fertility rate for Nigeria and each of the 36 states of the Federation
and FCT, Abuja.
Fertility Chapter 2 Fertility refers to the number of live births women of
reproductive age, that is, women age 15-49 years have. It differs from fecundity, which refers to the internal (that is physiological) capability of women to reproduce.
most commonly used
measure of fertility is the
total fertility rate (TFR),
which is the number of
children that a woman
over have her would
years, childbearing
provided at each age, she
experienced the age-
specific fertility rate . Age
specific rate, in turn, is the
number by births of
women of a given age
group per 1000 women in
that particular age group.
In 2015, the total fertility
rate remained as 5.5 births
0.0 2.0 4.0 6.0 8.0 10.0
Abia Akwa-Ibom
Bauchi Benue
C/River Ebonyi
Ekiti Gombe Jigawa
Kano Kebbi
Kwara Nasarawa
Ogun Osun
Plateau Sokoto
Yobe FCT Abuja
Total Fertility Rate

4
3.0 Introduction In Nigeria, the presence of diseases, illnesses, injuries and disabilities are only known and studied
through the cases reported at recognized health facilities across the country. Before going into
details, it is important to note that there are three key indicators, which describes the health
status of a population at a point in time.
These are incidence rate, prevalence rate, and case rate. The incidence rate is the number of persons contacting a disease during a given time period per 1,000 population at risk. The incidence rate differs from other morbidity rates in that almost any constant may be used to express it in a clear manner. For example, from “per 100” or “percent” to “per 100,000”; The prevalence rate is the number of persons who have a particular disease at a given point in time per 1,000 population and includes all known and new developing cases that have not resulted in death, cure or remission during the specified period; The case rate is the number of reported cases of a specific disease or illness per 100,000 population during a given year. It is a special type of incidence rate but differs slightly because it is based on the number of reported cases, which is not necessarily, the number of persons contacting the disease, that is, some people may get the disease or illness more than once.
3.1 Case Rates and Reporting of Notifiable Diseases
The cases of notifiable diseases reported and studied covering the periods 2010-2015 are
HIV/AIDS, pneumonia, malaria, hepatitis B, tuberculosis, yellow fever, measles, diarrhoea-water
without blood, diarrhoea-water with blood, and meningitis. Others include cholera, other STDs,
pertusis, vaginal discharge, lymphatic, male urethral discharge, NNT, filariasis, onchocerciasis,
genital ulcer, polio, AFP, female non-ves genital ulcer, and plague. From 2010-2015, the total
number of all cases of notifiable diseases reported in health facilities rose and fell. It rose from
1,666,854, of which 785,508 are males and 881,346 are females in 2010 to 2,161,326, of which
1,010,112 are males and 1,151,214 are females in 2011 representing 30.0 percent and further to
3,981,773, of which 1,647,865 are males and 2,333,908 are females in 2012 representing 84.0
percent and then fell to 1,438,875, of which 676,522 are males and 762,353 are females in 2015
Morbidity Chapter 3 Morbidity refers to the presence of disease, illness, injuries
and disabilities in a population.

5
representing 64.0 percent. Cumulatively, in the period under review, a total of 9,248,828 cases
of notifiable diseases were reported. Of which, males reported 4,120,007 cases and females
5,128,821 cases. Table 1 shows the case rates and percentage of notifiable diseases reported by
sex in Nigeria from 2010-2015.
Table 1: Case Rates of Reported Notifiable Diseases by Sex in Nigeria, 2010-2015
2010 2011 2012 2013 2014 2015 Notifiable Disease
Male Female Male Female Male Female Male Female Male Female Male Female HIV AIDS 13.7 24.4 12.3 23.4 5.9 10.2 13.0 13.0 23.4 24.4 10.2 12.3
Pneumonia 4.9 3.5 5.1 4.3 3.9 2.9 2.6 2.6 4.3 3.5 2.9 5.1
Malaria 66.9 59.9 70.3 62.1 68.6 56.8 56.8 56.8 62.1 59.9 56.8 70.3
Hepatitis B 0.1 0.1 0.3 0.3 4.4 0.4 0.5 0.5 0.3 0.1 0.4 0.3
Tuberculosis 1.1 1.0 1.1 0.9 0.8 1.0 0.9 0.9 0.9 1.0 1.0 1.1
Yellow Fever 0.1 0.0 0.0 0.0 3.8 0.0 0.0 0.0 0.0 0.0 0.0 0.0
Measles 0.5 0.4 0.9 0.8 5.6 4.4 4.4 4.4 0.8 0.4 4.4 0.9
Diarrhoea (Water Without Blood) 9.0 6.7 6.7 6.2 3.9 9.8 9.0 9.0 6.2 6.7 9.8 6.7
Diarrhoea (Water With Blood) 3.0 2.3 2.6 1.0 2.2 12.5 10.5 10.5 1.0 2.3 12.5 2.6
Meningitis 0.1 0.1 0.2 0.1 0.1 0.0 0.0 0.0 0.1 0.1 0.0 0.2
Cholera 0.1 0.1 0.1 0.1 0.1 0.1 0.0 0.0 0.1 0.1 0.1 0.1
Other STDs 0.3 0.3 0.2 0.2 0.1 0.9 1.1 1.1 0.2 0.3 0.9 0.2
Pertusis 0.1 0.1 0.1 0.1 0.2 0.1 0.1 0.1 0.1 0.1 0.1 0.1
Vaginal Discharge 0.0 0.8 0.0 0.4 0.0 0.0 0.7 0.7 0.4 0.8 0.0 0.0
Lymphatic 0.0 0.0 0.0 0.0 0.0 0.0 0.1 0.1 0.0 0.0 0.0 0.0
Male Urethral Discharge 0.1 0.0 0.2 0.0 0.2 0.3 0.0 0.0 0.0 0.0 0.3 0.2
NNT 0.0 0.0 0.0 0.0 0.0 0.0 0.0 0.0 0.0 0.0 0.0 0.0
Filariasis 0.0 0.0 0.0 0.0 0.0 0.0 0.0 0.0 0.0 0.0 0.0 0.0
Onchocerciasis 0.0 0.0 0.0 0.0 0.0 0.0 0.0 0.0 0.0 0.0 0.0 0.0
Genital Ulcer 0.0 0.1 0.0 0.0 0.0 0.2 0.2 0.2 0.0 0.1 0.2 0.0
Polio 0.0 0.0 0.0 0.0 0.0 0.0 0.0 0.0 0.0 0.0 0.0 0.0
AFP 0.0 0.0 0.0 0.0 0.0 0.0 0.0 0.0 0.0 0.0 0.0 0.0
Female Non-Ves Genital Ulcer 0.0 0.0 0.0 0.0 0.0 0.0 0.0 0.0 0.0 0.0 0.0 0.0
Plague 0.0 0.0 0.0 0.0 0.0 0.0 0.0 0.0 0.0 0.0 0.0 0.0
All Reported Cases 100.0 100.0 100.0 100.0 100.0 100.0 100.0 100.0 100.0 100.0 100.0 100.0
Source: NBS/Ministry of Health
From the above table, the most reported disease or illness in 2010 and 2015 is malaria. Males
reported 66.9 percent and females 59.9 percent of the disease in 2010 while in 2015, the figures

6
are 56.8 percent by males and 70.3 percent by females. This was followed by HIV/AIDS, which
was reported by males 13.7 percent and females 24.4 percent in 2010 to 10.2 percent by males
and 12.3 percent by females in 2015. Closely following in descending order of reported cases is
diarrhoea showing water without blood and diarrhoea showing water with blood. Other diseases
or illnesses whose reported cases are significant include pneumonia, measles, meningitis,
hepatitis B, tuberculosis, yellow fever, cholera and other STDs. Cases of pertusis, vaginal
discharge, lymphatic, male urethral discharge, heart disease/stroke (as measured by the
numberneeded-to-treat or NNT), filariasis, onchocerciasis, genital ulcer, polio, AFP, female non-
ves genital ulcer and plague are less or not reported at all.
3.2. Case Fatality Rate of Notifiable Diseases
Case fatality rate is the proportion of persons contacting a disease and who died of the disease
during a specified time period. For the reference periods, 2010-2015, the case fatality rates were
defined dividing the number of deaths from a particular disease by the number of persons
contacting the disease during each of the periods and multiplying by 100. Table 2 shows the case
fatality rate of the notifiable diseases by sex between January 2010 and December 31, 2015.
Table 2: Case Fatality Rates of Notifiable Diseases By Sex, 2010-2015
2010 2011 2012 2013 2014 2015 Disease Male Female Male Female Male Female Male Female Male Female Male Female
HIV AIDS 15.3 11.6 7.0 4.2 9.6 11.5 29.2 26.3 9.6 15.3 4.2 11.5
Pneumonia 0.6 0.7 0.5 0.6 0.3 0.3 1.3 1.3 0.3 0.6 0.6 0.3
Malaria 7.7 10.2 9.4 11.8 4.4 3.4 5.3 6.1 4.4 7.7 11.8 3.4
Hepatitis B 25.5 11.8 14.7 6.7 0.5 1.2 24.8 14.5 0.5 25.5 6.7 1.2
Tuberculosis 23.2 21.2 19.7 19.0 15.3 15.1 38.8 43.7 15.3 23.2 19.0 15.1
Yellow Fever 0.2 0.0 0.0 0.0 0.0 0.0 30.7 26.3 0.0 0.2 0.0 0.0
Measles 4.7 5.1 2.6 2.2 0.1 0.1 0.8 0.8 0.1 4.7 2.2 0.1
Diarrhoea (Water Without Blood) 20.9 10.1 9.8 9.8 8.4 9.5 8.4 9.6 8.4 20.9 9.8 9.5
Diarrhoea (Water With Blood) 0.1 0.1 0.2 0.3 0.1 0.1 0.1 0.1 0.1 0.1 0.3 0.1
Meningitis 14.1 11.7 8.3 13.4 2.8 98.9 10.5 9.0 2.8 14.1 13.4 98.9
Cholera 6.8 2.2 9.8 4.4 3.8 5.1 3.9 3.9 3.8 6.8 4.4 5.1
Other STDs 7.5 6.6 18.5 18.5 10.1 8.4 0.0 0.1 10.1 7.5 18.5 8.4
Pertusis 0.4 0.6 0.4 0.5 0.1 0.0 0.0 0.0 0.1 0.4 0.5 0.0
Vaginal Discharge 0.0 0.5 0.0 1.1 0.0 0.9 0.0 16.7 0.0 0.0 1.1 0.9
Lymphatic 26.7 23.1 57.1 31.7 83.3 2.0 0.0 0.0 83.3 26.7 31.7 2.0
Male Urethral Discharge 0.0 0.0 0.0 0.0 0.0 0.0 0.0 0.0 0.0 0.0 0.0 0.0
NNT 0.0 0.3 0.5 0.6 0.9 1.4 0.0 0.4 0.9 0.0 0.6 1.4
Filariasis 0.0 0.0 0.0 2.0 5.6 11.3 0.0 0.0 5.6 0.0 2.0 11.3

7
Onchocerciasis 0.0 0.0 1.7 4.4 2.2 6.4 0.0 0.0 2.2 0.0 4.4 6.4
Genital Ulcer 0.0 0.0 0.0 0.0 0.0 0.0 0.0 0.0 0.0 0.0 0.0 0.0
Polio 0.0 0.0 0.0 0.0 0.0 0.0 0.0 0.0 0.0 0.0 0.0 0.0
AFP 0.0 0.0 0.0 0.0 0.0 0.0 0.0 0.0 0.0 0.0 0.0 0.0
Female Non-Ves Genital Ulcer 0.0 0.0 0.0 0.0 0.0 0.0 0.0 0.0 0.0 0.0 0.0 0.0
Plague 0.0 0.0 0.0 0.0 0.0 0.0 0.0 0.0 0.0 0.0 0.0 0.0
All Reported Cases 9.5 9.9 8.5 9.2 4.1 9.1 11.9 12.4 4.1 9.5 9.2 9.1
Source: NBS/Ministry of Health
3.2.1 Case Fatality Rate
In Nigeria, since the recognition of HIV/AIDS in the early 1980s, the disease has continued to be
a critical health issue for women and men. The epidemic is also known to have undermined
development efforts worldwide and mostly afflict people, whose immunity had already been
destroyed by extreme poverty. It has particularly been noted too, that the disease affects the
working population, and thus prevent women and men from making meaningful contributions to
development efforts and general improvement of families. At the household level, the epidemic
increases the burden of care and erodes savings. Among the reported cases of HIV/AIDS in the
reference periods 2010-2015, Table 2 shows that 15.3 percent of males and 11.6 percent of
females living with the disease died of the illness in 2010 whereas a lower percentage of men
4.2 percent and women 11.5 percent died of the disease in 2015.
8
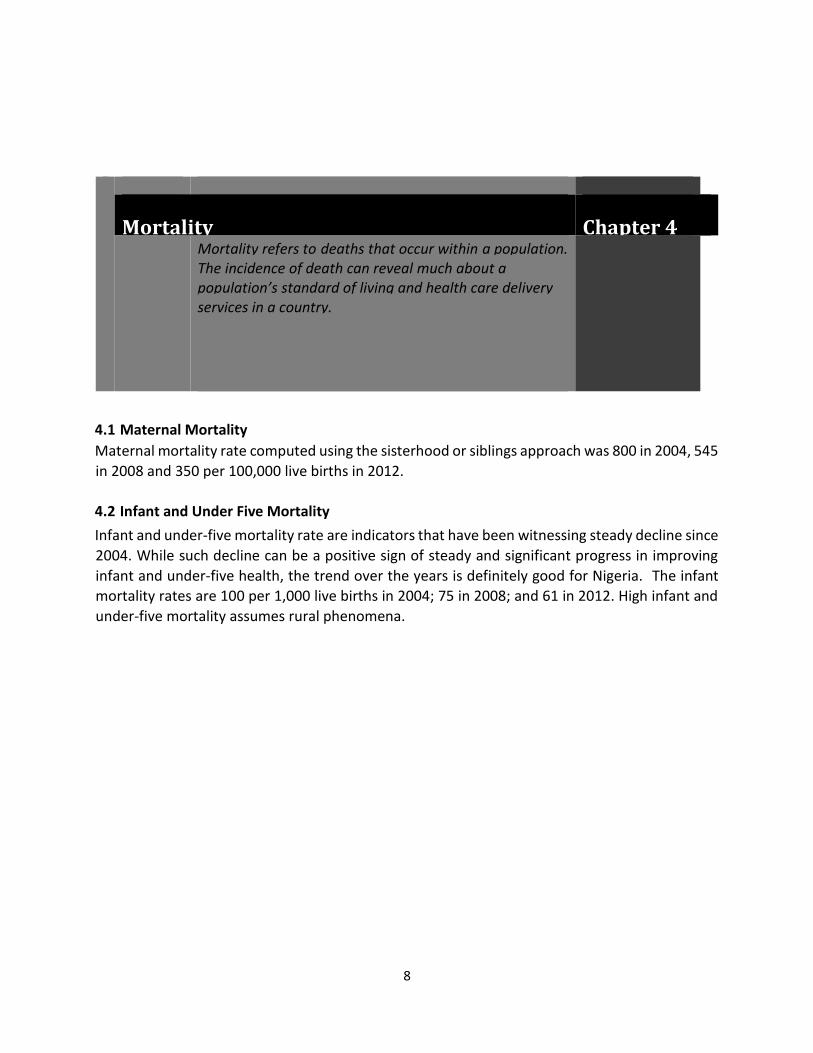
4.1 Maternal Mortality
Maternal mortality rate computed using the sisterhood or siblings approach was 800 in 2004, 545
in 2008 and 350 per 100,000 live births in 2012.
4.2 Infant and Under Five Mortality
Infant and under-five mortality rate are indicators that have been witnessing steady decline since
2004. While such decline can be a positive sign of steady and significant progress in improving
infant and under-five health, the trend over the years is definitely good for Nigeria. The infant
mortality rates are 100 per 1,000 live births in 2004; 75 in 2008; and 61 in 2012. High infant and
under-five mortality assumes rural phenomena.
Mortality Chapter 4 Mor tal ity refers to deaths th at occur within a population.
The incidence of death can reveal much about a population’s standard of living and health care delivery services in a country.

9
References
Arriaga, E. 1983. "Estimating fertility from data on children ever born by age of mother", International Research Document No.11 (United States Bureau of the Census, Washington, D.C.).
Arriaga, E. , P. Anderson and L. Heligman. 1976. Computer Programs for Demographic Analysis
(Washington, D.C., Government Printing Office).
Beers, H. S. (1945). Six-term formulas for routine actuarial interpolation. The Record of the
American Institute of Actuaries, vol. 34 (June).
Bennett, N. and S. Horiuchi. 1981. "Estimating the completeness of death registration in closed
populations", Population Index, vol. 47, No.2 (summer), pp. 207-221.
Brass, W. and others. 1968. The Demography of Tropical Africa (Princeton, Princeton University
Press). Brass, W. and E. A. Bamgboye. 1981. "The time location of reports of survivorship
estimates for maternal and paternal orphanhood and the ever-widowed", working paper No.81-1 (London, Centre for population Studies, London School of Hygiene and Tropical Medicine, University of London).
Brass, W. and K. Hill. 1973. "Estimating adult mortality from orphanhood", International
Population Conference, Liege, 1973, vol. 3 (Liege, International Union for the Scientific Study of population), pp. 111-123.
Coale, A. and P. Demeny. 1966. Regional Model Life Tables and Stable Populations (Princeton,
Princeton University Press).
Greville, T. N. E. 1943. "Short methods of constructing abridged life tables", The Record of
the American Institute of Actuaries, vol. XXXII, part 1, No.65 (June).
Heligman, L. and J. H. Pollard. 1980. "The age pattern of mortality", The Journal of the Institute
of Actuaries, vol. 107, part 1, No. 434 (June).
Hill, K. 1977. "Estimating adult mortality levels from information on widowhood", Population
Studies, vol. 31, No.1 (March), pp. 75-84.
Hill K. 1987. "Estimating census and death registration completeness", Asian and Pacific
Population Forum, vol. 1, No.3 (May), pp. 8-13 and 23-24.

10
Hill, K. and J. Trussell. 1977. "Further developments in indirect mortality estimation", Population
Studies, vol. 31, No.2 (July), pp. 313-334.
Damgaard, C. and Weiner, J. "Describing Inequality in Plant Size or Fecundity." Ecology 81, 1139-
1142, 2000.
Dixon, P. M.; Weiner, J.; Mitchell-Olds, T.; and Woodley, R. "Bootstrapping the Gini Coefficient of
Inequality." Ecology 68, 1548-1551, 1987.
Dixon, P. M.; Weiner, J.; Mitchell-Olds, T.; and Woodley, R. "Erratum to 'Bootstrapping the Gini
Coefficient of Inequality.' " Ecology 69, 1307, 1988.
Gini, C. "Variabilitá e mutabilita." 1912. Reprinted in Memorie di metodologia statistica (Ed. E.
Pizetti and T. Salvemini.) Rome: Libreria Eredi Virgilio Veschi, 1955.
Glasser, G. J. "Variance Formulas for the Mean Difference and Coefficient of Concentration." J.
Amer. Stat. Assoc. 57, 648-654, 1962.
Sen, A. On Economic Inequality. Oxford, England: Clarendon Press, 1973.
Damgaard, Christian. "Gini Coefficient." From MathWorld--A Wolfram Web Resource, created by
Eric W. Weisstein. http://mathworld.wolfram.com/GiniCoefficient.html