demographic statistics bulletin - national bureau of
TRANSCRIPT

2017
MAY 2018
DEMOGRAPHIC STATISTICS BULLETIN

2
TABLE OF CONTENTS
Preface -------------------------------------------------------------------------------------------------- 3
Executive Summary ----------------------------------------------------------------------------------4
List of Tables --------------------------------------------------------------------------------------------6
List of Figure --------------------------------------------------------------------------------------------6
Chapter 1
1.0 Population Projection --------------------------------------------------------------------------7
1.1 Elderly Population-------------------------------------------------------------------------------8
1.2 Fertility---------------------------------------------------------------------------------------------9
1.3 Nigeria Population Pyramid ------------------------------------------------------------------11
1.4 Nigeria’s Population Pyramid and implication for achieving
demographic dividend ------------------------------------------------------------------------12
1.5 Human Trafficking ------------------------------------------------------------------------------14
Chapter 2
2.0. Reproductive Health-----------------------------------------------------------------------------15
2.1. Maternal Health ---------------------------------------------------------------------------------15
2.1.1. Antenatal ------------------------------------------------------------------------------------------15
2.1.2. Contraceptive Use -------------------------------------------------------------------------------17
Chapter 3
3.0 Vital Statistics -------------------------------------------------------------------------------------19
3.1. Background Information -----------------------------------------------------------------------19
3.2. Birth Registration --------------------------------------------------------------------------------19
3.3. Deaths ---------------------------------------------------------------------------------------------- 22
3.4. Marriages -------------------------------------------------------------------------------------------24
Conclusion -------------------------------------------------------------------------------------------------26

3
PREFACE
This Demographic Statistics Bulletin is the third in the series. The Bulletin focuses on selected
demographic indicators namely population, fertility, mortality, reproductive health issues, health
records of births, deaths and marriages from 2013-2016 which are of public interest in Nigeria. As
such, this Bulletin is not exhaustive. The data was collected from both State and Federal Ministries,
Departments and Agencies (SFMDAs) across the country.
In this edition, users will find statistical information showing how available data measure the reality
of Nigeria’s demographic situation. It also highlights the need for proper record keeping at all Federal
and States Ministries, Departments and Agencies (MDA) nationwide, the need for strengthening the
capacity of all record-keepers and creating statistical synergy between Federal and States Ministries,
Departments and Agencies (MDA) and National Bureau of Statistics. While a number of States
responded positively to NBS’ data requests, others are being encouraged to make updated
submissions for the periods under review.
The Bureau remains committed to promoting the general use of statistical data and information on
demographic statistics in particular for development planning and decision-making.

4
EXECUTIVE SUMMARY
The purpose of the demographic bulletin is to analyze some demographic issues in the country and
provide information for policy makers and researchers.
Data was collected through secondary sources. Templates on selected demographic issues were
sent to relevant ministries, departments and agencies by NBS and they were completed by the MDA
desk officers responsible for the information. Furthermore, information domiciled in Federal
ministries, departments and agencies were collected by staff at NBS headquarters using relevant
templates.
Information derived from the Nigeria population pyramid shows that majority of the population lies
between ages 0–14, depicting a young population, high fertility rate and dependency. It also implies
a large population of adolescents entering the labor force in the near future. A sudden economic
shock can lead to higher unemployment unless new job opportunities are urgently created.
Demographic dividend is the accelerated economic growth which can happen as the population age
structure changes with investment in health, education, economic policy and good governance.
Harnessing demographic dividend will lead to decline in mortality rate, desire for smaller family size
and increase investment in family planning which will enable a decline in fertility among women of
child bearing age. If Nigeria is able to make substantial investments in reproductive health and family
planning particularly in parts of the country with poor health indicators, then fertility levels may begin
to decline more significantly and with improved investment in child survival and better implementation
of universal health coverage, the proportion of the population at working ages will increase relative
to the dependent population who earn little or no income.
Another demographic issue considered in the bulletin is maternal survival through utilization of
maternal health care. A strong indicator of maternal health care is antenatal care visit. Antenatal care
is known as the care given to a pregnant woman from the first trimester through the third trimester
till delivery of the baby. The standard is that a pregnant woman should at least visit a hospital or
Primary Health Care (PHC) four times or more during the duration of the pregnancy. Lagos state has
the highest (94.2 per cent) number of pregnant women who made four or more visits to antenatal
care in the country while Sokoto State showed the least (24.9 per cent). Lagos state also recorded
the highest proportion of pregnant women (42.5 per cent) who received ANC in their first trimester,
while Edo state recorded the highest proportion of women receiving ANC at 8 months or more of
pregnancy.
On the use of contraceptives among women of child bearing ages, it was shown that most women
who are currently married or in a union (86.6 per cent) were not using any contraceptive method to
prevent unwanted pregnancy. It further showed that Ebonyi state had the highest proportion (97.0
per cent) of women who are married without using any contraceptive methods to space their children
while Oyo state had the least (65.7 per cent).
Birth Registration is the process by which a child’s birth is recorded in the civil register by the
government authority. It provides the first legal recognition of the child and is generally required for
the child to obtain a birth certificate. Nationally, 7,742,488 births were registered in 2016, out of
which 33.09 percent of the births were registered before age one, 31.19 percent were registered
between age one and four, and 35.72 percent were registered at 5 years of age or later.

5
Kogi State recorded the highest level of under one-year registration (54.89 percent) of total birth
registration in the state while Anambra State recorded the least (19.83 percent). Late registration
may be attributed to poor attitude of parents to early birth registration. Increasing awareness about
its benefits may help to improve birth registration shortly after birth, rather than waiting till after 5
years of age.

6
LIST OF TABLES
Table 1: Projected Population by State (2012-2016) ---------------------------------------------7
Table 2: Number of trafficked persons by age group and year -------------------------------- 14
Table 3: Number of Antenatal Care Visits and Timing of First Visit by State ---------------16
Table 4: Use of contraception by modern methods and state ----------------------------------18
Table 5: Birth Registration by State and Age of Registration (2016) --------------------------19
Table 6: Birth Registration by Zone and Age of Registration (2016) ---------------------------21
Table 7: Distributions of Death by State and Year--------------------------------------------------22
Table 8: Distribution of Marriages by State and year ----------------------------------------------24
LIST OF FIGURES
Figure 1 Elderly Population by Years --------------------------------------------------------------------8
Figure 2 Total Fertility Rate by State (2016) -----------------------------------------------------------10
Figure 3 Nigeria Population Pyramid (2016) -----------------------------------------------------------12
Figure 4 Distribution of Deaths by Year -----------------------------------------------------------------17
Figure 5 Distribution of Marriages by Year (2014-2016) --------------------------------------------24
Cover page image: Guardian Nespapers, www.guardian.ng

7
Chapter 1 1.0 Population Projection
Population projections are used for the calculations of future birth rate, death rate and
migration of population based on their past and present conditions. They are in general
purely formal calculations, developing the implications of the assumptions that are
made. Projections made for the whole country are called total projections. But when
projections are made for a region, state or province, district or ethnic group, they are
called regional or sectoral projections.
Table 1: Projected Population by State (2012-2016)
STATE 2012 2013 2014 2015 2016
ABIA 3,345,769 3,437,336 3,531,408 3,628,055 3,727,347
ADAMAWA 3,783,127 3,894,444 4,009,037 4,127,001 4,248,436
AKWA IBOM 4,785,078 4,950,568 5,121,781 5,298,916 5,482,177
ANAMBRA 4,942,106 5,082,440 5,226,760 5,375,177 5,527,809
BAUCHI 5,706,046 5,903,388 6,107,554 6,318,781 6,537,314
BAYELSA 2,028,468 2,088,154 2,149,597 2,212,849 2,277,961
BENUE 5,092,533 5,247,624 5,407,438 5,572,118 5,741,815
BORNO 5,115,017 5,291,918 5,474,937 5,664,285 5,860,183
CROSS RIVER 3,442,816 3,544,120 3,648,404 3,755,757 3,866,269
DELTA 4,982,928 5,144,961 5,312,262 5,485,004 5,663,362
EBONYI 2,575,190 2,648,315 2,723,515 2,800,851 2,880,383
EDO 3,801,987 3,906,039 4,012,938 4,122,764 4,235,595
EKITI 2,889,357 2,980,330 3,074,167 3,170,959 3,270,798
ENUGU 3,912,311 4,031,459 4,154,235 4,280,750 4,411,119
GOMBE 2,865,649 2,958,833 3,055,047 3,154,389 3,256,962
IMO 4,758,912 4,913,660 5,073,440 5,238,416 5,408,756
JIGAWA 5,189,835 5,342,543 5,499,746 5,661,573 5,828,163
KADUNA 7,319,192 7,542,095 7,771,785 8,008,472 8,252,366
KANO 11,459,817 11,844,300 12,241,682 12,652,397 13,076,892
KATSINA 6,945,757 7,157,287 7,375,259 7,599,869 7,831,319
KEBBI 3,922,250 4,045,745 4,173,127 4,304,520 4,440,050
KOGI 3,967,630 4,088,462 4,212,974 4,341,279 4,473,490
KWARA 2,831,842 2,918,084 3,006,953 3,098,528 3,192,893
LAGOS 11,042,686 11,401,767 11,772,524 12,155,337 12,550,598
NASSARAWA 2,238,051 2,306,209 2,376,444 2,448,817 2,523,395
NIGER 4,849,730 5,017,456 5,190,982 5,370,510 5,556,247
OGUN 4,572,499 4,725,908 4,884,465 5,048,342 5,217,716
ONDO 4,143,422 4,269,608 4,399,637 4,533,626 4,671,695
OSUN 4,140,228 4,274,858 4,413,866 4,557,394 4,705,589

8
STATE 2012 2013 2014 2015 2016
OYO 6,843,840 7,080,532 7,325,409 7,578,755 7,840,864
PLATEAU 3,770,432 3,873,621 3,979,633 4,088,547 4,200,442
RIVERS 6,375,176 6,595,659 6,823,767 7,059,764 7,303,924
SOKOTO 4,432,908 4,567,910 4,707,024 4,850,374 4,998,090
TARABA 2,730,940 2,811,296 2,894,018 2,979,173 3,066,834
YOBE 2,863,785 2,965,792 3,071,433 3,180,836 3,294,137
ZAMFARA 3,972,914 4,102,103 4,235,493 4,373,221 4,515,427
FCT ABUJA 2,456,945 2,696,403 2,959,199 3,247,608 3,564,126
NIGERIA 170,157,060 175,690,143 181,403,148 187,301,926 193,392,517
Source: National Population Commission
1.1. Elderly Population
Ageing is defined simply as continued increase in age; it is one important demographic
indicator that has no specific or easily adoptable definition. In Nigeria, both women and men
are regarded and treated as elderly on getting to age 60 years and above. Great
transformations usually occur in societies where there is preponderance of young, active and
vibrant people but where older people are more in number, then significant challenges do
exist, primarily, in ensuring that adequate living conditions throughout the extended life span
are well managed. The total number of older people, that is, those aged 60 years and above
went up slightly from 8,741,292 in 2013 to 9,622,056 in 2016. Figure 1 indicates 1.8 per cent
increase in the male ageing population between 2013 and 2014 compared to 1.4 per cent
increase in the female ageing population between 2013 and 2014.
Figure 1: Elderly Population by Years
8,741
,292
9,025
,537
9,319
,025
9,622
,056
4,876
,375
5,034
,942
5,198
,666
5,367
,714
3,864
,917
3,990
,595
4,120
,359
4,254
,343
2013 2014 2015 2016
Total Elderly 60+ years Male Elderly 60+years Female Elderly 60+ years
Source: National Population Commission

9
1.2. Fertility
Fertility, as a demographic indicator is referred to as the actual reproduction performance in a population based on the number of live birth that occurs in a population. It indicates the actual number of children born alive. Child bearing, by itself, is dependent on so many factors including social circumstances such as culture, tradition, education and the overall level of development of a society or community. Also, the age of entry into a union and the availability of contraception are two key proximate determinants of fertility.
However, the most commonly used measure or indicator of fertility is the total fertility rate (TFR), which is, the number of children that a woman bears over her entire childbearing years, provided at each age during the childbearing years, she experiences the age-specific fertility rate (ASFR). The fertility age bracket for women is between ages 15 to 49 years. Age specific fertility rate, in turn, is the number of births given to by women of a specific age group per 1,000 women in that age group.
In 2015, total fertility rate was 5.5 births per woman but increased in 2016 to 5.8 (NDHS, 2013). This means that women in Nigeria will have on the average 5.8 children each during their entire childbearing years. Figure 2 shows fertility rate by States.

10
Figure 2: Total Fertility Rate by State (2016)
Source: NBS - Multiple Indicator Cluster Survey (MICS 2016/17)
0 2 4 6 8 10
Nigeria
FCT Abuja
Zamfara
Yobe
Taraba
Sokoto
Rivers
Plateau
Oyo
Osun
Ondo
Ogun
Niger
Nasarawa
Lagos
Kwara
Kogi
Kebbi
Katsina
Kano
Kaduna
Jigawa
Imo
Gombe
Enugu
Ekiti
Edo
Ebonyi
Delta
Cross River
Borno
Benue
Bayelsa
Bauchi
Anambra
Akwa Ibom
Adamawa
Abia
5.8
4.6
7.3
6.8
5.5
7.3
3.3
5.6
4.9
4.7
4.5
4.5
6.4
5.7
4.0
4.4
3.7
7.7
7.5
7.7
5.6
8.5
5.1
7.3
3.8
4.4
3.8
5.2
5.2
4.4
6.1
4.8
4.8
6.8
4.3
4.5
5.5
5.1
Births per woman
Stat
e

11
Figure 2 shows total fertility rate (TFR) by states in Nigeria, the TFR for Nigeria in 2016
according to MICS 5 report was 5.8 compared to 5.7 in 2011 (MICS 4). This indicates a slight
increase in the TFR in the country which might be due to poor use of contraception among
women and men. In 2016, Jigawa state had the highest TFR of 8.5 while Kano and Kebbi states
had TFR of 7.7 each (MICS 5). Rivers state had the lowest TFR of 3.3, followed by Kogi at 3.7
and Lagos at 4.0.
1.3 Nigeria Population Pyramid
A population pyramid, which can also be referred to "age pyramid" is a graphical illustration that represents the distribution of the various age groups in the population, the shape being in the form of a pyramid. Population pyramid often contains continuous stacked-histogram bars. The population size is depicted on the x-axis while the age-groups on y-axis. Males are conventionally shown on the left and females on the right, and they may be measured by raw number or as percentage of the total population. The essence of the population pyramid is to visualize sex and age composition of a given population. It is also used to determine the overall age distribution of a population for informed economic and social planning and decisions by policy makers
A great deal of information about the population of a country can be derived from the pyramid which can help shed light on the level of development and demographic characteristics of the population. The pyramid gives a clear picture of how a country transitions from high fertility to low fertility rate. The Nigeria population pyramid is shown in Figure 3 which shows that majority of the population lies between ages 0–14. This indicates that the fertility rate of the country is high and implies a high dependency. It also implies a large proportion of the population would soon be entering into the working age group. New jobs opportunities would therefore be required to meet up with the projected increase in labour force population.

12
Figure 3 Nigeria Population Pyramid (2016)
Source: National Population Commission
Age 16-30 years is associated with high risks especially among the male population. It is called the youth bulge. To reverse the effects of youth bulges, specific policies such as creating more jobs, improving family planning programs, and reducing overall infant mortality rates should be a priority in policy formulation.
While the growth of the youth population imposes supply pressures on education systems and labour markets, it also means that a growing share of the overall population is made up of those considered to be of working age and thus not dependent on the economic activity of others. In turn, this declining dependency ratio can have a positive impact on overall economic growth, creating a demographic dividend. The ability of a particular economy to harness this dividend, however, is dependent on its ability to ensure the deployment of this growing working-age population towards productive economic activity, and to create the jobs necessary for the growing labour force.
1.4 Nigeria’s population pyramid and implications for achieving the demographic dividend
According to the National Population Commission, as at 2016, Nigeria had an estimated population of over 193 million, annual population growth rate of 3.2%, and over 41% of Nigeria’s population was under age 15. The Total Fertility Rate, or the average number of children per woman over the course of her lifetime, declined from 6.5 children in 1990 to 5.8 percent in 2016 (NDHS, 2013). According to the UN World Population Prospects (2017), the
20.0 15.0 10.0 5.0 0.0 5.0 10.0 15.0 20.0
0-4
10-14
20-24
30-34
40-44
50-54
60-64
70-74
80-84
Percent
Female
Male
13
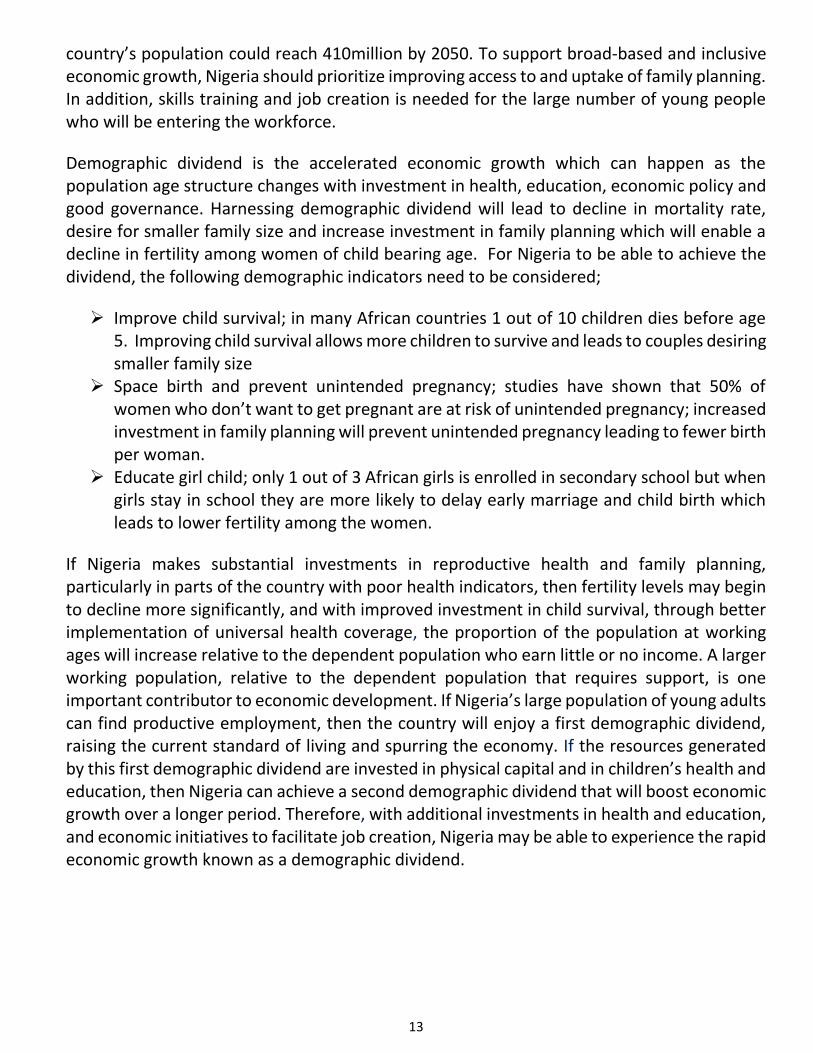
country’s population could reach 410million by 2050. To support broad-based and inclusive economic growth, Nigeria should prioritize improving access to and uptake of family planning. In addition, skills training and job creation is needed for the large number of young people who will be entering the workforce.
Demographic dividend is the accelerated economic growth which can happen as the population age structure changes with investment in health, education, economic policy and good governance. Harnessing demographic dividend will lead to decline in mortality rate, desire for smaller family size and increase investment in family planning which will enable a decline in fertility among women of child bearing age. For Nigeria to be able to achieve the dividend, the following demographic indicators need to be considered;
➢ Improve child survival; in many African countries 1 out of 10 children dies before age 5. Improving child survival allows more children to survive and leads to couples desiring smaller family size
➢ Space birth and prevent unintended pregnancy; studies have shown that 50% of women who don’t want to get pregnant are at risk of unintended pregnancy; increased investment in family planning will prevent unintended pregnancy leading to fewer birth per woman.
➢ Educate girl child; only 1 out of 3 African girls is enrolled in secondary school but when girls stay in school they are more likely to delay early marriage and child birth which leads to lower fertility among the women.
If Nigeria makes substantial investments in reproductive health and family planning, particularly in parts of the country with poor health indicators, then fertility levels may begin to decline more significantly, and with improved investment in child survival, through better implementation of universal health coverage, the proportion of the population at working ages will increase relative to the dependent population who earn little or no income. A larger working population, relative to the dependent population that requires support, is one important contributor to economic development. If Nigeria’s large population of young adults can find productive employment, then the country will enjoy a first demographic dividend, raising the current standard of living and spurring the economy. If the resources generated by this first demographic dividend are invested in physical capital and in children’s health and education, then Nigeria can achieve a second demographic dividend that will boost economic growth over a longer period. Therefore, with additional investments in health and education, and economic initiatives to facilitate job creation, Nigeria may be able to experience the rapid economic growth known as a demographic dividend.

14
1.5. Human Trafficking
Human trafficking can be described as the trade of humans for forced labour, sexual slavery,
or commercial sexual exploitation for the trafficker. Prior to the abolition of slave trade in the
early 19th century, human beings were sold as commodities to merchants by kings and
warriors in exchange for goods. These merchants provide weapons and fuelled crises between
communities to increase supply of slaves. The inhuman treatment meted out to these
individuals gave rise to the abolition of slave trade. Unfortunately, in the past two or more
decades this obnoxious trade and dehumanizing trade has resurfaced in a more dangerous
and horrific manner known as the modern-day slavery.
Table 2: Number of trafficked persons by age group and year
Age group 2013 2014 2015 Total
0 – 5 12 54 39 105
6 – 15 507 573 322 1402
16 – 25 408 347 409 1164
26 – 35 55 49 103 207
36 & above 19 3 12 34
Total 1001 1026 885 2912 Source: NAPTIP
Table 2 shows that younger persons are trafficked more than persons of older ages. The table
indicates that persons between age 6 to 15 years old were victims of trafficking in person
more than any other age groups in 2013-2014 followed by persons aged 16 to 25 years old
with 1,164 trafficked persons between 2013-2015. The table further shows that older persons
from 36 years and above were the least victims from the reported cases. Table 2 clearly shows
that while there was a slight increase in number of trafficked persons from 1001 in 2013 to
1026 in 2014, there was a significant decline between 2014 and 2015 accounted for by a sharp
fall in trafficked persons aged 6 – 15 year old.

15
Chapter 2
2.0. Reproductive Health
2.1. Maternal Health The reproductive years of women begin at puberty through menopause, and these years are
when most women experience important life events such as entry into sexual union, marriage
and child-bearing. It is also at these times that health risks, especially as related to pregnancy
and childbirth, cause ill-health and even death for many women of childbearing age. The
reproductive age is within the bracket of 15-49 age group.
2.1.1 Antenatal Antenatal care is known as the care given to a pregnant woman from the first trimester
through the third trimester till delivery of the baby. The standard is that a pregnant woman
should at least visit a hospital or PHC four times or more during the duration of the pregnancy.
This is to improve the outcome of pregnancy and birth for both the mother and child. It not
only monitors the health of the mother and fetus but also allow for the identification of
potential complication. In addition, it provides women with information about needed
nutrition during pregnancy and breastfeeding.

16
Source: NBS-Multiple Indicator Cluster Survey (MICS 2016/17)
Table 3: Number of antenatal care visits and timing of first visit by State
Percent distribution of women who had:
Percent distribution of women by number of months
pregnant at the time of first antenatal care visit
No antenatal
care visits
One
visit
Two
visits
Three
visits
4 or
more
visits
No
antenatal
care visits
First
trimester
4-5
months
6-7
months 8+ months
Total 31.6 4.6 4.9 8.6 49.1 32.0 18.4 29.8 17.3 2.0
State
Abia 8.7 0.9 1.3 2.4 86.1 8.7 32.0 35.8 22.6 0.9
Adamawa 19.0 3.6 5.8 14.6 55.7 19.8 26.1 39.6 13.0 1.2
Akwa Ibom 13.2 2.0 7.2 10.8 66.7 13.2 14.2 41.9 29.4 1.2
Anambra 1.3 3.3 1.0 2.0 90.0 1.3 40.2 41.7 14.4 2.4
Bauchi 38.2 4.9 9.0 12.7 33.0 38.4 6.5 22.0 30.7 2.2
Bayelsa 23.1 1.3 8.0 4.8 62.9 23.1 26.1 27.4 21.0 2.2
Benue 31.4 3.4 6.3 9.7 48.2 31.4 29.6 23.7 12.1 2.7
Borno 10.9 3.4 4.6 19.2 61.9 10.9 12.0 50.1 22.8 4.1
Cross River 12.2 1.9 5.4 13.4 67.1 12.2 22.1 36.8 25.4 3.5
Delta 17.5 3.5 6.3 5.4 64.5 17.5 22.8 39.3 17.6 2.8
Ebonyi 21.6 2.1 2.2 11.5 57.7 22.3 26.1 32.6 16.5 1.4
Edo 5.4 3.1 1.6 6.3 83.7 5.4 34.9 32.4 16.6 10.1
Ekiti 8.3 2.4 1.1 1.5 86.1 9.6 27.8 44.4 15.1 3.1
Enugu 5.1 10.4 0.9 2.9 76.7 5.1 41.9 38.5 14.1 0.0
Gombe 27.9 10.2 9.3 17.8 34.1 29.8 14.9 38.1 14.9 1.3
Imo 3.4 9.1 3.0 1.9 81.9 3.4 31.3 39.2 24.6 1.4
Jigawa 42.3 7.6 5.7 7.2 36.3 45.0 16.3 20.4 15.4 2.6
Kaduna 23.4 17.5 2.4 9.0 43.8 23.8 25.8 32.5 16.4 1.3
Kano 29.9 3.7 7.6 13.6 44.7 30.3 9.1 32.4 24.6 3.1
Katsina 54.6 3.3 4.3 3.3 33.4 55.1 4.7 20.3 18.1 1.2
Kebbi 52.9 7.0 7.5 8.3 20.9 53.3 15.9 14.1 6.7 5.3
Kogi 18.1 7.7 5.4 8.5 57.0 20.1 27.1 35.4 13.1 2.3
Kwara 20.3 0.6 3.0 8.9 66.6 20.3 21.4 45.5 11.5 1.2
Lagos 3.1 0.8 0.5 1.4 94.2 3.1 42.5 43.1 11.0 0.1
Nassarawa 30.7 6.7 3.4 8.7 50.2 31.6 28.5 26.9 11.6 1.1
Niger 49.1 4.1 5.7 8.5 32.6 49.1 18.6 20.6 9.4 2.3
Ogun 9.0 0.0 2.6 2.0 86.4 9.0 28.0 44.4 17.9 0.6
Ondo 12.8 2.2 3.3 4.5 76.1 12.8 22.9 36.1 25.4 2.7
Osun 2.4 0.0 3.3 2.1 92.2 2.4 32.9 42.5 21.1 1.2
Oyo 7.8 4.3 5.9 9.0 68.3 7.8 30.9 39.6 19.8 1.3
Plateau 38.7 2.1 4.9 7.8 46.5 38.7 20.7 26.2 13.5 0.9
Rivers 9.6 1.6 0.0 2.2 85.8 9.6 36.8 32.9 18.4 2.3
Sokoto 63.9 3.2 3.6 4.3 24.9 63.9 8.8 14.8 10.9 1.6
Taraba 50.9 3.7 4.9 7.4 31.6 50.9 15.2 23.3 9.9 0.7
Yobe 57.4 2.8 3.9 9.3 26.6 57.6 5.5 17.3 19.3 0.2
Zamfara 57.8 2.8 4.6 5.7 29.0 57.8 12.3 18.9 9.4 1.2
FCT Abuja 16.1 1.2 3.2 4.1 75.2 16.1 28.3 44.8 9.8 1.0

17
Table 3 shows the percentage distribution of number of antenatal care visits and timing of
first visit; Lagos state has the highest (94.2 per cent) number of four or more visit to antenatal
care in the country while Sokoto State had the least (24.9 per cent). Higher number of
antenatal care visits during pregnancy will help to prevent or identify conditions that may
threaten the health of the newborn and the mother. Anambra State recorded the lowest (1.3
per cent) proportion of women who had no antenatal care visits while Sokoto State recorded
the highest (63.9 per cent) proportion of pregnant women that had no antenatal care visit in
the country. However, Lagos state recorded the highest proportion of pregnant women (42.5
per cent) who received ANC in their first trimester, while Edo state recorded the highest
proportion of women receiving ANC at 8 months or more of pregnancy.
2.1.2 Contraceptive Use Contraceptive use refers to a conscious effort by a person to limit or space the number of children he/she wants to have through birth control methods. Knowledge of contraceptive, accessibility and use of contraceptive for family planning purposes and prevention of pregnancy are key indicators used to measure the extent of use in a country. Table 4 indicates that most of Nigerian women who are currently married or in a union (86.6 per cent) are not using any contraceptive method to prevent unwanted pregnancy. It further shows that Ebonyi state had the highest (97.0 per cent) of women who are married and are not using any contraceptive methods to space their child while Oyo state had the least (65.7 per cent). The Federal Ministry of Health in her efforts to achieve the millennium development goals in 2011, distributed free contraceptives to states to enhance child spacing. This free distribution of contraceptives has continued to achieve the current sustainable development goals for all women in the reproductive age in Nigeria to space their children for healthy living. However from Table 4, attitudes of the people towards utilization of these modern methods of contraceptives still appears very poor.

18
Table 4: Use of contraception by Modern Methods and State Percentage of women age 15-49 years currently married or in union who are using (or whose partner is using) a contraceptive method, Nigeria, 2016-17
Percent of women currently married or in union who are using (or whose partner is using) Contraceptive Number of women age 15-49
years currently married
or in union
No method
Female sterili- zation
Male sterili- zation IUD
Injectables Implants Pill
Male condom
Female condom
Diaphragm/Foam/Jelly LAM
Periodic abstinence Withdrawal Other
Any modern method
Any tradi-tional
method
Any metho
d Total 86.6 0.2 0.0 0.7 4.3 1.4 2.3 1.1 0.1 0.1 0.6 1.0 0.9 0.7 10.8 2.6 13.4 24,373
State Abia 83.4 0.0 0.0 1.1 3.9 0.5 1.8 1.1 0.0 0.0 1.1 5.8 1.4 0.0 9.5 7.1 16.6 197 Adamawa 90.9 0.6 0.0 0.5 3.9 0.4 1.2 0.3 0.1 0.3 0.0 0.5 1.0 0.5 7.1 2.0 9.1 612 Akwa Ibom 84.3 0.3 0.0 0.0 5.9 1.0 2.2 1.3 0.2 0.0 0.0 3.7 1.0 0.2 10.8 4.9 15.7 457 Anambra 71.8 0.6 0.0 0.0 1.9 3.4 2.2 5.0 1.0 0.0 2.8 7.1 4.2 0.0 16.9 11.3 28.2 322 Bauchi 88.1 0.5 0.0 0.0 1.6 1.2 1.5 0.0 0.0 0.2 3.5 0.1 0.3 3.1 8.4 3.5 11.9 1,330 Bayelsa 85.4 0.0 0.0 0.5 1.2 2.0 3.2 1.0 0.2 0.0 1.9 2.6 0.7 1.3 10.0 4.6 14.6 143 Benue 81.9 0.7 0.0 0.0 3.3 5.5 1.1 3.3 0.1 0.0 0.0 1.9 1.7 0.7 13.9 4.2 18.1 650 Borno 94.2 0.0 0.0 0.2 2.4 1.0 1.7 0.0 0.0 0.0 0.0 0.0 0.4 0.1 5.3 0.5 5.8 1,240 Cross
River 77.0 0.6 0.2 0.6 4.7 5.9 2.1 1.8 0.0 0.0 0.2 4.9 1.1 0.9 16.1 7.0 23.0 391
Delta 89.1 0.0 0.0 0.8 3.5 0.8 2.6 0.3 0.0 0.0 0.0 1.5 1.0 0.4 8.0 2.9 10.9 354 Ebonyi 97.0 0.3 0.2 0.0 0.5 0.4 0.0 0.0 0.0 0.3 0.4 0.5 0.3 0.2 2.1 0.9 3.0 212 Edo 84.3 0.0 0.0 1.5 2.4 0.4 3.5 1.0 0.0 0.2 1.0 3.1 2.6 0.0 10.0 5.7 15.7 296 Ekiti 68.6 0.6 0.3 4.0 7.7 1.7 1.6 7.3 0.0 0.2 0.7 2.1 3.4 1.3 24.4 6.8 31.4 143 Enugu 77.9 0.5 0.0 0.2 8.2 2.7 1.4 2.8 0.0 0.9 1.4 3.7 0.2 0.2 18.0 4.1 22.1 232 Gombe 93.4 0.0 0.0 0.3 3.4 0.9 0.7 0.1 0.0 0.0 0.7 0.1 0.0 0.3 6.0 0.4 6.6 440 Imo 64.2 0.2 0.0 1.5 4.4 1.7 3.3 6.4 0.0 1.1 2.6 6.3 7.9 0.2 21.3 14.5 35.8 345 Jigawa 98.7 0.0 0.0 0.4 0.4 0.0 0.4 0.0 0.0 0.0 0.0 0.0 0.0 0.2 1.1 0.2 1.3 1,110 Kaduna 75.9 0.0 0.0 0.7 9.5 3.4 6.7 1.1 0.1 0.1 0.3 0.2 1.9 0.1 21.9 2.2 24.1 1,475 Kano 93.7 0.0 0.0 0.4 2.2 0.7 2.2 0.0 0.0 0.1 0.2 0.2 0.0 0.4 5.7 0.6 6.3 1,862 Katsina 93.7 0.4 0.0 0.2 3.1 0.2 0.6 0.1 0.0 0.4 0.0 0.0 0.0 1.5 4.9 1.5 6.3 1,671 Kebbi 93.7 0.1 0.1 0.0 2.8 0.6 1.2 0.0 0.0 0.1 0.0 0.1 0.4 0.8 5.0 1.4 6.3 764 Kogi 93.3 0.3 0.0 0.0 3.5 0.3 2.0 0.1 0.0 0.0 0.0 0.0 0.0 0.3 6.2 0.3 6.7 357 Kwara 72.9 0.0 0.0 1.2 7.3 2.3 3.9 5.1 0.0 0.0 3.9 2.1 1.2 0.0 23.7 3.4 27.1 357 Lagos 77.4 0.7 0.0 2.1 4.6 1.9 4.0 3.6 0.4 0.0 0.0 2.4 2.1 0.8 17.4 5.3 22.6 1,097 Nassarawa 83.0 0.0 0.0 1.0 7.2 4.0 1.3 0.3 0.0 0.0 0.0 1.1 0.9 1.2 13.8 3.2 17.0 530 Niger 88.8 0.0 0.0 1.0 2.9 0.0 2.2 0.6 0.1 0.0 1.3 1.2 0.1 1.9 8.1 3.2 11.2 1,227 Ogun 78.7 0.0 0.0 1.0 8.1 1.7 5.0 2.3 0.0 0.1 0.0 0.4 0.8 1.9 18.2 3.2 21.3 327 Ondo 78.2 0.0 0.0 3.0 5.5 1.7 3.0 3.6 0.3 0.0 1.6 0.5 2.6 0.0 18.8 3.1 21.8 404 Osun 75.4 0.2 0.0 3.3 11.2 1.5 3.8 2.7 0.0 0.2 0.0 0.5 0.7 0.6 22.9 1.7 24.6 382 Oyo 65.8 0.2 0.0 3.3 12.3 3.3 6.0 2.5 0.0 0.1 2.2 1.2 2.3 0.6 30.0 4.2 34.2 751 Plateau 79.9 0.3 0.1 1.0 12.1 1.6 3.1 0.4 0.1 0.2 0.4 0.2 0.4 0.3 19.2 0.9 20.1 894 Rivers 82.0 0.2 0.0 0.0 3.5 1.7 2.5 1.7 0.2 0.0 1.2 3.4 2.5 1.1 11.0 7.0 18.0 423 Sokoto 95.3 0.0 0.0 0.0 2.7 0.5 1.5 0.0 0.0 0.0 0.0 0.1 0.0 0.0 4.6 0.1 4.7 784 Taraba 93.3 0.1 0.0 0.2 4.3 0.2 0.5 0.1 0.0 0.1 0.0 0.7 0.0 0.4 5.6 1.1 6.7 364 Yobe 96.5 0.0 0.0 0.0 1.8 0.2 1.2 0.0 0.0 0.0 0.0 0.0 0.0 0.2 3.3 0.2 3.5 866 Zamfara 94.4 0.0 0.0 0.4 1.8 1.2 1.1 0.2 0.0 0.1 0.1 0.2 0.2 0.2 5.0 0.6 5.6 1,149 FCT Abuja 73.8 1.6 0.0 1.4 5.9 1.7 2.7 5.0 0.4 0.0 1.3 2.4 1.3 2.6 19.9 6.3 26.2 213
Source: NBS - MICS (2016/2017

19
Chapter 3
3.0 Vital Statistics
3.1 Background Information
Vital Statistics are statistics on births, deaths, foetal deaths, marriages and
divorces. Collecting information on these events is usually through vital
registration. United Nations defines vital statistics ‘’as the total process of collecting
information by civil registration or enumeration on the frequency or occurrence of
specified and defined vital events, as well as relevant characteristics of the events
themselves and the person or persons concerned. Vital statistics provide crucial
and critical information on the population in a country. A useful by-product of birth
and death registration is official certificates of those events; these certificates serve
as prima facie evidence of that event, the common components of vital statistics
are Births, Deaths, Marriages and Divorces.
3.2. Birth Registration
Birth Registration is the process by which a child’s birth is recorded in the civil
register by the government authority.
Table 5: Birth Registration by State and Age of Registration (2016)
State Under Age
1 (%) Age 1 to 4 (%) Above Age 5 (%)
Total No of Birth Registration
Abia 27.12 32.87 40.01 204,847
Adamawa 24.98 42.88 32.13 849,702
Akwa-Ibom 27.36 29.64 43 157,121
Anambra 19.83 21.94 58.24 380,966
Bauchi 33.36 30.74 35.89 159,733
Bayelsa 22.37 30.67 46.96 76,443
Benue 39.73 26.5 33.77 99,765
Borno 29 26.28 44.72 140,421
Cross River 27.51 29.96 42.52 104,205
Delta 40.45 28.81 30.74 143,058

20
State Under Age
1 (%) Age 1 to 4 (%) Above Age 5 (%)
Total No of Birth Registration
Ebonyi 34.72 36.41 28.87 117,529
Edo 40.52 22.37 37.11 139,775
Ekiti 34.71 28.44 36.85 92,657
Enugu 34.26 28.48 37.26 166,738
F C T 46.21 20.76 33.03 146,668
Gombe 40.9 26.89 32.21 100,098
Imo 31.41 24.78 43.81 154,641
Jigawa 37.28 29.17 33.54 87,263
Kaduna 30.33 28.57 41.11 232,649
Kano 38.7 27.58 33.73 416,294
Katsina 34.91 27.62 37.46 355,298
Kebbi 25.7 45.27 29.03 595,273
Kogi 54.89 19.98 25.13 114,318
Kwara 48.08 26.4 25.52 146,222
Lagos 41.39 25.82 32.79 477,912
Nassarawa 32.53 25.05 42.42 108,064
Niger 34.61 25.61 39.78 127,809
Ogun 37.75 30.86 31.39 271,830
Ondo 31.68 28.44 39.88 152,045
Osun 32.17 39.9 27.92 227,270
Oyo 37.41 27.57 35.01 377,669
Plateau 37.64 22.98 39.38 111,752
Rivers 37.39 27.53 35.08 134,238
Sokoto 28.7 34.97 36.33 109,179
Taraba 45.8 19.95 34.25 100,452
Yobe 27.89 39.91 32.2 277,737
Zamfara 35.79 33.9 30.32 84,847
NATIONAL 33.09 31.19 35.72 7,742,488
Source: National Population Commission
It provides the first legal recognition of the child and is generally required for the
child to obtain a birth certificate.
Nationally, 7,742,488 births were registered in 2016, out of which 33.09 percent of
the births were registered before age one, 31.19 percent were registered between
age one and four; and 35.72 percent were registered above age 5 years.

21
Kogi State recorded the highest level of under one-year registration (54.89
percent). Anambra State recorded the least under one-year birth registration
(19.83 percent); this implies that over 80 percent of birth registration was done
after the child’s first birthday.
Anambra State accounted for the highest proportion (58.24 percent) of Birth
Registration for children aged 5 years and above in 2016. Late registration of births
in Anambra state may be attributed to poor attitude of the residents to early birth
registration; as such the people can be sensitized on the importance and legal
implication of birth registration.
Table 6: Birth Registration by Zone and Age of Registration (2016), percent
Zone Under 1 Age 1 to 4 Above Age 5
South East 29.47 28.90 41.64
South-South 32.60 28.16 39.23
South - West 35.85 30.17 33.97
North -Central 41.96 23.90 34.15
North - East 33.65 31.11 35.23
North - West 33.06 32.44 34.50
Source: National Population Commission
Table 6 reveals the percentage of Birth Registration by zone and age of registration.
The Zone with the highest percentage of under one-year registration was the North
– Central (41.96), while the Zone with the lowest percentage of under one-year
registration was the South – East (29.47).
The table further reveals that the North – West (32.44 per cent) had the highest
percentage of birth registration for children aged 1 to 4, but the North-Central

22
(23.90 per cent) had the least percentage of birth registration for children aged 1
to 4.
South – Eastern Zone had the highest percentage (41.64 per cent) of birth
registration at age 5 years and above, while the South –West had the lowest
percentage (33.97 per cent) of birth registration at age 5 years and above.
3.3. Deaths
Death refers to the permanent disappearance of all evidence of life at any time
after live birth has taken place (United Nations, 2014). The information on deaths
for this report was supplied by the State Ministries of Health.
Figure 4: Distribution of Deaths by Year
Source: States Ministry of Health
Table 7: Distribution of reported death cases by State
STATE 2014 2015 2016
Abia N/A N/A N/A
Adamawa N/A N/A N/A
Akwa Ibom N/A N/A N/A
27,912
25,124
22,359
0
5000
10000
15000
20000
25000
30000
2014 2015 2016

23
STATE 2014 2015 2016
Anambra 478 445 33
Bauchi 912 2,898 2,715
Bayelsa 189 278 172
Benue 1518 1554 1156
Borno N/A N/A N/A
Cross River 2042 2204 1824
Delta 317 310 303
Ebonyi N/A N/A N/A
Edo N/A N/A N/A
Ekiti 610 144 135
Enugu 272 40 4
FCT N/A N/A N/A
Gombe 1675 2029 1821
Imo N/A N/A N/A
Jigawa N/A N/A N/A
Kaduna 4527 3656 3948
Kano 1,003 342 313
Katsina N/A N/A N/A
Kebbi 2806 453 488
Kogi N/A N/A N/A
Kwara N/A N/A N/A
Lagos N/A N/A N/A
Nassarawa N/A N/A N/A
Niger 1048 933 659
Ogun 1774 912 1402
Ondo 2043 2629 1704
Osun 159 116 118
Oyo 2994 2837 2720
Plateau 891 1035 1003
Rivers 479 496 903
Sokoto N/A N/A N/A
Taraba N/A N/A N/A
Yobe 1033 749 1155
Zamfara 988 930 833 Source: States’ Ministry of Health/NPopC N/A-Not Available
The table above reveals the distribution of death by State and Year. Only 23 states
out of the 36 States (including FCT) reported on the number of deaths that occurred
in their state between 2014 and 2016.

24
3.4. Marriages
Marriage is the act, ceremony or process by which the legal relationship of spouses
is constituted. The legality of the union may be established by civil, religious or
other means as recognized by the laws of each country (United Nations, 2014). The
marriage statistics computed was derived from the Marriage Registries of the
states.
Figure 5: Distribution of Marriages by Year (2014-2016)
Source: States’ Marriage Registry
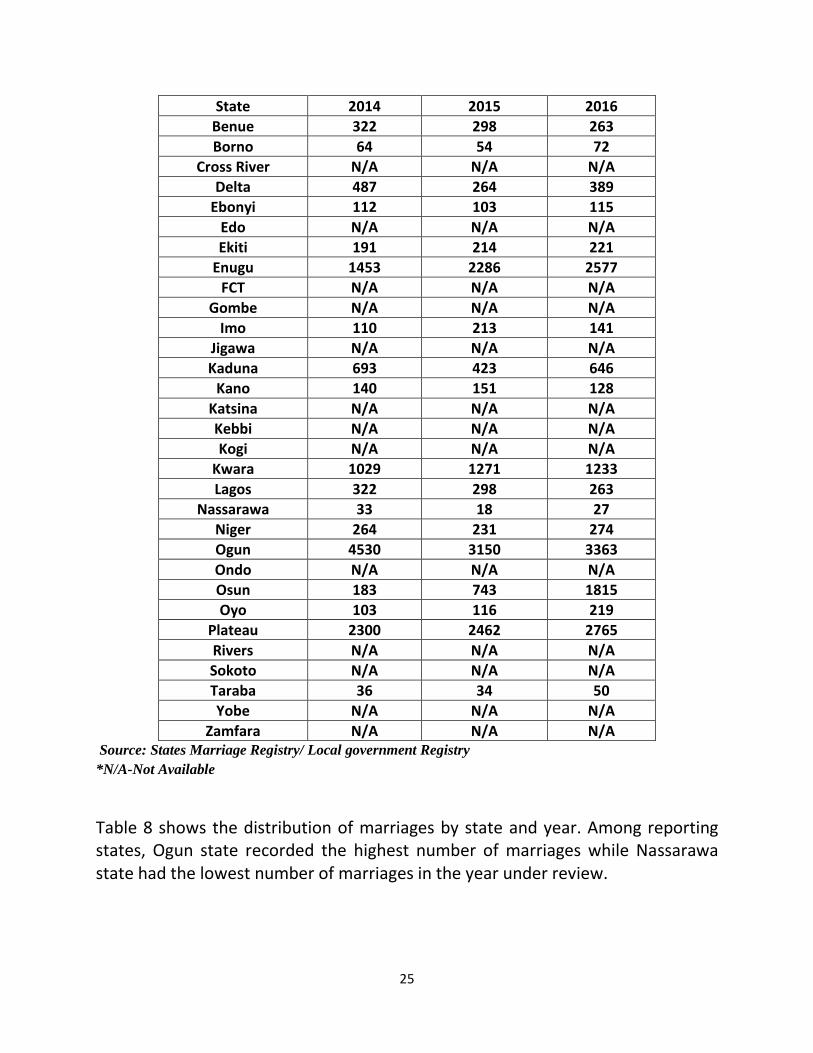
Table 8: Distribution of Marriages by State and year
State 2014 2015 2016
Abia 753 493 924
Adamawa N/A N/A N/A
Akwa-Ibom 630 976 795
Anambra 480 599 500
Bauchi 211 183 174
Bayelsa 615 858 666
67,445
64,453
59,504
50,000
52,000
54,000
56,000
58,000
60,000
62,000
64,000
66,000
68,000
70,000
2014 2015 2016
25
State 2014 2015 2016
Benue 322 298 263
Borno 64 54 72
Cross River N/A N/A N/A
Delta 487 264 389
Ebonyi 112 103 115
Edo N/A N/A N/A
Ekiti 191 214 221
Enugu 1453 2286 2577
FCT N/A N/A N/A
Gombe N/A N/A N/A
Imo 110 213 141
Jigawa N/A N/A N/A
Kaduna 693 423 646
Kano 140 151 128
Katsina N/A N/A N/A
Kebbi N/A N/A N/A
Kogi N/A N/A N/A
Kwara 1029 1271 1233
Lagos 322 298 263
Nassarawa 33 18 27
Niger 264 231 274
Ogun 4530 3150 3363
Ondo N/A N/A N/A
Osun 183 743 1815
Oyo 103 116 219
Plateau 2300 2462 2765
Rivers N/A N/A N/A
Sokoto N/A N/A N/A
Taraba 36 34 50
Yobe N/A N/A N/A
Zamfara N/A N/A N/A Source: States Marriage Registry/ Local government Registry
*N/A-Not Available
Table 8 shows the distribution of marriages by state and year. Among reporting states, Ogun state recorded the highest number of marriages while Nassarawa state had the lowest number of marriages in the year under review.

26
Conclusion
The findings in this report suggest that in the next three decades, Nigeria’s projected population will make it a large country with a youthful population, mainly as a result of high fertility rates. Although a large and young workforce is beneficial to support the availability of labour, production and consumption of goods and services, it also calls for careful management in order to ensure that majority of the population do not fall or live in poverty. The high fertility rates may be as a result of still relatively low uptake of family planning methods. Improving access to education and family planning methods will contribute positively to lowering fertility rates and hence managing population growth in the near future.