demographic and economic profile - sienna hills...
TRANSCRIPT

Washington County
Demographic and Economic Profile
Prepared byLecia Parks LangstonRegional Economist

Population/Demographics

Washington County Population
Source: Utah Population Estimates Committee; Utah Governor’s Office of Planning and Budget.
0
75,000
150,000
225,000
300,000
1980 1985 1990 1995 2000 2005 2010 2015
PopulationProjections

Population Growth
Source: U.S. Census Bureau.
0%
25%
50%
75%
100%
1940195019601970198019902000
Washington County
Utah
U.S.

Washington County Net Migration
0
2,250
4,500
6,750
9,000
1980 1984 1988 1992 1996 2000 2004 2008Source: Utah Population Estimates Committee; Utah Governor’s Office of Planning and Budget.

Washington County Population by City
Source: U.S. Census Bureau.
Enterprise
Hildale
Hurricane
Ivins
LaVerkin
Leeds
New Harmony
Rockville
St. George
Santa Clara
Springdale
Toquerville
Virgin
Washington 8,319
398
911
458
4,679
50,160
248
190
650
3,408
4,700
8,361
1,897
1,285
17,716
555
1,373
579
6,866
72,718
264
194
764
4,487
7,870
13,321
1,970
1,636
20082000

1990 to 2000 Population Growth by County
Source: U.S. Census Bureau.
SummitWashington
IronTooele
WasatchJuab
SanpeteUtah
DaggettCache
State TotalMorgan
GrandDavis
BeaverWeber
Salt LakeSevier
GarfieldBox Elder
KaneWayne
San JuanRich
UintahDuchesne
U.S.Piute
MillardEmery
Carbon 1%5%
10%12%13%14%14%14%14%15%
17%17%
19%22%
24%24%
26%27%28%29%30%30%
34%40%40%
42%51%
53%63%
86%92%

2000 to 2008 Population Growth by CountyWashington
WasatchTooele
UtahIron
MorganSummit
DavisState of Utah
CacheJuab
UintahSanpete
RichDuchesneSalt Lake
WeberBox Elder
KaneGrandSevierMillardBeaver
GarfieldSan Juan
WayneDaggett
PiuteEmery
Carbon -3%-2%
1%3%5%6%6%
8%9%9%9%10%
14%14%14%
16%17%18%
20%21%22%23%
26%33%34%36%
40%40%
48%59%
Source: Utah Population Estimates Committee; Utah Governor’s Office of Planning and Budget.

2007 to 2008 Population Growth by CountyUintah
RichPiute
MorganWasatchSummit
JuabDuchesne
UtahGarfield
KaneIron
TooeleWashington
San JuanCache
Box ElderGrand
State of UtahDavis
SanpeteWeberEmery
Salt LakeMillardBeaverSevier
CarbonWayne
Daggett -0.5%0.1%
0.6%0.9%0.9%1.0%1.1%
1.4%1.7%1.9%2.0%2.2%2.2%
2.6%2.6%2.7%2.7%
3.0%3.4%3.5%3.5%3.6%3.7%
4.0%4.0%4.1%4.1%
4.5%5.4%
5.7%
Source: Utah Population Estimates Committee; Utah Governor’s Office of Planning and Budget.

Under 5 5-17 18-24 25-44 45-64 Over 65
13%
26%27%
10%
17%
7%9%
20%
28%
12%
21%
10%
18%
15%
28%
10%
19%
10%
Age Groups
WashingtonUtahU.S.
2008 Population Age Distribution
Source: U.S. Census Bureau; American Community Survey

Washington County Race/Ethnic
Source: U.S. Census Bureau.
2000 2008
1.3%1.3%
7.9%
5.2%
0.5%0.4%0.8%
0.4%
1.2%1.4%
0.6%0.2%
Black American Indian Asian Pacific IslanderHispanic Two or More Races

Adults With at Least a High School Diploma*
* Population 25 years and older.Source: U.S. Census Bureau; American Community Survey.
85%90% 91% 88%
U.S. 2007 Utah 2007Washington County 2007Washington County 2000

Adults With at Least a Bachelor’s Degree*
* Population 25 years and older.Source: U.S. Census Bureau.
28% 29%
21% 21%
U.S. 2007 Utah 2007Washington County 2007Washington County 2000

Employment

Washington County Nonfarm Jobs
Source: Utah Department of Workforce Services.
0
15,000
30,000
45,000
60,000
1980 1984 1988 1992 1996 2000 2004 2008p

Nonfarm Job Growth
Source: Utah Department of Workforce Services.
-5%
0%
5%
10%
15%
20%
1990199119921993199419951996199719981999200020012002200320042005200620072008p
Washington County
Utah
U.S.

Duchesne Uintah
Carbon Summit Garfield Beaver
Rich Wayne
Sanpete Cache Sevier Grand Millard
U.S. Salt Lake
TooeleState Total
Box Elder San Juan
Weber Davis Kane Utah Piute Iron
Emery Washington
Morgan Wasatch
Juab Daggett-12.3%
-8.8%-7.6%
-4.4%-3.8%-3.0%-2.0%-1.4%-0.6%-0.6%-0.2%-0.2%-0.1%
0.1%0.1%0.1%0.3%0.4%0.4%0.5%1.0%1.6%2.0%2.0%2.1%2.3%3.6%3.8%4.6%
7.2%13.9%
Annual 2008 Change in Nonfarm Jobs
Source: Utah Department of Workforce Services; U.S Bureau of Labor Statistics.

2008 Washington County Jobs Distribution by Industry
Source: Utah Department of Workforce Services.
Mining1%
Construction12%
Manufacturing6%
Trade/Trans/Utilities24%
Information2%
Financial Activities4%
Prof/Business Svcs8%
Ed/Health/Social Svcs15%
Leisure/Hospitality14%
Other Services1%
Government14%

2008 Percent Change in Nonfarm Jobs by Industry
Source: Utah Department of Workforce Services.
Total
Mining
Construction
Manufacturing
Trade/Trans/Utilities
Information
Financial Activities
Prof/Business Svcs
Ed/Health/Social Svcs
Leisure/Hospitality
Other Services
Government 7%
-5%
-2%
6%
-4%
-7%
1%
-1%
-6%
-25%
-15%
-4%
2%
0%
2%
5%
1%
-1%
-5%
1%
-2%
-13%
13%
0%
Bar 3UtahWashington

2008 Washington County Numeric Change in Jobs by Industry
Source: Utah Department of Workforce Services.
Mining
Construction
Manufacturing
Trade/Trans/Utilities
Information
Financial Activities
Prof/Business Svcs
Ed/Health/Social Svcs
Leisure/Hospitality
Other Services
Government 427
-71
-124
443
-153
-161
11
-92
-186
-2,057
-46
Down 2,009 Jobs

2008 Nonfarm Job Distribution by Industry
Source: Utah Department of Workforce Services.
Mining
Construction
Manufacturing
Trade/Trans/Util
Information
Financial Activities
Prof/Bus Services
Ed/Health/Social Svcs
Leisure/Hospitality
Other Services
Government 17%
3%
9%
11%
13%
6%
3%
20%
10%
8%
1%
13%
3%
13%
15%
8%
4%
2%
24%
6%
12%
1%
WashingtonUtahNorth

Washington County Industrial Job Distribution
Source: Utah Department of Workforce Services.
Mining
Construction
Manufacturing
Trade/Trans/Util
Information
Financial Activities
Prof/Bus Services
Ed/Health/Social Svcs
Leisure/Hospitality
Other Services
Government 14%
2%
14%
11%
6%
4%
2%
25%
7%
14%
1%
13%
3%
13%
15%
8%
4%
2%
24%
6%
12%
1%
20081999North

1st Qtr 2008 Washington County Firms by Size
Source: Utah Department of Workforce Services.
15%
44%
18%
12%
8%
3%
1%
0%
0%
0
1-4
5-9
10-24
25-49
50-99
100-249
250-499
500 & More

1st Qtr 2008 Washington County Employment by Firm Size
Source: Utah Department of Workforce Services.
9%
12%
15%
22%
18%
13%
4%
8%
0
1-4
5-9
10-24
25-49
50-99
100-249
250-499
500 & Over
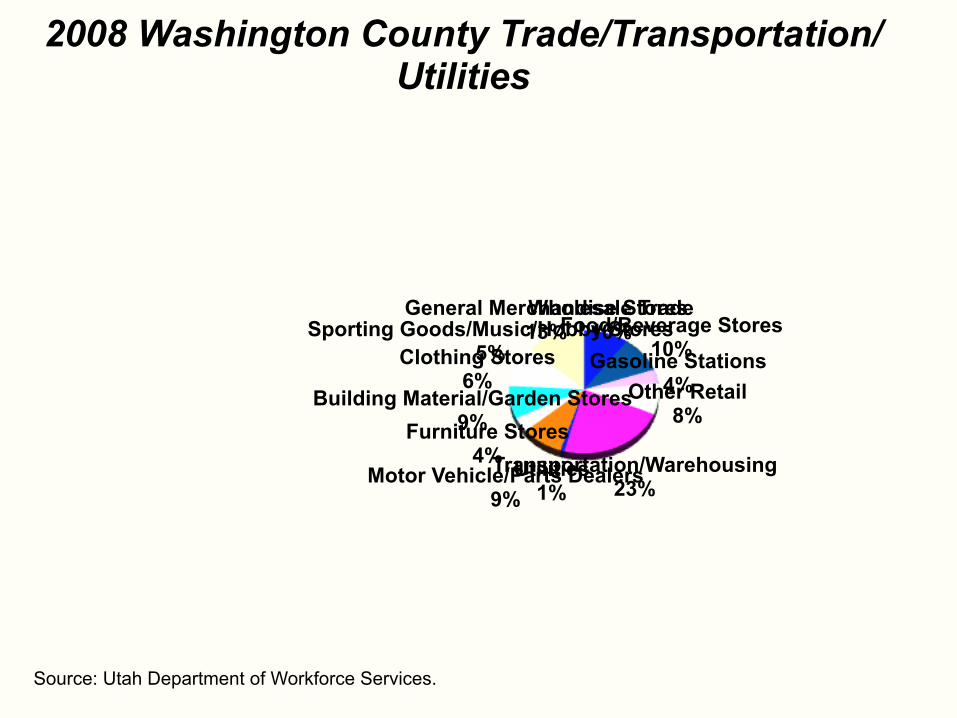
2008 Washington County Trade/Transportation/Utilities
Source: Utah Department of Workforce Services.
Wholesale Trade10%Food/Beverage Stores
10%Gasoline Stations4%Other Retail8%
Transportation/Warehousing23%
Utilities1%
Motor Vehicle/Parts Dealers9%
Furniture Stores4%
Building Material/Garden Stores9%
Clothing Stores6%
Sporting Goods/Music/Hobby Stores5%
General Merchandise Stores13%

Performing Arts/Sports3%Amusement/Recreation
10%
Accommodations23%
Food/Beverage Services64%
2008 Washington County Leisure/Hospitality Services Employment
Source: Utah Department of Workforce Services.

Annual Unemployment Rates
Source: Utah Department of Workforce Services.
2%
8%
1990199219941996199820002002200420062008p
U.S
Washington
Utah

Annual 2008 Unemployment RatesUintah
RichDuchesne
CachePiute
MillardMorganSummit
UtahDavis
Salt LakeBeaver
State of UtahWasatch
EmeryDaggett
SevierTooele
Box ElderKane
SanpeteWeber
IronCarbon
WashingtonJuab
WayneGrand
U.S.Garfield
San Juan 6.0%5.9%
5.8%5.6%
5.3%5.0%
4.6%4.3%
4.2%4.1%
4.0%4.0%
3.9%3.8%3.8%
3.7%3.6%
3.5%3.4%3.4%
3.3%3.3%
3.2%3.2%3.2%3.2%
2.8%2.7%
2.6%2.5%
2.2%
Source: Utah Dept. of Workforce Svcs; U.S. Bureau of Labor Statistics.

2007 Washington County Industry Employment Share by Gender
TotalMining
ConstructionManufacturing
UtilitiesWholesale Trade
Retail TradeTransportation/Warehousing
InformationFinancial Activities
Prof/Business SvcsEd/Health/Social Svcs
Leisure/HospitalityOther Services
Public Administration
0% 25% 50% 75% 100%MaleFemale
Source: U.S. Census Bureau, Local Employment Dynamics.

2007 Washington County Employment Share by Age
14-187% 19-21
9%22-24
9%
25-3425%35-44
19%
45-5417%
55-6411%
65-994%
Source: U.S. Census Bureau, Local Employment Dynamics.

2007 Average Monthly Earnings by Gender
$3,107
$1,891
$4,116
$2,271
Male FemaleWashingtonUtahNorth
Source: U.S. Census Bureau, Local Employment Dynamics.
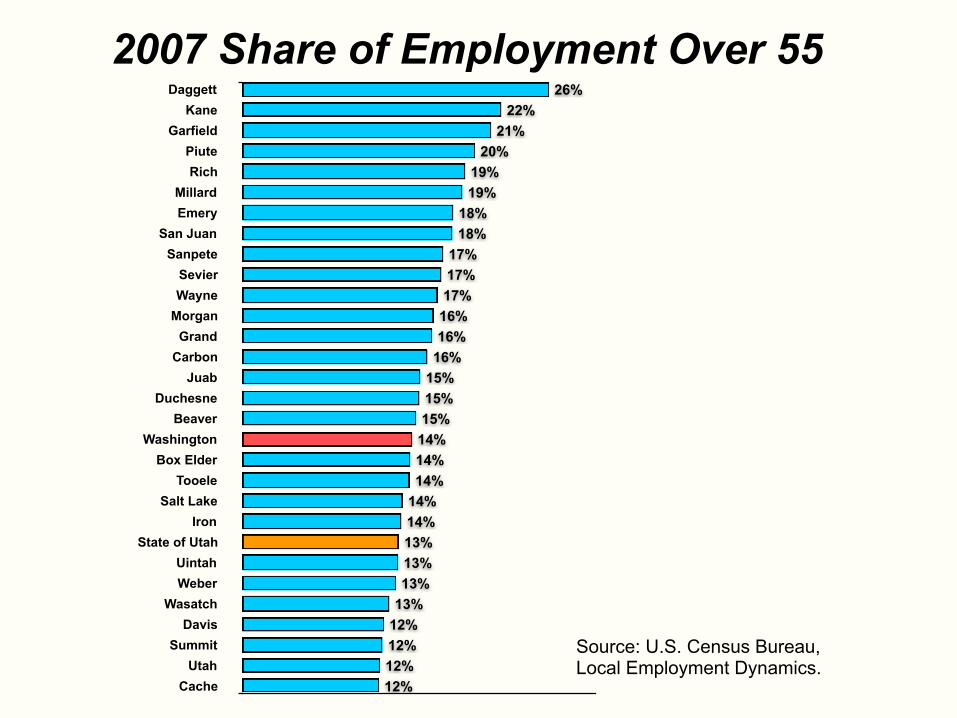
2007 Share of Employment Over 55Daggett
KaneGarfield
PiuteRich
MillardEmery
San JuanSanpete
SevierWayne
MorganGrand
CarbonJuab
DuchesneBeaver
WashingtonBox Elder
TooeleSalt Lake
IronState of Utah
UintahWeber
WasatchDavis
SummitUtah
Cache 12%12%12%12%13%13%13%13%14%14%14%14%14%15%15%15%16%16%16%17%17%17%
18%18%
19%19%
20%21%
22%26%
Source: U.S. Census Bureau, Local Employment Dynamics.
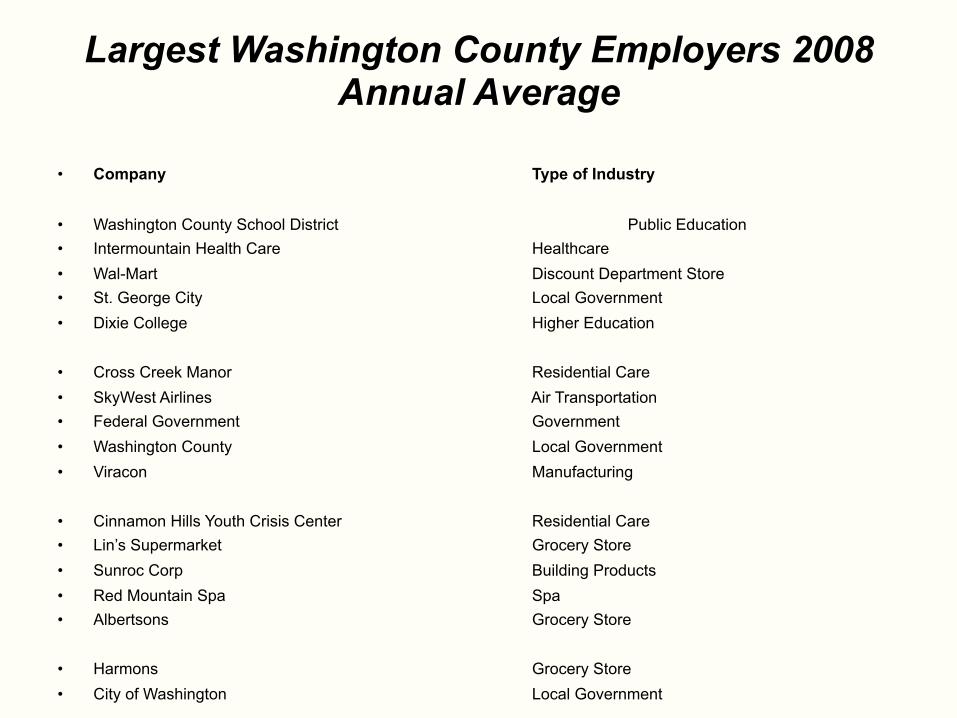
Largest Washington County Employers 2008 Annual Average
• Company Type of Industry
• Washington County School District Public Education• Intermountain Health Care Healthcare• Wal-Mart Discount Department Store• St. George City Local Government • Dixie College Higher Education
• Cross Creek Manor Residential Care• SkyWest Airlines Air Transportation• Federal Government Government• Washington County Local Government• Viracon Manufacturing
• Cinnamon Hills Youth Crisis Center Residential Care • Lin’s Supermarket Grocery Store• Sunroc Corp Building Products• Red Mountain Spa Spa• Albertsons Grocery Store
• Harmons Grocery Store• City of Washington Local Government

Income and Wages

600
1,200
1,800
2,400
3,000
1990199219941996199820002002200420062008p
Washington County Average Monthly Wage
Note: Inflation adjusted wages reflect the rate of inflation as measured by the Consumer Price Index, 1982-84=100Source: Utah Department of Workforce Services.
Actual
Inflation Adjusted

Washington County Average Monthly Wage As a Percent of State
Source: Utah Department of Workforce Services.
75% 75% 74%76% 78% 78% 78% 77% 78% 78% 76% 76% 76% 77% 77%
79% 80% 79% 78%
1990 1992 1994 1996 1998 2000 2002 2004 2006 2008p

Washington County 2008 Average Monthly Wage by Industry
Source: Utah Department of Workforce Services.
Total
Mining
Construction
Manufacturing
Trade/Trans/Utilities
Information
Financial Activities
Prof/Business Svcs
Ed/Health/Social Svcs
Leisure/Hospitality
Other Services
Government $2,680
$2,050
$1,206
$2,923
$2,634
$2,819
$2,512
$2,384
$2,811
$2,594
$1,928
$2,424

Washington County 2008Total Wages by Industry
Source: Utah Department of Workforce Services.
Millions of $
Trade/Trans/Utilities
Ed/Health/Social Svcs
Government
Construction
Prof/Business Services
Manufacturing
Leisure/Hospitality
Other Services
Financial Activities
Information
Mining$6.0
$24.6
$27.8
$33.1
$98.8
$105.4
$127.3
$196.5
$221.6
$269.4
$344.4

2008 Average Monthly Wage by County
Source: Utah Department of Workforce Services.
Uintah Duchesne Box Elder Salt Lake
Emery Tooele
State Total Carbon
Davis Utah
Weber Summit Millard
Morgan Daggett
Juab Wasatch
Washington Sevier
San Juan Cache
Beaver Grand
Iron Rich
Wayne Kane
Sanpete Garfield
Piute $1,910$2,010$2,065$2,098$2,121$2,121
$2,218$2,250
$2,341$2,380$2,407$2,411$2,424
$2,548$2,551$2,607$2,636
$2,746$2,754$2,794$2,834
$2,986$3,085$3,120$3,142
$3,317$3,468
$3,594$3,642$3,706

$61,173$62,432
$53,207U.S. Utah Washington
2007 Median Family Income
Source: U.S. Census Bureau; American Community Survey.

Less than $10,0001%
$10,000-14,9993%
$15,000-24,9998%
$25,000-34,99913%
$35,000-49,99920%
$50,000-74,99925%
$75,000-99,99914%
$100,000-149,00011%
$150,000-199,9992%$200,000 or More3%
Washington County 2007
Source: U.S. Census Bureau; American Community Survey.

2007 Personal Income by Source
Source: U.S. Bureau of Economic Analysis.
State of Utah WashingtonEarnings Dividends/Interest/Rent Transfer Payments
74%
15%
11%
62%
20%
18%

2007 Per Capita Personal Income by County
Source: U.S. Bureau of Economic Analysis.
SummitU.S.
Salt LakeDuchesne
DavisState of Utah
WeberKane
UintahCarbonMorganBeaver
WasatchRich
MillardBox Elder
GrandPiute
TooeleGarfield
WashingtonWayneEmerySevierCache
JuabUtahIron
DaggettSanpete
San Juan $17,170$19,329$19,941
$21,103$21,668$22,374$22,874$23,081$23,572$23,610$24,014$24,167$24,742$25,341$25,852$25,898$26,397$26,465$26,838$27,240
$28,071$28,730
$29,534$29,663$29,669$29,831
$31,518$32,996
$35,805$38,615
$59,216

Other Indicators

$95.7
$156.8
$197.6
$155.6$152.6$136.3
$157.0$164.5$178.7$188.6
$235.4
$316.4
$458.2
$604.1
$411.8
$351.2
$119.3
1992 19931994 1995 1996 1997 19981999 2000 2001 2002 2003 20042005 2006 2007 2008
Washington County New Residential Building Permit Valuation
Source: Utah Bureau of Business and Economic Research.
Millions of $

Washington County Permitted New Dwelling Units
Source: Utah Bureau of Business and Economic Research.
1992
1993
1994
1995
1996
1997
1998
1999
2000
2001
2002
2003
2004
2005
2006
2007
2008
682
1,954
2,256
3,8603,794
2,678
1,995
1,7401,5621,519
1,6871,514
1,9292,019
2,697
2,114
1,266

$16.1
$44.3$32.0
$75.2
$51.7
$84.8
$30.7$37.4
$68.9
$39.6
$109.6
$43.6
$107.5$118.2
$176.9
$143.5
$121.0
1992 1993 1994 1995 1996 1997 1998 1999 2000 2001 2002 2003 2004 2005 2006 2007 2008
Washington County New Nonresidential Building Permit Valuation
Source: Utah Bureau of Business and Economic Research.
Millions of $

2007-2008 Washington County Permitted New Dwelling Units by Community
Source: Utah Bureau of Business and Economic Research.
Enterprise
Hurricane
Ivins
LaVerkin
Leeds
Santa Clara
Springdale
St. George
Virgin
Washington City
Other 47
170
2
281
26
6
5
7
49
80
9
91
505
10
874
10
69
3
37
99
217
39
20072008

Percent Change in Washington County Gross Taxable Sales
Source: Utah State Tax Commission.
-8%
0%
8%
15%
23%
30%
199219941996199820002002200420062008p

Washington County 2008Gross Taxable Sales by Industry
Source: Utah State Tax Commission.
Ag/Forestry/Fishing0%
Mining0%Construction2%Manufacturing
2%Trans/Comm/Utilities5%
Wholesale Trade9%
Retail Trade63%
Finance/Insurance/Real Estate0% Services
13% Other5%

Washington County 2008 Gross Taxable Sales in Retail Trade Industry
Source: Utah State Tax Commission.
Miscellaneous9%Eating and Drinking Places
10%
Furniture6%
Apparel & Accessory6%
Motor Vehicle Dealers15%Food Stores
11%
General Merchandise33%
Building & Garden11%

Washington County Economic and Demographic Profile
• This PowerPoint presentation was prepared by the Utah Department of Workforce Services.
• For a hard copy in pdf format, please go to the following website: jobs.utah.gov/opencms/wi and click on “County Info” then select the appropriate county.
• PowerPoint slides are also available for downloading at this site as well as historical data.
• For more information, contact Lecia Parks Langston at 435/688-3115 or [email protected]