demand response
DESCRIPTION
Demand ResponseTRANSCRIPT


Assessment of Demand Response and Advanced Metering Federal Energy Regulatory Commission
i
Assessment of Demand Response and Advanced Metering Staff Report
Docket AD06-2-000
August 2006 (Revised December 2008)
Table of Contents
Table of Contents ___________________________________________________________ i
Executive Summary _________________________________________________________v Energy Policy Act of 2005 ________________________________________________________ v Commission Staff Activities ______________________________________________________ v Advanced Metering _____________________________________________________________vi Existing Demand Response Programs and Time-Based Rates __________________________vi Demand Response in Regional Transmission Planning and Operations __________________ x Regulatory Barriers_____________________________________________________________xi Conclusions___________________________________________________________________ xii
Chapter I. Introduction _____________________________________________________ 1 Energy Policy Act of 2005 ________________________________________________________ 1 Commission Staff Activities ______________________________________________________ 1 Demand Response and Advanced Metering Survey___________________________________ 2 Report Organization ____________________________________________________________ 2 Regional Definitions_____________________________________________________________ 3
Chapter II. Background on Demand Response __________________________________ 5 Definition of Demand Response ___________________________________________________ 5 Types of Demand Response ______________________________________________________ 6 Role of Demand Response in Retail and Wholesale Markets ___________________________ 7 Use of Demand Response in the United States _______________________________________ 8 Benefits of Demand Response____________________________________________________ 10
Participant Benefits ___________________________________________________________________10 Market and System Benefits ____________________________________________________________10 Additional Benefits Created by Demand Response ___________________________________________11
Evidence of Customer Price-Responsiveness _______________________________________ 13 Role of Enabling Technology ____________________________________________________ 14

Assessment of Demand Response and Advanced Metering Federal Energy Regulatory Commission
ii
Table of Contents (Cont.)
Chapter III. Advanced Metering and Market Penetration _________________________ 17 What is advanced metering? _____________________________________________________17 Overview of Advanced Metering __________________________________________________18
Building Blocks of Advanced Metering ___________________________________________________19 Estimates of Advanced Metering Market Penetration from FERC Survey _______________25
FERC Survey ________________________________________________________________________25 Advanced Metering Market Penetration Estimates ___________________________________________26 Uses of Advanced Metering_____________________________________________________________31 Recent Deployments of AMI Systems_____________________________________________________32
Costs and Benefits Associated with Advanced Metering_______________________________33 Costs of Deploying Advanced Metering ___________________________________________________33 Benefits Associated with Advanced Metering_______________________________________________35
Current Issues Associated with Advanced Metering__________________________________38 AMI specifications____________________________________________________________________38 Advanced Metering and Price Responsive Demand Response Networks __________________________39 Providing Timely Information to Customers ________________________________________________40 Interoperability and Standard Interfaces ___________________________________________________41 Security ____________________________________________________________________________42 Costs and Benefits to Include in Business Case Analyses ______________________________________43
Chapter IV. Existing Demand Response Programs and Time-Based Rates ___________ 45 Incentive-Based Demand Response Programs _______________________________________45
Direct Load Control___________________________________________________________________46 Interruptible/Curtailable Rates___________________________________________________________47 Emergency Demand Response Programs __________________________________________________48 Capacity-Market Programs _____________________________________________________________49 Demand Bidding/Buyback Programs______________________________________________________49 Ancillary Services ____________________________________________________________________51
Time-Based Rate Programs ______________________________________________________51 Time-of-Use Rates ___________________________________________________________________53 Time-of-Use Rates____________________________________________________________________54 Critical Peak Pricing __________________________________________________________________57 Real-Time Pricing ____________________________________________________________________60
Demand Response Program Survey Results_________________________________________63 Incentive-Based Demand Response_______________________________________________________63 Time-Based Rates ____________________________________________________________________65
Motivations for the Use of Demand Response and Time-Based Rates____________________69 Current issues/challenges ________________________________________________________71 Demand Response Activities at the State, Regional and Federal Level ___________________75

Assessment of Demand Response and Advanced Metering Federal Energy Regulatory Commission
iii
Table of Contents (Cont.)
Chapter V. Demand Response as a Resource ___________________________________ 79 FERC Survey: Demand Response Program Information_____________________________ 79 FERC Survey Results: Demand Response Resource Estimates ________________________ 81
Potential Peak Load Reduction of Demand Response Programs and Time-Based Rates ______________81 Actual vs. Potential Peak Reductions of Demand Response Programs and Time-Based Rates__________84
Existing Demand Response Resource Contribution__________________________________ 86 Chapter VI. Role of Demand Response in Regional Planning and Operations ________ 91
Potential for Demand Response for Regional Planning _______________________________ 91 Transmission Planning and Operations and Demand Response________________________ 95
Transmission Planning Process __________________________________________________________95 Demand Response in Transmission Planning _______________________________________________97 Provision of Ancillary Services by Demand Response ________________________________________97
Regional Treatment of Demand Response ________________________________________ 101 North American Electric Reliability Council_______________________________________________101 Texas Interconnection and the Electric Reliability Council of Texas ____________________________103 Western Interconnection and the Western Electric Coordinating Council_________________________104 Eastern Interconnection _______________________________________________________________108 International Examples________________________________________________________________114
Example Demand Response Projects_____________________________________________ 114 LIPA Edge _________________________________________________________________________114 Southern California Edison Feeder Relief _________________________________________________115 BPA Olympic Peninsula ______________________________________________________________116 Consolidated Edison__________________________________________________________________116 Mad River Valley Project______________________________________________________________117 The Energy Coalition _________________________________________________________________117
Concerns And Obstacles _______________________________________________________ 117 Lack of Uniform Treatment of Demand Response. __________________________________________117 Perceived Temporary Nature of Demand Response _________________________________________118 Regulatory Treatment of Transmission and Demand Response Costs____________________________119 Reliability of Statistical Demand Response ________________________________________________119 Manual Override and Voluntary Response ________________________________________________121 Capacity Credit _____________________________________________________________________122 Co-Optimization – Response Cost Vs Duration_____________________________________________123
Steps that could be taken to ensure that, in regional transmission planning and operations, demand resources are provided equitable treatment ________________________________ 123

Assessment of Demand Response and Advanced Metering Federal Energy Regulatory Commission
iv
Table of Contents (Cont.)
Chapter VII. Regulatory Barriers ___________________________________________ 125 Regulatory Barriers ___________________________________________________________125
Disconnect Between Retail Pricing and Wholesale Markets ___________________________________125 Utility Disincentives Associated with Offering Demand Response _____________________________126 Cost Recovery and Incentives for Enabling Technologies ____________________________________128 Barriers to Providing Demand-Response Services by Third Parties _____________________________129 Need for Additional Research on Cost-Effectiveness and Measurement of Reductions ______________130 Existence of Specific State-Level Barriers to Greater Demand Response_________________________131 Specific Retail and Wholesale Rules that Limit Demand Response _____________________________132 Insufficient Market Transparency and Access to Data _______________________________________132 Better Coordination of Federal-State Jurisdiction Affecting Demand Response____________________133
Recommendations_____________________________________________________________133
Appendices Appendix A: EPAct 2005 Language on Demand Response and Smart Metering
Appendix B: Acronyms Used in the Report
Appendix C: Glossary for the Report
Appendix D: Bibliography for the Report
Appendix E: The Public Process Leading to the Report
Appendix F: The FERC Survey
Appendix G: FERC Survey Respondents
Appendix H: Demand Response (DR) Programs and Services at Responding Utilities
Appendix I: Data and Sources for Figures
Appendix J: Acknowledgements
Errata to the 2006 Report
ES – Executive Summary
Assessment of Demand Response and Advanced Metering Federal Energy Regulatory Commission
v
Executive Summary
Energy Policy Act of 2005 Section 1252(e)(3) of the Energy Policy Act of 2005 (EPAct 2005) 1 requires the Federal Energy Regulatory Commission (Commission) to prepare a report by appropriate region, that assesses electric demand response resources, including those available from all consumer classes. Congress directed that this report be prepared and published not later than one year after the date of enactment of the EPAct 2005, and specifically to identify and review the following for the electric power industry:
• saturation and penetration rate of advanced meters and communications technologies, devices and systems;
• existing demand response programs and time-based rate programs; • the annual resource contribution of demand resources; • the potential for demand response as a quantifiable, reliable resource for regional planning
purposes; • steps taken to ensure that, in regional transmission planning and operations, demand
resources are provided equitable treatment as a quantifiable, reliable resource relative to the resource obligations of any load-serving entity, transmission provider, or transmitting party; and
• regulatory barriers to improved customer participation in demand response, peak reduction and critical period pricing programs.
Commission Staff Activities In preparing this report, Commission staff undertook several activities:
• Developed and implemented a first-of-its-kind, comprehensive national survey of electric demand response and advanced metering. The FERC Demand Response and Advanced Metering Survey (FERC Survey) requested information on (a) the number and uses of advanced metering, and (b) existing demand response and time-based rate programs, including their current level of resource contribution.
• Requested and received written comments from interested persons on a draft version of the FERC Survey, and on key issues and challenges that Commission staff should examine. Thirty-one entities provided written comments to the proposed survey.
• Held a public technical conference on January 25, 2006 at Commission headquarters in Washington, D.C.; obtained comments from five panels with over 30 participants.
• Surveyed 3,365 organizations in all 50 states representing every aspect of the electric delivery industry: investor-owned utilities, municipal utilities, rural electric cooperatives, power marketers, state and federal agencies, and unregulated demand response providers. The voluntary survey had a response rate of about 55 percent.
1 Energy Policy Act of 2005, Pub. L. No. 109-58, § 1252(e)(3), 119 Stat. 594 (2005) (EPAct section 1252(e)(3)).
The full text of section 1252 is attached as Appendix A.

ES – Executive Summary
Assessment of Demand Response and Advanced Metering Federal Energy Regulatory Commission
vi
• Collected information on the role of demand resources in regional transmission planning and operations through review of regional transmission documents, and through interviews with regional representatives.
• Conducted a detailed review of the literature on and experience with advanced metering, demand response programs, and time-based rates.
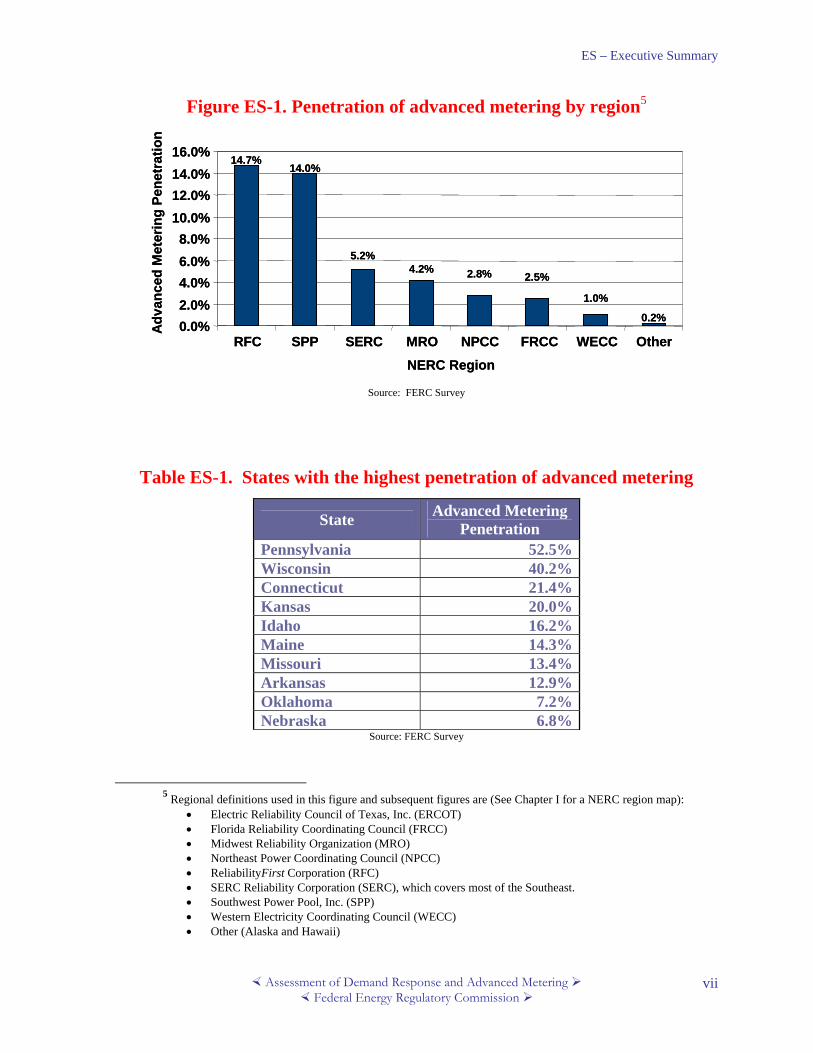
Advanced Metering By specifically designating saturation and penetrations rates of advanced meters and communication technologies, devices and systems as a matter to be covered in this report, Congress in section 1252 (e)(3) of EPAct 2005 recognized that the penetration of advanced metering2 is important for the future development of electric demand responsiveness in the United States. In studying this issue, Commission staff examined the state of the technology and the market penetration of advanced metering. One result of the FERC Survey is that advanced metering currently has a penetration of about six percent of total installed, electric meters in the United States. An analysis of market penetration by region indicates that there are differences in how much advanced metering has been adopted across the United States (see Figure ES-1). The parts of the United States associated with the ReliabilityFirst Council (RFC)3 and Southwest Power Pool (SPP) had the highest regional overall penetration rates of 14.7 percent and 14 percent, respectively. Advanced metering penetration for the remaining regions in the United States is lower than the national average. Commission staff also developed estimates of the penetration of advanced metering by state. These state-by-state estimates should provide a useful baseline in the state deliberations on smart metering required by EPAct 20054 and any future state proceedings on advanced metering. Table ES-1 displays the penetration rate of advanced metering in the ten states with the highest penetration. The remaining states reported lower penetration rates. Market penetrations also differ by type of organization. The estimate of market penetration of advanced metering is highest among rural electric cooperatives at about 13 percent. Investor-owned utilities have the next highest penetration at close to six percent. This suggests that small, publicly-owned entities such as electric cooperatives have been actively pursuing automated and advanced meter reading.
Existing Demand Response Programs and Time-Based Rates In this report, Commission staff adopted the definition of “demand response,” that was used by the U.S. Department of Energy (DOE) in its February 2006 report to Congress:
2 For purposes of this report, Commission staff defined “advanced metering” as follows: “Advanced metering is a
metering system that records customer consumption [and possibly other parameters] hourly or more frequently and that provides for daily or more frequent transmittal of measurements over a communication network to a central collection point.”
3 ReliabilityFirst Corporation (RFC) is located in the Mid-Atlantic and in portions of the Midwest. 4 EPAct 2005 section 1252(b)
ES – Executive Summary
Assessment of Demand Response and Advanced Metering Federal Energy Regulatory Commission
vii
Figure ES-1. Penetration of advanced metering by region5
Source: FERC Survey
Table ES-1. States with the highest penetration of advanced metering
Source: FERC Survey
5 Regional definitions used in this figure and subsequent figures are (See Chapter I for a NERC region map):
• Electric Reliability Council of Texas, Inc. (ERCOT) • Florida Reliability Coordinating Council (FRCC) • Midwest Reliability Organization (MRO) • Northeast Power Coordinating Council (NPCC) • ReliabilityFirst Corporation (RFC) • SERC Reliability Corporation (SERC), which covers most of the Southeast. • Southwest Power Pool, Inc. (SPP) • Western Electricity Coordinating Council (WECC) • Other (Alaska and Hawaii)
State Advanced Metering Penetration
Pennsylvania 52.5% Wisconsin 40.2% Connecticut 21.4% Kansas 20.0% Idaho 16.2% Maine 14.3% Missouri 13.4% Arkansas 12.9% Oklahoma 7.2% Nebraska 6.8%
2.8%4.2%
0.2%
1.0%
2.5%
5.2%
14.0%14.7%
0.0%2.0%4.0%6.0%8.0%
10.0%12.0%14.0%16.0%
RFC SPP SERC MRO NPCC FRCC WECC Other
NERC Region
Adv
ance
d M
eter
ing
Pene
trat
ion
2.8%4.2%
0.2%
1.0%
2.5%
5.2%
14.0%14.7%
0.0%2.0%4.0%6.0%8.0%
10.0%12.0%14.0%16.0%
RFC SPP SERC MRO NPCC FRCC WECC Other
NERC Region
Adv
ance
d M
eter
ing
Pene
trat
ion

ES – Executive Summary
Assessment of Demand Response and Advanced Metering Federal Energy Regulatory Commission
viii
Changes in electric usage by end-use customers from their normal consumption patterns in response to changes in the price of electricity over time, or to incentive payments designed to induce lower electricity use at times of high wholesale market prices or when system reliability is jeopardized.6
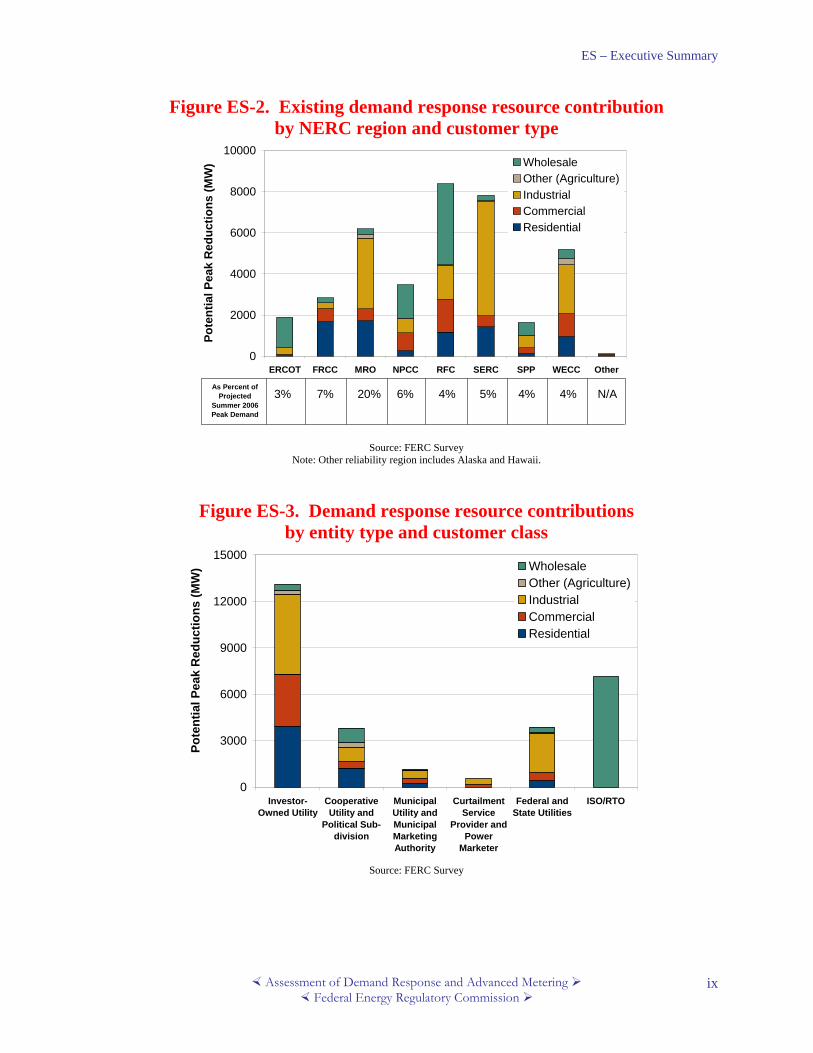
Demand response under this definition can be categorized into two groups: incentive-based demand response and time-based rates. Incentive-based demand response includes direct load control, interruptible/curtailable rates, demand bidding/buyback programs, emergency demand response programs, capacity market programs, and ancillary services market programs. Time-based rates include time-of-use rates, critical-peak pricing, and real-time pricing. Based on the results of the FERC Survey, Commission staff found that the use of demand response is not widespread. Only approximately five percent of customers are on some form of time-based rates or incentive-based program. The most common demand response programs offered are direct load control, interruptible/curtailable programs, and time-of-use rates, but only about 200 entities reported that they offer these programs. Interest in time-based rates and demand response programs is growing, and results from recent programs and pilots are encouraging. The FERC Survey also requested information on the potential peak reduction that existing demand response programs represent. Nationally, the total potential demand response resource contribution from existing programs is estimated to be about 37,500 MW. The vast majority of this resource potential is associated with incentive-based demand response. Figure ES-2 shows a breakdown of resource contribution by reliability region and by customer type. Because peak loads vary significantly among reliability regions, it is useful to characterize the existing demand response potential capability relative to each region’s summer peak demand. Demand response resource potential ranges from three to seven percent in most North American Electric Reliability Council (NERC) reliability regions, with the notable exception of the MRO region (20 percent). The NERC regions of the country with the largest demand response resource contributions (as a percent of the national total) are RFC (22 percent), SERC (21 percent), and MRO (16 percent). Demand response programs and time-based rates are offered by all forms of electric companies that serve customers. Publicly-owned utilities (electric cooperatives, political subdivisions, and municipal utilities) account for 55 percent of entities reporting that they offer time-of-use rates to residential customers. A similar distribution reported that they offered direct load control programs. Investor-owned utility programs account for 47 percent of national demand response resource contributions, followed by Independent System Operator/Regional Transmission Organization (ISO/RTO) administered demand response programs, which contribute 19 percent of national demand response resources (see Figure ES-3).
6 U.S. Department of Energy, Benefits of Demand Response in Electricity Markets and Recommendations for
Achieving Them: A Report to the United States Congress Pursuant to Section 1252 of the Energy Policy Act of 2005, February 2006 (February 2006 DOE EPAct Report).
ES – Executive Summary
Assessment of Demand Response and Advanced Metering Federal Energy Regulatory Commission
ix
Figure ES-2. Existing demand response resource contribution by NERC region and customer type
0
2000
4000
6000
8000
10000
ERCOT FRCC MRO NPCC RFC SERC SPP WECC Other
Pote
ntia
l Pea
k R
educ
tions
(MW
) Wholesale Other (Agriculture)IndustrialCommercialResidential
As Percent of Projected
Summer 2006 Peak Demand
3% 4%5%4%6%20%7% 4% N/A
Source: FERC Survey
Note: Other reliability region includes Alaska and Hawaii.
Figure ES-3. Demand response resource contributions by entity type and customer class
0
3000
6000
9000
12000
15000
Investor-Owned Utility
CooperativeUtility and
Political Sub-division
MunicipalUtility andMunicipalMarketingAuthority
CurtailmentService
Provider andPower
Marketer
Federal andState Utilities
ISO/RTO
Pote
ntia
l Pea
k R
educ
tions
(MW
) Wholesale Other (Agriculture)IndustrialCommercialResidential
Source: FERC Survey
ES – Executive Summary
Assessment of Demand Response and Advanced Metering Federal Energy Regulatory Commission
x
Demand Response in Regional Transmission Planning and Operations To a degree, generation, transmission, and demand response are substitutes, depending on the location of generation or demand response. As a substitute for generation, demand response can serve as a local peaking resource and thereby assist resource adequacy. As a substitute for transmission and distribution infrastructure, demand response can reduce the need for new transmission or distribution expansion to bring generation to a local area. At minimum, demand response can provide relief for an overloaded transmission system, and can defer the need for infrastructure.7 Time-based rates and direct-load-control can be used to target specific hours when system needs are greatest. Demand response is not treated in transmission planning uniformly across regions, and demand response is typically not directly assessed during transmission planning. It is included only indirectly in most transmission planning. Existing or expected demand response resources are incorporated into reliability assessments either as modifications to expected load or as responsive resources. New demand response resources are typically not included as potential solutions to transmission adequacy problems. System planners do not consider demand response equally when they examine options for dealing with transmission inadequacies. If they do consider demand response, it is as a temporary solution until a permanent transmission enhancement is in place. Commission staff found that many regional transmission organizations state that their responsibility is limited to identifying transmission concerns and evaluating proposed solutions, not primarily encouraging demand response. Bonneville Power Administration, the Midwest ISO, and the PJM Interconnection were the only large entities that reported having policies to consider demand response in transmission planning; however, these have not yet resulted in demand response projects. How to model demand response and how to measure demand response so it can be better included in electric regional planning is a challenge. In one sense, demand response is like insurance. Modeling its value correctly involves forecasting and uncertainty. A review of recent research suggests that demand response has a key role to play in regional planning. For demand response resources to be valued correctly in regional resource planning, resource plans must be made for a sufficiently long planning period. Demand response can meet peak resource needs and reduce the likelihood of low-probability, high-consequence and potentially costly events. Adding demand response resources to regional plans requires modeling that address uncertainties such as fuel prices, weather, and system factors. Modeled properly, demand response can be an important tool for risk management. Demand response can also serve as operating reserves. Several demand response programs such as direct load control can provide the timely response necessary to provide these reserves. Load participating in these programs is continuously poised to respond but only has to reduce consumption when a reliability event occurs. Moreover, while customers providing such operating reserves do not normally reduce transmission loading, they can reduce the amount of transmission capacity that must be held in reserve to respond to contingencies. This reserve capability of demand response both reduces the need for new transmission and increases the utilization of existing transmission to provide energy from low cost generation.
7 For example, ISO-New England obtained demand response in 2004 through the “Gap RFP” to address local
reserve concerns within Southwest Connecticut.
ES – Executive Summary
Assessment of Demand Response and Advanced Metering Federal Energy Regulatory Commission
xi
The eligibility of demand response resources to provide operating reserves has been limited in most regions and is typically limited to providing supplemental (non-spinning) and slower reserves. Restrictions on demand response providing spinning reserve have eased recently in some areas. For example, ERCOT allows demand response as a supplier of spinning reserve. PJM allows demand response to supply synchronized reserves and regulation. Based on comments received and Commission staff review of regional transmission planning and operations procedures, Commission staff has identified several actions and steps that could be taken to enable greater use of demand resources. The merits of taking the following steps should be considered by appropriate transmission planners and state and federal regulators:
• Assure that regions that schedule resources to meet either energy or reserve needs properly recognize the capabilities and characteristics of demand resources.
• Assure that requirements are specified in terms of functional needs rather than in terms of the technology that is expected to fill the need. This applies to ancillary services as well as to transmission enhancement.
• Accommodate the inherent characteristics of demand response resources (just as generation resource characteristics are accommodated).
• Allow appropriately designed demand response resources to provide all ancillary services including spinning reserve, regulation, and frequency response reserves.
• Allow for the consideration of demand response alternatives for all transmission enhancement proposals at both the state and ISO/RTO level. At the minimum, transmission expansion planning procedures would allow demand response resources to be proposed and considered as solutions at congested interfaces or in load pockets, along with local generation or transmission enhancements. This consideration would be done early in the process, and include a reporting and assessment of alternatives considered.
• When appropriate, treat demand response as a permanent solution, similar to transmission enhancements.
• Develop better demand response forecasting tools for system operators, to increase the usefulness and acceptability of demand response.
Regulatory Barriers Commission staff identified several regulatory barriers to improved customer participation in demand response, peak reduction and critical peak pricing programs. These barriers are based on input received from parties in written comments, comments filed and discussion heard at the FERC Demand Response Technical Conference, a review of demand-response program experience, and through a comprehensive literature review. Key regulatory barriers include:
• Disconnect between retail pricing and wholesale markets. Retail rates for most customers are fixed, while wholesale prices fluctuate. Placing even a small percentage of customers on tariffs based on marginal production costs, can allocate resources more efficiently.
• Utility disincentives associated with offering demand response. Reductions in customer demand reduce utility revenue. Without regulatory incentives such as rate decoupling or similar incentives, electric utilities lack an incentive to use or support demand response.
• Cost recovery and incentives for enabling technologies. Utilities are reluctant to undertake investments in enabling technologies such as advanced metering unless the business case and regulatory support for deployment is sufficiently positive to justify the outlay. These
ES – Executive Summary
Assessment of Demand Response and Advanced Metering Federal Energy Regulatory Commission
xii
investments may require an increase in rates. It is uncertain whether and how would regulators allow these costs to be recovered.
• The need for additional research on cost-effectiveness and measurement of reductions. There are deficiencies in the measurement of demand response and assessment of its cost-effectiveness. Cost-effectiveness tests that have been used by regulators must be improved to reflect changes in the industry, especially in organized markets.
• The existence of specific state-level barriers to greater demand response. Policies of retail rate regulators and state statutes in several states have created barriers to implementing greater levels of demand response, especially by exposing customers to time-based rates. Several states have laws that restrict the ability of regulators to implement critical peak pricing and other forms of time-based rates.
• Specific retail and wholesale rules that limit demand response. Certain wholesale and retail market designs have rules and procedures that are not conducive to demand participation. For example, the standard lengthy wholesale settlement periods utilized in ISO/RTO markets delays payment to participating retail customers.
• Barriers to providing demand response services by third parties. Shifting regulatory rules that allow third parties to provide demand response and potential sunset of various demand response programs are a disincentive to demand response providers. Because third parties often bear the risks of programs dependent on enabling technologies, they need long-term regulatory assurance or long-term contracts to raise the capital needed to invest in enabling technologies.
• Insufficient market transparency and access to data. Lack of third-party access to data has been identified as a barrier to demand response. Greater transparency of unregulated retailer price offers and information on the amount of load under time-based rates or pricing would assist grid operation and planning. A related but more fundamental barrier related to data is timely access to meter data.
• Better coordination of federal-state jurisdiction affecting demand response. While states have primary jurisdiction over retail demand response, demand response plays a role in wholesale markets under Commission jurisdiction. Greater clarity and coordination between wholesale and state programs is needed.
Conclusions Based on the results of the FERC Survey, input from interested persons, and an extensive examination of regional and national trends in electric demand response programs policy, Commission staff concludes that demand response has an important role to play in both wholesale and retail markets. The potential immediate reduction in peak electric demand that could be achieved from existing demand response resources is between three and seven percent of peak electric demand in most regions. However, the technologies needed to support significant deployment of electric demand response resources, such as advanced metering, have little market penetration. Demand response deserves serious attention. Staff recommends that the Commission: (1) explore how to better accommodate demand response in wholesale markets; (2) explore how to coordinate with utilities, state commissions and other interested parties on demand response in wholesale and retail markets; and (3) consider specific proposals for compatible regulatory approaches, including how to eliminate regulatory barriers to improved participation in demand response, peak reduction and critical peak pricing programs. Staff also encourages states to continue to consider ways to actively encourage demand response at the retail level. In particular, staff recommends that the Commission and states work cooperatively in finding demand response solutions.

Chapter I – Introduction
Assessment of Demand Response and Advanced Metering Federal Energy Regulatory Commission
1
Chapter I. Introduction
Energy Policy Act of 2005 The Energy Policy Act of 2005 (EPAct 2005) section 1252(e)(3)8 requires the Federal Energy Regulatory Commission (Commission) to prepare a report, by appropriate region, that assesses electric demand response resources, including those available from all consumer classes. Specifically, EPAct 2005 directs the Commission to identify and review:
(A) saturation and penetration rates of advanced meters and communications technologies, devices and systems; (B) existing demand response programs and time-based rate programs; (C) the annual resource contribution of demand resources; (D) the potential for demand response as a quantifiable, reliable resource for regional planning purposes; (E) steps taken to ensure that, in regional transmission planning and operations, demand resources are provided equitable treatment as a quantifiable, reliable resource relative to the resource obligations of any load-serving entity, transmission provider, or transmitting party; and (F) regulatory barriers to improved customer participation in demand response, peak reduction and critical period pricing programs.
Commission Staff Activities In preparing this report, Commission staff undertook several activities. First, Commission staff developed and implemented a national survey of demand response and advanced metering in the electric sector. Commission staff released a draft version of the survey for public comment, and over 25 parties provided comments. Second, comments were solicited from interested parties on the key demand response and advanced metering issues and challenges that Commission staff should examine. Over 30 parties provided written comments. Commission staff held a technical conference on demand response and advanced metering (FERC Technical Conference) on January 25, 2006 at Commission headquarters in Washington, DC. The FERC Technical Conference allowed the Commission and staff to gain valuable information regarding the key issues and challenges concerning the development of demand response resources in wholesale and retail markets, what experiences has industry had with implementing demand response and time-based rate programs, how to define advanced metering, and
8 Energy Policy Act of 2005, Pub. L. No. 109-58, § 1252(e)(3), 119 Stat. 594 (2005) (EPAct 2005 section 1252(e)(3)). The full text of section 1252 is attached as Appendix A.
Chapter I – Introduction
Assessment of Demand Response and Advanced Metering Federal Energy Regulatory Commission
2
what challenges and barriers exist to greater saturation of advanced metering. The conference also provided a regional perspective on demand response and advanced metering issues as a result of participation by representatives from around the country. Thirty-one panelists participated in the technical conference. Third, commission staff reviewed the literature and experience on advanced metering, demand response programs, and time-based rates. As part of this review, information on the role of demand resources in regional transmission planning and operations were collected through review of regional transmission documents, and through interviews with regional representatives.
Demand Response and Advanced Metering Survey Due to the lack of detailed data and information on the deployment of advanced metering, and the lack of data of sufficient detail on existing electric demand response and time-based rate programs, Commission staff developed and implemented a first-of-its-kind nation-wide survey to fill this information gap. The FERC Demand Response and Advanced Metering Survey (FERC Survey) requested information on (a) the number of advanced meters and their use, and (b) existing demand response and time-based rate programs, including their current level of resource contribution. In March 2006, the Commission received final Office of Management and Budget (OMB) approval of the FERC Survey. The FERC Survey was implemented as a web-based survey to expedite data retrieval and ensure consistency. Responses to the survey were requested from 3,365 organizations from all 50 states representing all aspects of the electric delivery industry: investor-owned utilities, municipal utilities, rural electric cooperatives, power marketers, state and federal agencies, and unregulated demand response providers.9 More than 1,850 entities responded to survey (a response rate of over 55 percent). Information gathered through the survey serves as the basis for the estimates of saturation of advanced metering, the information on existing demand response and time-based rate programs, and estimates of resource contribution included in this report. The results of this survey should prove useful for future policy discussions, particularly state-level examinations of smart metering directed by EPAct 2005.10
Report Organization The report begins with an executive summary and introduction which describes the report structure. It then delves deeper into the issues of demand response and advanced metering, detailing the information that Commission staff learned regarding the six issue areas required by EPAct 2005 section 1252(e)(3). Chapter 2 includes a background on demand response. This chapter includes a definition of demand response, a discussion of the various types of demand response programs, and examination of the benefits associated with demand response.
9 Appendix F includes detailed information on the survey and sample design, and the OMB approval process.
Appendix G lists the respondents to the survey. 10 EPAct 2005 section 1252(b).

Chapter I – Introduction
Assessment of Demand Response and Advanced Metering Federal Energy Regulatory Commission
3
Chapter 3 reviews advanced metering, and estimates the saturation of advanced metering nationally, regionally, by type of utility, customer class, and by state based on the results of the FERC Survey. This chapter also summarizes the key components of advanced metering, benefits and costs of advanced metering, and issues associated with the deployment of advanced metering. Chapter 4 examines time-based rates and demand response programs. Each of the various time-based rates and demand response programs are discussed in detail. The number of entities offering time-based rates and demand response programs are presented by type of entity and program type. This chapter also reviews the motivation behind increased interest in these programs, and explores the issues and challenges associated with the programs. The chapter concludes with a review of recent developments. Chapter 5 considers the size of demand response as a resource. It explores the size of the existing demand response resource in MWs, considering results from the FERC Survey. The FERC Survey yielded information on the potential resource contribution as well as the actual use of resources in 2005. Chapter 6 considers the potential and role of demand response in regional planning, with a focus on regional transmission planning and operations. This consideration includes a review of its current role along with a process for incorporating demand resources in resource plans. This chapter examines how demand response is utilized regionally, and provides steps that could be taken to ensure that, in regional transmission planning and operations, demand resources are provided equitable treatment as a quantifiable, reliable resource. Chapter 7 summarizes and analyzes the barriers identified in comments and in key reports and filings, and provides recommendations for future Commission deliberation.
Regional Definitions For the purposes of reporting the results of the assessment of demand response and advanced metering by region, as requested by Congress, this report will follow the regional definitions provided by the North American Electric Reliability Council (NERC). Eight regional reliability councils comprise the NERC in the lower 48 states. These regional reliability councils include:
• Electric Reliability Council of Texas, Inc. (ERCOT) • Florida Reliability Coordinating Council (FRCC) • Midwest Reliability Organization (MRO) • Northeast Power Coordinating Council (NPCC) • ReliabilityFirst Corporation (RFC) • SERC Reliability Corporation (SERC) • Southwest Power Pool, Inc. (SPP) • Western Electricity Coordinating Council (WECC)
Figure I-1 displays the configuration of these regions as of July 2006. Alaska and Hawaii are categorized as Other. Commission staff chose to use the NERC regions because they reflect the topology of the electric power sector, and the fact that many electric utilities cross state boundaries. Furthermore, wholesale market designs, resource requirements, and customer characteristics tend to vary by NERC regions.

Chapter I – Introduction
Assessment of Demand Response and Advanced Metering Federal Energy Regulatory Commission
4
Figure I-1. NERC Region Map

Chapter II – Background on Demand Response
Assessment of Demand Response and Advanced Metering Federal Energy Regulatory Commission
5
Chapter II. Background on Demand Response The purpose of this chapter is to provide background and context for the discussions of electric demand response and advanced metering that are contained in later chapters. This overview of demand response and advanced metering includes definitions and history of the use of these programs Topics discussed in this chapter include:
• Definition of demand response • Types of demand response • Role of demand response in retail and wholesale markets • Benefits of demand response • Use of demand response in the United States • Customer price-responsiveness • Role of enabling technologies
Definition of Demand Response Demand response refers to actions by customers that change their consumption (demand) of electric power in response to price signals, incentives, or directions from grid operators. In this report, Commission staff adopted the definition of “demand response” that was used by the U.S. Department of Energy (DOE) in its February 2006 report to Congress:
Changes in electric usage by end-use customers from their normal consumption patterns in response to changes in the price of electricity over time, or to incentive payments designed to induce lower electricity use at times of high wholesale market prices or when system reliability is jeopardized.11
The crux of demand response that this definition addresses is that it is an active response to prices or incentive payments. The changes in electricity use are designed to be short-term in nature, centered on critical hours during a day or year when demand is high or when reserve margins are low. Customer responses to high market prices can reduce consumption; this can shave wholesale market prices on a regular basis and thereby dampen the severity of price spikes in wholesale markets on extreme days. Customer response to incentives is an important tool available to operators of the electric grid to address reserve shortages, or for load-serving entities (LSEs) to incorporate in their portfolios to match customer demand with available supply, and where available to individual customers to better manage their costs of doing business.
If changes in electricity prices last for a long time or are expected to do so, a longer-term price-based reduction in consumption through investment in energy efficiency or change in customer behavior may occur. Energy efficiency and conservation are often achieved while consumers are involved in demand response programs through (a) actions taken by consumers to conserve their consumption of electricity during high price periods as they become more aware of their energy-usage patterns, or (b)
11 U.S. Department of Energy, Benefits of Demand Response in Electricity Markets and Recommendations for
Achieving Them: A Report to the United States Congress Pursuant to Section 1252 of the Energy Policy Act of 2005, February 2006 (February 2006 DOE EPAct Report), 6.

Chapter II – Background on Demand Response
Assessment of Demand Response and Advanced Metering Federal Energy Regulatory Commission
6
consumer investments in more energy-efficient lighting and appliances to lower their demand in all hours. Demand response programs coupled with direct feedback and specific education or advice have helped customers in some demand response programs reduce their consumption of electricity by up to 10 percent.12 Energy efficiency and conservation are not directly included in the definition of demand response programs for purposes of our review and report.13
Demand response plays a key role in linking the retail and wholesale sectors of electric markets. End-use customer response to prices or incentives primarily involves retail activities, and oversight of these activities generally is subject to retail regulation at the state or local level. Nevertheless, federal regulatory interests are implicated because of the importance of demand response in wholesale markets and its effect on wholesale market prices, the need for demand response as an emergency resource for grid operators. Consequently, it is important to improve coordination of state and federal electric policies that affect demand response, to achieve more effective regulation of electric markets.
Types of Demand Response This report reviews two primary categories of demand response: incentive-based demand response and time-based rates. Each category includes several major options:
• Incentive-based demand response o Direct load control o Interruptible/curtailable rates o Demand bidding/buyback programs o Emergency demand response programs o Capacity market programs o Ancillary-services market programs
• Time-based rates
o Time-of-use o Critical-peak pricing o Real-time pricing
Incentive-based demand response programs offer payments for customers to reduce their electricity usage during periods of system need or stress. By adjusting or curtailing a production process, shifting load to off-peak periods, or running on-site distributed generation, customers can reduce the level of demand that they place on distribution networks and the electric grid. Customers who participate in incentive-based demand response programs either receive discounted retail rates or separate incentive payments. Vertically integrated electric utilities and other LSEs such as cooperatives, municipal utilities, or unregulated retailers offer these programs on a retail basis directly to customers. At a wholesale level, the impetus comes from independent system operators (ISOs) or regional transmission organizations (RTOs) and power marketers. These programs can be triggered either for reliability or economic reasons. In the wholesale demand response programs, customer load
12 Chris King and Dan Delurey, “Efficiency and Demand Response: Twins, Siblings, or Cousins?,” Public Utilities
Fortnightly, 143 # 3, March 2005. 13 The U.S. DOE, the National Association of Regulatory Utility Commissioners (NARUC), and the National
Association of State Energy Officials are preparing an assessment of energy efficiency in response to EPAct 2005 section 139.
Chapter II – Background on Demand Response
Assessment of Demand Response and Advanced Metering Federal Energy Regulatory Commission
7
reductions are aggregated by retail customers, and then provided to the wholesale provider, such as an ISO, in exchange for an incentive. The second type of demand response is comprised of time-based rates. A range of time-based rates are currently offered directly to retail customers; not all are time-varying, but they may promote customer demand response based on price signals. These are different from flat rates, which are unvarying and offer no price signals. Flat rates are often assigned to residential customers, and are the only option in the absence of meters that can record time-differentiated usage (except block rates). Customer demand response, incentivized by time-varying price signals, is one way for electricity customers to move away from flat or averaged pricing and to promote more efficient markets. The two categories of demand response are highly interconnected and the various programs under each category can be designed to achieve complementary goals. For example, by adjusting customer load patterns or increasing price responsiveness, large-scale implementation of time-based rates can reduce the severity or frequency of price spikes and reserve shortages, thereby reducing the potential need for incentive-based programs. Care needs to be taken in their implementation to ensure that these programs do not work at cross-purposes. Chapter IV continues the examination of these demand response types and their current use in the United States.
Role of Demand Response in Retail and Wholesale Markets A truly functioning electricity market incorporates dynamic supply and demand forces. A frequent criticism of current wholesale market designs is that the demand-side of the market is not active; thereby creating the potential for supplier market power. Enabling demand-side responses as well as supply-side responses increases economic efficiency in electricity markets and improves system reliability.14 Not all consumers need to respond simultaneously for markets to benefit by lowered overall prices. One study suggested that shifting five to eight percent of consumption to off-peak hours and cutting another four to seven percent of peak demand could save utilities, businesses, and customers as much as $15 billion a year.15 Another posited, “20 percent of customers account for 80 percent of price response.”16 Others find that “only a fraction of all customers, perhaps as few as five percent, are needed to discipline electricity market prices.”17 In its comments to the Commission, the Demand Response and Advanced Metering Coalition (DRAM) said it “believes that demand response typically is capable of providing demand reductions of 3-5 percent of annual peak load for periods up to 100 hours or so per year.”18 In California’s statewide pricing pilot, 80 percent of load reduction came from 30 percent of customers.19
14 See especially Chapter 4 of Sally Hunt, Making Competition Work (New York: John Wiley & Sons, 2002). 15 Justin A. Colledge, et al., “Power by the Minute,” McKinsey Quarterly 2002 #1, 74-75. 16 Goldman, Charles and Roger Levy, Demand Response in the U.S.: Opportunities, Issues, and Challenges.
Presentation at the National Town Hall Meeting on Demand Response, Washington, DC, June 21, 2005, 20. 17 Bernie Neenan, Richard N. Boisvert, and Peter A. Cappers, “What Makes a Customer Price-Responsive?” The
Electricity Journal, 15 #3 (April 2002), 52. 18 Demand Response and Advanced Metering Coalition (DRAM), comments filed in Docket AD06-2, December
19, 2005, 5. 19 Susie Sides (San Diego Gas & Electric), FERC Technical Conference on Demand Response and Advanced
Metering, January 25, 2006 (hereinafter, “FERC Technical Conference”), transcript, 205.

Chapter II – Background on Demand Response
Assessment of Demand Response and Advanced Metering Federal Energy Regulatory Commission
8
Midwest ISO (MISO) Vice President Ron McNamara’s comments at the January 25, 2006 FERC Demand Response and Advanced Metering Technical Conference (FERC Technical Conference) and at DRAM’s January 2006 National Town Meeting on Demand Response support the need for demand response. He stated that industry tends to take load as a given, regardless of price, but that markets work best when prices are constrained by supply and demand. He added that scarcity pricing needs to come through as a real price signal, even while long-term bilateral contracts are the foundation of a market.20 Demand response programs provide markets with a second set of tools to respond to high prices or capacity shortages. DRAM suggests that markets without demand response tools use more power than they need to: demand response can mitigate market power and be a least-cost, faster-track solution to relieving areas of constrained supply (congestion pockets).21 ISO-New England’s president and CEO, Gordon van Welie, echoed that belief at an April 2006 demand response summit. He said there are two ways to meet the growing demand for electricity at a time of high natural gas prices: reduce demand or increase supply. His staff’s analysis found that two demand-side actions could save New England customers. Reducing electricity use by five percent during peak hours (through conservation and energy efficiency) would save consumers $580 million annually. A 500-MW increase in demand response participation which would cut wholesale costs by $32 million – a total of $612 million annually. Alternatively, the supply-side solution would add 1,000 MW of low-cost plants, saving consumers $600 million. The business-as-usual scenario, based on a five percent annual increase in demand, would keep electricity costs high and increase total costs by $700 million each year.22 Similar arguments were offered by the New York Public Service Commission in a recent order. The New York commission found that planners who rely solely on the supply-side will over-build the system for the few hours of annual system peak, rather than leveling that peak through conservation and demand response.23 The role that each form of time-based rates or incentive-based demand response plays in electric system planning and operations depends on the timeframe of the response. For example, real-time pricing or critical-peak pricing, which directly reflect wholesale prices, affect supply scheduling in day-ahead markets and during real-time dispatch. Time-of-use rates does not induce as rapid or large responses. Incentive-based demand resources such as direct load control, capacity, and ancillary services programs can be used as reserves during real-time, as reserves in day-ahead scheduling and dispatch, or as capacity resources in system planning. By contrast, energy efficiency can be viewed as a resource during system planning because of its long-term effects.
Use of Demand Response in the United States Time-based rates and other forms of demand response have been used within the electric power industry for decades. For many utilities, demand response was a part of their portfolio of resources and was activated during reserve shortages or periods of high prices. Two of the oldest forms of demand response have been interruptible/curtailable tariffs and time-of-use (TOU) rates. Many utilities place large industrial consumers that have interval meters on mandatory TOU rates. In the
20 Ron McNamara (MISO), FERC Technical Conference, transcript, 177-180. 21 DRAM, comments filed in Docket AD06-2, December 19, 2005, 2. 22 Gordon van Welie, speech to 2006 “ISO-NE Demand Response Summit,” April 27, 2006; and ISO-New
England, Staff White Paper, Controlling Electricity Costs, June 1, 2006 (the latter revised the figures slightly from the speech).
23 New York State Public Service Commission, Order Denying Petitions for Rehearing and Clarification in Part and Adopting Mandatory Hourly Pricing Requirements, issued and effective April 24, 2006, 2. [hereinafter NYPSC Order, April 24, 2006] See Chapter VI for a further discussion of the incorporation of demand resources into planning.
Chapter II – Background on Demand Response
Assessment of Demand Response and Advanced Metering Federal Energy Regulatory Commission
9
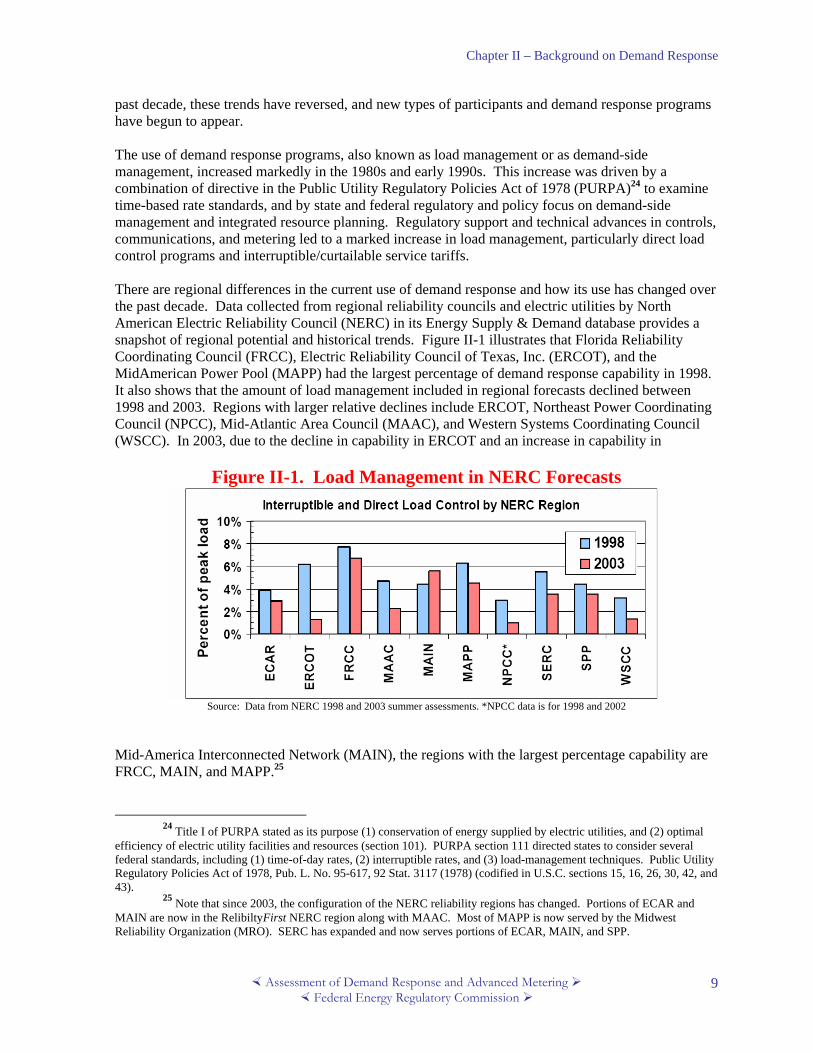
past decade, these trends have reversed, and new types of participants and demand response programs have begun to appear. The use of demand response programs, also known as load management or as demand-side management, increased markedly in the 1980s and early 1990s. This increase was driven by a combination of directive in the Public Utility Regulatory Policies Act of 1978 (PURPA)24 to examine time-based rate standards, and by state and federal regulatory and policy focus on demand-side management and integrated resource planning. Regulatory support and technical advances in controls, communications, and metering led to a marked increase in load management, particularly direct load control programs and interruptible/curtailable service tariffs. There are regional differences in the current use of demand response and how its use has changed over the past decade. Data collected from regional reliability councils and electric utilities by North American Electric Reliability Council (NERC) in its Energy Supply & Demand database provides a snapshot of regional potential and historical trends. Figure II-1 illustrates that Florida Reliability Coordinating Council (FRCC), Electric Reliability Council of Texas, Inc. (ERCOT), and the MidAmerican Power Pool (MAPP) had the largest percentage of demand response capability in 1998. It also shows that the amount of load management included in regional forecasts declined between 1998 and 2003. Regions with larger relative declines include ERCOT, Northeast Power Coordinating Council (NPCC), Mid-Atlantic Area Council (MAAC), and Western Systems Coordinating Council (WSCC). In 2003, due to the decline in capability in ERCOT and an increase in capability in
Figure II-1. Load Management in NERC Forecasts
Source: Data from NERC 1998 and 2003 summer assessments. *NPCC data is for 1998 and 2002
Mid-America Interconnected Network (MAIN), the regions with the largest percentage capability are FRCC, MAIN, and MAPP.25
24 Title I of PURPA stated as its purpose (1) conservation of energy supplied by electric utilities, and (2) optimal
efficiency of electric utility facilities and resources (section 101). PURPA section 111 directed states to consider several federal standards, including (1) time-of-day rates, (2) interruptible rates, and (3) load-management techniques. Public Utility Regulatory Policies Act of 1978, Pub. L. No. 95-617, 92 Stat. 3117 (1978) (codified in U.S.C. sections 15, 16, 26, 30, 42, and 43).
25 Note that since 2003, the configuration of the NERC reliability regions has changed. Portions of ECAR and MAIN are now in the RelibiltyFirst NERC region along with MAAC. Most of MAPP is now served by the Midwest Reliability Organization (MRO). SERC has expanded and now serves portions of ECAR, MAIN, and SPP.

Chapter II – Background on Demand Response
Assessment of Demand Response and Advanced Metering Federal Energy Regulatory Commission
10
According to the literature on this issue, a contributing factor behind the decline shown in Figure II-1 has been the waning of electric utility interest and investment in demand response over the past decade, due to changes in industry structure and the result of state electric restructuring plans.26 State and utility programs were dismantled in many restructured states that had previously supported extensive programs. In several states, such as Texas, load management was deemed a competitive service and regulated distribution companies were directed to divest their holdings.27 In other states, utility divestiture of generation or transfer of the provider-of-last-resort (POLR) obligation removed a significant driver for utility investment by splitting up the benefits of demand response across multiple parties. Ample capacity reserves in many parts of the United States also contributed to declining utility interest and investment. Many states, such as Nevada, still support demand response and load management and operate integrated resource-planning programs that frequently include demand response and energy efficiency.
Benefits of Demand Response Beyond the broad improvements in market efficiency and market linkages discussed above, demand response creates multiple, specific benefits for market participants and for the general efficiency and operation of electric markets. The following list of benefits encompasses many of the benefits referenced in the DOE report.28
Participant Benefits Customer adoption of demand response is based on the expectation of financial or operational benefits:29
• Financial benefits include cost savings on customers’ electric bills from using less energy when prices are high, or from shifting usage to lower-priced hours, as well as any explicit financial payments the customer receives for agreeing to or actually curtailing usage in a demand response program. The significant increases in fuel and electricity costs that have occurred over the last several years provide additional motivation for customers to control and reduce their energy consumption.
• Reliability benefits refer to customer perceived benefits from the reduced likelihood of being involuntarily curtailed and incurring even higher costs, or societal, in which the customer derives satisfaction from helping to avoid widespread shortages.
Market and System Benefits A key policy goal in implementing demand response is to create market, reliability, and social welfare benefits, including:30
26 Raynolds and Cowart document this decline in Electricity Reliability White Paper: Distributed Resources and Electric System Reliability, 2000.
27 More than 3,500 MW of capability from interruptible contracts no longer exist in Texas. Steven Braithwait, B. Kelly Eakin, Laurence D. Kirsch, “Encouraging Demand Participation In Texas’ Power Markets,” Laurits R. Christensen Associates Inc., prepared for the Market Oversight Division of the Public Utility Commission of Texas, August 2002.
28 February 2006 DOE EPAct Report, 26-29. 29 February 2006 DOE EPAct Report, 26. 30 The short-term and long-term market benefits, along with the reliability benefits description are drawn from the
list of “Collateral Benefits” included in February 2006 DOE EPAct Report, 27-28.
Chapter II – Background on Demand Response
Assessment of Demand Response and Advanced Metering Federal Energy Regulatory Commission
11
• Short-term market impacts are savings in variable supply costs brought about by more
efficient use of the electricity system, given available infrastructure. In particular, price responsiveness during periods of scarcity and high wholesale prices can temper high wholesale prices and price volatility. Decreases in price spikes and volatility should translate into lower wholesale and retail prices. Where customers are served by vertically integrated utilities, short-term benefits are limited to avoided variable supply costs. In areas with organized spot markets, demand response also reduces wholesale market prices for all energy traded in the applicable market. The amount of savings from lowered wholesale market prices depends on the amount of energy traded in spot markets. The New York Public Service Commission suggests that demand response can also reduce a state’s dependence on natural gas-fueled generation.31
• Long-term market impacts are associated with the ability of demand response to (a) reduce system or local peak demand, thereby displacing the need to build additional generation, transmission, or distribution capacity infrastructure, and (b) adjust the pattern of customer loads, which may result in a shift in the mix of peak versus baseload capacity.
• Operational and capital cost savings occur as system operators, LSEs, and distribution utilities benefit from avoided generation costs as well as avoided or deferred transmission and distribution costs. Since demand response can begin to be deployed in a relatively rapid fashion, demand response can contribute to the resolution of problems in load pockets on a shorter time frame than building new generation, transmission, or distribution, which can take years to complete.
• System reliability benefits. By reducing electricity demand at critical times (e.g., when a generator or a transmission line unexpectedly fails), demand response that is dispatched by the system operator on short notice can help return electric system (or localized) reserves to pre-contingency levels.
Additional Benefits Created by Demand Response Other demand response benefits noted in studies are more difficult to quantify; their magnitude will likely vary by region. The importance and perceived value of each of these benefits is subject to debate. Additional benefits may include:32
• More robust retail markets. Demand response promotes and creates additional options in
retail markets. For example, default-service real-time pricing can stimulate innovation (e.g., alternative index-based products or curtailment products) by retail suppliers.33 The availability of ISO/RTO-administered demand response programs can provide value-added opportunities for marketers and the ability of customers to monetize their demand reductions.
• Additional tools to manage customer load. Demand response provides expanded choices and tools for customers in states with and without retail competition to manage their electricity costs.
• Risk Management. Demand response allows customers, retailers, and utilities to hedge their risk exposure to system emergencies and price volatility. Retailers can hedge price risks by
31 NYPSC Order, April 24, 2006, 1-2. 32 The more robust retail markets, market performance benefits, and possible environmental benefits, are drawn
from the list of “Other Benefits” included in the February 2006 DOE EPAct Report, 29. 33 Galen Barbose, et al., Real Time Pricing as Default or Optional Service for C&I Customers: A Comparative
Analysis of Eight Case Studies, Lawrence Berkeley National Laboratory: LBNL-57661, August 2005.

Chapter II – Background on Demand Response
Assessment of Demand Response and Advanced Metering Federal Energy Regulatory Commission
12
creating callable quantity options (contracts for demand response) and by creating price offers for customers who are willing to face varying prices. Customers can explicitly incorporate demand response into their operations and electricity purchases on an individual facility or enterprise basis. Utilities can use demand response programs to hedge their portfolio. This form of hedging is particularly important when utilities have default service obligations under rate freezes or caps.34
• Market performance benefits. Demand response can also play an important role in mitigating the potential for generators to exert market power in wholesale electricity markets. In organized markets, during periods of high demand and inadequate supply, market-clearing prices can escalate to high levels as more expensive-to-operate generation is dispatched. Without price-response mechanisms to lower demand as market-clearing prices increase, the potential for supplier market power abuse (such as capacity withholding) is heightened. Price-responsive demand mitigates market power potential because these reductions increase suppliers’ risk of being priced out of the market. Customers who lower their consumption increase the number of suppliers in the market, reducing concentration and making collusion more difficult just when competitive concerns are the most severe. Sufficient amounts of price-responsive demand may reduce the need to use price caps and other market mechanisms such as installed capacity markets.
• Linking wholesale and retail markets. Demand response can help link retail and wholesale markets through greater customer price-responsiveness to wholesale price changes and by increased hedging opportunities.
• Possible environmental benefits. Demand response may provide conservation effects, both directly from load reductions (that are not made up at another time) and indirectly from increased customer awareness of their energy usage and costs.35 Demand response may provide environmental benefits by reducing generation plants’ emissions during peak periods. Reductions during peak periods should be balanced against possible emissions increases during off-peak hours, as well as from increased use of on-site generation. If the implementation of demand response contributes to reduced generation facility construction, there may be additional environmental and aesthetic benefits. These conservation and environmental impacts can be either positive or negative, and will likely vary by region.36
Multiple studies have attempted to quantify these benefits. The Electric Power Research Institute concluded that “… a 2.5% reduction in electricity demand statewide could reduce wholesale spot prices in California by as much as 24%; a 10% reduction in demand might slash wholesale price spikes by half.”37 McKinsey estimated national benefits of time-sensitive pricing to be $15 billion.38 An ICF Consulting study for the Commission estimated a $4 billion savings in annual system operating costs if customers were exposed to peak-period price signals.39 These benefits also flow to society as a whole, not just to participants.40
34 David Kathan, Policy and Technical Issues Associated with ISO Demand Response Programs, prepared for
NARUC, July 2002. 35 King and Delurey, 2005. 36 Stephen P. Holland and Erin T. Mansur, “The Distributional and Environmental Effects of Time-Varying Prices
in Competitive Electricity Markets,” CSEM Working Paper (WP-143), May 2005. 37 Taylor Moore, “Energizing Customer Demand Response in California,” EPRI Journal, Summer 2001, 8. 38 Colledge, 2,7. 39 ICF Consulting, Economic Assessment of RTO Policy, prepared for FERC, February 2002. 40 Colledge, 2.

Chapter II – Background on Demand Response
Assessment of Demand Response and Advanced Metering Federal Energy Regulatory Commission
13
The Commission has recognized the benefits of demand response in multiple orders over the last six years. For example, in a 2001 order addressing the California crisis, the Commission stated:
Without a demand response mechanism, the [independent system operator] is forced to work under the assumption that all customers have an inelastic demand for energy and will pay any price for power. There is ample evidence that this is not true. Many customers, given the right tools, can and will manage their demand. . . . A working demand response program puts downward pressure on price, because suppliers have additional incentives to keep bids close to their marginal production costs and high supply bids are more likely to reduce the bidder's energy sales. Appropriate price signals to customers thus help to mitigate market power as high supply bids are more likely to reduce the bidders' energy sales. Suppliers thus have additional incentive to keep bids close to their marginal production costs. Demand-side price-responsive bids will also help to allocate scarce supplies efficiently.41
The Commission also noted the value of incentive-based demand response in maintaining grid reliability in a 2002 PJM order:
PJM is responsible for ensuring the short-term reliability of the interstate transmission system. When system reliability events require PJM to implement measures to protect the transmission system (i.e., PJM declares a Maximum Generation Emergency), encouraging load reductions and the use of on-site generation is an important tool in maintaining transmission reliability.42
Evidence of Customer Price-Responsiveness Offered time-based rates, customers choose whether to adjust their consumption or not. Their decision to adjust consumption is driven by the costs and benefits of taking one of the following actions: (a) adjusting routine business activity specifically to avoid paying higher than average prices; (b) forgoing discretionary usage; and (c) deploying distributed or on-site generation. The ability of customers to respond to prices requires the following conditions: that time-based rates are communicated to them; that they have load control systems that allow them to respond to price signals (e.g., by shedding load, automatically turning appliances down or off, or turning on an on-site generator); and that customers have meters that can measure consumption by at least the time of day so the utility can determine how much power was used at what time and bill accordingly.
Experiences in New York, Georgia, California, and other states and pricing experiments have demonstrated that customers do take actions to adjust their consumption, and are responsive to price (i.e., they have a nonzero price elasticity of demand). Georgia Power Company’s successful real-time pricing tariff option has demonstrated that industrial customers who receive real-time prices based on an hour-ahead market are relatively price-responsive (price elasticities ranging from approximately –0.2 at moderate price levels, to –0.28 at prices of $1/kWh or more) given the short-time period in which to act. Among day-ahead real-time pricing customers, price elasticities range from approximately –0.04 when prices are at moderate levels to –0.13 when customers are exposed to higher prices.43 A critical peak-pricing experiment in California in 2004 determined that small residential and commercial customers are price responsive and will produce significant reductions.
41 San Diego Gas and Electric Co., 95 FERC ¶61,148, at 62,555 (2001). 42 PJM Interconnection, L.L.C., 99 FERC ¶ 61,139 at n. 18 (2002). 43 Industrial Consumers, comments filed in Docket No. AD05-17-000, November 18, 2005, 39.
Chapter II – Background on Demand Response
Assessment of Demand Response and Advanced Metering Federal Energy Regulatory Commission
14
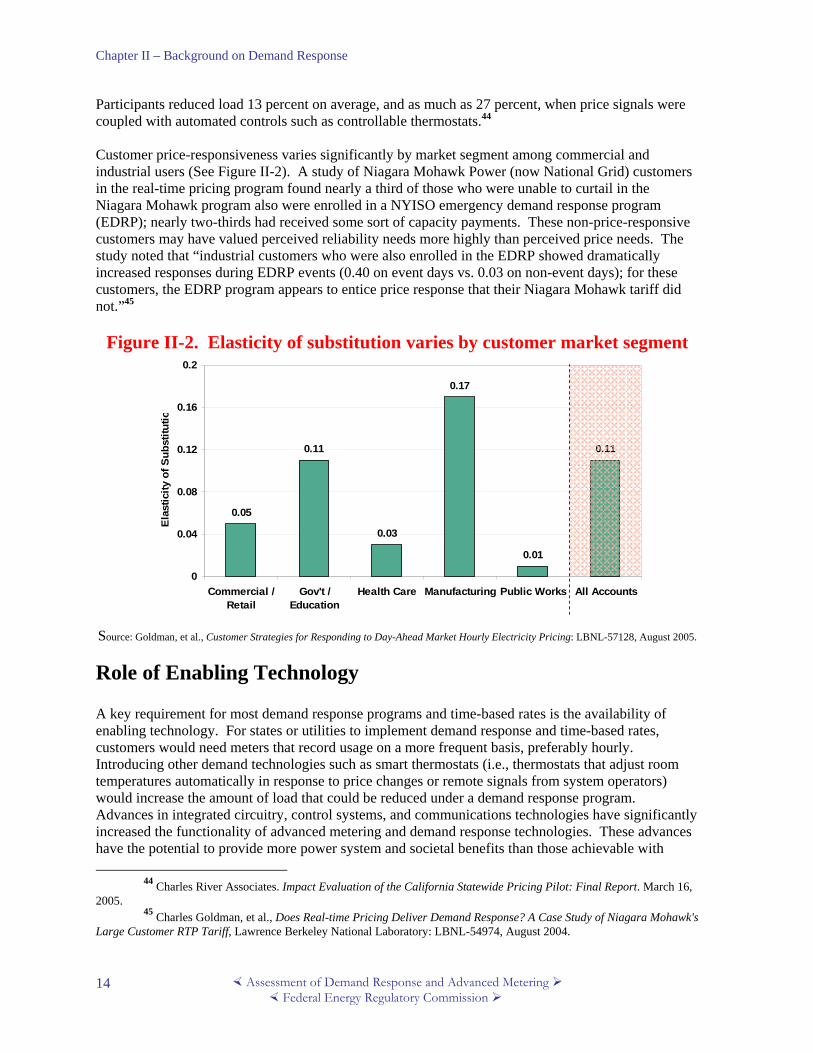
Participants reduced load 13 percent on average, and as much as 27 percent, when price signals were coupled with automated controls such as controllable thermostats.44 Customer price-responsiveness varies significantly by market segment among commercial and industrial users (See Figure II-2). A study of Niagara Mohawk Power (now National Grid) customers in the real-time pricing program found nearly a third of those who were unable to curtail in the Niagara Mohawk program also were enrolled in a NYISO emergency demand response program (EDRP); nearly two-thirds had received some sort of capacity payments. These non-price-responsive customers may have valued perceived reliability needs more highly than perceived price needs. The study noted that “industrial customers who were also enrolled in the EDRP showed dramatically increased responses during EDRP events (0.40 on event days vs. 0.03 on non-event days); for these customers, the EDRP program appears to entice price response that their Niagara Mohawk tariff did not.”45
Figure II-2. Elasticity of substitution varies by customer market segment
0.05
0.11
0.03
0.17
0.01
0.11
0
0.04
0.08
0.12
0.16
0.2
Commercial /Retail
Gov't /Education
Health Care Manufacturing Public Works All Accounts
Elas
ticity
of S
ubst
itutio
Source: Goldman, et al., Customer Strategies for Responding to Day-Ahead Market Hourly Electricity Pricing: LBNL-57128, August 2005.
Role of Enabling Technology A key requirement for most demand response programs and time-based rates is the availability of enabling technology. For states or utilities to implement demand response and time-based rates, customers would need meters that record usage on a more frequent basis, preferably hourly. Introducing other demand technologies such as smart thermostats (i.e., thermostats that adjust room temperatures automatically in response to price changes or remote signals from system operators) would increase the amount of load that could be reduced under a demand response program. Advances in integrated circuitry, control systems, and communications technologies have significantly increased the functionality of advanced metering and demand response technologies. These advances have the potential to provide more power system and societal benefits than those achievable with
44 Charles River Associates. Impact Evaluation of the California Statewide Pricing Pilot: Final Report. March 16, 2005.
45 Charles Goldman, et al., Does Real-time Pricing Deliver Demand Response? A Case Study of Niagara Mohawk's Large Customer RTP Tariff, Lawrence Berkeley National Laboratory: LBNL-54974, August 2004.

Chapter II – Background on Demand Response
Assessment of Demand Response and Advanced Metering Federal Energy Regulatory Commission
15
existing demand response programs. These advances make automated customer responses possible in more situations, allowing both greater customer receptivity and higher utility confidence that customers can and will respond to price-based demand response. Examples of enabling technologies include, but are not limited to,46
• interval meters with two-way communications capability that allow customer utility bills to
reflect their actual usage pattern rather than an average load profile for that customer class • multiple, user-friendly communication pathways to notify customers of load curtailment
events • energy-information tools that enable near-real-time access to interval load data, analyze load
curtailment performance relative to baseline usage, and provide diagnostics to facility operators on potential loads to target for curtailment
• demand-reduction strategies that are optimized to meet differing high-price or electric system emergency scenarios
• load controllers and building energy management control systems that are optimized for demand response and which facilitate automation of load curtailment strategies at the end use level
• on-site generation equipment, used either for emergency back-up or to meet primary power needs of a facility
The prices for technologies to implement time-based rates and automated customer responses have been falling, just as their capabilities have been rising. In his seminal book, Spot Pricing of Electricity, Professor Fred Schweppe of Cornell University posited that demand response was an integral part of a market model. His analysis envisioned technology solutions that may have seemed futuristic in 1988, including automatic thermostat controls and customer warnings when the spot prices to run an appliance would exceed a pre-determined cost. He posited that as time goes by, “appliance manufacturers would start to produce appliances designed to be able to exploit time-varying prices.”47 Communication technologies for notifying customers about system emergencies or price events also are important. Whether programs are adopted in restructured electricity markets or in traditional regulated markets, LSEs can adopt real-time and critical-peak pricing by notifying customers through pagers, cell phones, the Internet, and other means. The more communications channels used, the greater the likelihood of customer response.
46 Charles Goldman, Grayson Heffner, and Michael Kintner-Meyer, Do "Enabling Technologies" Affect Customer
Performance in Price-Responsive Load Programs?, August 2002: LBNL-50328, 10. 47 Fred C. Schweppe, Spot Pricing of Electricity (Boston: Kluwer Academic Publishing, 1988), chapter 4.

Chapter II – Background on Demand Response
Assessment of Demand Response and Advanced Metering Federal Energy Regulatory Commission
16

Chapter III – Advanced Metering Penetration
Assessment of Demand Response and Advanced Metering Federal Energy Regulatory Commission
17
Chapter III. Advanced Metering and Market Penetration48 This chapter addresses the first area, in EPAct section 1252(e)(3), that Congress directed the Commission to consider:
(A) saturation and penetration rates of advanced meters and communications technologies, devices and systems.
This chapter contains a detailed analysis of the state of advanced metering, and estimates the saturation and penetration of advanced metering in the electric power sector across the United States. It also discusses the importance of advanced metering for electric demand response, describes the available forms of advanced metering and key technological developments in metering and communications equipment. To develop this estimate of advanced metering penetration, Commission staff conducted a comprehensive and first-of-its-kind survey of metering. The FERC Demand Response and Advanced Metering Survey49 (FERC Survey) requested information on electric industry meters in all 50 states, with attention to meters that measure usage in short time intervals and with meter data retrieval more frequent than monthly. The results of this survey suggest that advanced metering achieved almost a six percent penetration in the United States electric meter market by the end of 2005. This chapter builds on the discussion of demand response and time-based rate programs included in Chapter II, and is organized into five sections:
• Definition of advanced metering • Description of the components and technologies associated with advanced metering • Presentation of the estimates of market penetration based on information received in the FERC
Survey • Costs and benefits associated with the deployment of advanced metering • Issues associated with advanced metering
What is advanced metering? Commission staff defines “advanced metering” as follows:
Advanced metering is a metering system that records customer consumption [and possibly other parameters] hourly or more frequently and that provides for daily or more frequent transmittal of measurements over a communication network to a central collection point.
The key concept reflected in this definition is that advanced metering involves more than a meter than can measure consumption in frequent intervals. Advanced metering refers to the full measurement and collection system, and includes customer meters, communication networks, and data management
48 This chapter reflects the views and the assistance of Patti Harper-Slaboszewicz of UtiliPoint International. 49 See Appendix F for a description of the FERC Survey.
Chapter III – Advanced Metering Penetration
Assessment of Demand Response and Advanced Metering Federal Energy Regulatory Commission
18
systems. This full measurement and collection system is commonly referred to as advanced metering infrastructure (AMI). Commission staff chose this definition based on (a) a review of the state-of-the-art of metering and communications technology, (b) specifications for “smart metering” or advanced metering in recent utility solicitations,50 (c) what type of meters and infrastructure is necessary to support demand response and to provide additional utility operational benefits beyond reducing metering costs,51 and (d) definitions of advanced metering included in the EPAct 2005.52
Overview of Advanced Metering The need to bill customers for their electricity consumption has historically been the primary reason to read electric meters. Today, with advances in metering technology and communication systems, advanced meters and infrastructure can provide additional value to utilities by enhancing customer service, reducing theft, improving load forecasting, monitoring power quality, managing outages, and supporting price-responsive demand response programs. For example, if electric load serving entities (LSEs) read meters every day, customer service representatives can assist a customer starting or ending service in one phone call, or more easily handle high bill complaints. With more frequent, hourly reads, customer demand can be totaled across meters served by a feeder line or transformer. This allows electric distribution companies to properly size equipment to handle peak loads, and increase the reliability of service while reducing costs. Hourly reads can also improve the accuracy of load forecasting, allowing LSEs to sell more power into the wholesale market, or reduce spot market purchases.53 Advanced metering also supports time-based rates. Monthly-only meter reads limit available rate options and does not support the provision of usage information in real-time to customers (see Chapter IV for a full description of alternative rate offerings). Hourly meter reading capabilities permit current and future innovative rate designs. These innovative rate designs can include retail rates designed to encourage customers to curtail energy use when wholesale prices are high and to make short-term or long-term changes to slow the growth of peak demand, and wholesale programs operated by Independent System Operators and Regional Transmission Organizations (ISO/RTOs) that are designed to curtail consumption during periods of high wholesale prices or system emergencies.54 In
50 Recent requests for proposals for automated meter reading have included a fixed network requirement, and the
requirements almost always involve measuring interval data hourly and collecting the data at least once per day. Exceptions have included more stringent requirements, for example, CenterPoint, a large utility in Texas, issued an RFP in January 2006 requesting 15 minute interval data.
51 Jana Corey, Director, Advanced Metering Infrastructure (AMI) Initiative for PG&E, provided the following written testimony in support of PG&E’s filing for the AMI project: “Over time, the operational benefits are expected to cover 89 percent of the costs and PG&E continues to estimate that the additional customer demand response benefits will allow the total benefits to exceed the total AMI Project cost.” “Section I Advanced Metering Infrastructure Project A.05-06-028 - Supplemental Testimony Pacific Gas and Electric Company Chapter 1 AMI Project and Project Management”, Application 05-06-028, filed October 13, 2005 with California Public Utilities Commission.
52 EPAct 2005 section 1252 (included in Appendix A) references advanced metering as a “suitable meter,” a “device to enable demand response,” “advanced metering with communications,” and “time-based meters with communication devices.” The section header includes the term “Smart Metering.” EPAct 2005 section 103 offers a more specific definition: “advanced meters or advanced metering devices that provide data at least daily and that measure at least hourly consumption of electricity.”
53 Patti Harper-Slaboszewicz, “Market Trends in AMR and Demand Response,” prepared for Automatic Meter Reading Association (AMRA), 2005.
54 Roger Levy, “Meter Scoping Study,” prepared for the California Energy Commission, March 2002.

Chapter III – Advanced Metering Penetration
Assessment of Demand Response and Advanced Metering Federal Energy Regulatory Commission
19
many time-based pricing pilots and implementations of time-based pricing, a key consideration has been to provide timely information to customers, and almost all time-based rate pilots or implementations have used advanced metering.55 Nevertheless, some electric utility representatives believe that the added expense of advanced metering is not needed to support time-based rates, and that deployment of time-of-use meters is sufficient to achieve benefits.56 The remainder of this section presents the key building blocks of advanced metering and discusses the available technologies.
Building Blocks of Advanced Metering Advanced metering or AMI consists of various components, including meters enabled with communications, a data collection network, and an AMI host system and database. Figure III-1 provides an overview of the building blocks of advanced metering. Note that while the focus of the discussion in this chapter will be on electric metering, AMI can also be deployed to collect data from gas and water meters.
Figure III-1. Building blocks of advanced metering
Source: UtiliPoint International
As is shown in Figure III-1, advanced metering has several components. Each customer meter is equipped with the ability to communicate with a network. A customer meter and the associated communication is commonly referred to as an “endpoint.” The communication system endpoints send
55 The following time-based pricing pilots/implementations have depended on advanced metering: Gulf Power GoodCents, California Statewide Pricing Pilot, PSE&G myPower Pilot Program, Anaheim Spare the Power Days program.
56 See for example, Alan Wilcox (Sacramento Municipal Utility District), FERC Technical Conference, transcript, 134-137.
Data Data Collection Collection
NetworkNetwork Advanced MeteringAdvanced MeteringInfrastructure HostInfrastructure Host
To MeterTo MeterDataData
ManagementManagement
neptuneTrident
99
99
99
9
Applicable to all meter reading systems – from mobile to complex real-time fixed networks
Electric endpoint
Water endpoint
Gas endpoint
Data Data Collection Collection
NetworkNetwork Advanced MeteringAdvanced MeteringInfrastructure HostInfrastructure Host
To MeterTo MeterDataData
ManagementManagement
neptuneTrident
99
99
99
9
neptuneTrident
99
99
99
9
neptuneTrident
99
99
99
9
neptuneTrident
99
99
99
9
neptuneTrident
99
99
99
9
neptuneTrident Trident
99
99
99
99
99
99
99
Applicable to all meter reading systems – from mobile to complex real-time fixed networks
Electric endpoint
Water endpoint
Gas endpoint
Chapter III – Advanced Metering Penetration
Assessment of Demand Response and Advanced Metering Federal Energy Regulatory Commission
20
meter readings up through the data collection network to the AMI host system. The data analysis and storage of the meter data is managed by meter data management (MDM) systems. Each of these components is discussed in greater detail below.
Metering Electric meters have historically been used to measure, at the minimum, consumption of electricity in kWh over a monthly or other similar billing period. Meters installed at larger commercial and industrial customers often also measured maximum demand in kW and other power quality parameters. Up until the last decade or so, these meters, especially for smaller customers, were based on electromechanical designs. Over time, electromechanical meters have become highly reliable and typically last for up to 40 years. In recent years, metering has gone through a transformation from electromechanical meters to solid state, electronic meters. The shift towards solid state meters is driven in part by their additional functionality,57 but the strongest driver for the rising market share of solid state meters is investment in automated meter reading (AMR) or AMI. With AMI or AMR enabled meters, the utility will plan to change out the meter when the AMI or AMR communications fails or is replaced. Thus, the shorter useful life of the solid state meter compared to electromechanical meters is less important. Along with the shift towards solid state meters, there also has been a gradual transition from manual meter reading to AMR, and onto AMI, and utilities are at various stages of adopting automation. Many utilities continue to employ meter readers to walk routes to read utility meters once a month. However, the number of utilities that use meter books and later key in the readings is dwindling. Hand-held electronic meter books began replacing meter books in the 1980s, which allow the meter reader to physically connect to the meter or key in the meter reading. Meter reads can then be downloaded to the utility billing system, which reduces transcription errors and speeds up the billing process. This system works fairly well for collecting meter reads for monthly bills but still requires the meter reader to get reasonably close to the meter on the customer’s property.58 AMR and AMI were developed to allow meter reading to be more efficient and less-costly through remote meter reading. In particular, deployments of AMI can also support more frequent meter reading. The design of the meter and the technology used does have implications for its ability to be part of an AMI system. To enable an electromechanical meter to communicate with an AMI system, an electronic meter module is installed “under-the-glass” of the meter. This module counts and records electronically the spinning of the disk within the meter. This retrofit solution does have limitations, however. The AMI measurement is performed independently of the meter measurement which may result in a discrepancy between the usage displayed by the electromechanical meter and what is reported via the AMI system. Retrofit of solid state meters to communicate with AMI systems is more straightforward and most meters currently being deployed have the ability to accommodate communication modules from multiple AMI vendors and technologies. Utilities tend to meter medium-sized customers with demand meters. However, these customers are not large enough to be metered with the more sophisticated metering used for the largest customers of utilities. Demand meters measure the maximum demand during the billing period along with the
57 Solid state meters provide the ability to measure loads at lower levels, increased measurement frequency, increased accuracy, data storage capability, measurement of additional parameters, and ease of upgrading meter functionality or integrating communication technology.
58 Roger Levy, 2002.

Chapter III – Advanced Metering Penetration
Assessment of Demand Response and Advanced Metering Federal Energy Regulatory Commission
21
energy measurement. The difficulty has been with how to reset the demand measurement once the maximum demand has been recorded for the current billing period without actually physically visiting the meter site. With AMI, if the utility retrieves the maximum demand daily, it is no longer necessary to manually reset the demand measurement. The transition to solid state metering occurred some time ago for larger customers. Conversion to a new AMI system for larger customers is typically driven by the need to change communications technologies. For example, many electric utilities are converting from using analog cellular to other communication technologies as cellular companies drop support for analog cellular. For all customers, there are a variety of choices for meters, solid state or electromechanical, and most AMI vendors have developed AMI modules for more than one meter vendor. Large purchases of meters today are usually related to a rollout of AMI, and purchase is guided by the selection of the AMI technology rather than by the selection of a particular meter. AMI has thus contributed to the treatment of meters as commodities by utilities.
AMI Data Collection AMI data collection involves the collection and retrieval of meter data without physically visiting the meter site, and is typically done by means of a fixed network.59 Today, electric utilities use various types of AMI systems. The different types of AMI systems available on the market today are:
• Broadband over power line • Power line communications • Fixed radio frequency (RF) networks • Systems utilizing public networks (landline, cellular, or paging)
Each of these different AMI system types are examined in more detail below.
Broadband Over Power Line (BPL)60 BPL works by modulating high-frequency radio waves with the digital signals from the Internet. These high frequency radio waves are fed into the utility grid at specific points, often at substations. They travel along medium voltage circuits and pass through or around the utility transformers to subscribers' homes and businesses. Sometimes the last leg of the journey, from the transformer to the home, is handled by other communication technologies, such as Wi-Fi. As seen in Figure III-2 below, substations receive power from power plants over high voltage lines, and then step down the voltage to transmit power to distribution transformers over medium voltage circuits. Each medium voltage circuit services 20-25 distribution transformers which convert the medium voltage down to the voltage level used within most homes and businesses (110v/220v). Between one and six homes are connected to each distribution transformer which translates to about 100 homes passed per medium voltage circuit.
59 A fixed network refers to either a private or public communication infrastructure which allows the utility to
communicate with meters without visiting or driving by the meter location. 60 The information in this section relies heavily on facts provided in a seminar presented in 2005 by UtiliPoint:
Ethan Cohen, UtiliPoint, “BPL Hope, Hyperbole, and Reality,” April 2005.

Chapter III – Advanced Metering Penetration
Assessment of Demand Response and Advanced Metering Federal Energy Regulatory Commission
22
Figure III-2. Stylized Grid diagram
Source: Bruce Bahlmann, Birds-Eye.Net and UtiliPoint® International
To implement BPL, a utility must interconnect substations (many of which are already interconnected using fiber). The BPL signal is then injected onto the medium voltage circuits at the substations. Due to the tendency of transformers to filter the high-frequency BPL signal, at each distribution transformer one of three things can happen: the signal is pushed through the transformer, the transformer is bypassed, or the signal is provided to the customers using a Wi-Fi device physically located near the distribution transformer. In Europe, there are typically 100 customers served on a distribution line with transformers at each end of the span. In contrast, the United States distribution system has one transformer serving six to ten customers, which increases the relative cost in the United States.61 Major vendors of broadband over powerlines include Ambient, Amperion, Current Technologies, Main.net, and PowerComm Systems.
Power Line Communications (PLC) PLC systems send data through powerlines by injecting information into either the current, voltage or a new signal. This can be accomplished by slightly perturbing the voltage or current signal as it crosses the zero point or adding a new signal onto the power line. The system normally has equipment installed in utility substations to collect the meter readings provided by the endpoint, and then the information is transmitted using utility communications or public networks to the utility host center for the PLC system. The low frequency signals used in PLC communications in the United States are not filtered out by distribution transformers. PLC systems are particularly well suited to rural environments, but have also been successfully used in urban environments.62 For utilities with both rural and suburban areas in their service territory, PLC provides an option for using one AMI technology for the entire service territory for electric meters. PLC systems initially targeted residential and small commercial metering, but are now able to read for larger customers as well.
61 “Is the Ambient system compatible with all distribution systems?” Frequently asked questions on Ambient Corporation website, http://www.ambientcorp.com/pages/faqs-UTILITY.htm, “For all practical purposes, yes. In the US and Canada, all systems are essentially the same from a BPL perspective. In other countries, differences in voltage, frequency and configuration (specifically, the number of customers on each distribution transformer) can impact equipment and system design. In general, the higher density of customers per transformer in Europe and other countries works in favor of BPL.”
62 PPL Electric Utilities has used PLC in Pennsylvania and, more recently, Pacific Gas & Electric selected a PLC system for its electric AMI system for both rural and suburban areas.

Chapter III – Advanced Metering Penetration
Assessment of Demand Response and Advanced Metering Federal Energy Regulatory Commission
23
Major vendors of power line communications include Cannon Technologies, DCSI, and Hunt Technologies.
Fixed RF Systems In basic fixed radio frequency (RF) systems, meters communicate over a private network using RF signals. Each meter communicates via the network directly to a data collector or a repeater. Repeaters may forward information from numerous endpoints to the more sophisticated devices called data collectors. Data collectors often store the meter readings from meters within range. The data collectors then upload the meter readings to the AMI host system at preset times using the best communication method available, ranging from public networks to microwave to Ethernet connections. The communications between the data collector and the network controller are usually two-way, and allow the network controller to query for a recent meter reading and the status of one or a group of meters. From 1994 to 1999, this type of automated meter reading system was selected for every large fixed network deployment in the United States. 63 Since 1999, fixed RF has been selected in seven of the 12 large fixed network deployments. More advanced RF networks have also been developed and implemented. Within these more advanced systems, the meters themselves may form part of the network, and meters are not required to communicate directly or indirectly with a repeater or the data collector. One example of an advanced RF AMI network is shown below in Figure III-3. In this system, endpoints can communicate directly with towers (similar to super data collectors) or via a ‘buddy” meter. Other advanced systems are designed with endpoints that form a mesh network, and where some of the endpoints within the mesh may function as data collectors and meters. The flexibility provided by advanced RF AMI systems is generally thought to offer advantages in terms of better coverage and more robust communications. One of the key features of the more advanced RF networks that appeal to utilities is the ability of the network to “self heal.”64 If the endpoints have more than one communication path to the main hub of the system, and the best path is no longer available, endpoints can change their communication path. This is very important to utilities because changes in the service territory are ongoing. New buildings are constructed, trees or other shrubbery are planted or grow, and other changes occur which affect RF communications. Major vendors of fixed RF systems include Cellnet, Elster, Hexagram, Itron, Sensus/AMDS, Silver Spring Networks, Tantalus, and Trilliant.
63 See Table III-3 later in this chapter for a list of recent deployments. 64 Bruce Carpenter, Portland General Electric, “PGE Mesh Metering Tests”, September 2005

Chapter III – Advanced Metering Penetration
Assessment of Demand Response and Advanced Metering Federal Energy Regulatory Commission
24
Figure III-3. Advanced RF Network system overview
Source: Sensus/AMDS
Systems Utilizing Public Networks These systems utilize existing public networks such as paging, satellite, internet and/or telephony (cellular or landline) networks to provide for communications between meters and utilities. One key advantage of these systems is the ability to deploy AMI across a wide area with low densities, and the possible lower upfront cost of deployment since the utility does not need to build a private infrastructure. Some systems rely on paging networks while others rely on cellular or landline telephone networks. Some have used satellite communications. Three key limitations include: being subject to the coverage provided by the public networks; changing protocols (this is especially true in the cellular segment); and operational costs. With AMI systems based on public networks, if there is coverage at the customer location, installation costs are limited to installing the new endpoint, and setting up the service. Utilities are not required to install any communication infrastructure, which can speed up the deployment process. All of these systems have been used for larger customers and small rollouts of AMI, but recently these systems are being considered for much larger rollouts for smaller customers.65
65 Hydro One in Ontario announced in April 2005 it had selected Rogers Wireless Inc./SmartSynch to provide
25,000 "Smart Meters" as part of a pilot program. The Smart Synch system relies on a selection of various public networks for communications.
Phone LineISDN
Satellite
TGBTower Gateway
Basestation
'
UTILITY OFFICE
RNIRegional Network Interface
Map TGB Channel Noise
TGB Channel NoiseCorrelation
Map TGB Channel Noise
TGB Channel NoiseCorrelation
System Health Management
Data Warehouse60 Day History
XML FileItron MV 90, MV 90 HHFItron Enterprise EditionSIMSCustom Interface
Web FunctionsUtility Interface
Two-way & One-wayMeter endpoints
(Electric, Gas, Water)
75 to 300 Sq. MilesPer tower range
Phone LineISDN
Satellite
TGBTower Gateway
Basestation
'
UTILITY OFFICE
RNIRegional Network Interface
Map TGB Channel Noise
TGB Channel NoiseCorrelation
Map TGB Channel Noise
TGB Channel NoiseCorrelation
Map TGB Channel Noise
TGB Channel NoiseCorrelation
System Health Management
Data Warehouse60 Day History
XML FileItron MV 90, MV 90 HHFItron Enterprise EditionSIMSCustom Interface
Web FunctionsUtility Interface
Two-way & One-wayMeter endpoints
(Electric, Gas, Water)
75 to 300 Sq. MilesPer tower range
Chapter III – Advanced Metering Penetration
Assessment of Demand Response and Advanced Metering Federal Energy Regulatory Commission
25
Meter Data Management Meter data management provides utilities a place to store meter data collected from the field. Utilities that install AMI usually invest in meter data management to provide storage for the large number of meter readings that will be collected each year per meter. If utilities opt for hourly interval data, this results in 8,760 meter readings per meter year, compared to 12 each year for a meter that is read once per month. For a utility of even modest size, the storage requirements and data processing can become substantial. Meter data management can also be configured to meet the specific requirements of other utility applications. For example, with meter data management, meter data can be provided in the same manner to all applications, or it can provide data in the exact form that each application requires. If the utility bills residential customers on the total usage for the billing period, the meter data management can total all of the daily reads to provide the billing system the total usage for each customer.
Estimates of Advanced Metering Market Penetration from FERC Survey In order to respond to the direction from Congress to assess market penetration of advanced metering by region, Commission staff undertook a comprehensive survey of electric delivery companies and other entities that might own or operate retail electric meters to learn how they use their advanced metering systems, and for how many meters utilities they have deployed to collect information that could be used to support demand response. This section reports on the results of this survey.
FERC Survey Commission staff asked respondents to provide information on how often customer usage data is collected, and the frequency of the data measurement. This allowed the survey to provide meaningful benchmarks for advanced metering, showing statistics for a range of metering sophistication. In the FERC Survey, Commission staff requested respondents that own or operate customer meters to provide information by customer class on the number of customer meters they own and/or operate, and how energy usage is measured and retrieved. Electric utilities and other entities divide energy measurement into several categories based on how often the data is collected, and the frequency of the data intervals. Commission staff also asked entities to distinguish between whether the installed metering and/or advanced metering system in place is capable of meeting the stated requirements or is being used in accordance with the stated standards. Collection of data on whether meters are capable covers situations where electric utilities are not using the AMI system to the fullest extent, but could in the future without a separate physical trip to retrofit or replace the customer meter. Entities were asked to divide the number of meters in the following categories for each customer class that are being used or capable of being used:
1. For those meters where meter reads are collected at least daily, how many are collecting interval data where:

Chapter III – Advanced Metering Penetration
Assessment of Demand Response and Advanced Metering Federal Energy Regulatory Commission
26
Intervals <= 15 minutes. Interval is > 15 minutes and <= hourly.
2. For those meters where meter reads are collected at least monthly but not as often as daily, how many are collecting interval data where:
Intervals <= 15 minutes. Intervals are > 15 minutes and <= hourly.
3. For those meters where measurement is collected for two to four peak periods (on, shoulder, off, etc.) per day, how many are:
Collecting for intervals greater than hourly but less than daily (two hour intervals, three hour intervals, etc.).
Providing daily peak period totals. Providing monthly totals for each peak period
. Consistent with our earlier definition of advanced metering, the penetration estimates presented below reflect meters that are currently used to collect measurements with data intervals of an hour or less, and a data retrieval frequency of at least daily. It is still unclear how demand response requirements will be incorporated into advanced metering or whether it will be common practice to use the AMI systems to send demand response signals to customers or to load control equipment. Therefore, Commission staff elected to ask respondents about other features of AMI, besides measurement and data retrieval.
Advanced Metering Market Penetration Estimates The results of the FERC Survey indicates that advanced metering or AMI currently has a low market penetration of less than six percent in the United States (See Figure III-4).66 This result is lower than past estimates, which had suggested the penetration rate was closer to 10 percent.67 The following discussion breaks down the advanced metering penetration results by customer class, region, customer class and region, and by state.
Figure III-4. United States penetration of advanced metering
Source: FERC Survey
66 UtiliPoint International, under contract with the Commission for the purposes of this Report, performed analysis
and tabulation of results 67 Chris King, eMeter “Advanced Metering Infrastructure (AMI) Overview of System Features and Capabilities,”
prepared for presentation at a joint meeting of the CPUC, CEC, and the Governor’s Cabinet of California, September 30, 2004.
Non-Advanced Metering,
94.1%
Advanced Metering,
5.9%
Advanced Metering
Non-Advanced Metering
Non-Advanced Metering,
94.1%
Advanced Metering,
5.9%
Advanced Metering
Non-Advanced Metering

Chapter III – Advanced Metering Penetration
Assessment of Demand Response and Advanced Metering Federal Energy Regulatory Commission
27
A breakdown of the national results by customer class (Figure III-5) suggests that the market penetration estimates of advanced metering for the primary customer classes (residential, commercial, and industrial) are relatively close to the national penetration estimate. The highest penetration rate (eight percent) is associated with transportation customers.
Figure III-5. Penetration of advanced metering by customer class
Source: FERC Survey
Examination of market penetration by type of entity and ownership (see Figure III-6) indicates that electric cooperatives have deployed the greatest level of advanced metering, with overall penetration of 12.9 percent. Investor-owned utilities have the next highest level of penetration at 5.7 percent, close to the national average.
Figure III-6. Penetration of advanced metering by ownership
Source: FERC Survey
0.0%
1.0%
2.0%
3.0%
4.0%
5.0%
6.0%
7.0%
8.0%
9.0%
Other Transportation Industrial Commercial Residential
Customer Class
Adv
ance
d M
eter
ing
Pene
trat
ion
0.0%
1.0%
2.0%
3.0%
4.0%
5.0%
6.0%
7.0%
8.0%
9.0%
Other Transportation Industrial Commercial Residential
Customer Class
Adv
ance
d M
eter
ing
Pene
trat
ion
0.3% 0.1% 0.0%0.4%
5.7%
12.9%
2.0% 1.3%0.5%
1.3%
0.0%
2.0%
4.0%
6.0%
8.0%
10.0%
12.0%
14.0%
Cooperative InvestorOwned
MunicipalMarketingAuthority
Municipal PoliticalSubdivision
PowerMarketer
Federal CSP State ISO
Ownership
Adv
ance
d M
eter
ing
Pene
trat
ion
0.3% 0.1% 0.0%0.4%
5.7%
12.9%
2.0% 1.3%0.5%
1.3%
0.0%
2.0%
4.0%
6.0%
8.0%
10.0%
12.0%
14.0%
Cooperative InvestorOwned
MunicipalMarketingAuthority
Municipal PoliticalSubdivision
PowerMarketer
Federal CSP State ISO
Ownership
Adv
ance
d M
eter
ing
Pene
trat
ion

Chapter III – Advanced Metering Penetration
Assessment of Demand Response and Advanced Metering Federal Energy Regulatory Commission
28
An analysis of market penetration by region indicates that there are differences in how much advanced metering has been adopted across the United States (see Figure III-7) in the footprints of the various NERC regional reliability councils. The ReliabilityFirst Council (RFC), which covers the Mid-Atlantic and portions of the Midwest, and the Southwest Power Pool (SPP), with overall penetration rates of 14.7 percent and 14.0 percent respectively, show the highest regional penetration.
Figure III-7. Penetration of advanced metering by NERC region68
Source: FERC Survey
Table III-1 further breakdown of the regional market penetration estimates by customer class.69 The penetration of advanced metering for the residential and commercial classes is the highest in the RFC and SPP regions. All other NERC regions have lower than average penetrations of AMI for residential and commercial classes. For the industrial class, the MRO, RFC and NPCC regions enjoy a penetration rate higher than average, and all of the other regions are below average. Table III-2 includes estimates of the penetration of advanced metering by state. These state-by-state estimates may prove a useful baseline in the state deliberations on smart metering required by EPAct 200570 and any future state proceedings on advanced metering. There is wide variation in the number of advanced meters that have been installed across the states. The five states with the highest penetration of advanced meters are Pennsylvania, Wisconsin, Connecticut, Kansas, and Idaho. Most states have reported much lower penetration of advanced meters. 71
68 Regional definitions used in this figure and subsequent figures and tables are based on NERC regions. See Chapter I for a map of these regions.
69 Examples of transportation customers are rapid transit customers. Other customers include wholesale customers, street lights, and customers that do not fit into the other categories.
70 EPAct 2005 section 1252(b). 71 The penetration estimates for several states such as Louisiana and Mississippi do not reflect complete
information. Electric utilities serving these states were unable to provide a full inventory of meters due to the impacts of Hurricanes Katrina and Rita in 2005.
2.8%4.2%
0.2%
1.0%
2.5%
5.2%
14.0%14.7%
0.0%2.0%4.0%6.0%8.0%
10.0%12.0%14.0%16.0%
RFC SPP SERC MRO NPCC FRCC WECC Other
NERC Region
Adv
ance
d M
eter
ing
Pene
trat
ion
2.8%4.2%
0.2%
1.0%
2.5%
5.2%
14.0%14.7%
0.0%2.0%4.0%6.0%8.0%
10.0%12.0%14.0%16.0%
RFC SPP SERC MRO NPCC FRCC WECC Other
NERC Region
Adv
ance
d M
eter
ing
Pene
trat
ion
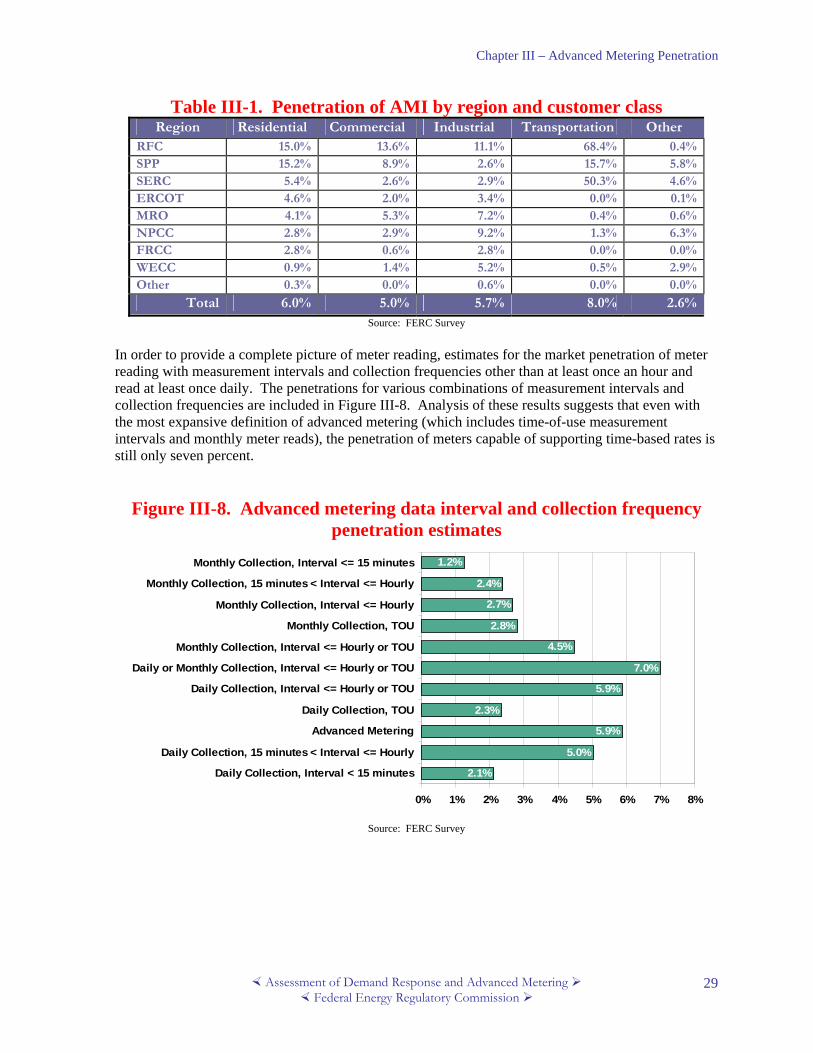
Chapter III – Advanced Metering Penetration
Assessment of Demand Response and Advanced Metering Federal Energy Regulatory Commission
29
Table III-1. Penetration of AMI by region and customer class Region Residential Commercial Industrial Transportation Other
RFC 15.0% 13.6% 11.1% 68.4% 0.4%SPP 15.2% 8.9% 2.6% 15.7% 5.8%SERC 5.4% 2.6% 2.9% 50.3% 4.6%ERCOT 4.6% 2.0% 3.4% 0.0% 0.1%MRO 4.1% 5.3% 7.2% 0.4% 0.6%NPCC 2.8% 2.9% 9.2% 1.3% 6.3%FRCC 2.8% 0.6% 2.8% 0.0% 0.0%WECC 0.9% 1.4% 5.2% 0.5% 2.9%Other 0.3% 0.0% 0.6% 0.0% 0.0%
Total 6.0% 5.0% 5.7% 8.0% 2.6%Source: FERC Survey
In order to provide a complete picture of meter reading, estimates for the market penetration of meter reading with measurement intervals and collection frequencies other than at least once an hour and read at least once daily. The penetrations for various combinations of measurement intervals and collection frequencies are included in Figure III-8. Analysis of these results suggests that even with the most expansive definition of advanced metering (which includes time-of-use measurement intervals and monthly meter reads), the penetration of meters capable of supporting time-based rates is still only seven percent.
Figure III-8. Advanced metering data interval and collection frequency penetration estimates
2.1%
5.0%
5.9%
2.3%
5.9%
7.0%
4.5%
2.8%
2.7%
2.4%
1.2%
0% 1% 2% 3% 4% 5% 6% 7% 8%
Daily Collection, Interval < 15 minutes
Daily Collection, 15 minutes < Interval <= Hourly
Advanced Metering
Daily Collection, TOU
Daily Collection, Interval <= Hourly or TOU
Daily or Monthly Collection, Interval <= Hourly or TOU
Monthly Collection, Interval <= Hourly or TOU
Monthly Collection, TOU
Monthly Collection, Interval <= Hourly
Monthly Collection, 15 minutes < Interval <= Hourly
Monthly Collection, Interval <= 15 minutes
Source: FERC Survey
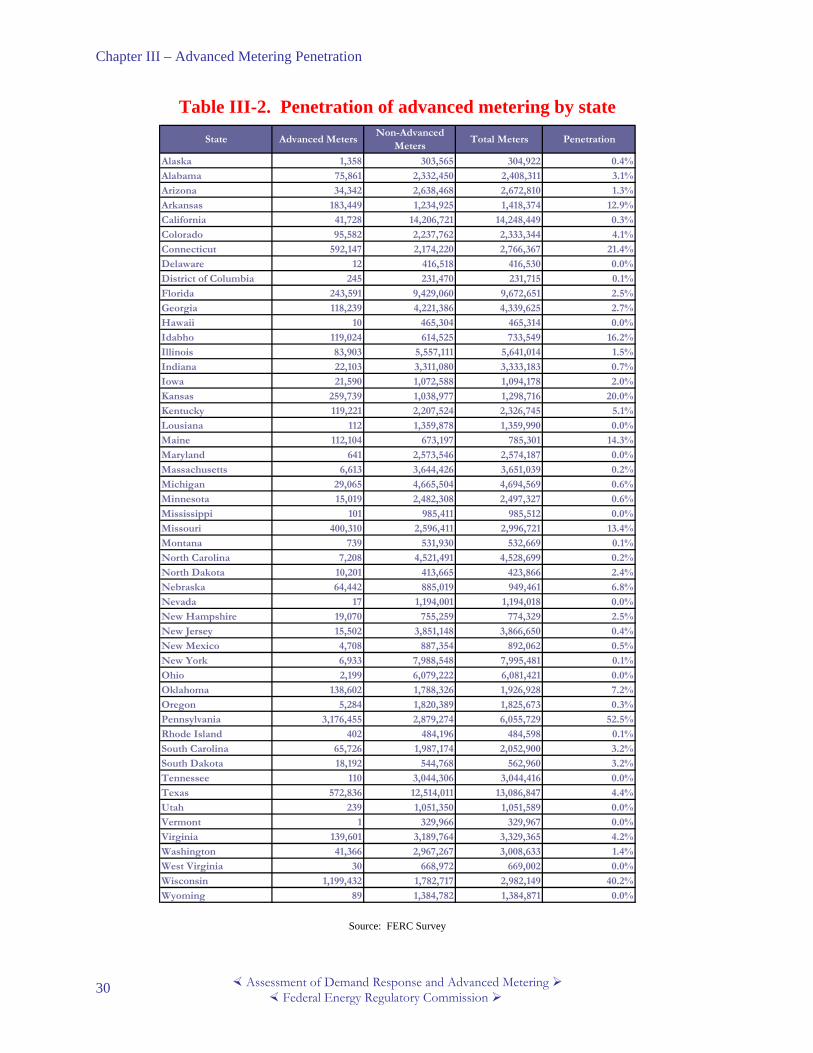
Chapter III – Advanced Metering Penetration
Assessment of Demand Response and Advanced Metering Federal Energy Regulatory Commission
30
Table III-2. Penetration of advanced metering by state
Source: FERC Survey
State Advanced MetersNon-Advanced
MetersTotal Meters Penetration
Alaska 1,358 303,565 304,922 0.4%
Alabama 75,861 2,332,450 2,408,311 3.1%
Arizona 34,342 2,638,468 2,672,810 1.3%
Arkansas 183,449 1,234,925 1,418,374 12.9%
California 41,728 14,206,721 14,248,449 0.3%
Colorado 95,582 2,237,762 2,333,344 4.1%
Connecticut 592,147 2,174,220 2,766,367 21.4%
Delaware 12 416,518 416,530 0.0%
District of Columbia 245 231,470 231,715 0.1%
Florida 243,591 9,429,060 9,672,651 2.5%
Georgia 118,239 4,221,386 4,339,625 2.7%
Hawaii 10 465,304 465,314 0.0%
Idabho 119,024 614,525 733,549 16.2%
Illinois 83,903 5,557,111 5,641,014 1.5%
Indiana 22,103 3,311,080 3,333,183 0.7%
Iowa 21,590 1,072,588 1,094,178 2.0%
Kansas 259,739 1,038,977 1,298,716 20.0%
Kentucky 119,221 2,207,524 2,326,745 5.1%
Lousiana 112 1,359,878 1,359,990 0.0%
Maine 112,104 673,197 785,301 14.3%
Maryland 641 2,573,546 2,574,187 0.0%
Massachusetts 6,613 3,644,426 3,651,039 0.2%
Michigan 29,065 4,665,504 4,694,569 0.6%
Minnesota 15,019 2,482,308 2,497,327 0.6%
Mississippi 101 985,411 985,512 0.0%
Missouri 400,310 2,596,411 2,996,721 13.4%
Montana 739 531,930 532,669 0.1%
North Carolina 7,208 4,521,491 4,528,699 0.2%
North Dakota 10,201 413,665 423,866 2.4%
Nebraska 64,442 885,019 949,461 6.8%
Nevada 17 1,194,001 1,194,018 0.0%
New Hampshire 19,070 755,259 774,329 2.5%
New Jersey 15,502 3,851,148 3,866,650 0.4%
New Mexico 4,708 887,354 892,062 0.5%
New York 6,933 7,988,548 7,995,481 0.1%
Ohio 2,199 6,079,222 6,081,421 0.0%
Oklahoma 138,602 1,788,326 1,926,928 7.2%
Oregon 5,284 1,820,389 1,825,673 0.3%
Pennsylvania 3,176,455 2,879,274 6,055,729 52.5%
Rhode Island 402 484,196 484,598 0.1%
South Carolina 65,726 1,987,174 2,052,900 3.2%
South Dakota 18,192 544,768 562,960 3.2%
Tennessee 110 3,044,306 3,044,416 0.0%
Texas 572,836 12,514,011 13,086,847 4.4%
Utah 239 1,051,350 1,051,589 0.0%
Vermont 1 329,966 329,967 0.0%
Virginia 139,601 3,189,764 3,329,365 4.2%
Washington 41,366 2,967,267 3,008,633 1.4%
West Virginia 30 668,972 669,002 0.0%
Wisconsin 1,199,432 1,782,717 2,982,149 40.2%
Wyoming 89 1,384,782 1,384,871 0.0%
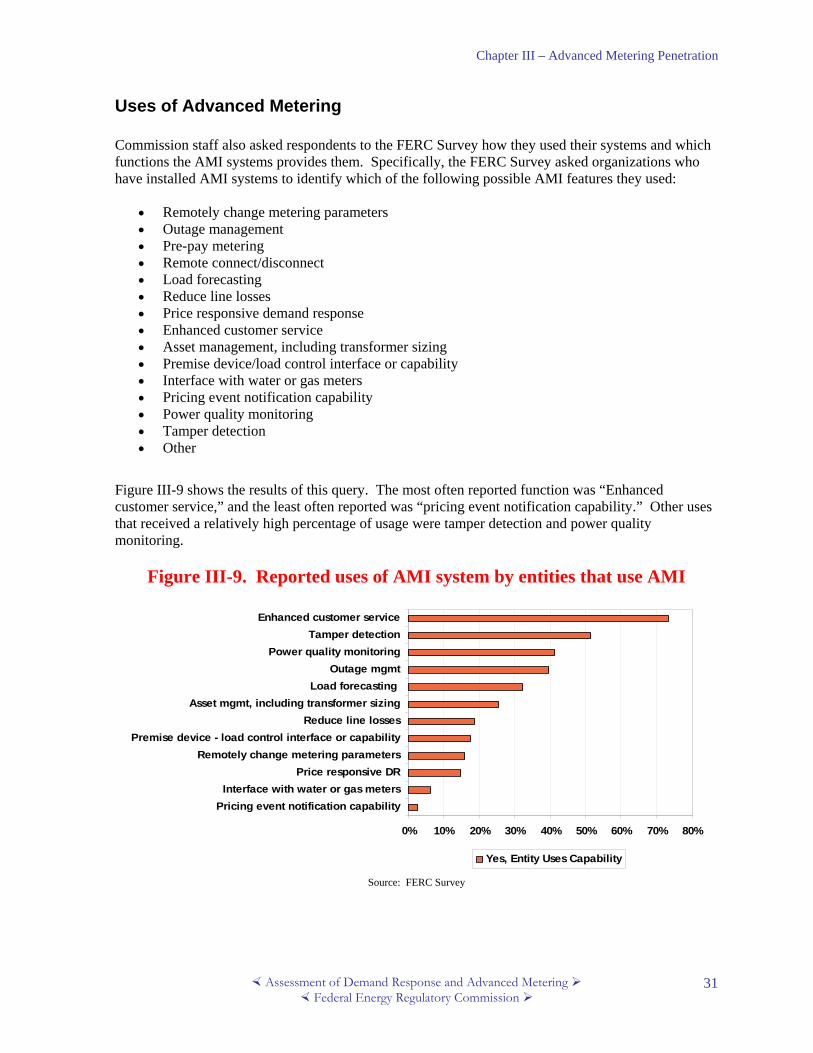
Chapter III – Advanced Metering Penetration
Assessment of Demand Response and Advanced Metering Federal Energy Regulatory Commission
31
Uses of Advanced Metering Commission staff also asked respondents to the FERC Survey how they used their systems and which functions the AMI systems provides them. Specifically, the FERC Survey asked organizations who have installed AMI systems to identify which of the following possible AMI features they used:
• Remotely change metering parameters • Outage management • Pre-pay metering • Remote connect/disconnect • Load forecasting • Reduce line losses • Price responsive demand response • Enhanced customer service • Asset management, including transformer sizing • Premise device/load control interface or capability • Interface with water or gas meters • Pricing event notification capability • Power quality monitoring • Tamper detection • Other
Figure III-9 shows the results of this query. The most often reported function was “Enhanced customer service,” and the least often reported was “pricing event notification capability.” Other uses that received a relatively high percentage of usage were tamper detection and power quality monitoring.
Figure III-9. Reported uses of AMI system by entities that use AMI
0% 10% 20% 30% 40% 50% 60% 70% 80%
Pricing event notification capabilityInterface with water or gas meters
Price responsive DRRemotely change metering parameters
Premise device - load control interface or capabilityReduce line losses
Asset mgmt, including transformer sizingLoad forecasting
Outage mgmtPower quality monitoring
Tamper detectionEnhanced customer service
Yes, Entity Uses Capability
Source: FERC Survey
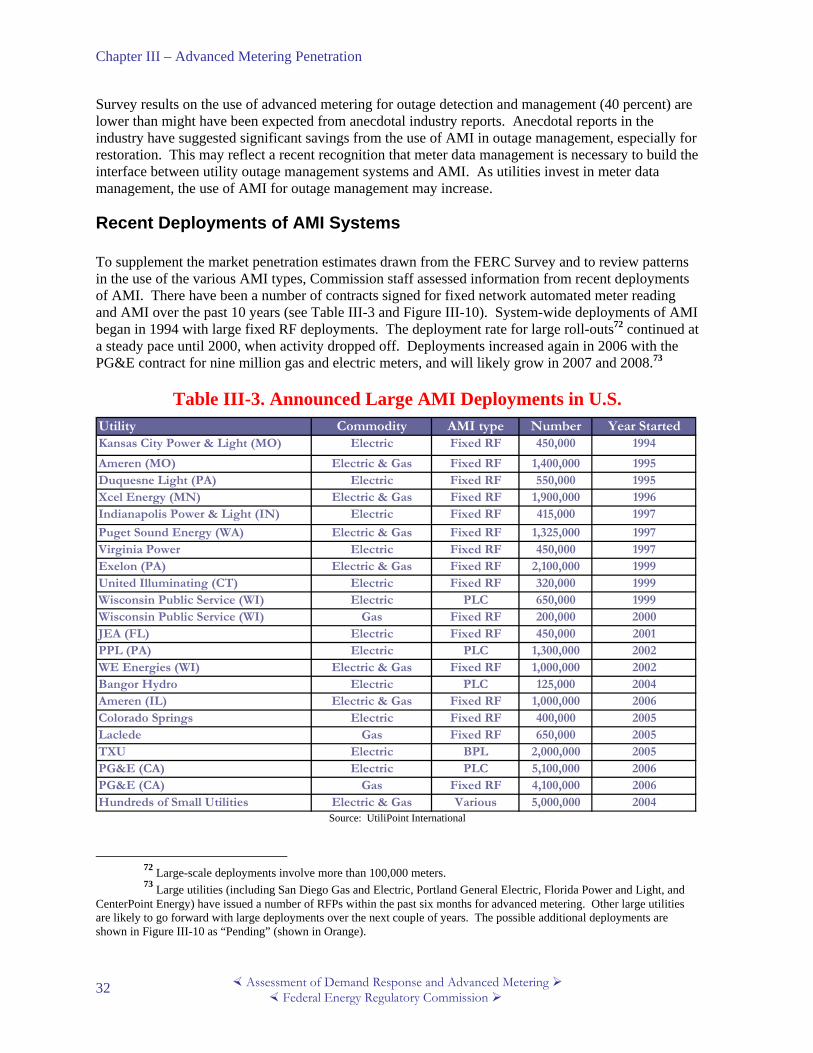
Chapter III – Advanced Metering Penetration
Assessment of Demand Response and Advanced Metering Federal Energy Regulatory Commission
32
Survey results on the use of advanced metering for outage detection and management (40 percent) are lower than might have been expected from anecdotal industry reports. Anecdotal reports in the industry have suggested significant savings from the use of AMI in outage management, especially for restoration. This may reflect a recent recognition that meter data management is necessary to build the interface between utility outage management systems and AMI. As utilities invest in meter data management, the use of AMI for outage management may increase.
Recent Deployments of AMI Systems To supplement the market penetration estimates drawn from the FERC Survey and to review patterns in the use of the various AMI types, Commission staff assessed information from recent deployments of AMI. There have been a number of contracts signed for fixed network automated meter reading and AMI over the past 10 years (see Table III-3 and Figure III-10). System-wide deployments of AMI began in 1994 with large fixed RF deployments. The deployment rate for large roll-outs72 continued at a steady pace until 2000, when activity dropped off. Deployments increased again in 2006 with the PG&E contract for nine million gas and electric meters, and will likely grow in 2007 and 2008.73
Table III-3. Announced Large AMI Deployments in U.S. Utility Commodity AMI type Number Year StartedKansas City Power & Light (MO) Electric Fixed RF 450,000 1994
Ameren (MO) Electric & Gas Fixed RF 1,400,000 1995Duquesne Light (PA) Electric Fixed RF 550,000 1995Xcel Energy (MN) Electric & Gas Fixed RF 1,900,000 1996Indianapolis Power & Light (IN) Electric Fixed RF 415,000 1997
Puget Sound Energy (WA) Electric & Gas Fixed RF 1,325,000 1997Virginia Power Electric Fixed RF 450,000 1997Exelon (PA) Electric & Gas Fixed RF 2,100,000 1999United Illuminating (CT) Electric Fixed RF 320,000 1999Wisconsin Public Service (WI) Electric PLC 650,000 1999Wisconsin Public Service (WI) Gas Fixed RF 200,000 2000JEA (FL) Electric Fixed RF 450,000 2001PPL (PA) Electric PLC 1,300,000 2002WE Energies (WI) Electric & Gas Fixed RF 1,000,000 2002Bangor Hydro Electric PLC 125,000 2004Ameren (IL) Electric & Gas Fixed RF 1,000,000 2006Colorado Springs Electric Fixed RF 400,000 2005Laclede Gas Fixed RF 650,000 2005TXU Electric BPL 2,000,000 2005PG&E (CA) Electric PLC 5,100,000 2006PG&E (CA) Gas Fixed RF 4,100,000 2006Hundreds of Small Utilities Electric & Gas Various 5,000,000 2004
Source: UtiliPoint International
72 Large-scale deployments involve more than 100,000 meters. 73 Large utilities (including San Diego Gas and Electric, Portland General Electric, Florida Power and Light, and
CenterPoint Energy) have issued a number of RFPs within the past six months for advanced metering. Other large utilities are likely to go forward with large deployments over the next couple of years. The possible additional deployments are shown in Figure III-10 as “Pending” (shown in Orange).
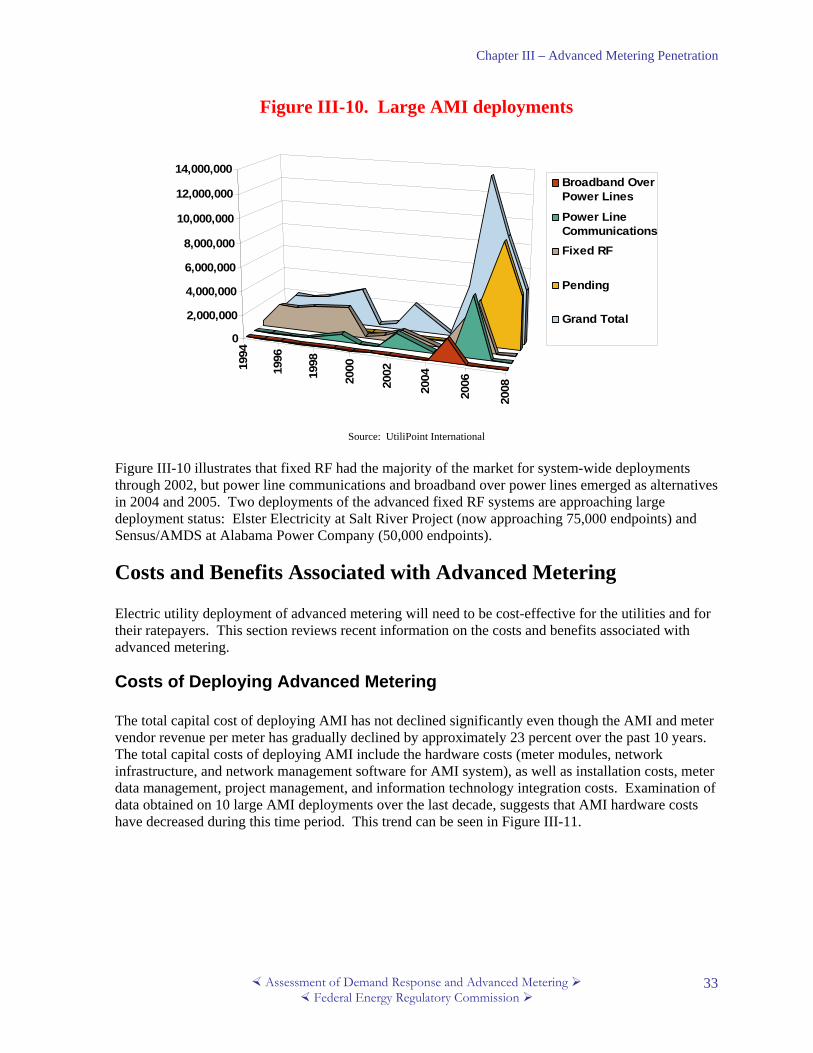
Chapter III – Advanced Metering Penetration
Assessment of Demand Response and Advanced Metering Federal Energy Regulatory Commission
33
Figure III-10. Large AMI deployments
1994
1996
1998
2000
2002
2004
2006
2008
0
2,000,000
4,000,000
6,000,000
8,000,000
10,000,000
12,000,000
14,000,000Broadband OverPower Lines
Power LineCommunicationsFixed RF
Pending
Grand Total
Source: UtiliPoint International
Figure III-10 illustrates that fixed RF had the majority of the market for system-wide deployments through 2002, but power line communications and broadband over power lines emerged as alternatives in 2004 and 2005. Two deployments of the advanced fixed RF systems are approaching large deployment status: Elster Electricity at Salt River Project (now approaching 75,000 endpoints) and Sensus/AMDS at Alabama Power Company (50,000 endpoints).
Costs and Benefits Associated with Advanced Metering Electric utility deployment of advanced metering will need to be cost-effective for the utilities and for their ratepayers. This section reviews recent information on the costs and benefits associated with advanced metering.
Costs of Deploying Advanced Metering The total capital cost of deploying AMI has not declined significantly even though the AMI and meter vendor revenue per meter has gradually declined by approximately 23 percent over the past 10 years. The total capital costs of deploying AMI include the hardware costs (meter modules, network infrastructure, and network management software for AMI system), as well as installation costs, meter data management, project management, and information technology integration costs. Examination of data obtained on 10 large AMI deployments over the last decade, suggests that AMI hardware costs have decreased during this time period. This trend can be seen in Figure III-11.

Chapter III – Advanced Metering Penetration
Assessment of Demand Response and Advanced Metering Federal Energy Regulatory Commission
34
Figure III-11. Total AMI capital and hardware costs per meter
$-
$50.00
$100.00
$150.00
$200.00
$250.00
1994 1996 1998 2000 2002 2004 2006 2008
Hardware Per MeterTotal Capital per Meter
Source: UtiliPoint International
In the late 1990’s, the hardware costs per meter averaged $99.74 By 2005/2006, the average hardware cost per meter had decreased to $76. The capital costs of installing the AMI communications infrastructure, in contrast, have stayed relatively constant except for the deployment at Jacksonville Electric Associates in 2001 (which included water and electric meters), generally bound by $125 per meter on the low end and $150 on the high end. Table III-4 below shows the hardware and total detailed data on each of the 10 deployments. There is considerably more expense and capital investment involved for a successful deployment of AMI than metering and AMI system components. Deployment costs include:
• Project management • Installation of meters and network • Meter data management • Information technology integration costs with meter data management and other systems
For the AMI deployments where both the hardware costs per meter and the total AMI capital cost per meter were available, the hardware costs per meter represented as low as 50 percent and as high as 70 percent of the total AMI capital costs. A study by Charles River Associates found that hardware costs represented only 45 percent of total costs (see Figure III-12 for a breakdown of AMI System Costs).
74 All dollar values are nominal dollars.

Chapter III – Advanced Metering Penetration
Assessment of Demand Response and Advanced Metering Federal Energy Regulatory Commission
35
Table III-4. AMI Cost Benchmarks
Utility Year Meters (millions)
Hardware (millions)
Total Capital (millions)
Hardware per meter
Total Capital per
Meter
DLCo 1996 0.6 $60 - $99.23 -
Virginia Power 1997 0.5 $44 - $97.78 -
PREPA 1998 1.3 $130 - $100.00 -
ENEL 2000 30.0 $2,673 - $89.10 -
JEA 2001 0.7 - $150 $214.29
PPL 2002 1.3 $112 $160 $86.15 $123.08
Bangor Hydro 2004 0.1 $7.50 $15.0 $68.18 $136.36
TXU 2005 0.3 $19 $38 $75.60 $150.00
PG&E 2005 9.8 $721 $1,328 $73.57 $135.48
SDG&E 2006 2.3 $199 $329 $86.43 $143.04 Source: Utilipoint International
Figure III-12. AMI System Cost Breakdown
20%
11%
15%
9%
45%
Endpoint Hardware
Network Hardware
Installation
Project Management
IT
Source: David Prins et. al. (CRA International), “Interval Metering Advanced Communications Study,” August 2005
Benefits Associated with Advanced Metering The deployment of advanced metering creates multiple benefits. These benefits include:
• Meter reading and customer service • Asset management • Value added services • Outage management • Financial

Chapter III – Advanced Metering Penetration
Assessment of Demand Response and Advanced Metering Federal Energy Regulatory Commission
36
This section presents the benefits that have been identified in the metering literature and from industry stakeholders.75
Utility Meter Reading and Customer Service Benefits Implementation of advanced metering or AMI can significantly reduce meter reading expenses and capital expenditures, and can also increase the accuracy and timeliness of meter reading and billing. In particular, eliminating estimated bills is a key driver for investment in automated meter data collection systems. Utilities rarely are able to estimate total consumption for a month accurately, even using weather and historical monthly consumption data. This is especially true for residential customers during vacations and customer moves (e.g., students attending college and returning home). Additional benefits include improved employee safety from the reduced need to visit customer facilities or enter customer premises, and reduced employee turnover and training needs. While many of these same meter readings can be achieved by automated meter reading, advanced metering allows additional benefits due to the ability to query the meter frequently, or as needed. For example, utilities need to report on sales on a monthly basis. Without actual meter readings, this is an estimate, and utilities have found this to be a labor intensive report to produce. With advanced metering, utilities can prepare this report using actual meter readings as of midnight on the last day of the month.
Asset Management Benefits Advanced metering can provide important information to assist in electric utility asset management. First, proper sizing of equipment, based on detailed and accurate data on customer demand and usage patterns can be a sizeable benefit for some utilities. In the past, operational managers have been at a disadvantage when defending their requests for capital investment in distribution equipment. Executive management could easily see the impact on the bottom line of the investment in terms of increased debt /capital spending, but operational managers did not always have good tools to demonstrate the corresponding value of making distribution capital expenditures. Advanced metering provides information that can be used to model the benefits and risks of not investing. In one case, Oklahoma Gas and Electric considered raising the load levels on distribution transformers. Using estimates for load that distribution transformers carried at peak times, similar to what can be developed using the information provided by advanced metering, it was clear to management that lowering the load levels on distribution transformers was the more prudent choice. Lowering load levels was selected even though it caused the utility to increase capital spending.76 The benefits of avoiding failures of distribution transformers outweighed the costs, something the operational managers had not been able to show without reliable estimates of peak load on transformers. Another key asset management benefit provided by advanced metering is the ability for electric utilities to more efficiently monitor and maintain the distribution equipment necessary to reliably deliver power to customers. These benefits include theft detection, improving cost allocation across the customer base, deferring investment, and predictive maintenance of equipment. Other asset management benefits include:
• Vegetation management
75 A recent meeting of the AMI-MDM Working Group, which focuses on meter data management issues associated with advanced metering, developed a comprehensive listing of benefits. This list of benefits can be found at www.amimdm.com. The discussion in this section draws from the ADM-MDM list.
76 Patti Harper-Slaboszewicz (UtiliPoint), “Distribution Planning – A Tale of Two Utilities,” November 2005.

Chapter III – Advanced Metering Penetration
Assessment of Demand Response and Advanced Metering Federal Energy Regulatory Commission
37
• Improved information on voltage levels at customer premises • Reduced manual testing of a sample of meters through built-in electronic meter self-
diagnostics
Ability to Offer Value-Added Services Advanced metering also provides benefits that are typically not available with manual meter reading or with AMR. These additional benefits include new or improved services that utilities can offer to customers with advanced metering, including additional rate options, flexible billing cycles, benchmarking of energy usage (especially important for commercial customers with similar set-ups in multiple locations), aggregation of accounts and/or synchronization of multiple account billing and meter reading, web services based on the more timely information provided by advanced metering, and bill prediction for large and small customers, including weather forecast data. With timely access to data, customer service representatives can also use interval data to more easily explain why bills are higher than expected. The interval data will show not only the total usage for each day but also when it was used.
Outage Management Benefits Advanced metering can provide outage management benefits if configured appropriately. The most important benefit from the implementation of advanced metering in outage management is during restoration. After the work crews finish the first round of repairs, utilities can use advanced metering on customer premises to check for additional problems before work crews leave the area. This avoids needing to recall work crews to fix problems not handled in the first round of repairs, and can allow power to be restored faster. Another important benefit is to verify an outage before sending a truck to respond to the outage by checking for power to customer meters. The problem could be on the customer side of the meter. Utilities achieve cost savings by not dispatching a truck unnecessarily, and the customer can begin effecting repairs faster if the problem is on their side of the meter. Responding faster to small outages is another important benefit, especially in terms of improving customer service and improving regulatory relations. Utilities can restore power faster and often during regular hours, and customers are not faced with reporting the outage and then waiting for repairs to be made. Over time, utilities expect that, as customers learn that the AMI system send information on outages to the utility, call center volume during outages will be significantly reduced. When customers do call in, utilities will be able to provide a better estimate of repair times.
Financial Benefits Financial benefits accrue not only from utility efficiency gains, but also indirectly from complaints and faster service restoration. For example, faster restoration and shorter outages may result in better outage metrics, which in turn may impact the earnings of some utilities. Improved cash flow stems from reducing the time it takes the utility to produce a bill after the meter is read. Before advanced metering, the average time for read-to-bill date is three to five days, and with advanced metering, this usually drops to one or two days.
Benefit Estimates A key issue is how to quantify the benefits listed above. According to Gary Fauth and Michael Wiebe:

Chapter III – Advanced Metering Penetration
Assessment of Demand Response and Advanced Metering Federal Energy Regulatory Commission
38
Properly measured, AMR benefits can amount to between $1.35 and $3.00 per customer per month, over the useful life of the hardware. In contrast, AMR in many situations can cost $1.25 to $1.75 per customer per month, measured over the useful life of the hardware and including both capital and operating costs. These cost and benefit numbers by themselves produce a positive business case outcome in most cases. Business cases for AMR can produce internal rates of return ranging from 15 to 20% and payback periods of less than six years.77
Utilities have reported significant benefits associated with improved outage management. For example, PPL, a large investor owned utility in Pennsylvania, has achieved savings of 10 percent in restoration costs after large outages.78 PPL also reported that it has reduced the number of estimated bills from an average of four to six percent of the total number of bills it processes to less than one percent. Ameren has achieved savings of $2 million annually by using its AMI system to measure the load on its distribution transformers at the system peak, and by reducing the size and inventory of transformers.79 Bangor Hydro’s AMI system saved time and money by eliminating a problem where customers would call and report an outage before traveling to remote fishing camps to avoid having to wait for service crews should there be an outage. Now, if customers call, the utility can immediately verify power to the meter before the customer leaves home. In another example, PG&E has estimated it makes 48,000 truck rolls each year for single no-outage calls, and could save $4.3 million annually with AMI.80
Data from PG&E’s AMI business case suggests that savings associated with meter reading are only a part of the benefits that can be achieved with AMI. PG&E has estimated that 46 percent of the benefits that they estimated in their business case were unrelated to meter reading.
Current Issues Associated with Advanced Metering While there are benefits to advanced metering and AMI, there is not universal attraction to its implementation. What follows is an identification and discussion of issues associated with advanced metering and AMI.
AMI specifications Most requests for proposals (RFPs) from electric utilities now include a requirement for delivering interval data, at least hourly, for all meters connected to the network on a daily basis. The requirement for interval data for all customers is relatively new, and reflects the increased functionality and performance of AMI products on the market. However, billing and settlement requirements in organized wholesale markets may influence what utilities specify in their RFPs. If wholesale settlement is based on 15 minute interval profiles, utilities may be more likely to ask for 15 minute intervals for all customers. While the need to support time-based rates may prompt regulators to support an investment in AMI, the requirements for AMI are usually based on other considerations,
77 Gary Fauth and Michael Wiebe, “Fixed-Network AMR: Lessons for Building the Best Business Case”, AMRA
newsletter, September 2004, 5. 78 David Prins, et al. (CRA), “Interval Metering Advanced Communications Study,” August 2005, 24. 79 Prins, et al., 25. 80 Prins, et al., 24.

Chapter III – Advanced Metering Penetration
Assessment of Demand Response and Advanced Metering Federal Energy Regulatory Commission
39
such as operational efficiencies and wholesale settlement. Consequently, consistent AMI specifications may be difficult to achieve in the near-term.
Advanced Metering and Price Responsive Demand Response Networks With advanced metering, utilities can offer customers a variety of time-based rates, either charging higher prices when wholesale prices are high or offering rebates when customers reduce energy consumption during times of high prices, often called critical peak periods. AMI provides the information necessary to support the billing process and gives customers timely updates on their energy use and bills. An open question that is being discussed, is whether the AMI system should be used to provide price signals or notification of system emergencies. In some cases, the AMI system itself will likely provide the communication backbone to transmit signals to the end-use controllers, and in other cases, other networks will be used. If the AMI system is selected to transmit the signal to an appliance, the signal will not necessarily travel through the meter. An appliance such as a load control device may be designed to be treated as another node on the system, and communicate independently of the meter. Alternatively, the signal may be relayed to the load control device through another node on the system, such as the data collector or tower. A number of utilities use networks other than AMI systems to communicate with smart thermostats81 (see Figure III-13 for an example smart thermostat) and other load control devices, such as paging or FM radio. The California Energy Commission (CEC) is currently considering revising the building codes to require smart thermostats. As part of this proposal, the CEC is proposing sending a one-way broadcast signal using FM radio to smart thermostats, but the three investor-owned utilities in California did not support this concept as the only communication option. Rather, the utilities indicated that they wanted to use their AMI systems, once installed, for controlling these devices.82
Figure III-13. Example of a Smart Thermostat
Source: Comverge
81 The temperature settings on smart thermostats, also known as programmable communicating thermostats (PCT),
can be remotely adjusted through signals from a central controller or by a customer. 82 Committee Workshop, California Energy Resources Conservation and Development Commission, Feb. 13,
2006.

Chapter III – Advanced Metering Penetration
Assessment of Demand Response and Advanced Metering Federal Energy Regulatory Commission
40
Other jurisdictions are having similar discussions, and the industry has not yet decided on a consistent approach for integrating smart thermostats and dedicated customer display devices into AMI. For regions with significant retail activity, the picture is more complex because electric distribution companies will likely be the owners of the AMI systems, but they may not necessarily be the entities offering demand response programs. This lack of consistency may complicate future deployments of equipment and procedues until standard approaches are adopted.
Providing Timely Information to Customers The provision of timely, useful information to residential and commercial customers can assist customers in responding to time-based rates and to otherwise help in managing their energy costs. However, the degree to which customers use this information and the vehicle for providing the information is at issue. For customers with central air conditioning or heating, the trend is to use the smart thermostat as a customer display device to provide information on the current price in effect, whether a critical peak period is in effect, and other information specific to controlling the temperature within the home.83 The example smart thermostat in Figure III-13 can provide price information. There is also interest in providing customers with daily bill updates which could also be displayed on smart thermostats.84 The thermostat vendors have modified the design of thermostats to accommodate price responsive demand response programs, providing a large screen on the smart thermostat that can display a variety of information for customers. For those without central air conditioning or heating, what information to provide to customers is still being explored, as well has how to provide the information. Utilities that have posted usage information on websites have reported that few customers take advantage of the service, and of those that do, most visit the site only once or twice. Customers have indicated in several studies that they prefer to receive information about their energy usage with their bill.85 Utilities are also considering providing or offering customers dedicated in-home display devices. Utilities will likely continue to post information on line for those interested, and over time, it is expected that the industry will learn what information customers find useful to manage their energy bills.86 Results from the FERC Survey suggest that only a tiny fraction of U.S. electricity customers receive interval usage information by any means, and the smallest proportion can view their usage via the AMI system. The FERC Survey asked how many customers had access to hourly interval data and the ways in which they receive that information. Figure III-14 displays the survey results. 760 entities responded to this question while 310 entities said that at least one customer receives interval usage
83 The CEC is pursuing this approach in California and is currently considering revising building standards to require a PCT wherever a setback thermostat is currently required. Using the PCT as a display device avoids the need for a dedicated in-home display device, and the customers already associate the PCT with energy.
84 Providing customers with a daily bill update is part of the design of the SmartPowerDC program, a new dynamic pricing pilot in the District of Columbia. The SmartPowerDC program is managed by the Smart Meter Pilot Project (SMPPI). SMPPI is a non-profit corporation with a board membership of Pepco, the DC commission, two consumer advocacy groups, and the meter readers union.
85 Idaho Power reported these findings based on their dynamic pricing pilot in 2006. 86 Vendors are developing in-home display devices in response to utility interest. Some are similar to PCTs except
that the device is not also a thermostat. Another version is to glow different colors depending on the current price. See Committee Workshop Before the California Energy Resources Conservation and Development Commission, In the Matter of Systems Integration Framework Programmable Communicating Thermostat (PCT), Feb. 16, 2006.
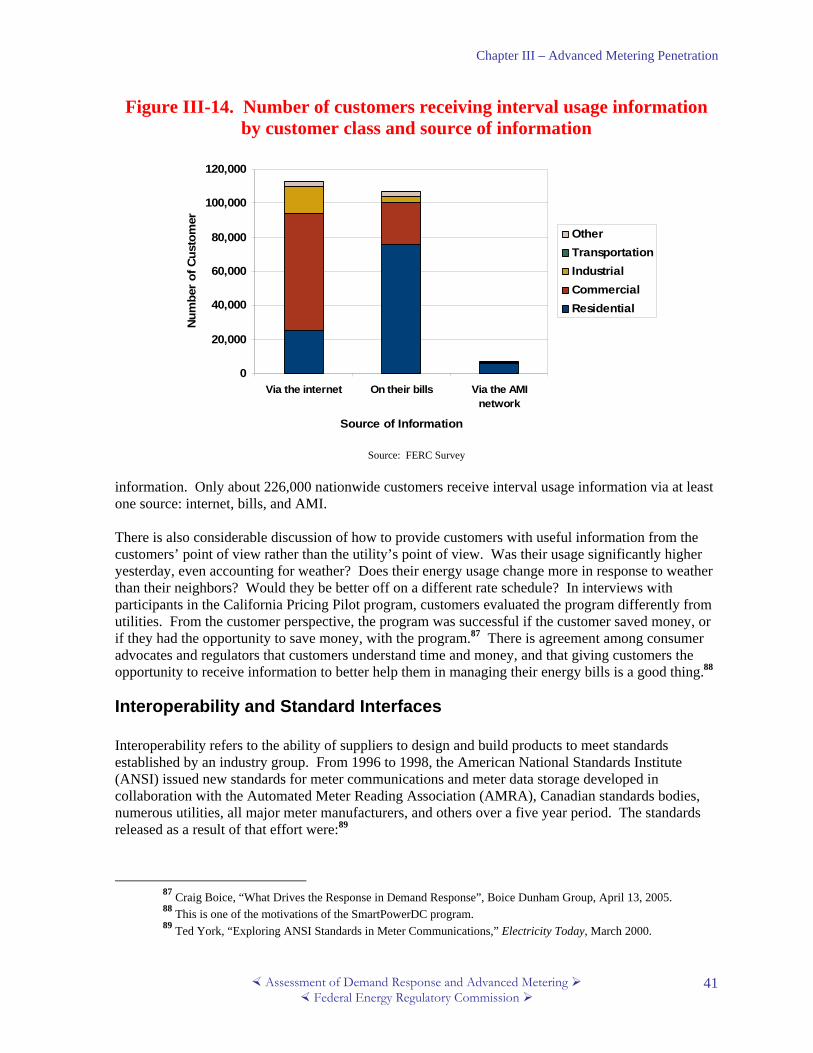
Chapter III – Advanced Metering Penetration
Assessment of Demand Response and Advanced Metering Federal Energy Regulatory Commission
41
Figure III-14. Number of customers receiving interval usage information by customer class and source of information
0
20,000
40,000
60,000
80,000
100,000
120,000
Via the internet On their bills Via the AMInetwork
Source of Information
Num
ber o
f Cus
tom
er
OtherTransportationIndustrialCommercialResidential
Source: FERC Survey
information. Only about 226,000 nationwide customers receive interval usage information via at least one source: internet, bills, and AMI. There is also considerable discussion of how to provide customers with useful information from the customers’ point of view rather than the utility’s point of view. Was their usage significantly higher yesterday, even accounting for weather? Does their energy usage change more in response to weather than their neighbors? Would they be better off on a different rate schedule? In interviews with participants in the California Pricing Pilot program, customers evaluated the program differently from utilities. From the customer perspective, the program was successful if the customer saved money, or if they had the opportunity to save money, with the program.87 There is agreement among consumer advocates and regulators that customers understand time and money, and that giving customers the opportunity to receive information to better help them in managing their energy bills is a good thing.88
Interoperability and Standard Interfaces Interoperability refers to the ability of suppliers to design and build products to meet standards established by an industry group. From 1996 to 1998, the American National Standards Institute (ANSI) issued new standards for meter communications and meter data storage developed in collaboration with the Automated Meter Reading Association (AMRA), Canadian standards bodies, numerous utilities, all major meter manufacturers, and others over a five year period. The standards released as a result of that effort were:89
87 Craig Boice, “What Drives the Response in Demand Response”, Boice Dunham Group, April 13, 2005. 88 This is one of the motivations of the SmartPowerDC program. 89 Ted York, “Exploring ANSI Standards in Meter Communications,” Electricity Today, March 2000.

Chapter III – Advanced Metering Penetration
Assessment of Demand Response and Advanced Metering Federal Energy Regulatory Commission
42
• C12.18 - 1996 Protocol Specification for ANSI Type 2 Optical Port o For reading a meter using infrared optical port when data stored in tables as specified
in C12.19 • C12.19 - 1997 Utility Industry End Device Tables
o This standard defines a set of flexible data structures for use in metering products, including the option of including vendor defined tables
• ANSI C12.21-1998 Protocol Specification for Telephone Modem Communication o This extends the C12.18 and C12.19 to telephone modem communications
The next step, ANSI C12.22 - Protocol Specification for Interfacing to Data Communications Networks, covers network communications, which is pertinent to communicating with meters over a network as opposed to point-to-point communications.90 The adoption of the new standard (expected by the end of the year) and the recent announcement by Itron that its new AMI system will conform to the standard will put pressure on other AMI vendors to adapt their systems to conform as well. For the moment, even though some utilities have expressed an interest in open standards, which is consistent with C12.22, it has not been a major factor in recent AMI selections. That is likely to change, as evidenced by SCE and SDG&E. SCE has listed open protocols to be a requirement of AMI,91 and of interest by SDG&E in their latest filing on AMI. However, SDG&E also noted that “Any new AMI technologies or new market product offerings would need to provide SDG&E customers with additional value and functionality or reduced costs such that the net incremental benefits from the potential new technology or offering exceeds the cost to convert or change from the selected SDG&E AMI solution set(s).”92 This suggests that SDG&E would evaluate a new product with open standards to see if the value of the new product exceeds the cost of using the new product. For SDG&E, open standards is a feature of AMI, whereas for SCE it is a requirement. These two utilities illustrate the different attitudes toward open standards. There is a clear consensus on the need for standard interfaces between systems, such as between the host AMI system and MDM, and between MDM and other utility data systems. This would also apply to interfaces with DR networks and systems. 93
Security Utilities need to take reasonable precautions to protect customer privacy, and to maintain the security of the grid. Monthly meter reads are not regarded as particularly valuable other than for generating a customer bill. Hourly meter reads, especially when viewed over a long time span, can provide a significant amount of information about customers. Interval data stored to provide a history of energy use must be secure from unauthorized use.
90 Point-to-point communications includes using a hand-held device to read the meter, covered in ANSI c12.18, or
telephone modem communications, covered in ANSI c12.21. Network communications involve communications of one-to-many, or many-to-many, as are involved with advanced metering.
91 “Advanced Metering Infrastructure -- Frequently asked questions,” and “Why is SCE interested in an AMI solution using open standards and interoperability,” available at http://www.sce.com/PowerandEnvironment/ami/faqs/.
92 Chapter 8 Summary of AMI Implementation and Operations, Prepared Supplemental, Consolidating, Superseding and Replacement Testimony of Ted Reguly, San Diego Gas & Electric Company before The Public Utilities Commission of the State of California, March 28, 2006.
93 EnerNex Corporation, “Advanced Metering and Demand Responsive Infrastructure: A Summary of the PIER/CEC Reference Design, Related Research and Key Findings Draft,” prepared for California Energy Commission, June 1, 2005.

Chapter III – Advanced Metering Penetration
Assessment of Demand Response and Advanced Metering Federal Energy Regulatory Commission
43
There is disagreement regarding the level of security that is required when meter data is transmitted from the endpoint to the AMI host system. The discussions that have taken place in various industry groups94 on standard interfaces within the AMI system have addressed security requirements, including discussions on encryption, verification of successful communication, and verification of identity of devices. The overall goal is to ensure that only authorized devices provide and receive meter data, and that unauthorized devices are not able to provide or receive meter data. 95
Costs and Benefits to Include in Business Case Analyses Recent examinations of the business case for advanced metering have used a wide variety of costs and benefits in their assessments.96 For example, some business cases include demand response as an explicit benefit, while others do not. These differences make it difficult for retail rate regulators to compare proposals and deployments across electric utilities under their review, and for electric utilities to comprehensively judge whether they should deploy advanced metering.97
94 Various industry groups discussing reference designs, standards, and best practices such as OpenAMI,
UtilityAMI, IntelliGrid, and AMI MDM have discussed security of customer meter data. 95 Paul DeMartini (SCE), FERC Technical Conference, transcript, 89:10-90:13, 109:12-110:9; and Chris King,
(eMeter), transcript, 106:22-107:5. 96 See Chapter 2, “AMI Business Vision, Policy and Methodology”, Prepared Supplemental, Consolidating,
Superseding and Replacement Testimony of Edward Fong, San Diego Gas & Electric Company, before The Public Utilities Commission of the State of California, Mar. 28, 2006, TR-7. SDG&E included DR benefits in their business case. See also “Section I Advanced Metering Infrastructure Project A.05-06-028 - Supplemental Testimony Pacific Gas and Electric Company Chapter 1 AMI Project and Project Management,” Application 05-06-028, filed October 13, 2005 with the California Public Utilities Commission. PG&E did not explicitly include DR benefits in their business case filing, but estimated that DR benefits would provide enough benefits to make the AMI investment worthwhile.
97 Recent work by McKinsey & Company, Inc. with vendors, utilities, consultants and regulators has resulted in a consensus, pro forma modeling platform for business case development. This business case model is still under development, and will be made public at energydelivery.mckinsey.com.

Chapter III – Advanced Metering Penetration
Assessment of Demand Response and Advanced Metering Federal Energy Regulatory Commission
44

Chapter IV – Existing Demand Response and Time-Based Rates
Assessment of Demand Response and Advanced Metering Federal Energy Regulatory Commission
45
Chapter IV. Existing Demand Response Programs and Time-Based Rates
This chapter addresses the second area, in EPAct Section 1252(e)(3), that Congress directed the Commission to consider:
(B) existing demand response programs and time-based rate programs. The discussion within this chapter reviews the various demand response programs and time-based rate options currently in existence. In addition to reviewing these programs, the results of the first-of-its-kind, comprehensive FERC Demand Response and Advanced Metering Survey98 (FERC Survey) were used to determine how prevalent these programs and rates are nationally and regionally. The results of this survey suggest that the use of demand response is not widespread. Only approximately five percent of customers are on some form of rate-based or incentive-based program. The most common demand response programs offered are direct load control programs, interruptible/curtailable tariffs, and time-of-use rates. This chapter is organized into six sections and builds on the discussion of demand response and time-based rate programs included in Chapter II. These sections include:
• Discussion of incentive-based demand programs • Discussion of time-based demand response programs • Results from FERC Survey on the use of demand response • Motivations for industry and customer interest in demand response programs • Issues and challenges associated with implementing demand response programs • Demand response activities at the state, regional, and federal level
Incentive-Based Demand Response Programs The first form of demand response includes an inducement or incentive for customer participation, instead of the direct price signals associated with time-based rates. Because they do not rely on direct responses of customers to prices, which is difficult to measure or predict, incentive-based demand response programs provide a more active tool for load-serving entities, electric utilities, or grid operators to manage their costs and maintain reliability. The types of incentive-based programs that exist include:
• Direct load control • Interruptible/curtailable rates • Demand bidding/buyback programs • Emergency demand response programs • Capacity market programs • Ancillary-service market programs
98 See Appendix F for a description of the FERC Survey.

Chapter IV – Existing Demand Response and Time-Based Rates
Assessment of Demand Response and Advanced Metering Federal Energy Regulatory Commission
46
This section reviews these programs, and explores implementation experience with these programs.
Direct Load Control Direct load control (DLC) programs refer to programs in which a utility or system operator remotely shuts down or cycles a customer’s electrical equipment on short notice to address system or local reliability contingencies in exchange for an incentive payment or bill credit. Operation of DLC typically occurs during the times of system peak demand. However, DLC is also operated when economic to avoid high on-peak electricity purchases.
DLC has been in operation for at least two decades. A variety of utilities developed and deployed large programs in the late 1960s,99 and expanded those programs significantly during the 1980s and 1990s. By 1985, 175 residential customer direct-load control projects and 99 commercial projects were in place at electric utilities.100 The FERC Survey found that 234 utilities reported direct load-control programs. Florida Power & Light has implemented the largest program, with 740,570 customers.
The most common form of DLC is a program that cycles the operation of appliances such as air-conditioners or water heaters. In these programs, a one-way remote switch (also known as a digital control receiver) is connected to the condensing unit of an air conditioner or to the immersion element in a water heater. By remotely switching off the load at the appliance, peak loads can be reduced. Although the actual reductions vary by size of the appliance, customer usage patterns, and climate, the demand reductions for each air conditioner is about 1 kW and for water heaters about 0.6 kW. The operation of the switch is controlled through radio signals (for older systems) or through digital paging. Depending on the duty cycle selected, the switch turns off the condensing unit or element for the full duration of an event or for various fractions of an hour (e.g., a common duty cycle is 15 minutes off during an hour). DLC programs also typically limit the number of times or hours that the customer’s appliance can be turned off per year or season.
In recent years, remote switches have become more sophisticated through new technologies. Virtually all of the new switches are individually addressable, meaning that individual switches can be controlled independently. This allows more targeted reductions to address localized problems. Software upgrades can now be done wirelessly and communication with switches can be conducted using public paging networks instead of building and maintaining expensive communications networks. Most switches also contain multiple relays so that air conditioners and water heaters can be controlled by the same switch with independent control strategies for each relay.
In addition, remote control of individual appliances is being supplanted by remote control of smart, or programmable, communicating thermostats in recently implemented programs. DLC programs that use these smart thermostats, such the Long Island Power Authority’s LIPA Edge program, remotely adjust the temperature settings on the thermostats. During the summer the utility can remotely adjust the temperature upward to reduce demand. After an event, the temperature setting is readjusted to the pre-event, customer-selected level. Some smart thermostat programs also provide the customer the ability to change the thermostat settings through the Internet.
99 According to the EPRI, Detroit Edison was the first utility to implement a load control program in 1968, EPRI,
The Demand-Side Management Information Directory, EPRI EM-4326, 1985. 100 EPRI EM-4326, 3-2.
Chapter IV – Existing Demand Response and Time-Based Rates
Assessment of Demand Response and Advanced Metering Federal Energy Regulatory Commission
47
While DLC has been an important demand response resource for many years, and while several utilities have recently implemented or increased the size of programs, several key utilities have been mothballing or phasing out their programs, especially in restructured states. For example, since load management was designated a competitive service in the Texas restructuring act, CenterPoint Energy Houston Electric’s air conditioner cycling program was sold and eventually shut down. Similarly, Pepco suspended its Kilowatchers Club air conditioner cycling program after it sold its generation assets when Maryland’s electric sector was restructured. There is also concern that the equipment in older programs operated by many utilities is aging and degrading.101
Interruptible/Curtailable Rates Customers on interruptible/curtailable service rates/tariffs receive a rate discount or bill credit in exchange for agreeing to reduce load during system contingencies. If customers do not curtail, they can be penalized. Interruptible/curtailable tariffs differ from the emergency demand response and capacity-program alternatives because they are typically offered by an electric utility or load-serving entity, and the utility/load serving entity (LSE) has the ability to implement the program when necessary.
Interruptible/curtailable tariffs are generally filed tariffs with regulatory commissions and offered to a utility’s largest customers. Typical minimum customer sizes to be eligible for interruptible/curtailable tariffs range from 200 kW for the base interruptible program in California to 3 MW in American Electric Power’s (AEP) Ohio service territory. Customers on these rates agree to either curtail a specific block of electric load or curtail their consumption to a pre-specified level. Customers on these rates typically must curtail within 30 to 60 minutes of being notified by the utility. The number of times or hours that a utility can call interruptions is capped (e.g., AEP-Ohio will not call its interruptible/curtailable customers more than 50 hours during any season).102 In exchange for the obligation to curtail load, interruptible/curtailable tariff customers receive either discounted rates or a bill credit when they curtail.
Interruptible programs are also not for all customers. In particular, customers with 24 hour-a-day, seven-days-a-week operations or continuous processes (e.g., silicon chip production) are not good candidates. Similarly, schools, hospitals, and other customers that have an obligation to continue providing service are also not good candidates.
While interruptible/curtailable tariffs have been in place for decades, there is concern amongst resource planners about whether interruptible/curtailable tariffs provide a reliable and sustainable resource. The number of customers taking interruptible/curtailable tariffs from utilities has dropped in the last decade.103 The cause for this drop is a combination of the impacts of restructuring, reductions in price discounts associated with interruptible/curtailable tariffs due to the current excess capacity in much of the country, and customer departure because of perceived risk.
101 Frank Magnotti, Comverge, presentation to MADRI Workshop, June 2006, 3. 102 During that winter of 2000-2001, as of January 22, 2001, PG&E had exhausted its interruptible program, having
called upon 140 customers for 100 hours each. Jane M. Clemmensen, “Californians Facing a Power-Strapped Summer,” EC&M, April 1, 2001.
103 See the experience in California -- Charles A. Goldman, Joseph H. Eto, and Galen L. Barbose, California Customer Load Reductions during the Electricity Crisis: Did they Help to Keep the Lights On?, Lawrence Berkeley National Laboratory: LBNL-49733, May 2002.
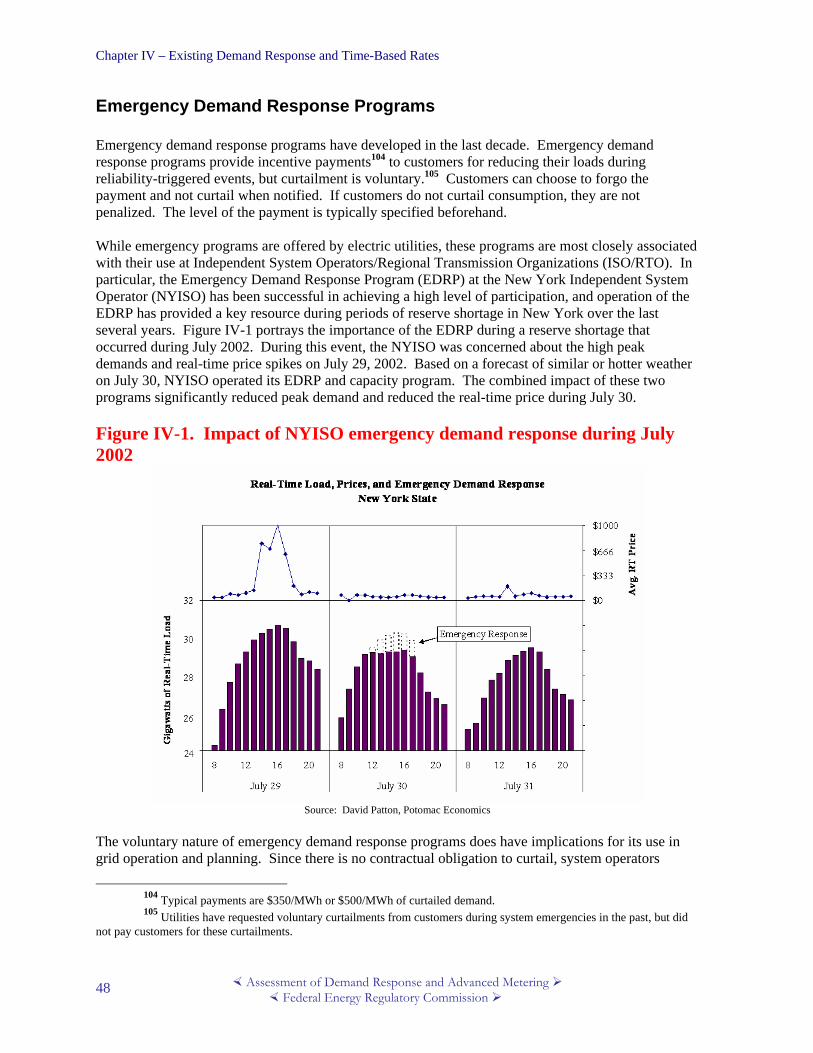
Chapter IV – Existing Demand Response and Time-Based Rates
Assessment of Demand Response and Advanced Metering Federal Energy Regulatory Commission
48
Emergency Demand Response Programs Emergency demand response programs have developed in the last decade. Emergency demand response programs provide incentive payments104 to customers for reducing their loads during reliability-triggered events, but curtailment is voluntary.105 Customers can choose to forgo the payment and not curtail when notified. If customers do not curtail consumption, they are not penalized. The level of the payment is typically specified beforehand.
While emergency programs are offered by electric utilities, these programs are most closely associated with their use at Independent System Operators/Regional Transmission Organizations (ISO/RTO). In particular, the Emergency Demand Response Program (EDRP) at the New York Independent System Operator (NYISO) has been successful in achieving a high level of participation, and operation of the EDRP has provided a key resource during periods of reserve shortage in New York over the last several years. Figure IV-1 portrays the importance of the EDRP during a reserve shortage that occurred during July 2002. During this event, the NYISO was concerned about the high peak demands and real-time price spikes on July 29, 2002. Based on a forecast of similar or hotter weather on July 30, NYISO operated its EDRP and capacity program. The combined impact of these two programs significantly reduced peak demand and reduced the real-time price during July 30. Figure IV-1. Impact of NYISO emergency demand response during July 2002
Source: David Patton, Potomac Economics
The voluntary nature of emergency demand response programs does have implications for its use in grid operation and planning. Since there is no contractual obligation to curtail, system operators
104 Typical payments are $350/MWh or $500/MWh of curtailed demand. 105 Utilities have requested voluntary curtailments from customers during system emergencies in the past, but did
not pay customers for these curtailments.
Chapter IV – Existing Demand Response and Time-Based Rates
Assessment of Demand Response and Advanced Metering Federal Energy Regulatory Commission
49
cannot accurately forecast how much load curtailment will occur when the program is activated. Consequently, participants in these programs do not receive capacity payments.
Capacity-Market Programs In capacity-market programs, customers commit to providing pre-specified load reductions when system contingencies arise, and are subject to penalties if they do not curtail when directed. Capacity-market programs can be viewed as a form of insurance. In exchange for being obligated to curtail load when directed, participants receive guaranteed payments (i.e., insurance premiums). Just like with insurance, in some years load curtailments will be not be called, even though participants are paid to be on call. Capacity market programs are typically offered by wholesale market providers such as ISOs/RTOs that operate installed capacity (ICAP) markets, and are the organized market analog of interruptible/curtailable tariffs.
In addition to agreeing to the obligation to curtail, capacity-market program eligibility is based on a demonstration that the reductions are sustainable and achievable. For example, the requirements to receive capacity payments in NYISO’s Special Case Resources program are: minimum load reductions of 100 kW, minimum four-hour reduction, two-hour notification, and to be subject to one test or audit per capability period.106 These requirements are designed to ensure that the reductions can be counted upon when they are called. LSEs that have programs or offerings that meet the eligibility requirements can receive capacity credits or count the capacity toward ICAP requirements.
ISO/RTO capacity programs have been important resources in recent years. NYISO operated the Special Case Resources program during the July 30, 2002, reserve shortage event (displayed in Figure IV-1), and relied on Special Case Resources to help restore power after the August 14, 2003, blackout. The ISO New England (ISO-NE) relied upon its capacity program assets to forestall rolling blackouts in southwest Connecticut during the summer 2005 heat wave. The PJM Interconnection (PJM) relied on demand response assets in its Active Load Management program in the Baltimore-Washington region during the same heat wave.
Many curtailment service providers (CSPs) and customers prefer these programs because they provide guaranteed payments, instead of the prospect of uncertain payments. Grid operators like the capacity programs because they represent a firm resource that can be implemented quickly.107 The level of the capacity payments that have been offered in NYISO and ISO-NE (e.g., $14/kW-month in the 2005-06 ISO-NE Winter Supplemental Program) have contributed to increased customer interest.108
Demand Bidding/Buyback Programs One of the newest types of incentive-based demand response programs is the demand bidding/buyback program. Demand bidding/buyback programs encourage large customers to offer to provide load reductions at a price at which they are willing to be curtailed, or to identify how much load they would
106 NYISO, Installed Capacity Manual, section 4.12. 107 For example, in anticipation of a cold winter and natural gas shortages in New England, ISO-NE implemented a
winter supplemental capacity program in December 2005. Curtailment service providers were able to enroll more than 333 MW of new demand-response capacity by January 18, 2006. http://www.iso-ne.com/committees/comm_wkgrps/mrkts_comm/dr_wkgrp/mtrls/2006/feb12006/winter_supplemental_program_update_02-01-2006.ppt
108 See http://www.iso-ne.com/genrtion_resrcs/dr/sp_proj/wntr/wsp_factsheet_120105.pdf. In areas such as PJM where the value of capacity is lower, the applicable capacity program has not been as successful.
Chapter IV – Existing Demand Response and Time-Based Rates
Assessment of Demand Response and Advanced Metering Federal Energy Regulatory Commission
50
be willing to curtail at posted prices. These demand-bidding programs provide a means to elicit price-responsiveness when prices begin to increase. Both vertically integrated utilities and ISOs/RTOs operate these programs. If customer bids are cheaper than alternative supply options or bids, the load curtailments are dispatched and customers are obligated to curtail their consumption. These programs are attractive to many customers because they allow the customer to stay on fixed rates, but receive higher payments for their load reductions when wholesale prices are high. Customers, who are not on time-based rates, can use the demand-bidding programs to receive value for their reductions. Otherwise, these customers are on fixed retail rates.
The most well-known forms of demand-bidding programs are operated by the ISOs. There are two forms of these programs. The first incorporates demand bids directly into the optimization and scheduling process. In programs such as NYISO’s Day-Ahead Demand Response Program (DADRP), customers typically bid a price at which they would be willing to curtail their load and the level of curtailment in MW on a day-ahead basis. If these bids are selected for operation during the security-constrained dispatch process, then customers must execute the curtailment the next day. If they do not reduce their load, they are subject to a penalty. In the second form of demand bidding, the customer acts as price-taker. A good example of this program is the Real-Time Price Response Program at the ISO-NE. When participants in this program reduce consumption when notified, they receive the market-clearing price, whatever it may be, as payment. The ISOs have suggested that demand-bidding programs are transitional programs that will be supplanted by retail pricing that reflects and signals wholesale prices. The stated goal of the PJM Economic Program is to “provide a program offering that will help in the transition to an eventual permanent market structure whereby customers do not require subsidies to participate but where customers see and react to market signals or where customers enter into contracts with intermediaries who see and react to market signals on their behalf.”109
Electric utilities also operate demand-bidding programs. While several of these programs (e.g., Con Edison’s Day Ahead Demand Reduction Program) are designed to aggregate customers for participation in ISO demand-bidding programs, several utilities operate these programs to meet their own resource needs. For example, WE Energies has operated the Power Market Incentives program for several years. In this program, the utility identifies how much it is willing to pay for load curtailments. Participating customers respond to this request and if they are accepted they are obligated to reduce their consumption. Nevertheless, operation of these demand bidding/buyback programs has been the subject of controversy, particularly over the issue of who is responsible for the costs associated with successful bids. A 2002 National Association of Regulatory Utility Commissioners (NARUC) report examined this controversy and concluded that there was no consensus on the issue and additional effort would be needed to examine the issue.110 The issue is still active in 2006, particularly in PJM, where discussions continue to determine the size of the incentive provided in PJM’s Economic Program. For example, in a recent case, AEP asserted that “while, in certain circumstances, incentives may be effective to launch a program, the continued use of economic incentives for a permanent program is inappropriate. This issue needs to be addressed now rather than ignored in order to avoid a program
109 PJM, Market Monitoring Unit, 2004 State of the Market, March 8, 2005, 87. 110 David Kathan, Policy and Technical Issues Associated with ISO Demand Response Programs, prepared for
NARUC, 2002.

Chapter IV – Existing Demand Response and Time-Based Rates
Assessment of Demand Response and Advanced Metering Federal Energy Regulatory Commission
51
that cannot stand on its own merits.”111 PJM intends to complete these stakeholder discussions within the year.
Ancillary Services The final type of incentive-based demand response is ancillary-service market programs. Ancillary-services programs allow customers to bid load curtailments in ISO/RTO markets as operating reserves. If their bids are accepted, they are paid the market price for committing to be on standby. If their load curtailments are needed, they are called by the ISO/RTO, and may be paid the spot market energy price.112
In order to participate in ancillary-service markets, customers must be able to adjust load quickly when a reliability event occurs. The response duration depends on the nature of the event and the type of reserve being supplied, but is typically provided in minutes rather than the hours required when peak shaving or responding to price signals. There is typically a higher minimum size for reductions and customers are required to install advanced real-time telemetry. These short timeframes and program requirements limit the type of resources that can participate. These resources could include large industrial processes that can be safely curtailed quickly without harm to equipment, such as air products or electric-arc steel furnaces, large water pumping load, or remote automatic control of appliances such as air conditioners.113 At present, only the CAISO and ERCOT allow a limited amount of demand response to participate in their ancillary-services markets. The Participating Load Program at the CAISO allows qualifying loads to bid directly into the CAISO non-spin and replacement reserve and supplemental energy markets. At present the primary resource in the Participating Load Program is the large water pumps operated by the California Department of Water Resources. The Loads Acting as a Resource (LaaR) program in ERCOT currently provides more than 1,800 MW of responsive reserves through automatic under frequency relays. In order to qualify as a LaaR, the load, breaker status, and relay status must have real-time telemetry to ERCOT.
PJM, ISO-NE, and NYISO are in various stages of the development of allowing demand response to participate in ancillary-service markets. While ISO-NE and NYISO are still in the process of implementing the software and optimization changes necessary to allow demand to provide reserves, PJM began allowing demand response to provide synchronized reserves on May 1, 2006.
Time-Based Rate Programs The second form of demand response is time-based rate programs. Historically, utilities offered small, or low-volume, commercial and residential customers a flat rate based on their average cost of serving that customer class. These flat rates were developed based on historical regulatory principles of rate design that were originally articulated by noted utility rate expert, James Bonbright. According to Bonbright, rates should be fair, simple, acceptable, effective, equitable, nondiscriminatory, and
111 AEP, comments filed in Docket ER06-406, January 18, 2006. 112 The role of demand response resources in providing ancillary services is discussed in greater detail in Chapter
VI. 113 See Brendan J. Kirby, Spinning Reserve From Responsive Loads, Oak Ridge National Laboratory: ORNL/TM-
2003/19, March 2003, for a discussion of how residential direct load control programs are capable of meeting 10-minute operating reserve rules.

Chapter IV – Existing Demand Response and Time-Based Rates
Assessment of Demand Response and Advanced Metering Federal Energy Regulatory Commission
52
efficient.114 The regulatory process balances these principles, which reflect the competing interests of customers, utilities, and social justice.115
Utilities or other LSEs buy the power to serve these customers through a combination of long-term contracts, ownership of generating plants, or purchases on the spot wholesale markets (based on day-ahead or day-of, or real-time, electricity prices). Since prices of electricity have locational and/or time-based differences, an average price for all customers needs to build in a risk premium for the supplier, who bears the risk of price volatility in wholesale markets.116 Economists and policy-makers increasingly have been arguing in favor of time-based rates (also known as dynamic pricing) for retail customers, a practice that can link wholesale and retail markets. The primary objective of incorporating time-based rates in retail electric markets is to send price signals to customers that reflect the underlying costs of production. By exposing at least some customers to prices based on these marginal production costs, resources can be allocated more efficiently.117 Furthermore, price-based demand response can be used by retail providers in both restructured and non-restructured states to reduce or shape customer demand to balance electricity use and overall costs. Alternatively, flat electricity prices based on average costs, according to the U.S. Department of Energy (DOE), can lead customers to “over-consume – relative to an optimally efficient system in hours when electricity prices are higher than the average rates, and under-consume in hours when the cost of producing electricity is lower than average rates.”118 Basing customer rates on wholesale prices also has the benefit of increasing price response during periods of scarcity and high wholesale prices, which can help moderate generator market power. Rates and pricing that are considered time-based include time-of-use (TOU) rates, critical peak pricing (CPP), and real-time pricing (RTP). These programs expose customers to varying levels of price exposure – the least with TOU and the most with RTP. Figure IV-2 illustrates the type of hourly price variation customers would face under the different time-based rates. Each of these tariff types is described in greater detail below, using current program examples and issues raised by each type.
114 James C. Bonbright, Albert L. Danielsen, David R. Kamerschen, Principles of Public Utility Rates, 2nd ed.
(Arlington, VA: Public Utilities Reports, 1988). 115 Bernie Neenan, “Focusing on Issues of Rate Design,” Utilipoint IssueAlert, March 10, 2006; and Frederick
Weston, “Dynamic Pricing: Options and Policies,” white paper for MADRI regulatory subgroup, November 2005, 1. 116 Eric Hirst, “The Financial and Physical Insurance Benefits of Price-Responsive Demand,” The Electricity
Journal 15 #4 (2002), 66-73. 117 There is a substantial literature on setting rates based on marginal costs in the electric sector. See, for example,
M. Crew and P. Kleindorfer. Public Utility Economics (New York: St. Martin’s Press, 1979, and B. Mitchell, W. Manning, and J. Paul Acton. Peak-Load Pricing (Cambridge: Ballinger, 1978). Other papers suggest that setting rates based on marginal costs will result in a misallocation of resources (see S. Borenstein, “The Long-Run Efficiency of Real-Time Pricing,” The Energy Journal 26 #3 (2005)). Nevertheless, the literature also indicates that marginal cost pricing may result in a revenue shortfall or excess, and standard rate-making practice is to require an adjustment (presumably to an inelastic component) to reconcile with embedded cost-of-service. Various rate structures to accomplish marginal-cost pricing include two-part tariffs (see W. Kip Viscusi, John M. Vernon and Joseph E. Harrington. Economics of Regulation and Antitrust, 3rd ed. (Cambridge: MIT Press, 2000)) and allocation of shortfalls to rate classes.
118 DOE February 2006 EPAct Report, 7.

Chapter IV – Existing Demand Response and Time-Based Rates
Assessment of Demand Response and Advanced Metering Federal Energy Regulatory Commission
53
Figure IV-2: Time-based pricing hourly variations
0
10
20
30
40
50
1 2 3 4 5 6 7 8 9 10 11 12 13 14 15 16 17 18 19 20 21 22 23 24Hour of the day
Pric
e (c
ents
/kW
h)Critical PeakCritical Peak
Pricing
0
10
20
30
40
50
1 2 3 4 5 6 7 8 9 10 11 12 13 14 15 16 17 18 19 20 21 22 23 24Hour of the day
Pric
e (c
ents
/kW
h)
On-Peak
Time-of-UsePricing
Time-of-Use (TOU) Pricing: These daily energy or energy and demand rates are differentiated by peak and off-peak (and possibly shoulder) periods.
Critical Peak Pricing (CPP): CPP is an overlay on either TOU or flat pricing. CPP uses real-time prices at times of extreme system peak. CPP is restricted to a small number of hours per year, is much higher than a normal peak price, and its timing is unknown ahead of being called.
Real-Time Pricing: RTP links hourly prices to hourly changes in the day-of (real-time) or day-ahead cost of power. One option is ‘one-part’ pricing, in which all usage is priced at the hourly, or spot price. A second approach is ‘two-part’ pricing.
0
10
20
30
40
50
1 2 3 4 5 6 7 8 9 10 11 12 13 14 15 16 17 18 19 20 21 22 23 24Hour of the day
Pric
e (c
ents
/kW
h)
Real-TimePricing
Source: Weston & Shirley, Scoping Paper on Dynamic Pricing: Aligning Retail Prices with Wholesale Markets, June 2005, pp. 4-5 (definitions); and Goldman, et al., Customer Strategies for Responding to Day-Ahead Market Hourly Electricity Pricing, Lawrence Berkeley National Laboratory: LBNL-57128, August 2005 (graphics).

Chapter IV – Existing Demand Response and Time-Based Rates
Assessment of Demand Response and Advanced Metering Federal Energy Regulatory Commission
54
Time-of-Use Rates Time-of-use (TOU) rates are the most prevalent time-varying rate, especially for residential customers. Most customers are exposed to some form of TOU rates, if only with rates that vary by six-month seasons. For instance, a summer-peaking utility may charge a higher rate for the energy use part of a bill than for the same amount of electricity consumed during the off-peak six months. This is a seasonal (time-varying) rate. More sensitive time-of-use rates establish two or more daily periods that reflect hours when the system load is higher (peak) or lower (off-peak), and charge a higher rate during peak hours. Off-peak hours are usually some part of the evening and night, as well as weekends. The length of the on-peak period varies, but can last between 8 a.m. and 8 p.m. By way of example, the on-peak period for residential TOU rates at the Kansas City Power and Light is from 1 p.m. to 7 p.m. The definition of TOU periods differs widely among utilities, based on the timing of their peak system demands over the day, week, or year. TOU rates sometimes have only two prices, for peak and off-peak periods, while other tariffs include a shoulder period or partial-peak rate. Some TOU rates apply year-round, although many tariffs include two seasons.
History Utilities’ TOU rates or TOU pilot offerings have risen and fallen over time, in part depending on regulatory encouragement or restructuring disincentives. DOE’s predecessor agency, the Federal Energy Administration, sponsored 16 demonstration TOU pilots between 1975 and 1981.119 Experiments tested single and multiple TOU rates, and lasted from six months to three years. The group which offered multiple rates included programs in Arizona, California (Los Angeles Department of Water and Power and Southern California Edison), Puerto Rico, Wisconsin, and North Carolina (Carolina Power & Light). EPRI later pooled the data from these experiments to estimate price elasticities of demand. They found the estimated elasticity of substitution was -0.14 (in other words, a doubling of on-peak to off-peak ratio would result in a drop of 14 percent in the corresponding quantity ratio). One of the last comprehensive national surveys of demand response programs in the United States prior to the current FERC Survey was conducted by EPRI in 1994. That survey gathered information on “1,959 demand-side efforts conducted by 512 electric utilities.”120 Respondents reported 55 competitive rate programs offered by 39 utilities; only three of these included residential customers. The competitive rate programs involved more than 590,000 customers, including 559,000 residential customers. Some of the competitive rates were experimental; others included real-time pricing.121 Another survey category was load management rate programs; EPRI survey respondents cited 177 of these, including 80 TOU rate programs with over 500,000 participants.122 The bulk of TOU program participation came from residential customers participating in voluntary programs offered by four utilities: Pacific Gas & Electric, California (four programs, including a residential one with 102,000 participants); Baltimore Gas & Electric, Maryland (voluntary for 31,956 residential participants; mandatory for new single-family homes, with 39,092 customers);
119 Ahmad Faruqui & Stephen George, “The Value of Dynamic Pricing in Mass Markets,” The Electricity Journal,
15 (6) July 2002, 47-48. 120 EPRI, 1994 Survey of Utility Demand-Side Programs and Services: Final Report, November 1995, TR-105685,
iii. 121 EPRI, TR-105685, section 1.6. 122 EPRI, TR-105685, section 2.6.
Chapter IV – Existing Demand Response and Time-Based Rates
Assessment of Demand Response and Advanced Metering Federal Energy Regulatory Commission
55
Metropolitan Edison, Pennsylvania123 (68,946 residential participants); and Salt River Project, Arizona (46,549 participants). Many utilities now require their larger commercial and industrial (C&I) customers to be on TOU rates. TOU rates are common outside of the United States. Electricité de France (EdF) has offered TOU rates for decades; it now also offers a “Tempo” critical peak rate, layered on a TOU rate; “Tempo” employs color-coded signals sent by power line carrier to a customer’s plug-in device on a day-ahead basis, as well as smart thermostats and programmable space and water-heating controls.124 As different U.S. states began to restructure, especially where utilities divested their generation, utilities allowed their TOU (or other load-response) demand response programs to lapse, particularly for smaller customers.125
Implementation Experience Experience with TOU rates and customer acceptance of the rates has varied widely across the United States. The experiences of utilities with residential TOU rates in Arizona and Washington are instructive. Salt River Project Agricultural Improvement and Power District (SRP) and Arizona Public Service (APS) residential TOU programs. APS and SRP, which compete in the Phoenix area, are cited as having residential participation rates that approach one-third of their customers.126 Demand response is important for an area that is growing as rapidly as Phoenix, and competition seems to contribute to the utilities offering attractive time-based packages that work. APS offers two residential TOU plans plus a flat-rate plan. Its Time Advantage plan has energy-only charges, which better suits customers who use 60 percent or more of their power off-peak. The Combined Advantage plan features much lower hourly energy prices, but adds a demand charge based on a customer’s peak use. SRP offers residential and business TOU plans plus a basic residential plan. SRP advises customers to opt for the E-26 TOU plan only if they use at least 1,000 kWh in summer periods and if they can shift usage to off-peak hours. SRP’s TOU customers save about eight percent on their annual bill. Those customers who find that they are not saving are allowed to revert to the basic plan, but must remain on it for at least one year. Each utility’s plan has peak and off-peak hours that vary seasonally, but no shoulder period. Both SRP and APS recognize the importance of customer education. Their web sites feature calculators for customers to compare costs under time-based and flat plans, along with energy-saving tips and advice on choosing a plan based on usage patterns. Interestingly, both utilities require unlimited physical access to customers’ meters, which must be read more than once monthly.127
123 Metropolitan Edison is now part of FirstEnergy Corporation. 124 Energy & Environmental Economics, A Survey of Time-of-Use Pricing, Summer 2006 (forthcoming), prepared
for the U.S. Environmental Protection Agency, section E.2, and http://particuliers.edf.fr/article343.html (accessed June 26, 2006).
125 For instance, prior to its divestiture of generation assets, Pepco (Maryland) required large residential customers to be on TOU rates. After divestiture, existing customers were allowed to elect non-TOU tariffs; new Pepco customers have been unable to sign up for time-of-use rates if they did not have TOU meters. Pepco is currently running the SmartPowerDC program, a dynamic pricing pilot in Washington, D.C.
126 Demand Response and Advanced Metering Coalition (DRAM), comments filed in Docket AD06-2, December 19, 2005, 4.
127 APS and SRP web sites: http://www.aps.com/aps_services/residential/rateplans/ResRatePlans_8.html; http://www.aps.com/aps_services/residential/rateplans/ResRatePlans_9.html; http://www.srpnet.com/prices/home/tou.aspx
Chapter IV – Existing Demand Response and Time-Based Rates
Assessment of Demand Response and Advanced Metering Federal Energy Regulatory Commission
56
Puget Sound Energy (PSE) began a TOU pilot in June 2001; it installed new meters. PSE enrolled 240,000 customers who moved from flat rates to its TOU program. During the mid-day period (10 a.m. to 5 p.m.), TOU customers paid the same amount (5.8¢/kWh) as those on flat rates. Morning (6 a.m. – 10 a.m.) and evening (5 p.m. – 9 p.m.) periods were priced only one cent higher. Enthusiastic customers achieved five-to-six percent peak reductions, and conserved 5 percent in the first year. PSE instituted a $1/month charge to recoup part of its metering costs in July 2002. This substantially cut into customer savings. In the fall of 2002, customers began receiving cost comparisons of TOU bills with what they would have paid on flat rates; 90 percent were saving less than the metering charge. Washington state discontinued the TOU pilot in November 2002.128 Evaluations of the PSE program included several possible explanations for the need to discontinue the program. PSE is a winter-peaking utility, which normally faces mild weather and energy prices well below the national average; right before the pilot, prices were exceptionally high and volatile. By the fall of 2002, prices were lower and less volatile, due to the abatement of the California energy crisis (and critical need to export power to California). According to Eric Hirst, “dynamic pricing induces customers to reduce their electricity consumption when prices are high; the same customers will increase their use when prices are low. Dynamic pricing can hedge against high gas prices or low-hydro years. But, dynamic pricing benefits are not evenly distributed: “price increases during low-priced periods are much less than the price reductions during high-price periods.”129 Other analyses noted a lack of sufficient difference between PSE’s peak and off-peak prices. Regions with less mild weather might offer higher incentives (in terms of rate differences) to shift usage to off-peak hours.130 The absence of automated equipment and prior customer education about their energy consumption habits may have also minimized response rates.
Issues All time-based rates other than seasonal rates require meters that register customer electricity consumption based on time-of-day or more frequent billing blocks. Traditional meters for smaller customers that were installed several years ago, or even newer remotely readable ones, do not necessarily record time-of-day usage. The additional capital and operating cost of replacing or upgrading these meters can be included in separate customer charges, as determined by individual public utility commissions, if customers choose TOU rates. Alternatively, if AMI systems are deployed, the necessary infrastructure would be in place to support TOU rates. Regulators who implement TOU plans need to decide how many periods are relevant: two daily; peak and off-peak plus a shoulder; weekends as off-peak; or seasonal differences layered on the time-of-day periods. The size of the price-spread between peak and off-peak hours is important so that customers perceive real price signals, but also so they can achieve bill savings without a loss of revenue to utilities.
128 Washington Utilities and Transportation Commission (UTC), Puget’s Time-of-Use Program:
http://www.wutc.wa.gov/webimage.nsf/0/62515a89dde8130388256ae800699ca5?OpenDocument (accessed June 15, 2006). 129 Direct Testimony of Eric A. Hirst on Behalf of Puget Sound Energy, Inc., November 26, 2001, before the
Washington Utilities and Transportation Commission, 11-12. 130 See Lewis Nerenberg, “From Promise to Progress”, UC Santa Cruz, May 2005, 4-7; and Dan Delurey, “Retail
Demand Response”, IEA Workshop presentation, Paris, France, February 2003, 4-6.
Chapter IV – Existing Demand Response and Time-Based Rates
Assessment of Demand Response and Advanced Metering Federal Energy Regulatory Commission
57
Critical Peak Pricing Critical Peak Pricing (CPP) is a relatively new form of retail TOU rates that relies on very high, critical peak prices, as opposed to the ordinary peak prices in TOU rates. A specified high per-unit rate for usage is in operation during times that the utility defines as critical peak periods. CPP events may be triggered by system contingencies or high prices faced by the utility in procuring power in the wholesale market. Unlike TOU blocks, which are typically in place for 6 to 10 hours during every day of the year or season, the days in which critical peaks occur are not designated in the tariff, but dispatched on relatively short notice as needed, for a limited number of days during the year. CPP rates can be superimposed on either a TOU or time-invariant rate. While CPP is price-based, the fact that it is called in real-time at periods of extreme system stress makes it equally a reliability-based demand response. CPP rates have several variants, including:
• Fixed-period CPP (CPP-F). In CPP-F, the time and duration of the price increase are predetermined, but the days when the events will be called are not. The maximum number of called days per year is also usually predetermined. The events are typically called on a day-ahead basis.
• Variable-period CPP (CPP-V). In CPP-V,131 the time, duration, and day of the price increase are not predetermined. The events are usually called on a day-of basis. CPP-V is typically paired with devices such as communicating thermostats that allow automatic responses to critical peak prices.
• Variable peak pricing (VPP). This is a recent form of CPP that has been proposed in New England.132 As with CPP, the off-peak and shoulder period energy prices would be set in advance for a designated length of time, such as a month or more. In the version proposed in Connecticut, the peak price for each peak-period hour would be set each day based on the average of the corresponding ISO Day-Ahead Connecticut Load Zone locational marginal prices (LMPs), adjusted to account for delivery losses and other costs typically recovered volumetrically. The advantage of VPP is that it more directly links the wholesale market to retail pricing.
• Critical peak rebates. In critical peak rebate programs, customers remain on fixed rates but receive rebates for load reductions that they produce during critical peak periods.
History CPP rates are relatively uncommon in the United States; the first major implementation occurred at Gulf Power in 2000. Overseas, France’s EdF has used a variation on CPP as its default residential rate since the late 1980s. Recent adoption of CPP rates in the United States is based on the realization that some of the price spikes experienced between 1998 and 2001 could have been drastically diminished had there been real-time (or near real-time) signals to customers to curtail their electricity use. The FERC Survey found that 25 utilities currently offer CPP tariffs or pilots.
131 Charles River Associates (CRA), Impact Evaluation of the California Statewide Pricing Pilot: Final Report,
March 16, 2005 for a discussion of CPP-F and CPP-V. 132 Filed Testimony of Bernard F. Neenan on Behalf of ISO New England Inc. before the Connecticut Department
of Public Utility Control, Docket No. 05-10-03, February 10, 2006.
Chapter IV – Existing Demand Response and Time-Based Rates
Assessment of Demand Response and Advanced Metering Federal Energy Regulatory Commission
58
Implementation Experience The results of the CPP program at Gulf Power and various CPP pilots suggest that CPP programs can provide important benefits without exposing customers to significant risk. Gulf Power, Florida. Gulf Power, a subsidiary of Southern Company, began marketing its GoodCents Select program to residential customers in March 2000 after experimenting with an earlier version between 1991 and 1994. By the end of 2001, the program had grown to include 2,300 homes, and by 2003 had 6,000 participants. The key features of the program are a monthly participation charge (about $5/month), an absence of incentive payments (incentives are imbedded in the four-part time-of-use), and no penalties for not modifying use. GoodCents Select comprises four elements: a TOU rate with a CPP component; a smart meter that receives pricing signals and provides outage detection; customer-programmed automated response technologies (including a smart thermostat governing air conditioning and water heaters, plus heat- and pool-pump timers); and multiple ways to communicate rate changes and critical peak conditions to participants. There are three time-of-use prices for non-critical hours, and a critical-peak price that can be invoked no more than one percent of the hours in a year. Gulf Power’s customers have saved more than 1 MW under this program.133 Gulf Power believes that both customers and utilities benefit from customer-controlled load management programs when price signals are used in conjunction with technology to automate demand responses. Its customers program the settings on their equipment and have the ability to override price signals; they are willing to participate; and they can save on their bills. Gulf Power said that the utility benefits in several ways: the “program facilitates the promotion of the most economically efficient electric and end-use technologies;” “significant demand reduction can be achieved in real-time (more than 2kW per participant during summer peaks);” demand response is profit-preserving; and, demand response programs to clip peaks should be assessed with the same payback criteria as 30-year combustion turbines (CT) installed to handle peak. Gulf Power reports that the GoodCents program creates initial savings of $35 million, plus annual O&M savings of $2.5 million.134 California Statewide Pricing Pilot. California implemented a statewide pilot of CPP, known as the Statewide Pricing Pilot, which included 2,500 customers, involved all three investor-owned utilities (IOUs), and ran from July 2003 to December 2004. Three agencies cooperated in implementing the Statewide Pricing Pilot, including the California Public Utilities Commission (CPUC), the California Energy Commission (CEC), and the California Power Authority (CPA). The pilot tested three rate structures, including a TOU rate in which the peak price was 70 percent higher than the standard rate and twice as high as the off-peak price. It also tested two CPP rates: a statewide TOU rate layered with a CPP that could be dispatched with day-ahead notice up to 15 times annually (CPP-F), and a variable critical-peak rate (CPP-V), targeted at a population that had already participated in a smart thermostat pilot. CPP-V was dispatched with four-hour day-of notification, for two-to-five hours. The CPP-V customers had the option of free enabling technology to facilitate their responses. Results demonstrated customer responsiveness across all groups and geographies, with and without air conditioning. Figure IV-3 presents the results from the pilot across a number of characteristics. Figure IV-4 displays how customer peak reduction differed by type of rate. Residential customers,
133 Southern Company Services, comments filed in Docket AD06-002, December 19, 2005, 8, noting that participants had saved over 1 MW “thus far” under this program.
134 Dan Merilatt, GoodCents Solutions, “Demand Response Programs: New Considerations, Choices, and Opportunities,” white paper (January 2004), 13-17.

Chapter IV – Existing Demand Response and Time-Based Rates
Assessment of Demand Response and Advanced Metering Federal Energy Regulatory Commission
59
Figure IV-3. California CPP: Residential CPP Response by Attribute
Source: Roger Levy, Joint California Workshop, “Advanced Metering Results and Issues” September 2004.
Figure IV-4. Average Residential Critical Peak Impacts by Rate Treatment
Source: Roger Levy, Joint California Workshop, “Advanced Metering Results and Issues” September 2004.
who had been thought to be less price-responsive than larger customers, achieved 15 percent or more reductions with high price signals on critical days; they achieved five percent reductions with more modest TOU prices. Residential customers were in fact more price responsive as a group than C&I customers, although the absolute effects on energy savings may have been higher with the latter group. The presence of enabling technologies made a dramatic difference in the response rates of customers – up to two-thirds of the reductions in some groups were attributable to smart thermostats (Figure IV-4).135 Satisfaction among participants was high, with 87 percent of participants responding that the
135 Faruqui & George, “Quantifying Customer Response to Dynamic Pricing,” The Electricity Journal (May 2005),
58-59.
17.2%15.1%
13.5%
19.2%
12.5%12.8%12.1% 12.1%12.3%
9.8%9.8%
0.0%
5.0%
10.0%
15.0%
20.0%
25.0%
High vs.Low User
Income Single vs.Multi-Family
Central ACOwnership
PoolOwnership
State-wideAverage
Peak
Loa
d R
educ
tion
200% A
verage Use
Single Family
50% A
verage Use
<$40,000
>$100,000
NO
Multi-Fam
ily
YES
YES
NO
Average Critical Peak Day
4.1%
12.5%
34.5%
0%
10%
20%
30%
40%
50%
Time of Use CPP-F CPP-V
Pea
k Lo
ad R
educ
tion
Critical Peak
Variable With
Automated Controls
Critical Peak Fixed
TOU
CPP-V
Critical Peak
Variable With
Automated Controls
Hottest Critical Peak Day

Chapter IV – Existing Demand Response and Time-Based Rates
Assessment of Demand Response and Advanced Metering Federal Energy Regulatory Commission
60
program was fair.136 In fact, a number of the participants remained in the time-of-use program after the pilot was discontinued, even though they then began paying for their own enabling technologies. Post-pilot interviews revealed that, contrary to popular belief, residential customers considered the CPP tariffs easier to understand than their previous inverted tier rates.137
Real-Time Pricing Real-time pricing (RTP) rates vary continuously during the day, directly reflecting the wholesale price of electricity, as opposed to rate designs such as time-of-use or CPP that are largely based on preset prices. RTP links hourly prices to hourly changes in the day-of (real-time) or day-ahead cost of power. The direct connection between wholesale prices and retail rates introduces price-responsiveness into the retail market, and serves to provide important linkages between wholesale and retail markets. There are several RTP variants in place across the United States – day-of versus day-ahead pricing, one-part versus two-part pricing, and mandatory versus voluntary. A two-part RTP rate is the more common form of price-risk sharing;138 however, the largest customers in Delaware, Maryland, and New Jersey are starting to be placed on day-of mandatory RTP in default-service market designs. The first RTP programs, in the mid-1980s, were introduced in California as a novel strategy for meeting demand-side management (DSM) objectives and testing critical assumptions about customer acceptance and price response. Utilities such as Niagara Mohawk Power Co. (now part of National Grid) and Georgia Power also were early adopters of real-time pricing tariffs. According to a report on RTP conducted by the Lawrence Berkeley National Laboratory,139 more than 70 utilities in the United States have offered voluntary RTP tariffs on either a pilot or permanent basis. The motivations of these utilities to implement RTP were varied: either to promote retail market development or to lessen the need to build additional peaking generators.
Day-Ahead Real-Time Pricing (DA-RTP) DA-RTP customers are given one-day notice of the prices for each of the next day’s 24 hours. This gives customers time to plan their responses, such as shifting use (often by shifting load to off-peak hours or by using onsite generation) or to hedge day-ahead prices with other products if they cannot curtail their demand. Niagara Mohawk is an oft-cited example of an early adopter of default DA-RTP for its largest customers. More recently, its experiences with TOU and RTP served as the basis for a New York Public Service Commission (NYPSC) decision to phase-in default RTP for all large customers. From the early 1980s to November 1998, the default tariff (SC-3A) for Niagara Mohawk’s largest customers was a time-of-use rate. In November 1998, Niagara Mohawk implemented default day-ahead RTP for all customers with more than 2 MW of demand, which comprised more than 130 industrial, commercial, and institutional customers. By 2003, 50-55 percent of customers faced real-
136 Charles River Associates, March 2005, 13. 137 Residential Customer Understanding of Electricity Usage and Billing, Momentum Market Intelligence, WG3
Report, Jan. 29, 2004, viii-ix., cited by Roger Levy, “Advanced metering and dynamic rates: the Issues,” September 30, 2004.
138 Frederick Weston & Wayne Shirley, Dynamic Pricing: Aligning Retail Prices with Wholesale Market, June 2005, 5.
139 Galen Barbose, Charles Goldman, & Bernie Neenan, A Survey of Utility Experience with Real Time Pricing, Lawrence Berkeley National Laboratory: LBNL-54238, 2004.
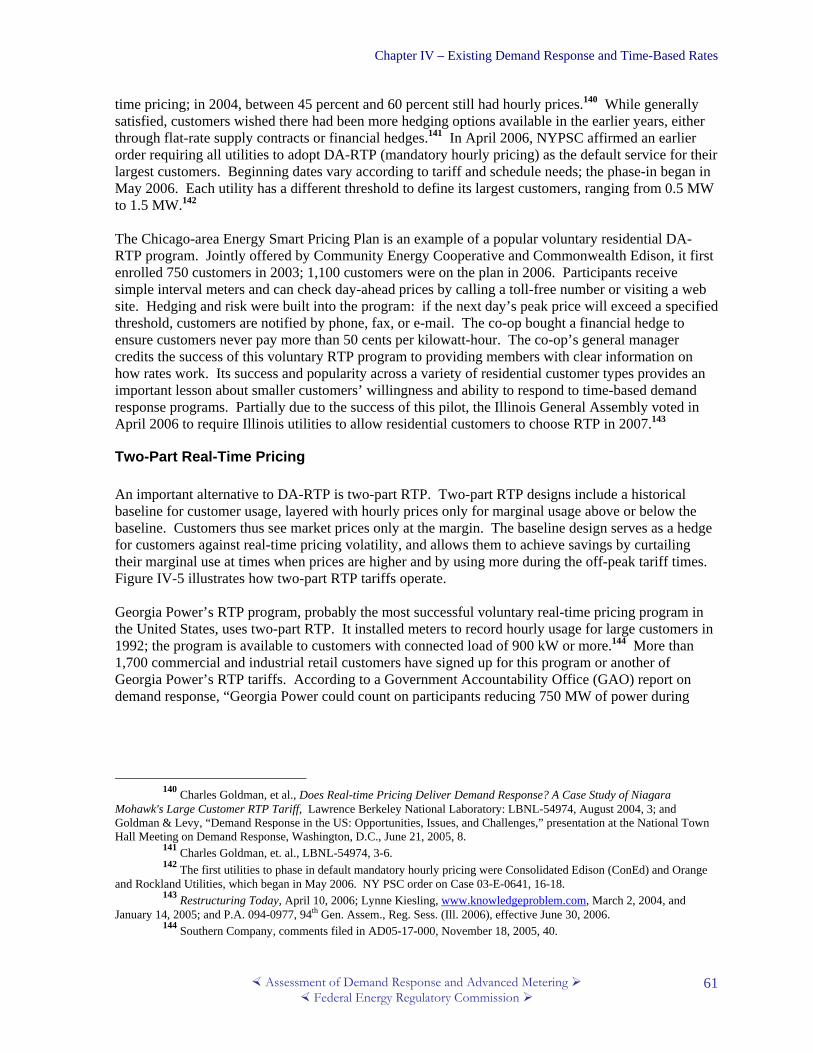
Chapter IV – Existing Demand Response and Time-Based Rates
Assessment of Demand Response and Advanced Metering Federal Energy Regulatory Commission
61
time pricing; in 2004, between 45 percent and 60 percent still had hourly prices.140 While generally satisfied, customers wished there had been more hedging options available in the earlier years, either through flat-rate supply contracts or financial hedges.141 In April 2006, NYPSC affirmed an earlier order requiring all utilities to adopt DA-RTP (mandatory hourly pricing) as the default service for their largest customers. Beginning dates vary according to tariff and schedule needs; the phase-in began in May 2006. Each utility has a different threshold to define its largest customers, ranging from 0.5 MW to 1.5 MW.142 The Chicago-area Energy Smart Pricing Plan is an example of a popular voluntary residential DA-RTP program. Jointly offered by Community Energy Cooperative and Commonwealth Edison, it first enrolled 750 customers in 2003; 1,100 customers were on the plan in 2006. Participants receive simple interval meters and can check day-ahead prices by calling a toll-free number or visiting a web site. Hedging and risk were built into the program: if the next day’s peak price will exceed a specified threshold, customers are notified by phone, fax, or e-mail. The co-op bought a financial hedge to ensure customers never pay more than 50 cents per kilowatt-hour. The co-op’s general manager credits the success of this voluntary RTP program to providing members with clear information on how rates work. Its success and popularity across a variety of residential customer types provides an important lesson about smaller customers’ willingness and ability to respond to time-based demand response programs. Partially due to the success of this pilot, the Illinois General Assembly voted in April 2006 to require Illinois utilities to allow residential customers to choose RTP in 2007.143
Two-Part Real-Time Pricing An important alternative to DA-RTP is two-part RTP. Two-part RTP designs include a historical baseline for customer usage, layered with hourly prices only for marginal usage above or below the baseline. Customers thus see market prices only at the margin. The baseline design serves as a hedge for customers against real-time pricing volatility, and allows them to achieve savings by curtailing their marginal use at times when prices are higher and by using more during the off-peak tariff times. Figure IV-5 illustrates how two-part RTP tariffs operate. Georgia Power’s RTP program, probably the most successful voluntary real-time pricing program in the United States, uses two-part RTP. It installed meters to record hourly usage for large customers in 1992; the program is available to customers with connected load of 900 kW or more.144 More than 1,700 commercial and industrial retail customers have signed up for this program or another of Georgia Power’s RTP tariffs. According to a Government Accountability Office (GAO) report on demand response, “Georgia Power could count on participants reducing 750 MW of power during
140 Charles Goldman, et al., Does Real-time Pricing Deliver Demand Response? A Case Study of Niagara
Mohawk's Large Customer RTP Tariff, Lawrence Berkeley National Laboratory: LBNL-54974, August 2004, 3; and Goldman & Levy, “Demand Response in the US: Opportunities, Issues, and Challenges,” presentation at the National Town Hall Meeting on Demand Response, Washington, D.C., June 21, 2005, 8.
141 Charles Goldman, et. al., LBNL-54974, 3-6. 142 The first utilities to phase in default mandatory hourly pricing were Consolidated Edison (ConEd) and Orange
and Rockland Utilities, which began in May 2006. NY PSC order on Case 03-E-0641, 16-18. 143 Restructuring Today, April 10, 2006; Lynne Kiesling, www.knowledgeproblem.com, March 2, 2004, and
January 14, 2005; and P.A. 094-0977, 94th Gen. Assem., Reg. Sess. (Ill. 2006), effective June 30, 2006. 144 Southern Company, comments filed in AD05-17-000, November 18, 2005, 40.
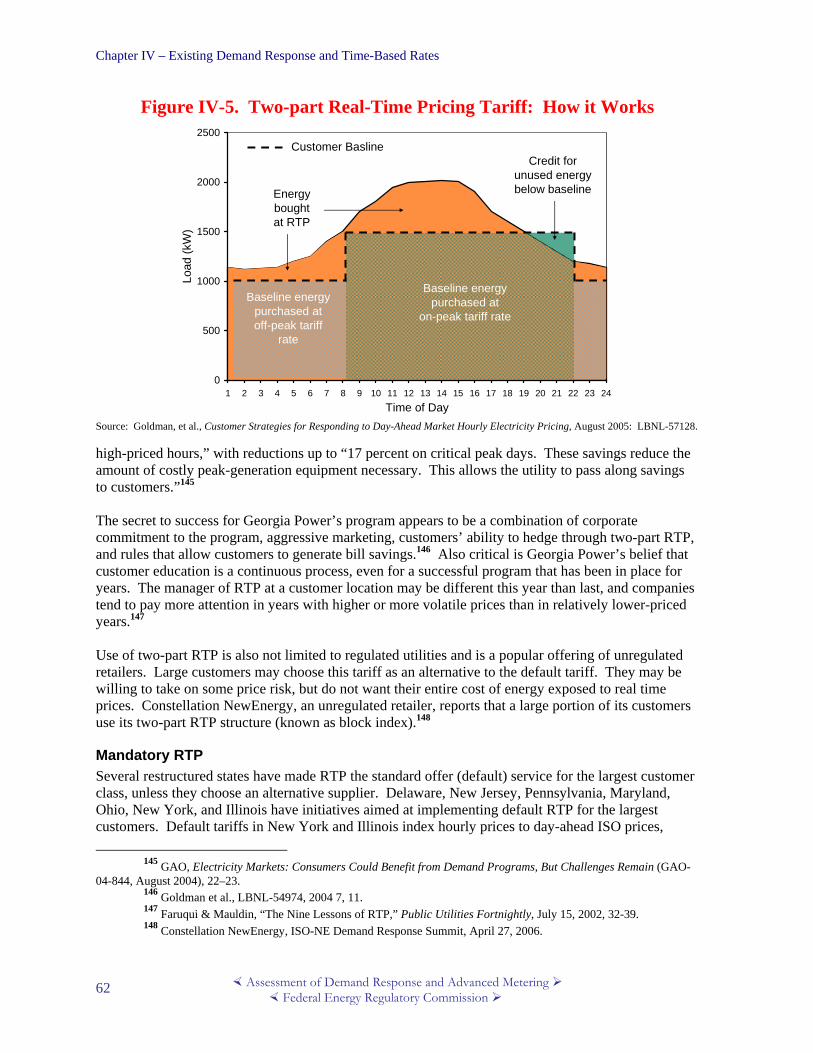
Chapter IV – Existing Demand Response and Time-Based Rates
Assessment of Demand Response and Advanced Metering Federal Energy Regulatory Commission
62
Figure IV-5. Two-part Real-Time Pricing Tariff: How it Works
0
500
1000
1500
2000
2500
1 2 3 4 5 6 7 8 9 10 11 12 13 14 15 16 17 18 19 20 21 22 23 24Time of Day
Load
(kW
)
Credit for unused energy below baselineEnergy
boughtat RTP
Baseline energypurchased atoff-peak tariff
rate
Baseline energypurchased at
on-peak tariff rate
Customer Basline
Source: Goldman, et al., Customer Strategies for Responding to Day-Ahead Market Hourly Electricity Pricing, August 2005: LBNL-57128. high-priced hours,” with reductions up to “17 percent on critical peak days. These savings reduce the amount of costly peak-generation equipment necessary. This allows the utility to pass along savings to customers.”145 The secret to success for Georgia Power’s program appears to be a combination of corporate commitment to the program, aggressive marketing, customers’ ability to hedge through two-part RTP, and rules that allow customers to generate bill savings.146 Also critical is Georgia Power’s belief that customer education is a continuous process, even for a successful program that has been in place for years. The manager of RTP at a customer location may be different this year than last, and companies tend to pay more attention in years with higher or more volatile prices than in relatively lower-priced years.147 Use of two-part RTP is also not limited to regulated utilities and is a popular offering of unregulated retailers. Large customers may choose this tariff as an alternative to the default tariff. They may be willing to take on some price risk, but do not want their entire cost of energy exposed to real time prices. Constellation NewEnergy, an unregulated retailer, reports that a large portion of its customers use its two-part RTP structure (known as block index).148
Mandatory RTP Several restructured states have made RTP the standard offer (default) service for the largest customer class, unless they choose an alternative supplier. Delaware, New Jersey, Pennsylvania, Maryland, Ohio, New York, and Illinois have initiatives aimed at implementing default RTP for the largest customers. Default tariffs in New York and Illinois index hourly prices to day-ahead ISO prices,
145 GAO, Electricity Markets: Consumers Could Benefit from Demand Programs, But Challenges Remain (GAO-04-844, August 2004), 22–23.
146 Goldman et al., LBNL-54974, 2004 7, 11. 147 Faruqui & Mauldin, “The Nine Lessons of RTP,” Public Utilities Fortnightly, July 15, 2002, 32-39. 148 Constellation NewEnergy, ISO-NE Demand Response Summit, April 27, 2006.

Chapter IV – Existing Demand Response and Time-Based Rates
Assessment of Demand Response and Advanced Metering Federal Energy Regulatory Commission
63
while Delaware, New Jersey, Maryland, and some Pennsylvania utilities index to real-time hourly ISO prices. Through April 2006, default RTP for large C&I customers had been implemented by 11 utilities in four states, and it was proposed or planned for 15 additional utilities.149
Demand Response Program Survey Results The FERC Survey requested information on the use and prevalence of demand response programs across the United States. This section summarizes information on how many programs are offered, and how many customers are currently on these programs.150
Incentive-Based Demand Response Table IV-1 lists the number of entities that offered the various types of incentive-based demand response in the United States in 2005. The FERC Survey indicates that DLC programs and interruptible/curtailable tariffs are the most popular type of incentive-based demand response. The following discussion presents detailed results on the number of incentive-based demand response programs and the number of customers enrolled in these programs by region and by type of company.
Table IV-1. Number of entities offering incentive-based demand response programs in the United States Type of Program Number of Entities
Direct Load Control 234 Interruptible/Curtailable 218
Emergency Demand Response Program 27 Capacity Market Program 16 Demand Bidding/Buyback 18
Ancillary Services 1 Source: FERC Survey
Direct Load Control (DLC) DLC programs are widely available nationally, with 234 entities offering at least one DLC program. DLC programs were targeted primarily to residential customers; however, 33 percent of these entities also offered at least one DLC program for commercial customers. DLC programs are particularly popular among utilities in the MRO region (39 percent of the total number of entities offering DLC programs) followed by SERC and RFC, 17 percent each (see Figure IV-6). Several states in the MRO region (Minnesota and Iowa) have historically either required or encouraged utilities to spend a portion of their revenue on demand-side management programs, including direct load control, and utilities in the upper Midwest have historically had favorable rules that allowed load-management resources to be counted towards meeting reserve requirements. Cooperative utilities and political subdivisions account for the largest (51 percent) portion of entities offering DLC programs followed by municipal entities and IOUs.
149 Neenan, “Default RTP Service Links Wholesale and Retail Markets,” UtiliPoint IssueAlert, October 28, 2005,
and Goldman, April 27, 2006, 3-6. 150 Appendix H lists the entities who offer demand response programs.
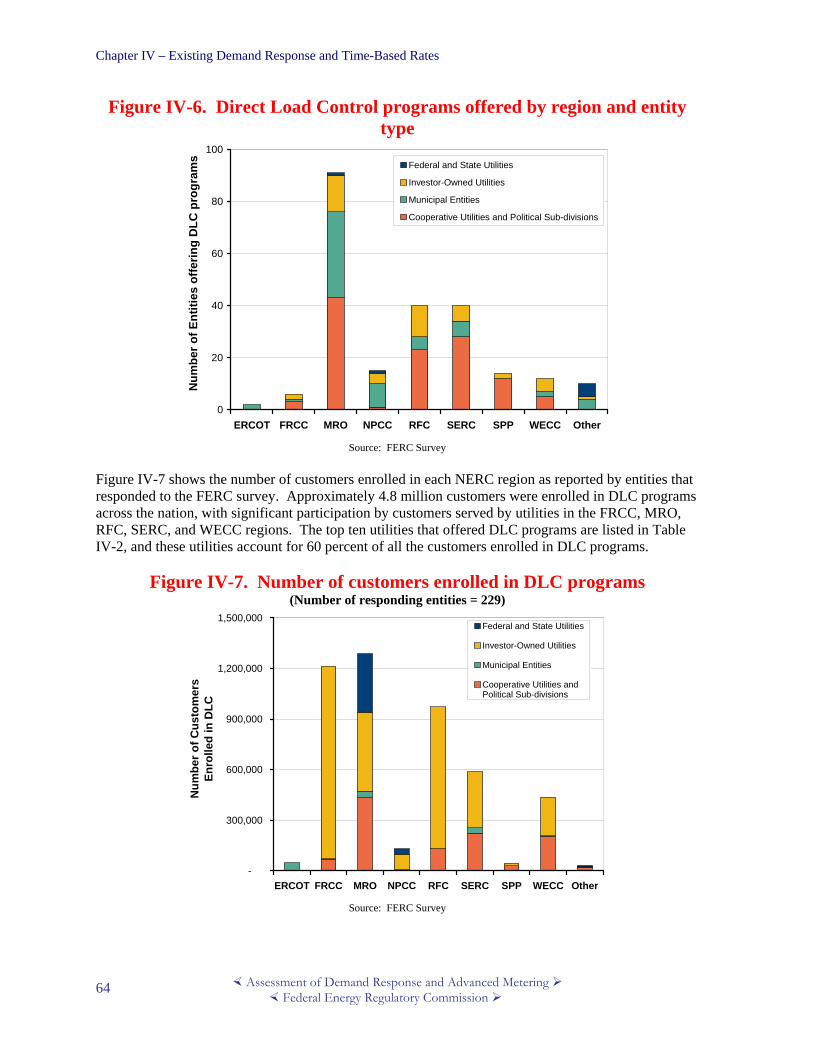
Chapter IV – Existing Demand Response and Time-Based Rates
Assessment of Demand Response and Advanced Metering Federal Energy Regulatory Commission
64
Figure IV-6. Direct Load Control programs offered by region and entity type
0
20
40
60
80
100
ERCOT FRCC MRO NPCC RFC SERC SPP WECC Other
Num
ber o
f Ent
ities
offe
ring
DLC
pro
gram
s Federal and State Utilities
Investor-Owned Utilities
Municipal Entities
Cooperative Utilities and Political Sub-divisions
Source: FERC Survey
Figure IV-7 shows the number of customers enrolled in each NERC region as reported by entities that responded to the FERC survey. Approximately 4.8 million customers were enrolled in DLC programs across the nation, with significant participation by customers served by utilities in the FRCC, MRO, RFC, SERC, and WECC regions. The top ten utilities that offered DLC programs are listed in Table IV-2, and these utilities account for 60 percent of all the customers enrolled in DLC programs.
Figure IV-7. Number of customers enrolled in DLC programs (Number of responding entities = 229)
-
300,000
600,000
900,000
1,200,000
1,500,000
ERCOT FRCC MRO NPCC RFC SERC SPP WECC Other
Num
ber o
f Cus
tom
ers
Enro
lled
in D
LC
Federal and State Utilities
Investor-Owned Utilities
Municipal Entities
Cooperative Utilities andPolitical Sub-divisions
Source: FERC Survey
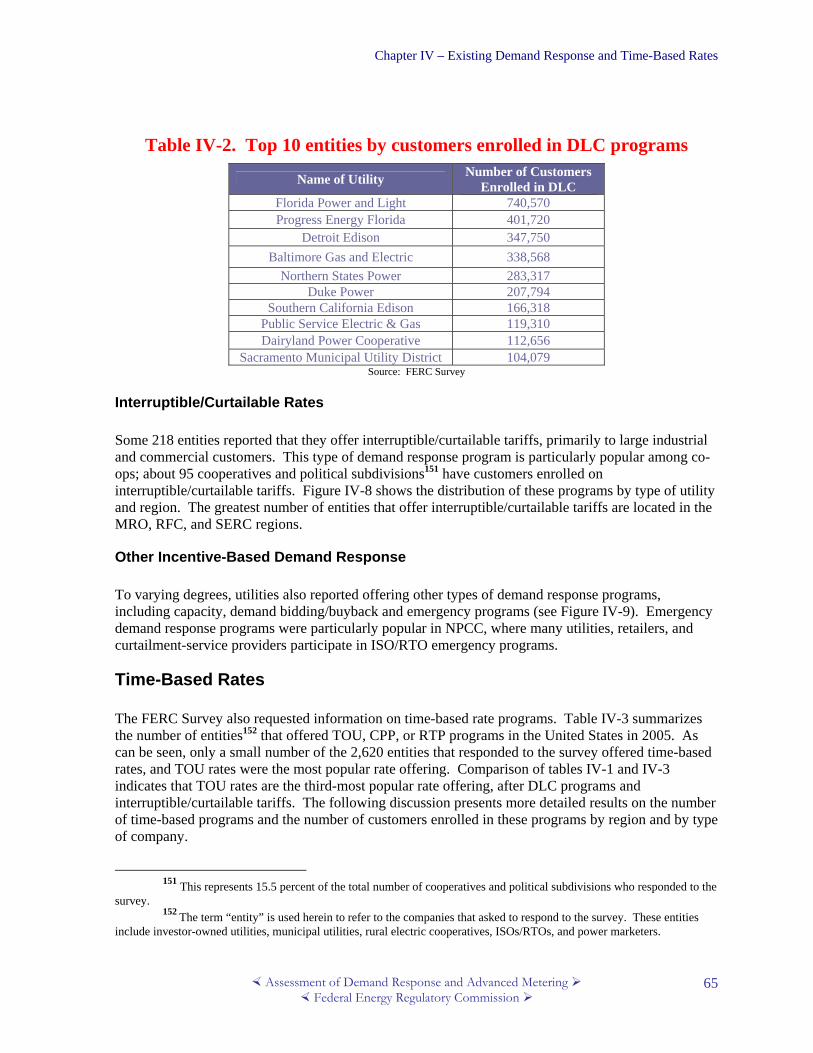
Chapter IV – Existing Demand Response and Time-Based Rates
Assessment of Demand Response and Advanced Metering Federal Energy Regulatory Commission
65
Table IV-2. Top 10 entities by customers enrolled in DLC programs
Name of Utility Number of Customers Enrolled in DLC
Florida Power and Light 740,570 Progress Energy Florida 401,720
Detroit Edison 347,750 Baltimore Gas and Electric 338,568
Northern States Power 283,317 Duke Power 207,794
Southern California Edison 166,318 Public Service Electric & Gas 119,310 Dairyland Power Cooperative 112,656
Sacramento Municipal Utility District 104,079 Source: FERC Survey
Interruptible/Curtailable Rates Some 218 entities reported that they offer interruptible/curtailable tariffs, primarily to large industrial and commercial customers. This type of demand response program is particularly popular among co-ops; about 95 cooperatives and political subdivisions151 have customers enrolled on interruptible/curtailable tariffs. Figure IV-8 shows the distribution of these programs by type of utility and region. The greatest number of entities that offer interruptible/curtailable tariffs are located in the MRO, RFC, and SERC regions.
Other Incentive-Based Demand Response To varying degrees, utilities also reported offering other types of demand response programs, including capacity, demand bidding/buyback and emergency programs (see Figure IV-9). Emergency demand response programs were particularly popular in NPCC, where many utilities, retailers, and curtailment-service providers participate in ISO/RTO emergency programs.
Time-Based Rates The FERC Survey also requested information on time-based rate programs. Table IV-3 summarizes the number of entities152 that offered TOU, CPP, or RTP programs in the United States in 2005. As can be seen, only a small number of the 2,620 entities that responded to the survey offered time-based rates, and TOU rates were the most popular rate offering. Comparison of tables IV-1 and IV-3 indicates that TOU rates are the third-most popular rate offering, after DLC programs and interruptible/curtailable tariffs. The following discussion presents more detailed results on the number of time-based programs and the number of customers enrolled in these programs by region and by type of company.
151 This represents 15.5 percent of the total number of cooperatives and political subdivisions who responded to the
survey. 152 The term “entity” is used herein to refer to the companies that asked to respond to the survey. These entities
include investor-owned utilities, municipal utilities, rural electric cooperatives, ISOs/RTOs, and power marketers.

Chapter IV – Existing Demand Response and Time-Based Rates
Assessment of Demand Response and Advanced Metering Federal Energy Regulatory Commission
66
Figure IV-8. Number of entities offering interruptible / curtailable tariffs
by region and entity type
0
10
20
30
40
50
60
ERCOT FRCC MRO NPCC RFC SERC SPP WECC Other
Num
ber o
f Ent
ities
offe
ring
I/C P
rogr
ams Federal and State Utilities
Investor-Owned Utilities
Municipal Entities
Cooperative Utilities andPolitical Sub-divisions
Source: FERC Survey
Figure IV-9. Number of entities offering capacity, demand bidding, and
emergency programs by region
0
4
8
12
16
ERCOT FRCC MRO NPCC RFC SERC SPP WECC Other
Num
ber o
f Ent
ities
Capacity ProgramsDemand BiddingEmergency
Source: FERC Survey

Chapter IV – Existing Demand Response and Time-Based Rates
Assessment of Demand Response and Advanced Metering Federal Energy Regulatory Commission
67
Table IV-3: Number of entities offering time-based rates in the United States
Type of Program Number of Entities
Time-of-Use Rates 187 Real-time Pricing 47
Critical Peak Pricing 25 Source: FERC Survey
Time-of-Use Rates Figure IV-10 shows the number of entities that offer time-of-use (TOU) tariffs to their residential customers by NERC region; 148 utilities reported that they offer a time-of-use tariff to their residential customers, while the remaining 39 offer TOU rates to nonresidential customers. Publicly-owned utilities are large users of these programs. Cooperative utilities, political subdivisions, and municipal entities together account for 55 percent of entities offering TOU rates. In order to get a sense of regional differences in TOU tariffs offered to residential customers, the percentage of residential sales of those entities in each region that offer residential TOU tariffs is reported in Figure IV-10. For example, even though only five entities report offering a residential TOU tariff, they account for 78 percent of residential sales in the FRCC region. Residential TOU tariffs appear to be most widely available in the FRCC and SERC regions (78 percent and 72 percent, respectively, of residential sales), followed by WECC (57 percent). Figure IV-10. TOU tariffs offered to residential customers by entity type153
0
10
20
30
40
50
ERCOT FRCC MRO NPCC RFC SERC SPP WECC Other
Num
ber o
f Ent
ities
that
Offe
r TO
U
Tarif
f to
Res
iden
tial C
usto
mer
s
Federal and State UtilitiesInvestor-Owned UtilitiesMunicipal EntitiesCooperative Utilities and Political Sub-Divisions
% of Residential Sales
44 1557517239474178
Source: FERC Survey Electric distribution companies typically offer a TOU tariff as an optional tariff service for residential customers; thus, it is important to track actual customer enrollment on TOU tariffs in order to assess
153 Regional definitions used in this figure and subsequent figures are based on NERC regions. Chapter I contains
a map and listing of the regions.

Chapter IV – Existing Demand Response and Time-Based Rates
Assessment of Demand Response and Advanced Metering Federal Energy Regulatory Commission
68
customer acceptance and market penetration. About 1.57 million out of 120 million residential customers were signed up for a TOU tariff in the United States, which represents a market penetration of 1.4 percent nationally. Figure IV-11 displays the regional distribution of customer participation in these rates. As can be seen, most of the customers enrolled in TOU rate programs are concentrated in the RFC and WECC regions, and that the vast majority of residential customers on TOU rates are served by investor-owned utilities. Indeed, 10 entities, mainly investor-owned utilities located primarily in the RFC and WECC regions, account for about 85 percent of the residential customers enrolled in TOU tariffs. These 10 entities are listed in Table IV-4.
Critical Peak Pricing About 25 entities reported offering at least one CPP tariff with an enrollment of about 11,000 customers nationally. Many of the CPP tariffs appeared to be pilot programs (e.g., utilities that participated in the California Statewide Pricing Pilot). About 70 percent of the customers enrolled in CPP rates were served by an IOU, even though 72 percent of the entities offering CPP rates are co-ops and munis.154 The top five entities by number of customers enrolled in CPP programs are shown in Table IV-5. These five entities account for 96 percent of the total number of customers reported to be on CPP rates.
Figure IV-11. Residential customers on TOU tariffs by region and entity type
-
200,000
400,000
600,000
800,000
ERCOT FRCC MRO NPCC RFC SERC SPP WECC Other
Num
ber o
f Res
iden
tial
Cus
tom
ers
Enro
lled
in T
OU
Federal and State Utilities
Investor-Owned Utilities
Municipal Entities
Cooperative Utilities andPolitical Sub-divisions
Source: FERC Survey
154 We have concerns regarding the classification by several respondents of their tariff as CPP. For example, one
rural cooperative (Cass County Electric Cooperative) with a large number of residential customers enrolled described its CPP tariff as a demand-limiting program involving electric heat backed up by onsite generation for residential customers. Similarly, 12 small cooperatives and municipal utilities reported offering CPP rates for large commercial and industrial customers.
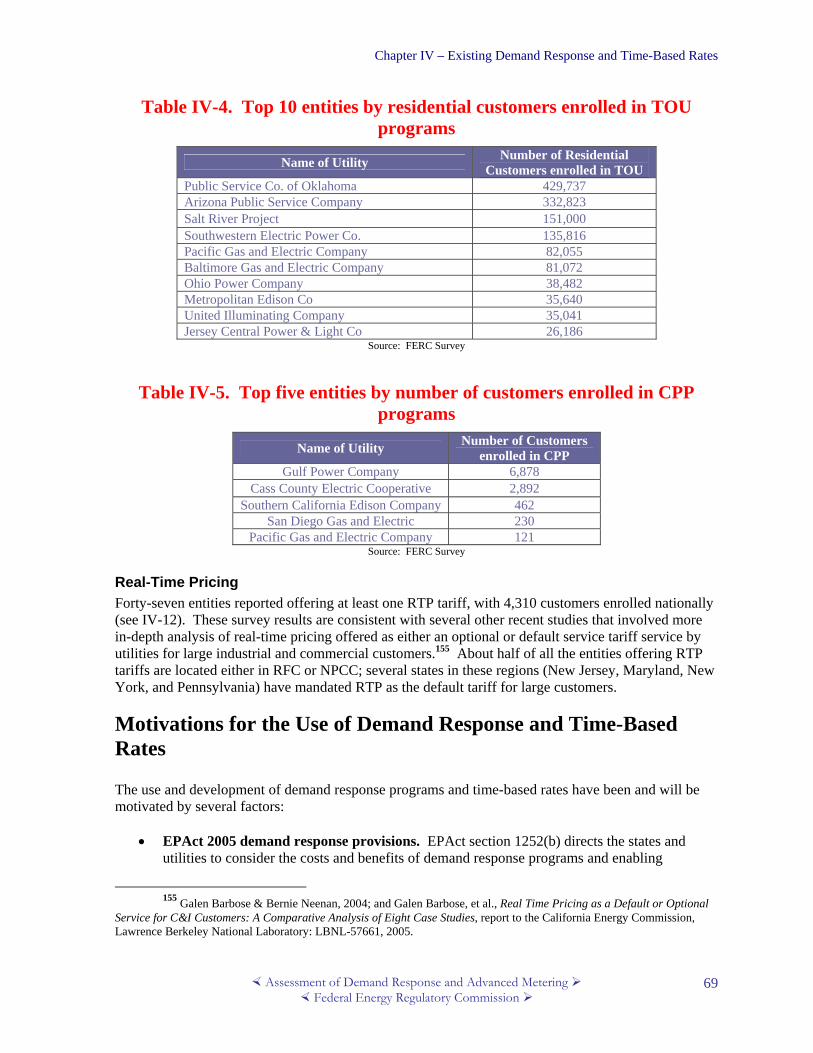
Chapter IV – Existing Demand Response and Time-Based Rates
Assessment of Demand Response and Advanced Metering Federal Energy Regulatory Commission
69
Table IV-4. Top 10 entities by residential customers enrolled in TOU programs
Name of Utility Number of Residential Customers enrolled in TOU
Public Service Co. of Oklahoma 429,737 Arizona Public Service Company 332,823 Salt River Project 151,000 Southwestern Electric Power Co. 135,816 Pacific Gas and Electric Company 82,055 Baltimore Gas and Electric Company 81,072 Ohio Power Company 38,482 Metropolitan Edison Co 35,640 United Illuminating Company 35,041 Jersey Central Power & Light Co 26,186
Source: FERC Survey
Table IV-5. Top five entities by number of customers enrolled in CPP
programs
Name of Utility Number of Customers enrolled in CPP
Gulf Power Company 6,878 Cass County Electric Cooperative 2,892
Southern California Edison Company 462 San Diego Gas and Electric 230
Pacific Gas and Electric Company 121 Source: FERC Survey
Real-Time Pricing Forty-seven entities reported offering at least one RTP tariff, with 4,310 customers enrolled nationally (see IV-12). These survey results are consistent with several other recent studies that involved more in-depth analysis of real-time pricing offered as either an optional or default service tariff service by utilities for large industrial and commercial customers.155 About half of all the entities offering RTP tariffs are located either in RFC or NPCC; several states in these regions (New Jersey, Maryland, New York, and Pennsylvania) have mandated RTP as the default tariff for large customers.
Motivations for the Use of Demand Response and Time-Based Rates The use and development of demand response programs and time-based rates have been and will be motivated by several factors:
• EPAct 2005 demand response provisions. EPAct section 1252(b) directs the states and utilities to consider the costs and benefits of demand response programs and enabling
155 Galen Barbose & Bernie Neenan, 2004; and Galen Barbose, et al., Real Time Pricing as a Default or Optional
Service for C&I Customers: A Comparative Analysis of Eight Case Studies, report to the California Energy Commission, Lawrence Berkeley National Laboratory: LBNL-57661, 2005.
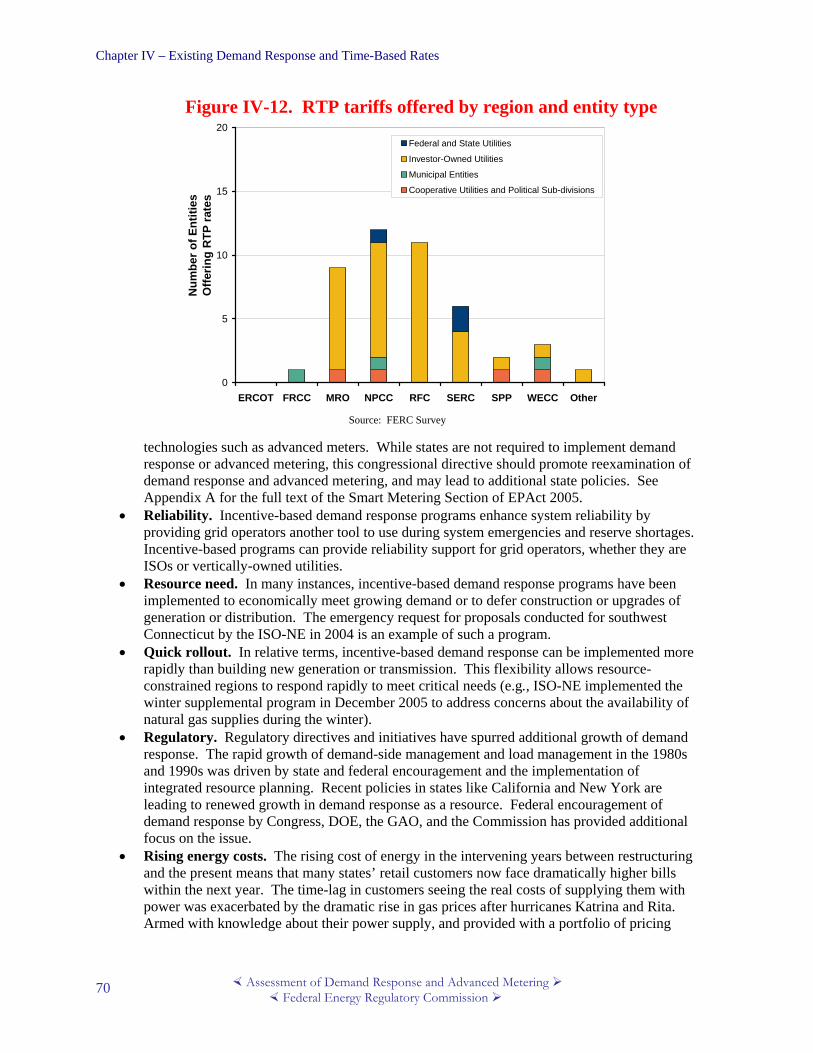
Chapter IV – Existing Demand Response and Time-Based Rates
Assessment of Demand Response and Advanced Metering Federal Energy Regulatory Commission
70
Figure IV-12. RTP tariffs offered by region and entity type
0
5
10
15
20
ERCOT FRCC MRO NPCC RFC SERC SPP WECC Other
Num
ber o
f Ent
ities
O
fferin
g R
TP ra
tes
Federal and State Utilities
Investor-Owned Utilities
Municipal Entities
Cooperative Utilities and Political Sub-divisions
Source: FERC Survey
technologies such as advanced meters. While states are not required to implement demand response or advanced metering, this congressional directive should promote reexamination of demand response and advanced metering, and may lead to additional state policies. See Appendix A for the full text of the Smart Metering Section of EPAct 2005.
• Reliability. Incentive-based demand response programs enhance system reliability by providing grid operators another tool to use during system emergencies and reserve shortages. Incentive-based programs can provide reliability support for grid operators, whether they are ISOs or vertically-owned utilities.
• Resource need. In many instances, incentive-based demand response programs have been implemented to economically meet growing demand or to defer construction or upgrades of generation or distribution. The emergency request for proposals conducted for southwest Connecticut by the ISO-NE in 2004 is an example of such a program.
• Quick rollout. In relative terms, incentive-based demand response can be implemented more rapidly than building new generation or transmission. This flexibility allows resource-constrained regions to respond rapidly to meet critical needs (e.g., ISO-NE implemented the winter supplemental program in December 2005 to address concerns about the availability of natural gas supplies during the winter).
• Regulatory. Regulatory directives and initiatives have spurred additional growth of demand response. The rapid growth of demand-side management and load management in the 1980s and 1990s was driven by state and federal encouragement and the implementation of integrated resource planning. Recent policies in states like California and New York are leading to renewed growth in demand response as a resource. Federal encouragement of demand response by Congress, DOE, the GAO, and the Commission has provided additional focus on the issue.
• Rising energy costs. The rising cost of energy in the intervening years between restructuring and the present means that many states’ retail customers now face dramatically higher bills within the next year. The time-lag in customers seeing the real costs of supplying them with power was exacerbated by the dramatic rise in gas prices after hurricanes Katrina and Rita. Armed with knowledge about their power supply, and provided with a portfolio of pricing

Chapter IV – Existing Demand Response and Time-Based Rates
Assessment of Demand Response and Advanced Metering Federal Energy Regulatory Commission
71
plans along with education, training, and enabling technologies, customers can be given the ability and opportunity to change their habits and lower their energy bills.
• Advances in enabling technologies. The price for technologies to implement dynamic pricing and automated customer responses has been falling, just as the capabilities of these technologies have been rising. The increasingly advanced functionality of enabling technologies has the potential to provide wider power system and societal benefits beyond those solely within the scope of demand response programs. Automated customer responses is now possible in more situations, allowing both greater customer receptivity and higher utility confidence that customers can and will respond to price-based demand response. These advances have contributed to the rekindling of interest in demand-side policies.
• Customer interest. Many customers, particularly large industrial customers, are interested in incentive-based demand response to reduce utility bills and to help maintain system reliability, without exposing them to price risks. Industrial customers have participated in interruptible/ curtailable tariffs for years and have been some of the most active participants in the various utility and ISO incentive-based programs.
• Lowered utility costs. LSEs and vertically-integrated utilities are interested in incentive-based demand response when it is cost-effective and can lower their resource acquisition or procurement costs.
• Risk management. Customers and LSEs can use demand response to hedge their exposure to high prices and price volatility by operating these resources and programs during these periods.
UtiliPoint International conducted a survey to determine what electric utilities and regulators considered the primary drivers of demand response programs in 2005.156 Figure IV-13 displays these results. According to the utilities surveyed, regulatory directives and requirements were the primary drivers for their development of programs. UtiliPoint also found that the relative weight given to each driver differs by type of utility. IOUs focus on reliability and reducing utility costs, and have only a modest interest in lowering participant’s energy costs. Municipal utilities have a higher interest in lowering participant’s energy bills. Co-operative utilities were highly motivated to lower bills for participants and to lower utility costs, and not by increasing reliability. The UtiliPoint survey also uncovered a difference in perceptions about regulators as drivers of demand response programs. While only 20 percent of regulators reported that regulation was a primary driver for demand response, 68 percent of IOUs that responded cited “regulatory” as the primary driver for developing or expanding demand response.157
Current issues/challenges Even with the drivers listed above to motivate increased utilization of incentive-based demand response, the previous discussion suggests that use of incentive-based demand response is not widespread. There are multiple reasons for the lack of greater usage, including:
• Need for investment in meters and other enabling technology. Without the ability to measure consumption by time of day (preferably hourly – See Chapter III), it will be difficult to offer and conduct many incentive-based demand response programs, and to measure any reductions. Customers and LSEs also need new automation or control equipment or retrofits
156 UtiliPoint, Outlook and Evaluation of Demand Response, June 10, 2005. 157 UtiliPoint, Outlook, 18, 22-23.
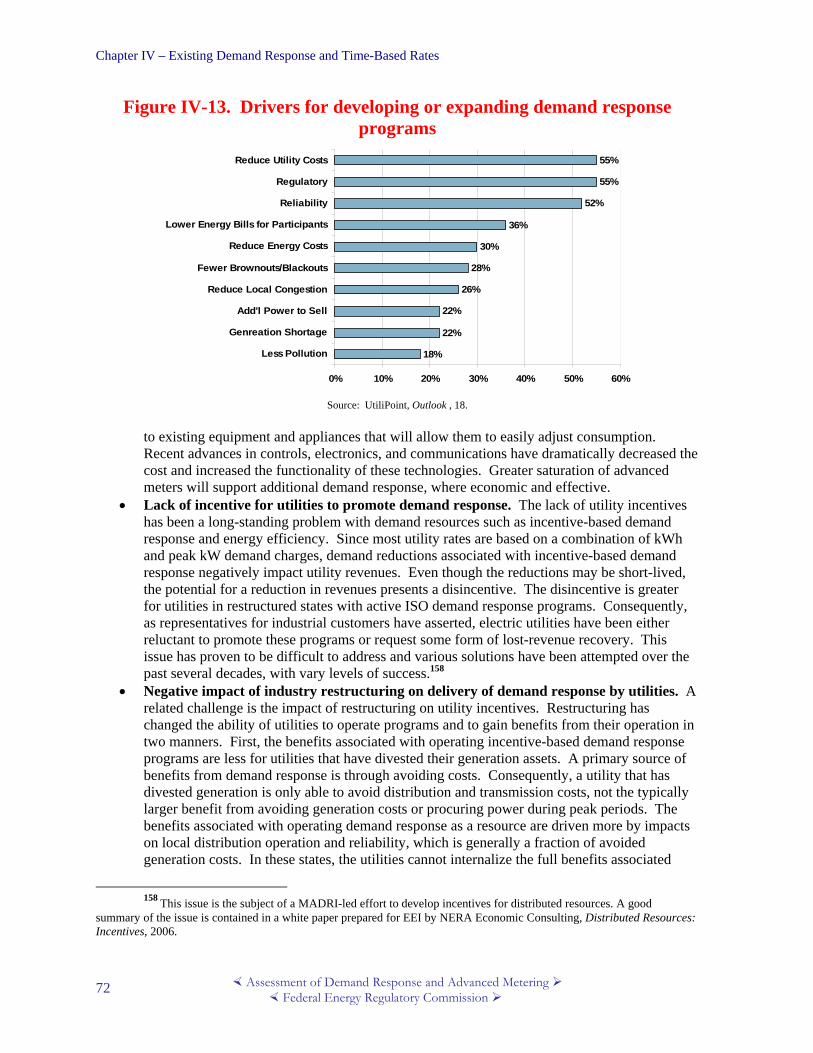
Chapter IV – Existing Demand Response and Time-Based Rates
Assessment of Demand Response and Advanced Metering Federal Energy Regulatory Commission
72
Figure IV-13. Drivers for developing or expanding demand response programs
18%
22%
22%
26%
28%
30%
36%
52%
55%
55%
0% 10% 20% 30% 40% 50% 60%
Less Pollution
Genreation Shortage
Add'l Power to Sell
Reduce Local Congestion
Fewer Brownouts/Blackouts
Reduce Energy Costs
Lower Energy Bills for Participants
Reliability
Regulatory
Reduce Utility Costs
Source: UtiliPoint, Outlook , 18.
to existing equipment and appliances that will allow them to easily adjust consumption. Recent advances in controls, electronics, and communications have dramatically decreased the cost and increased the functionality of these technologies. Greater saturation of advanced meters will support additional demand response, where economic and effective.
• Lack of incentive for utilities to promote demand response. The lack of utility incentives has been a long-standing problem with demand resources such as incentive-based demand response and energy efficiency. Since most utility rates are based on a combination of kWh and peak kW demand charges, demand reductions associated with incentive-based demand response negatively impact utility revenues. Even though the reductions may be short-lived, the potential for a reduction in revenues presents a disincentive. The disincentive is greater for utilities in restructured states with active ISO demand response programs. Consequently, as representatives for industrial customers have asserted, electric utilities have been either reluctant to promote these programs or request some form of lost-revenue recovery. This issue has proven to be difficult to address and various solutions have been attempted over the past several decades, with vary levels of success.158
• Negative impact of industry restructuring on delivery of demand response by utilities. A related challenge is the impact of restructuring on utility incentives. Restructuring has changed the ability of utilities to operate programs and to gain benefits from their operation in two manners. First, the benefits associated with operating incentive-based demand response programs are less for utilities that have divested their generation assets. A primary source of benefits from demand response is through avoiding costs. Consequently, a utility that has divested generation is only able to avoid distribution and transmission costs, not the typically larger benefit from avoiding generation costs or procuring power during peak periods. The benefits associated with operating demand response as a resource are driven more by impacts on local distribution operation and reliability, which is generally a fraction of avoided generation costs. In these states, the utilities cannot internalize the full benefits associated
158 This issue is the subject of a MADRI-led effort to develop incentives for distributed resources. A good
summary of the issue is contained in a white paper prepared for EEI by NERA Economic Consulting, Distributed Resources: Incentives, 2006.
Chapter IV – Existing Demand Response and Time-Based Rates
Assessment of Demand Response and Advanced Metering Federal Energy Regulatory Commission
73
with these programs, and additional benefits accrue either to the customer or potentially to a third-party vendor. Second, as was discussed earlier, in some states, such as Texas, distribution companies are not allowed to offer demand response as a service. While these factors reflect key underlying cost and benefit issues, they may represent transitional problems. Ultimately, the proper allocation of costs and benefits should result in competition and innovation among retailers that may include demand response programs and time-based rates.
• Subsidization. The form of payment for reductions in incentive-based demand response programs is viewed as a subsidy by many parties, including economists such as Larry Ruff and by industry associations such as EEI. The basic argument raised by these parties is that the correct form of inducing demand response is through pricing and that “any payment to a customer for demand reduction should never exceed the wholesale price minus the retail price that the customers would have otherwise paid to own the power. Any payment above this level would be a subsidy, that is, a nonmarket payment that has to be recovered through a tax or charge on all customers.”159
• Measurement of demand reductions. The measurement of demand reductions associated with incentive-based demand response programs has proven to be a difficult and controversial problem, particularly for demand-bidding, emergency demand response, and capacity programs.160 The key measurement issue is how to calculate the level of consumption that would have occurred if the participant had not curtailed consumption – i.e., the customer baseline level. Once the customer baseline is determined, the level of reduction is calculated by subtracting the actual demand from the estimated baseline normal demand. However, there are a variety of means to estimate the baseline that are used by utilities and ISOs,161 typically involving an average of usage over several recent days. A key problem with most estimation methods is the potential for gaming – participants may bid into the market or state that they will curtail when they would already be shut down for the day. The ultimate solution for this measurement problem would be to directly measure usage in real-time or to move toward specific entitlements or to set reduction levels, instead of after-the-fact measurement and estimation.
• Boom-bust nature of demand response. A fundamental challenge with incentive-based demand response is the boom-bust nature of electric markets. The use of incentive-based demand response is largely concentrated during periods of tight supplies or reserve shortages. When generation is plentiful, the need for these programs is less, with consequent reduction in payments – either through reduced capacity payments or through infrequent usage. This overcapacity situation exists today in many parts of the country. As a result, customer interest may atrophy and demand response programs are likely to be mothballed or terminated in these regions. However, when supply and demand become tighter, the stock of available demand response resources may not be adequate.
• Valuation and cost-effectiveness. One of the key challenges for regulatory approval and review of demand response is the lack of an adopted method or consensus procedure for the evaluation and definition of cost-effectiveness. The cost-effectiveness tests that were developed to assess demand-side management in the 1980s and 1990s162 focus on avoided
159 Richard Tempchin (EEI), FERC Technical Conference, transcript, 26-27. 160 Measurement issues are less for interruptible/curtailable tariffs because the tariffs generally specify the level of
demand reduction or specify the level to which the facility demand must not exceed during an event. 161 A review of baseline methods can be found in Xenergy, “Protocol Development for Demand Response
Calculation,” prepared for the California Energy Commission, Contract 400-28-002, August 2002. 162 The most recent version of tests that were developed in the 1980s is California Standard Practice Manual:
Economic Analysis of Demand-Side Programs And Projects, State of California, Governor’s Office of Planning and

Chapter IV – Existing Demand Response and Time-Based Rates
Assessment of Demand Response and Advanced Metering Federal Energy Regulatory Commission
74
generation costs and are inadequate to capture the additional market and reliability benefits that demand response can bring to retail and wholesale markets. Several ISO/RTOs have attempted to evaluate the cost-effectiveness of demand response in their yearly evaluations, but there is no consistency among them. The Demand Response Resource Center is conducting a comprehensive evaluation and results from this research should be available in late 2006.163
• Delayed payments to demand response providers. One problem in ISO/RTO markets is the delayed processing and disbursement of payments for demand reductions. ISOs typically wait 60 days or more to finalize settlements. Customers and curtailment service providers object that this delay creates cash flow problems.
• Customer inertia/desire for simplicity. Most customers (particularly residential ones) will be resistant to programs if they require effort, such as when the basic design of the program is not simple. Focusing these educational efforts first on the largest customers will allow these customers to adequately assess the rewards and costs associated with participation in demand response programs. Experience in other states such as New York and California (which use some system benefit funds for customer education) has shown that targeted customer education and training increases participation and response rates.
• Focus on single time-based rate program structures. Because of their different needs and knowledge levels of how to respond, as well as their varying abilities to respond, customers need targeted and ongoing training and education to help them understand how to increase their response rates to demand response programs. Customer price-responsiveness varies significantly by market segment among commercial and industrial users. The differences in customers’ ability to respond at peak times and the degree to which they are able or willing to respond implies that policy-makers need to create a portfolio of dynamic pricing products from which customers can choose and offer different incentives to different types of customers.
• Need for simple and fair time-based pricing. The principles of simplicity and fairness are keys to the success of real-time programs. UtiliPoint found that “as long as customers are convinced that utility-posted prices are fair and reflect actual system circumstances, and are based on competitive markets, they will accept them as the basis for time-varying rates.”164 This seems to be a common refrain from satisfied customers. Customers notified by various means about daily prices and price spikes achieve better responses and are more satisfied with the programs. Both in re-regulated electricity markets and traditional utility territories, multiple notification channels (such as toll-free numbers, pagers, cell phones, and the Internet) increase success rates of RTP programs. Customers’ use of programmable communicating thermostats is important for easier response to these rates. 165
• Mandatory vs. voluntary participation in price-based programs. Experience has shown that when participation in price-based programs is voluntary, the level of customer participation and aggregate load reductions have been modest.166 Voluntary TOU or RTP programs with opt-in can create a self-selection bias problem from the perspective of some LSEs: customers who know they already use less at peak enroll, while those who use more at peak but who may not want to risk shifting or paying higher peak prices do not. Thus, little or
Research, July 2002, http://drrc.lbl.gov/pubs/CA-SPManual-7-02.pdf.
163 See http://drrc.lbl.gov/drrc-ron-7-21-05.html 164 Bernie Neenan, “Taxonomy of Time-Varying Pricing Designs,” UtiliPoint IssueAlert, March 29, 2006), 4. 165 Patti Harper-Slaboszewicz, “Analysis of Time-Based Retail Pricing for Smaller Customers,” presentation at
“American Utility Week” Conference, Atlanta, GA, April 25, 2006. 166 Charles Goldman, “Does Real-Time Pricing Deliver Demand Response?,” New England Restructuring
Roundtable 2005, 7, 11.

Chapter IV – Existing Demand Response and Time-Based Rates
Assessment of Demand Response and Advanced Metering Federal Energy Regulatory Commission
75
no load is shifted from peak, defeating the purpose of the program. In addition, since most voluntary time-based rate programs are designed to be revenue neutral (i.e., on- and off-peak rates designed to collect the same revenue as the non-TOU default tariff from a hypothetical customer), customers with below average on-to-off-peak consumption ratios are free riders who can reduce their bills by taking the TOU rate option without changing their consumption behavior. The revenue shortfall can have undesirable consequences and possibly create revenue losses for LSEs.167 Customers tend to stay in voluntary programs with clear opt-out options. Customer responses to well-designed, simple programs they perceive as fair are high: they want to stay in the programs, and felt they achieved savings and control. Experience in California suggests that customers especially like dynamic pricing programs that pair automated customer technologies. Customers with access to smarter appliances and systems thought they became more aware of their energy use and costs as well as their routines at home and at work.168
• Varying willingness among utilities to work with third parties. A 2005 demand response survey found dramatic differences among traditional IOUs, co-ops, and municipal electric utilities (munis) in their preferences in partnering with third parties.169 Co-ops, which believe they already have a higher interest in using demand response to lower their customers’ bills, have a high negative response to using third parties. It is likely that the best fit for third-party involvement may be in organized markets where third parties can aggregate load across IOUs or where aggregators can offer one program design for large companies with multiple locations. Third parties may offer models to bridge that gap for customers served by traditional utilities.
Demand Response Activities at the State, Regional and Federal Level While the trend in utility investment and activity in demand response over the last decade has been downward, there has been a recent upsurge in interest and activity in demand response nationally and, in particular, regional markets.170 A recent study stated, “the resurgence of demand response programs stems directly from their rediscovered value as a dual hedge against both reliability risks such as generation shortfalls and transmission congestion, as well as financial risks such as wholesale price spikes.”171 This upsurge has been the result of several factors. First, tight supply conditions in densely populated regions such as California, New York, and the Chicago area created a need for resources that could be quickly deployed. Second, the development of organized markets within ISOs or RTOs created an interest and need for demand response resources. These ISOs/RTOs created programs to coordinate and encourage demand response programs offered by unregulated providers and utilities. These programs have been found to be effective, and have had a far larger impact on market prices
167 Chi-Keung Woo et al., “Pareto-superior time-of-use rate option for industrial firms,” Economics Letters (1995),
267-272. 168 A post-pilot analysis of California’s statewide pricing program described 87 percent of pilot customers who
perceived program as fair; many stayed on the rate after the pilot was over, although they then paid for the enabling equipment they were given during the pilot. George & Faruqui, CRA (March 2005), 13.
169 UtiliPoint, Outlook, 26-37. 170 Note that the EIA and NERC data sources may not be capturing this upswing because they do not collect
information from unregulated demand-response providers or ISOs/RTOs. The discussion in Chapter V indicates that when ISO programs are included, total resource contribution from demand response stabilized beginning in 2000.
171 Research Reports International, Demand Response Programs, 2005, 6.
Chapter IV – Existing Demand Response and Time-Based Rates
Assessment of Demand Response and Advanced Metering Federal Energy Regulatory Commission
76
than the costs avoided or incurred by the individual participating customer and the ISOs/RTOs.172 Third, state legislation or regulatory initiatives in many states have provided additional investment or requirements for additional demand response.
Activities at the state and regional level are extremely important to increasing the level of price-responsiveness in markets and promoting demand response. A recent CERA study found a “direct correlation … between the levels of regulatory support for implementing DSM programs and the level of energy savings achieved by the state’s utilities.”173 State activities can include direct investigations into demand-side issues, including demand response, time-of-use rates, and the feasibility of advanced metering. Important activities can also include state regulatory re-examination of utilities’ return structure for investment in demand response and advanced meters. State policies already distinguish a full range of demand-side tools to meet their energy needs beyond demand response defined only as load-curtailment, including energy efficiency, distributed generation, industrial response, and price-based demand response programs.174 Several states have initiated proceedings in response to EPAct 2005 Section 1252(b) on time-based metering and communications.
Section 1252 (g) (4)(A)-(B) directed states to commence consideration by August 2006, and to complete consideration by a year later.175 Many states have opened these proceedings; others, by virtue of related proceedings opened within the three years prior to the passage of EPAct 2005, can count those as qualifying. Other examples of state policies and regional cooperation include:
• The CPUC and the California Energy Commission are promoting demand response and advanced metering through its Statewide Pricing Pilot, Advanced Metering Initiative, and Energy Action Plan II. The Action Plan creates a “loading order” to meet capacity, which places demand response and energy efficiency goals before generation additions; those begin with renewable energy.176 The CPUC has required investor-owned utilities to meet five percent of their load requirements with demand response.177 While the CPUC rejected critical peak pricing as the default rate for commercial and industrial customers, it will re-examine it in utility rate cases to focus more on residential customers.178
• The Connecticut legislature passed “An Act Concerning Energy Independence” in July 2005, followed by recommendations from the Connecticut Energy Advisory Board. The Connecticut Energy Advisory Board advocated for the state to set goals to reduce its peak demand 10 percent by 2010; promote the increased development of demand response; develop and offer time-of-use rates, interruptible/curtailable tariffs, and advanced meters (beginning
172 For example, ISO-NE, Independent Assessment of Demand Response Programs of ISO New England Inc.,
Docket No. ER02-2330-040. 173 Hope Robertson, Cambridge Energy Research Associates (CERA); Focusing on the Demand Side of the Power
Equation: Implications and Opportunities (Private Report), Cambridge, MA: CERA, May 2006, 12. 174 For example Connecticut is offering financial incentives for industrials to use onsite non-grid connected
distributed generation, including CHP, under its Energy Independence Bill, July 21, 2005. 175 EPAct 2005 section 1252(g)(4)(A)-(B). 176 Sandra Fromm, et al., Implementing California’s Loading Order For Electricity Resources. California Energy
Commission Staff Report, July 2005. 177 CPUC Decision (D.) 03-06-032, June 2003. 178 Platts Megawatt Daily, May 30, 2006, 8-9 and SNL Energy Power Daily, May 26, 2006, 4.

Chapter IV – Existing Demand Response and Time-Based Rates
Assessment of Demand Response and Advanced Metering Federal Energy Regulatory Commission
77
with customers whose demand is more than 350 kW); and offer seasonal rates and aggressive education on energy efficiency, costs, and demand management to all customers.179
• New York, Texas, and California are examples of states that worked deliberately to coordinate policy across multiple agencies and stakeholders. In New York, this entails coordination between New York State Energy Research and Development Authority (NYSERDA), the NYISO, the NYPSC, and New York Department of Environmental Resources. While for those states, the ISO, the state, and the retail regulatory agency are nearly geographically the same, lessons about policy coordination across stakeholder agencies and jurisdictions are important for other areas where jurisdictional overlap or confusion impedes policy changes.
• Regional coalitions representing stakeholders from utilities, state public utility commissions, federal regulatory agencies, technology developers, metering companies, and third-party providers have been working together in the Mid-Atlantic (MADRI) and New England (NEDRI, Massachusetts Energy Technology Collaborative) states to find ways to collaborate on promoting demand response and advanced metering.
• State funding of programs, enabling technologies, and education, can advance these initiatives: “two state agencies – NYSERDA in New York and the CEC in California – have been conspicuous leaders in the demonstration of demand response (demand response) programs utilizing enabling technologies.”180
• State policies on standard offer service or “provider of last resort” (POLR) have increased the number of customers exposed to RTP and time-based rates and pricing. The default tariff rate for the largest customers in New Jersey and Maryland is currently a direct pass-through of the PJM real-time price. Similarly, large customers in National Grid USA’s New York territory have been exposed to real-time prices since 1998.181 The NYPSC recently directed utilities to file draft tariffs that would make real-time hourly pricing mandatory for their largest customer classes already subject to mandatory time-of-use rates.182 The law further requires that voluntary time-of-use rates be available for New York residential customers.183
Another key development is that third-party providers have emerged whose only business is to maximize demand response and use related technologies. They aggregate and deliver load-response to markets, and have skills needed to monitor energy markets and prices. These third parties provide a valuable service to customers, because many large consumers have limited expertise or experience with aggregating or managing demand response, especially in markets. An Lawrence Berkeley National Laboratory survey showed that 70 percent of business managers in Niagara Mohawk’s RTP program rarely or never monitored next-day hourly prices; only 17 percent consulted prices routinely; 13 percent only checked day-ahead hourly prices when other signals (such as NYISO events or very hot weather) suggested they would be high.184 Most businesses monitor their own business, not the energy business.
179 Connecticut, PA 05-1: An Act Concerning Energy Independence. 180 Charles Goldman, Michael Kintner-Meyer, and Grayson Heffner, Do "Enabling Technologies" Affect Customer
Performance in Price-Responsive Load Programs? Lawrence Berkeley National Laboratory: LBNL-50328, August 2002, 3. 181 Galen Barbose et al., LBNL-57661. 182 Case 03-E-0641, “Proceeding on motion of the Commission regarding expedited implementation of mandatory
hourly pricing for commodity service, Order instituting further proceedings and requiring the filing of draft Tariffs,” September 23, 2005.
183 N.Y. Pub. Serv. Law § 66(27). 184 Charles Goldman, October 28, 2005.
Chapter IV – Existing Demand Response and Time-Based Rates
Assessment of Demand Response and Advanced Metering Federal Energy Regulatory Commission
78
Examples of third-party providers and the services and innovative practices that they conduct include:
Comverge is a vendor of smart, or programmable, communicating thermostats. These are replacing DLC equipment from utility legacy programs, or being installed fresh. These thermostats can be used to support time-based rate programs such as critical peak pricing.
EnerNOC is a curtailment-service provider (CSP) or load aggregator for emergency demand response. EnerNOC has aggregated load reductions in the commercial buildings sector, and has sold these reductions into ISO/RTO emergency demand response and capacity programs. It has systems installed in New England, California, and New York. Participating businesses, office buildings, and other medium-sized participants benefit through lower bills or rebate checks.185
Consumer PowerLine (CPLN) is another aggregator that has been innovative in working with urban multiple-family buildings as well as with commercial and industrial customers. It aggregates pools of electricity from clients, creating a virtual power plant that local utilities or ISOs can call on with a half-hour’s notice.
The federal government also has been supportive of demand response. DOE has funded multiple projects, which included analyses of the value of demand response, research and development on technologies such as automated controls,186 and support for regional examinations of demand response and distributed resources (such as MADRI). The Federal Energy Management Program has incorporated advanced metering and demand response directly into policies and procedures that it expects federal facility managers to consider.187 The GAO examined demand response in two reports in 2004 and 2005.
185 CNet news.com., April 29, 2005. 186 The Pacific Northwest National Laboratory began a pilot called “Gridwise” in January 2006, involving about
300 volunteers and 200 homes. Gridwise supports a regional initiative to test and speed adoption of new smart grid technologies that can make the power grid more resilient and efficient. The homes in the pilot receive real-time price information through a broadband Internet connection and automated equipment that adjusts consumers’ energy use based on price. Some customers also have computer chips embedded in their dryers and water heaters that can sense when the power transmission system is under stress and automatically turn off certain functions briefly until the grid can be stabilized by power operators.
187 EnergyBizInsider, “Letters from Readers”, Apr. 5, 2006, letter from Kevin Myles, GSA.
Chapter V – Demand Response as a Resource
Assessment of Demand Response and Advanced Metering Federal Energy Regulatory Commission
79
Chapter V. Demand Response as a Resource188 This chapter addresses the third area, in EPAct section 1252(e)(3), that Congress directed the Commission to consider:
(C) the annual resource contribution of demand resources; This chapter develops an estimate of the annual resource contribution of demand resources in the United States of about 37,500 MW, and discusses the potential for demand response as a resource for utilities and load serving entities.189 Information on demand response programs and time-based rates collected in the FERC Demand Response and Advanced Metering (FERC Survey) forms the basis for this estimate. This chapter is organized into three sections:
• Description of the resource contribution information on demand response programs collected in the FERC Survey
• Demand response resource contribution estimates from the FERC Survey • Commission staff estimates of resource contribution from existing programs
FERC Survey: Demand Response Program Information The FERC Survey collected comprehensive information from entities on their demand response programs and time-based rates and tariffs. The survey allowed respondents to provide information on up to eight demand response programs/tariffs for each customer class.190 When a particular program/tariff was applicable to more than one customer class (e.g. industrial and commercial), respondents were asked to enter the relevant information for each customer class. For wholesale customers, data collected included: enrolled load (in MW) and program design information such as minimum reduction, response time, and others. For each program and/or tariff, respondents were requested to provide a short description of features, number of customers enrolled, maximum demand (in MW) of enrolled customers, potential peak reductions (in MW), and actual peak reductions (in MW).191 The FERC Survey defines information on demand response potential for demand response programs or time-based tariffs as:
188 Chuck Goldman and Ranjit Bharvirkar of Lawrence Berkeley National Laboratory assisted with the drafting of
this chapter. 189 Chapter VI continues this discussion of the potential for demand resources for regional planning and explores
how demand resources can be analyzed and included in regional planning and transmission expansion and operation. 190 Customers were classified as residential, commercial, industrial, transportation, and other. 191 Wholesale entities were not required to report demand response program information by customer class; thus
they are treated as a separate category in addition to residential, commercial, industrial, and other customers. From program evaluations conducted by several Independent System Operator/Regional Transmission Organizations (ISOs/RTOs), industrial and commercial customers account for the bulk of enrolled load, although Curtailment Service Providers (CSPs) and Load Serving Entities (LSEs) are allowed to aggregate load reductions from residential customers to participate in ISO/RTO demand response programs. However, it was not possible to develop estimates by customer class for each ISO/RTO.

Chapter V – Demand Response as a Resource
Assessment of Demand Response and Advanced Metering Federal Energy Regulatory Commission
80
Potential Peak Reduction (PPR): The potential annual coincident peak load reduction (as measured in MW) that can be deployed from demand response programs, rates and tariffs that coincides with the annual system peak load of the entity (see Figure V-1 which shows a stylized example for a medium-sized utility with a large demand response program).192 The survey asked respondents to provide PPR as of the end of 2005. This quantity reflects the installed load reduction capability and represents the load that can be reduced either by the direct control of the utility system operator or by the customer in response to a utility request to curtail load. PPR forms the basis for the estimates of resource contribution requested by Congress. Actual Peak Reduction (APR): The coincident reductions to the annual peak load (as measured in MW) in 2005 achieved by customers that participate in a demand response program that coincides with the annual system peak of the utility or Independent System Operator (ISO). The PPR values provided by entities for the various customer classes and enrolled load information provided by wholesale market entities (e.g., ISOs) serve as the primary basis for estimating the annual resource contribution of demand response resources. Commission staff developed estimates of the annual demand response resource contribution for various United States regions and by type of entity, along with comparisons of actual peak reductions vs. potential peak reduction capability.
Figure V-1. Schematic representation of demand response potential peak reduction for a demand response program
0
1000
2000
3000
4000
5000
6000
7000
1 2 3 4 5 6 7 8 9 10 11 12 13 14 15 16 17 18 19 20 21 22 23 24
Hours of the day
Max
imum
Dem
and
ofE
nrol
led
Cus
tom
ers (
MW
)
Non-Discretionary Load
Discretionary Load
Load Curtailment
Utility SystemPeak
Total Load
Source: Federal Energy Regulatory Commission
The following sections present estimates for resource contribution. First, the report summarizes the results from the FERC Survey for PPR. Second, it estimates resource contribution by combining data from the FERC Survey with publicly available information on demand response capacity. The FERC
192 The entity can be an investor-owned utility, a cooperative utility, a political sub-division, a municipal utility, a
municipal marketing authority, a federal or state utility, an ISO or an RTO, a power marketer, or a curtailment service provider.
Chapter V – Demand Response as a Resource
Assessment of Demand Response and Advanced Metering Federal Energy Regulatory Commission
81
Survey results were supplemented with the additional information because, after reviewing the data provided by survey respondents, it became clear that the FERC Survey results alone should not be utilized to estimate the annual demand response resource contribution because of various data quality issues (e.g., non-response, missing data on demand response potential).
FERC Survey Results: Demand Response Resource Estimates
Potential Peak Load Reduction of Demand Response Programs and Time-Based Rates The total potential peak reduction for all regions and customer classes is 29,655 MW (see Figure V-2) based on the FERC Survey data. This represents approximately four percent of the total United States projected electricity demand for summer 2006 (743,927 MW).193 The Reliability First (RFC) region accounts for the largest share of potential peak reduction for existing demand response resources (24 percent) followed by the Midwest Reliability Organization (MRO) and SERC Reliability Corporation (SERC) regions (approximately 16 percent each).194 Wholesale demand response programs195 (primarily operated by ISOs and RTOs) account for about 30 percent of the total demand response resource potential peak reductions nationally and about 50 percent or more of regional resource contribution in three regions: Electricity Reliability Council of Texas (ERCOT) (80 percent); RFC (55 percent); and the Northeast Power Coordinating Council (NPCC) (49 percent). In contrast, wholesale demand response programs account for only about six percent of the potential peak reduction in the MRO and five percent in SERC. Demand response programs/tariffs targeted to industrial customers provide 32 percent of the total national demand response resource potential. This potential is concentrated in two regions – SERC (73 percent of total regional potential) and MRO (57 percent). Residential customers account for about 20 percent of total demand response resource potential nationally and represent nearly 1,000 MW or more in several regions (Florida Reliability Coordinating Council (FRCC), MRO, RFC, and the Western Electricity Coordinating Council (WECC)). In the FRCC region, residential customers provide 58 percent of the regional demand response resource potential. Commercial customers account for about 16 percent of the demand response resource potential at a national level. Investor-owned utility-operated demand response programs and time-based tariffs account for 44 percent of total national demand response resource potential (see Figure V-3). The second largest contributors of demand response resource are ISOs and RTOs (24 percent). Cooperative utilities (including political sub-divisions)196 and federal/state utilities each provide approximately 13 percent of the demand response resource potential. Most of the demand response resource for federal and state utilities is available from industrial customers (66 percent of total potential from companies in this category); in contrast, residential and commercial customers provide about 43 percent of the demand response potential for cooperative utilities and political sub-divisions.
193 NERC, 2005 Long-term Reliability Assessment, September 2005. 194 The report includes a complete listing and map of the NERC regions in Chapter I. 195 In wholesale demand response programs, retail companies aggregate individual customer load reductions and
sell or provide the reductions to the wholesale provider. 196 While Commission staff tracked responses from electric cooperatives and political subdivisions in the FERC
Survey, this report combines results due to their similarity.

Chapter V – Demand Response as a Resource
Assessment of Demand Response and Advanced Metering Federal Energy Regulatory Commission
82
Figure V-2. Demand response potential peak reduction by region and
customer class
0
2000
4000
6000
8000
ERCOT FRCC MRO NPCC RFC SERC SPP WECC Other
Pote
ntia
l Pea
k R
educ
tions
(MW
)Wholesale Other (Agriculture)IndustrialCommercialResidential
Source: FERC Survey
Notes: Other reliability region includes Alaska and Hawaii
Figure V-3. Demand response potential peak load reduction by type of entity and customer class
0
3000
6000
9000
12000
15000
Investor-Owned Utility
CooperativeUtility and
Political Sub-division
MunicipalUtility andMunicipalMarketingAuthority
CurtailmentService
Provider andPower
Marketer
Federal andState Utilities
ISO/RTO
Pote
ntia
l Pea
k R
educ
tions
(MW
) Wholesale Other (Agriculture)IndustrialCommercialResidential
Source: FERC Survey

Chapter V – Demand Response as a Resource
Assessment of Demand Response and Advanced Metering Federal Energy Regulatory Commission
83
Electric industry participants were also asked to provide information in the FERC Survey on the type of demand response programs or time-based tariffs offered to customers.197 The results are displayed in Figure V-4. Interruptible/curtailable tariffs account for about 7,504 MW of demand response resource potential (27 percent of the total national potential), followed closely by direct load control (DLC) (24 percent). Most of the potential peak reduction associated with interruptible/curtailable tariffs is available from industrial customers (84 percent of total interruptible/curtailable potential), while most of the DLC resource is available from residential customers (84 percent of the total direct load potential). In contrast, a significant share of the demand response resource potential in ancillary services, capacity market programs, demand bidding, and emergency demand response programs are provided by wholesale customers of ISOs and RTOs. Respondents indicated that a number of demand response programs/tariffs, primarily targeted to industrial and commercial customers, had more than one type of program feature; these entries were classified in the “Multiple” category after review of data quality.
Figure V-4. Resource potential of various types of demand response programs and time-based tariffs
0
2000
4000
6000
8000
Interru
ptible
Direct
Load C
ontrol
Emergen
cy D
eman
d Res
ponse
Capac
ity
Ancillar
y Serv
ices
Deman
d Bidding
Multiple
Other
Real-T
ime P
ricing
Critica
l Pea
k Pric
ing
Time-o
f-UsePo
tent
ial P
eak
Red
uctio
ns (M
W)
ISO/RTOOther (Agriculture)IndustrialCommercialResidential
Incentive-based DR Programs Time-based Tariffs
Source: FERC Survey
Based on responses to the FERC Survey, time-varying pricing tariffs (includes time-of-use, real-time pricing, and critical peak pricing) comprise only five percent of the total demand response resource potential. However, it is likely that the reported PPR values for time-based tariffs, particularly time-of-use rates, are too low for several reasons. First, 67 percent of the survey respondents that stated that they offered time-of-use type programs only provided data on the number of customers signed up for the tariff, and were unable to provide a demand response resource potential value. Second, it is more difficult for respondents to accurately estimate the demand response potential for customers on
197 See Chapter IV for a detailed discussion of the various demand response program and time-based rate types.

Chapter V – Demand Response as a Resource
Assessment of Demand Response and Advanced Metering Federal Energy Regulatory Commission
84
time-varying tariffs because estimates of customer demand elasticities are typically required.198 It is unclear what methods respondents used to estimate demand response potential for customers on time-varying tariffs. However, it is clear that demand response resource potential reported by respondents for time-of-use tariffs significantly underestimates this quantity because of missing data for PPR values.
Actual vs. Potential Peak Reductions of Demand Response Programs and Time-Based Rates Potential versus actual peak load reductions for demand response programs for each reliability region in Figure V-5. In interpreting information on actual peak reductions of demand response programs or time-based tariffs, it is important to recognize that: (1) certain types of demand response programs (interruptible/curtailable tariffs, emergency demand response programs, and DLC) are often only called on during system emergencies, which are infrequent and do not occur each year because they are dependent on weather and system conditions; (2) activity levels in “economic” demand response programs (e.g., demand bidding) are influenced by the volatility and level of electricity commodity prices; (3) demand response program design features influence customer response (e.g. penalties for non-performance); and (4) most utilities do not routinely track or estimate actual peak reductions for customers on time-based rates as measurement and evaluation studies are required – consequently, survey non-response is an issue for time-based rates. On a national basis, respondents to the FERC Survey reported about 8,716 MW of actual peak reductions in 2005. Although the RFC region has the largest existing demand response resource potential (see Figure V-2), respondents reported that demand response programs and price-based tariffs in the MRO, WECC and SERC regions accounted for the largest number of MWs actually deployed in 2005 (see Figure V-5). The ratio of actual to potential peak load reductions for demand response programs was between 40-50 percent in three regions (FRCC, MRO, and WECC). It is important to note that ISO/RTOs did not report actual peak load reductions in the FERC Survey, which potentially leads to underestimates of actual peak reduction for those regions with significant wholesale demand response programs.199 In Table V-1, the median value of the ratio of actual to potential peak reductions is presented for various types of demand response programs. Among the sample of DLC programs, the actual peak load reduction in 2005 is 56 percent of the potential peak reduction for the typical (i.e., median) program.200 For interruptible/curtailable tariffs, the actual peak load reduction is lower: median value of 39 percent of the potential peak reduction.201 These results suggest that a DLC program (because the utility has some control over the customer’s end use equipment) may offer a more predictable
198 Customer demand models require hourly interval usage data, retail prices, and information on customer
characteristics. 199 PJM reported a maximum hourly reduction of 205 MW out of 1,619 MW of emergency demand response
resource and 226 MW out of 2,210 MW of economic resources. ISO-NE reported a total energy reduction of 66,251 MWh from 472 MW of demand response resources enrolled in various programs. (Reference: State of the Market Reports for PJM and ISO-NE. ERCOT reports that Load Acting as a Resource (LAAR) provided 4,637 GWh in 2005 and received $71.1M in payments (S. Krein, “Load Participation in ERCOT Ancillary Services Markets,” April 18, 2006, AESP Brown Bag Seminar).
200 Another interpretation is that the median value of 0.75 (or 75 percent) indicates that exactly half of the demand response programs targeted to residential customers have the ratio of APR to PPR greater than 0.75 in 2005.
201 Customers on I/C tariffs typically initiate and control load curtailments when events are called by the utility (in contrast to residential customers in DLC programs); most I/C tariffs include penalties for non-performance.
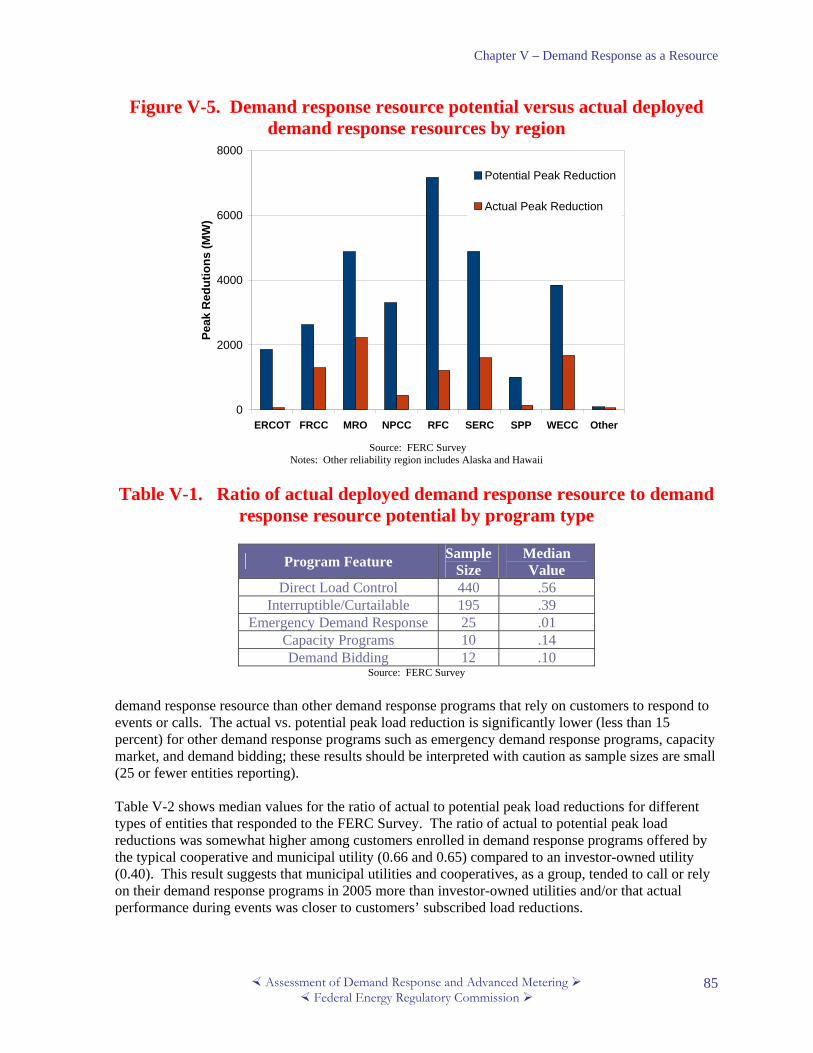
Chapter V – Demand Response as a Resource
Assessment of Demand Response and Advanced Metering Federal Energy Regulatory Commission
85
Figure V-5. Demand response resource potential versus actual deployed demand response resources by region
0
2000
4000
6000
8000
ERCOT FRCC MRO NPCC RFC SERC SPP WECC Other
Peak
Red
utio
ns (M
W)
Potential Peak Reduction
Actual Peak Reduction
Source: FERC Survey
Notes: Other reliability region includes Alaska and Hawaii Table V-1. Ratio of actual deployed demand response resource to demand
response resource potential by program type
Program Feature Sample Size
Median Value
Direct Load Control 440 .56 Interruptible/Curtailable 195 .39
Emergency Demand Response 25 .01 Capacity Programs 10 .14 Demand Bidding 12 .10
Source: FERC Survey demand response resource than other demand response programs that rely on customers to respond to events or calls. The actual vs. potential peak load reduction is significantly lower (less than 15 percent) for other demand response programs such as emergency demand response programs, capacity market, and demand bidding; these results should be interpreted with caution as sample sizes are small (25 or fewer entities reporting). Table V-2 shows median values for the ratio of actual to potential peak load reductions for different types of entities that responded to the FERC Survey. The ratio of actual to potential peak load reductions was somewhat higher among customers enrolled in demand response programs offered by the typical cooperative and municipal utility (0.66 and 0.65) compared to an investor-owned utility (0.40). This result suggests that municipal utilities and cooperatives, as a group, tended to call or rely on their demand response programs in 2005 more than investor-owned utilities and/or that actual performance during events was closer to customers’ subscribed load reductions.

Chapter V – Demand Response as a Resource
Assessment of Demand Response and Advanced Metering Federal Energy Regulatory Commission
86
Table V-2. Ratio of actual demand response peak reduction versus potential peak load reduction
Type of Entity Sample Size Median
Value Investor-owned Utility 74 0.40 Co-operative Utility or Political Sub-division 209 0.66 Municipal Utility or Municipal Marketing Authority 91 0.65
Curtailment Service Provider or Power Marketer 9 0.37 Source: FERC Survey
Existing Demand Response Resource Contribution In this section, estimates of the existing demand response resource contribution for the United States drawing upon an analysis of FERC Survey responses and other sources (e.g., EIA Form 861, ISO/RTO demand response program evaluations) are presented.202 Nationally, existing demand response resource contribution of 37,552 MW is estimated. This represents approximately five percent of the total United States projected electricity demand for summer 2006.203 A breakdown of resource contribution by reliability regions is shown in Figure V-6. The three regions with the largest demand response resource contribution to the national total are RFC (22 percent of the total national potential) followed by SERC (21 percent) and MRO (16 percent). The demand response potential reported by entities in the RFC, SERC, and MRO reliability regions ranges from about 6,000 to over 8,000 MW in each region. Given that peak loads vary significantly among reliability regions, it is also useful to characterize the existing demand response potential capability relative to each region’s summer peak demand. Demand response resource potential ranges from three to seven percent in most NERC reliability regions, with the notable exception of the MRO region. The demand response resource potential reported by utilities in the MRO region as a share of the region’s summer peak demand is significantly higher (20 percent) compared to other reliability regions. Since the MRO value is significantly higher than the other regions, an exploratory analysis was conducted in an attempt to understand and offer possible explanations for this somewhat surprising result. First, several states (Minnesota and Iowa) in the MRO region currently have or previously had laws that required utilities to invest a certain percentage of revenues in demand side management programs (1.5-2 percent), which contributed to demand response resource development. Utilities in this region have made significant investments in residential DLC programs, including both air conditioning and water heating programs. Second, utilities in the upper Midwest have historically had favorable rules that allowed load management resources to be counted towards meeting reserve requirements. Third, the characteristics of the customer base in the region, particularly among industrial customers, may be relatively more favorable
202 Commission staff chose to draw upon additional sources for the resource contribution estimate because of data
quality issues associated with the potential peak reduction estimates in the FERC Survey. These issues included: non-response to the survey, missing or partial responses to the potential peak reduction questions, and possible double-counting. These issues and how the various data quality checks and corrections that the Commission staff utilized are discussed at greater length in Appendix F.
203 NERC, 2005.
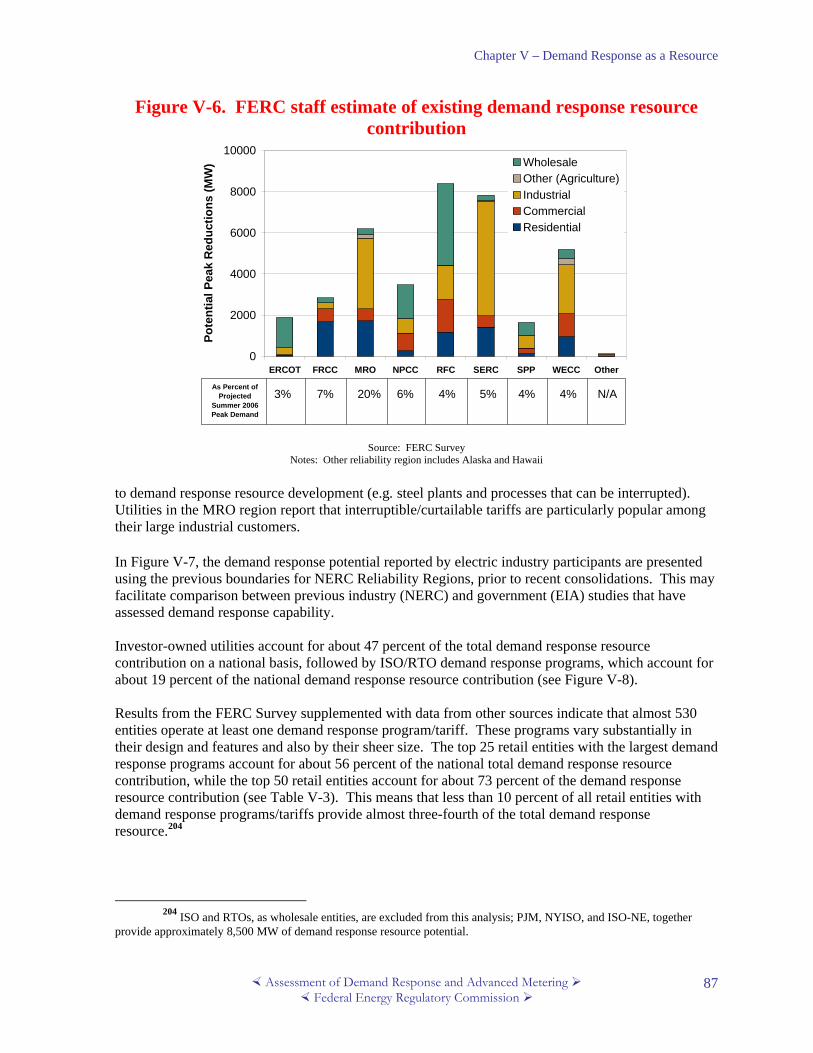
Chapter V – Demand Response as a Resource
Assessment of Demand Response and Advanced Metering Federal Energy Regulatory Commission
87
Figure V-6. FERC staff estimate of existing demand response resource contribution
0
2000
4000
6000
8000
10000
ERCOT FRCC MRO NPCC RFC SERC SPP WECC Other
Pote
ntia
l Pea
k R
educ
tions
(MW
) Wholesale Other (Agriculture)IndustrialCommercialResidential
As Percent of Projected
Summer 2006 Peak Demand
3% 4%5%4%6%20%7% 4% N/A
Source: FERC Survey
Notes: Other reliability region includes Alaska and Hawaii to demand response resource development (e.g. steel plants and processes that can be interrupted). Utilities in the MRO region report that interruptible/curtailable tariffs are particularly popular among their large industrial customers. In Figure V-7, the demand response potential reported by electric industry participants are presented using the previous boundaries for NERC Reliability Regions, prior to recent consolidations. This may facilitate comparison between previous industry (NERC) and government (EIA) studies that have assessed demand response capability. Investor-owned utilities account for about 47 percent of the total demand response resource contribution on a national basis, followed by ISO/RTO demand response programs, which account for about 19 percent of the national demand response resource contribution (see Figure V-8). Results from the FERC Survey supplemented with data from other sources indicate that almost 530 entities operate at least one demand response program/tariff. These programs vary substantially in their design and features and also by their sheer size. The top 25 retail entities with the largest demand response programs account for about 56 percent of the national total demand response resource contribution, while the top 50 retail entities account for about 73 percent of the demand response resource contribution (see Table V-3). This means that less than 10 percent of all retail entities with demand response programs/tariffs provide almost three-fourth of the total demand response resource.204
204 ISO and RTOs, as wholesale entities, are excluded from this analysis; PJM, NYISO, and ISO-NE, together
provide approximately 8,500 MW of demand response resource potential.
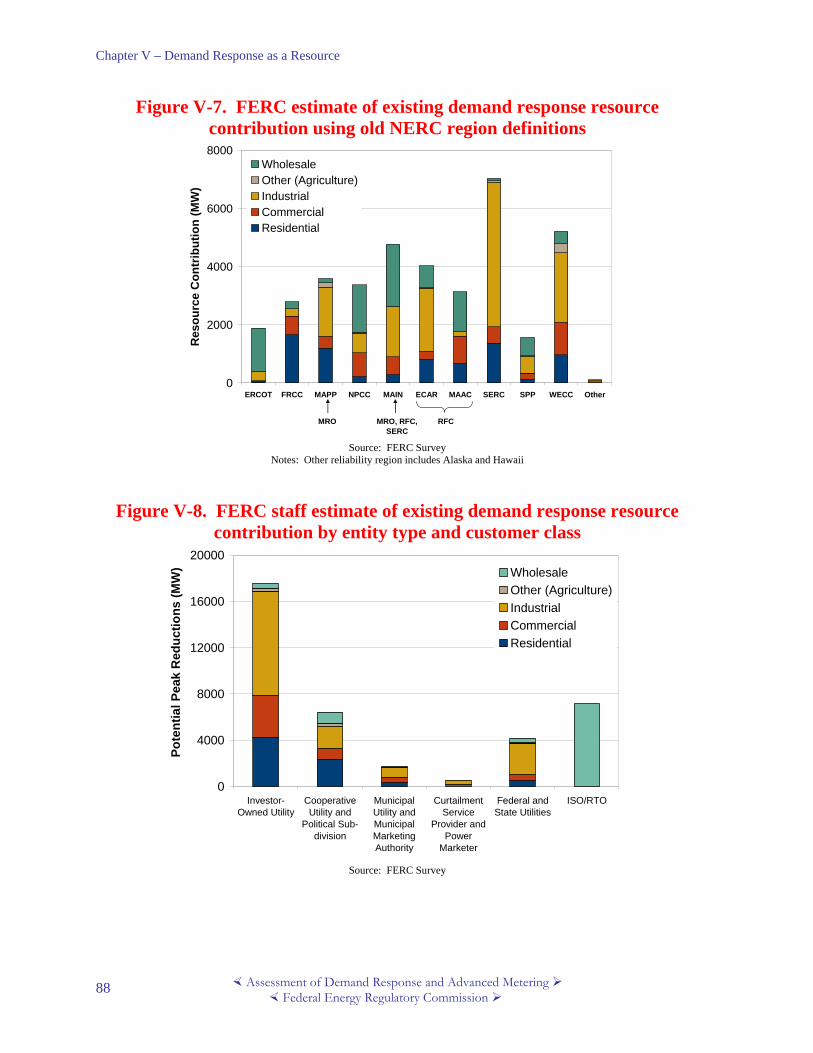
Chapter V – Demand Response as a Resource
Assessment of Demand Response and Advanced Metering Federal Energy Regulatory Commission
88
Figure V-7. FERC estimate of existing demand response resource contribution using old NERC region definitions
0
2000
4000
6000
8000
ERCOT FRCC MAPP NPCC MAIN ECAR MAAC SERC SPP WECC Other
Res
ourc
e C
ontr
ibut
ion
(MW
)
WholesaleOther (Agriculture)IndustrialCommercialResidential
RFCMRO MRO, RFC, SERC
Source: FERC Survey Notes: Other reliability region includes Alaska and Hawaii
Figure V-8. FERC staff estimate of existing demand response resource contribution by entity type and customer class
0
4000
8000
12000
16000
20000
Investor-Owned Utility
CooperativeUtility and
Political Sub-division
MunicipalUtility andMunicipalMarketingAuthority
CurtailmentService
Provider andPower
Marketer
Federal andState Utilities
ISO/RTO
Pote
ntia
l Pea
k R
educ
tions
(MW
) Wholesale Other (Agriculture)IndustrialCommercialResidential
Source: FERC Survey
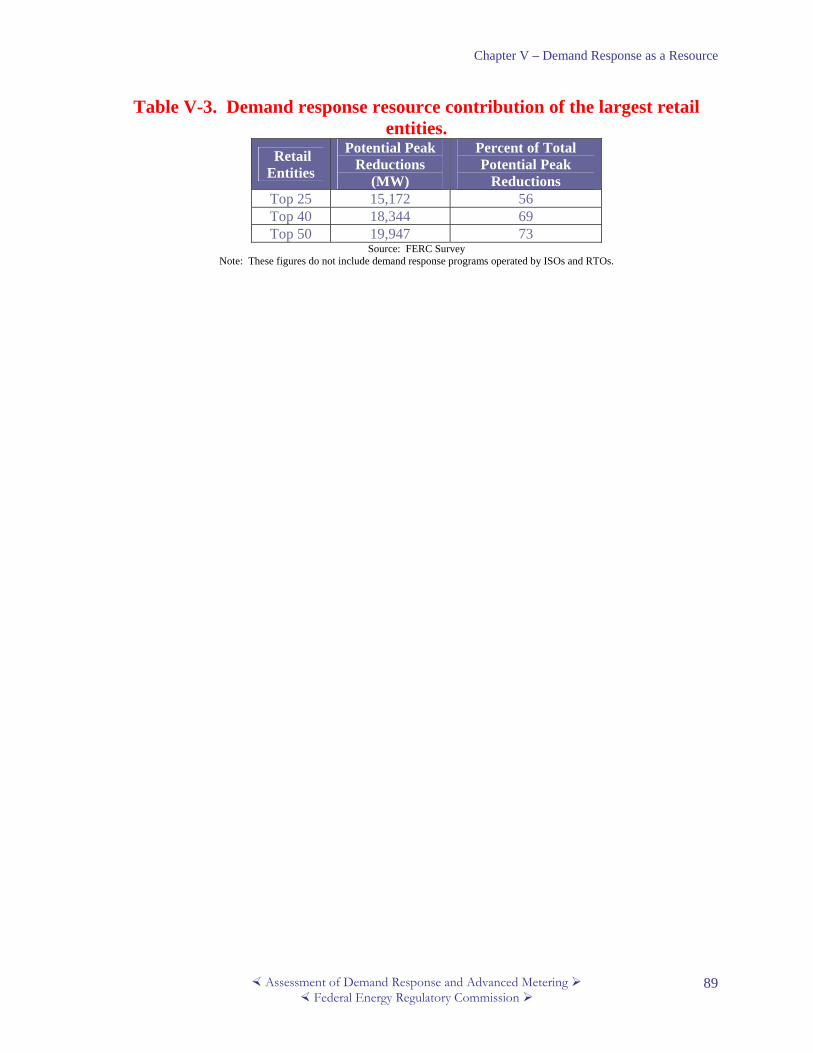
Chapter V – Demand Response as a Resource
Assessment of Demand Response and Advanced Metering Federal Energy Regulatory Commission
89
Table V-3. Demand response resource contribution of the largest retail entities.
Retail Entities
Potential Peak Reductions
(MW)
Percent of Total Potential Peak
Reductions Top 25 15,172 56 Top 40 18,344 69 Top 50 19,947 73
Source: FERC Survey Note: These figures do not include demand response programs operated by ISOs and RTOs.

Chapter V – Demand Response as a Resource
Assessment of Demand Response and Advanced Metering Federal Energy Regulatory Commission
90

Chapter VI – Role of Demand Response in Regional Planning and Operations
Assessment of Demand Response and Advanced Metering Federal Energy Regulatory Commission
91
Chapter VI. Role of Demand Response in Regional Planning and Operations205
This chapter addresses the fourth and fifth area Congress directed the Commission to consider in EPAct section 1252(e)(3):
(D) the potential for demand response as a quantifiable, reliable resource for regional planning purposes; and
(E) steps taken to ensure that, in regional transmission planning and operations, demand resources are provided equitable treatment as a quantifiable, reliable resource relative to the resource obligations of any load-serving entity, transmission provider, or transmitting party.
Demand response is an important, reliability resource for the power system in the United States. As was reported in Chapter V, there is approximately 37,500 MW of existing demand response potential in the United States, which represents roughly five percent of the peak load; large enough to be “real” but still relatively small. These resources are factored into regional resource planning and transmission enhancement planning either explicitly or implicitly as modifiers to the load forecast in most regions. Demand response resources currently supply ancillary services and efforts are underway to allow them to supply more. However, sole and explicit use of demand response as an alternative to transmission expansion is extremely rare. The primary focus of this chapter is on the integration of demand response resources into regional planning, with a significant focus on the role of these resources in regional transmission planning and operation. This chapter is organized into six sections:
• Potential for demand response for regional planning • Transmission planning process and demand response • Regional treatment of demand response • Examples of projects that incorporate demand response into regional transmission planning • Concerns and obstacles • Steps that could be taken to ensure that, in regional transmission planning and operations,
demand resources are provided equitable treatment
Potential for Demand Response for Regional Planning Demand response can play a role in regional planning. This role is examined in the following discussion on regional planning in general and in the more detailed discussion on regional transmission expansion planning and operations in the remainder of this chapter. The goals of regional planning include, but are not limited to: ensuring that all customers have access to service, maintaining a reliable electricity supply, maximizing economic benefits, and/or minimizing costs. The
205 Brendan Kirby of Oak Ridge National Laboratory assisted in the drafting of this chapter.

Chapter VI – Role of Demand Response in Regional Planning and Operations
Assessment of Demand Response and Advanced Metering Federal Energy Regulatory Commission
92
application of these goals varies depending on specific regional load requirements, available generation mix, customer interest, and state and regional policies. Historically, most regions of the United States satisfied their load requirements through generation and transmission planning activities conducted by individual utilities. Beginning in the 1980s, many states such as California, Hawaii, Nevada, New York, Ohio, and others adopted integrated resource planning procedures and requirements to formalize these planning efforts, to ensure full examination of a variety of resources, and to allow regulator and public input into resource planning. These utility-integrated resource plans were typically prepared by individual utilities, but various states, such as California, engaged in statewide resource planning exercises. The use of resource planning at a larger, multi-state regional scale is limited,206 but in recent years its use has expanded with the development of Independent System Operators/Regional Transmission Organizations (ISOs/RTOs) and other entities pursuing broad planning.207 However, such planning is not universal or uniform which presents challenges for realization of a truly effective regional plan. In the past, traditional resource planning concentrated on supply-side and transmission resources. With the advent of integrated resource planning, demand-side options (including various forms of demand response such as direct load control) were directly examined and integrated into the planning process. The two primary means used to incorporate demand-side measures in an integrated resource plan: (a) as an adjustment to the long-term demand forecast; or (b) as an explicit resource. Several states require each utility to include demand-side measures as a part of their particular demand forecast but not necessarily as an energy resource. Massachusetts includes demand-side measures only to the extent that they impact load on infrastructure during peak or critical times.208 Another state, Hawaii, includes demand-side management in both the forecasting and resource procurement processes. Energy efficiency options play a more important role in Hawaii’s demand-side management than options such as load management.209 Other state legislatures and regulators require utilities to include demand-side measures more directly. In California, the California Public Utility Commission (CPUC) introduced a requirement that forced each utility to meet three percent of annual system peak demand for 2005 through demand response programs. The requirement increases one percent each year until 2007.210 California also includes demand-side measures as a resource after utility energy contracts expire. Once the long-term contracts that were signed by the California Power Authority during the California crisis expire, each utility must employ all possible energy efficiency, demand response, and distributed resources before issuing offer requests for supply-side resources. The utility must exhaust all available energy efficiency, demand response, and distributed generation resources and prove to the CPUC that the use of fossil fuels over renewable resources has justification.211
206 One notable exception is the regional planning activities of the Northwest Power and Conservation Council over the years in the Pacific Northwest.
207 The role of regional planning is discussed in the Open Access Transmission Tariff (OATT) Reform NOPR Docket Nos. RM05-25-000 and RM05-17-000. See Preventing Undue Discrimination and Preference in Transmission Service, 71 Fed. Reg. 32,686 (June 6, 2006), FERC Stats. & Regs. ¶ 32,603 (2006).
208 Regulatory Assistance Project, Regulatory Assistance Project Electric Resource Long-range Planning Survey: Massachusetts, July 2003.
209 Liz Baldwin, Regulatory Assistance Project Electric Resource Long-range Planning Survey: Hawaii, June 2005.
210 CPUC Decision (D.) 03-06-032, June 2003. 211 Regulatory Assistance Project, Regulatory Assistance Project Electric Resource Long-range Planning Survey:
California, August 2005.

Chapter VI – Role of Demand Response in Regional Planning and Operations
Assessment of Demand Response and Advanced Metering Federal Energy Regulatory Commission
93
Many other states do not incorporate demand-side measures or demand response in any way. In more than 20 percent of the states examined in a survey conducted by the Regulatory Assistance Project, demand-side measures were either not required by the state or no incentive existed to include demand-side measures in the integrated resource plan.212 The rationale for not requiring the inclusion of demand responses varies. Arizona’s rationale is that since it is a net exporter of power, utilities have not developed demand response strategies such as real-time pricing, and no incentive exists to motivate creation of these measures.213 Maine has not required integrated resource planning, energy efficiency, or demand-side projects since it restructured its electric industry. Maine utilities used to have demand-side targets, but that ended with restructuring; ISO New England is now the primary entity that coordinates regional planning.214 Energy efficiency and load management also are not included in integrated resource plans in Kansas, conceivably because supply options often appear to make more economic sense to utilities that have demand options. Kansas utilities can sell excess power on the wholesale market, and the resulting wholesale revenues can be used to keep regulated rates lower. Consequently, demand options are not always considered by the utilities.215 A principal challenge to including demand response measures in an integrated resource plan is how to directly model and value these measures. A recent case study conducted by Dan Violette and Rachel Freeman for the International Energy Agency provides a comprehensive assessment of the potential of demand response resources for regional planning.216 According to Violette and Freeman, for demand response resources to be valued correctly within an integrated resource planning framework, resource plans must have a sufficiently long time horizon. Demand response can reduce the costs of low-probability, high-consequence events, but these events may only occur once a decade. The modeling and resulting integrated resource plan must also address various uncertainties, such as fuel prices, weather, and system factors. By explicitly including the risk factors, demand response can be assessed as a risk management tool. The Violette and Freeman case study involved creating a model that would allow tradeoffs between both supply and demand-side resources. They examined changes in system costs with and without the inclusion of demand response resources for a 19-year time horizon. The case study provided an estimate of the valuation of demand response resources for the electric system, and included results on uncertainty measurements, hourly costs, capacity charges, demand response capacity usage, and loss of load, among other things. In particular, substantial differences for plans with demand response resources and those without existed with regards to hourly costs, capacity charges, and capacity usage. In a simulated case comprised of a peak demand day with additional system stresses, the addition of demand response reduced the maximum hourly costs by more than 50 percent. Figure VI-1shows a total cost savings of $24.5 million.
212 These states include: Wyoming, Arizona, Ohio, Kansas, Michigan, Delaware, Pennsylvania, and Maine. 213 Regulatory Assistance Project, Regulatory Assistance Project Electric Resource Long-range Planning Survey:
Arizona, July 2003. 214 Catherine Murray, Regulatory Assistance Project Electric Resource Long-range Planning Survey: Maine, July
2003. 215 Liz Baldwin, Regulatory Assistance Project Electric Resource Long-range Planning Survey: Kansas,
September 2005. 216 Daniel M. Violette and Rachel Freeman, “Demand Response Resources (DRR) Valuation And Market
Analysis: Assessing DRR Benefits And Costs,” Summit Blue Consulting, http://www.summitblue.com/publications/DRR%20Valuation%20and%20Market%20Analysis.pdf, 2006.

Chapter VI – Role of Demand Response in Regional Planning and Operations
Assessment of Demand Response and Advanced Metering Federal Energy Regulatory Commission
94
Figure VI-1. Marginal costs savings from demand response resource
programs
Source: Daniel M. Violette and Rachel Freeman, “Demand Response Resources (DRR) Valuation And Market Analysis: Assessing DRR
Benefits And Costs,” Summit Blue Consulting, 2006 A substantial percentage of new capacity charges was deferred due to the availability of demand response. The savings amounted to $892 million (2004 dollars) over the 20-year horizon. Capacity charge savings were affected by the amount of demand response resources dispatched per year. The model reflected a significant deployment of demand response resources once every four years. A small amount of demand response resources was used frequently, while use of all available demand response resources happened infrequently. Figure VI-2 shows the percent of demand response resources used under three different program scenarios: without real-time pricing, with real-time pricing, and with critical peak pricing. The net present value of the total system cost showed a reduction with the inclusion of demand response. The savings in incremental costs were 10 percent for the peak-pricing scenario and 23 percent for the real-time pricing scenario. Violette and Freeman concluded that “overall, this case study shows that a Monte Carlo approach, coupled with a resource planning model, can address the value of DRR given uncertainties in future outcomes for key variables, and can also assess the impact DRR has on reducing the costs associated with low-probability, high-consequence events. In this case study, the addition of DRR to the resource plan reduced the costs associated with extreme events, and it reduced the net present value of total system costs over the planning horizon.”217 The importance of the results achieved by Violette and Freeman in their case study is that demand response resources can be directly incorporated into integrated resource planning methods.
217 Daniel M. Violette and Rachel Freeman, 2006; DRR refers to demand response resources.
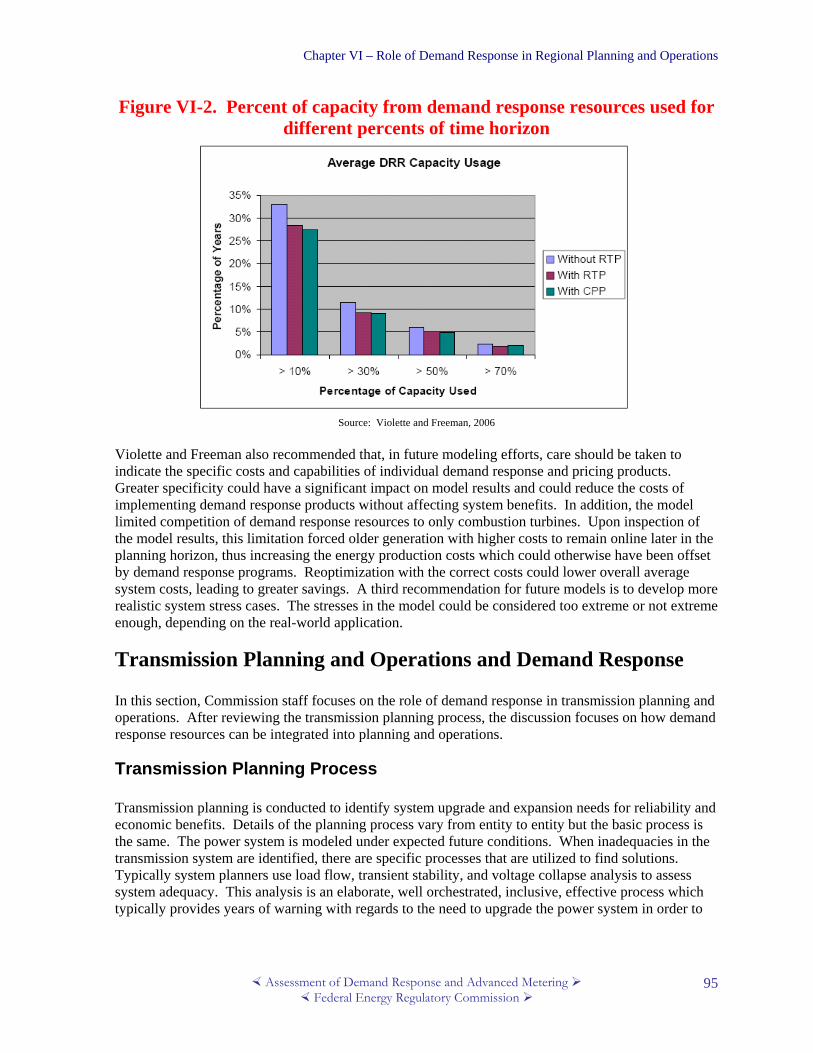
Chapter VI – Role of Demand Response in Regional Planning and Operations
Assessment of Demand Response and Advanced Metering Federal Energy Regulatory Commission
95
Figure VI-2. Percent of capacity from demand response resources used for different percents of time horizon
Source: Violette and Freeman, 2006
Violette and Freeman also recommended that, in future modeling efforts, care should be taken to indicate the specific costs and capabilities of individual demand response and pricing products. Greater specificity could have a significant impact on model results and could reduce the costs of implementing demand response products without affecting system benefits. In addition, the model limited competition of demand response resources to only combustion turbines. Upon inspection of the model results, this limitation forced older generation with higher costs to remain online later in the planning horizon, thus increasing the energy production costs which could otherwise have been offset by demand response programs. Reoptimization with the correct costs could lower overall average system costs, leading to greater savings. A third recommendation for future models is to develop more realistic system stress cases. The stresses in the model could be considered too extreme or not extreme enough, depending on the real-world application.
Transmission Planning and Operations and Demand Response In this section, Commission staff focuses on the role of demand response in transmission planning and operations. After reviewing the transmission planning process, the discussion focuses on how demand response resources can be integrated into planning and operations.
Transmission Planning Process Transmission planning is conducted to identify system upgrade and expansion needs for reliability and economic benefits. Details of the planning process vary from entity to entity but the basic process is the same. The power system is modeled under expected future conditions. When inadequacies in the transmission system are identified, there are specific processes that are utilized to find solutions. Typically system planners use load flow, transient stability, and voltage collapse analysis to assess system adequacy. This analysis is an elaborate, well orchestrated, inclusive, effective process which typically provides years of warning with regards to the need to upgrade the power system in order to

Chapter VI – Role of Demand Response in Regional Planning and Operations
Assessment of Demand Response and Advanced Metering Federal Energy Regulatory Commission
96
meet the expected needs. The process often distinguishes between system upgrades that are needed to maintain reliability and those that are only needed to facilitate commerce or increase efficiency. ISOs/RTOs, regional reliability councils, and regional planning organizations do not typically have the obligation or authority to directly design or construct transmission enhancement solutions. Once they identify transmission system inadequacies, they publicize the needs and expect transmission, generation, and demand-side investors to propose projects to solve the problems. The planners evaluate the proposed solutions to see if they meet the technical and economic requirements of the system. The best projects are endorsed and put into the regional transmission expansion plan. The projects must then be approved by state and federal regulators as appropriate. The ISO/RTO Planning Committee is an organization composed of the Alberta Electric System Operator (AESO), the California Independent System Operator (CAISO), the Electric Reliability Council of Texas, Inc. (ERCOT), the Independent Electricity System Operator (IESO) in Ontario, the ISO New England (ISO-NE), the Midwest ISO, the New York ISO (NYISO), the PJM Interconnection (PJM), and the Southwest Power Pool (SPP). The committee provides a concise description of the evolving state of regional transmission planning:
Regional electric system planning is evolving. In the early days of an ISO/RTO planning effort, transmission expansion plans often represented a compilation of the member utilities’ local transmission plans. As the planning organization and stakeholder relationships grow stronger, the plans grow in scope and complexity, starting with work to conduct reliability planning on an intraregional basis and then moving to interregional reliability and economic or environmental improvement projects. Often, the next step is to strengthen the plan to address a particular system need or policy issue that exceeds reliability alone. After the RTO’s planners and transmission owners become comfortable with regionally integrated reliability planning, the next step is to look at intraregional and interregional economic opportunities, where new transmission investment can significantly increase interregional flows and reduce costs.218
The generation and transmission solutions offered to the regional planner are typically developed by well established competitive generation companies and regulated transmission providers. A few developers of merchant transmission also occasionally develop projects. Transmission planners explore a host of possible solutions including upgrading existing lines, building new lines, adding control devices, etc. Separate departments exist to perform the electrical analysis, acquire right-of-way, design civil engineering solutions, procure equipment, and interface with the affected communities, construction. Getting new transmission lines built is difficult, but there is a large, elaborate, and detailed process that exhaustively examines all possible transmission solutions and actively seeks the most desirable. Generation planning is also well established. No such similar process exists for examining demand response solutions. Instead, Commission staff has determined that demand response is typically treated as a solution that may be examined if it is offered by others and if the offering meets criteria that were established based upon traditional transmission and generation technical solutions.
218 ISO/RTO Planning Committee, ISO/RTO Electric System Planning, Current Practices, Expansion Plans, and
Planning Issues, February 10, 2006.

Chapter VI – Role of Demand Response in Regional Planning and Operations
Assessment of Demand Response and Advanced Metering Federal Energy Regulatory Commission
97
Demand Response in Transmission Planning All of the various types of demand response resources discussed earlier in this report (particularly in Chapter IV) can impact transmission adequacy, and several of these options can be used as direct substitutes for transmission enhancement. For example, time-based rates and direct load control can target specific hours when response is desired. The former facilitates voluntary market response to price signals while the latter utilizes direct control commands. Both types can be used to address capacity inadequacy caused by a lack of generation or a lack of transmission. In addition, while not the subject of this report, energy efficiency reduces consumption during all hours and typically reduces the need for transmission. It is not focused on hours when transmission is congested and may not provide as cost effective a response to a specific transmission problem as more directed alternatives. Demand response is not treated in transmission planning uniformly across the United States. As is discussed later in this chapter, many organizations state that their responsibility is limited to identifying transmission concerns and evaluating the viability of proposed solutions. Specific projects are to be proposed by generation, transmission, and demand response companies. Conversely, some institutions specifically state that they always evaluate demand response alternatives for transmission enhancements but demand response solutions do not show up in their transmission expansion plans. The 2006 ISO/RTO Planning Committee report states that its nine organizations have approved 1,121 transmission projects worth $15.6 billion including 5,070 miles of new transmission lines and 133,062 MW of approved new generation. In contrast, only 4,000 MW of new and existing demand response projects are mentioned and only for New York and California. An additional 500 MW of demand response are mentioned by ISO-NE. In one sense, demand response is included in almost all transmission planning. Known existing or expected demand response is incorporated into the reliability assessment, either as a modification to the expected load or as a responsive resource. Load that is responsive to real-time or time-of-use prices, for example, is accounted for by modifying the forecast peak and off-peak load. Load that responds to system operator calls is used as a responsive resource, similar to generation, to mitigate problems found in the transmission analysis. Energy efficiency measures simply reduce energy requirements and are incorporated into future load forecasts, often without explicit consideration by transmission planners. Commission staff has concluded that system planners do not typically include new demand response as a potential solution to transmission adequacy problems. Demand response is not considered equally when a system planner lays out options for dealing with the discovered transmission inadequacies. The Bonneville Power Administration (BPA) and MISO have policies calling for demand response considerations but these policies have not resulted in actual projects.
Provision of Ancillary Services by Demand Response Demand response resources can also assist in the operation of transmission systems in the form of ancillary services such as operating reserves.219 Customers participating in these programs are
219 Reliability rules currently prohibit the use of responsive load to provide some ancillary services (spinning
reserve for example) in some regions but technically the generation/load balance can always be restored by changing either side of the equation. See B. Kirby, Spinning Reserve From Responsive Loads, Oak Ridge National Laboratory: ORNL/TM-2003/19, March 2003.
Chapter VI – Role of Demand Response in Regional Planning and Operations
Assessment of Demand Response and Advanced Metering Federal Energy Regulatory Commission
98
continuously poised to respond, but only has to reduce consumption when a reliability event actually occurs. The response duration depends on the nature of the event and the type of reserve being supplied (see Figure VI-3) but is typically provided in seconds to minutes rather than the hours required when peak shaving or responding to price signals. Fast communications are often required to notify the load when response is needed. While customer load loads providing reliability reserves do not reduce transmission loading itself under normal conditions, they can reduce the amount of transmission capacity that must be held in reserve to respond to contingencies. This both reduces the need for new transmission and increases the utilization of existing transmission to provide energy from low cost generation. Some demand response resources are technically superior to generation when supplying spinning reserve; the ancillary service requiring the fastest response. Many systems can curtail consumption faster than generation can increase production. The only time delay is for the control signal to get from the system operator to the load. This is typically 90 seconds or less (much less with dedicated radio response), much faster than the 10 minutes allowed for generation to fully respond. When responding to system frequency deviations, the curtailment can be essentially instantaneous. Communications delays are not encountered because frequency is monitored at the load itself. An example where demand response provides superior spinning reserve when compared with generation can be seen in Figure VI-4.220 In this Figure, WECC’s interconnection frequency response is shown for the sudden loss of the Palo Verde unit 1 generator. The lower curve shows system frequency response, with generators providing all of the spinning reserve. The upper curve shows that system frequency when 300 MW of spinning reserves were provided by a large pumping load instead of from generation. As can be seen, system frequency does not dip as low and recovers more quickly. Markets for ancillary services typically develop shortly after markets for energy are established. The interdependence between the supply of energy and ancillary services makes this natural. Table VI-1 shows the current state of ancillary service markets, and whether demand response is allowed to participate.
Demand response has typically allowed provided supplemental (non-spinning) and slower reserves. Restrictions on allowing demand response to provide spinning reserve have eased recently in some areas. ERCOT allows demand response as a supplier of spinning reserve. PJM permits demand response to supply spinning reserves and regulation. NYISO expects to allow demand response to supply spinning reserves in the third quarter of 2007. MISO is in the midst of ancillary service market design and the supply rules are not yet clear.
220 John Kueck and Brendan Kirby, Presentation to the WECC CMOPS, January 7, 2005. Stability runs performed
by Donald Davies of the Western Electricity Coordinating Council (WECC).

Chapter VI – Role of Demand Response in Regional Planning and Operations
Assessment of Demand Response and Advanced Metering Federal Energy Regulatory Commission
99
Figure VI-3. Response time and duration that characterize ancillary services
Source: Brendan Kirby of Oak Ridge National Laboratory
Figure VI-4. Impact of demand response on WECC system stability
Source: Donald Davies of WECC
0.1 1 10 100
TIME (MINUTES)
Regulation
Fast Energy Balancing Markets
Frequency Responsive Spinning Reserve
Supplemental Reserve
Backup Supply
HourlyEnergy
Contingency Operations
Normal Operations

Chapter VI – Role of Demand Response in Regional Planning and Operations
Assessment of Demand Response and Advanced Metering Federal Energy Regulatory Commission
100
Table VI-1 Current and pending ancillary service markets221
Regulation Spinning Non-spinning Supplemental
(10 min)
Long Term Supplemental
(30 min)
Replacement (60 min)
Co-optimization exemption
ISO-NE D D No NYISO D D D No PJM D &C D &C D Yes
MISO C C C Not yet set
ERCOT D D D Yes CAISO D Yes
Notes: – Market based
C – Cost based F – Fixed monthly MVAR payment D – Demand response is allowed to participate (or will be shortly) New England has forward reserves for obtaining supplemental and regulation
Co-optimization of ancillary services and energy markets presents a unique problem for demand response. Co-optimization (and in California, the Rational Buyer) is based on the idea that the various services can be ranked in order of “quality.” Quality is judged by required speed of response, with regulation being the highest quality service followed by spinning, non-spinning, supplemental, long-term supplemental, replacement reserves, and energy supply. The reasoning is that higher quality services can and should always be substituted for lower quality services if the higher quality services are available at a lower price. If not enough replacement reserves are offered into the market but there is an excess of spinning reserves, for example, the system operator is able to purchase spinning reserves and use them as replacement reserves. The reserve supplier is supposed to be indifferent since it is being paid the spinning reserves price and being asked to provide the slower and therefore easier to provide replacement reserves service. This rationale is often extended to allow the system operator to use excess reserves as an energy supply when energy prices are high. This works well for most generators since they are indifferent as to how long they run (they may have minimum run times but generally do not have maximum run times). Unfortunately, co-optimization can unintentionally block many demand response resources from participating in reserves markets. An air-conditioning load, which can respond rapidly and provide excellent spinning reserve at low price, for example, may be unwilling to provide the multi-hour response required for replacement reserves or energy.222 The chance that it will be forced to do so by the co-optimizer may block demand resources from making themselves available to enhance system reliability. Very recently this problem has been recognized and addressed in several (but not all) markets. The CAISO, for example, allows demand response resources to declare themselves as unavailable for providing anything except the reserve market it has bid into. Energy is traded through bilateral contracts in ERCOT so it is separate from the ancillary service markets and the problem does not arise. PJM allows resources to submit different capacities in the ancillary service and energy markets so a demand response resource can state that it has zero energy capacity. These markets are noted in Table VI-1 under the “Co-optimization exemption” column.
221 This table was adapted from the Ancillary Services Round Table, Midwest Independent System Operator, Carmel Indiana, April 26-27, 2006.
222 Energy limited hydro generators and emissions-limited thermal generators have a similar constraint and cannot afford to risk being called on for extended operations.
Chapter VI – Role of Demand Response in Regional Planning and Operations
Assessment of Demand Response and Advanced Metering Federal Energy Regulatory Commission
101
Regional Treatment of Demand Response Transmission system planning responsibilities are spread among a number of groups. The North American Electric Reliability Council (NERC) is the industry organization which addresses power system reliability. Regional councils provide added specificity as it relates to the particular needs of their region. ISOs, RTOs, and balancing authority (control area) operators have very specific concerns with the transmission systems they operate. Concerns about the impact demand response can have on transmission planning span a broad range. While it was not possible to conduct an exhaustive survey of the demand response activities of all the organizations with transmission planning responsibility in North America for this report various organizations were selected for inclusion in order to span the geographic scope as well as the range of organizational structures. Prior to examining how each region addresses demand response, the following discussion presents its treatment at the NERC level. The information provided in this section draws upon information obtained directly from the NERC regions and ISO/RTOs.223
North American Electric Reliability Council NERC was formed in 1968 as the utility industry organization which develops voluntary reliability rules to coordinate how the bulk electric system is planned and operated. The voluntary structure is being replaced with a structure that requires mandatory compliance with reliability standards pursuant to the provisions of the Energy Policy Act of 2005 (EPAct 2005). Under the new system, the Federal Energy Regulatory Commission has the authority to review reliability standards proposed by the Electric Reliability Organization (ERO) that when approved, provide reliability of the nation’s bulk-power system. The rule concerning the certification of the ERO has been issued by the Commission and the selection of an ERO is expected shortly. NERC filed the initial standards for formal review on April 4, 2006. On May 11, 2006, Commission staff issued a preliminary assessment containing a thorough review of the 102 NERC standards and on July 5, 2006, it held a technical conference with the industry to discuss the standards. A notice of proposed rulemaking concerning which standards might be accepted or remanded is expected to be issued in the fall. NERC Reliability Standards address the types of assessments and the applicable criteria to be used in evaluating the reliability of the bulk electric system. They do not directly address the use of demand response or any other solutions to achieve compliance with the applicable criteria. In general, there are three classes of options; generation solutions, transmission solutions, and demand response solutions. The choice of one or more classes of options is usually based on their relative cost and effectiveness.224 Of the 102 standards and the Glossary of Terms Used in Reliability Standards presented by NERC for approval as mandatory standards, eight standards directly or indirectly deal with demand-side issues and demand response. They are:225
223 The following individuals provided information during discussions concerning regional demand response: Adam Keech and Jeff Bladen of PJM; Keith Tynes of SPP; Tom Abrams of Santee Cooper and SERC; Brian Silverstein of BPA; Robert Burke and Mario DePillis of ISO-NE; Dave Lawrence of NYISO; Charles Tyson, Dale Osborn, and Jeff Webb of MISO; Art Nordlinger of Tampa Electric and FRCC; Alan Isemonger of CAISO; Stephen Pertusiello of Consolidated Edison; and Donald Davies, Dick Simons, and Jay Loock of WECC.
224 Note that demand response is unique in that it is essentially the only solution that is directly discussed in the standards.
225 NERC, Reliability Standards for the Bulk Electric Systems of North America, North American Electric Reliability Council, Princeton, NJ, February 7, Downloaded from www.nerc.com on March 20, 2006.

Chapter VI – Role of Demand Response in Regional Planning and Operations
Assessment of Demand Response and Advanced Metering Federal Energy Regulatory Commission
102
• Standard BAL-002 — Disturbance Control Performance
o The permissible mix of Operating Reserve – Spinning and Operating Reserve – Supplemental that may be included in Contingency Reserves.
• Standard BAL-005 — Automatic Generation Control o The standard also ensures that all facilities and load electrically synchronized to the
Interconnection are included within the metered boundary of a Balancing Area so that balancing of resources and demand can be achieved.
• Standard TOP-002 —Normal Operations Planning o Identifies performance to be achieved using all tools available to the operators.
• Standard MOD-016-0 — Actual and Forecast Demands, Net Energy for Load, Controllable DSM (demand side management)
o Planning Authority and Regional Reliability Organizations must document actual and forecast demand data, net energy for load data, and controllable DSM data.
• Standard MOD 019-0 — Forecasts of Interruptible Demands and DCLM Data o Load Serving Entities must provide forecasts of summer and winter peak interruptible
demands and Direct Control Load Management (DCLM) response capabilities for the next five to ten years.
• Standard MOD-020-0 — Providing Interruptible Demands and DCLM Data o Load Serving Entities must report their interruptible demands and direct load control
management capabilities to Balancing Authorities, Transmission Operators, and Reliability Coordinators on request.
• Standard MOD-021-0 — Accounting Methodology for Effects of Controllable DSM in Forecasts
o Load-Serving Entities, Transmission Planners, and Resource Planners must document how conservation, time-of-use rates, interruptible demands, and Direct Control Load Management are addressed in peak demand and net energy forecasts.
• Standard TPL-006-0 — Assessment Data from Regional Reliability Organizations o Regional Reliability Organizations are required to provide data concerning actual and
projected demands and net energy for load, forecast methodologies, forecast assumptions and uncertainties, and treatment of Demand-Side Management including program ratings, effects on annual system loads and load shapes, contractual arrangements, and program durations.
Seven additional MOD standards contain guidance concerning collecting and reporting forecast demand and (if interpreted broadly) demand side management program performance data. NERC states that the purpose of these standards includes: “Forecast demand data is needed to perform future system assessments to identify the need for system reinforcement for continued reliability. In addition to assist in proper real-time operating, load information related to controllable Demand-Side Management programs is needed”226 (emphasis added). Forecasted load, with demand response included, drives the need for generation expansion and transmission to deliver the generation to the load. The following NERC MOD standards try to assure that accurate demand and demand side response data is collected by requiring the Regional Reliability Organizations (RROs) “to establish consistent data requirements, reporting procedures, and system models to be used in the analysis of the reliability of the Interconnected Transmission Systems:”
226 NERC, 2006

Chapter VI – Role of Demand Response in Regional Planning and Operations
Assessment of Demand Response and Advanced Metering Federal Energy Regulatory Commission
103
• Standard MOD-011-0 — Regional Steady-State Data Requirements and Reporting Procedures • Standard MOD-012-0 — Dynamics Data for Transmission System Modeling and Simulation. • Standard MOD-013-0 — RRO Dynamics Data Requirements and Reporting Procedures • Standard MOD-014-0 — Development of Interconnection-Specific Steady State System
Models • Standard MOD-015-0 — Development of Interconnection-Specific Dynamics System Models • Standard MOD-017-0 — Aggregated Actual and Forecast Demands and Net Energy for Load • Standard MOD-018-0 — Reports of Actual and Forecast Demand Data
NERC submitted its “Glossary of Terms Used in Reliability Standards” to the Commission with the 102 reliability standards for approval as mandatory reliability standards. There is a discrepancy between the definition of “Spinning Reserve”227 and “Operating Reserves – Spinning.”228 The latter permits demand response to be considered as part of the spinning reserve requirement while the former does not. Furthermore as pointed out in the “FERC Staff Preliminary Assessment of NERC Reliability Standards”229 under BAL-002-0 “the minimum percentage of spinning reserve required as part of the contingency reserve is not defined in the standard but is at the discretion of the RRO. Various regions have different definitions as to which resources are eligible to be counted as spinning reserves. For example in some regions large irrigation pumping and pumped hydro resources are permitted to be used as spinning reserves, and in other regions they are not. These deficiencies need to be addressed. Under BAL-005, the reliability goal of balancing generation and load requires the ability of the Balancing Authority to have control over adequate amounts and types of generation reserves and controllable load management resources.”230
Texas Interconnection and the Electric Reliability Council of Texas Electric Reliability Council of Texas (ERCOT) is both a NERC Region and an interconnection which lies completely within the borders of the state of Texas. In 2001, ERCOT consolidated the operation of 10 control areas into a single control area with bilateral energy transactions and ancillary service markets serving 20 million people with a peak load of 60,000 MW, 24,000 miles of transmission, and a $20 billion electricity market. Energy is arranged through bilateral agreements. ERCOT obtains ancillary services and balancing energy (15 minutes) through markets. While ERCOT does simultaneous selection of ancillary service resources it does not force ancillary service providers into the energy market. ERCOT coordinates transmission planning with the various transmission and distribution service providers in Texas. Modeling expected future conditions identifies transmission limitations and helps in the comparison of alternative solutions. ERCOT also determines the transmission enhancements necessary to accommodate generation interconnection. ERCOT distinguishes between transmission enhancements that are required to maintain reliability regardless of the generation dispatch and those for which generation redispatch can be substituted. Demand response alternatives are considered
227 Unloaded generation that is synchronized and ready to serve additional demand (emphasis added). 228 The portion of Operating Reserve consisting of: Generation synchronized to the system and fully available to
serve load within the Disturbance Recovery Period following the contingency event; or Load fully removable from the system within the Disturbance Recovery Period following the contingency event
229 Federal Energy Regulatory Commission, Staff Preliminary Assessment of the North American Electric Reliability Council’s Proposed Mandatory Reliability Standards (“FERC Staff Preliminary Assessment of NERC Mandatory Reliability Standards”), Docket RM06-16, May 11, 2006, 30.
230 FERC Staff Preliminary Assessment of NERC Reliability Standards, 32.

Chapter VI – Role of Demand Response in Regional Planning and Operations
Assessment of Demand Response and Advanced Metering Federal Energy Regulatory Commission
104
where possible. The ERCOT board approves all major transmission projects. ERCOT determines which transmission provider will build the transmission enhancement and notifies the Public Utility Commission (PUC). The transmission provider applies for and obtains PUC approval to build the transmission enhancement; ERCOT supports the PUC approval process. ERCOT makes extensive use of demand response. Load is allowed to provide responsive reserves (spinning reserve), non-spinning reserves (30 minute response), replacement reserve, and balancing energy. Over 1,100 MW of load is qualified to provide spinning reserves and over 1,200 MW of loads is qualified to provide non-spinning reserve. Over 500 MW of response was observed during recent frequency excursions. Demand response is currently limited to providing half of the reserves needed until system operator experience is gained.231 Interestingly, not a single load has offered to provide balancing energy while demand response is providing as much responsive reserve as allowed. This may indicate that demand response duration is more limiting than response speed. On April 17, 2006, ERCOT was forced to use 1,000 MW of involuntary demand response and 1,200 MW of voluntary demand response to successfully prevent a system-wide blackout. Unusually high and unexpected load due to unanticipated hot weather, coupled with 14,500 MW of generation that was unavailable due to planned spring maintenance, resulted in insufficient capacity to meet load. System frequency dropped to 59.73 Hz at one point. Rolling blackouts were required for about two hours, with individual customers curtailed between 10 and 45 minutes at a time. All of the load called upon to respond did so successfully (voluntary and involuntary), though there was a 15 minute delay with one block of involuntary load curtailment.
Western Interconnection and the Western Electric Coordinating Council WECC is the NERC regional reliability council responsible for the Western Interconnection, encompassing all or parts of fourteen states, two Canadian provinces, and a portion of Mexico. Peak load is about 146,000 MW. There are a number of transmission planning groups within WECC that are responsible for portions of the interconnection: Southwest Transmission Expansion Plan group (STEP), Northwest Transmission Assessment Committee (NTAC), Southwest Area Transmission (SWAT), Rocky Mountain Area Transmission Study (RMATS), and Colorado Coordinated Planning Group (CCPG). WECC does not encourage or discourage demand response; it is neutral concerning technology choices for reliability solutions. WECC does not conduct transmission system planning; instead each WECC member to plan its portion of the transmission system. WECC compiles the system-wide base cases used by others to plan the transmission system and evaluate the need for new transmission. These base cases incorporate the input from each of the members, both for existing conditions and for conditions expected in the future. WECC notes that it is not specifically aware of what demand response is included in the information supplied by the members. Expected peak loads may be reduced by the amount of expected demand response. WECC indicated that it is not aware of any obstacles to greater use of demand response.
231 Joel Mickey, Competitive Ancillary Services Market in ERCOT, MISO Ancillary Services Round Table, April
26, 2006.
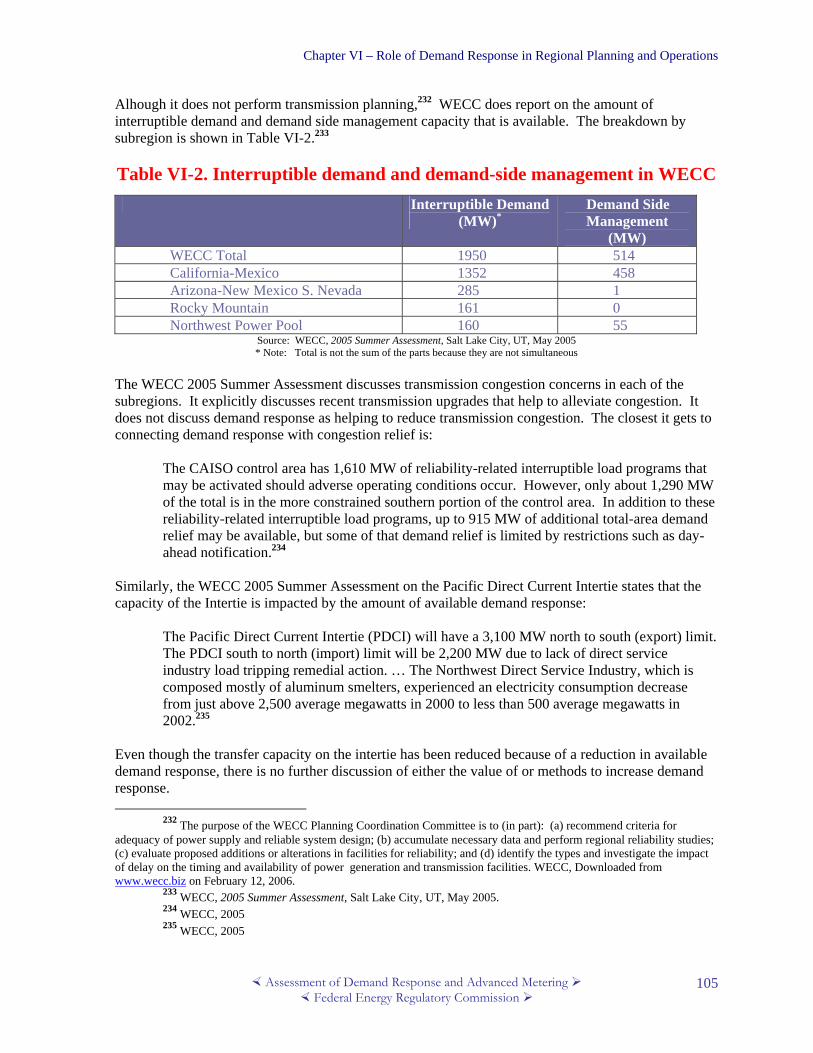
Chapter VI – Role of Demand Response in Regional Planning and Operations
Assessment of Demand Response and Advanced Metering Federal Energy Regulatory Commission
105
Alhough it does not perform transmission planning,232 WECC does report on the amount of interruptible demand and demand side management capacity that is available. The breakdown by subregion is shown in Table VI-2.233 Table VI-2. Interruptible demand and demand-side management in WECC
Interruptible Demand (MW)*
Demand Side Management
(MW) WECC Total 1950 514 California-Mexico 1352 458 Arizona-New Mexico S. Nevada 285 1 Rocky Mountain 161 0 Northwest Power Pool 160 55
Source: WECC, 2005 Summer Assessment, Salt Lake City, UT, May 2005 * Note: Total is not the sum of the parts because they are not simultaneous
The WECC 2005 Summer Assessment discusses transmission congestion concerns in each of the subregions. It explicitly discusses recent transmission upgrades that help to alleviate congestion. It does not discuss demand response as helping to reduce transmission congestion. The closest it gets to connecting demand response with congestion relief is:
The CAISO control area has 1,610 MW of reliability-related interruptible load programs that may be activated should adverse operating conditions occur. However, only about 1,290 MW of the total is in the more constrained southern portion of the control area. In addition to these reliability-related interruptible load programs, up to 915 MW of additional total-area demand relief may be available, but some of that demand relief is limited by restrictions such as day-ahead notification.234
Similarly, the WECC 2005 Summer Assessment on the Pacific Direct Current Intertie states that the capacity of the Intertie is impacted by the amount of available demand response:
The Pacific Direct Current Intertie (PDCI) will have a 3,100 MW north to south (export) limit. The PDCI south to north (import) limit will be 2,200 MW due to lack of direct service industry load tripping remedial action. … The Northwest Direct Service Industry, which is composed mostly of aluminum smelters, experienced an electricity consumption decrease from just above 2,500 average megawatts in 2000 to less than 500 average megawatts in 2002.235
Even though the transfer capacity on the intertie has been reduced because of a reduction in available demand response, there is no further discussion of either the value of or methods to increase demand response.
232 The purpose of the WECC Planning Coordination Committee is to (in part): (a) recommend criteria for adequacy of power supply and reliable system design; (b) accumulate necessary data and perform regional reliability studies; (c) evaluate proposed additions or alterations in facilities for reliability; and (d) identify the types and investigate the impact of delay on the timing and availability of power generation and transmission facilities. WECC, Downloaded from www.wecc.biz on February 12, 2006.
233 WECC, 2005 Summer Assessment, Salt Lake City, UT, May 2005. 234 WECC, 2005 235 WECC, 2005
Chapter VI – Role of Demand Response in Regional Planning and Operations
Assessment of Demand Response and Advanced Metering Federal Energy Regulatory Commission
106
WECC has adopted a uniform underfrequency load shedding plan and requires members to have 37 percent of the load shed in various steps for underfrequency conditions.236 The following discussion explores the role of demand response in two WECC subregions: BPA and CAISO. While not an exhaustive examination of the full WECC, examination of these subregions provides useful information on how the role of demand response is evolving in the region.
Bonneville Power Administration BPA owns and operates 15,000 miles of transmission, about 75 percent of the high voltage grid in the Pacific Northwest. It does not own generation; it markets wholesale electrical power from federal and non-federal generators. About 40 percent of the electric power used in the Northwest comes from BPA.237 At peak use, the system transports about 30,000 MW of electricity to customers.238 BPA has a highly visible effort aimed at identifying non-wires alternatives to transmission enhancement. Load in the Pacific Northwest has continued to grow but BPA has not build any substantial transmission enhancements between 1987 and 2003. BPA is concerned that congestion is increasing and reliability may suffer. BPA believes non-wires solutions may be a more cost effective solution while deferring the need to build new transmission facilities.239 Non-wires solutions are attractive because transmission constraints often occur 40 hours or less per year. New transmission to meet these peak conditions would sit idle most of the time. Alternatively, customers could respond without much disruption to their normal operations. BPA cites two past successful demand response projects that justify its current efforts at finding additional non-wires solutions. Traditional conservation measures lowered peak loads on Orcas Island for several years while an underwater cable was replaced. The Puget Reinforcement Project used conservation programs to helped avoid voltage collapse in the Puget Sound area and delayed construction of additional transmission lines crossing the Cascade mountains for ten years. Technological advances in load control and distributed generation lead BPA to conclude that additional opportunities now exist. BPA has committed to study non-wires solutions before deciding to build any transmission enhancements.240 BPA is now targeting the Olympic Peninsula with a pilot project that started in 2004. The transmission system on the Olympic Peninsula (and in other areas) does not meet NERC’s reliability criteria. BPA’s focus is on deferring transmissions enhancement temporarily, rather than looking at demand response as a permanent resource. BPA evaluates each project based upon the savings associated with transmission project deferral. A demand response project might be viewed as a three-year deferral of a $60 million transmission project, for example. In that case, the value of the demand response project would be $11 million based on a 7 percent interest rate. Unlike the ultimate transmission project that demand response is delaying, the economic viability of demand response would not be examined over the 30-year life of a typical transmission line.
236 WECC, Western Electricity Coordinating Council Relay Work Group Underfrequency Load Shedding Relay
Application Guide - Revised, August 3 2004. 237 BPA, Downloaded from www.bpa.gov on April 14, 2006. 238 BPA, Transmission Planning Through a Wide-Angle Lens, A Two-Year report on BPA’s Non-Wires Solutions
Initiative, Bonneville Power Administration, (“BPA Non-Wires Solutions Initiative”), September 2004. 239 BPA, Non-Wires Solutions, Questions & Answers , Exploring Cost-Effective Non-Construction Transmission
Alternatives, Bonneville Power Administration, www.transmission.bpa.gov/planproj/non-wires_round_table/ (“Non-Wires Solutions Q&A”), 2004.
240 BPA Non-Wires Solutions Initiative, 2004.

Chapter VI – Role of Demand Response in Regional Planning and Operations
Assessment of Demand Response and Advanced Metering Federal Energy Regulatory Commission
107
BPA identified 20 transmission problem areas in 2001, and nine were designated as high priority. A study was commissioned to examine both the overall BPA transmission planning process and the specific transmission needs. The resulting report recommended process changes in BPA’s transmission planning to consider non-wires alternatives early enough that they can make a difference. The report also identified specific projects that might be amenable to non-wires solutions. BPA formed a Non-Wires Solutions Round Table to obtain opinions from a diverse set of stakeholders within the region. Members included environmental groups, regulators, large energy consumers, Indian tribes, renewables advocates, and independent power producers. They addressed four issues: screening criteria, detailed studies for particular problem areas, non-wires technology, and institutional barriers.241 Specific projects that were identified as candidates for non-wires solutions were:
• Puget Sound Area – the required non-wires load reduction was too large and the wires solution also reduced transmission losses so the Kagley-Echo Lake transmission line solution was selected.
• Olympic Peninsula – this was selected as a pilot project to test non-wires technologies including aggregated distributed generation and demand reduction.
• Lower Valley, Wyoming. Institutional barriers identified by the Round Table include:
• Lost utility revenue – utilities are reluctant to pursue demand response when it may reduce sales and revenue.
• Lack of incentive for accurate forecasting – high load forecasts can justify additional transmission; thereby making it more difficult for demand response solutions to be adopted.
• Lack of transparency in transmission planning. • Load shielded from actual wholesale electricity price volatility – additional demand response
would make economic sense if loads could see the true value of that response. • Reliability of non-wires solutions – this can be both an actual and a perceptual problem. • Funding and implementation – multiple parties can benefit from demand side solutions
(generation, transmission, and distribution) but it can be difficult to determine who should pay and who should implement the programs. Partnerships are often necessary but difficult to arrange.
Currently BPA demand response efforts are still in the pilot program stage. Through pilots, BPA will test the dependability of demand response solutions. The first full initiative to actually defer a transmission project may happen late in 2006.
California ISO The State of California has a very active demand response program supported by the California Energy Commission, the California Public Utility Commission, and the California Consumer Power and Conservation Financing Authority. Demand response resources range in size from residential air conditioners to California Department of Water Resources 80,000 horsepower pumps. As was
241 BPA Non-Wires Solutions Initiative, 2004.

Chapter VI – Role of Demand Response in Regional Planning and Operations
Assessment of Demand Response and Advanced Metering Federal Energy Regulatory Commission
108
discussed in Chapter IV, California expects to have demand response equal to five percent of the system peak available by 2007. California has established a “preferred loading order” to guide energy decisions. The loading order consists of decreasing electricity demand by increasing energy efficiency and demand response, and meeting new generation needs, first with renewable and distributed generation resources, and second with clean fossil-fueled generation.242 Quantitative goals are not included for the use of distributed generation or demand response as an alternative to transmission enhancement and coordination with transmission planning is a recognized problem in California. CAISO was created by the state to operate the transmission system for most of the state including 25,000 miles of transmission lines and a peak load of over 47,000 MW. The CAISO transmission planning process reviews the transmission expansion plans submitted by the participating transmission owners to assure that they solve identified problems, are the best alternatives, and are the most economical from a system point of view. The CAISO performs a comprehensive review to assure that nothing is missing. Management approves projects costing less than $20 million and refers larger projects to the CAISO board for approval. Studies are performed to establish Reliability Must Run generation requirements. CAISO has approved 337 transmission enhancement projects costing over $3 billion. Both the CAISO and the California Public Utility Commission have authority to require transmission enhancements to meet regulatory obligations. The CAISO is currently proposing a new planning process. The CAISO will produce a five-year project-specific plan and a ten-year conceptual plan will be produced to address reliability and economic needs. It will submit identified projects to the transmission owners. Participating transmission owners are then expected to submit transmission plans that incorporate the CAISO plan. The transmission plan is designed to eliminate congestion and reliability must run requirements as well as to provide economic signals for generation siting.243 The 2005 CAISO transmission initiatives encompassed seven projects, which included substation and line work. No demand response projects were included. The CAISO has a great deal of experience obtaining ancillary services from competitive markets. It operated the first ancillary service markets and currently has a proposal before the Commission to redesign those markets. The CAISO proposes to implement its redesign by November 2007. Demand response resources are currently not allowed to supply regulation or spinning reserves. While the CAISO has used a “Rational Buyer” mechanism and proposes in the future to use co-optimization to substitute “higher quality” ancillary services for “lower quality” services and energy supply, demand response resources and energy-limited hydro generators can flag their capability as being available for contingency response only.244
Eastern Interconnection The Eastern Interconnection is the largest of the three interconnections in North America but it has no organization with overall reliability responsibility. Instead, it is composed of six regional reliability councils that coordinate activities to assure that the interconnection remains reliable. Since there are multiple ISOs within the Eastern Interconnection, the Inter-RTO/ISO Council is also developing an inter-RTO/ISO expansion plan process. Steps are being taken to facilitate coordinated joint planning
242 S. Fromm, K. Kennedy, V. Hall, B.B. Blevins, Implementing California’s Loading Order For Electricity Resources, California Energy Commission Staff Report, July 2005.
243 A. J. Perez (CAISO), New ISO Transmission Planning Process, August 1, 2006. 244 Alan Isemonger, CAISO Ancillary Service (AS) Procurement Under MRTU, MISO Ancillary Services Round
Table, April 26, 2006.
Chapter VI – Role of Demand Response in Regional Planning and Operations
Assessment of Demand Response and Advanced Metering Federal Energy Regulatory Commission
109
over a vast region but this process does not appear to include much in the way of demand response. The following discussion presents the transmission planning activities of the various Eastern Interconnection RTO/ISO and regional reliability councils.
Midwest ISO The Midwest ISO (MISO) manages the transmission system and operates electricity markets for a region that covers all or part of fifteen states and one Canadian province. Peak load is approximately 132,000 MW; 16 percent of the total US/Canadian load and 21 percent of the Eastern Interconnection load. The Midwest ISO Transmission Expansion Plan 2005 (MTEP 05)245 describes the currently recommended transmission needs for the MISO system. The plan identifies 615 facility additions requiring $2.9 billion in investment by 2010. MISO develops the regional plan based upon a roll-up and integration of the individual transmission owners’ plans. The results are discussed with the Organization of Midwestern States and approved by the MISO board. There is essentially no attention paid to demand response in the MTEP 05. No demand response projects have been identified within the $2.9 billion in reliability investment. Generation redispatch and transmission system expansion are recognized as methods to address inadequate reliability, but demand response is not mentioned. Line conversion is specifically addressed as an alternative to new construction, but demand response is not. The description of the process for determining system adequacy, needed additions, and generation redispatch does not include a discussion of demand response. However, the plan does recognize that controlled involuntary load shedding is an effective tool that the system operator can rely upon to contain rare events and prevent uncontrolled outage cascading. MTEP 05 only mentions “Demand-side options” once, when it states that their evaluation is required: “The MTEP process is to consider all market perspectives, including demand-side options, generation location, and transmission expansion alternatives.” Commission staff cannot determine whether demand-side options actually are considered in the process.246 There is a brief section on “Load Technologies,” which discusses the possible future use of controlled floor heating to help shape wind output to more closely follow other loads. Alternatively, “the load could be used as a dynamic brake for generator stability considerations following a fault on the transmission system.”247 There is no mention of the adequacy or inadequacy of current load control technologies to address current system needs. MISO is currently engaged in an active ancillary service market design process that, while not explicitly using demand response to address transmission adequacy, is considering how demand response can participate in supporting system reliability.248 The MISO stakeholder process is examining how ancillary service markets operate in other regions, including how they accommodate demand response. That process should result in a filing with the Commission in 2006.249
245 MISO, Midwest ISO Transmission Expansion Plan 2005 – MTEP 05, June 2005. 246 There is one further sentence in the report that states “In rare situations the ‘redispatch’ can manifest itself as
dropping load and backing down generation rather than simply shifting generation among sources.” 247 MISO, June 2005. 248 MISO, Ancillary Services Round Table, Midwest Independent System Operator, Carmel, Indiana, April 26-27,
2006. 249 See June 6, 2006 resource adequacy report in Docket No. ER06-1112 at 7. In addition, MISO will be including
effectively implementing enhanced DSM programs in its Phase II filing expected in 2007.
Chapter VI – Role of Demand Response in Regional Planning and Operations
Assessment of Demand Response and Advanced Metering Federal Energy Regulatory Commission
110
PJM Interconnection At this time, the PJM Interconnection (PJM) serves 51 million people in all or parts of 13 states and the District of Columbia. It has a peak demand of approximately 135,000 MW; roughly 16 percent of the total US/Canadian load and 22 percent of the Eastern Interconnection load. PJM began in 1927 and developed as a tight power pool. In 1997, it became fully independent and started its first bid-based energy market, and it became an RTO in 2001.250 Transmission planning in the PJM region is accomplished through the Regional Transmission Expansion Planning Protocol which annually generates a Regional Transmission Expansion Plan (RTEP) covering the next 10 years. RTEP determines the best way to integrate transmission with generation and demand response projects to meet load-serving obligations.251 Over $1.8 billion in transmission enhancement projects have been identified through the RTEP process. Although supply or demand side solutions may be found to be a more efficient or effective replacement for transmission enhancements, PJM is not authorized to implement them directly.252 Instead, PJM identifies transmission solutions to problems and, subject to cost/benefit analysis, recommends their implementation through the RTEP if no solution has been proposed by a market participant within a one-year window. PJM’s approach is to give market forces an opportunity to determine whether transmission investment beyond that needed to ensure reliability is warranted. While PJM planners work with transmission owners to assess the impact of a proposed project on the PJM system, the upgrades are the sole right of each transmission owner to construct. Each RTEP includes: 1) a set of recommended “direct connection” transmission enhancements; 2) a set of “network” transmission enhancements; 3) a set of market-proposed generation or merchant transmission projects; 4) a set of baseline upgrades; and 5) the cost responsibility of each party involved. Most demand response is implicitly included in PJM regional transmission planning as a modifier to forecast load. PJM typically assumes that the current level of demand response will continue into the future when evaluating any specific transmission area. PJM has recently made changes to its market structure to allow demand response resources to participate in ancillary services markets. As of May 1, 2006, demand response resources may provide spinning reserves and regulation. PJM is the first RTO to allow demand response to participate in each of the ancillary services markets.253 Demand response in the regulation and synchronized reserve markets is initially limited to 25 percent of total requirements until system operator experience is gained. Loads are compensated for their capacity contributions as well. PJM has stated that “Demand response should be encouraged so long as it is the right economic answer. However, it is not an end in itself.”254 PJM has identified a number of obstacles to incorporating demand response into PJM transmission planning and operations: lack of widespread use of hourly and sub-hourly metering, which is required
250 PJM, downloaded from www.pjm.com on April 3, 2006 251 PJM, Amended And Restated Operating Agreement Of PJM Interconnection, L.L.C., Schedule 6 Regional
Transmission Expansion Planning Protocol, PJM Interconnection, April 26, 2006, and PJM, PJM Regional Transmission Expansion Plan, 2006, and PJM Interconnection, www.pjm.com, February 22, 2006. Note that the planning horizon is expanding to 15 years with the next RTEP.
252 PJM Interconnection L.L.C, comments filed in Docket AD06-2, December 19, 2005. 253 A. Keech, PJM Ancillary Services Markets, MISO Ancillary Services Round Table, April 26, 2006. Load can
not supply black start or reactive power. 254 PJM Comments, December 19, 2005.

Chapter VI – Role of Demand Response in Regional Planning and Operations
Assessment of Demand Response and Advanced Metering Federal Energy Regulatory Commission
111
to accurately measure demand response, and the lack of good long-term demand response forecasting.255
Southwest Power Pool Southwest Power Pool (SPP) is a NERC regional reliability council and a FERC-approved RTO for all or parts of Arkansas, Kansas, Louisiana, Mississippi, Oklahoma, New Mexico, and Texas. SPP serves 4 million customers with about a 39,000 MW peak load with 33,000 miles of transmission lines. SPP identifies the region’s transmission expansion needs through an open stakeholder process. Coordinating with the region’s 45 electric utilities, SPP identifies the best overall regional transmission expansion plan. SPP then directs or arranges for the necessary transmission expansions, additions, and upgrades including coordination with state and federal regulators. SPP does not itself explicitly include demand response in transmission planning studies, although it does consider generation as an alternative to transmission enhancement. Individual LSEs incorporate any current or expected demand response that is within their boundaries in their load forecasts. Individual transmission owners could investigate demand response solutions as alternatives to transmission expansion projects but they are not required to do so by the region. SPP does require 30 percent of the load to be interruptible on under frequency load shedding relays in three blocks of 10 percent each.
Florida Reliability Coordinating Council Florida Reliability Coordinating Council (FRCC) is the regional reliability council for the state of Florida. Transmission system planning for the approximately 43,000 MW peak load region is dominated by its peninsular geography, with all connections to the Eastern Interconnection made at the northern border. FRCC coordinates the transmission planning efforts of the members for the region and assesses resource adequacy for the 10 year future period. Although the amount of demand response in FRCC is sizable (seven percent of peak demand, see Chapter V), the Florida PUC has been reevaluating the cost effectiveness of demand-side management and has been reducing the rebates offered to consumers. Consequently, the amount of available demand-side management capability has been decreasing. Transmission planners do not consider demand response, and the demand forecast is not reduced by the amount of expected demand response. Planners feel that there is not sufficient demand response in any one location to eliminate the need for transmission enhancement. Demand response could delay the need for a project by a year, at most. Still, there is a lot of demand response capability in Florida. Progress Energy Florida (formerly Florida Power Corporation), for example, has operated a very successful demand response program that it began in the 1980’s and includes 800,000 out of 4.4 million customers. 1000 MW of peak load reduction and 2000 MW of emergency response ares available within two seconds to one minute. However, FRCC does not qualify this resource as spinning reserve.256
255 Jeff Bladen (PJM), FERC Technical Conference, January 25, 2006, transcript, 251-256. 256 Ed Malemezian, Interview with Brendan Kirby, ORNL, 2005.

Chapter VI – Role of Demand Response in Regional Planning and Operations
Assessment of Demand Response and Advanced Metering Federal Energy Regulatory Commission
112
New York ISO NYISO was formed in 1998 as part of the restructuring of New York State's electric power industry. The NYISO is an outgrowth of the New York Power Pool which was formed following the Northeast Blackout of 1965. The power pool coordinated the statewide interconnected transmission system and economically dispatched the generation fleet. Its mission is to ensure the reliable, safe, and efficient operation of the state's 10,775 miles of major transmission system and to administer an open, competitive and nondiscriminatory wholesale market for electricity in New York State. Peak summer load is about 32,000 MW. The NYISO’s market exceeded $10 billion in 2005.257 NYISO recently initiated a Comprehensive Reliability Planning Process which identifies reliability concerns and transmission needs. This process involves extensive modeling, considering expected loads, generation resources, transmission limitations, and demand response resources including the Emergency Demand Response Program and Special Case Resource programs, discussed later. The process identifies reliability based needs rather than solutions. Generation, transmission, and demand response-based projects can be proposed. NYISO selects acceptable solutions based on their technical capability to address the identified problem and the economic viability. Only in rare cases when no acceptable solutions are proposed will the ISO discuss compelling a transmission owner to construct a transmission-based solution (backstop solution). As was the case with PJM, the NYISO intends this process to promote market based solutions to reliability problems. Transfer limits into southeastern New York are limited by voltage rather than thermal constraints with a significant need arising by 2008. 1,750 MW of resources from generation or demand response will be needed by 2010 in order to free up voltage-support capability. As a partial response to this problem, the New York Public Service Commission (NYPSC) is requiring 300 MW of demand reduction in New York City. Consolidated Edison is to obtain half of that response (150 MW). The other half will come from other suppliers. The NYPSC has also set time lines and metering requirements to help accelerate acceptance. Demand response solutions may receive funding from New York State Energy Research and Development Authority. NYISO may allow demand response to supply spinning reserves. This will likely occur in the third quarter of 2007. Currently, demand response can only supply non-spinning reserve. Ancillary service bids are co-optimized with energy requirements by the NYISO, allowing the system operator to use ancillary service resources to supply energy if needed. This may be limiting the amount of demand response offered to the system, since some loads may be unwilling to expose themselves to the risk of being required to curtail operations for an extended period.
ISO New England ISO New England (ISO-NE) evolved out of the NEPOOL tight power pool which, prior to 1999, provided joint economic dispatch across Connecticut, Maine, Massachusetts, New Hampshire, Rhode Island, and Vermont. The ISO-NE has over 8,000 miles of transmission lines to serve about a 27,000 MW peak load. ISO-NE stated that it works with stakeholders to develop fair and efficient wholesale electricity markets, to plan a reliable bulk power system, and to protect the short-term reliability of the control
257 NYISO, downloaded from www.nyiso.com, April 3, 2006.
Chapter VI – Role of Demand Response in Regional Planning and Operations
Assessment of Demand Response and Advanced Metering Federal Energy Regulatory Commission
113
area. ISO-NE annually develops a 10-year Regional System Plan which accounts for the addition of generation units, demand response, load growth, and generation retirements. System economics and air emissions are considered, along with reliability, in planning the transmission system. In addition to specifying what transmission enhancements are required, the Regional System Plan also helps attract market solutions (generation and demand response) to mitigate the need for the transmission enhancements. The current Regional System Plan includes 272 transmission projects that are expected to cost between $2 and $4 billion. Demand response is not the same as transmission enhancement in ISO-NE’s eyes. Demand response can provide a temporary solution until a permanent transmission enhancement is in place. When the power system in Southwest Connecticut was recognized as being inadequate, it was also acknowledged that neither transmission nor generation solutions could be implemented in time to restore reliability. Demand response solutions of 250 MW were sought to quickly fill the reliability gap. Transmission solutions are still being pursued to permanently resolve the problem. ISO-NE believes it has authority from FERC to order transmission construction if needed to maintain reliability. Conditions have never warranted that action. Instead the ISO has preferred to identify needs and allow the market to propose generation, transmission, or demand response solutions. The ISO views its role as selecting the best from what is proposed rather than identifying the best solution on its own. Selected projects then move through the state and federal regulatory process to enter the rate base or transmission tariff if they are transmission based. Generation and demand response projects move through their own regulatory and commercial processes. The existing form of ISO-NE’s capacity markets makes it difficult for demand response resources to fully participate in the ancillary service markets. Forward capacity markets mean that reserve costs are mostly sunk in real-time and rational real-time offers are expected to clear at $0. Further, ISO-NE utilizes forward reserve auctions, two to five months in advance, to procure 10-minute non-spinning reserve and 30 minute operating reserves. These are difficult commitments for demand response resources to make. These markets are designed to satisfy 95 percent of the reserve requirements and include penalties for failure to respond in real time. Any resource can participate, but it must look like a low-capacity generator with a high energy price and capable of providing reserves 98 percent of the time.258 Demand response resources can also register as a Dispatchable Asset Related Demand, and essentially will be treated as generators. The resources cannot restrict its response to contingency events; energy and ancillary services are co-optimized based upon the bid response price. Submitting a $999/MWh only partially mitigates the energy deployment risk and also undesirably reduces contingency event deployments.259
Southeastern Electric Reliability Council Southeastern Electric Reliability Council (SERC) encompasses all or parts of 16 states in the southeastern and central United States. Prior to the recent consolidation of the 10 regions into eight, SERC was the largest with a peak load of about 165,000 MW. It has 5,057 MW of interruptible load and demand response and 50,000 MW of load shedding capability. SERC does not have a regional policy concerning the use of demand response related to transmission enhancement. Transmission
258 Mario DePillis, The New Ancillary Services Markets of New England, MISO Ancillary Services Round Table, April 26, 2006.
259 Mario DePillis, 2006.
Chapter VI – Role of Demand Response in Regional Planning and Operations
Assessment of Demand Response and Advanced Metering Federal Energy Regulatory Commission
114
planning and the role of demand response is left to the individual transmission owners.
International Examples In many parts of the world, as in many parts of the United States, demand response impacts transmission planning indirectly by impacting expected demand. In the Nordic countries, for example, Nordel (the regional transmission operator) regards demand response as critical to supporting reliability but it does not implement demand response programs itself as this is done by the individual countries. Demand response appears to be more aimed at providing balancing capability than at deferring transmission and distribution investment.260 Australia provides a counterpoint. Australia’s National Electricity Market operates the longest interconnected power system in the world – more than 4,000 kilometers from Queensland to South Australia. Peak demand is 31,000 MW. Energy prices are typically under A$40/MWh but can go as high as A$10,000/MWh during system emergencies.261 Such a geographically large power system is necessarily dependant on transmission and transmission constraints are not uncommon. A major method for demand response to participate in markets is in support of the deferral of capital expenditure for load-growth related network expansion. New South Wales enacted a “D Factor” which allows Distribution Network Service Providers to retain capital expenditures avoided through targeting of demand management. The New South Wales DM Code of Practice also requires Distribution Network Service Providers to exhaust demand-side management as an alternative before undertaking load-driven network expansion.
Example Demand Response Projects The following examples illustrate the steps that have been taken to consider and use demand response as an alternative to transmission at various utilities and regions.
LIPA Edge The LIPA Edge project is a good example of how a demand reduction project that controls residential and small commercial air conditioners using modern technology has the potential of serving as a resource for ancillary services. The installed technology has the technical ability to provide spinning reserves, as well as peak load reduction. Remotely controllable Carrier Comfort Choice thermostats, coupled with two-way communication provided by Silicone Energy and Skytel two-way pagers allow the Long Island Power Authority (LIPA) to monitor capability and response, as well as to control, load reductions. It also enables customers to control their individual thermostats via the Internet, a benefit that motivates participation.262 The project currently controls 25,000 residential units and 5,000 small commercial
260 Grayson Heffner, Demand Response Providing Regulation and Reserve Services in Nordic Electricity Markets
– DRAFT, Consortium for Electric Reliability Technical Solutions, March 2006. 261 Grayson Heffner, Demand Response Provision of Ancillary Services in Australia’s National Electricity Market
- DRAFT, Consortium for Electric Reliability Technical Solutions, March 2006. 262 LIPA, LIPA Edge, presentation to the New York Independent System Operator Price-Responsive Load
Working Group, 21 November 21, 2002.

Chapter VI – Role of Demand Response in Regional Planning and Operations
Assessment of Demand Response and Advanced Metering Federal Energy Regulatory Commission
115
units provide 36 MW of peak load reduction.263 Detailed discussions with Carrier in 2002 revealed that the technology is fast enough to provide spinning reserves and provides ample monitoring capability. Further analysis of test data revealed that the program can typically deliver 75 MW of 10-minute spinning reserves264 at little or no additional cost at times of heavy system loading. This could provide a significant benefit for capacity-constrained Long Island. Significant spinning reserve capability remains even if the system is being used for peak reduction as shown in Figure VI-5.265 Spinning reserves capacity is now likely over 100 MW.
Figure VI-5. LIPA Edge spinning reserve capability during August 14,
2002 curtailment
-10
0
10
20
30
40
50
60
70
80
0:00 4:00 8:00 12:00 16:00 20:00 0:00
Hour
MW
Available Spinning Reserve WithoutDemand Reduction Response
Available Spinning Reserve WithDemand Reduction Response
Demand Reduction Response
Source: Brendan Kirby of Oak Ridge National Laboratory
Southern California Edison Feeder Relief Southern California Edison (SCE), with California Energy Commission support, is conducting a Demand Response Dispatch Verification Research and Demonstration Project in the summer of 2006 to demonstrate the impacts of distributed resources both as a means to provide specific load relief at the substation and distribution feeder level, and as a spinning reserves resource. The system uses the Internet, the SCE-wide area network, and various wireless technologies to provide two-way control and monitoring of the devices that control electric loads at approximately 450 sites in Southern California. Two specific objectives are to demonstrate that, when load is curtailed by a dispatch signal, the available MW demand response of a specific circuit can be predicted with a 90 percent statistical confidence and demonstrate that the load can be curtailed reliably and quickly on the issuance of a dispatch signal. The load shed is expected to start within 10 seconds of the signal and be fully implemented within two minutes.
263 Michael Marks, E-mail discussion with Michael Marks of the Applied Energy Group, April 15, 2006. 264 This test was conducted when the peak reduction program only had 25 MW of capacity. 265 Kirby, 2003.

Chapter VI – Role of Demand Response in Regional Planning and Operations
Assessment of Demand Response and Advanced Metering Federal Energy Regulatory Commission
116
SCE is implementing a special contract for the test with 400 to 500 residential customers and 50 to 100 commercial customers. Various curtailment intervals are to be tested. The selected circuit has a peak load of 9 MW. SCE expects to curtail 2 to 3 MW depending on time of day, temperature, and day of week. A rigorous statistical analysis has been performed in planning the number of customers under the test, the number of tests, and the data acquisition system to ensure the results provide a relative precision of 15 percent at the 90 percent level of confidence. SCE expects the test to provide a benchmark for repeatable, precise, rapid demand response used as a reliability service.266
BPA Olympic Peninsula BPA is conducting several pilot projects aimed at deferring the need for transmission enhancements. Several technologies are being utilized including:
• Direct load control – 20 MW from electric water heating, pool pumps, heat pumps, forced air furnaces, and baseboard heating. One-way radio pagers and power line communications within the residence are being used.
• Demand response – 16 MW from electric water heaters, cloths dryers, pool pumps, heat pumps, and forced air furnaces. Fiber optic and cable internet connections are being used to communicate with Grid-FriendlyTM appliances. Customers can set prices for response. Grid-FriendlyTM appliances will also respond to system frequency disturbances.
• Voluntary load curtailment – 22 MW through the Demand Exchange internet-based auction where loads can offer to reduce consumption in response to reliability or market volatility events.
• Distributed generation – 4 MW from industrial and commercial backup generators. • Energy efficiency – 15 MW.
Consolidated Edison Consolidated Edison provides an example where demand-side resources are being explicitly sought as an alternative to transmission and distribution expansion. Consolidated Edison issued a request for proposals in April 2006 seeking at least 123 MW of demand side management in targeted areas of New York City and Westchester County in order to defer transmission and distribution capital investment. Multiple proposals will be considered; each proposal must be for at least 500 kW of aggregated peak summer load reduction. Consolidated Edison provided detailed information and maps for each geographic area to help project developers. Materials include:
• Numbers and types of customers (residential, commercial, small commercial, types of business, types of residential, numbers of central air conditioners, numbers of room air conditioners, etc.)
• Sizes of individual customer loads (10-300+KW) • Total required load reduction (2-25 MW) • Need date (2008-2011) • Minimum project duration (two to four years)
266 SCE, California Independent System Operator and California Energy Commission, CERTS Demand Response
Project, Plan For Summer 2006 Demand Response Test on Southern California Edison Distribution Circuit, March 23, 2005
Chapter VI – Role of Demand Response in Regional Planning and Operations
Assessment of Demand Response and Advanced Metering Federal Energy Regulatory Commission
117
Clean distributed generation may be proposed, as well as energy efficiency measures. Distributed generators can reduce customer load but they may not export to the grid to be considered for this program. Energy efficiency measures are allowed (compact florescent lights, energy efficient motors, efficient air conditioning, and steam chillers, for example). Consolidated Edison has chosen not to include direct load control and measures that “temporarily curtail or interrupt loads” in this request for proposals. These will also not consider operating and maintenance improvements and improved new construction measures.267
Mad River Valley Project In 1989, Green Mountain Power (GMP) needed to enhance the distribution system feeding Sugarbush Resort in the Mad River Valley in central Vermont. Load was expected to grow and a $5 million parallel 34.5 kV line was needed. Instead, Sugarbush installed an energy management system to enable it to monitor and control its load and keep the total feeder load below 30 MW. Snowmaking was the major controlled load. GMP also engaged in an energy efficiency program for other customers on the feeder. Note that GMP largely abandoned the follow-on demand side management work once the network problems were resolved.268
The Energy Coalition The Energy Coalition was formed in 1981 by end users to aggregate demand response to help alleviate generation and network capacity shortages in southern California. The Business Energy Coalition of the Energy Coalition is a specific project in the San Francisco area that specializes in short-term network relief. A 10 MW pilot project is based on the area’s 200 largest customers with day-ahead and same-day response. Response is limited to five hours/event, one event/day, five events/month, and one hundred hours/year. Response can be called upon for CAISO Stage 2 emergencies, spinning reserve shortfalls, forecasted San Francisco temperatures above 78 degrees, local emergencies, and total CAISO load forecast to exceed 43,000 MW.
Concerns And Obstacles There are a number of obstacles to the greater use of demand response as an element in transmission planning and operations. Specific concerns and obstacles that have been identified by Commission staff are discussed below.
Lack of Uniform Treatment of Demand Response. There are many examples of features of reliability rules that accommodate generator limitations that do not increase system reliability. They are necessary to enable generators to provide the desired reliability response but they are not themselves directly related to that desired reliability response. A partial list includes:
267 Consolidated Edison, Request For Proposals To Provide Demand Side Management To Provide Transmission
And Distribution System Load Relief And Reduce Generation Capacity Requirements To Consolidated Edison Company Of New York, Inc., www.coned.com, April 14, 2006.
268 Richard Cowart, Distributed Resources and Electric System Reliability, The Regulatory Assistance Project, 2001.
Chapter VI – Role of Demand Response in Regional Planning and Operations
Assessment of Demand Response and Advanced Metering Federal Energy Regulatory Commission
118
• Minimum run times • Minimum off times • Minimum load • Ramp time for spinning reserve • Accommodation of inaccurate response • Limiting regulation range within operating range to accommodate coal pulverizer
configuration These rules are necessary to elicit the reliability response the power system requires. Similar accommodations could be afforded to other technologies, such as demand response, based on their limitations. A partial list might include:
• Maximum run time • Value of capacity that is coincident with system load • Value of response speed • Value of response accuracy • Match metering requirements to resource characteristics
Perceived Temporary Nature of Demand Response When demand response is considered as an alternative to transmission expansion, it is typically considered as deferral rather than as an alternative. This has important implications for demand response financing as well as performance. The economic viability of demand response is determined by comparing the cost of the demand response project with the present value of the savings obtained by delaying construction of the transmission investment for a few years. The transmission alternative, however, is evaluated over a 20 to 30-year facility life. Since transmission additions are large projects, transmission additions typically reduce or eliminate the need for targeted demand response resources. The basic reasoning is that load growth will eventually make the transmission investment necessary so demand response can only delay the inevitable. Operating practice often follows the same temporary logic. Demand response programs may be discontinued once the transmission project they have been delaying is finally installed. The excess capacity that is typically initially made available by transmission expansion (discussed below) makes demand response, at least temporarily unnecessary. A transmission investment is not considered in the same way. If additional transmission is needed later, it is additional transmission, not replacement. Note that demand response can also be long-lived – Progress Energy Florida’s demand response program has been operating for over 20 years. While this argument that demand response is a temporary solution is logical, it is different from how other transmission investments are evaluated. A subtransmission line might be installed or upgraded, delaying the need for a new transmission line for a few years. The subtransmission line would not be taken out of service or out of the rate base, however, once the larger line was in place. It would instead be considered a permanent part of the power system. How transmission costs are incurred and paid for is also important. Transmission is a long-lived, capital intensive, low maintenance investment with almost no cost related to use. Once installed, in one sense, use of transmission is free; there appears to be no marginal cost. Conversely, demand response typically has costs (or user inconvenience) associated with each use; there is a marginal cost. Consequently, once transmission is available it is used instead of demand response, furthering the idea that demand response is a short lived, high operating cost solution when compared with transmission.
Chapter VI – Role of Demand Response in Regional Planning and Operations
Assessment of Demand Response and Advanced Metering Federal Energy Regulatory Commission
119
While transmission projects have few costs associated with use they do have significant annual maintenance costs. Transmission assets deteriorate rapidly with no maintenance (tree trimming, relay and breaker maintenance, etc.). It is difficult to tie specific costs to specific users but the marginal costs are there.
Regulatory Treatment of Transmission and Demand Response Costs Transmission is almost always a regulated asset. Once it is in the rate base, its costs are fully covered. Demand response is not usually treated as a regulated capital resource placed in a rate base. Demand response may be cheaper overall but once transmission is available transmission always appears to be lower cost. Transmission cost recovery is essentially guaranteed once a project is built. A 230 kV high voltage transmission line would not be taken out of the rate base when an extra high voltage 765 kV line was overlaid on the transmission system, regardless of how line loadings changed. Reliability regions and ISOs are typically barred from actively developing demand side resources as alternatives to transmission enhancement. Their role is limited to facilitating competitive markets where generators and loads can economically optimize their production and use of energy. Their transmission planning activities identify constraints that are or will be impacting reliability or commerce. Regulated transmission providers and competitive generation and demand entities are expected to offer solutions, which the ISO and region assess. BPA seems to have considered this rational as well. A 2001 BPA consultant report stated: “In many respects these nonwires activities have been outside of TBL’s (Transmission Business Line – BPA’s transmission side of the business) purview and TBL has had to be passive with respect to them. If they happen, TBL can account for them, but it cannot make them happen.”269 BPA changed its approach to transmission planning and now formally considers non-wires alternatives for all transmission enhancement projects costing $2 million or more.
Reliability of Statistical Demand Response An often expressed concern is that demand response is not as reliable or as certain as generation response. While there is no absolute guarantee that any physical resource will be able to provide a specific response at any specific time, large generators have dedicated staff, extensive monitoring and control, and strong economic incentives to actually provide the response they are contracted to provide. Loads, especially small loads, do not have the same staffing or equipment resources. Response is voluntary in some cases. Nevertheless, there is good reason to believe that the inherent reliability of the response from aggregations of small loads is actually better than the reliability of response from large generators. Fundamentally, curtailments based on customer actions are a statistical resource, while generation is a deterministic resource. Some load reductions are large and deterministic while some generators are small and statistical; but as a general rule, individual load reductions are small, are important in aggregate, and behave statistically; individual generators are large, are important individually, and
269 R. Orans, S. Price, D. Lloyd, T. Foley, and E. Hirst, Expansion of BPA Transmission Planning Capabilities,
Bonneville Power Administration, November 2001.
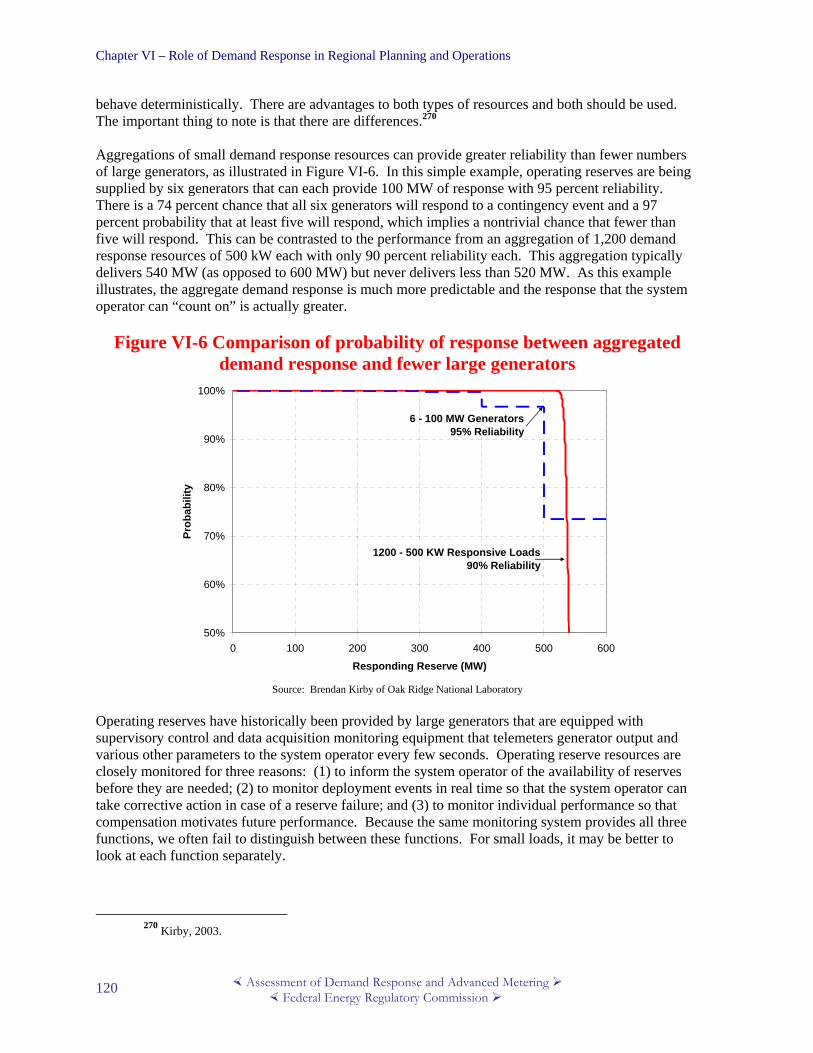
Chapter VI – Role of Demand Response in Regional Planning and Operations
Assessment of Demand Response and Advanced Metering Federal Energy Regulatory Commission
120
behave deterministically. There are advantages to both types of resources and both should be used. The important thing to note is that there are differences.270 Aggregations of small demand response resources can provide greater reliability than fewer numbers of large generators, as illustrated in Figure VI-6. In this simple example, operating reserves are being supplied by six generators that can each provide 100 MW of response with 95 percent reliability. There is a 74 percent chance that all six generators will respond to a contingency event and a 97 percent probability that at least five will respond, which implies a nontrivial chance that fewer than five will respond. This can be contrasted to the performance from an aggregation of 1,200 demand response resources of 500 kW each with only 90 percent reliability each. This aggregation typically delivers 540 MW (as opposed to 600 MW) but never delivers less than 520 MW. As this example illustrates, the aggregate demand response is much more predictable and the response that the system operator can “count on” is actually greater.
Figure VI-6 Comparison of probability of response between aggregated demand response and fewer large generators
50%
60%
70%
80%
90%
100%
0 100 200 300 400 500 600
Responding Reserve (MW)
Prob
abili
ty
6 - 100 MW Generators95% Reliability
1200 - 500 KW Responsive Loads90% Reliability
Source: Brendan Kirby of Oak Ridge National Laboratory
Operating reserves have historically been provided by large generators that are equipped with supervisory control and data acquisition monitoring equipment that telemeters generator output and various other parameters to the system operator every few seconds. Operating reserve resources are closely monitored for three reasons: (1) to inform the system operator of the availability of reserves before they are needed; (2) to monitor deployment events in real time so that the system operator can take corrective action in case of a reserve failure; and (3) to monitor individual performance so that compensation motivates future performance. Because the same monitoring system provides all three functions, we often fail to distinguish between these functions. For small loads, it may be better to look at each function separately.
270 Kirby, 2003.

Chapter VI – Role of Demand Response in Regional Planning and Operations
Assessment of Demand Response and Advanced Metering Federal Energy Regulatory Commission
121
The statistical nature of aggregated demand response lends itself to useful forecasting in place of real-time monitoring. Forecasting errors for load-supplied reserves can be more easily accommodated than forecast errors for the total load. A 10 percent error in the load forecast for a 30,000 MW balancing authority can result in a 3,000 MW supply shortfall. A 10 percent error in 600 MW of expected reserve response from demand response can be handled by derating the resource and calling for 10 percent more response than is needed. This derating can be refined as experience is gained. Demand response forecasting errors for large aggregations of small responding loads are fortunately correlated with overall load forecasting errors. If total load is higher than the forecast, so are the available reserves from demand response. Metering requirements could be based on the reliability requirements of the system, recognizing that large deterministic resources present a different monitoring requirement than aggregations of small statistical resources in order to achieve the same system reliability.
Manual Override and Voluntary Response Demand response programs often find that they must accommodate voluntary response in order to increase participation. This is not surprising. While the cost of electricity is important to most consumers, it is only one of many costs. Loads often find it impossible to make firm, long-term curtailment commitments because there is some chance that external events (external to the power system) will prevent them from reducing power consumption when requested. Even if a customer is able to respond 99 percent of the time, the other one percent of the time may be perceived to be of such high importance that the load is unwilling to participate in a curtailment program. This reaction is surprisingly universal; it can be true for residential as well as commercial and industrial customers.271 Day-ahead and hour-ahead hourly markets reduce or eliminate this problem for many large loads and generators. But the transaction burden of constantly interacting with energy and ancillary service markets is likely too great for many small loads. Many will prefer to establish a standing offer for response that they are able to honor the vast majority of the time. Manual override provides an alternative with benefits for both the power system and the customer. With a manual override feature, the load curtailment occurs, but the individual customer has the option of overriding the curtailment. The advantage to the power system is that this option increases the load participation and likely reduces the required compensation. The advantage to the customer is that it can opt out of a particular curtailment if the inconvenience or cost for the specific event is unusually high. Many peak reduction programs now include this feature, and it appears to be successful. Most important, the increase in participation outweighs the number of customers overriding the curtailment. How the opt-out is configured can be important. The natural fear from the power system side is that many customers will always opt out, but the size of this problem may not be large. Opting out requires the customer to notice that the curtailment is happening and decide that the inconvenience is too great. The customer must take specific action for
271 An industrial load may have an unexpected order and consequent production goal. A residential customer may
have a sick child at home and be unwilling to allow air conditioning curtailment. Neither event could be predicted in advance and neither event is tied to power system conditions.
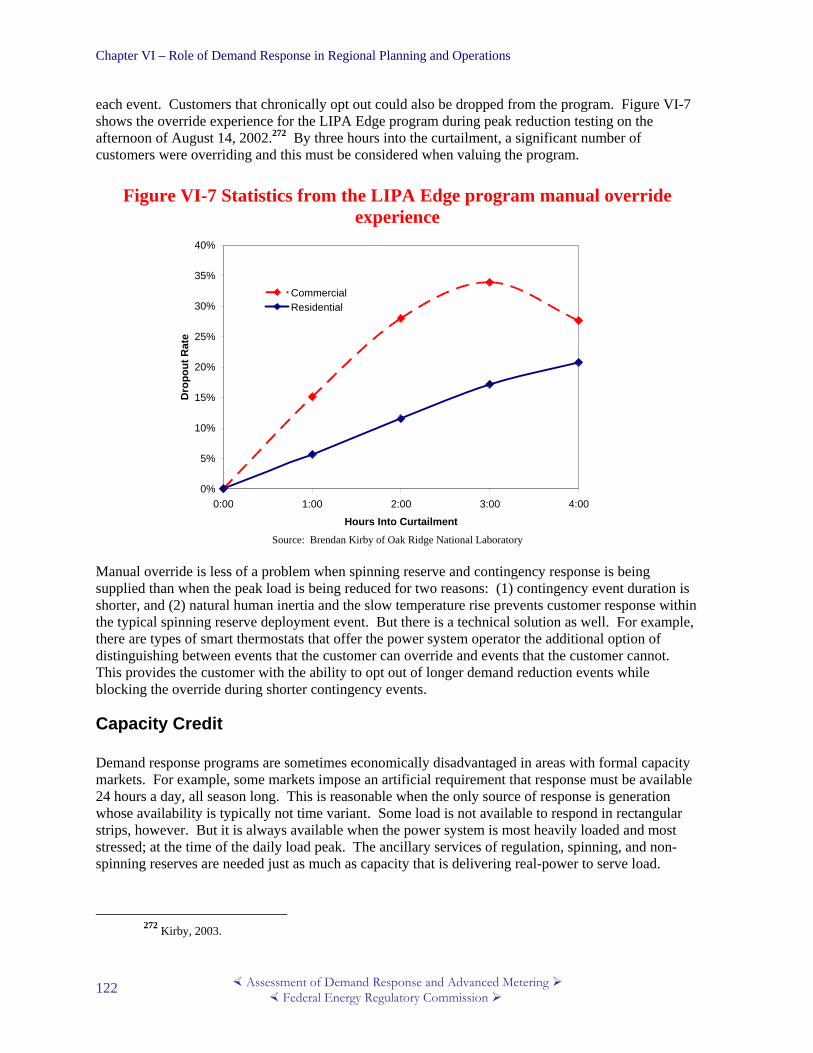
Chapter VI – Role of Demand Response in Regional Planning and Operations
Assessment of Demand Response and Advanced Metering Federal Energy Regulatory Commission
122
each event. Customers that chronically opt out could also be dropped from the program. Figure VI-7 shows the override experience for the LIPA Edge program during peak reduction testing on the afternoon of August 14, 2002.272 By three hours into the curtailment, a significant number of customers were overriding and this must be considered when valuing the program.
Figure VI-7 Statistics from the LIPA Edge program manual override
experience
Source: Brendan Kirby of Oak Ridge National Laboratory Manual override is less of a problem when spinning reserve and contingency response is being supplied than when the peak load is being reduced for two reasons: (1) contingency event duration is shorter, and (2) natural human inertia and the slow temperature rise prevents customer response within the typical spinning reserve deployment event. But there is a technical solution as well. For example, there are types of smart thermostats that offer the power system operator the additional option of distinguishing between events that the customer can override and events that the customer cannot. This provides the customer with the ability to opt out of longer demand reduction events while blocking the override during shorter contingency events.
Capacity Credit Demand response programs are sometimes economically disadvantaged in areas with formal capacity markets. For example, some markets impose an artificial requirement that response must be available 24 hours a day, all season long. This is reasonable when the only source of response is generation whose availability is typically not time variant. Some load is not available to respond in rectangular strips, however. But it is always available when the power system is most heavily loaded and most stressed; at the time of the daily load peak. The ancillary services of regulation, spinning, and non-spinning reserves are needed just as much as capacity that is delivering real-power to serve load.
272 Kirby, 2003.
0%
5%
10%
15%
20%
25%
30%
35%
40%
0:00 1:00 2:00 3:00 4:00
Hours Into Curtailment
Dro
pout
Rat
e
CommercialResidential

Chapter VI – Role of Demand Response in Regional Planning and Operations
Assessment of Demand Response and Advanced Metering Federal Energy Regulatory Commission
123
Co-Optimization – Response Cost Vs Duration Many demand response resources differ from most generators in that the cost of response rises with response duration. An air conditioning load, for example, incurs almost no cost when it provides a 10-minute interruption but incurs unacceptable costs when it provides a six hour interruption. Conversely a generator typically incurs startup and shutdown costs, even for short responses but only has ongoing fuel costs associated with its response duration. In fact, many generators have minimum run times and minimum shutdown times. This low-cost-for-short-duration-response (coupled with fast response speed) makes some demand response resources ideal for providing spinning reserve but less well suited for providing energy response or peak reduction. This policy works well for most generators but causes severe problems for loads that need to limit the duration or frequency of their response to occasional contingency conditions.273 Loads can submit very high energy bids in an attempt to be the last resource called but this is still no guarantee that they will not be used as a multi-hour energy resource. Submitting a high cost energy bid also means that the load will be used less frequently for contingency response than is economically optimal. Price caps on energy bids further limit the ability of the loads to control how long they are deployed for. California had this problem with its Rational Buyer approach, but it has since changed its market rules. It now allows resources to flag themselves as available for contingency response only. PJM allows resources to establish different prices for each service and energy providing a partial solution. ERCOT does not have this problem because energy is supplied through bilateral arrangements. Energy and ancillary service markets are separate. Possibly as a consequence, half of ERCOT’s contingency response comes from demand response.
Steps that could be taken to ensure that, in regional transmission planning and operations, demand resources are provided equitable treatment Section 1252(e)(3) of EPAct 2005 requires that the Commission identify steps that could be taken to ensure that, in regional transmission planning and operations, demand resources are provided equitable treatment. Based on comments and Commission staff review of regional transmission planning and operations, Commission staff has identified several actions and steps that could be taken to obtain increased access for demand resources. The merits of taking the following steps should be considered by appropriate transmission planners and state and federal regulators:
• Assure that regions that schedule resources and reserve needs properly recognize the capabilities and characteristics of demand resources, particularly when energy and ancillary services are co-optimized.
• Assure that requirements are specified in terms of functional needs rather than in terms of the technology that is expected to fill the need. This applies to ancillary services as well as to transmission enhancement.
o Value response speed and accuracy. o Value statistical response.
273 Co-optimization often does not work for energy or emissions-limited generators either.
Chapter VI – Role of Demand Response in Regional Planning and Operations
Assessment of Demand Response and Advanced Metering Federal Energy Regulatory Commission
124
• Accommodate the inherent characteristics of demand response resources (just as generation resource characteristics are accommodated).
o Recognize that some demand response resources have maximum run times. o Recognize the statistical nature of demand response from aggregations of numerous
small loads. o Recognize that the monitoring and communications requirements to maintain system
reliability are fundamentally different for aggregations of large numbers of small resources than they are for fewer large resources.
o Recognize the coincidence of demand response capability and total system load. Allocate appropriate capacity credit to demand response.
o Accommodate voluntary response and perform the research required to establish the level of reliable response capability.
• Allow appropriately designed demand response resources to provide all ancillary services including spinning reserve, regulation, and any new frequency responsive reserves.
• Allow for the consideration of demand response alternatives for all transmission enhancement proposals at both the state and ISO/RTO level.
o At the minimum, transmission expansion planning procedures would allow demand response resources to be proposed and considered as solutions to congested interfaces or load pockets along with local generation or transmission enhancements.
o Require demand response evaluations early enough in the process so that demand response solutions can actually be developed.
o Require reporting of alternatives considered and reasons for decisions. • When appropriate, treat demand response as a permanent solution, similar to transmission
enhancements.
Chapter VII – Regulatory Barriers
Assessment of Demand Response and Advanced Metering Federal Energy Regulatory Commission
125
Chapter VII. Regulatory Barriers This chapter addresses the sixth area, in EPAct 2005 section 1252(e)(3), that Congress directed the Commission to consider:
(F) regulatory barriers to improved customer participation in demand response, peak reduction and critical period pricing programs.
The regulatory barriers discussed in this chapter are based on input received in written comments, comments filed and discussion heard at the FERC Demand Response Technical Conference (FERC Technical Conference), a review of demand-response program experience, and through a comprehensive literature review.274
Regulatory Barriers
Disconnect Between Retail Pricing and Wholesale Markets The most frequently mentioned regulatory barrier in the literature and in the comments reviewed by Commission staff is the disconnect between fixed retail rates and fluctuating wholesale prices. By placing even a small percentage of customers on tariffs based on time-based rates, resources can be allocated more efficiently. Time-based rates offer customers incentives to shift their consumption to periods with lower rates and allow them to save on their energy bills. This is true with or without retail choice. And because the cost of delivering energy during peak periods is higher than averaged flat rates, average pricing results in an income transfer from customers who use a lower proportion of their energy during peak periods to those who use a high fraction of their electricity on peak.275 Because most customers do not face time-varying prices (see Chapter IV discussion), they are charged prices associated with the average cost to produce electricity calculated over extended period of months or years. Large customers in a few states have direct exposure to hourly pricing, but this is the exception, not the rule.276 The Government Accountability Office (GAO), in its 2004 report on demand response, highlighted this disconnect: “Most of today’s electricity system is a hybrid – competition setting wholesale prices and regulation largely setting retail prices. In addition, local public power entities (munis) and rural electric coops (co-ops) account for about 25 percent of the wholesale market and are self-regulated.”277 Even though the benefits of placing at least some customers on time-based rates is well documented, and while major industry organizations and regulatory agencies are in favor of greater implementation
274 Earlier chapters discussed barriers associated with non-regulatory areas such as implementation and customer perception.
275 California Energy Commission, Feasibility of Implementing Dynamic Pricing in California, report to the legislature to satisfy the legislative requirement of SB 1976, October 2003, http://energy.ca.gov/reports/2003-10-31_400-03-020F.PDF.
276 Only a few states such as California, Connecticut, Illinois, and New York have taken actions to introduce greater amounts of time-based rates into their jurisdictions.
277 GAO, Electricity Markets: Consumers Could Benefit from Demand Programs, But Challenges Remain, GAO-04-844, August 2004, 9.

Chapter VII – Regulatory Barriers
Assessment of Demand Response and Advanced Metering Federal Energy Regulatory Commission
126
of time-based rates,278 the structure of retail rates is largely based on fixed rates. Only a few states such as California, Connecticut, Illinois, and New York have taken actions to introduce greater amounts of time-based rates into their jurisdictions. The basic structure of retail rates has not changed significantly for decades, and even the default (standard offer service or Provider of Last Resort (POLR)) rates offered in restructured states usually maintain the historic non-varying rates and rate structures or use pre-specified fixed prices. The disconnect between retail rates and wholesale markets has grown larger as opportunities to integrate demand response into wholesale markets have increased, but retail offerings have stagnated. ISO-NE’s CEO, Gordon van Welie, posited that the continuation of flat retail pricing is “paternalistic and outdated,” stating his belief that “some form of dynamic pricing should be the basis for default service pricing for large customers.”279 However, others argue against implementation of time-based rates based on concerns about whether consumers can reasonably be expected to adjust their demand for essential uses. For example, the Pennsylvania Office of Consumer Advocate argues that time-based rates “are not appropriate when the usage relates to essential home heating or air conditioning and necessary appliance usage.”280 Although there have been many experimental and pilot programs, it is not clear why these have not moved into full implementation. As a panelist at the FERC Technical Conference expressed it, “we are suffering the death by a thousand pilots.”281 The examination of smart metering and time-based rates in the state deliberations required by EPAct 2005 should shed some light on this barrier, and may lead to greater deployment of advanced metering and time-based rates. In addition, advances in technology and cost declines associated with metering and controls, in combination with the greater system benefits they now offer, should also help ameliorate concerns about cost-effectiveness.
Utility Disincentives Associated with Offering Demand Response A long-standing barrier to electric utility investment in and promotion of customer demand-side programs is that historically, utilities make money from the sale of electricity. Otherwise stated, traditional rate-making models have been based on formulas of:
PROFIT = REVENUE – COSTS and REVENUE = PRICE * QUANTITY 282 Any actions taken by customers to reduce their overall consumption through energy efficiency, adjustment of their consumption in response to prices or load reductions during peak periods or reserve shortages, will likely reduce short-term utility revenues if they result in a reduction in kWh consumption or reduced customer peak demand. In particular, utilities cannot be assured that if customers shift their peak load reductions to off-peak usage, the utility will remain revenue neutral. As NERA stated, “while utilities have long championed conservation for a variety of long-term business reasons, it is possible that demand response would decrease earnings in the short-term and
278 For example, the Edison Electric Institute and New York Public Service Commission. 279 Gordon van Welie, speech to 2006 ISO-NE Demand Response Summit, April 27, 2006. 280 Pennsylvania Office of Consumer Advocate, comments filed in Docket AD05-17, November 18, 2005. 281 Alison Silverstein, FERC Technical Conference, transcript, 42:9. 282 Frederick Weston and Wayne Shirley, “Scoping Paper on Dynamic Pricing: Aligning Retail Prices with
Wholesale Markets,” prepared for MADRI Regulatory Subgroup, June 2005, 1, 12-15.

Chapter VII – Regulatory Barriers
Assessment of Demand Response and Advanced Metering Federal Energy Regulatory Commission
127
that this would serve as a disincentive for the utility to play an active role in promoting demand response.”283 The restructuring of the electric industry has added additional disincentives for distribution utilities. In some states, utility divestiture of generation and load-management assets 284 and the transfer of the POLR obligation to serve have removed significant drivers for utility investment. If a distribution utility does not have a direct load responsibility, then the long-term benefits associated with operating demand response as a resource are driven more by impacts on local distribution operation and reliability, and these are usually a small fraction of avoided generation costs. Policies to address utility disincentives to demand-side activities and management have been suggested and implemented for many years.285 Policy changes fall into three categories:
• Remove Disincentives. Policies that remove retail rate structures and rate designs that have discouraged implementation of demand response by decoupling profits from sales volumes.
• Recover Costs. Policies that give utilities a reasonable opportunity to recover the costs of implementing demand-response programs.
• Reward Performance. Sometimes referred to as performance-based ratemaking, retail rates and regulatory policies can include incentives for implementing high-performance demand-response programs. Incentives are usually higher returns on investment if the programs demonstrate success, through reduction of peak demand or peak period energy use, or payments based on increased customer enrollment. Shared-savings mechanisms (where utilities share the savings and/or profits associated with the demand-response programs with customers or third-party aggregators) can also be employed as another performance incentive.
Productive discussions on the best means to address utility disincentives continue. Decoupling policies are being actively examined in state proceedings, and have been implemented in California and Oregon. Other states such as New York286 and Connecticut287 rejected rate decoupling, noting the negative impact that large revenue accruals can have on rate stability. A recently approved rate plan for Consolidated Edison provides an additional example of policies that are directed at removing disincentives. Under the rate plan, Consolidated Edison will recover demand-response implementation costs (spread over three to five years) through monthly adjustment charges for all electric customers who benefit. Their incentive to perform is based on a process Consolidated Edison and the NYPSC agreed on in order to monetize the costs of demand response and “make the distribution company whole” by doing demand response.288 Consolidated Edison is entitled to recover the lost revenues from demand management that are incremental to what are already contained in its
283 NERA Economic Consulting (NERA), Distributed Resources: Incentives, prepared for EEI, April 20, 2006, 10. 284 More than 3,500 MW of capacity from interruptible contracts no longer exists. Steven Braithwait, B. Kelly
Eakin, Laurence D. Kirsch, Encouraging Demand Participation In Texas’s Power Markets, Laurits R. Christensen Associates, Inc., prepared for the Market Oversight Division of the Public Utility Commission of Texas, August 2002.
285 A good summary of these policies in included in Hope Robertson, Focusing on the Demand Side of the Power Equation: Implications and Opportunities, Cambridge Energy Research Associates, May 2006, 15-16.
286 State of New York Public Service Commission, Case No. 03-E-0640, Staff Report, July 9, 2004, 7-8. 287 Connecticut Department of Public Utility Control, Investigation into Decoupling Energy Distribution Company
Earnings from Sales, Final Decision, Docket No. 05-09-09, January 18, 2006. 288 MADRI business case subgroup meeting and conference call, May 15, 2006; for ConEd’s demand-side
agreement; and NYPSC Order on Demand Action Plan, Case 04-E-0572, March 15, 2006, see http://www.energetics.com/MADRI/#may06

Chapter VII – Regulatory Barriers
Assessment of Demand Response and Advanced Metering Federal Energy Regulatory Commission
128
electric rate plan forecast for the megawatt reductions achieved.289 Decoupling policies are also the subject of ongoing discussions within the Mid-Atlantic Distributed Resources Initiative (MADRI).290
Cost Recovery and Incentives for Enabling Technologies Without additional technology, customer actions in response to prices, incentives, or directions from grid operators cannot be (a) measured and compensated, or (b) enabled. One study noted that without near universal installation of advanced metering, demand response activity for smaller customers will likely be limited to customers with large loads suitable for load control.291 Wide-scale upgrading of meters or deployment of advanced metering and other enabling technologies requires substantial investments and outlays of capital. Utilities are reluctant to undertake these investments unless the business case for deployment is sufficiently positive to justify the outlay. In addition, utilities are concerned about whether meters could become a stranded asset under future deregulation – that is, is there long-term regulatory certainty to their investment? As Chapter III noted, the business case for advanced metering can include numerous operational cost savings for distribution utilities, in addition to demand response-related savings. Operational benefits may largely cover much of the cost of the deployment, as well as accelerating its cost recovery. Utilities need to conduct a fair and reasonable cost-benefit analysis of adopting metering infrastructure that takes into account the nature and needs of the service territory.292 Recovery of at least part of utility investment in metering, either through expensing or rate-basing, may be necessary. Without cost recovery, utilities may not have an incentive to roll out advanced metering to all customers. As was the case with utility investment in demand response, in order to provide sufficient incentive for utility investment in advanced metering, returns from this investment need to be at least commensurate with returns that utilities can get from their generation and transmission assets. Cost recovery of advanced metering in rates has been the subject of regulatory proceedings. Because these deployments may require an increase in rates, it is uncertain whether states will allow full deployments to be fully rate-based, amortized, or expensed. UtiliPoint presented the results of an earlier survey at the FERC Technical Conference (see Figure VII-1) that suggested that most of the regulators contacted supported at least partial cost recovery of advanced metering and demand response. Rate recovery is not without controversy. For instance, consumer groups in California argued against rate recovery of advanced metering in the proceedings associated with statewide deployment.293 Until uncertainty about rate recovery of advanced metering can be resolved, and that meters will not become a stranded asset under future deregulation, utilities will be reluctant to invest in the technology.294 Similarly, utilities will also need to know whether retail rate regulators will approve a
289 Richard Miller (Consolidated Edison), FERC Technical Conference, January 25, 2006, transcript, 64: 250. 290 See http://www.energetics.com/MADRI/ for presentations and papers. 291 UtiliPoint, Outlook & Evaluation of Demand Response, June 2005, 9. 292 After the assessment period in California’s Advanced Metering Initiative, the three investor-owned utilities
proposed very different metering systems and infrastructure, based on the “nature” of their customers and on customer responses during the pilot period. See “California’s Statewide Pricing Pilot: Overview of Key Findings,” Presentation made to MADRI, May 4, 2005, 18-22.
293 See, for example, prepared Testimony of Jeffrey A. Nahigian, in SDG&E’s Application for Adoption of an Advanced Metering Infrastructure (A. 05-03-015).
294 Colledge, Justin A., et al., “Power by the Minute.” McKinsey Quarterly, 2002, #1: 73-80.

Chapter VII – Regulatory Barriers
Assessment of Demand Response and Advanced Metering Federal Energy Regulatory Commission
129
Figure VII-1. Regulator treatment of AMI and Demand Response
Allowance of Cost Recovery for Future Expenses of AMI/AMR and/or Demand
Response
Yes - full recovery
of prudent expenses,
35%
Yes - some
recovery of prudent expenses,
39%
No, 17%
No reply, 9%
Source: Patti Harper-Slaboszewicz, UtiliPoint, “Regulator Interest in AMI and Demand Response,” written remarks submitted as panelist,
FERC Technical Conference, 5 concurrent retail dynamic pricing structure. Utility delay or non-action on advanced metering deployment due to these uncertainties may limit the potential for demand response in the United States. Another cost-recovery barrier raised at the FERC Technical Conference is the disconnect between the economic life of advanced metering infrastructure and its accounting depreciation period. Southern California Edison (SCE) reports that “many utilities, including us, are concerned about the potential that AMI technology will not last as long as its depreciation period… Since the ANSI meters and communication networks will have to operate in very difficult environmental conditions over a long time, if the life of these systems falls short, this could result in significant cost impacts for our customers.”295 Aligning the economic life with the accounting life will remove this disincentive. In addition, advances in technology and cost declines associated with metering and controls, in combination with the greater system benefits they now offer, should also help ameliorate concerns about cost-effectiveness.
Barriers to Providing Demand-Response Services by Third Parties While the development of organized markets and independent system operators (ISOs) and Regional Transmission Organizations (RTOs) demand-response programs has created opportunities for the development of third-party demand response providers, shifting regulatory rules and potential sunset of various demand-response programs has proven to be a disincentive. Many third-parties partner with utilities, using various risk- and profit-sharing models. The providers are often invisible to retail customers whose demand response they enable. Because third parties often bear the risks of programs
295 Paul DeMartini (Southern California Edison), FERC Technical Conference, transcript, 23: 88-89.

Chapter VII – Regulatory Barriers
Assessment of Demand Response and Advanced Metering Federal Energy Regulatory Commission
130
dependent on enabling technologies, they need long-term regulatory assurance or long-term contracts to finance the capital they need from banks.
Need for Additional Research on Cost-Effectiveness and Measurement of Reductions As states and ISOs have implemented various price-based and incentive-based demand response programs, it has become clear that there are key deficiencies in the measurement of demand response and the means to assess cost-effectiveness. The need was articulated by Chuck Goldman of the Lawrence Berkeley National Laboratory (LBNL) at the FERC Technical Conference, “the third general area is strengthening demand-response analysis and valuation, so that program designers, policymakers, and customers can anticipate demand-response impacts and benefits. Demand-response program managers need to be able to reliably measure the net benefits of demand-response options, both costs and benefits, to ensure that they are effective at providing needed demand reductions and are cost effective to consumers.”296 Improvements in these areas will assist in state deliberations and in increasing the level of effective and beneficial demand response. There are several problems with the current demand-response measurement methods. Evaluation of demand-response programs requires accurate measurement or estimation of the reductions effected by customers. At present, calculation of demand-response impacts is based on a combination of statistical estimation and engineering analysis, but there does not appear to be any consistency in these methods across utilities, states, and ISOs. For instance, several methods are currently used in ISO programs to estimate what customer demand would have been in lieu of customer actions to reduce consumption (i.e., the customer baseline). Some ISOs use an average usage over a set number of days, while others use the average of consumption immediately prior to and after demand-response events. The ability to forecast and understand how greater price-responsiveness will affect load shapes, load growth, and resource needs is limited. LBNL’s Chuck Goldman stated: “The impacts from price based demand response, which depend heavily on customer behavior, are really less well known. There are a number of studies that have tried to calculate the elasticity of demand, and there's been a lot of work done on it, but when you actually translate that work into the actual system impacts, hour by hour, there's a lot of work that needs to be done.”297 There is also disagreement about what should be included in the cost-effectiveness and program evaluations. Most of the current tests for cost-effectiveness298 were designed to assess energy efficiency and load-management activities by vertically-integrated utilities in non-restructured environments. In particular, the current tests were originally designed to establish generation equivalency for demand response, not to evaluate demand response in its entirety. Given the changes in industry structure and the existence of organized markets, these tests need to be updated. Other costs and benefits such as customer, environmental, societal, risk information, opportunity, and other difficult-to-quantify impacts are excluded. The need to update the tests is well understood, and California has taken a lead in developing an integrated efficiency and demand-response framework
296 Charles Goldman (LBNL), FERC Technical Conference, transcript, 14: 7-15. 297 Goldman, FERC Technical Conference, transcript, 21:18-24. 298 The most well-known set of cost-effectiveness tests is the Standard Practice Methodology developed in
California in the late 1970s and early 1980s (also known as the “California tests”).
Chapter VII – Regulatory Barriers
Assessment of Demand Response and Advanced Metering Federal Energy Regulatory Commission
131
and is funding research in this area.299 There is also no consistency in the evaluation methodologies that have been conducted by the ISOs on their programs. The need for clarity on cost-effectiveness methods is also an issue in the assessment of advanced metering. In particular, the inclusion and valuation of a wide variety of operational benefits such as remote shut-off/turn-on, reduction in estimated bills, and demand response is subject to debate. When these features are part of the cost-benefit calculus, the payback period for an investment in advanced meters shortens considerably.300 Utilities and regulators may also fail to include the operations and maintenance savings that accrue from demand-response programs and advanced metering but exceed narrow program costs. Research and consensus on appropriate costs and benefits to measure are needed in this area.
Existence of Specific State-Level Barriers to Greater Demand Response In several states, the policies of retail rate regulators and state statutes create barriers to implementing greater levels of demand response and development of price-based programs. For example, California and New York laws effectively limit the ability to introduce new time-based rates, especially real-time pricing. In California, a bill was passed during the California Crisis (AB1-X) that limits the ability of the California Public Utility Commission (CPUC) to implement time-based rates such as Critical Peak Pricing (CPP) for residential customers. Bruce Kaneshiro of the CPUC reported at the FERC Technical Conference that “depending on your legal interpretation of the code of the language in that bill, you could interpret it to mean that the commission is prohibited from actually raising the rates for most of its residential customers until the power that was procured by the Department Water Resources has been effectively paid off. That won't happen until 2011.”301 In New York, state law prohibits mandatory time-of-use rates for residential customers.302 The New York law places a cap on the level of price-responsiveness that can be implemented in the state, and limits state policy to voluntary price-based demand response in the residential sector. One commenter interpreted the recently passed HB 6 in Delaware to phase-in higher retail prices to contain similar restrictions.303 State policies with regard to disbursement of societal-benefit charge funds304 can also provide a barrier to greater demand response. Commissioner Anne George of Connecticut reports that they “had some initial problems with lack of support from our energy conservation and management board and the utility in terms of how to spend the system benefit charge – the funds collected from that. I think a lot of that was centered around not understanding demand response as a permanent tool.”305 Until these statutes and policies (and others like them in other states) are no longer enforced or are repealed, the full potential for demand response will not be achieved.
299 PIER Demand Response Research Center, Research Opportunity Notice DRRC RON-01, Establish the Value of
Demand Response; Develop an Integrated Efficiency Demand Response Network. July 21, 2005. 300 Roger Levy, “Establishing the AMI Business Case Framework: Advancing Technology to Support Utility,
Customer and Societal Needs,” presentation to MADRI AMI subgroup, Philadelphia, PA: May 4, 2005; and David B. Smith, Citigroup, Meter Read: Pushing the Needle to Smart Metering. February 2006.
301 Bruce Kaneshiro (CPUC), FERC Technical Conference, transcript, 201:7-13. 302 See, New York State Public Service Law §66(27). 303 Delaware HB 6, http://www.legis.state.de.us/LIS/LIS143.NSF/vwLegislation/HB+6?Opendocument. 304 Societal benefits charges are non-bypassable charges on customer bills that are used by multiple states to fund a
variety of activities, including energy efficiency, renewable energy, low-income energy assistance, and demand response. 305 Anne George (CT DPUC), FERC Technical Conference, 236-237.

Chapter VII – Regulatory Barriers
Assessment of Demand Response and Advanced Metering Federal Energy Regulatory Commission
132
Specific Retail and Wholesale Rules that Limit Demand Response Similar to the barriers caused by existing state statutes and policies about pricing and disbursement of funds, certain wholesale and retail market designs that have evolved over the last decade include rules and procedures that are not particularly friendly to demand participation. These problems include provisions included in state restructuring statutes, settlement and payment procedures, and frequent changes in market design and rules. An example of provisions in state restructuring statutes that have the effect of limiting demand response is the requirement that retail electric companies in the Electric Reliability Council of Texas (ERCOT) must be associated with and settle with only one Qualifying Scheduling Entity (QSE). This requirement creates problems for companies that are interested in aggregating customer load reduction. Unless the load-reduction company limits its aggregation to the customers of one retail electric company, it needs to develop contractual agreements with multiple retail electric companies and QSEs in order to get paid for any load reduction it provides to the market. This dynamic is one of the reasons that the demand-response provider company Comverge chose not to activate the air conditioner switches that it bought from CenterPoint Energy. Settlement issues related to payment for load reductions to third-party companies continues to be a problem in the ISO markets.306 Standard settlement procedure in the ISOs is to complete final settlement for positions between 60 to 90 days after the close of the real-time or day-ahead market. Third-party aggregators complain that this settlement provision delays when they can provide customers payments for their actions. For example, participants in a Mid-Atlantic Distributed Resources Initiative (MADRI) meeting in December 2005 indicated that they still had not received payments for load reductions that had occurred during the previous summer. Provisions in the PJM tariff also make it difficult for third-party aggregators to provide the ISO an accounting of when curtailments occurred within a set time period. Since distribution utilities have exclusive access to meter data, third-party aggregators must wait until the utilities complete their meter reading and verification processes before they can submit the curtailment data to the ISOs. While PJM indicates that this problem has been resolved by the time of the FERC Technical Conference, a more systemic solution is needed. Deployment of advanced metering and greater real-time access to meter reads by third-party providers will assist in the resolution of this payment issue.307
Insufficient Market Transparency and Access to Data Lack of access to data has been identified as a barrier to demand response. Greater transparency of unregulated retailer price offers and information on the amount of load under time-based rates or pricing will assist grid operation and planning. As Chuck Goldman of LBNL states: “If you want to move toward having customers being exposed to prices, you have to understand what's happening in the market, and, right now, we have very little information about what's happening among retailers in this area.”308
306 Bernie Neenan, Richard N. Boisvert and Peter A. Cappers, “What Makes a Customer Price-Responsive?” The
Electricity Journal, 15 #3 (April 2002), 53, discussing NYISO’s price-response load programs in the summer of 2001; conversations with PJM officials in the summer of 2005 reveal that this problem persists.
307 PJM is discussing solutions to this problem in its Demand-Side Working Group: http://www.pjm.org/committees/working-groups/dsrwg/dsrwg.html.
308 Chuck Goldman (LBNL), FERC Technical Conference, 48:20-24.

Chapter VII – Regulatory Barriers
Assessment of Demand Response and Advanced Metering Federal Energy Regulatory Commission
133
A connected but larger barrier related to data is timely access to meter data. Customer response to time-varying prices has the most impact when customers can see the result of their actions in real-time or near real-time. One of the benefits associated with advanced metering is the ability to measure and provide usage. Nevertheless, policies on access to meter data have not kept up with the developments and advancements in advanced metering technology and data retrieval. Typically, the rules and tariffs in operation for distribution utilities provide access to meter reads to customers, but with some time lag. More problematic is the access to customer meter data for independent retailers and aggregators. Ideally, in an efficient and transparent market, retailers would be able to base their price offerings and scheduling/settlement on knowledge about actual customer load shape. While there are exceptions, such as the meter data access policies in ERCOT, current utility tariffs and policies make access to this data time-consuming and expensive.
Better Coordination of Federal-State Jurisdiction Affecting Demand Response While states have primary jurisdiction over demand response, demand response plays a role in wholesale markets under Commission jurisdiction. Some commentators such as Steel Manufacturers Association,309 Alcoa,310 and Heffner and Sullivan311 have suggested that confusion over the scope of demand response in wholesale markets has limited the full potential of demand response. Greater clarity and coordination between wholesale and state programs is needed.
Recommendations Demand response deserves serious attention. Staff recommends that the Commission: (1) explore how to better accommodate demand response in wholesale markets; (2) explore how to coordinate with utilities, state commissions and other interested parties on demand response in wholesale and retail markets; and (3) consider specific proposals for compatible regulatory approaches, including how to eliminate regulatory barriers to improved participation in demand response, peak reduction and critical peak pricing programs. Staff also encourages states to continue to consider ways to actively encourage demand response at the retail level. In particular, staff recommends that the Commission and states work cooperatively in finding demand response solutions.
309 Steel Manufacturers Association, comments filed in Docket AD06-2, December 19, 2005. 310 Alcoa, comments filed in Docket AD06-2, December 19, 2005. 311 Grayson Heffner and Freeman Sullivan, A Critical Examination of ISO-Sponsored Demand Response
Programs, August 2005.

Chapter VII – Regulatory Barriers
Assessment of Demand Response and Advanced Metering Federal Energy Regulatory Commission
134

Appendices to the Report
Assessment of Demand Response and Advanced Metering Federal Energy Regulatory Commission
Appendices
Appendix A: EPAct 2005 Language on Demand Response and Smart Metering Appendix B: Acronyms Used in the Report Appendix C: Glossary for the Report Appendix D: Bibliography for the Report Appendix E: The Public Process Leading to the Report Appendix F: The FERC Survey Appendix G: FERC Survey Respondents Appendix H: Demand Response (DR) Programs and Services at Responding Utilities Appendix I: Data and Sources for Figures Appendix J: Acknowledgements


Appendix A: EPAct 2005 Language
Assessment of Demand Response and Advanced Metering Federal Energy Regulatory Commission
A-1
Appendix A: EPAct 2005 Language on Demand Response and Smart Metering
SEC. 1252. SMART METERING.
(a) IN GENERAL.—Section 111(d) of the Public Utility Regulatory Policies Act of 1978 (16 U.S.C. 2621(d)) is amended by adding at the end the following: ‘‘(14) TIME-BASED METERING AND COMMUNICATIONS.— (A) Not later than 18 months after the date of enactment of this paragraph, each electric utility shall offer each of its customer H. R. 6—371 classes, and provide individual customers upon customer request, a time-based rate schedule under which the rate charged by the electric utility varies during different time periods and reflects the variance, if any, in the utility’s costs of generating and purchasing electricity at the wholesale level. The time-based rate schedule shall enable the electric consumer to manage energy use and cost through advanced metering and communications technology. ‘‘(B) The types of time-based rate schedules that may be offered under the schedule referred to in subparagraph (A) include, among others—
‘‘(i) time-of-use pricing whereby electricity prices are set for a specific time period on an advance or forward basis, typically not changing more often than twice a year, based on the utility’s cost of generating and/or purchasing such electricity at the wholesale level for the benefit of the consumer. Prices paid for energy consumed during these periods shall be pre-established and known to consumers in advance of such consumption, allowing them to vary their demand and usage in response to such prices and manage their energy costs by shifting usage to a lower cost period or reducing their consumption overall; ‘‘(ii) critical peak pricing whereby time-of-use prices are in effect except for certain peak days, when prices may reflect the costs of generating and/or purchasing electricity at the wholesale level and when consumers may receive additional discounts for reducing peak period energy consumption; ‘‘(iii) real-time pricing whereby electricity prices are set for a specific time period on an advanced or forward basis, reflecting the utility’s cost of generating and/or purchasing electricity at the wholesale level, and may change as often as hourly; and ‘‘(iv) credits for consumers with large loads who enter into pre-established peak load reduction agreements that reduce a utility’s planned capacity obligations.
‘‘(C) Each electric utility subject to subparagraph (A) shall provide each customer requesting a time-based rate with a time-based meter capable of enabling the utility and customer to offer and receive such rate, respectively. ‘‘(D) For purposes of implementing this paragraph, any reference contained in this section to the date of enactment of the Public Utility Regulatory Policies Act of 1978 shall be deemed to be a reference to the date of enactment of this paragraph. ‘‘(E) In a State that permits third-party marketers to sell electric energy to retail electric consumers, such consumers shall be entitled to receive the same time-based metering and communications device and service as a retail electric consumer of the electric utility. ‘‘(F) Notwithstanding subsections (b) and (c) of section 112, each State regulatory authority shall, not later than 18 months after the date of enactment of this paragraph conduct an investigation in accordance with section 115(i) and issue a decision whether it is appropriate to implement the standards set out in subparagraphs (A) and (C).’’. H. R. 6—372
Appendix A: EPAct 2005 Language
Assessment of Demand Response and Advanced Metering Federal Energy Regulatory Commission
A-2
(b) STATE INVESTIGATION OF DEMAND RESPONSE AND TIMEBASED METERING.—Section 115 of the Public Utility Regulatory Policies Act of 1978 (16 U.S.C. 2625) is amended as follows: (1) By inserting in subsection (b) after the phrase ‘‘the standard for time-of-day rates established by section 111(d)(3)’’ the following: ‘‘and the standard for time-based metering and communications established by section 111(d)(14)’’. (2) By inserting in subsection (b) after the phrase ‘‘are likely to exceed the metering’’ the following: ‘‘and communications’’. (3) By adding at the end the following: ‘‘(i) TIME-BASED METERING AND COMMUNICATIONS.—In making a determination with respect to the standard established by section 111(d)(14), the investigation requirement of section 111(d)(14)(F) shall be as follows: Each State regulatory authority shall conduct an investigation and issue a decision whether or not it is appropriate for electric utilities to provide and install time-based meters and communications devices for each of their customers which enable such customers to participate in time-based pricing rate schedules and other demand response programs.’’. (c) FEDERAL ASSISTANCE ON DEMAND RESPONSE.—Section 132(a) of the Public Utility Regulatory Policies Act of 1978 (16 U.S.C. 2642(a)) is amended by striking ‘‘and’’ at the end of paragraph (3), striking the period at the end of paragraph (4) and inserting ‘‘; and’’, and by adding the following at the end thereof: ‘‘(5) technologies, techniques, and rate-making methods related to advanced metering and communications and the use of these technologies, techniques and methods in demand response programs.’’. (d) FEDERAL GUIDANCE.—Section 132 of the Public Utility Regulatory Policies Act of 1978 (16 U.S.C. 2642) is amended by adding the following at the end thereof: ‘‘(d) DEMAND RESPONSE.—The Secretary shall be responsible for— ‘‘(1) educating consumers on the availability, advantages, and benefits of advanced metering and communications technologies, including the funding of demonstration or pilot projects; ‘‘(2) working with States, utilities, other energy providers and advanced metering and communications experts to identify and address barriers to the adoption of demand response programs; and ‘‘(3) not later than 180 days after the date of enactment of the Energy Policy Act of 2005, providing Congress with a report that identifies and quantifies the national benefits of demand response and makes a recommendation on achieving specific levels of such benefits by January 1, 2007.’’. (e) DEMAND RESPONSE AND REGIONAL COORDINATION.— (1) IN GENERAL.—It is the policy of the United States to encourage States to coordinate, on a regional basis, State energy policies to provide reliable and affordable demand response services to the public. (2) TECHNICAL ASSISTANCE.—The Secretary shall provide technical assistance to States and regional organizations formed by two or more States to assist them in—
(A) identifying the areas with the greatest demand response potential; H. R. 6—373 (B) identifying and resolving problems in transmission and distribution networks, including through the use of demand response; (C) developing plans and programs to use demand response to respond to peak demand or emergency needs; and (D) identifying specific measures consumers can take to participate in these demand response programs.

Appendix A: EPAct 2005 Language
Assessment of Demand Response and Advanced Metering Federal Energy Regulatory Commission
A-3
(3) REPORT.—Not later than 1 year after the date of enactment of the Energy Policy Act of 2005, the Commission shall prepare and publish an annual report, by appropriate region, that assesses demand response resources, including those available from all consumer classes, and which identifies and reviews—
(A) saturation and penetration rate of advanced meters and communications technologies, devices and systems; (B) existing demand response programs and time-based rate programs; (C) the annual resource contribution of demand resources; (D) the potential for demand response as a quantifiable, reliable resource for regional planning purposes (E) steps taken to ensure that, in regional transmission planning and operations, demand resources are provided equitable treatment as a quantifiable, reliable resource relative to the resource obligations of any load-serving entity, transmission provider, or transmitting party; and (F) regulatory barriers to improve customer participation in demand response, peak reduction and critical period pricing programs.
(f) FEDERAL ENCOURAGEMENT OF DEMAND RESPONSE DEVICES.—It is the policy of the United States that time-based pricing and other forms of demand response, whereby electricity customers are provided with electricity price signals and the ability to benefit by responding to them, shall be encouraged, the deployment of such technology and devices that enable electricity customers to participate in such pricing and demand response systems shall be facilitated, and unnecessary barriers to demand response participation in energy, capacity and ancillary service markets shall be eliminated. It is further the policy of the United States that the benefits of such demand response that accrue to those not deploying such technology and devices, but who are part of the same regional electricity entity, shall be recognized. (g) TIME LIMITATIONS.—Section 112(b) of the Public Utility Regulatory Policies Act of 1978 (16 U.S.C. 2622(b)) is amended by adding at the end the following: ‘‘(4)(A) Not later than 1 year after the enactment of this paragraph, each State regulatory authority (with respect to teach electric utility for which it has ratemaking authority) and each nonregulated electric utility shall commence the consideration referred to in section 111, or set a hearing date for such consideration, with respect to the standard established by paragraph (14) of section 111(d). ‘‘(B) Not later than 2 years after the date of the enactment of this paragraph, each State regulatory authority (with respect to each electric utility for which it has ratemaking authority), and each nonregulated electric utility, shall complete the consideration, and shall make the determination, referred to in section 111 with respect to the standard established by paragraph (14) of section 111(d).’’.

Appendix A: EPAct 2005 Language
Assessment of Demand Response and Advanced Metering Federal Energy Regulatory Commission
A-4
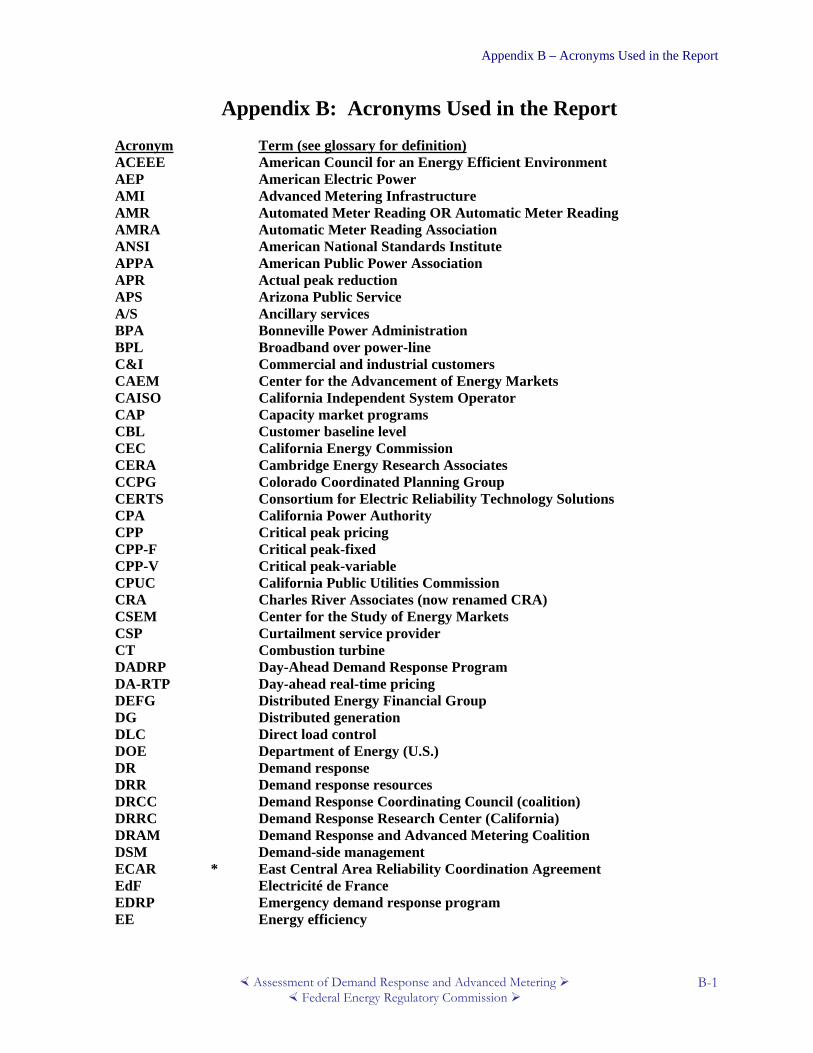
Appendix B – Acronyms Used in the Report
Assessment of Demand Response and Advanced Metering Federal Energy Regulatory Commission
B-1
Appendix B: Acronyms Used in the Report
Acronym Term (see glossary for definition) ACEEE American Council for an Energy Efficient Environment AEP American Electric Power AMI Advanced Metering Infrastructure AMR Automated Meter Reading OR Automatic Meter Reading AMRA Automatic Meter Reading Association ANSI American National Standards Institute APPA American Public Power Association APR Actual peak reduction APS Arizona Public Service A/S Ancillary services BPA Bonneville Power Administration BPL Broadband over power-line C&I Commercial and industrial customers CAEM Center for the Advancement of Energy Markets CAISO California Independent System Operator CAP Capacity market programs CBL Customer baseline level CEC California Energy Commission CERA Cambridge Energy Research Associates CCPG Colorado Coordinated Planning Group CERTS Consortium for Electric Reliability Technology Solutions CPA California Power Authority CPP Critical peak pricing CPP-F Critical peak-fixed CPP-V Critical peak-variable CPUC California Public Utilities Commission CRA Charles River Associates (now renamed CRA) CSEM Center for the Study of Energy Markets CSP Curtailment service provider CT Combustion turbine DADRP Day-Ahead Demand Response Program DA-RTP Day-ahead real-time pricing DEFG Distributed Energy Financial Group DG Distributed generation DLC Direct load control DOE Department of Energy (U.S.) DR Demand response DRR Demand response resources DRCC Demand Response Coordinating Council (coalition) DRRC Demand Response Research Center (California) DRAM Demand Response and Advanced Metering Coalition DSM Demand-side management ECAR * East Central Area Reliability Coordination Agreement EdF Electricité de France EDRP Emergency demand response program EE Energy efficiency

Appendix B – Acronyms Used in the Report
Assessment of Demand Response and Advanced Metering Federal Energy Regulatory Commission
B-2
EEI Edison Electric Institute EIA Energy Information Administration (U.S.) EPA Environmental Protection Agency (U.S.) EPAct 2005 Energy Policy Act of 2005 EPRI Electric Power Research Institute ERCOT * ** Electric Reliability Council of Texas, Inc. FERC Federal Energy Regulatory Commission (U.S.) FRCC * ** Florida Reliability Coordinating Council GAO General Accountability Office (U.S.) GMP Green Mountain Power HVAC Heating, ventilation, and air conditioning kW Kilowatt-hour kWh Kilowatt-hour (one thousand watt-hours) I/C Interruptible /Curtailable ICAP Installed capacity ICAP-SCR Installed capacity special case resources (NYISO category) ICF ICF International – consulting firm IEA International Energy Agency (Paris) IOU Investor-owned utility ISO Independent system operator ISO-NE Independent System Operator of New England LaaR Load acting as a resource (ERCOT category) LBNL Lawrence Berkeley National Laboratory LIPA Long Island Power Authority LMP Locational marginal price/pricing LSE Load-serving entity MAAC * Mid-Atlantic Area Council (geographically within PJM) MADRI Mid-Atlantic Distributed Resources Initiative MAIN * Mid-America Interconnected Network MDM Meter data management MISO Midwest Independent System Operator MRO ** Midwest Reliability Organization MTEP Midwest ISO Transmission Expansion Plan 2005 MW Megawatt (one million watts) MWh Megawatt-hour (one million watt-hours) NARUC National Association of Regulatory Utility Commissioners NEDRI New England Distributed Resources Initiative NERA NERA Economic Consulting NERC North American Electric Reliability Council NPCC ** Northeast Power Coordinating Council NRECA National Association of Rural Electric Cooperatives NTAC Northwest Transmission Assessment Committee NYDER New York Department of Environmental Resources NYISO New York Independent System Operator NYPSC New York Public Service Commission NYSERDA New York State Energy Research and Development Authority O&M Operations and maintenance ORNL Oak Ridge National Laboratory (U.S.) PCT Programmable communicating thermostat PDCI Pacific Direct Current Inter-tie

Appendix B – Acronyms Used in the Report
Assessment of Demand Response and Advanced Metering Federal Energy Regulatory Commission
B-3
PG&E Pacific Gas & Electric PIER Public Interest Energy Research (CEC) PJM PJM Interconnection, L.L.C PLC Power line communication PNNL Pacific Northwest National Laboratory (DOE) POLR Provider of last resort PLMA Peak Load Management Association PPR Potential peak reduction PSC Public Service Commission PSE Puget Sound Energy PUC Public Utility Commission PURPA Public Utility Regulatory Policies Act of 1978 QSE Qualifying scheduling entity RAP Regulatory Assistance Project RF Radio frequency RFC ** ReliabilityFirst Corporation RFP Request for proposals RMATS Rocky Mountain Area Transmission Study RRO Regional reliability organization RTEP Regional transmission expansion plan RTO Regional transmission organization RTP Real-time pricing SCADA Supervisory control and data acquisition SCE Southern California Edison SCR Special Case Resources (NYISO category) SDG&E San Diego Gas & Electric SERC ** SERC Reliability Corporation SERC * Southeastern Electric Reliability Council SPP * ** Southwest Power Pool, Inc. SPP Statewide Pricing Pilot (California) SRP Salt River Agricultural Improvement & Power District SSG-WI PWG Seams Steering Group – Western Interconnection Planning Work Group STEP Southwest Transmission Expansion Plan group SWAT Southwest Area Transmission TBL Transmission business line TWACS Two-way automatic communication system TO Transmission owner TOU Time-of-use (rate) UFLS Under frequency load shedding UVLS Under voltage load shedding VPP Variable peak pricing WECC * ** Western Electricity Coordinating Council
* former NERC region used in FERC Surveys and in Chapter VI ** proposed new Regional Reliability Organizations

Appendix B – Acronyms Used in the Report
Assessment of Demand Response and Advanced Metering Federal Energy Regulatory Commission
B-4
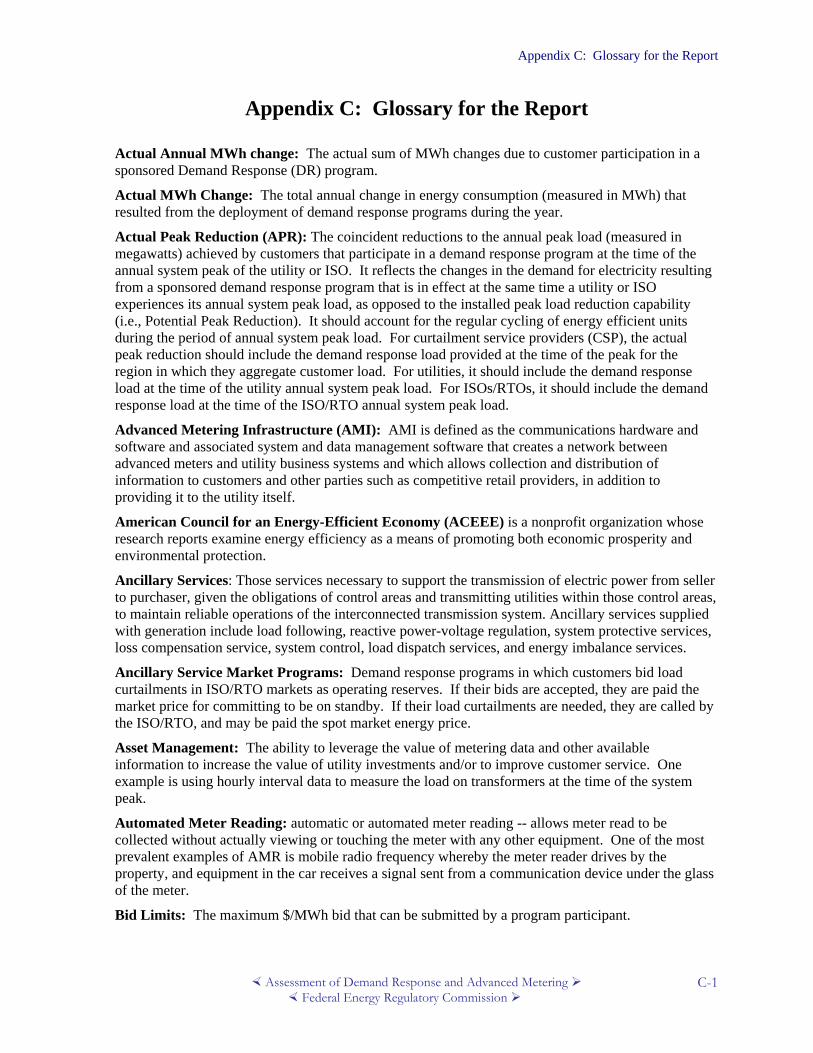
Appendix C: Glossary for the Report
Assessment of Demand Response and Advanced Metering Federal Energy Regulatory Commission
C-1
Appendix C: Glossary for the Report
Actual Annual MWh change: The actual sum of MWh changes due to customer participation in a sponsored Demand Response (DR) program.
Actual MWh Change: The total annual change in energy consumption (measured in MWh) that resulted from the deployment of demand response programs during the year.
Actual Peak Reduction (APR): The coincident reductions to the annual peak load (measured in megawatts) achieved by customers that participate in a demand response program at the time of the annual system peak of the utility or ISO. It reflects the changes in the demand for electricity resulting from a sponsored demand response program that is in effect at the same time a utility or ISO experiences its annual system peak load, as opposed to the installed peak load reduction capability (i.e., Potential Peak Reduction). It should account for the regular cycling of energy efficient units during the period of annual system peak load. For curtailment service providers (CSP), the actual peak reduction should include the demand response load provided at the time of the peak for the region in which they aggregate customer load. For utilities, it should include the demand response load at the time of the utility annual system peak load. For ISOs/RTOs, it should include the demand response load at the time of the ISO/RTO annual system peak load.
Advanced Metering Infrastructure (AMI): AMI is defined as the communications hardware and software and associated system and data management software that creates a network between advanced meters and utility business systems and which allows collection and distribution of information to customers and other parties such as competitive retail providers, in addition to providing it to the utility itself.
American Council for an Energy-Efficient Economy (ACEEE) is a nonprofit organization whose research reports examine energy efficiency as a means of promoting both economic prosperity and environmental protection.
Ancillary Services: Those services necessary to support the transmission of electric power from seller to purchaser, given the obligations of control areas and transmitting utilities within those control areas, to maintain reliable operations of the interconnected transmission system. Ancillary services supplied with generation include load following, reactive power-voltage regulation, system protective services, loss compensation service, system control, load dispatch services, and energy imbalance services.
Ancillary Service Market Programs: Demand response programs in which customers bid load curtailments in ISO/RTO markets as operating reserves. If their bids are accepted, they are paid the market price for committing to be on standby. If their load curtailments are needed, they are called by the ISO/RTO, and may be paid the spot market energy price.
Asset Management: The ability to leverage the value of metering data and other available information to increase the value of utility investments and/or to improve customer service. One example is using hourly interval data to measure the load on transformers at the time of the system peak.
Automated Meter Reading: automatic or automated meter reading -- allows meter read to be collected without actually viewing or touching the meter with any other equipment. One of the most prevalent examples of AMR is mobile radio frequency whereby the meter reader drives by the property, and equipment in the car receives a signal sent from a communication device under the glass of the meter.
Bid Limits: The maximum $/MWh bid that can be submitted by a program participant.

Appendix C: Glossary for the Report
Assessment of Demand Response and Advanced Metering Federal Energy Regulatory Commission
C-2
Billing or Revenue Meter: Meters installed at customer locations that meter electric usage and possibly other parameters associated with a customer account and provide information necessary for generating a bill to the customer for the customer account.
Bonneville Power Administration (BPA): A federal power marketing and electric transmission agency headquartered in Portland, Oregon.
Capable: AMI network could initiate interval data and collection without a physical visit to the meter site to reprogram it or to add an extra device of some kind.
Capacity Market Programs (CAP): Demand response programs in which customers offer load curtailments as system capacity to replace conventional generation or delivery resources. Customers typically receive day-of notice of events and face penalties for failure to curtail when called upon to do so. Incentives usually consist of up-front reservation payments.
Commercial sector: An energy-consuming sector that consists of service-providing facilities and equipment belonging to: businesses; federal, state, and local governments; and other private and public organizations, such as religious, social, or fraternal groups. The commercial sector includes institutional living quarters, sewage treatment facilities, and street lighting. Common uses of energy associated with this sector include space heating, water heating, air conditioning, lighting, refrigeration, cooking, and running a wide variety of other equipment. Note: This sector includes generators that produce electricity and/or useful thermal output primarily to support the activities of the above-mentioned commercial establishments.
Cooperative Electric Utility: An electric utility legally established to be owned by and operated for the benefit of those using its service. The utility company will generate, transmit, and/or distribute supplies of electric energy to a specified area not being serviced by another utility. Such ventures are generally exempt from federal income tax laws. Most electric cooperatives were initially financed by the Rural Utilities Service (formerly the Rural Electrification Administration), U.S. Department of Agriculture.
Critical Peak Pricing (CPP): CPP rates are a hybrid of the TOU and RTP design. The basic rate structure is TOU. However, provision is made for replacing the normal peak price with a much higher CPP event price under specified trigger conditions (e.g., when system reliability is compromised or supply prices are very high).
Curtailment Service Provider (CSP): Demand response load providers that are not necessarily load serving entities. CSPs may sponsor demand response programs and sell the demand response load to utilities, RTOs and/or ISOs.
Customer Account: A record at the energy provider that identifies an entity receiving electric service at one or more locations within the utility service footprint. The identified entity is responsible for paying the cost of energy consumed and metered at the location(s) on the account. There may be no meter associated with the customer account (such as with street lights), or one or more meters associated with a particular customer account.
Demand: Represents the requirements of a customer or area at a particular moment in time. Typically calculated as the average requirement over a period of several minutes to an hour, and thus usually expressed in kilowatts or megawatts rather than kilowatt-hours or megawatt-hours. Demand and load are used interchangeably when referring to energy requirements for a given customer or area.
Demand Bidding/Buyback (DB): A demand response program where customers or curtailment service providers offer bids to curtail based on wholesale electricity market prices or an equivalent. Mainly offered to large customers (e.g., one MW and over), but small customer demand response load can be aggregated by curtailment service providers and bid into the demand bidding program sponsor.
Appendix C: Glossary for the Report
Assessment of Demand Response and Advanced Metering Federal Energy Regulatory Commission
C-3
Demand Response (DR): The planning, implementation, and monitoring of activities designed to encourage customers to modify patterns of electricity usage, including the timing and level of electricity demand. Demand response covers the complete range of load-shape objectives and customer objectives, including strategic conservation, time-based rates, peak load reduction, as well as customer management of energy bills.
Demand Response Event: A period of time identified by the demand response program sponsor when it is seeking reduced energy consumption and/or load from customers participating in the program. Depending on the type of program and event (economic or emergency), customers are expected to respond or decide whether to respond to the call for reduced load and energy usage. The program sponsor generally will notify the customer of the demand response event before the event begins, and when the event ends. Generally each event is a certain number of hours, and the program sponsors are limited to a maximum number of events per year.
Demand Response Load: The load reduction that results from demand response activities.
Direct Load Control (DLC): A demand response activity by which the program operator remotely shuts down or cycles a customer’s electrical equipment (e.g. air conditioner, water heater) on short notice. Direct load control programs are primarily offered to residential or small commercial customers.
Duration of Event: The length of an Emergency or Economic Demand Response Event in hours.
EIA ID Number: Unique identification number assigned by EIA to companies and entities operating in the electric power industry.
Economic Demand Response Event: A demand response event in which the demand response program sponsor directs response to an economic market opportunity rather than for reliability or because of an emergency in the energy delivery system of the program sponsor orthe RTO/ISO.
Edison Electric Institute (EEI): The trade association for the investor-owned utility companies.
Elasticity of Demand: The degree to which consumer demand for a product responds to changes in price, availability or other factors.
Electric Power: The rate at which electric energy is transferred. Electric power is measured by capacity and is commonly expressed in megawatts (MW).
Electric Power Research Institute (EPRI): An independent, non-profit energy and environmental research organization which brings together members, participants, and the Institute's scientists and engineers to work collaboratively on solutions to electric power issues.
Electric Reliability Council of Texas (ERCOT): The electric reliability organization which ensures reliable and cost-effective operation of the grid in the Texas area.
Electric Utility: A corporation, person, agency, authority, or other legal entity or instrumentality aligned with distribution facilities for delivery of electric energy for use primarily by the public. Included are investor-owned electric utilities, municipal and state utilities, federal electric utilities, and rural electric cooperatives. A few entities that are tariff based and affiliated with companies that own distribution facilities are also included.
Electricity: A form of energy characterized by the presence and motion of elementary charged particles generated by friction, induction, or chemical change.
Emergency Demand Response Event: A demand response event called by the program sponsor in response to an emergency of the delivery system of the demand response sponsor or of another entity such as a utility or ISO.
Appendix C: Glossary for the Report
Assessment of Demand Response and Advanced Metering Federal Energy Regulatory Commission
C-4
Emergency Demand Response Program (EDRP): A demand response program that provides incentive payments to customers for load reductions during periods when reserve shortfalls arise.
Energy: The capacity for doing work as measured by the capability of doing work (potential energy) or the conversion of this capability to motion (kinetic energy). Energy has several forms, some of which are easily convertible and can be changed to another form useful for work. Most of the world's convertible energy comes from fossil fuels that are burned to produce heat that is then used as a transfer medium to mechanical or other means in order to accomplish tasks. Electrical energy is usually measured in kilowatt-hours.
Energy Efficiency (EE): Refers to programs that are aimed at reducing the energy used by specific end-use devices and systems, typically without affecting the services provided. These programs reduce overall electricity consumption (reported in megawatt-hours), often, but not always, without explicit consideration for the timing of program-induced savings. Such savings are generally achieved by substituting technologically more advanced equipment to produce the same level of end-use services (e.g. lighting, heating, motor drive) with less electricity. Examples include energy saving appliances and lighting programs, high-efficiency heating, ventilating and air conditioning (HVAC) systems or control modifications, efficient building design, advanced electric motor drives, and heat recovery systems.
Enhanced Customer Service: The ability to offer ultimate customers the choice of bill data, additional rate options such as real time pricing or critical peak pricing, verify an outage or restoration of service following an outage, more information to understand a customer concern over an electric bill, reduce bill estimates when a meter read is not available, opening or closing of an account due to customer relocation without requiring a site visit to the meter(s), and/or more accurate bills.
Executive Dashboard: The ability of the AMI network to provide information that would support utility management viewing on a timely basis. The information might include current outages and MW sales. In this context, the utility would need to also have an executive dashboard application. Timely would not necessarily mean in real-time but it would likely mean that within an hour to 24 hours, management would be able to view usage measured at revenue and billing meters across the utility service territory.
Florida Reliability Coordinating Council (FRCC): The FRCC is one of eight Regional Reliability Councils in the lower 48 states that comprise the North American Electric Reliability Council (NERC). It covers Peninsular Florida, east of the Apalachicola River.
Gas Meter: A meter that measures natural gas usage for ultimate customers.
ICAP Credit: An ISO capacity credit to satisfy a resource requirement.
Independent system operator (ISO): An organization that has been granted the authority to operate, in a nondiscriminatory manner, the transmission assets of the participating transmission owners in a fixed geographic area. ISOs often run organized markets for spot electricity.
Industrial: The energy-consuming sector that consists of all manufacturing facilities and equipment used for producing, processing, or assembling goods. The industrial sector encompasses the following types of activity: manufacturing; agriculture, forestry, and fisheries; mining; and construction. Overall energy use in this sector is largely for process heat and cooling and powering machinery, with lesser amounts used for facility heating, air conditioning, and lighting. Fossil fuels are also used as raw material inputs to manufactured products. This sector may include energy deliveries to large commercial customers, and may exclude deliveries to small industrial customers which may be included in the commercial sector. It also may classify by using the North American Industry Classification System or on the basis of energy demand or annual usage exceeding some specified

Appendix C: Glossary for the Report
Assessment of Demand Response and Advanced Metering Federal Energy Regulatory Commission
C-5
limit set by the energy provider.
Industrial Customer: Electric power consumers which usually consume large amounts of electricity and are usually in the manufacturing, construction, mining, agriculture, fishing or forestry industries. Utilities usually classify service to these consumers based on their power demand or an annual usage amount which exceeds some specified limit.
Interface with Water or Gas Meters: The ability of the AMI network to collect water or gas meter readings and to transmit the gas or water meter readings over the AMI network to an entity that can provide the gas or water meter readings to the gas or water utility providing the service.
Interruptible/Curtailable Service (I/C): Curtailment options integrated into retail tariffs that provide a rate discount or bill credit for agreeing to reduce load during system contingencies. Penalties may be assessed for failure to curtail. In some instances, the demand reduction may be affected by direct action of the System Operator (remote tripping) after notice to the customer in accordance with contractual provisions. For example, demands that can be interrupted to fulfill planning or operating reserve requirements normally should be reported as Interruptible Demand. Interruptible programs have traditionally been offered only to the largest industrial (or commercial) customers. Interruptible Demand as reported here does not include Direct Control Load or price responsive demand response.
Investor-Owned Utility (IOU): A utility organized under state law as a publicly traded corporation for the purposes of providing electric power service and earning profits for its stockholders.
Kilowatt (kW): One thousand watts.
Kilowatthour (kWh): One thousand watt-hours.
Line Loss: Electric energy lost because of the transmission of electricity. Much of the loss is thermal in nature.
Load (Electric): The amount of electric power delivered or required at any specific point or points on a system. The requirement originates at the energy-consuming equipment of the consumers.
Load Acting as a Resource (LaaR): An interruptible program operated by ERCOT in which customers may qualify to provide operating reserves.
Load Forecasting: The estimation of future load requirements for specified intervals for a period of time. The load forecast may provide an estimate of hourly loads for a group of ultimate customers for the next five years, for example.
Load-serving entity (LSE): Any entity, including a load aggregator or power marketer, that serves end-users within a control area and has been granted the authority or has an obligation pursuant to state or local law, regulation, or franchise to sell electric energy to end-users located within the control area.
Maximum Demand: This is determined by the interval in which the 60-minute integrated demand is the greatest.
Maximum Hourly Load: The highest amount of demand that is measured or expected to be curtailed at a certain point in time.
Megawatt (MW): One million watts of electricity.
Megawatthour (MWh): One thousand kilowatt-hours or 1 million watt-hours.
Midwest Reliability Organization (MRO): The Midwest Reliability Organization (MRO) is one of eight Regional Reliability Councils in the lower 48 that comprise NERC. Its members include the

Appendix C: Glossary for the Report
Assessment of Demand Response and Advanced Metering Federal Energy Regulatory Commission
C-6
following states: Minnesota, Wisconsin, Iowa, North Dakota, South Dakota, Nebraska, Montana, Illinois and Upper Peninsula of Michigan.
Minimum Term: The minimum length in years that customers are obligated to participate in a demand response program.
Municipality: A village, town, city, county, or other political subdivision of a state.
National Association of Regulatory Utility Commissioners (NARUC): A non-profit organization whose members include the governmental agencies that are engaged in the regulation of utilities and carriers in the fifty states, the District of Columbia, Puerto Rico.
North American Electric Reliability Council (NERC): The organization certified by the Commission as the reliability organization for the nation’s bulk power grid. NERC consists of eight Regional Reliability Councils in the lower 48 states. The members of these Councils are from all segments of the electricity supply industry - investor-owned, federal, rural electric cooperative, state/municipal, and provincial utilities, independent power producers, and power marketers.
Operating Company: The name a utility uses in doing business within a particular state associated with a particular service territory.
Outage Management: The response of an electric utility to an outage affecting the ultimate customers of the electric service. The utility may use the AMI network to detect outages, verify outages, map the extent of an outage, or verify the service has been restored after repairs have been made.
Peak Demand: The maximum load during a specified period of time.
Potential MWh Change: The potential total annual change in energy consumption (measured in MWh) that would result from the deployment of demand response programs. It reflects the total change in consumption if the full demand reduction capability of the program were deployed, as opposed to actual MWh change during the year.
Potential Peak Reduction: The potential annual coincident peak load reduction (measured in megawatts) that can be deployed from demand response programs. It represents the load that can be reduced either by the direct control of the utility system operator or by the consumer in response to a utility request to curtail load. It reflects the installed load reduction capability, as opposed to the Actual Peak Reduction achieved by participants, during the time of annual system peak load. It should account for the regular cycling of energy efficient units during the period of system peak load. For utilities, it should be the potential sum of demand reduction capability to their annual peak load (measured in megawatts) achieved by the program participants. For an ISO or RTO, it should be the sum of coincident reduction capability to the ISO or RTO achieved by participants at the time of system peak of the ISO or RTO. Similarly, for CSPs, it should be the sum of coincident reduction capability sponsored by the CSP and achieved by demand response program participants at the time of the peak for the region in which the CSP is aggregating customer load.
Power Marketers: Business entities, including energy service providers, that are engaged in buying and selling electricity, but do not own generating or transmission facilities. Power marketers and energy service providers, as opposed to brokers, take ownership of the electricity and are involved in interstate trade. Power marketers file with the Federal Energy Regulatory Commission (FERC) for status as a power marketer. Energy service providers may not register with FERC but may register with the states if they undertake only retail transactions.
Power Quality Monitoring: The ability of the AMI network to discern, record, and transmit to the utility instances where the voltage and/or frequency were not in ranges acceptable for reliability.

Appendix C: Glossary for the Report
Assessment of Demand Response and Advanced Metering Federal Energy Regulatory Commission
C-7
Premise Device/Load Control Interface or Capability: The ability of the AMI network to communicate directly with a device located on the premises of the ultimate customer, which may or may not be owned by the utility. These might include a programmable communicating thermostat or a load control switch.
Pre-Pay Metering: A metering and/or software and payment system that allows the ultimate customer to pay for electric service in advance.
Price Responsive Demand Response: All demand response programs that include the use of time-based rates to encourage retail customers to reduce demands when prices are relatively high. These demand response programs may also include the use of automated responses. Customers may or may not have the option of overriding the automatic response to the high prices.
Pricing Event Notification Capability: The ability of the AMI network to convey to utility customers participating in a price responsive demand response program that a demand response event is planned, beginning, ongoing, and/or ending.
Provision of Usage Information to Customers: The ability of the AMI network to convey to ultimate customers information on their usage in a timely fashion. Timely in this context would be dependent on the customer class, with larger customers generally receiving the information with less lag time than residential customers.
Public Utility: An enterprise providing essential public services, such as electric, gas, telephone, water, and sewer under legally established monopoly conditions.
Public Utility District: Municipal corporations organized to provide electric service to both incorporated cities and towns and unincorporated rural areas.
Publicly Owned Electric Utility: A class of ownership found in the electric power industry. This group includes those utilities operated by municipalities, political subdivisions, and state and federal power agencies (such as BPA or TVA).
Railroad and Railway Electric Service: Electricity supplied to railroads and interurban and street railways, for general railroad use, including the propulsion of cars or locomotives. Such electricity is supplied under separate and distinct rate schedules.
Real Time Pricing (RTP): A retail rate in which the price for electricity typically fluctuates hourly reflecting changes in the wholesale price of electricity. RTP prices are typically known to customers on a day-ahead or hour-ahead basis.
Reduce Line Losses: The ability to use the AMI network to lower the line losses on the transmission system.
Regional transmission organization (RTO): An organization with a role similar to that of an independent system operator but covering a larger geographical scale and involving both the operation and planning of a transmission system. RTOs often run organized markets for spot electricity.
Remotely Change Metering Parameters: The ability to change parameters associated with a particular revenue or billing meter, such as the length of the data interval measured, without a site visit to the meter location.
Remote Connect/Disconnect: The ability to physically turn on or turn off power to a particular billing or revenue meter without a site visit to the meter location.
Residential: The energy-consuming sector that consists of living quarters for private households. Common uses of energy associated with this sector include space heating, water heating, air conditioning, lighting, refrigeration, cooking, and running a variety of other appliances. The

Appendix C: Glossary for the Report
Assessment of Demand Response and Advanced Metering Federal Energy Regulatory Commission
C-8
residential sector excludes institutional living quarters. This sector may exclude deliveries or sales to apartment buildings or homes on military bases (these buildings or homes may be included in the commercial sector).
Response Time: The maximum notice and lead time that a demand response program sponsor provides to demand response program participants prior to an economic or emergency demand response event.
Retail: Sales covering electrical energy supplied for residential, commercial, and industrial end-use purposes. Other small classes, such as agriculture and street lighting, also are included in this category.
Revenue Assurance: A set of activities designed to increase the revenue from providing electric service to ultimate customers, including locating meters without associated customer accounts, relatively high line losses compared with other similar locations, energy theft, and/or improper metering installations.
Service Territory: The area within a particular state where an electric utility is allowed to provide ultimate customers for distribution, transmission, or energy services.
Specific Event Limits: The maximum number of events that can be called during a year.
Southwest Power Pool (SPP): The Southwest Power Pool is both the RTO and NERC reliability organization for Kansas, Missouri, Oklahoma, and part of New Mexico.
System (Electric): Physically connected generation, transmission, and distribution facilities operated as an integrated unit under one centralized manager or operations supervisor.
Theft Detection: The ability to detect when a revenue or billing meter has been potentially tampered with and to indicate a potential energy theft in progress that should be further investigated by the utility.
Time-Based Rate (TBR): A retail rate in which customers are charged different prices for different times during the day. Examples are time-of-use (TOU) rates, real time pricing (RTP), hourly pricing, and critical peak pricing (CPP).
Time-of-use (TOU) Rate: A rate with different unit prices for usage during different blocks of time, usually defined for a 24 hour day. TOU rates reflect the average cost of generating and delivering power during those time periods. Daily pricing blocks might include an on-peak, partial-peak, and off-peak price for non-holiday weekdays, with the on-peak price as the highest price, and the off-peak price as the lowest price.
Transformer: A device that operates on magnetic principles to increase (step up) or decrease (step down) voltage.
Transmission: The movement or transfer of electric energy over an interconnected group of lines and associated equipment between points of supply and points at which it is transformed for delivery to consumers or is delivered to other electric systems. Transmission is considered to end when the energy is transformed for distribution to the consumer.
Transmission System (Electric): An interconnected group of electric transmission lines and associated equipment for moving or transferring electric energy in bulk between points of supply and points at which it is transformed for delivery over the distribution system lines to consumers.
Transportation: An energy consuming sector that consists of electricity supplied and services rendered to railroads and interurban and street railways, for general railroad use including the propulsion of cars or locomotives, where the electricity is supplied under separate and distinct rate

Appendix C: Glossary for the Report
Assessment of Demand Response and Advanced Metering Federal Energy Regulatory Commission
C-9
schedules.
Type of Organization: in fielding the FERC Survey, this allowed Commission staff to identify the type of organization that best represents the energy market participant. The possible categories were : Investor-owned utilities (IOU), Municipal Utility (M), Cooperative Utility (C), State-owned Utility (S), Federally-owned Utility (F), Independent System Operator (ISO), Regional Transmission Operator (RTO), Curtailment Service Provider (CSP), or other (O).
Ultimate Consumer: A consumer that purchases electricity for its own use and not for resale.
Uncommitted Capacity: Generating resources that are physically located in the region, but are not dedicated or contractually committed to serve load in the region.
Water meter: A meter that measures water usage for end-use customers.
Watt (W): The unit of electrical power equal to one ampere under a pressure of one volt. A watt is equal to 1/746 horsepower.
Watt-hour (Wh): The electrical energy unit of measure equal to one watt of power supplied to, or taken from, an electric circuit steadily for one hour.
Year of Study: Identification of the projected years covered by a specified study.

Appendix C: Glossary for the Report
Assessment of Demand Response and Advanced Metering Federal Energy Regulatory Commission
C-10
Appendix D – Bibliography
Assessment of Demand Response and Advanced Metering Federal Energy Regulatory Commission
D-1
Appendix D: Demand Response and Advanced Metering Source List and Bibliography
Note: where reports are publicly available on the internet, we have provided a link to the source. Demand Response and Competition:
Federal and State Reports, Orders, Conferences: FEDERAL: Energy Policy Act of 2005, Pub. L. No. 109-58, § 1252(e)(3), 119 Stat. 594 (2005) (EPAct section
1252(e)(3). U.S.-Canada Power System Outage Task Force. Final Report on the August 14, 2003 Blackout in the
United States and Canada: Causes and Recommendations. April 2003. https://reports.energy.gov/BlackoutFinal-Web.pdf
U.S. Department of Energy (DOE). Benefits of Demand Response in Electricity Markets, and Recommendations for Achieving Them: A Report to the U.S. Congress. February 2006. http://www.oe.energy.gov/documents/congress_1252d.pdf
U.S. Environmental Protection Agency’s (EPA). –. Clean Energy-Environment Guide to Action: Policies, Best Practices, and Action Steps for States.
April 2006. http://www.epa.gov/cleanenergy/pdf/gta/guide_action_full.pdf –. Energy & Environmental Economics, for EPA-State Energy Efficiency Renewable Energy Projects.
A Survey of Time-of-Use Pricing and Demand-Response Programs. July 2006. (forthcoming) U.S. Federal Energy Regulatory Commission (FERC) and the Electric Energy Market Competition
Task Force. Draft Report to Congress on Competition in the Wholesale and Retail Markets for Electric Energy. Docket No. AD05-17-000. June 5, 2006.
–. Office of Market Oversight. “Demand Response.” In 2004 State of the Market Report. June 2005. http://www.ferc.gov/EventCalendar/Files/20050615093455-06-15-05-som2004.pdf
–. Transcript from “Technical Conference on Demand Response and Advanced Metering,” January 25, 2006. http://www.ferc.gov/eventcalendar/Files/20060214164735-DemandResponseTranscript.pdf
U.S. Government Accountability Office (GAO). Electricity Restructuring: Key Challenges Remain. November 2005: GAO-06-237. http://www.gao.gov/new.items/d06237.pdf
–. Consumers Could Benefit from Demand Programs, but Challenges Remain, GAO-04-844. August 2004. http://www.gao.gov/new.items/d04844.pdf
STATES: California: California Energy Commission (CEC) and California Public Utilities Commission,
Energy Action Plan II: Implementation Roadmap for Energy Policies, adopted, Sept. 21, 2005. http://www.energy.ca.gov/energy_action_plan/2005-09-21_EAP2_FINAL.PDF
–. CEC. Feasibility of Implementing Dynamic Pricing in California. Report to the Legislature to satisfy the legislative requirement of SB 1976, October 2003. http://energy.ca.gov/reports/2003-10-31_400-03-020F.PDF
–. CEC Staff Report by Fromm, S., et al. Implementing California’s Loading Order For Electricity Resources. July 2005. http://energy.ca.gov/2005publications/CEC-400-2005-043/CEC-400-2005-043.PDF
–. Committee Workshop Before the California Energy Resources Conservation and Development Commission. In the Matter of Systems Integration Framework Programmable Communicating Thermostat (PCT). February 16, 2006.
Connecticut: Public Act No. 05-1: An Act Concerning Energy Independence, House Bill 7501 [July 21, 2005], http://www.cga.ct.gov/2005/act/Pa/2005PA-00001-R00HB-07501SS1-PA.htm
–. Connecticut Energy Advisory Board, Energy Plan for Connecticut, February 2006.

Appendix D – Bibliography
Assessment of Demand Response and Advanced Metering Federal Energy Regulatory Commission
D-2
–. Department of Public Utility Control (DPUC). Orders implementing utility and customer incentive programs to promote development of distributed resources. Docket Nos. 05-07-16 and 05-07-17, March 27, 2006.
–. DPUC. Investigation into Decoupling Energy Distribution Company Earnings from Sales, Final Decision. Docket No. 05-09-09, January 18, 2006. http://www.dpuc.state.ct.us/dockhist.nsf/6eaf6cab79ae2d4885256b040067883b/1720fa522a11e3cf852571390072d560?OpenDocument
Delaware: Delaware Public Service Commission, Order No. 6912, PSC Regulation Docket No. 57, in the matter of the Commission’s combined consideration of the utilization of Advanced metering technologies under 26 Del. C. § 1008(b) (1)b. and the implementation of Federal standards for time-based metering and time-based rate schedules under 16 U.S.C. §§ 2621(d) ) (14) AND 2625(i)), opened May 9, 2006.
–. HB 6. 143rd Gen. Assem., Reg. Sess. (Del. 2006). Electric Utility Retail Customer Supply Act. http://www.legis.state.de.us/LIS/LIS143.NSF/vwLegislation/HB+6?Opendocument
Idaho: Idaho Public Utilities Commission, Idaho Power: Review of Phase One AMR Implementation Status Report, Case No. IPC-E-06-01. http://www.puc.idaho.gov/internet/cases/summary/IPCE0601.html
Illinois: P.A. 094-0977, 94th Gen. Assem., Reg. Sess. (Ill. 2006), effective June 30, 2006. Amends the Public Utility Act to allow residential consumers to elect real-time pricing. http://www.ilga.gov/legislation/publicacts/fulltext.asp?Name=094-0977
Louisiana: Louisiana Public Service Commission. Investigation to determine if it is appropriate for LPSC jurisdictional electric utilities to provide and install time-based meters and participate in time-based pricing rate schedules and other demand response programs. Docket R-2913, 12/5/2005.
–. Commission Examination of the public benefits of potentially adopting rules, new tariffs, and / or other regulatory mechanisms that would promote (or require) the use of wireless metering in Louisiana. Docket No. R-29213, Subdocket A.
Massachusetts: Massachusetts Division of Energy Resources, Creating and Demonstrating Incentives for Electricity Providers to Integrate Distributed Energy Resources (DER). EPRI DER/Public Private Partnership, July 11, 2005.
New York: New York State Public Service Commission (NYPSC). Order Denying Petitions for Rehearing and Clarification in Part and Adopting Mandatory Hourly Pricing Requirements, issued and effective April 24, 2006. http://www3.dps.state.ny.us/pscweb/webfileroom.nsf/ArticlesByCategory/B3B48B2CC15476388525714C00666B91/$File/301_03-E-0641_04_24_06.pdf?OpenElement
–. Proceeding on Motion of the Commission Regarding Expedited Implementation of Mandatory Hourly Pricing for Commodity Service, NYPSC Case No. 03-E-0641, April 11, 2006. http://www.dps.state.ny.us/fileroom.html
–. Staff Report. Case No. 03-E-0640, July 9, 2004. Pennsylvania: Pennsylvania Office of Consumer Advocate. Comments filed in Docket AD05-17,
“Electric Energy Market Competition Task Force”, November 18, 2005.
Appendix D – Bibliography
Assessment of Demand Response and Advanced Metering Federal Energy Regulatory Commission
D-3
Demand Response and Advanced Metering: Works Cited and Consulted.
American Council for an Energy-Efficient Economy (ACEEE); Energy Efficiency Resources Standards: Experience and Recommendations . Washington: Report E063, March 2006.
American National Standards Institute (ANSI). Minutes of ANSI C12 Committee on Electricity Metering, Subcommittee 17, Data Communication Protocols meeting. May 4, 2006.
Barbose, Galen et al. for DRCC. Real Time Pricing as Default or Optional Service for C&I Customers: A Comparative Analysis of Eight Case Studies. Berkeley, CA, August 2005: LBNL-57661. http://drrc.lbl.gov/pubs/57661.pdf
Barbose, Galen, Charles Goldman (LBNL), Bernie Neenan (Neenan Associates). A Survey of Utility Experience with Real Time Pricing. Berkeley, CA, December 2004: LBNL-54238. http://eetd.lbl.gov/EA/EMP/reports/54238.pdf
Bladen, Jeffrey. Testimony of J. Bladen for Technical Conference on Demand Response and Advanced Metering. PJM Interconnection, Valley Forge PA, January 25, 2006.
Blevins, R.P. (Plexus Research, Inc.) for Electric Power Research Institute. 1994 Survey of Utility Demand-Side Programs and Services, Pleasant Hill, CA: EPRI, November 1995: TR-105685. Available only to members and by purchase.
Blumsack, Seth A., Jay Apt, and Lester B. Lave. “Lessons from the Failure of U.S. Electricity Restructuring.” The Electricity Journal, 19 #2 (March 2006): 15-32.
Boice, Craig. What drives the response in Demand Response? Boice Dunham Group, April 13, 2005. Boisvert, Richard, et al. Industrial and Commercial Customer Response To Real Time Electricity
Prices. December 2004. http://eetd.lbl.gov/ea/emp/reports/Boisvert.pdf Boisvert, Richard N. and Bernie F. Neenan. Social Welfare Implications of Demand Response
Programs in Competitive Electricity Markets. Berkeley, CA, August 2003: LBNL-52530. http://eetd.lbl.gov/ea/emp/reports/LBNL-52530.pdf
Bonbright, James C., Albert L. Danielsen, David R. Kamerschen. Principles of Public Utility Rates. 2nd ed. Arlington, VA: Public Utilities Reports, 1988.
Bonneville Power Administration (BPA). Non-Wires Solutions, Questions & Answers: Exploring Cost-Effective Non-Construction Transmission Alternatives. 2004. www.transmission.bpa.gov/planproj/non-wires_round_table/
–. Transmission Planning Through a Wide-Angle Lens: A Two-Year report on BPA’s Non-Wires Solutions Initiative. September 2004. http://www.transmission.bpa.gov/PlanProj/Non-Wires_Round_Table/NonWireDocs/Non-Wires_2year_report.pdf
–. “About BPA.” Downloaded from www.bpa.gov on April, 14, 2006. Borenstein, Severin. “The Long-Run Efficiency of Real-Time Pricing.” The Energy Journal. 26 #3
(June 2005): 93-116. Braithwait, Steven and Ahmad Faruqui. “The Choice not to Buy: Energy Savings and Policy
Alternatives for Demand Response.” Public Utility Fortnightly, March 15, 2001. Braithwait, Steven, B. Kelly Eakin, and Laurence D. Kirsch. Encouraging Demand Participation In
Texas’s Power Markets, prepared for the Market Oversight Division of the Public Utility Commission of Texas. Madison, WI: Laurits R. Christensen Associates (now CA Energy Consulting), August 2002. http://www.puc.state.tx.us/electric/projects/26055/part_rpt.pdf
Brown, Marilyn and Mark Levine, “Overview of Load as a Resource”, Consortium for Electric Reliability Technology Solutions, Oak Ridge National Laboratory (ORNL), May 2002. http://www.naseo.org/committees/energyproduction/documents/overview_of_load_as_a_resource.pdf
Camp, Ward. “AMI Case Studies: PP&L, Idaho, FP&L.” Presentation to the Joint California Workshop on “Advanced Metering Results and Issues.” Sacramento, CA: September 30, 2004.
Cappers, Peter. “Everything You Ever Wanted to Know About Price Elasticities, but Were Afraid to Ask.” UtiliPoint’s IssueAlert, April 7, 2006.

Appendix D – Bibliography
Assessment of Demand Response and Advanced Metering Federal Energy Regulatory Commission
D-4
Caves, Douglas, Kelly Eakin, and Ahmad Faruqui. “Mitigating Price Spikes in Wholesale Markets through Market-Based Pricing in Retail Markets.” The Electricity Journal, (April 2000): 13-23.
Charles River Associates. Impact Evaluation of the California Statewide Pricing Pilot: Final Report (to the California Energy Commission). March 16, 2005. http://www.energy.ca.gov/demandresponse/documents/group3_final_reports/2005-03-24_SPP_FINAL_REP.PDF
Colledge, Justin A. et al. (McKinsey & Co.) “Power by the Minute.” McKinsey Quarterly, 2002 #1: 73-80.
Consolidated Edison. Request For Proposals To Provide Demand Side Management To Provide Transmission And Distribution System Load Relief And Reduce Generation Capacity Requirements To Consolidated Edison Company Of New York, Inc. April 14, 2006.
“Constellation NewEnergy’s Experience with Dynamic Pricing.” Presentation at ISO-NE DR Summit, April 27, 2006. http://www.iso-ne.com/genrtion_resrcs/dr/events/2006/PKellyDetwiler.pdf
Crossley, David .J. Worldwide Survey of Network-driven Demand-side Management Projects. IEA Demand Side Management Programme, Task XV Research Report No 1. Australia, Energy Futures Australia Pty Ltd. September 2005.
Delurey, Dan. “Retail Demand Response: Challenges and Outlook.” Presentation at IEA Workshop, Paris, France, February 24, 2005. www.dramcoalition.org
DePillis, M. The New Ancillary Services Markets of New England. MISO Ancillary Services Round Table. Carmel, IN, April 26, 2006.
Distributed Energy Financial Group and Center for the Advancement of Energy Markets. A Critical Examination of Demand Response Programs at the ISO Level: End Goals, Implementation, and Equity, Final Report. October 2005. http://www.defgllc.com/Assets/downloads/defg-caem_demandresponsestudyfinalreport_oct2005(2).pdf
Earle, Robert and Ahmad Faruqui. “Toward a New Paradigm for Valuing Demand Response.” The Electricity Journal 19 # 4 (May 2006): 21-31.
Eakin, Kelly and Ahmad Faruqui, editors. Electricity Pricing in Transition. Boston: Kluwer Academic Publishers, 2002.
EnerNex Corporation. “Advanced Metering and Demand Responsive Infrastructure: A Summary of the PIER/CEC Reference Design, Related Research and Key Findings: Draft.” Prepared for the California Energy Commission June 1, 2005. http://ciee.ucop.edu/dretd/PIERDemandResponseSummaryReport.pdf
Faruqui, Ahmad, and Melanie Mauldin. “The Barriers to Real-Time Pricing: Separating Fact from Fiction.” Public Utilities Fortnightly, July 2002: 30 – 40.
–. “The Nine Lessons of Real-Time Pricing.” Public Utilities Fortnightly, July 2002: 33-39. Faruqui, Ahmad, and Stephen S. George. “Pushing the Envelope on Rate Design.” The Electricity
Journal 19 #2 (March 2006): 33-42. –. “Quantifying Customer Response to Dynamic Pricing.” The Electricity Journal 18 #4 (May 2005):
53-63. –. “The Value of Dynamic Pricing in Mass Markets,” The Electricity Journal, 15 #6 (July 2002): 45-
55. Fauth, Gary and Michael Wiebe. “Fixed-Network AMR: Lessons for Building the Best Business
Case.” AMRA newsletter, September 2004. Fromm, Sandra, et al. Implementing California’s Loading Order For Electricity Resources. California
Energy Commission Staff Report, July 2005. http://energy.ca.gov/2005publications/CEC-400-2005-043/CEC-400-2005-043.PDF
George, Stephen S. and Ahmad Faruqui, CRA, “California’s Statewide Pricing Pilot: Overview of Key Findings.” Presentation to MADRI, May 2005.
Glazer, Craig. Comments of PJM on the Demand Response and Time Based Rate Issues Raised and/or Identified in EPAct 2005 Section 1252 (e)(3). Valley Forge, PA: PJM, 2005.

Appendix D – Bibliography
Assessment of Demand Response and Advanced Metering Federal Energy Regulatory Commission
D-5
Goldman, Charles (LBNL). “Customer Experience with Real Time Pricing as the Default Service.” Presentation at the ISO-NE Demand Response Summit, Sturbridge, MA, April 27, 2006.
–. "Demand Response: Issues and Challenges.” Keynote presentation, FERC Demand Response Technical Conference, Washington, DC, January 25, 2006.
–. “Does Real-Time Pricing Deliver Demand Response?” Presentation to New England Restructuring Roundtable, Oct. 25, 2005. www.raabassociates.org/Articles/Goldman_10.28.05.ppt
Goldman, Charles, et al. Customer Response to Day-ahead Wholesale Market Electricity Prices: Case Study of RTP Program Experience in New York. Berkeley, CA: LBNL-54761, June 2004. http://eetd.lbl.gov/ea/emp/reports/NMPC_LBNL_54761.pdf
–. Does Real-time Pricing Deliver Demand Response? A Case Study of Niagara Mohawk's Large Customer RTP Tariff. Berkeley, CA, August 2004: LBNL-54974. http://eetd.lbl.gov/ea/emp/reports/54974.pdf
Goldman, Charles and Ranjit Bharvirkar (LBNL). “Load Management Resources in the U.S.” Presentation to FERC staff, October 4, 2005.
Goldman, Charles A., Joseph H. Eto, and Galen L. Barbose. California Customer Load Reductions during the Electricity Crisis: Did they Help to Keep the Lights On? Berkeley, CA: LBNL-49733, May 2002.
Goldman, Charles, N. Hopper and R. Bharvirkar (LBNL) and Bernie Neenan, et al. Customer Strategies for Responding to Day-Ahead Market Hourly Electricity Pricing. Berkeley, CA: LBNL-57128, August 2005. http://eetd.lbl.gov/ea/emp/reports/57128.pdf
Goldman, Charles and Roger Levy, Demand Response in the U.S.: Opportunities, Issues, and Challenges. Presentation at the National Town Hall Meeting on Demand Response, Washington, DC, June 21, 2005.
Goldman, Charles A., Grayson Heffner, and Galen Barbose. Customer Load Participation in Wholesale Markets: Summer 2001 Results, Lessons Learned and Best Practices. Berkeley, CA: LBNL-50966, February 2002. http://eetd.lbl.ov/ea/emp/reports/50966.pdf
Goldman, Charles, Grayson Heffner (LBNL), and Michael Kintner-Meyer (PNNL). Do "Enabling Technologies" Affect Customer Performance in Price-Responsive Load Programs? May 2002, ACEEE Conference Paper. and August 2002: LBNL-50328. http://eetd.lbl.gov/ea/emp/reports/50328.pdf
Patti Harper-Slaboszewicz (UtiliPoint). “Market Trends in AMR and Demand Response,” prepared for Automatic Meter Reading Association (AMRA), 2005.
–. “Regulator Interest in AMI and Demand Response,” presentation at FERC Technical Conference, January 25, 2006.
Heffner, Grayson C. Configuring Load as a Resource for Competitive Electricity Markets: Review of Demand Response Programs in the U.S. and Around the World. Berkeley, CA, November 2002: LBNL-51496. http://eetd.lbl.gov/EA/EMP/reports/51496.pdf
–. Demand Response Providing Regulation and Reserve Services in Nordic Electricity Markets: draft. Consortium for Electric Reliability Technical Solutions, March 2006.
–. Demand Response Provision of Ancillary Services in Australia’s National Electricity Market: draft. Consortium for Electric Reliability Technical Solutions, March 2006.
Heffner, Grayson and Freeman Sullivan. A Critical Examination of ISO-Sponsored Demand Response Programs, white paper prepared for multi-client study organized by CAEM/DEFG. August 2005. http://www.defgllc.com/Assets/downloads/caem-defg_heffner_drwhitepaperno1_final(2).pdf
Hirst, Eric. Direct Testimony on Behalf of Puget Sound Energy, Inc., before the Washington Utilities and Transportation Commission, November 26, 2001.
–. “The Financial and Physical Insurance Benefits of Price-Responsive Demand.” The Electricity Journal 15 #4 (May 2002): 66-73.
Hirst, Eric and Brendan Kirby. Opportunities for Demand Participation in New England Contingency Reserve Markets. New England Demand Response Initiative (NEDRI) technical paper,
Appendix D – Bibliography
Assessment of Demand Response and Advanced Metering Federal Energy Regulatory Commission
D-6
February 2003. Holland, Stephen P. and Erin T. Mansur. The Distributional and Environmental Effects of time-
Varying Prices in Competitive Electricity Markets. Berkeley, CA: Center for the Study of Energy Markets (CSEM), May 2005. http://www.ucei.berkeley.edu/PDF/csemwp143.pdf
Hunt, Sally. Making Competition Work. See especially Chapter 4, “Requirements for Competition: Demand Side.” New York: John Wiley & Sons, 2002.
ICF Consulting. Economic Assessment of RTO Policy. Study prepared for the Federal Energy Regulatory Commission (FERC). February 2002. http://www.ferc.gov/industries/electric/indus-act/rto/cost/02-26-02-report.pdf
Isemonger, Alan. “CAISO Ancillary Service Procurement Under MRTU.” Presentation at MISO Ancillary Services Roundtable. Carmel, IN, April 26, 2006. http://www.midwestmarket.org/publish/Folder/469a41_10a26fa6c1e_-7d890a48324a
ISO-New England. Staff White Paper. Controlling Electricity Costs. June 1, 2006. http://www.iso-ne.com/pubs/whtpprs/electricity_costs.pdf
ISO/RTO Planning Committee. ISO/RTO Electric System Planning,Current Practices, Expansion Plans, and Planning Issues. February 10, 2006.
Irastorza, Veronica. “New Metering Enables Simplified and More Efficient Rate Structures.” The Electricity Journal, 18 #10 (December 2005): 53-61.
Kathan, David, for the National Association of Regulatory Utility Commissioners (NARUC). Policy and Technical Issues Associated with ISO Demand Response Programs. July 2002. http://www.goodcents.com/Info/Policy_Technical%20Issues.pdf
Keech, Adam. “PJM Ancillary Services Markets.” Presentation at MISO Ancillary Services Roundtable. Carmel, IN, April 26, 2006.
Kiesling, Lynne. “The Role of Retail Pricing in Electricity Restructuring.” In The Challenge of Electricity Restructuring, edited by Andrew Kleit. Lanham, MD: Rowman & Littlefield, 2006. (forthcoming)
–. “Demand Response: Progress and Barriers.” Presentation at MIT-CEEPR Conference. Cambridge, MA, November 2005. www.knowledgeproblem.com/KieslingCEEPRNov2005.pdf
–. “Energy Smart” columns, March 2, 2004, and January 14, 2005. www.knowledgeproblem.com King, Chris. “Advanced Metering Infrastructure: Overview of System Features and Capabilities,
September 2005. King, Chris and Dan Delurey. “Efficiency and Demand Response: Twins, Sibling, or Cousins?”
Public Utilities Fortnightly, March 2005: 54-61. Kirby, Brendan. Spinning Reserve From Responsive Loads, ORNL/TM-2003/19, Oak Ridge National
Laboratory, March 2003. Kirby, Brendan and Eric Hirst. Load as a Resource in Providing Ancillary Services. American Power
Conference, Chicago, IL, April 1999. –. Technical Issues Related to Retail Load Provision of Ancillary Services. New England Demand
Response Initiative technical paper. February 2003. Kirby, Brendan, et al. Frequency Control Concerns In The North American Electric Power System,
Oak Ridge National Lab. ORNL/TM-2003/41, December 2002. Kueck, John and Brendan Kirby. Presentation to the WECC Compliance Monitoring and Operating
Practices Subcommittee. January 7, 2005. Laurita, Robert and Henry Yoshimura. Interview by Brendan Kirby, 2005. Levy, Roger. “Advanced Metering and Dynamic Rates: the Issues.” September 30, 2004. –. “California Statewide Pricing Pilot (SPP): Overview and Design Features.” Presentation at the
Joint California Workshop on “Advanced Metering Results and Issues.” Sacramento, CA: September 30, 2004.

Appendix D – Bibliography
Assessment of Demand Response and Advanced Metering Federal Energy Regulatory Commission
D-7
–. “Establishing the AMI Business Case Framework: Advancing Technology to Support Utility, Customer and Societal Needs,” presentation to MADRI AMI subgroup, Philadelphia, PA: May 4, 2005.
–. “Meter Scoping Study,” prepared for the California Energy Commission, March 2002. Leonhardt, David, “Save Yourself,” The New York Times, April 11, 2006, section G, 1. Long Island Power Authority (LIPA). LIPA Edge, presentation to the NYISO Price-Responsive Load
Working Group. November 21 2002. –. Data supplied through Applied Energy Group for 2002. Loughran, David S. and Jonathan Kulick. “Demand-Side Management and Energy Efficiency in the
United States.” Energy Journal, 25 #1 (January 2004): 19 – 40. Lynk, Fred, PSE&G. “myPower Pilot Program,” presentation to MADRI Regulatory Subgroup,
November 2005. McKinsey & Co., Inc. “The Benefits of Demand-Side Management and Dynamic Pricing Programs.”
White Paper, May 2001. (see also Colledge, Justin A., et al. “Power by the Minute.” ) –. AMI tool, under development; may be made available on pro-bono basis. McAuliffe, Pat and Arthur Rosenfeld, California Energy Commission. Response of Residential
Customers to Critical Peak Pricing and Time-of-Use Rates during the Summer of 2003, September 23, 2004.
Magnotti, Frank A., Comverge. “Bridging the Gap between Wholesale and Retail Markets.” Presentation to MADRI business-models subgroup, Washington, DC: March 10, 2006. http://www.energetics.com/MADRI/pdfs/magnotti_031006.pdf
–. “Smart Thermostat DER Initiative.” Presentation to MADRI, Trenton, NJ: June 5, 2006. http://www.energetics.com/MADRI/pdfs/Magnotti.pdf
Malemezian, Ed. Interview by Brendan Kirby, 2005. Marks, Michael, Applied Energy Group. E-mail discussion with Brendan Kirby. April 15, 2006. Merilatt, Dan, GoodCents Solutions. “Demand Response Programs: New Considerations, Choices,
and Opportunities.” White paper, January 2004. http://www.goodcents.com/Info/Demand%20Response%20Programs.pdf
Mickey, Joel. Competitive Ancillary Services Market in ERCOT. MISO Ancillary Services Round Table. Carmel, IN, April 26, 2006.
Midwest Independent System Operator (MISO). MISO Ancillary Services Round Table. Carmel Indiana: April 26-27, 2006. Presentations: http://www.midwestmarket.org/publish/Folder/469a41_10a26fa6c1e_-7d890a48324a
–. Midwest ISO Transmission Expansion Plan 2005 – MTEP 05. June 2005. –. Midwest ISO Transmission Expansion Plan 2003 – MTEP 03 , June 2003. Moezzi, Mithra, et al. Real Time Pricing and the Real Live Firm. August 2004: LBNL-54978.
http://eetd.lbl.gov/ea/emp/reports/54978.pdf Moore, Taylor. “Energizing Customer Demand Response in California,” EPRI Journal, Summer
2001, 8. Neenan, Bernie. “The Benefits of Dynamic Pricing in New England.” Presentation to ISO-NE
Demand Response Summit, April 27, 2006. http://www.iso-ne.com/genrtion_resrcs/dr/events/2006/BNeenan.pdf
–. 4-part series on time-varying retail rates in UtiliPoint’s IssueAlert. “Focusing on Issues of Rate Design,” March 10, 2006; “Taxonomy of Time-Varying Pricing Designs,” March 24, 2006; with Jeremey Anderson, “Estimates of the Price Elasticity of Electricity,” May 8, 2006; and with Peter Cappers, “Everything You Ever Wanted to Know About Price Elasticities, but Were Afraid to Ask,” April 7, 2006.
Neenan, Bernie, et al. (Neenan Associates). Improving Linkages between Wholesale and Retail Markets through Dynamic Retail Pricing. Report prepared for ISO-New England, December 2005.
Appendix D – Bibliography
Assessment of Demand Response and Advanced Metering Federal Energy Regulatory Commission
D-8
Neenan, Bernie, Richard N. Boisvert, and Peter A. Cappers. “What Makes a Customer Price-Responsive?” The Electricity Journal, 15 #3 (April 2002):52-59.
NERA Economic Consulting. Distributed Resources: Incentives. Prepared for Edison Electric Institute. Washington: EEI, April 2006. http://www.energetics.com/MADRI/pdfs/nera_042406.pdf
Nerenberg, Lewis. “From Promise to Progress: Unleashing Consumer Power through the Real-Time Pricing of Electricity.” Working Paper (on Puget Sound Energy, Georgia Power), Baskin School of Engineering, UC Santa Cruz, May 2005.
North American Electric Reliability Council (NERC). Glossary of Terms Used in Reliability Standards. Princeton, NJ: NERC, 2006.
–. Reliability Standards for the Bulk Electric Systems of North America. NERC: Princeton, 2006. Downloaded from www.nerc.com on March 20, 2006.
–. 2005 Summer Assessment Reliability of Bulk Electricity Supply in North America. NERC: Princeton, May 2005.
Northeast Power Coordinating Council (NPCC). Emergency Operation Criteria: Document A-3. August 31, 2004.
New York Independent System Operator (NYISO). Downloaded from www.nyiso.com on April 3, 2006.
Orans, R., S. Price, D. Lloyd, T. Foley, and Eric Hirst. Expansion of BPA Transmission Planning Capabilities. Bonneville Power Administration. November 2001.
Pacific Northwest National Laboratory. “GridWise” Initiative to test new electric grid Technologies.” Press release, January 11, 2006. http://www.pnl.gov/news/release.asp?id=118
Perez, A. J. New ISO Transmission Planning Process. California Independent System Operator (CAISO). August 1, 2006
PJM. Market Monitoring Unit. 2004 State of the Market, March 8, 2005. http://www.pjm.com/markets/market-monitor/downloads/mmu-reports/pjm-som-2004.pdf
–. Amended And Restated Operating Agreement Of PJM Interconnection, L.L.C., Schedule 6 Regional Transmission Expansion Planning Protocol, PJM Interconnection. April 26, 2006.
–. PJM Regional Transmission Expansion Plan, PJM Interconnection. February 22, 2006. –. Planning data, downloaded from www.pjm.com on April 3, 2006. PIER Demand Response Research Center. Research Opportunity Notice DRRC RON-01: Establish
the Value of Demand Response; Develop an Integrated Efficiency Demand Response Network. July 21, 2005. http://drrc.lbl.gov/pubs/DRRC-01_FINAL.pdf
Prins, David, et al. (CRA International). Interval Metering Advanced Communications Study. Presentation to Distributors Forum, August 2005. http://www.doi.vic.gov.au/doi/doielect.nsf/2a6bd98dee287482ca256915001cff0c/8656c7cb924bfbfdca2570660001b117/$FILE/Distributor%20Forum%20-%202%20August%202005.pdf
PUC of Texas. Investigation into April 17, 2006 Rolling Blackouts in the Electric Reliability Council of Texas Region: Preliminary Report. April 24, 2006.
Raynolds, Ned (Alliance to Save Energy) and Richard Cowart (Regulatory Assistance Project). Electricity Reliability White Paper: Distributed Resources and Electric System Reliability. 2000. http://www.ase.org/content/article/detail/1127
“Regulatory Reform: Removing the Disincentives to Utility Investment in Energy Efficiency.” Regulatory Assistance Project. Issues Newsletter, September 2005.
Research Reports International. Demand Response Programs (Private Report). 4th edition. Evergreen, CO: April 2005.
Robertson, Hope, CERA. Focusing on the Demand Side of the Power Equation: Implications and Opportunities (Private Report). Cambridge, MA: May 2006.
Rose, Kenneth and Karl Meeusen, for APPA, EEI, NARUC and NRECA. Reference Manual and Procedures for Implementation of the PURPA Standards in the Energy Policy Act of 2005. March 22, 2006. http://www.naruc.org/associations/1773/files/PURPA_Manual_webversion.pdf
Appendix D – Bibliography
Assessment of Demand Response and Advanced Metering Federal Energy Regulatory Commission
D-9
Rosenstock, Steve, Edison Electric Institute (EEI). Final Results of the EEI / PLMA 2003 Demand Response Benchmarking Survey. Washington, DC: EEI, April 2004.
Ruff, Larry E. Economic Principles Of Demand Response In Electricity. Prepared for Edison Electric Institute. EEI: Washington, DC: October 2002. http://www.ksg.harvard.edu/hepg/Papers/Ruff_economic_principles_demand_response_eei_10-02.pdf
Southern California Edison (SCE). “Advanced Metering Infrastructure: Frequently Asked Questions.” http://www.sce.com/PowerandEnvironment/ami/faqs/.
–. “Why is SCE interested in an AMI solution using open standards and interoperability,” (FAQ #6). –. California Independent System Operator and California Energy Commission, CERTS Demand
Response Project, Plan For Summer 2006 Demand Response Test on Southern California Edison Distribution Circuit, 23 March 23, 2005.
Schweppe, Fred C. et al. Spot Pricing of Electricity. Boston: Kluwer Academic Publishing, 1988. Smith, David B., Citigroup. Meter Read: Pushing the Needle to Smart Metering. February 2006 Smith, Vernon L., “An Experimental Study of Competitive Market Behavior,” The Journal of Political
Economy, 70 (2), [April 1962], pp. 111-137. Smith, Vernon and Lynne Kiesling, for CAEM/DEFG. A Market-Based Model for ISO Demand
Response Programs. August 2005. http://www.faculty.econ.northwestern.edu/faculty/kiesling/CAEM_DEFG_Smith_Kiesling_Final.pdf
UtiliPoint. Outlook & Evaluation of Demand Response. Albuquerque, NM: UtiliPoint International, Inc. June 2005.
van Welie, Gordon. Address to ISO-NE Annual Demand Response Summit, April 27, 2006. http://www.iso-ne.com/pubs/pubcomm/pres_spchs/2006/dr_speech.pdf
Viscusi, W. Kip, John M. Vernon, and Joseph E. Harrington. Economics of Regulation and Antitrust. 3rd edition. Cambridge: MIT Press, 2000.
Western Electricity Coordinating Council. 2005 Summer Assessment. Salt Lake City, UT: WECC, May 2, 2005.
–. Data downloaded from www.wecc.biz on February 12, 2006. –. Relay Work Group Underfrequency Load Shedding Relay Application Guide, revised. August 3
2004. Weston, Frederick (Rick), and Wayne Shirley, RAP, Dynamic Pricing: Aligning Retail Prices with
Wholesale Markets; the Throughput Issue: Addressing the Adverse Impact of Distributed Resources on Utility Earnings; Role of Distributed Resources in System Planning, Scoping Paper for MADRI Regulatory subgroup, June 2005.
Weston, Frederick (Rick), “Time Sensitive and Dynamic Pricing Options.” MADRI presentation, February 2006. www.energetics.com/MADRI
Weston. “Dynamic Pricing: Options and Policies.” White paper for MADRI regulatory subgroup. November 2005. www.raponline.org
Woo, Chi-Keung, Ren Orans, Brian Horii and Peter Chow. “Pareto-superior time-of-use Rate Option for Industrial Firms,” Economics Letters 49 (1995): 267-272.
York, Ted. “Exploring ANSI Standards in Meter Communications,” Electricity Today, March 2000.
Appendix D – Bibliography
Assessment of Demand Response and Advanced Metering Federal Energy Regulatory Commission
D-10
Online Resources for further information on Demand Response and Advanced Metering:
Associations / Collections of Studies:
Association of Energy Services Professionals: http://www.aesp.org/i4a/pages/index.cfm?pageid=1 American Council for an Energy-Efficient Economy: http://www.aceee.org/ Demand Response and Advanced Metering Coalition (DRAM): http://www.dramcoalition.org Lawrence Berkeley National Laboratories, Demand Response Research Center (LBNL):
http://drrc.lbl.gov/drrc.html Midwest Energy Efficiency Alliance: http://www.mwalliance.org/ Regulatory Assistance Project (RAP). Reports and Issues newsletters on Energy Efficiency, Demand-
Side Resources, and Demand Management: www.raponline.org (All RAP reports cited in this bibliography can be found at this site.)
University of California Energy Institute (UCEI), Energy Market (CSEM) Working Papers: http://www.ucei.berkeley.edu/
Regional Demand Response Programs, Initiatives, Planning:
Bonneville Power Authority (BPA), energy efficiency: http://www.bpa.gov/Energy/N/ California:
PIER Demand Response Research Center. Created by CEC in 2004 to plan and conduct multi-disciplinary research to advance DR in California. http://drrc.lbl.gov/drrc.html
CAISO, Demand Response: http://www.caiso.com/clientserv/load/ ERCOT: http://www.puc.state.tx.us/electric/projects/26055/26055.cfm Mid-Atlantic Distributed Resources Initiative (MADRI)
Meeting agendas, presentations, and reports: http://www.energetics.com/MADRI/ Advanced Metering Tool-box: http://www.energetics.com/madri/toolbox/
Midwest ISO (MISO): http://www.midwestmarket.org/page/MisoPortalHome Emergency Operations Procedure:
http://www.midwestmarket.org/publish/Document/2b8a32_103ef711180_-7f700a48324a/_.pdf?action=download&_property=Attachment
New England: ISO-NE Demand Response
o Working Group materials: http://www.iso-ne.com/committees/comm_wkgrps/mrkts_comm/dr_wkgrp/index.html
o Demand Response main page: http://www.iso-ne.com/genrtion_resrcs/dr/index.html New England Distributed Resource Initiative (NEDRI)
o Studies: http://www.raponline.org/Feature.asp?select=20 o Studies prepared state-by-state, by Raab Associates:
http://www.nedri.raabassociates.org/main/projects.asp?proj=35&state=Completed New York: ISO – Demand Response:http://www.nyiso.com/public/products/demand_response/index.jsp Pacific Northwest National Laboratory (DOE):
Energy Efficiency and Renewable Energy Research: http://eere.pnl.gov/program_areas.stm PJM Interconnection, LLC:
Demand Response Working Group: http://www.pjm.org/committees/working-groups/dsrwg/dsrwg.html
Demand Response: http://www.pjm.org/services/demand-response/demand-response.html

Appendix E: The Public Process
Assessment of Demand Response and Advanced Metering Federal Energy Regulatory Commission
E-1
Appendix E: The Public Process Leading to the Report On November 3, 2005, Commission staff issued a notice of proposed voluntary survey and technical conference regarding Assessment of demand response resources, asking g for comments on a proposed survey, technical conference topics, and interest regarding participating at the conference.1 The November 2005 Notice set a comment date of December 5, 2005 for entities that wanted to comment on proposed survey questions and/or request to participate in the technical conference. A number of entities provided comments:
• Alcoa Inc. • American Electric Power Service Corporation • American Public Power Association • Avista Corporation • California Department of Water Resources State Water Project • Demand Response and Advanced Metering Coalition • Detroit Edison Company • Edison Electric Institute • Exelon Corporation • FirstEnergy Service Company • Stephen George of Charles River Association • Hunt Technologies Inc. • ISO New England • Mid-Atlantic Distributed Resources Initiative (MADRI) • Midwest Independent Transmission System Operator, Inc. • National Grid USA • New England Conference of Public Utilities Commissioners • New York State Electric and Gas Corporation • PJM Interconnection, L.L.C. • PNM Resources Inc. • Portland General Electric Company • San Diego Gas & Electric Company • Salt River Project Agricultural Improvement & Power District • Silver Spring Networks • Southern California Edison Company • Southern Company Services, Inc. • Steel Manufacturers Association • U.S. Environmental Protection Agency • Xcel Energy
The November 2005 Notice established a comment date of December 19, 2005 for entities that wanted to comment on proposed technical conference topics. A number of entities provided comments:
• Alcoa Inc.
1 This notice was published in the Federal Register on November 9, 2005, 70 Fed. Reg. 68,002 (2005) (November
2005 Notice).

Appendix E: The Public Process
E-2 Assessment of Demand Response and Advanced Metering Federal Energy Regulatory Commission
• American Public Power Association • California Public Utility Commission staff / California Energy Commission • Central Maine Power Corporation, New York State Electric and Gas Corporation, and
Rochester Gas and Electric Company • Cinergy Services, Inc. • Consumers Energy Council of America • Demand Response and Advanced Metering Coalition • Distributed Energy Financial Group, LLC • Edison Electric Institute • Exelon Corporation • Idaho Power Company • ISO New England • Midwest Independent Transmission System Operator, Inc. • National Grid USA • Hunt Technologies Inc. • MADRI • MidAmerican Energy Company • Missouri Public Service Commission • National Energy Marketers Association • Nevada Power Company / Sierra Pacific Power Company • New England Conference of Public Utilities Commissioners • New York Independent System Operator, Inc. • New York State Public Service Commission • Pacific Gas and Electric Company • Pennsylvania Public Utility Commission • PJM Interconnection, L.L.C. • Portland General Electric Company • Public Service Commission of Maryland • Public Utilities Commission of Ohio • San Diego Gas & Electric Company • Silicon Valley Leadership Group • Southern California Edison Company • Southern Company Services, Inc. • Steel Manufacturers Association
Commission staff issued notices of the January 25, 2006 technical conference.2 The following entities submitted comments / testimony:
• Jeffrey Bladen, PJM Interconnection, L.L.C. – presentation • James Brew, Steel Manufacturers Association – presentation • Ken Corum, Northwestern Power and Conservation Council – presentation • Jeff Davis, Missouri Public Service Commission – presentation • Paul Demartin, Southern California Edison Company – presentation
2 Notice of the technical conference was published in the Federal Register on December 16, 2005, 70 Fed. Reg.
74,804 (2005). Subsequent notices to the technical conference were published in the Federal Register. See 71 Fed. Reg. 3,287 (2006); see also 71 Fed. Reg. 4,361 (2006).

Appendix E: The Public Process
Assessment of Demand Response and Advanced Metering Federal Energy Regulatory Commission
E-3
• Charles Goldman, Lawrence Berkeley National Laboratory – presentation • Phil Giudice, EnerNOC – presentation • Patti Harper-Slaboszewicz, Utilitpoint International – presentation • Bruce Kaneshiro, California Public Utilities Commission – presentation • John M. Kelly, American Public Power Association – presentation • Tom Kerr, U.S. Environmental Protection Agency – presentation • David Lawrence, New York Independent System Operator, Inc. – presentation • Ronald McNamara, Midwest Independent System Operator, Inc. – presentation • David Meade, Praxair, Inc. – presentation • Jay Morrison, National Rural Electric Cooperative Association – presentation • Tim Roughan, National Grid – presentation • Peter Scarpelli, RETX – presentation • Doug Stinner, PPL Electric Utilities – presentation • Rick Tempchin, Edison Electric Institute – presentation • Alan Wilcox, Sacramento Municipal Utility District – presentation • Henry Yoshimura, ISO New England – presentation • Xcel Energy Comments
On March 15, 2006, Commission staff issued a notice of issuance of voluntary survey of advanced metering and demand response programs regarding assessment of demand response resources.3
3 Notice of the survey was published in the Federal Register on March 24, 2006, 71 Fed. Reg. 14,888 (2006).

Appendix E: The Public Process
E-4 Assessment of Demand Response and Advanced Metering Federal Energy Regulatory Commission
Appendix F: The FERC Survey
Assessment of Demand Response and Advanced Metering Federal Energy Regulatory Commission
F-1
Appendix F: The FERC Survey Summary The Energy Policy Act of 2005 (EPAct 2005) required that the Federal Energy Regulatory Commission (FERC) provide Congress with both qualitative information4 about demand response (DR) and advanced metering infrastructure (AMI) as well as specific quantitative, region-specific information. Commission staff determined that a survey of all private and public entities that provide electric power and DR to customers would help fulfill the requirement. Between September 2005 and June 2006, Commission staff—with the technical support of UtiliPoint International, Inc. (UtiliPoint):
• developed a survey and sampling design; • issued a proposed survey for public comment as well as a notice announcing a related
technical conference in the November 9, 2005 Federal Register; • gathered public information and guidance for the FERC Survey through the January 2006
technical conference; • initiated and successfully completed the Office of Management and Budget’s (OMB)
authorization process for federal information collections; • fielded the FERC Survey, collected the data and completed a substantial amount of data
analyses for this report. The response rate for the FERC Survey was 56% for the demand response section (1,886 of the 3,365 entities who received the FERC Survey) and 55% for the AMI section (1,860 of the 3,365 entities who received the FERC Survey). The FERC Survey response rate resulted from its being voluntary (instead of mandatory, like the EIA-861) and asking for more information on demand-side resources than the EIA Form-861survey. The following provides a detailed review of the steps Commission staff took to achieve this critical response rate documents the surveying process and addresses the OMB requirements for a summary of response rates and sampling results. An additional OMB requirement was to incorporate into its methodology a random sample derived from the respondent universe for the AMI section of the FERC Survey.
Development of the FERC Survey and Sampling Design Coordination with EIA Commission staff coordinated with Robert Schnapp, Director, Electric Power Division, EIA, to determine what EIA information Commission staff could use to meet the requirements of EPAct 2005 and to avoid imposing redundant reporting burdens on the industry. Neither the use of EIA DR data nor revisions of existing EIA information collections were going to help Commission staff meet the statutory requirement because: (1) there was a mismatch between the data collected and the data
4 See this Report’s Chapter VI, Role of Demand Response in Regional Planning and Operations and Chapter VII,
Regulatory Barriers.

Appendix F: The FERC Survey
Assessment of Demand Response and Advanced Metering Federal Energy Regulatory Commission
F-2
Congress asked for;5 and (2) the timetable for revising and collecting the needed data through EIA-861 did not coincide with the Congressional deadline of August 8, 2006.6 Based on these circumstances, Commission staff concluded that a separate survey was needed. The Draft Survey Commission staff decided to use a voluntary rather than mandatory survey because many of the entities it would be surveying were non-jurisdictional. To design the draft survey, Commission staff received advice and assistance from Chuck Goldman and Ranjit Bharvirkar from the Lawrence Berkeley National Laboratory, the Demand Response and Advanced Metering Coalition (DRAM) and the Mid-Atlantic Demand Response Initiative (MADRI). Commission staff designed the draft survey to collect the needed information using three forms: one was to collect general and identifying information on the respondents, the second was on demand response and time-based metering programs (FERC-727), and the third was on advanced metering infrastructure (FERC-728). Dividing the FERC Survey into three sections allowed different people within an organization to collect data and complete the forms at the same time. The general information section of the FERC Survey helped link data from all parts of the FERC Survey together for each respondent. It also provided a fast way for organizations to respond to the FERC Survey if they had no information to report.
The Respondent Universe To analyze the survey data and calculate statistics for this report, Commission staff reviewed the composition of the respondent universe (RU) very closely, and found that there were 3,365 organizations as listed in Table F-1.
Table F-1. Respondent Universe of FERC Survey
Group Name # of Organizations in Group Municipally Owned Utilities 1,847 Cooperative Utilities 884 Investor Owned Utilities 219 Power Marketers 165 Political Subdivisions 126 Municipal Marketing Authorities 19 Curtailment Service Providers (CSPs) 68 State Utilities 21 Federal Utilities 9 RTOs/ISOs 7 Grand Total 3,365
Source: EIA, Internet
5 EIA-861 data provides total, aggregated data on energy efficiency and load management. It does not collect
information on saturation and penetration rates of advanced meters, communications, technologies, devices and systems. In additon, the EIA-861 does not ask about existing demand resource programs or time-based rate programs. The form does not have detailed information on the annual resource contribution of demand resources.
6 Per an August 21, 2005 conversation between David Kathan of FERC and Robert Schnapp of EIA, it was determined to be too late for EIA to incorporate the additional data Commission staff needed in the EIA-861 which was soon to be issued to collect 2005 data. Moreover, EIA-861 responses are due by April of each year, and EIA does not publish the results of the survey until November or December. This timetable did not allow FERC to be able to respond to Congress.

Appendix F: The FERC Survey
Assessment of Demand Response and Advanced Metering Federal Energy Regulatory Commission
F-3
Table F-2 shows the adjustments Commission staff had to make to the number of organizations in three categories (Municipally Owned Utilities, Curtailment Service Providers (CSPs) and Regional Transmission Organization/Independent System Operator (RTO/ISO) to:
• limit the geographic scope of the survey to businesses in American States, as required by Congress;
• reflect a change in utility ownership status that occurred during the survey period; • ensure accurate survey outreach to all organizations which might have DR or AMI activities to
report; and • eliminate data redundancy.
Specifically, Commission staff and Utilipoint made four adjustments to the number of groups in each category of the RU as they proceeded from OMB authorization to fielding and analysis. First, the organizations that received the FERC survey included a municipal utility in Guam and three utilities in the United States territories of Puerto Rico, Virgin Islands, and Samoa. Commission staff did not include the organizations in the territories that responded in the final survey tabulations, and so the number of State utilities in the RU decreased from 24 to 21, and the number of municipally owned utilities decreased from 1,847 to 1,846. In the course of fielding the survey, one investor owned utility changed to a municipal utility, which increased the number of municipally owned utilities from 1,846 back up to 1,847 and decreased the number of investor utilities from 220 to 219. Commission staff inadvertently counted four RTOs/ISOs as CSPs during its work with OMB for survey and sample authorizations. Commission staff also subsequently found that it had counted one of the CSPs three times because the company has three EIA identification numbers in the 2005 EIA 861 database used to field the FERC Survey. The necessary adjustments result in a decrease in the number of CSPs listed in the requests to OMB for survey and sample authorization (74) and in the number of CSPs who received the FERC Survey (70) to 68.
Table F-2. Adjustments to Number of Organizations in RU Groups
Group Name
# of Organizations
in RU by Group
RU #s in FERC Survey Authorization
Request to OMB
RU #s in FERC-
Proposed Sample Design
RU #s who
Received Survey
Municipally Owned Utilities 1,847 1,847 1,847 1,847Cooperative Utilities 884 884 884 884Investor Owned Utilities 219 220 220 220Power Marketers 165 165 165 165Political Subdivisions 126 126 126 126Municipal Marketing Authorities 19 19 19 19CSPs 68 74 74 70State Utilities 21 24 24 24Federal Utilities 9 9 9 9RTOs/ISOs 7 8 0 7Grand Total 3,365 3,294 3,368 3,371
Source: EIA, Internet The utility component of the respondent universe consists of utilities in the United States that are involved in the generation, transmission, and distribution of electric energy. The region definition used in the FERC Survey was based on that used by the North American Electric Reliability Council

Appendix F: The FERC Survey
Assessment of Demand Response and Advanced Metering Federal Energy Regulatory Commission
F-4
(NERC). Using NERC regions allowed collection of data based on how energy is traded and managed, and provided the most useful regional grouping for the consideration of DR resources, and advanced metering deployment that would potentially reduce barriers for participation in demand response and time-based rate programs and/or tariffs. FERC Survey Methodology The results in the final report reflect improvements Commission staff was able to make to the draft survey because of public comments. In addition, in order to obtain OMB approval, Commission staff had to incorporate a sample in its survey design methodology. Public Comment On November 3, 2005, Commission staff issued in Docket No. AD06-2-000 a notice with the proposed survey.7 The notice was published in the November 9, 2005 Federal Register.8 In seeking public comment, Commission staff asked whether the questions would elicit accurate information on advanced meters and demand response programs, or whether the questions should be modified or supplemented to better obtain information. In addition, Commission staff asked for input on other sources of information on advanced metering and demand response programs. Twenty-nine entities filed comments regarding the proposed survey. In response to the comments, numerous changes were made including clarification of what was expected on the FERC Survey and the development of a glossary of terms. In addition, detailed instructions for completing each section of the FERC Survey were significantly revised and expanded. The FERC Survey web page was populated with information about the Commission’s demand response work, including a document listing and answering frequently asked questions; related notices; the draft survey; and a Commission-staff summary of comments on the draft survey. Respondents were also able to download a copy of the entire survey instrument to help them organize and conduct their data collections and to help them complete the FERC Survey online as quickly as possible. The structure of the FERC Survey was revised to allow respondents to enter as many as 8 demand response and/or time-based rate programs/tariffs per customer class per region. Respondents were provided with multiple choice questions in a format only requiring that respondents make a choice among options rather than enter codes. This was done to improve the quality of data and ease the burden on respondents. Other survey design enhancements included the use of tables whenever possible for respondents to be able to ensure that the numerical information provided was consistent across each customer class and routing to keep respondents from having to search for the next relevant question to answer. This feature was tested on the web before release of the survey to ensure that it worked correctly. Many of the comments revealed that potential respondents were interested in the results, understood the questions, and were very capable of discussing the issues in great detail. To allow for additional input, the FERC Survey provided comment boxes on a regular basis throughout the forms. This yielded information that could normally only have been obtained through an in-person interview.
7 The two sections of the survey were FERC-727 “Demand Responses and Time-Based Rate Programs Survey” and FERC-728 “Advanced Metering Program Survey.”
8 70 FR 68002-6803.

Appendix F: The FERC Survey
Assessment of Demand Response and Advanced Metering Federal Energy Regulatory Commission
F-5
Commission staff received several comments on the draft survey regarding security and took steps to address the concerns. Commission staff issued a randomly generated, organization-specific, alpha-numeric password to ensure that the survey responses received were the official response of the organization. The letter from Commission staff with the survey provided potential respondents with their password. UtiliPoint was diligent in keeping the survey responses and data secure. Access to the FERC Survey was through a FERC webpage link that took respondents to the UtiliPoint server. UtiliPoint’s server hosting company uses network intrusion detection in a signature based model. They also use a state based layer firewall with notification and alerting of abnormal events. The administrator at the server hosting company is a Certified Information Systems Security Professional. OMB Requirements Commission staff reviewed and met the OMB guidelines outlined in Questions and Answers When Designing Surveys for Information Collections. The biggest challenge Commission staff had in gaining OMB approval of the FERC Survey came from a belief OMB staff had that sending out the FERC Survey to the entire respondent universe would result in data with a self-selection bias. As a result, OMB required Commission staff to: (1) change the FERC Survey design to mitigate the potential for self-selection bias by drawing a random sample of 762 in the AMI section; (2) provide a report on the achieved response rates by strata and on the results of analyses comparing the random sample to the RU and (3) note any meaningful differences between the response rate of the AMI section of survey for the RU and for the sample of 762 in the final report to Congress. In its analysis, Commission staff found no significant self-selection bias in the data. Methodology Commission staff conducted the FERC Survey using the Internet. The FERC-727 and FERC-728 were posted as forms on the Commission’s web page and the links allowed those who took the FERC Survey to submit their responses electronically directly to FERC and UtiliPoint. In designing the methodology for the DR and AMI sections of the survey, UtiliPoint:
• Drew the pool of utility respondents from the 2005 EIA respondent list and verified the
number of organizations in each group; • Segmented the pool of potential FERC Survey respondents by NERC region, type of utility
and the number of retail customers served; • Sized utilities based on total number of customers each utility reported in its 2004 EIA-861
form, as follows: o large (number of customers over 100,000); o medium (number of customers > 25,000 and less than 100,000); o other (0 retail customers or Generation and Transmission utility) and o small (less than or equal to 25,000 customers); and
• Drew a random sample of 762 for the AMI section of the survey. Commission staff expected that the DR program/tariff offerings as well as the penetration of AMI would be substantially different across the different size utilities and across the different types of utilities.

Appendix F: The FERC Survey
Assessment of Demand Response and Advanced Metering Federal Energy Regulatory Commission
F-6
The AMI survey methodology anticipated responses from utilities that have ownership and/or responsibility for revenue and billing metering, such as cooperative, federal, investor owned, municipal, political subdivision, and state utilities who serve retail customers. Utilities that do not serve retail customers—namely Municipal Marketing Authorities, Wholesalers or Generation and Transmission (G&T) utilities—were not expected to submit responses for the AMI section of the FERC Survey since these types of utilities typically do not own or have responsibility for billing and revenue meters for retail customers. In addition, Power Marketers (which include Competitive Retailers, Energy Service Providers, Retail Providers, and the other names generally used in regions with retail competition or retail choice) were not expected to submit responses to the AMI section of the FERC Survey because these utilities typically do not own or have responsibility for retail metering. Fielding the FERC Survey and Analyzing the Data Efforts to Maximize Response Rates Commission staff tried to maximize response rates by using an aggressive outreach approach of addressing large gatherings of organizations that were expected to respond to the FERC Survey. For example, Commission staff announced preliminary survey plans to and discussed with several trade and state associations including members and/or representatives of the National Association of Regulatory Commissioners, American Public Power Association, Edison Electric Institute, and the National Rural Electric Cooperative Association. In a cooperative spirit and in consideration of the authority that state utility commissioners have in this matter, Commission staff sent letters to state regulators over FERC Chairman Kelliher’s signature informing them of the organizations in their state that were asked to participate in the FERC Survey. The letter committed to giving them a status report of whether or not those utilities in their jurisdiction had responded to the FERC Survey. Commission staff sent the follow-up letters to the state regulators 30 days after the FERC Survey issued. Another effort to maximize response was that the letter Commission staff sent to the respondent universe used personalized greetings, provided information about the FERC Survey, gave general guidance on how to complete the FERC-727 and FERC-728 and referred to the potential respondent company by name to encourage its participation in the important study. Commission staff sent the FERC Survey letter via email as well as in hard copy. Delivery of a hard copy of the FERC Survey package at the place of business was especially useful because Commission staff anticipated contacts listed in the 2005 EIA-861 data base may have changed. Commission staff also worked to maximize response rates through the FERC Survey’s design. The FERC Survey included routing to only show the respondent relevant questions, used multiple choice questions where feasible, and kept validity checking to a minimum to reduce respondent frustration during the data entry process. To accommodate respondents who were not comfortable completing a web survey or who did not have access to the internet, the instructions provided a person’s name and contact information so they could find an alternative means for reporting their information. Respondents needing such accommodation received an email telling them the links to the FERC Survey web page to print the forms. The email included instructions for completing submitting the FERC Survey manually. Respondents were able to have someone fill out the FERC Survey for them during a phone call, if they
Appendix F: The FERC Survey
Assessment of Demand Response and Advanced Metering Federal Energy Regulatory Commission
F-7
chose to. There was a phone number at the bottom of each page of the FERC Survey for respondents to call if they encountered problems while filling out the survey and this boosted response rates by solving technical difficulties which might have discouraged respondents. For example, some respondents notified Commission staff and Utilipoint that they were not able to access the information on the web site. Investigation of the matter found that these respondents had pop-up ad blockers on their computers. By disabling this feature on their computer, they were able to complete the survey. Commission staff and Utilipoint collected and compiled this sort of information into a frequently asked question list which was then posted on the survey web page. Commission staff accommodated people at organizations with no internet by preparing and mailing copies of the FERC Survey and all the information needed to complete the FERC Survey to them. To increase the likelihood of getting survey responses from contacts listed in the EIA-861 data base who were responsible for reporting on three or more organizations, Commission staff sent customized letters to these contacts. The letter included a spreadsheet they could use to report their data and eliminated the need to fill out the multi-page survey repeatedly. Commission staff and Utilipoint followed through with those who had not completed the FERC Survey by the deadline by phoning them and filling out the relevant survey sections for them while they were on the phone. People who did all the follow-up had experience in interviewing energy market participants and had a deep knowledge of advanced metering, demand response, and time-based rates. UtiliPoint tracked responses as they came in to assess which NERC regions might have been showing under-representation and targeted these for early follow-up. Expected and Actual Response Rates With regard to expected response rates in general, Commission staff expected that large utilities would be very responsive and medium sized utilities less so. Small utilities were expected to be very responsive, but primarily if someone followed up with a phone call. The response rate for the demand response and time-based programs/tariffs section of the FERC survey was expected to be lower than for the AMI survey section for two reasons. First, utilities were going to need to submit fewer responses for this FERC Survey section since only one response was required per NERC region, whereas for the AMI survey section, one response was required per state. Large utilities with operations across states were to complete an AMI survey section for each state but were to provide only one response for the FERC Survey section on DR. The second reason for anticipating a lower response rate was that longer surveys have lower response rates. The actual response rates between the two sections were almost identical. Commission staff expected—and received—a large number of responses from larger utilities for two reasons. First, larger utilities have consistently reported more demand response load in MW than smaller utilities. Second, large utilities had shown a keen interest in the demand response section of the FERC Survey. Commission staff also expected a high response rate from the larger utilities on the AMI section survey design for three reasons. First, the larger utilities represent more retail customers. Second, the large utilities showed a keen interest in the AMI section of the FERC Survey in their responses to the

Appendix F: The FERC Survey
Assessment of Demand Response and Advanced Metering Federal Energy Regulatory Commission
F-8
Commission’s draft survey. Third, Commission staff gave follow-up to non-responding, large utilities a high priority. The percentage of responses by utility size was consistent with UtiliPoint survey experience that large utilities are typically very responsive and medium sized utilities less so. Experience also had showed that small utilities are very responsive, but primarily if someone follows up with a phone call. The large number of small utilities limited the number of non-responding small utilities that could be economically included in planned follow-up. The follow-up calls were planned to first go to larger utilities since they represent the most meters per response, and then to any market segment that was having a lower than expected response rate.
Commission staff achieved a very significant—and rare—response rate greater than 50% for the small cooperative and municipally owned utilities. Small municipals usually have a voluntary survey response rate of 5 %. Table F-3 displays the response rates received. In spite of follow up phone calls and in-person conversations with staff and leaders at all levels of the CSPs, Commission staff was only able to achieve a response rate for CSPs that was 29% for the DR section the FERC Survey and 28% for the AMI section of the FERC Survey. During the analysis phase of the FERC Survey, experienced industry analysts reviewed the data provided by the respondents. The data was carefully weighted based on the type of organization, size, and region, to allow analyses of the responses to accurately reflect the entire market. The industry analysts tabulated the data to provide meaningful and interesting information for the report to Congress. The FERC Survey response rate—overall and by strata—showed no statistically significant evidence of self-selection bias when Commission staff and Utilipoint compared the response rates of the 762 organizations in the random AMI sample to the response rates of the 1,860 in the respondent universe who completed the AMI section of the FERC Survey. Table F-4 displays the expected and actual response rates for AMI. There were various categories of the ways in which organizations reported their information. In the most straightforward response, organization A submitted a DR and/or an AMI survey response for organization A. Other responses were sometimes more complicated in the organizations they covered. For example, in some cases Organization B submitted DR and or AMI responses for organization B that included the information for the organization A. This occurred when there were multiple operating companies within a particular NERC region for one entity. In other cases Organization A submitted a General Information for organization A indicating no DR and/or AMI programs. Organization B submitted a General Information for organization B indicating no DR and/or programs for Organization B. Organization A and B are separate operating companies for one entity. In yet other cases, Commission staff and Utilipoint received an email from a responsible authority indicating that organization A no longer is in business, or was never a separate entity. In a follow-up phone call with organization A, we learned they offered no DR programs and/or had no AMI. We always asked them to fill out the General Information section of the survey, and mostly did, but some did not.
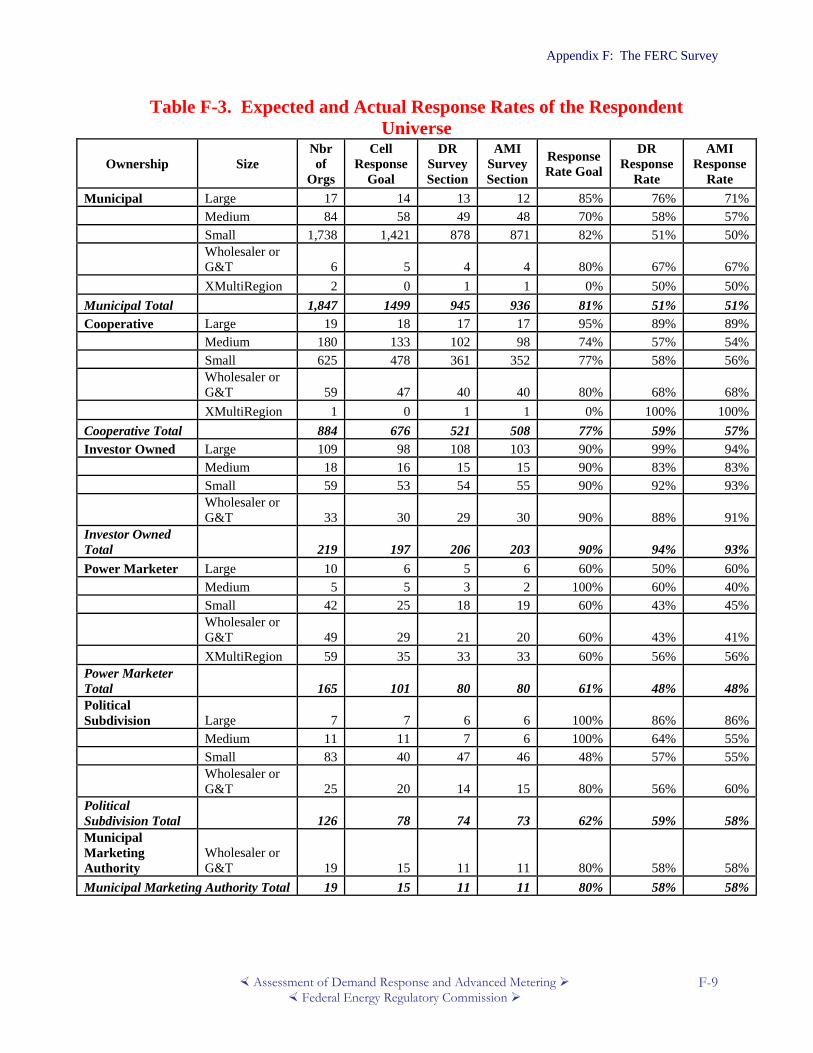
Appendix F: The FERC Survey
Assessment of Demand Response and Advanced Metering Federal Energy Regulatory Commission
F-9
Table F-3. Expected and Actual Response Rates of the Respondent Universe
Ownership Size Nbr of
Orgs
Cell Response
Goal
DR Survey Section
AMI Survey Section
Response Rate Goal
DR Response
Rate
AMI Response
Rate Municipal Large 17 14 13 12 85% 76% 71% Medium 84 58 49 48 70% 58% 57% Small 1,738 1,421 878 871 82% 51% 50%
Wholesaler or G&T 6 5 4 4 80% 67% 67%
XMultiRegion 2 0 1 1 0% 50% 50%Municipal Total 1,847 1499 945 936 81% 51% 51%Cooperative Large 19 18 17 17 95% 89% 89% Medium 180 133 102 98 74% 57% 54% Small 625 478 361 352 77% 58% 56%
Wholesaler or G&T 59 47 40 40 80% 68% 68%
XMultiRegion 1 0 1 1 0% 100% 100%Cooperative Total 884 676 521 508 77% 59% 57%Investor Owned Large 109 98 108 103 90% 99% 94% Medium 18 16 15 15 90% 83% 83% Small 59 53 54 55 90% 92% 93%
Wholesaler or G&T 33 30 29 30 90% 88% 91%
Investor Owned Total 219 197 206 203 90% 94% 93%Power Marketer Large 10 6 5 6 60% 50% 60% Medium 5 5 3 2 100% 60% 40% Small 42 25 18 19 60% 43% 45%
Wholesaler or G&T 49 29 21 20 60% 43% 41%
XMultiRegion 59 35 33 33 60% 56% 56%Power Marketer Total 165 101 80 80 61% 48% 48%Political Subdivision Large 7 7 6 6 100% 86% 86% Medium 11 11 7 6 100% 64% 55% Small 83 40 47 46 48% 57% 55%
Wholesaler or G&T 25 20 14 15 80% 56% 60%
Political Subdivision Total 126 78 74 73 62% 59% 58%Municipal Marketing Authority
Wholesaler or G&T 19 15 11 11 80% 58% 58%
Municipal Marketing Authority Total 19 15 11 11 80% 58% 58%
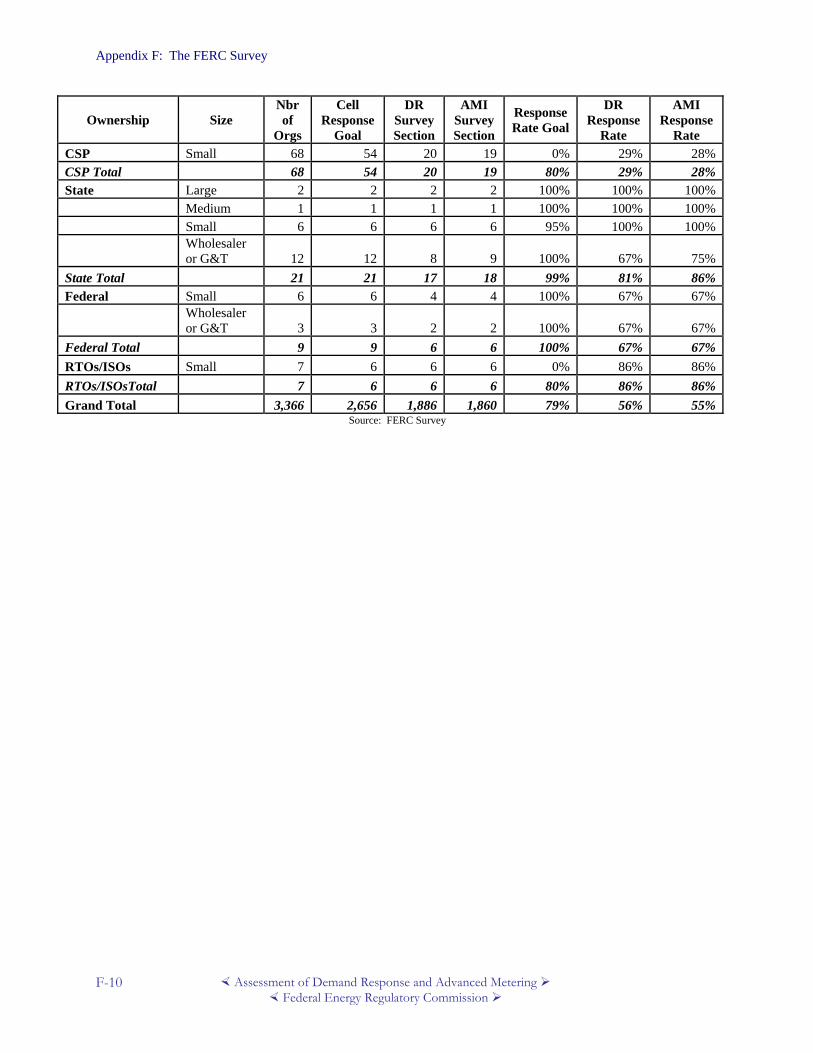
Appendix F: The FERC Survey
Assessment of Demand Response and Advanced Metering Federal Energy Regulatory Commission
F-10
Ownership Size Nbr of
Orgs
Cell Response
Goal
DR Survey Section
AMI Survey Section
Response Rate Goal
DR Response
Rate
AMI Response
Rate CSP Small 68 54 20 19 0% 29% 28%CSP Total 68 54 20 19 80% 29% 28%State Large 2 2 2 2 100% 100% 100% Medium 1 1 1 1 100% 100% 100% Small 6 6 6 6 95% 100% 100%
Wholesaler or G&T 12 12 8 9 100% 67% 75%
State Total 21 21 17 18 99% 81% 86%Federal Small 6 6 4 4 100% 67% 67%
Wholesaler or G&T 3 3 2 2 100% 67% 67%
Federal Total 9 9 6 6 100% 67% 67%RTOs/ISOs Small 7 6 6 6 0% 86% 86%RTOs/ISOsTotal 7 6 6 6 80% 86% 86%Grand Total 3,366 2,656 1,886 1,860 79% 56% 55%
Source: FERC Survey

Appendix F: The FERC Survey
Assessment of Demand Response and Advanced Metering Federal Energy Regulatory Commission
F-11
Table F-4. Expected and Actual Response Rates by Strata: AMI
Ownership Size Nbr of
Orgs
Cell Response
Goal
AMI Survey Section
Response Rate Goal
AMI Response
Rate Municipal Large 17 14 12 85% 71% Medium 18 14 13 80% 72% Small 58 47 42 82% 72%
Wholesaler or G&T 6 5 4 80% 67%
XMultiRegion 0% Municipal Total 99 81 71 82% 72%Cooperative Large 19 18 17 95% 89% Medium 20 16 15 80% 75% Small 18 14 12 80% 67%
Wholesaler or G&T 59 47 40 80% 68%
XMultiRegion Cooperative Total 116 96 84 82% 72%Investor Owned Large 109 98 103 90% 94% Medium 18 16 15 90% 83% Small 59 53 55 90% 93%
Wholesaler or G&T 33 30 30 90% 91%
Investor Owned Total 219 197 203 90% 93%Power Marketer Large 10 6 6 60% 60% Medium 5 5 2 100% 40% Small 42 25 19 60% 45%
Wholesaler or G&T 49 29 20 60% 41%
XMultiRegion 59 35 33 60% 56%Power Marketer Total 165 101 80 61% 48%Political Subdivision Large 7 7 6 100% 86% Medium 4 4 2 100% 50% Small 3 2 0 53% 0%
Wholesaler or G&T 25 20 15 80% 60%
Political Subdivision Total 39 33 23 84% 59%
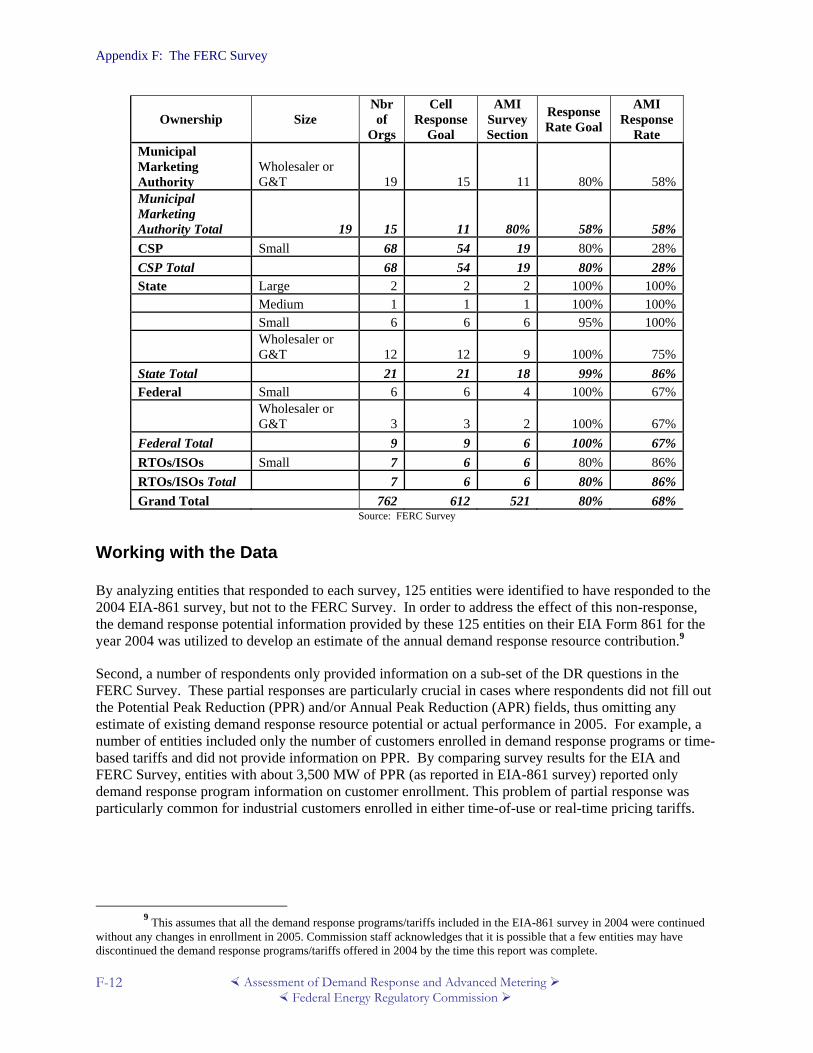
Appendix F: The FERC Survey
Assessment of Demand Response and Advanced Metering Federal Energy Regulatory Commission
F-12
Ownership Size Nbr of
Orgs
Cell Response
Goal
AMI Survey Section
Response Rate Goal
AMI Response
Rate Municipal Marketing Authority
Wholesaler or G&T 19 15 11 80% 58%
Municipal Marketing Authority Total 19 15 11 80% 58% 58%CSP Small 68 54 19 80% 28%CSP Total 68 54 19 80% 28%State Large 2 2 2 100% 100% Medium 1 1 1 100% 100% Small 6 6 6 95% 100%
Wholesaler or G&T 12 12 9 100% 75%
State Total 21 21 18 99% 86%Federal Small 6 6 4 100% 67%
Wholesaler or G&T 3 3 2 100% 67%
Federal Total 9 9 6 100% 67%RTOs/ISOs Small 7 6 6 80% 86%RTOs/ISOs Total 7 6 6 80% 86%Grand Total 762 612 521 80% 68%
Source: FERC Survey
Working with the Data By analyzing entities that responded to each survey, 125 entities were identified to have responded to the 2004 EIA-861 survey, but not to the FERC Survey. In order to address the effect of this non-response, the demand response potential information provided by these 125 entities on their EIA Form 861 for the year 2004 was utilized to develop an estimate of the annual demand response resource contribution.9
Second, a number of respondents only provided information on a sub-set of the DR questions in the FERC Survey. These partial responses are particularly crucial in cases where respondents did not fill out the Potential Peak Reduction (PPR) and/or Annual Peak Reduction (APR) fields, thus omitting any estimate of existing demand response resource potential or actual performance in 2005. For example, a number of entities included only the number of customers enrolled in demand response programs or time-based tariffs and did not provide information on PPR. By comparing survey results for the EIA and FERC Survey, entities with about 3,500 MW of PPR (as reported in EIA-861 survey) reported only demand response program information on customer enrollment. This problem of partial response was particularly common for industrial customers enrolled in either time-of-use or real-time pricing tariffs.
9 This assumes that all the demand response programs/tariffs included in the EIA-861 survey in 2004 were continued
without any changes in enrollment in 2005. Commission staff acknowledges that it is possible that a few entities may have discontinued the demand response programs/tariffs offered in 2004 by the time this report was complete.
Appendix F: The FERC Survey
Assessment of Demand Response and Advanced Metering Federal Energy Regulatory Commission
F-13
To address this missing data issue, PPR values provided by an entity from the EIA Form 861 database were used to estimate resource contribution in cases where that entity did not report PPR values for a particular customer class in their FERC Survey response.10
Another notable data issue that Commission staff and Utilipoint addressed was the potential for over-reporting and the double-counting of PPR and enrolled DR load. On the matter of over-reporting, a number of entities reported in their response to the FERC Survey the same PPR values for commercial and industrial customers enrolled in a demand response program or time-based tariff. In these cases, FERC Survey respondents may have erroneously entered the total demand response resource for each program in both customer classes instead of splitting it appropriately. Based on the comments provided by FERC Survey respondents, about 200 MW of PPR may have been counted twice for commercial and industrial customers. On the matter of double-counting, the possibility of utilities that reported PPR values for customers enrolled in DR programs that were offered (and also reported) by wholesale market entities like RTOs and ISOs may have resulted in “double-counted” DR resources in the raw data. Specifically, a number of entities appear to have provided data about DR resources that were essentially a part of the DR programs operated by their respective RTOs or ISOs. In cases where utilities specifically indicated that a DR program or tariff was linked to an RTO/ISO DR program, the PPR values of the respondent were adjusted to avoid double-counting. Data quality checks were also performed on all utility responses in those regions with ISOs and RTOs, which involved comparisons of information reported in the FERC Survey by ISO/RTOs on their DR programs with utility responses to the FERC Survey. Through this process, 3,222 MW of PPR is estimated to have been double-counted between utility and RTO/ISO DR programs. In developing an estimate of annual DR resource contribution, this “double-counting” resulted in demand response potential values being adjusted downward.
A final notable issue that is always present in surveys is data quality. A number of data quality checks were developed to assess reasonableness of survey responses on demand response resource potential. For example, a number of respondents did not notice that data about PPR, APR, and maximum demand of enrolled customers was requested in terms of megawatts and provided data in kilowatts.11
10 Entities report PPR values by customer class on the EIA Form 861; hence, FERC aggregated survey responses by
each entity to the customer class level in addressing missing data values for PPR (i.e., partial non-response). 11 For cases where an entity’s PPR value looked suspiciously high (e.g. because it may have been reported in kW, not
MW), FERC compared the demand response resource estimates for an entity with their annual peak demand as reported in the EIA-861 survey. For example, an entity with annual peak demand of 25 MW cannot report a demand response resource of 1,000 MW. Obviously, in this case, the demand response resource was reported in terms of kW instead of MW; and PPR values were adjusted accordingly.

Appendix F: The FERC Survey
Assessment of Demand Response and Advanced Metering Federal Energy Regulatory Commission
F-14

Appendix G: FERC Survey Respondents
Assessment of Demand Response and Advanced Metering Federal Energy Regulatory Commission
G-1
Appendix G: FERC Survey Respondents*
Municipally Owned Utilities (986 Entities) Adrian Public Utilities Comm (MN) Aitkin Public Utilities Comm (MN) Albany Wtr Gas&Light Comm (GA) Algoma Utility Comm (WI) Anchorage Municipal Light and Power (AK) Atlantic Municipal Utilities (IA) Austin Energy (TX) Bancroft Municipal Utilities (IA) Barton Village, Inc (VT) Beaver City Corporation (UT) Town of Benson (NC) Bloomer Electric & Water Co (WI) Board of Water Elec & Comm (IA) Borough of Blakely (PA) Borough of Butler (NJ) Borough of Catawissa (PA) Borough of Chambersburg (PA) Borough of Duncannon (PA) Borough of Ellwood City (PA) Borough of Goldsboro (PA) Borough of Grove City (PA) Borough of Hatfield (PA) Borough of Lewisberry (PA) Borough of Milltown (NJ) Borough of New Wilmington (PA) Borough of Olyphant (PA) Borough of Pemberton (NJ) Borough of Perkasie (PA) Borough of Royalton (PA) Borough of Smethport (PA) Borough of St Clair (PA) Borough of Wampum (PA) Borough of Watsontown (PA) Borough of Zelienople (PA) Bozrah Light & Power Co (CT) Brainerd Public Utilities (MN) Bremen Elec Light & Power Co (IN) Bristol Virginia Utilities (VA) Brodhead Water & Light Comm (WI) Brownsville Pub Utilities Board (TX) Cairo Public Utility Company (IL) Canton Municipal Utilities (MS) Carrollton Board of Public Wks (MO) Cascade Municipal Utilities (IA) Cedar Falls Utilities (IA) Cedarburg Light & Wtr Comm (WI) Chillicothe Municipal Utils (MO) City & Cnty of San Francisco (CA)
City of Abbeville (LA) City of Abbeville (SC) City of Acworth (GA) City of Adel (GA) City of Alameda (CA) City of Albany (MO) City of Albion (ID) City of Alexander City (AL) City of Alexandria (MN) City of Algona (IA) City of Alpha (MN) City of Alta (IA) City of Alta Vista (IA) City of Altamont (KS) City of Altamont (IL) City of Altus (OK) City of Ames (IA) City of Anaheim (CA) City of Anderson (IN) City of Anita (IA) City of Ansley (NE) City of Anthony (KS) City of Arcadia (WI) City of Arcanum (OH) City of Argyle (WI) City of Arlington (SD) City of Ashland (KS) City of Attica (KS) City of Auburn (IA) City of Augusta (KS) City of Aurora (SD) City of Axtell (KS) City of Aztec (NM) City of Azusa (CA) City of Baldwin City (KS) City of Bangor (WI) City of Bardwell (KY) City of Barnesville (MN) City of Barron (WI) City of Bastrop (TX) City of Battle Creek (NE) City of Baudette (MN) City of Bay City (MI) City of Bayard (NE) City of Beatrice (NE) City of Bedford (VA) City of Belleville (KS) city of Bellville (TX)
City of Beloit (KS) City of Benkelman (NE) City of Benton (AR) City of Bentonville (AR) City of Berea Municipal Utilities (KY) City of Beresford (SD) City of Bethany (MO) City of Big Stone City (SD) City of Biggs (CA) City of Black River Falls (WI) City of Blackwell (OK) City of Blaine (WA) City of Blanding (UT) City of Blooming Prairie (MN) City of Blue Earth (MN) City of Blue Hill (NE) City of Bluffton (IN) City of Bonners Ferry (ID) City of Boscobel (WI) City of Bountiful (UT) City of Bowie (TX) City of Bowling Green (OH) City of Brady (TX) City of Breese (IL) City of Bristol (TN) City of Broken Bow (NE) City of Bronson (KS) City of Brookings (SD) City of Brooklyn (IA) City of Brownfield (TX) City of Brownton (MN) City of Brundidge (AL) City of Bryan (TX) City of Buffalo (MN) City of Buffalo (IA) City of Buford (GA) City of Burbank (CA) City of Burley (ID) City of Burlington (KS) City of Burlington (CO) City of Burwell (NE) City of Bushnell (IL) City of Bushnell (FL) City of Butler (MO) City of Caldwell (TX) City of Calhoun (GA) City of California (MO) City of Camden (SC)

Appendix G: FERC Survey Respondents
Assessment of Demand Response and Advanced Metering Federal Energy Regulatory Commission
G-2
Municipally Owned Utilities (Cont’d)
City of Cameron (MO) City of Campbell (MO) City of Carlyle (IL) City of Carmi (IL) City of Cartersville (GA) City of Carthage (MO) City of Casey (IL) City of Castroville (TX) City of Cavalier (ND) City of Celina (OH) City of Center (CO) City of Central City (NE) City of Centralia (MO) City of Centralia (WA) City of Chanute (KS) City of Chappell (NE) City of Charlevoix (MI) City of Chattahoochee (FL) City of Chefornak (AK) City of Cheney (WA) City of Chewelah (WA) City of Chicopee (MA) City of Chignik (AK) City of Claremore (OK) City of Clewiston (FL) City of Clintonville (WI) City of Coggon (IA) City of Colby (KS) City of Coleman (TX) City of College Station (TX) City of Collins (MS) City of Colorado Springs (CO) City of Columbia (MO) City of Columbia City (IN) City of Columbus (WI) City of Commerce (GA) City of Cornelius (NC) City of Cornell (WI) City of Corning (IA) City of Covington (IN) City of Crane (MO) City of Croswell (MI) City of Crystal Falls (MI) City of Cuba City (WI) City of Cuero (TX) City of Cumberland (WI) City of Curtis (NE) City of Cushing (OK) City of Cuyahoga Falls (OH) City of Danville (VA) City of David City (NE)
City of Dayton (IA) City of Deaver (WY) City of Declo (ID) City of Denison (IA) City of Detroit (MI) City of Detroit Lakes (MN) City of Dighton (KS) City of Doerun (GA) City of Dothan (AL) City of Dover (DE) City of Dover (OH) City of Duncan (OK) City of Dunnell (MN) City of Dysart (IA) City of Eagle River (WI) City of Earlville (IA) City of Easton (MO) City of Eaton Rapids (MI) City of Edmond (OK) City of Eitzen (MN) City of El Dorado Springs (MO) City of Elba (AL) City of Electra (TX) City of Elfin Cove (AK) City of Elizabethton (TN) City of Elk Point (SD) City of Elk River (MN) City of Elkhorn (WI) City of Ellaville (GA) City of Ellensburg (WA) City of Ellsworth (IA) City of Elroy (WI) City of Elsmore (KS) City of Elwood (KS) City of Emerson (NE) City of Enterprise (UT) City of Enterprise (KS) City of Erie (KS) City of Escanaba (MI) City of Escondido (CA) City of Estelline (SD) City of Estherville (IA) City of Eudora (KS) City of Eugene (OR) City of Fairbury (NE) City of Fairfax (MN) City of Fairhope (AL) City of Faith (SD) City of Falls City (NE) City of Falmouth (KY) City of Farmer City (IL)
City of Farmersville (TX) City of Farmington (NM) City of Farnhamville (IA) City of Fayette (MO) City of Fennimore (WI) City of Flandreau (SD) City of Floresville (TX) City of Floydada (TX) City of Fonda (IA) City of Forest Grove (OR) City of Fort Collins (CO) City of Fountain (CO) City of Franklin (VA) City of Fredericktown (MO) City of Fredonia (AZ) City of Gaffney (SC) City of Galion (OH) City of Gallup (NM) City of Galva (KS) City of Garden City (KS) City of Gardner (KS) City of Garnett (KS) City of Garrett (IN) City of Gas City (IN) City of Gastonia (NC) City of Geary (OK) City of Geneseo (IL) City of Georgetown (TX) City of Gering (NE) City of Giddings (TX) City of Gillette (WY) City of Gilman City (MO) City of Girard (KS) City of Gladstone (MI) City of Glasco (KS) City of Glen Elder (KS) City of Glenwood Springs (CO) City of Glidden (IA) City of Goldsmith (TX) City of Goldthwaite (TX) City of Goodland (KS) City of Gothenburg (NE) City of Grafton (ND) City of Granbury (TX) City of Grand Haven (MI) City of Grand Island (NE) City of Grand Junction (IA) City of Grand Marais (MN) City of Granite (OK) City of Granite Falls (MN) City of Green Cove Springs (FL)

Appendix G: FERC Survey Respondents
Assessment of Demand Response and Advanced Metering Federal Energy Regulatory Commission
G-3
Municipally Owned Utilities (Cont’d)
City of Greendale (IN) City of Greenfield (IA) City of Greensburg (KS) City of Groton (SD) City of Guttenberg (IA) City of Hallettsville (TX) City of Halstad (MN) City of Hannibal (MO) City of Harrisonburg (VA) City of Hart Hydro (MI) City of Hartley (IA) City of Hastings (NE) City of Haven (KS) City of Hawarden (IA) City of Hebron (NE) City of Hecla (SD) City of Helper (UT) City of Hempstead (TX) City of Henning (MN) City of Hermann (MO) City of Hermiston (OR) City of Heyburn (ID) City of Hickman (NE) City of Higginsville (MO) City of Highland (IL) City of Highlands (NC) City of Hill City (KS) City of Hinton (IA) City of Holland (MI) City of Holton (KS) City of Holyoke (MA) City of Holyrood (KS) City of Homestead (FL) City of Hominy (OK) City of Hope (AR) City of Hopkinton (IA) City of Horton (KS) City of Houston (MO) City of Howard (SD) City of Hubbard (OH) City of Hudson (OH) City of Hudson (IA) City of Hugoton (KS) City of Hunnewell (MO) City of Imperial (NE) City of Independence (MO) City of Independence (IA) City of Indianola (NE) City of Iola (KS) City of Jackson (MO) City of Jackson (MN)
City of Jackson (GA) City of Jackson (TN) City of Jacksonville Beach (FL) City of Jasper (IN) City of Jetmore (KS) City of Jewett City (CT) City of Jonesville (LA) City of Kansas City (KS) City of Kaukauna (WI) City of Kiel (WI) City of Kimball (NE) City of Kimballton (IA) City of King Cove (AK) City of Kingman (KS) City of Kings Mountain (NC) City of Kinston (NC) City of Kirkwood (MO) City of Kotlik (AK) City of La Crosse (KS) City of La Grange (GA) City of La Junta (CO) City of Lafayette (AL) City of Lafayette (LA) City of LaFayette (GA) City of Lake Crystal (MN) City of Lake Mills (IA) City of Lake View (IA) City of Lake Worth (FL) City of Lakeland (FL) City of Lakin (KS) City of Lamar (MO) City of Lamar (CO) City of Lamoni (IA) City of Lampasas (TX) City of Lanett (AL) City of Lansing (MI) City of Las Animas (CO) City of Laurel (NE) City of Laurens (IA) City of Laurens (SC) City of Laurinburg (NC) City of Lawrenceville (GA) City of Lebanon (MO) City of Lebanon (IN) City of Lebanon (OH) City of Leesburg (FL) City of Lewes (DE) City of Lexington (OK) City of Lexington (NE) City of Lexington (TX) City of Liberal (MO)
City of Lincoln Center (KS) City of Lindsborg (KS) City of Linton (IN) City of Livingston (TX) City of Lodi (CA) City of Lodi (WI) City of Logan (UT) City of Logansport (IN) City of Lompoc (CA) City of Long Grove (IA) City of Los Angeles (CA) City of Lowell (MI) City of Lubbock (TX) City of Luverne (MN) City of Mabel (MN) City of Macon (MO) City of Maddock (ND) City of Madelia (MN) City of Madison (NE) City of Madison (SD) City of Malden (MO) City of Mangum (OK) City of Manitou (OK) City of Mankato (KS) City of Mansfield (MO) City of Mansfield (GA) City of Manti (UT) City of Maquoketa (IA) City of Marietta (GA) City of Marion (KS) City of Marshall (MO) City of Marshall (IL) City of Marshall (MN) City of Marshall (MI) City of Martinsville (VA) City of Mascoutah (IL) City of Mason (TX) City of McCleary (WA) City of McGregor (IA) City of McLaughlin (SD) City of McLeansboro (IL) City of McPherson (KS) City of Medford (WI) City of Memphis (MO) City of Menasha (WI) City of Mendon (OH) City of Mesa (AZ) City of Metropolis (IL) City of Milford (DE) City of Milford (IA) City of Milton (WA)

Appendix G: FERC Survey Respondents
Assessment of Demand Response and Advanced Metering Federal Energy Regulatory Commission
G-4
Municipally Owned Utilities (Cont’d) City of Milton-Freewater (OR) City of Minden (LA) City of Mishawaka (IN) City of Mitchell (NE) City of Monroe (UT) City of Monroe (NC) City of Monroe City (MO) City of Montezuma (IA) City of Montezuma (KS) City of Moorhead (MN) City of Mora (MN) City of Moran (KS) City of Morgan City (UT) City of Morrill (KS) City of Mount Vernon (MO) City of Mountain Iron (MN) City of Mountain Lake (MN) City of Mountain View (MO) City of Mt Pleasant (IA) City of Mulberry (KS) City of Mulvane (KS) City of Murray (UT) City of Muscoda (WI) City of Muscotah (KS) City of Naperville (IL) City of Nebraska City (NE) City of Needles (CA) City of Neodesha (KS) City of Neola (IA) City of New Braunfels (TX) City of New Hampton (IA) City of New Holstein (WI) City of New Lisbon (WI) City of New Martinsville (WV) City of New Richmond (WI) City of New Smyrna Beach (FL) City of Newberry (FL) City of Newburg (MO) City of Newfolden (MN) City of Newkirk (OK) City of Newton (IL) City of Nielsville (MN) City of Niles (MI) City of Nixa (MO) City of North Little Rock (AR) City of North St Paul (MN) City of Northwood (ND) City of Norway (MI) City of Norwood (MA) City of Oakley (KS) City of Oberlin (KS) City of Odessa (MO)
City of Ogden (IA) City of Oglesby (IL) City of Orange City (IA) City of Orangeburg (SC) City of Orrville (OH) City of Ortonville (MN) City of Osage (IA) City of Osborne (KS) City of Ouzinkie (AK) City of Owatonna (MN) City of Owensboro (KY) City of Oxford (KS) City of Painesville (OH) City of Palmetto (GA) City of Palmyra (MO) City of Palo Alto (CA) City of Paris (MO) City of Parker (SD) City of Paullina (IA) City of Pawhuska (OK) City of Peabody (MA) City of Pella (IA) City of Perry (MO) City of Perry (OK) City of Petoskey (MI) City of Piggott (AR) City of Piqua (OH) City of Plankinton (SD) City of Plattsburgh (NY) City of Plymouth (WI) City of Pocahontas (IA) City of Pomona (KS) City of Poplar Bluff (MO) City of Port Angeles (WA) City of Portland (MI) City of Powell (WY) City of Pratt (KS) City of Preston (IA) City of Princeton (IL) City of Pryor (OK) City of Radford (VA) City of Randall (MN) City of Rayne (LA) City of Red Bud (IL) City of Red Cloud (NE) City of Redding (CA) City of Remsen (IA) City of Rensselaer (IN) City of Renwick (IA) City of Rich Hill (MO) City of Richland (WA) City of Richland (MO)
City of Richland Center (WI) City of Richmond (IN) City of Rising Sun (IN) City of River Falls (WI) City of Riverside (CA) City of Robertsdale (AL) City of Robinson (KS) City of Rockport (MO) City of Rocky Mount (NC) City of Rolla (MO) City of Roodhouse (IL) City of Roseville (CA) City of Rushmore (MN) City of Sabetha (KS) City of Saint Peter (MN) City of Salamanca (NY) City of Salem (VA) City of Salisbury (MO) City of Sallisaw (OK) City of San Antonio (TX) City of San Saba (TX) City of Sanborn (IA) City of Sandersville (GA) City of Sargent (NE) City of Savonburg (KS) City of Schuyler (NE) City of Scribner (NE) City of Seaford (DE) City of Seattle (WA) City of Seguin (TX) City of Seneca (KS) City of Sergeant Bluff (IA) City of Seward (NE) City of Seymour (TX) City of Shasta Lake (CA) City of Sheboygan Falls (WI) City of Shelby (OH) City of Shelly (MN) City of Shiner (TX) City of Shullsburg (WI) City of Sikeston (MO) City of Sioux Center (IA) City of Sioux Falls (SD) City of Slater (MO) City of Snyder (NE) City of Soda Springs (ID) City of South Norwalk (CT) City of Spencer (NE) City of Springfield (IL) City of Springfield (OR) City of Springville (UT) City of St Clairsville (OH)

Appendix G: FERC Survey Respondents
Assessment of Demand Response and Advanced Metering Federal Energy Regulatory Commission
G-5
Municipally Owned Utilities (Cont’d) City of St George (UT) City of St James (MN) City of St James (MO) City of St John (KS) City of St Martinville (LA) City of St Marys (KS) City of St Marys (OH) City of St Paul (NE) City of Stanhope (IA) City of Stanton (IA) City of Staples (MN) City of Steelville (MO) City of Stephen (MN) City of Stephenson (MI) City of Stockton (KS) City of Story City (IA) City of Stoughton (WI) City of Strawberry Point (IA) City of Stromsburg (NE) City of Stroud (OK) City of Stuart (NE) City of Stuart (IA) City of Sturgeon Bay (WI) City of Sullivan (IL) City of Sutton (NE) City of Syracuse (NE) City of Tallahassee (FL) City of Taunton (MA) City of Tecumseh (NE) City of Thayer (MO) City of Thief River Falls (MN) City of Thorntown (IN) City of Tipton (IA) City of Toronto (KS) City of Traer (IA) City of Trinidad (CO) City of Truth or Consequences (NM) City of Tuskegee (AL) City of Tyler (MN) City of Tyndall (SD) City of Unalaska (AK) City of Union (SC) City of Unionville (MO) City of Vandalia (MO) City of Vermillion (SD) City of Vernon (CA) City of Vero Beach (FL) City of Vineland (NJ) City of Vinton (IA) City of Volga (SD) City of Wadena (MN) City of Wamego (KS)
City of Waseca (MN) City of Washington (GA) City of Washington (NC) City of Washington (KS) City of Waterloo (IL) City of Watertown (NY) City of Wathena (KS) City of Watonga (OK) City of Waynetown (IN) City of Webster City (IA) City of Weimar (TX) City of Weiser (ID) City of Wellington (KS) City of Wells (MN) City of Wessington Springs (SD) City of West Bend (IA) City of West Liberty (IA) City of West Memphis (AR) City of West Point (NE) City of West Point (GA) City of Westby (WI) City of Westerville (OH) City of Whigham (GA) City of White (SD) City of Williamsport (IN) City of Williston (FL) City of Winfield (KS) City of Winthrop (MN) City of Wisner (NE) City of Wood River (NE) City of Worthington (MN) City of Wray (CO) City of Wynnewood (OK) City of Zeeland (MI) City Water and Light Plant (AR) Clarksdale Public Utilities (MS) Clarksville Light & Water Co (AR) Clinton Combined Utility Sys (SC) Coldwater Board of Public Util (MI) Conway Corporation (AR) Corbin City Utilities Comm (KY) Cozad Board of Public Works (NE) Crawfordsville Elec, Lgt & Pwr (IN) Delano Municipal Utilities (MN) East Bay Municipal Util Dist (CA) Easton Utilities Comm (MD) Fairmont Public Utilities Comm (MN) Fairview City Corporation (UT) Fillmore City Corporation (UT) Fitzgerald Wtr Lgt&Bond Com (GA) Flora Utilities (IN) Florence Utility Comm (WI)
Foley Board of Utilities (AL) Fort Pierce Utilities Auth (FL) Glencoe Light & Power Comm (MN) Grafton Electric (IA) Grand Rapids Pub Util Comm (MN) Greenwood Utilities Comm (MS) Groton Dept of Utilities (CT) Grundy Center Mun Light & Power (IA) Hartford Electric (WI) Havana Power & Light Company (FL) Hawley Public Utilities Comm (MN) Heber Light & Power Company (UT) Henderson City Utility Comm (KY) Hillsdale Board of Public Wks (MI) Hooversville Boro Elec Lgt Co (PA) Hurricane Power Committee (UT) Hustisford Utilities (WI) Hutchinson Utilities Comm (MN) Indianola Municipal Utilities (IA) Jacksonville Electric Authority (FL) Jefferson Utilities (WI) Juneau Utility Comm (WI) Kaysville City Corporation (UT) Keewatin Public Utilities (MN) Kenyon Municipal Utilities (MN) Ketchikan Public Utilities (AK) Kissimmee Utility Authority (FL) La Farge Municipal Electric Co (WI) La Porte City Utilities (IA) Lake Mills Light & Water (WI) Lake Placid Village, Inc (NY) Lawrenceburg Municipal Utils (IN) Lehi City Corporation (UT) Lincoln Electric System (NE) Litchfield Public Utilities (MN) Manitowoc Public Utilities (WI) Melrose Public Utilities (MN) Mohawk Municipal Comm (NY) Monroe Water, Light & Gas Comm (GA) Mont Alto Borough (PA) Moose Lake Water & Light Comm (MN) Nashville Electric Service (TN) Nephi City Corporation (UT) New Castle Municipal Serv Comm (DE) New London Electric&Water Util (WI) New Prague Utilities Comm (MN) Newnan Wtr, Sewer & Light Comm (GA) Nome Joint Utility Systems (AK) North Branch Water & Light Comm (MN) North Slope Borough Power & Light (AK) Norwalk Third Taxing District (CT) Oconomowoc Utilities (WI)

Appendix G: FERC Survey Respondents
Assessment of Demand Response and Advanced Metering Federal Energy Regulatory Commission
G-6
Municipally Owned Utilities (Cont’d) Oconto Falls Water & Light Comm (WI) Orlando Utilities Comm (FL) Page Electric Utility (AZ) Paragould Light & Water Comm (AR) Parowan City Corporation (UT) Payson City Corporation (UT) Philippi Municipal Electric (WV) Precinct of Woodsville (NH) Princeton Public Utils Comm (MN) Proctor Public Utilities Comm (MN) Pub Wrks Comm-Fayetteville (NC) PUD No 1 of Asotin County (WA) Raton Public Service Com (NM) Redwood Falls Pub Util Comm (MN) Reedsburg Utility Comm (WI) Rice Lake Utilities (WI) Rochester Public Utilities (MN) Rock Rapids Municipal Utility (IA) Salem City Corporation (UT) Shawano Municipal Utilities (WI) Slinger Utilities (WI) South Vienna Corporation (OH) Spanish Fork City Corporation (UT) Spring City Corporation (UT) Spring Valley Pub Utils Comm (MN) Stillwater Utilities Authority (OK) Sun Prairie Wtr & Light Comm (WI) Tatitlek Electric Utility (AK) Terrebonne Parish Consol Gv't (LA) Texas Municipal Power Agency (TX) Tipton Municipal Electric Util (IN) Town of Advance (IN) Town of Apex (NC) Town of Argos (IN) Town of Ashburnham (MA) Town of Ashland (NH) Town of Avilla (IN) Town of Bainbridge (IN) Town of Basin (WY) Town of Belhaven (MD) Town of Belmont (MA) Town of Black Creek (NC) Town of Bostic (NC) Town of Boyce (LA) Town of Braintree (MA) Town of Braman (OK) Town of Brooklyn (IN) Town of Brookston (IN) Town of Centerville (IN) Town of Chalmers (IN) Town of Chester (MA) Town of Coatesville (IN)
Town of Concord (MA) Town of Culpeper (VA) Town of Enfield (NC) Town of Etna Green (IN) Town of Ferdinand (IN) Town of Fleming (CO) Town of Forest City (NC) Town of Frederick (CO) Town of Front Royal (VA) Town of Groveland (MA) Town of Guernsey (WY) Town of Gueydan (LA) Town of Hardwick (VT) Town of Haxtun (CO) Town of High Point (NC) Town of Hudson (MA) Town of Hull (MA) Town of Huntersville (NC) Town of Jamestown (IN) Town of Knightstown (IN) Town of Laverne (OK) Town of Littleton (NH) Town of Louisburg (NC) Town of Lusk (WY) Town of Lyons (CO) Town of Madison (ME) Town of Maiden (NC) Town of Mannford (OK) Town of Mansfield (MA) Town of Massena (NY) Town of McCormick (SC) Town of Merrimac (MA) Town of Middleborough (MA) Town of Middletown (IN) Town of Middletown (DE) Town of Montezuma (IN) Town of North Attleborough (MA) Town of Oak City (UT) Town of Oak Creek (CO) Town of Paragonah (UT) Town of Pendleton (IN) Town of Pinetops (NC) Town of Pineville (NC) Town of Reading (MA) Town of Readsboro (VT) Town of Rowley (MA) Town of Shrewsbury (MA) Town of Smyrna (DE) Town of South Hadley (MA) Town of South Whitley (IN) Town of Spiceland (IN) Town of Spiro (OK)
Town of Sterling (MA) Town of Stowe (VT) Town of Straughn (IN) Town of Summerfield (KS) Town of Veedersburg (IN) Town of Wakefield (MA) Town of Wakefield (VA) Town of Walstonburg (NC) Town of Waynesville (NC) Town of Welsh (LA) Town of Winamac (IN) Town of Winnsboro (SC) Turlock Irrigation District (CA) Two Rivers Water & Light (WI) Van Buren Light & Power Dist (ME) Village of Andover (NY) Village of Angelica (NY) Village of Arcadia (OH) Village of Arnold (NE) Village of Baraga (MI) Village of Bartley (NE) Village of Belmont (WI) Village of Benton (WI) Village of Bergen (NY) Village of Bethany (IL) Village of Bethel (OH) Village of Black Earth (WI) Village of Boonville (NY) Village of Bradshaw (NE) Village of Brocton (NY) Village of Callaway (NE) Village of Carey (OH) Village of Castile (NY) Village of Chatham (IL) Village of Chelsea (MI) Village of Chester (NE) Village of Clinton (MI) Village of Davenport (NE) Village of Decatur (NE) Village of Deshler (OH) Village of Endicott (NY) Village of Endicott (NE) Village of Enosburg Falls (VT) Village of Fairport (NY) Village of Freeburg (IL) Village of Grafton (OH) Village of Greene (NY) Village of Greenup (IL) Village of Gresham (WI) Village of Hamilton (NY) Village of Hampton (NE) Village of Hazel Green (WI)

Appendix G: FERC Survey Respondents
Assessment of Demand Response and Advanced Metering Federal Energy Regulatory Commission
G-7
Municipally Owned Utilities (Cont’d) Village of Hemingford (NE) Village of Hildreth (NE) Village of Holbrook (NE) Village of Holley (NY) Village of Hyde Park (VT) Village of Jacksonville (VT) Village of Johnson (VT) Village of Lakeview (OH) Village of L'Anse (MI) Village of Little Valley (NY) Village of Lodi (OH) Village of Ludlow (VT) Village of Lyman (NE) Village of Lyndonville (VT) Village of Marshallville (OH) Village of Mayville (NY) Village of Mazomanie (WI) Village of Merrillan (WI) Village of Milan (OH) Village of Minster (OH) Village of Morrisville (VT) Village of Mt Horeb (WI) Village of New Glarus (WI)
Village of Northfield (VT) Village of Orleans (VT) Village of Oxford (NE) Village of Pardeeville (WI) Village of Paw Paw (MI) Village of Pemberville (OH) Village of Philadelphia (NY) Village of Prairie Du Sac (WI) Village of Rantoul (IL) Village of Reynolds (NE) Village of Richmondville (NY) Village of Rockville Centre (NY) Village of Rouses Point (NY) Village of Sauk City (WI) Village of Sherburne (NY) Village of Shickley (NE) Village of Shiloh (OH) Village of Silver Springs (NY) Village of Skaneateles (NY) Village of Spencerport (NY) Village of Springville (NY) Village of Stratford (WI) Village of Swanton (VT)
Village of Talmage (NE) Village of Tontogany (OH) Village of Trempealeau (WI) Village of Tupper Lake (NY) Village of Versailles (OH) Village of Walthill (NE) Village of Waunakee (WI) Village of Wauneta (NE) Village of Waynesfield (OH) Village of Wellsville (NY) Village of Yellow Springs (OH) Wagoner Public Works Authority (OK) Waterloo Light & Water Comm (WI) Watertown Municipal Utilities (SD) Waupun Utilities (WI) Waverly Municipal Elec Utility (IA) Weatherford Mun Utility System (TX) West Point Utility System (IA) Whitehall Electric Utility (WI) Williamstown Utility Comm (KY) Winner Municipal Utility (SD) Wonewoc Electric & Water Util (WI)
Cooperative Utilities (537 Entities) A & N Electric Coop (VA) Adams Electric Coop (IL) Adams Electric Cooperative Inc (PA) Adams Rural Elec Coop, Inc (OH) Adams-Columbia Electric Coop (WI) Aiken Electric Coop Inc (SC) Alabama Electric Coop Inc (AL) Alfalfa Electric Coop, Inc (OK) Alger-Delta Coop Electric Assn (MI) Allamakee-Clayton El Coop, Inc (IA) Allegheny Electric Coop Inc (PA) Altamaha Elec Member Corp (GA) Amicalola Elec Member Corp (GA) Anoka Electric Coop (MN) Appalachian Electric Coop (TN) Arizona Electric Pwr Coop Inc (AZ) Ark Valley Elec Coop Assn, Inc (KS) Arkansas Electric Coop Corp (AR) Arkansas Valley E C Corp (AR) Arrowhead Electric Coop, Inc (MN) Ashley Chicot Elec Coop, Inc (AR) Associated Electric Coop, Inc (MO) Atchison-Holt Electric Coop (MO) Bailey County Elec Coop Assn (TX) Bartholomew Cnty Rural E M C (IN)
Bartlett Electric Coop, Inc (TX) Basin Electric Power Coop (ND) Bayfield Electric Coop, Inc (WI) Beartooth Electric Coop, Inc (MT) Beauregard Electric Coop, Inc (LA) Bedford Rural Elec Coop, Inc (PA) Belfalls Electric Coop, Inc (TX) Beltrami Electric Coop, Inc (MN) Big Bend Electric Coop, Inc (WA) Big Country Electric Coop, Inc (TX) Big Flat Electric Coop Inc (MT) Big Horn Cnty Elec Coop, Inc (MT) Big Horn Rural Electric Co (WY) Big Rivers Electric Corp (KY) Big Sandy REC Corp (KY) Black Hills Electric Coop, Inc (SD) Black River Electric Coop, Inc (SC) Black Warrior Elec Mem Corp (AL) Blue Grass Energy Coop Corp (KY) Blue Ridge Electric Coop Inc (SC) Bluestem Electric Coop Inc (KS) Boone County Rural EMC (IN) Boone Electric Coop (MO) Bowie-Cass Electric Coop, Inc (TX) Brazos Electric Power Coop Inc (TX)
Bridger Valley Elec Assn, Inc (WY) Broad River Electric Coop, Inc (SC) Brown County Rural Elec Assn (MN) Brown-Atchison E C A Inc (KS) Brunswick Electric Member Corp (NC) Buckeye Power, Inc (OH) Buckeye Rural Elec Coop, Inc (OH) Burke-Divide Electric Coop Inc (ND) Butler County Rural Elec Coop (IA) Butler Rural El Coop Assn, Inc (KS) Butler Rural Electric Coop Inc (OH) Butte Electric Coop, Inc (SD) C & L Electric Coop Corp (AR) Caddo Electric Coop, Inc (OK) Calhoun County Elec Coop Assn (IA) Callaway Electric Cooperative (MO) Cam Wal Electric Coop, Inc (SD) Canadian Valley Elec Coop, Inc (OK) Canoochee Electric Member Corp (GA) Cape Hatteras Elec Member Corp (NC) Capital Electric Coop, Inc (ND) Carbon Power & Light, Inc (WY) Carroll Electric Coop, Inc (OH) Carroll Electric Member Corp (GA) Carteret-Craven El Member Corp (NC)

Appendix G: FERC Survey Respondents
Assessment of Demand Response and Advanced Metering Federal Energy Regulatory Commission
G-8
Cooperative Utilities (Cont’d)Cass County Electric Coop Inc (ND) Cass Electric Coop (IA) Central Alabama Electric Coop (AL) Central Electric Coop Inc (OR) Central Electric Coop, Inc (PA) Central Electric Coop, Inc (SD) Central Electric Mem Corp (NC) Central Electric Power Coop (MO) Central Electric Pwr Coop, Inc (SC) Central Florida Elec Coop, Inc (FL) Central Iowa Power Cooperative (IA) Central New Mexico EC, Inc (NM) Central Rural Elec Coop, Inc (OK) Central Valley Elec Coop, Inc (NM) Central Virginia Electric Coop (VA) Chariton Valley Elec Coop, Inc (IA) Charles Mix Electric Assn, Inc (SD) Cherryland Electric Coop Inc (MI) Chippewa Valley Electric Coop (WI) Choctawhatche Elec Coop, Inc (FL) Choptank Electric Coop, Inc (MD) Chugach Electric Assn Inc (AK) City of Salem (OR) Clark County Rural E M C (IN) Clark Energy Coop Inc (KY) Clarke Electric Coop Inc (IA) Claverack Rural Elec Coop Inc (PA) Clay County Elec Coop Corp (AR) Clay Electric Cooperative, Inc (FL) Clearwater Power Company (ID) Clearwater-Polk Elec Coop Inc (MN) Cloverland Electric Co-op (MI) Coahoma Electric Power Assn (MS) Coastal Electric Coop, Inc (SC) Coastal Electric Member Corp (GA) Cobb Electric Membership Corp (GA) Codington-Clark Elec Coop, Inc (SD) Coleman County E C, Inc (TX) Coles-Moultrie Electric Coop (IL) Colquitt Electric Mem Corp (GA) Columbia Basin Elec Coop., Inc (OR) Columbia Power Coop Assn Inc (OR) Columbus Electric Coop, Inc (NM) Comanche Cnty E C Assn (TX) Community Electric Coop (VA) Co-Mo Electric Coop Inc (MO) Concho Valley Elec Coop Inc (TX) Consolidated Electric Coop (MO) Consolidated Electric Coop Inc (OH)
Consumers Energy (IA) Consumers Power, Inc (OR) Continental Divide El Coop Inc (NM) Cooke County Elec Coop Assn (TX) Cookson Hills Elec Coop, Inc (OK) Coop L&P Assn Lake Cnty (MN) Coosa Valley Electric Coop Inc (AL) Coos-Curry Electric Coop, Inc (OR) Copper Valley Elec Assn, Inc (AK) Cordova Electric Coop, Inc (AK) Corn Belt Energy Corporation (IL) Corn Belt Power Coop (IA) Coweta-Fayette El Mem Corp (GA) Craig-Botetourt Electric Coop (VA) Crow Wing Coop Pwr&Lght Co (MN) Cuivre River Electric Coop Inc (MO) Cumberland Valley Rural E C C (KY) Dairyland Power Coop (WI) Dakota Electric Association (MN) Dakota Energy Coop Inc (SD) Dakota Valley Elec Coop Inc (ND) Daviess Martin County R E M C (IN) Deaf Smith Electric Coop, Inc (TX) Decatur County Rural E M C (IN) Delaware Cnty Elec Coop Inc (NY) Delaware Electric Cooperative (DE) Denton County Elec Coop, Inc (TX) Deseret Gen & Tran Coop (UT) Diverse Power Incorporated (GA) Dixie Electric Coop (AL) Dixie Electric Power Assn (MS) Dixie Escalante R E A, Inc (UT) Douglas Electric Coop, Inc (SD) Douglas Electric Coop, Inc (OR) Dubois Rural Electric Coop Inc (IN) Duncan Valley Elec Coop, Inc (AZ) East Central OK Elec Coop Inc (OK) East Kentucky Power Coop, Inc (KY) East River Elec Pwr Coop, Inc (SD) East Texas Electric Coop, Inc (TX) East-Central Iowa REC (IA) Eastern Illinois Elec Coop (IL) Eastern Iowa Light & Pwr Coop (IA) Eau Claire Electric Coop (WI) Edisto Electric Coop, Inc (SC) Egyptian Electric Coop Assn (IL) Elmhurst Mutual Pwr&Light Co (WA) EnergyUnited EMC (NC) Excelsior Electric Mem Corp (GA)
Fairfield Electric Coop, Inc (SC) Fannin County Electric Coop (TX) Farmers Electric Company, Ltd (ID) Farmers Electric Coop Corp (AR) Farmers Electric Coop, Inc (IA) Farmers Electric Coop, Inc (TX) Farmers' Electric Coop, Inc (NM) Farmers' Electric Coop, Inc (MO) Farmers Mutual Electric Co (IL) Farmers Rural Electric Coop Corp (KY) Federated Rural Electric Assn (MN) First Electric Coop Corp (AR) Flathead Electric Coop Inc (MT) Fleming-Mason Energy Coop Inc (KY) Flint Electric Membership Corp (GA) Flint Hills Rural E C A, Inc (KS) Florida Keys El Coop Assn, Inc (FL) Fort Belknap Electric Coop Inc (TX) Fox Islands Electric Coop, Inc (ME) Franklin Rural Electric Cooperative (IA) French Broad Elec Member Corp (NC) Frontier Power Company (OH) Fulton County Rural E M C (IN) Garkane Energy Coop, Inc (UT) Gascosage Electric Coop (MO) Georgia Transmission Corp (GA) Glidden Rural Electric Coop (IA) Golden Spread Elec Coop, Inc (TX) Golden Valley Elec Assn Inc (AK) Goldenwest Electric Coop, Inc (MT) Graham County Electric Coop Inc (AZ) Grand Electric Coop, Inc (SD) Grand Valley Rrl Pwr Line, Inc (CO) Grayson Rural Electric Coop Corp (KY) Great Lakes Energy Coop (MI) Great River Energy (MN) GreyStone Power Corporation (GA) Grundy County Rural Elec Coop (IA) Grundy Electric Coop, Inc (MO) Guernsey-Muskingum El Coop Inc (OH) Gunnison County Elec Assn. (CO) Guthrie County Rural E C A (IA) Habersham Electric Membership Corp (GA) Hamilton County Elec Coop Assn (TX) Hancock County Rural E M C (IN) Harkers Island El Member Corp (NC) Harrison County Rrl Elec Coop (IA) Hart Electric Member Corp (GA) Haywood Electric Member Corp (NC)

Appendix G: FERC Survey Respondents
Assessment of Demand Response and Advanced Metering Federal Energy Regulatory Commission
G-9
Cooperative Utilities (Cont’d)H-D Electric Coop Inc (SD) Heartland Power Coop (IA) Heartland Rural Elec Coop, Inc (KS) Henry County Rural E M C (IN) High Plains Power Inc (WY) High West Energy, Inc (WY) Highline Electric Assn (CO) HILCO Electric Coop, Inc. (TX) Hill County Electric Coop, Inc (MT) Holmes-Wayne Elec Coop Inc (OH) Hood River Electric Coop (OR) Hoosier Energy R E C, Inc (IN) Horry Electric Coop Inc (SC) Houston County Elec Coop Inc (TX) Howell-Oregon Elec Coop, Inc (MO) Humboldt County R E C (IA) Idaho Cnty L&P Coop Assn, Inc (ID) Illinois Rural Electric Coop (IL) Inland Power & Light Company (WA) Inter County Energy Coop Corp (KY) Intercounty Electric Coop Assn (MO) Intermountain Rural Elec Assn (CO) Iowa Lakes Electric Coop (IA) Irwin Electric Membership Corp (GA) Jackson County Rural E M C (IN) Jackson Electric Coop, Inc (WI) Jackson Electric Member Corp (GA) Jackson Energy Coop Corp (KY) Jackson Purchase Energy Corp (KY) Jasper County Rural E M C (IN) Jasper-Newton Elec Coop, Inc (TX) Jefferson Davis Elec Coop, Inc (LA) Jefferson Electric Mem Corp (GA) Jemez Mountains E C, Inc (NM) Johnson County Rural E M C (IN) Jump River Electric Coop Inc (WI) K C Electric Association (CO) KAMO Electric Coop Inc (OK) Kansas Electric Pwr Coop Inc (KS) Karnes Electric Coop Inc (TX) Kauai Island Utility Cooperative (HI) Kay Electric Coop (OK) KEM Electric Coop Inc (ND) Kenergy Corp (KY) Kiamichi Electric Coop, Inc (OK) Kingsbury Electric Coop, Inc (SD) Kiwash Electric Coop, Inc (OK) Kodiak Electric Assn Inc (AK) Kootenai Electric Coop Inc (ID)
Kotzebue Electric Assn Inc (AK) L & O Power Co-operative (IA) La Plata Electric Assn, Inc (CO) Laclede Electric Coop, Inc (MO) LaCreek Electric Assn, Inc (SD) Lake Region Coop Elec Assn (MN) Lake Region Electric Assn, Inc (SD) Lakeview Light & Power (WA) Lamar County Elec Coop Assn (TX) Lamar Elec Membership Corp (GA) Lane Electric Coop Inc (OR) Lane-Scott Electric Coop, Inc (KS) Laurens Electric Coop, Inc (SC) Lea County Electric Coop, Inc (NM) Leavenworth-Jefferson E C, Inc (KS) Lee County Electric Coop, Inc (FL) Licking Rural Electric Inc (OH) Lighthouse Electric Coop, Inc (TX) Lincoln Electric Coop, Inc (MT) Linn County Rural E C A (IA) Little Ocmulgee El Mem Corp (GA) Lower Yellowstone R E A, Inc (MT) Lumbee River Elec Mem Corp (NC) Lynches River Elec Coop, Inc (SC) Lyon-Coffey Electric Coop, Inc (KS) Lyon-Lincoln Electric Coop Inc (MN) Macon Electric Coop (MO) Magic Valley Electric Coop Inc (TX) Magnolia Electric Power Assn (MS) Maquoketa Valley Rrl Elec Coop (IA) Marias River Electric Coop Inc (MT) Marlboro Electric Coop, Inc (SC) McCone Electric Coop Inc (MT) McDonough Power Coop (IL) McKenzie Electric Coop Inc (ND) McLean Electric Coop, Inc (ND) McLeod Cooperative Pwr Assn (MN) Meade County Rural E C C (KY) Mecklenburg Electric Coop, Inc (VA) Medina Electric Coop, Inc (TX) Menard Electric Coop (IL) Miami-Cass County Rural EMC (IN) Mid-Carolina Electric Coop Inc (SC) Middle Georgia El Mem Corp (GA) Middle Kuskokwim E C Inc (AK) Middle Tennessee E M C (TN) Midland Power Coop (IA) Mid-Ohio Energy Coop, Inc (OH) Midstate Electric Coop, Inc (OR)
Midwest Electric, Inc (OH) Midwest Energy Cooperative (MI) Midwest Energy Inc (KS) Mid-Yellowstone Elec Coop, Inc (MT) Mille Lacs Electric Coop (MN) Minn Valley Coop L&P Assn (MN) Minnesota Valley Electric Coop (MN) Minnkota Power Coop, Inc (ND) Missouri Rural Electric Coop (MO) Modern Electric Water Company (WA) Monroe County Elec Coop, Inc (IL) Moon Lake Electric Assn Inc (UT) Mora-San Miguel Elec Coop, Inc (NM) Morgan County Rural Elec Assn (CO) Mt Wheeler Power, Inc (NV) N W Electric Power Coop, Inc (MO) Navasota Valley Elec Coop, Inc (TX) Navopache Electric Coop, Inc (AZ) Nemaha-Marshall E C A, Inc (KS) Nespelem Valley Elec Coop, Inc (WA) New Enterprise R E C, Inc (PA) New Horizon Electric Coop, Inc (SC) Newberry Electric Coop, Inc (SC) NewCorp Resources El Coop Inc (TX) New-Mac Electric Coop, Inc (MO) Ninnescah Rural E C A Inc (KS) Niobrara Electric Assn, Inc (WY) Noble County R E M C (IN) Nobles Cooperative Electric (MN) Nodak Electric Coop Inc (ND) Nolin Rural Electric Coop Corp (KY) Norris Electric Coop (IL) North Arkansas Elec Coop, Inc (AR) North Carolina El Member Corp (NC) North Central Elec Coop, Inc (ND) North Plains Electric Coop Inc (TX) North Star Electric Coop, Inc (MN) North West Rural Electric Coop (IA) Northeast Missouri El Pwr Coop (MO) Northeast Oklahoma Electric Coop, Inc (OK) Northern Electric Coop, Inc (MT) Northern Neck Elec Coop, Inc (VA) Northern Rio Arriba E Coop Inc (NM) Northern Virginia Elec Coop (VA) Northwest Iowa Power Coop (IA) Northwestern Rural E C A, Inc (PA) Oakdale Electric Coop (WI) Ocmulgee Electric Member Corp (GA) Oglethorpe Power Corporation (GA)

Appendix G: FERC Survey Respondents
Assessment of Demand Response and Advanced Metering Federal Energy Regulatory Commission
G-10
Cooperative Utilities (Cont’d)Ohop Mutual Light Company, Inc (WA) Okanogan County Elec Coop, Inc (WA) Okefenoke Rural El Member Corp (GA) Oklahoma Electric Coop Inc (OK) Oliver-Mercer Elec Coop Inc (ND) Oneida-Madison Elec Coop, Inc (NY) Ontonagon County R E A (MI) Oregon Trail El Cons Coop,Inc (OR) Osceola Electric Coop, Inc (IA) Otsego Electric Coop, Inc (NY) Owen Electric Coop Inc (KY) Ozark Electric Coop Inc (MO) Ozarks Electric Coop Corp (AR) P K M Electric Coop, Inc (MN) Park Electric Coop Inc (MT) Parke County Rural E M C (IN) Parkland Light & Water Co (WA) Peace River Electric Coop, Inc (FL) Pedernales Electric Coop, Inc (TX) Pee Dee Electric Coop, Inc (SC) Pee Dee Elec Member Corp (NC) Pella Cooperative Elec Assn (IA) Pemiscot-Dunklin E C Inc (MO) Peninsula Light Company (WA) People's Cooperative Services (MN) People's Electric Cooperative (OK) Petit Jean Electric Coop Corp (AR) Piedmont Elec Member Corp (NC) Pierce-Pepin Coop Services (WI) Pioneer Electric Coop, Inc (KS) Pioneer Rural Elec Coop, Inc (OH) Planters Electric Member Corp (GA) Pointe Coupee Elec Mem Corp (LA) Polk-Burnett Electric Coop (WI) Poudre Valley R E A, Inc (CO) Powder River Energy Corp (WY) Prairie Land Electric Coop Inc (KS) Presque Isle Elec & Gas Coop (MI) Price Electric Coop Inc (WI) Radiant Electric Coop, Inc (KS) Ralls County Electric Coop (MO) Randolph Elec Member Corp (NC) Rappahannock Electric Coop (VA) Ravalli County Elec Coop, Inc (MT) Rayburn Cntry Elec Coop, Inc (TX) REA Energy Coop Inc (PA) Redwood Electric Coop (MN) Rich Mountain Elec Coop, Inc (AR) Richland Electric Coop (WI)
Rita Blanca Electric Coop, Inc (TX) Rolling Hills Electric Coop (KS) Roosevelt Cnty Elec Coop Inc (NM) Rosebud Electric Coop Inc (SD) Runestone Electric Assn (MN) Rusk County Electric Coop, Inc (TX) Sac County Rural Electric Coop (IA) Sac-Osage Electric Coop Inc (MO) Salt River Electric Coop Corp (KY) Saluda River Electric Coop Inc (SC) Sam Rayburn G&T E C Inc (TX) San Luis Valley R E C, Inc (CO) San Miguel Electric Coop, Inc (TX) San Miguel Power Assn, Inc (CO) Sand Mountain Electric Coop (AL) Satilla Rural Elec Mem Corp (GA) SE-MA-NO Electric Coop (MO) Seminole Electric Coop, Inc (FL) SEMO Electric Cooperative (MO) Shelby Electric Coop, Inc (IL) Shelby Energy Co-op, Inc (KY) Sheridan Electric Coop, Inc (MT) Sho-Me Power Electric Coop (MO) Singing River Elec Pwr Assn (MS) Slash Pine Elec Member Corp (GA) Smarr EMC (GA) Snapping Shoals El Mem Corp (GA) Somerset Rural Elec Coop, Inc (PA) South Central Ark El Coop, Inc (AR) South Central Indiana REMC (IN) South Kentucky R E C Corp (KY) Southeast Colorado Pwr Assn (CO) Southeastern IL Elec Coop, Inc (IL) Southern Illinois Elec Coop (IL) Southern Iowa Elec Coop, Inc (IA) Southern Maryland E C Inc (MD) Southern Pine Elec Coop, Inc (AL) Southside Electric Coop, Inc (VA) Southwest Electric Coop, Inc (MO) Southwest Louisiana E M C (LA) Southwest Texas E C, Inc (TX) Southwestern Electric Coop Inc (IL) Southwestern Elec Coop Inc (NM) Square Butte Electric Coop (ND) Steuben Rural Elec Coop, Inc (NY) Sullivan County R E C, Inc (PA) Sumter Electric Coop, Inc (FL) Sumter Electric Member Corp (GA) Sun River Electric Coop, Inc (MT)
Sussex Rural Electric Coop Inc (NJ) Suwannee Valley E C Inc (FL) Swans Island Electric Coop Inc (ME) Swisher Electric Coop, Inc (TX) T I P Rural Electric Coop (IA) Tallapoosa River Elec Coop Inc (AL) Taylor County Rural E C C (KY) Taylor Electric Coop (WI) Tex-La Electric Coop-Texas Inc (TX) The Energy Cooperative (PA) Three Notch Elec Member Corp (GA) Tipmont Rural Elec Mem Corp (IN) Traverse Electric Coop, Inc (MN) Trico Electric Cooperative Inc (AZ) Tri-County Electric Coop (MN) Tri-County Electric Coop Assn (MO) Tri-County Electric Coop, Inc (FL) Tri-County Electric Coop, Inc (IL) Tri-County Electric Coop, Inc (TX) Tri-County Rural Elec Coop Inc (PA) Twin Valley Electric Coop Inc (KS) Umatilla Electric Coop Assn (OR) Unalakleet Valley Elec Coop (AK) United Electric Coop Service Inc (TX) United Electric Coop, Inc (MO) United Electric Coop, Inc (PA) United Electric Co-op, Inc (ID) Upper Missouri G&T El Coop Inc (MT) Upshur Rural Elec Coop Corp (TX) Upson Elec Member Corp (GA) Valley Electric Assn, Inc (NV) Valley Electric Coop, Inc (MT) Valley Rural Electric Coop Inc (PA) Verdigris Valley Elec Coop Inc (OK) Verendrye Electric Coop Inc (ND) Vermont Electric Cooperative, Inc. (VT) Vigilante Electric Coop, Inc (MT) Wabash County Rural E M C (IN) Walton Electric Member Corp (GA) Warren County Rural E M C (IN) Warren Electric Coop Inc (PA) Washington Elec Member Corp (GA) Washington Electric Coop Inc (VT) Washington-St Tammany E C, Inc (LA) Webster Electric Coop (MO) West Central Electric Coop Inc (SD) West Florida El Coop Assn, Inc (FL) West Oregon Electric Coop Inc (OR) West River Electric Assn Inc (SD)

Appendix G: FERC Survey Respondents
Assessment of Demand Response and Advanced Metering Federal Energy Regulatory Commission
G-11
Cooperative Utilities (Cont’d)Western Coop Electric Assn Inc (KS) Western Farmers Elec Coop, Inc (OK) Western Illinois Elec Coop (IL) Western Indiana Energy REMC (IN) Western Iowa Power Coop (IA) Wheatland Electric Coop, Inc (KS) Wheatland R E A, Inc (WY)
White County Rural E M C (IN) White River Electric Assn, Inc (CO) White River Valley El Coop Inc (MO) Whitewater Valley Rural EMC (IN) Wild Rice Electric Coop, Inc (MN) Willwood Light & Power Co (WY) Withlacoochee River Elec Coop (FL)
Wolverine Pwr Supply Coop,Inc (MI) Wood County Elec Coop, Inc (TX) Woodruff Electric Coop Corp (AR) Wyrulec Company (WY) Yazoo Valley Elec Power Assn (MS) Yellowstone Valley Elec Co-op Inc. (MT) York Electric Coop Inc (SC)
Investor Owned Utilities (203 Entities)AEP Generating Company (OH) AEP Texas Central Company (OH) AEP Texas North Company (OH) AGC Division of APG Inc (IN) Ajo Improvement Co (AZ) Alabama Power Co (AL) Alaska Electric Light&Pwr Co (AK) Alaska Power Co (WA) Allegheny Generating Co (PA) Alpena Power Co (MI) Amana Society Service Co (IA) Andreanof Electric Corp (AK) Aniak Light & Power Co Inc (AK) Appalachian Power Co (OH) Aquila Inc (MO) Arizona Public Service Co (AZ) Atlantic City Electric Co (DE) Avista Corp (WA) Baltimore Gas & Electric Co (MD) Bangor Hydro-Electric Co (ME) Bethel Utilities Corp (AK) Black Diamond Power Co (WV) Black Hills Power Inc (SD) Block Island Power Co (RI) Boston Edison Co (MA) Cambridge Electric Light Co (MA) CenterPointEnrgy HoustonElec (TX) Central Electric Inc (AK) Central Hudson G&E Corp (NY) Central Illinois Light Co (MO) Central Illinois Pub Serv Co (IL) Central Maine Power Co (ME) Central Vermont PubServ Corp (VT) Chitina Electric Inc (AK) Cincinnati Gas & Electric Co (OH) Citizens Electric Co (PA) Cleco Power LLC (LA) Cleveland Electric Illum Co (OH) Columbus Southern Power Co (OH) Commonwealth Edison Co (IL) Commonwealth Electric Co (MA) Connecticut Light & Power Co (CT) Consolidated Edison Co-NYInc (NY)
Consolidated Water Power Co (WI) Consumers Energy Co (MI) Dahlberg Light & Power Co (WI) Dayton Power & Light Co (OH) Delmarva Power (DE) Detroit Edison Co (MI) Duke Power Co (NC) Duquesne Light Co (PA) Edison Sault Electric Co (MI) Egegik Light & Power Co (AK) El Paso Electric Co (TX) Electric Energy Inc (IL) Elk Power Co (WV) Elkhorn Public Service Co (WV) Empire District Electric Co (MO) Entergy Arkansas Inc (AR) Entergy Gulf States Inc (TX) Entergy Louisiana Inc (LA) Entergy Mississippi Inc (MS) Entergy New Orleans Inc (LA) Entergy Power, Inc (AR) Fale-Safe, Inc (OR) Fishers Island Utility Co Inc (NY) Fitchburg Gas & Elec Light Co (NH) Florida Power & Light Co (FL) Florida Public Utilities Co (FL) Georgia Power Co (GA) Granite State Electric Co (NH) Green Mountain Power Corp (VT) Gulf Power Co (FL) Gustavus Electric Inc (AK) Gwitchyaa Zhee Utility Co (AK) Hawaii Electric Light Co Inc (HI) Hawaiian Electric Co Inc (HI) Holyoke Power & Electric Co (MA) Holyoke Water Power Co (MA) Idaho Power Co (ID) Illinois Power Co (MO) Indiana Michigan Power Co (OH) Indiana-Kentucky Elec Corp (OH) Indianapolis Power & Light Co (IN) Interstate Power and Light Co (IA) Jersey Central Power & Lt Co (OH)
Kansas City Power & Light Co (MO) Kansas Gas & Electric Co (KS) Kentucky Power Co (OH) Kentucky Utilities Co (KY) KeySpan Generation LLC (NY) Kimball Light and Water Co (WV) Kingsport Power Co (OH) Kuiggluum Kallugvia (AK) Lockhart Power Co (SC) Louisville Gas & Electric Co (KY) Madison Gas & Electric Co (WI) Maine Public Service Co (ME) Manley Utility Co Inc (AK) Massachusetts Electric Co (MA) Maui Electric Co Ltd (HI) MDU Resources Group Inc (ND) Metropolitan Edison Co (OH) Miami Power Corporation (OH) MidAmerican Energy Co (IA) Minnesota Power Inc (MN) Mississippi Power Co (MS) Monongahela Power Co (PA) Morenci Water and Electric Co (AZ) Mt Carmel Public Utility Co (IL) Nantucket Electric Co (MA) Napakiak Ircinraq Power Co (AK) Nevada Power Co (NV) New England Elec Transm'n Corp (NH) New England Hydro-Tran Elec Co (MA) New England Hydro-Trans Corp (NH) New England Power Company (MA) New York State Elec & Gas Corp (NY) Niagara Mohawk Power Corp. (NY) North Central Power Co Inc (WI) Northern Indiana Pub Serv Co (IN) Northern States Power Co (WI) Northern States Power Co (MN) NorthWestern Energy (SD) NorthWestern Energy LLC (MT) Northwestern Wisconsin Elec Co (WI) Ohio Edison Co (OH) Ohio Power Co (OH) Ohio Valley Electric Corp (OH)

Appendix G: FERC Survey Respondents
Assessment of Demand Response and Advanced Metering Federal Energy Regulatory Commission
G-12
Investor Owned Utilities (Cont’d)Oklahoma Gas & Electric Co (OK) Omya Inc (VT) Orange & Rockland Utils Inc (NY) Otter Tail Power Co (MN) Pacific Gas & Electric Co (CA) PacifiCorp (OR) PECO Energy Co (PA) Pelican Utility (AK) Pennsylvania Electric Co (OH) Pennsylvania Power Co (OH) Pike County Light & Power Co (PA) Pioneer Power and Light Co (WI) Portland General Electric Co (OR) Potomac Electric Power Co (DC) PPL Electric Utilities Corp (PA) Progress Energy Carolinas (NC) Progress Energy Florida (FL) PSI Energy Inc (IN) Public Service Co of NH (NH) Public Service Co of NM (NM) PublicService Co of Oklahoma (OH) Public Service Elec & Gas Co (NJ) Puget Sound Energy Inc (WA) Redlands Water & Power Co (CO) Rochester Elec Lgt and Power (VT)
Rochester Gas & Electric Corp (NY) Rockland Electric Co (NY) Safe Harbor Water Power Corp (PA) San Diego Gas & Electric Co (CA) Savannah Electric & Power Co (GA) Sharyland Utilities LP (TX) Sierra Pacific Power Co (NV) South Beloit Wtr Gas & Elec (WI) South Carolina Gen Co, Inc (SC) Southern California Edison Co (CA) Southern California Water Co (CA) Southern Electric Gen Co (AL) Southern Indiana Gas&Elec Co (IN) Southwestern Elec Power Co (OH) Strawberry Water Users Assn (UT) Superior Water, Light & Pwr Co (WI) System Energy Resources, Inc (MS) Tampa Electric Co (FL) Tanana Power Co Inc (AK) The Narragansett Electric Co (RI) The Potomac Edison Co (PA) The Toledo Edison Co (OH) TransCanadaPwr Div-Engy Ltd (CN) Tucson Electric Power Co (AZ) TXU Electric Delivery Company (TX)
UGI Utilities, Inc (PA) Union Electric Co (MO) Union Light, Heat & Power Co (OH) Union Power Co (WV) United Illuminating Co (CT) United Light and Power Co (WV) Unitil Energy Systems (NH) Upper Peninsula Power Co (MI) Vermont Electric Power Co, Inc (VT) Vermont Electric Trans Co Inc (VT) Vermont Yankee Nucl Pwr Corp (VT) Virginia Electric & Power Co (VA) War Light and Power Co (WV) Wellsborough Electric Co (PA) West Penn Power Co (PA) Westar Energy Inc (KS) Western Massachusetts Elec Co (MA) Westfield Electric Co (WI) Wheeling Power Co (OH) Wisconsin Electric Power Co (WI) Wisconsin Power & Light Co (WI) Wisconsin Public Service Corp (WI) Wisconsin River Power Company (WI) York Haven Power Company (OH)
Power Marketers (74 Entities) Agway Energy Services, LLC (NY) Ameren Energy Marketing (MO) APS Energy Services (AZ) Aquila Energy Marketing Corp (MO) Cargill Power Markets LLC (MN) CECG Maine, LLC (MD) Cirro Corporation (TX) CL Power Sales Eight LLC (CA) CL Power Sales Nine LLC (CA) CL Power Sales Seven LLC (MA) CL Power Sales Ten LLC (CA) CL Power Sales Two LLC (CA) CMS Marketing, Serv&Trd Co (MI) Competitive Engy Serv, LLC (ME) ConocoPhillips Company (TX) Consolidated Edison Sol Inc (NY) Constellation NewEnergy, Inc (MD) Constellation Enrgy Comdties (MD) Coral Power LLC (TX) CP Pwr Sales Seventeen LLC (MA) CPL Retail Energy, LP (TX) Direct Energy, LP (TX) Dominion Energy Marketing (VA) Dominion Retail Inc (VA) Duke Energy Trdg&Mrktg LLC (TX)
Duke Energy Trdg & Mktg, LLC (TX) Edison Mission Mktg&Trdg Inc (MA) El Paso Merchant Energy LP (TX) Empire Natural Gas Corp (NY) Energy Coop of New York, Inc (NY) Energy West Resources Inc (MT) Engage Energy America LLC (TX) Exelon Energy Company (IL) First Energy Solutions Corp. (OH) GEN-SYS Energy (WI) Granite Peak Energy (ND) Great Bay Pwr Marketing, Inc. (NH) Hinson Power Company LLC (WA) Independence Pwr Marketing (NY) Merrill Lynch Commodities (TX) Mirant Americas EngyMrktg LP (GA) Mpower Retail Energy LP (TX) Neumin Production Company (TX) OGE Energy Resources, Inc (OK) People's Electric Corporation (OK) Peoples Energy Services (IL) PEPCO Energy Services (VA) Pilot Power Group Inc (CA) Powerex Corporation (CN) PPL EnergyPlus LLC (PA)
PPM Energy Inc (OR) Quest Energy, LLC (MI) Rainbow Energy Marketing Corp (ND) Reliant Energy Electric Solutions (TX) Reliant Energy Retail Services, Inc (TX) Reliant Energy Services Inc (TX) Reliant Energy Solutions East, LLC (TX) Spark Energy, LP (TX) Split Rock Energy LLC (MN) Strategic Energy LLC (PA) Stream Energy (TX) Suez Enrgy Resources North America (TX) Tara Energy, Inc (TX) TDX North Slope Generating Co (AK) Texas Retail Energy, LLC (AR) Tractebel Energy Marketing Inc (TX) TransAlta Enrgy Marketing (U.S.) Inc. (CN) TXU Energy Retail Co LP (TX) TXU ET Services Co (TX) TXU SESCO Energy Services Co (TX) UNS Electric, Inc (AZ) Williams Energy Mktg & Trdg Co (OK) WPS Energy Services (WI) WTU Energy, LP (TX)

Appendix G: FERC Survey Respondents
Assessment of Demand Response and Advanced Metering Federal Energy Regulatory Commission
G-13
Political Subdivisions (77 Entities) Arkansas River Power Authority (CO) Burt County Public Power Dist (NE) Butler County Rural P P D (NE) Central Lincoln People's Ut Dt (OR) Central Nebraska Pub P&I Dist (NE) Chimney Rock Public Power Dist (NE) Clatskanie Peoples Util Dist (OR) Cornhusker Public Power Dist (NE) Crisp County Power Comm (GA) Cuming Cnty Public Pwr Dist (NE) Custer Public Power District (NE) Dawson Power District (NE) Electrical Dist No2 Pinal Cnty (AZ) Electrical Dist No4 Pinal Cnty (AZ) Electrical Dist No6 Pinal Cnty (AZ) Elkhorn Rural Public Pwr Dist (NE) Emerald People's Utility Dist (OR) Heartland Consumers Pwr Dist (SD) Hohokam Irr & Drain Dist (AZ) Imperial Irrigation District (CA) Intermountain Power Agency (CA) KBR Rural Public Power District (NE) Kings River Conservation Dist (CA) Kokhanok Village Council (AK) Lincoln County Pwr Dist No 1 (NV) Louisiana Energy & Pwr Auth (LA)
Loup River Public Power Dist (NE) McCook Public Power District (NE) Merced Irrigation District (CA) Midvale Irrigation District (WY) Modesto Irrigation District (CA) Mohegan Tribal Utility Auth (CT) MSR Public Power Agency (CA) Municipal Enrgy Agency of NE (NE) Nebraska Public Power District (NE) North Central Public Pwr Dist (NE) Northern Wasco County PUD (OR) Northwest Rural Pub Pwr Dist (NE) Oakdale& S SanJoaquin Irrign (CA) Omaha Public Power District (NE) Oroville-Wyandotte Irrig Dist (CA) Perennial Public Power Dist (NE) Piedmont Municipal Pwr Agny (SC) Placer County Water Agency (CA) Polk Cnty Rural Pub Pwr Dist (NE) PSC of Yazoo City (MS) Public Utility District No 1 (WA) Public Utility District No 2 (WA) PUD No 1 of Benton County (WA) PUD No 1 of Chelan County (WA) PUD No 1 of Clallam County (WA) PUD No 1 of Clark County (WA)
PUD No 1 of Cowlitz County (WA) PUD No 1 of Douglas County (WA) PUD No 1 of Ferry County (WA) PUD No 1 of Grays Harbor Cnty (WA) PUD No 1 of Kittitas County (WA) PUD No 1 of Klickitat County (WA) PUD No 1 of Okanogan County (WA) PUD No 1 of Pend Oreille Cnty (WA) Roosevelt Public Power Dist (NE) Sacramento Municipal Util Dist (CA) Salt River Project (AZ) Seward County Rrl Pub Pwr Dist (NE) Snohomish County PUD No 1 (WA) Southern California P P A (CA) Southwest Public Power Dist (NE) Stanton County Public Pwr Dist (NE) Tonopah Irrigation District (AZ) Truckee Donner P U D (CA) Tuolumne County Pub Power Agny (CA) Twin Valleys Public Power Dist (NE) Utah Associated Mun Power Sys (UT) Vermont Public Pwr Supply Auth (VT) Wellton-Mohawk Irr & Drain Dist (AZ) Western Minnesota Mun Pwr Agny (SD) Yakutat Power Inc (AK)
Municipal Marketing Authorities (11 Entities) CT Muni Elec Engy Coop (CT) Florida Municipal Pwr Agency (FL) Illinois Municipal Elec Agency (IL) Indiana Municipal Pwr Agency (IN)
Mass Mun Wholesale Elec Co (MA) Minnesota Municipal Pwr Agny (MN) Municipal Electric Authority (GA) Municipal Enrgy Agency of MS (MS)
Northern Municipal Power Agency (MN) Utah Municipal Power Agency (UT) Wisconsin Public Power Inc Sys (WI)
Curtailment Service Providers (19 Entities) A&C Management Group LLC (NJ) Allied Utility Network (GA) Baltimore Gas & Electric (MD) Celerity Energy Partners, LLC (WA) Commercial Utility Consultants, Inc. (PA) Constellation Energy Source (MA) Consumer Powerline Company (NY)
Crucible Metals (NY) Downes Associates, Inc. (MD) ECONnergy Energy Co, Inc. (NY) Enrgy Investment Systms, Inc. (NY) EnerNOC, Inc (MA) FirstEnergy (PA) Galt Power (DE)
MWN Energy Group (PA) Onsite Energy Corporation (CA) State University of NY at Buffalo (NY) The Legacy Energy Group (VA) WebGen Systems (MA)
State Utilities (20 Entities)Ak-Chin Electric Utility Authority (AZ) Alaska Energy Authority (AK) American Samoa Power Authority (AS) Arizona Power Authority (AZ) Brazos River Authority (TX) California Dept of Wtr Res (CA) Colorado River Comm of NV (NV)
Electric Fund (CDWR) (CA) Energy Northwest (WA) Grand River Dam Authority (OK) Guadalupe Blanco River Auth (TX) Long Island Power Authority (NY) Metropolitan Water District of S CA (CA) Navajo Tribal Utility Authority (AZ)
New River Light & Power Co (NC) New York Power Authority (NY) Oklahoma Municipal Power Auth (OK) South Carolina Pub Serv Auth (SC) Virgin Islands Wtr&Pwr Auth (VI) Virginia Tech Electric Service (VA)

Appendix G: FERC Survey Respondents
Assessment of Demand Response and Advanced Metering Federal Energy Regulatory Commission
G-14
Federal (6 Entities)Bonneville Power Admin (OR) Southeastern Power Admin (GA)
Southwestern Power Admin (OK) Tennessee Valley Authority (TN)
USBIA-Mission Valley Power (MT) Western Area Pwr Admin (CO)
RTOs/ISOs (6 Entities) CAISO ERCOT
ISONE MISO
NYISO PJM
* Commission staff received a total of 1,939 responses to the 3,366 surveys it sent out. Some respondents (1,886) completed the Demand Response section of the survey, others (1,860) completed the AMI section of the survey. The difference among the 1,886, 1,860 and 1,939 numbers stems from some respondents filling out only the general information section of the survey or otherwise reporting to Commission staff that they had no programs or activities to report.

Appendix H: DR Programs and Services at Responding Utilities
Assessment of Demand Response and Advanced Metering Federal Energy Regulatory Commission
H-1
Appendix H: Demand Response (DR) Programs and Services at Responding Utilities
Ancillary Services TXU Energy Retail Company LP Capacity Market Programs Allied Utility Network Celerity Energy Partners, LLC City of Waseca Electric Utility Commonwealth Edison Co. ConEdison Solutions Consumers Energy Co.
EnerNOC, Inc. New York Power Authority Northern States Power Co Orange & Rockland Utils, Inc. Pacific Gas & Electric Company PacifiCorp
PECO Energy Company Pioneer Electric Cooperative, Inc. Portland General Electric Co Wisconsin Public Power, Inc.
Critical Peak Pricing Arrowhead Electric Coop, Inc. Austin Energy Butler Rural Electric Coop, Inc. (OH) Cass County Elec Coop Inc. (ND) Cherryland Electric Cooperative Choptank Electric Cooperative, Inc. City of Gastonia City of Grafton City of High Point Electric
Department City of LaGrange City of Laurinburg, North Carolina Clay County Electric Coop Corp Consumers Energy Gulf Power Company High Plains Power, Inc. Idaho Power Company Jackson Electric Membership Corporation Oakdale Electric Cooperative
OGE Electric Services (DBA Oklahoma Gas and Electric) Pacific Gas & Electric Co Pioneer Rural Electric Coop, Inc. (OH) Rappahannock Electric Coop San Diego Gas & Electric Co Southern California Edison Company Wisconsin Public Service Corp
Demand Bidding Alliant Energy City of Lafayette Electric Department Entergy Arkansas, Inc. Gaffney Board of Public Works Groton Dept of Utilities New Braunfels Utilities Niagara Mohawk
Otter Tail Power Company Pacific Gas & Electric Co Polk County Rural Public Power District Portland General Electric Co PSI Energy Inc Sacramento Municipal Utility District
San Diego Gas & Electric Co Snohomish County PUD No 1 Southern California Edison Co Wisconsin Electric Power Co Wisconsin Public Service Corp
Direct Load Control A & N Electric Coop Adams Electric Coop Adams-Columbia Electric Cooperative Alabama Power Company Alaska Electric Light and Power Company Allamakee-Clayton Electric Coop Altamaha EMC Anderson Municipal Light and Power Austin Energy Baltimore Gas & Electric Co Barnesville Municipal Utility Black River Electric Coop Inc. Blue Earth Light & Water Dept Bluestem Electric Coop, Inc.
Board of Public Works Boone Electric Coop Bristol Tennessee Essential Services Buckeye Power, Inc Butler Rural Electric Coop Ass’n Inc. Butler Rural Electric Coop, Inc. C & L Electric Coop Corporation Caddo Electric Coop Capital Electric Coop, Inc. Cass County Electric Coop, Inc Central Electric Membership Corp (NC) Central Florida Electric Coop, Inc. Central Maine Power Company
Central Rural Electric Coop Central Vermont Public Service Corporation City of Ames City of Arlington City of Aurora City of Big Stone City City of Bowling Green, OH City of Camden City of Central City City of Detroit Lakes City of Fort Collins Colorado City of Gothenburg City of Grafton City of Groton City of Hecla City of Kinston

Appendix H: DR Programs and Services at Responding Utilities
Assessment of Demand Response and Advanced Metering Federal Energy Regulatory Commission
H-2
Direct Load Control (Cont’d) City of Laurinburg (NC) City of Milford City of Moorhead City of New Smyrna Beach City of Northwood City of Parker City of Saint Peter City of Seward City of Staples City of Stromsburg City of Waseca Electric Utility City of White City of Wood River Clay County Electric Coop Corp Coastal Electric Cooperative, Inc Coles-Moultrie Electric Coop Colorado Springs Utilities Columbia Water & Light Dept Commonwealth Edison Co. Community Electric Coop Con Edison Concord Municipal Light Plant Connexus Energy Consolidated Electric Coop Continental Cooperative Services Cooperative Light & Power Corn Belt Energy Corp Cornhusker Public Power District Coweta-Fayette EMC CPS Energy Crowning Power Cuivre River Electric Coop, Inc. Cuming County Public Power District Dahlberg Light & Power Co. Dairyland Power Coop Dakota Electric Association Dakota Energy Coop, Inc. David City Utilities Delaware County Electric Coop, Inc. Delmarva Power & Light Company Detroit Edison Company Dominion North Carolina Power Dominion Virginia Power Dubois Rural Electric Coop, Inc. Duke Power Duquesne Light Company East River Electric Power Coop Elk River Municipal Utilities Elkhorn Rural Public Power District EnergyUnited EMC Excelsior EMC Farmers Electric Coop Corp Farmers' Electric Coop First Electric Cooperative Corp Flint Electric Membership Corporation
Florida Power & Light Co Frontier Power Company Georgia Power Company Grand Rapids Public Utilities Commission Great Lakes Energy Cooperative Grundy Electric Cooperative, Inc. Guernsey-Muskingum Electric Coop, Inc. Hart Electric Membership Corporation Hawaiian Electric Company, Inc. Hawley Public Utilities Highline Electric Association Horry Electric Coop, Inc Idaho Power Company Illinois Rural Electric Coop Indianapolis Power & Light Co Jackson Electric Cooperative Jackson E M C Jamestown (Indiana) Municipal Electric Utility Jefferson Energy Coop Jersey Central Power & Light Co Kansas City Power & Light Co KBR Rural Public Power District KEM Electric Coop, Inc. Kentucky Utilities Company Lake Region Electric Coop Lee County Electric Coop, Inc Licking Rural Electrification Lighthouse Electric Coop, Inc. Linton Municipal Electric Utility Litchfield Public Utilities Long Island Power Authority Louisville Gas & Electric Co Loup River Public Power District Lynches River Electric Coop, Inc Madison Gas and Electric Co Marshall Municipal Utilities McLean Electric Cooperative McLeod Cooperative Power Assn Mecklenburg Electric Coop Menard Electric Coop MidAmerican Energy Company Midwest Electric, Inc Midwest Energy Coop Mille Lacs Electric Coop Modesto Irrigation District Montana-Dakota Utilities Co. Moose Lake Water & Light Commission Morgan County rural Electric Assn Municipal Commission of Boonville Navopache Electric Coop, Inc. Nevada Power Company New Prague Utilities Comm.
Nobles Cooperative Electric Nodak Electric Cooperative, Inc. North Arkansas Electric Coop, Inc North Central Electric Coop, Inc. North Central Public Power District North West Rural Electric Coop Northern States Power Co Northern States Power Company(Wisconsin) Northern Virginia Electric Coop Northwest Rural Public Power District Oakdale Electric Cooperative Oliver-Mercer Electric Coop, Inc. Osceola Electric Coop, Inc Otter Tail Power Company Owatonna Public Utilities PacifiCorp PECO Energy Company Pee Dee Electric Member Corp (NC) People's Electric Coop Perennial Public Power District Pierce Pepin Cooperative Services, Inc. Pioneer Rural Electric Coop, INC Polk County Rural Public Power District Price Electric Coop, Inc. Progress Energy Carolinas, Inc. Progress Energy Florida, Inc. PSI Energy Inc Public Service Electric & Gas Company Randolph Electric Membership Corporation Rappahannock Electric Coop Rice Lake Utilities Richland Electric Coop Runestone Electric Association Sacramento Municipal Utility District San Diego Gas and Electric Seward County Public Power District Shelby Electric Coop, INC Sioux Center Municipal Utilities Southeastern Electric Coop, Inc. Southern California Edison Company Southern Indiana Gas & Elec Co Southern Maryland Electric Coop, Inc. Southside Electric Cooperative Southwest Public Power District Southwestern Electric Coop, Inc Stanton County Public Power District
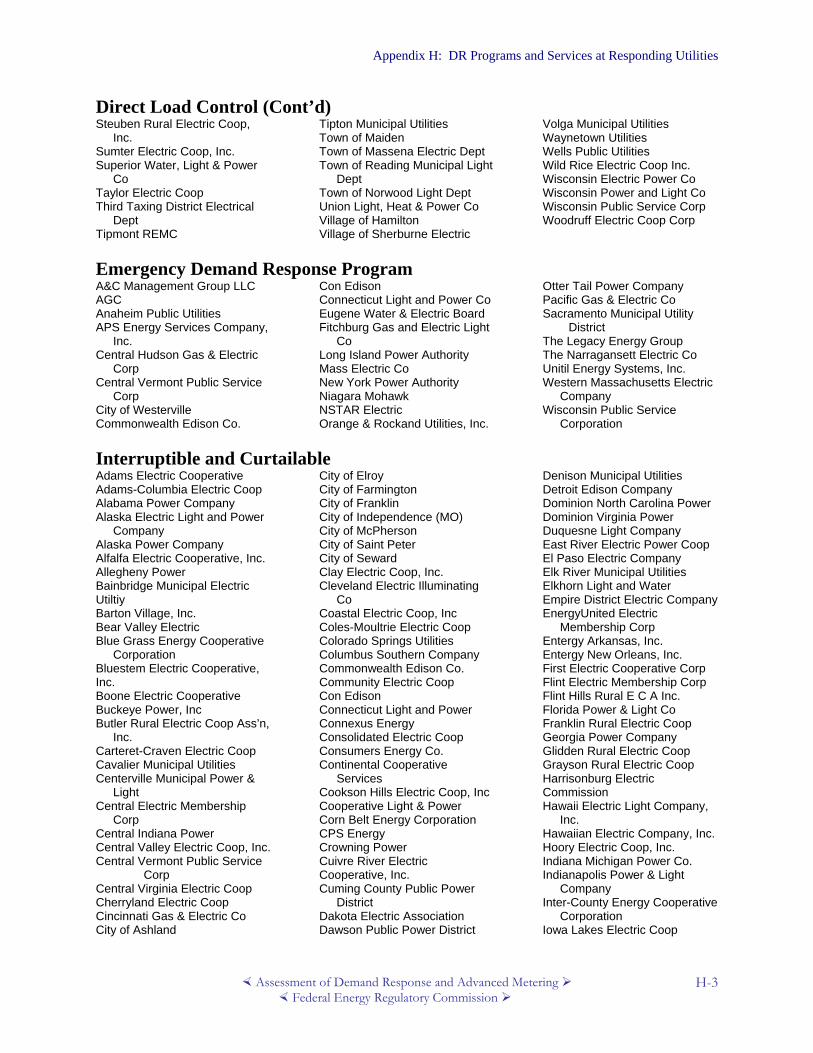
Appendix H: DR Programs and Services at Responding Utilities
Assessment of Demand Response and Advanced Metering Federal Energy Regulatory Commission
H-3
Direct Load Control (Cont’d) Steuben Rural Electric Coop, Inc. Sumter Electric Coop, Inc. Superior Water, Light & Power Co Taylor Electric Coop Third Taxing District Electrical Dept Tipmont REMC
Tipton Municipal Utilities Town of Maiden Town of Massena Electric Dept Town of Reading Municipal Light Dept Town of Norwood Light Dept Union Light, Heat & Power Co Village of Hamilton Village of Sherburne Electric
Volga Municipal Utilities Waynetown Utilities Wells Public Utilities Wild Rice Electric Coop Inc. Wisconsin Electric Power Co Wisconsin Power and Light Co Wisconsin Public Service Corp Woodruff Electric Coop Corp
Emergency Demand Response Program A&C Management Group LLC AGC Anaheim Public Utilities APS Energy Services Company, Inc. Central Hudson Gas & Electric Corp Central Vermont Public Service Corp City of Westerville Commonwealth Edison Co.
Con Edison Connecticut Light and Power Co Eugene Water & Electric Board Fitchburg Gas and Electric Light Co Long Island Power Authority Mass Electric Co New York Power Authority Niagara Mohawk NSTAR Electric Orange & Rockand Utilities, Inc.
Otter Tail Power Company Pacific Gas & Electric Co Sacramento Municipal Utility District The Legacy Energy Group The Narragansett Electric Co Unitil Energy Systems, Inc. Western Massachusetts Electric Company Wisconsin Public Service Corporation
Interruptible and Curtailable Adams Electric Cooperative Adams-Columbia Electric Coop Alabama Power Company Alaska Electric Light and Power Company Alaska Power Company Alfalfa Electric Cooperative, Inc. Allegheny Power Bainbridge Municipal Electric Utiltiy Barton Village, Inc. Bear Valley Electric Blue Grass Energy Cooperative Corporation Bluestem Electric Cooperative, Inc. Boone Electric Cooperative Buckeye Power, Inc Butler Rural Electric Coop Ass’n, Inc. Carteret-Craven Electric Coop Cavalier Municipal Utilities Centerville Municipal Power & Light Central Electric Membership Corp Central Indiana Power Central Valley Electric Coop, Inc. Central Vermont Public Service Corp Central Virginia Electric Coop Cherryland Electric Coop Cincinnati Gas & Electric Co City of Ashland
City of Elroy City of Farmington City of Franklin City of Independence (MO) City of McPherson City of Saint Peter City of Seward Clay Electric Coop, Inc. Cleveland Electric Illuminating Co Coastal Electric Coop, Inc Coles-Moultrie Electric Coop Colorado Springs Utilities Columbus Southern Company Commonwealth Edison Co. Community Electric Coop Con Edison Connecticut Light and Power Connexus Energy Consolidated Electric Coop Consumers Energy Co. Continental Cooperative Services Cookson Hills Electric Coop, Inc Cooperative Light & Power Corn Belt Energy Corporation CPS Energy Crowning Power Cuivre River Electric Cooperative, Inc. Cuming County Public Power District Dakota Electric Association Dawson Public Power District
Denison Municipal Utilities Detroit Edison Company Dominion North Carolina Power Dominion Virginia Power Duquesne Light Company East River Electric Power Coop El Paso Electric Company Elk River Municipal Utilities Elkhorn Light and Water Empire District Electric Company EnergyUnited Electric Membership Corp Entergy Arkansas, Inc. Entergy New Orleans, Inc. First Electric Cooperative Corp Flint Electric Membership Corp Flint Hills Rural E C A Inc. Florida Power & Light Co Franklin Rural Electric Coop Georgia Power Company Glidden Rural Electric Coop Grayson Rural Electric Coop Harrisonburg Electric Commission Hawaii Electric Light Company, Inc. Hawaiian Electric Company, Inc. Hoory Electric Coop, Inc. Indiana Michigan Power Co. Indianapolis Power & Light Company Inter-County Energy Cooperative Corporation Iowa Lakes Electric Coop

Appendix H: DR Programs and Services at Responding Utilities
Assessment of Demand Response and Advanced Metering Federal Energy Regulatory Commission
H-4
Interruptible and Curtailable (Cont’d) Jackson Energy Coop Corp JEA Jefferson Energy Coop Kansas City Power & Light Company Kansas gas and Electric Company Kauai Island Utility Cooperative Kentucky Power Co. Kentucky Utilities Co Kiamichi Electric Cooperative, Inc. Kissimmee Utility Authority Kiwash Electric Cooperative, Inc. Leavenworth Jefferson Electric Coop Lee County Electric Cooperative, Incorporated Lincoln Electric System Louisville Gas & Electric Company Lumbee River Electric Membership Corporation Madison Gas and Electric Company Manitowoc Public Utilities Marshall Municipal Utilities Mass Electric Co Maui Electric Company, Ltd McLeod Cooperative Power Association Mecklenburg Electric Coop Menard Electric Coop Metropolitan Edison Co MidAmerican Energy Company Midwest Electric, Inc Midwest Energy, Inc. Narragansett Electric Co Navopache Electric Cooperative, Inc. Nebraska Public Power District New Prague Utilities Commission New York Power Authority Ninnescah Rural Electric Cooperative Assn., Inc. Nobles Cooperative Electric Nolin Rural Electric Coop Corp North Arkansas Electric Coop, Inc North Central Power Co., Inc. North Plains Electric Coop Inc. Northern Neck Electric Coop Northern States Power Co
Northern States Power Company (WI) Northern Virginia Electric Coop Northwestern Wisconsin Electric Company NSTAR Electric Oakdale Electric Cooperative Ohio Edison Co Ohio Power Company Omaha Public Power District Orlando Utilities Commission Otter Tail Power Company Owatonna Public Utilities Owen Electric Cooperative Paragould Light and Water Commission PECO Energy Company Pee Dee Electric Member Corp (NC) Pennsylvania Electric Co Pennsylvania Power Co Pepco Energy Services, Inc. Perennial Public Power District Pioneer Electric Cooperative, Inc. Progress Energy Carolinas, Inc. Progress Energy Florida, Inc. PSI Energy Inc Public Service Company of New Hampshire Public Service Company of New Mexico Public Service Electric & Gas Company Randolph Electric Membership Corporation Rappahannock Electric Coop Richmond Power and Light Roosevelt Public Power District Runestone Electric Association Salamanca Board of Public Utilities Salt River Electric Cooperative Corporation San Diego Gas and Electric Satilla Rural Elec Member Corporation Shelby Electric Coop, Inc Shelby Energy Cooperative Incorporated South Carolina Public Service Authority South Kentucky Rural Electric Cooperative Corporation
Southeastern Electric Coop, Inc. Southern California Edison Co Southern Indiana Gas & Elec Co Southside Electric Coop, Inc. Southwestern Electric Coop, Inc SRP Sterling Municipal Light Dept Sumter Electric Cooperative, Inc. Superior Water, Light & Power Company Swanton Village, Inc. T.I.P. Rural Electric Cooperative Tennessee Valley Authority Thief River Falls Municipal Utilities Toledo Edison Co Town of Hardwick Electric Department Town of Stowe Electric Department Trico Electric Cooperative, Inc Tucson Electric Power Company Union Electric Company Union Light, Heat & Power Co UniSource Electric United Electric Cooperative Services, Inc. Village of Enosburg Village of Hyde Park, Inc. Village of Jacksonville Village of Johnson, Inc. Village of Ludlow Electric Light Dept. Village of Lyndonville Electric Dept Village of Morrisville Water & Light Dept. Village of Northfield Village of Orleans, Inc. Waverly Light and Power Webster Electric Coop Westar Energy, Inc. Wheeling Power Co.(WPCO) White River Valley Electric Coop Inc. Wisconsin Electric Power Company Wisconsin Power and Light Company Wisconsin Public Power, Inc. Wisconsin Public Service Corporation
Real-Time Pricing Alabama Power Company Alpena Power Company Atlantic City Electric Company
Baltimore Gas and Electric Butler County Rural Electric Cooperative
Central Hudson Gas & Electric Corporation

Appendix H: DR Programs and Services at Responding Utilities
Assessment of Demand Response and Advanced Metering Federal Energy Regulatory Commission
H-5
Real-Time Pricing (Cont’d) Chicopee Municipal Lighting Plant Cincinnati Gas & Electric Co Cleveland Electric Illuminating Co Con Edison Connecticut Light and Power Delmarva Power & Light Company Dominion Virginia Power Duquesne Light Company Georgia Power Company Hill County Electric Cooperative, Inc JEA Jersey Central Power & Light Co Kansas City Power & Light Company
Maui Electric Co Ltd MidAmerican Energy Company New York Power Authority Niagara Mohawk Northern States Power Co (MN) Northern States Power Co (WI) Northern Rio Arriba Electric Coop Ohio Edison Co Orange & Rockland Utilities, Inc. Otter Tail Power Company Pennsylvania Power Co Pepco Pepco Energy Services, Inc. Portland General Electric Company Progress Energy Carolinas, Inc. PSI Energy Inc
Public Service Electric & Gas Company Reliant Energy, Inc. Seattle City Light South Beloit Water Gas and Electric Company South Carolina Public Service Authority Tennessee Valley Authority Toledo Edison Co Union Light, Heat & Power Co Vermont Electric Cooperative Western Massachusetts Electric Company Wisconsin Electric Power Company
Time-of-Use Adams-Columbia Electric Coop Ak-Chin Energy Services Alabama Power Co Alliant Energy Arizona Public Service Co Baltimore Gas and Electric Co Bangor Hydro-Electric Barron Light & Water Big Horn Rural Electric Co Blue Grass Energy Cooperative Corp Blue Ridge Electric Coop Broad River Electric Coop Butler County Rural Electric Coop Butler Rural Electric Cooperative, Inc. Carbon Power and Light Inc. Carteret-Craven Electric Coop Cedarburg Light & Water Utility Central Alabama Electric Coop Central Electric Membership Corp Central Hudson Gas & Electric Corp Central Illinois Light Co Central Illinois Public Service Co Central Maine Power Co Central NM Electric Coop Central Vermont Public Service Corp Choptank Electric Cooperative, Inc. Cincinnati Gas & Electric Co City of Kiel Utilities City of Kinston City of Laurinburg, (NC) City of Mountain Iron Clark County Rural EMC Clark Energy Coop, Inc.
Clay Electric Coop, Inc. Cleveland Electric Illuminating Co Colorado Springs Utilities Columbia Water & Light Department Columbus Southern Company Columbus Water & Light Concord Municipal Light Plant Consumers Energy Connecticut Light and Power Continental Cooperative Services CPS Energy Crisp County Power Commission Cumberland Valley Electric Decatur County Rural E M C Delmarva Power & Light Co Dominion North Carolina Power Dominion Virginia Power Duke Power Duquesne Light Co East-Central Iowa Rural Electric Coop Econnergy Energy Co, Inc. El Paso Electric Co Elkhorn Light and Water Energy Investment Systems, Inc. Entergy Arkansas, Inc. Entergy Gulf States, Inc. Farmers Electric Coop, Inc. Farmers RECC Fleming-Mason Energy Coop Inc. Florence Utilities Florida Power & Light Co Georgia Power Co Grand Valley Rural Power Lines, Inc.
Grayson Rural Electric Coop Green Mountain Power Corp Gunnison C E A Inc. Hartford Electric Hawaiian Electric Company, Inc. High Plains Power, Inc. Highline Electric Association Idaho Power Company Illinois Power Company Indiana Michigan Power Co Inter-County Energy Coop Corp Iowa Lakes Electric Cooperative Jackson Electric Membership Corp Jackson Energy Cooperative Corp JEA Jefferson Utilities Jemez Mountain Electric Coop, Inc. Jersey Central Power & Light Co Johnson County REMC Kansas City Power & Light Co Kentucky Power Co Kentucky Utilities Co Kingsport Power Co La Plata Electric Association Laurens Electric Coop, Inc Long Island Power Authority Los Angeles Department of Water and Power Lumbee River Electric Membership Corporation Madison Gas and Electric Company Medford Electric Utility Menasha Utilities Metropolitan Edison Co MidAmerican Energy Company Montana-Dakota Utilities Co.

Appendix H: DR Programs and Services at Responding Utilities
Assessment of Demand Response and Advanced Metering Federal Energy Regulatory Commission
H-6
Time-of-Use (Cont’d) Morgan County rural Elec Assn Navopache Electric Cooperative, Inc. Nevada Power Company New Holstein Utilities New Richmond Utilities Niagara Mohawk Niobrara Electric Assn Inc North Central Power Co., Inc. Northern Indiana Public Service Company Northern States Power Co (MN) Northern States Power Co (WI) Northwest Rural Public Power District Northwestern Wisconsin Electric Company Northern Rio Arriba Elec Coop NSTAR Electric Oconomowoc Utilities OGE Electric Services (DBA Oklahoma Gas and Electric) Ohio Power Company (OPCO) Oklahoma Electric Coo Orange & Rockland Utilities, Inc. Orlando Utilities Commission Owen Electric Cooperative Pacific Gas & Electric Co PacifiCorp PECO Energy Company Pee Dee Elect Mem Corp (NC) Pennsylvania Electric Co Pennsylvania Power Co Piedmont Electric Membership Corporation Pioneer Electric Cooperative, Inc. Portland General Electric Company Poudre Valley R E A, Inc. Powder River Energy Corp Progress Energy Carolinas, Inc. Progress Energy Florida, Inc. PSI Energy Inc Public Service Co. of Oklahoma Public Service Company of New Hampshire Public Service Company of New Mexico Public Service Electric & Gas Company Randolph Electric Membership Corporation Rice Lake Utilities River Falls Municipal Utilities Riverside Public Utilities Rochester Gas & Electric Corp Roosevelt Public Power District Sacramento Municipal Utility District San Diego Gas and Electric
San Luis Valley R E C Seattle City Light Shelby Energy Coop Inc Sierra Pacific Power Co Slinger Utilities South Beloit Water Gas and Electric Co South Carolina Public Service Authority South Central Indiana R E M C South Kentucky Rural Electric Coop Corp Southeast Colorado Power Assn Southwestern Electric Power Co SRP Sterling Municipal Light Department Stoughton Utilities Sun Prairie Water & Light Taylor County RECC Texas North Company Toledo Edison Co Town of Reading Municipal Light Department Trico Electric Cooperative, Inc Tucson Electric Power Company Turlock Irrigation District TXU Energy Retail Company LP UGI Utilities, Inc. UIL Umatilla Electric Coop Union Electric Company Union Light, Heat & Power Co United Electric Cooperative Services, Inc. Unitil Energy Systems, Inc. Vermont Electric Coop Waverly Light and Power Westby Utilities Western Massachusetts Electric Co Wheatland REA Wheeling Power Co Wisconsin Power and Light Co Wisconsin Public Service Corp
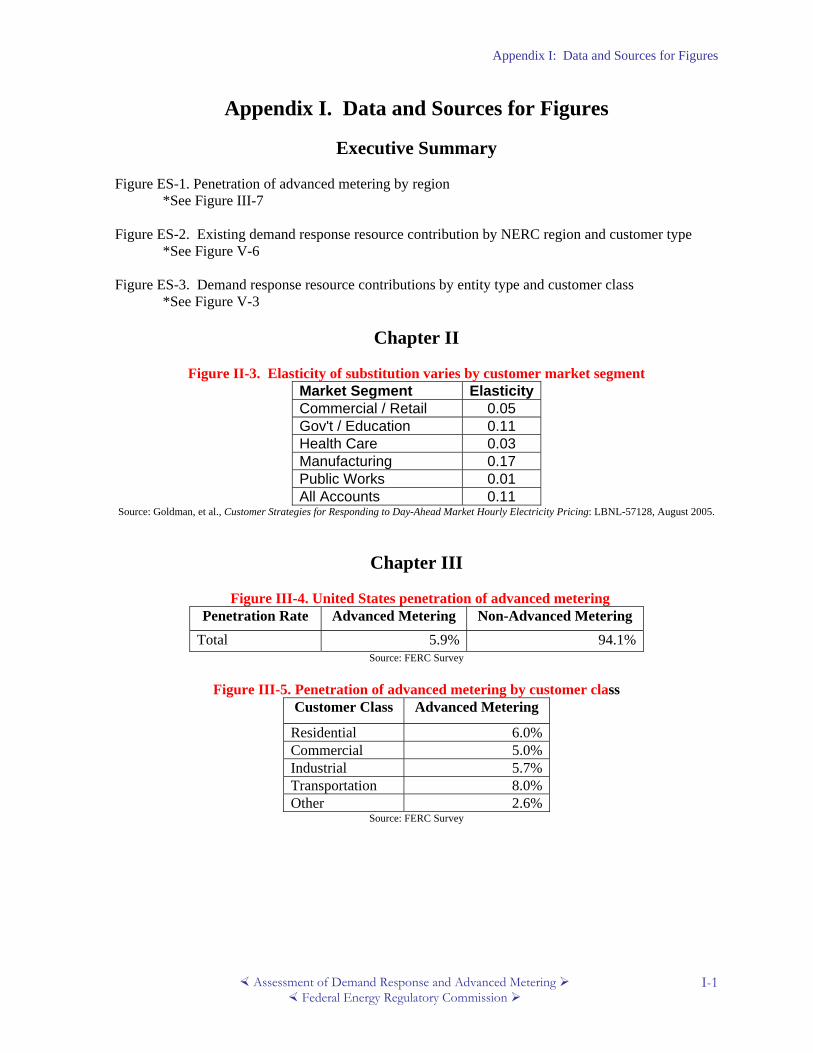
Appendix I: Data and Sources for Figures
Assessment of Demand Response and Advanced Metering Federal Energy Regulatory Commission
I-1
Appendix I. Data and Sources for Figures
Executive Summary Figure ES-1. Penetration of advanced metering by region *See Figure III-7 Figure ES-2. Existing demand response resource contribution by NERC region and customer type *See Figure V-6 Figure ES-3. Demand response resource contributions by entity type and customer class *See Figure V-3
Chapter II
Figure II-3. Elasticity of substitution varies by customer market segment Market Segment ElasticityCommercial / Retail 0.05 Gov't / Education 0.11 Health Care 0.03 Manufacturing 0.17 Public Works 0.01 All Accounts 0.11
Source: Goldman, et al., Customer Strategies for Responding to Day-Ahead Market Hourly Electricity Pricing: LBNL-57128, August 2005.
Chapter III
Figure III-4. United States penetration of advanced metering Penetration Rate Advanced Metering Non-Advanced Metering
Total 5.9% 94.1% Source: FERC Survey
Figure III-5. Penetration of advanced metering by customer class
Customer Class Advanced Metering
Residential 6.0%Commercial 5.0%Industrial 5.7%Transportation 8.0%Other 2.6%
Source: FERC Survey
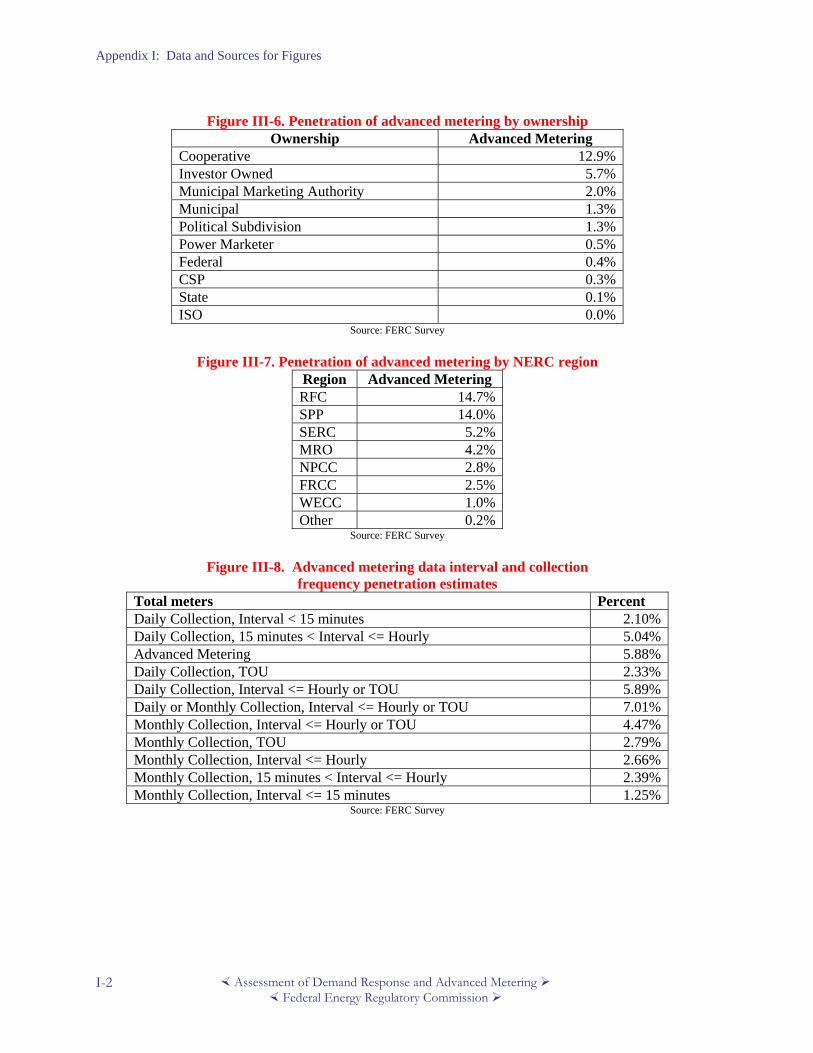
Appendix I: Data and Sources for Figures
Assessment of Demand Response and Advanced Metering Federal Energy Regulatory Commission
I-2
Figure III-6. Penetration of advanced metering by ownership
Ownership Advanced Metering Cooperative 12.9% Investor Owned 5.7% Municipal Marketing Authority 2.0% Municipal 1.3% Political Subdivision 1.3% Power Marketer 0.5% Federal 0.4% CSP 0.3% State 0.1% ISO 0.0%
Source: FERC Survey
Figure III-7. Penetration of advanced metering by NERC region Region Advanced Metering RFC 14.7%SPP 14.0%SERC 5.2%MRO 4.2%NPCC 2.8%FRCC 2.5%WECC 1.0%Other 0.2%
Source: FERC Survey
Figure III-8. Advanced metering data interval and collection frequency penetration estimates
Total meters Percent Daily Collection, Interval < 15 minutes 2.10%Daily Collection, 15 minutes < Interval <= Hourly 5.04%Advanced Metering 5.88%Daily Collection, TOU 2.33%Daily Collection, Interval <= Hourly or TOU 5.89%Daily or Monthly Collection, Interval <= Hourly or TOU 7.01%Monthly Collection, Interval <= Hourly or TOU 4.47%Monthly Collection, TOU 2.79%Monthly Collection, Interval <= Hourly 2.66%Monthly Collection, 15 minutes < Interval <= Hourly 2.39%Monthly Collection, Interval <= 15 minutes 1.25%
Source: FERC Survey
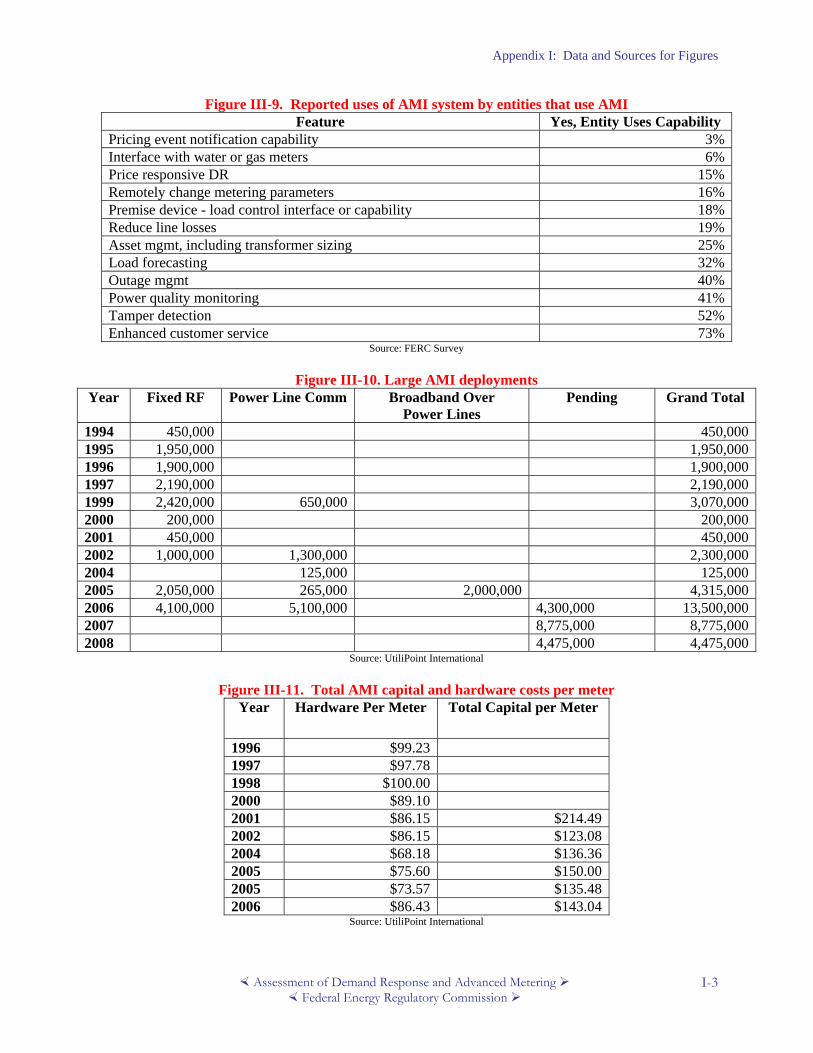
Appendix I: Data and Sources for Figures
Assessment of Demand Response and Advanced Metering Federal Energy Regulatory Commission
I-3
Figure III-9. Reported uses of AMI system by entities that use AMI Feature Yes, Entity Uses Capability
Pricing event notification capability 3%Interface with water or gas meters 6%Price responsive DR 15%Remotely change metering parameters 16%Premise device - load control interface or capability 18%Reduce line losses 19%Asset mgmt, including transformer sizing 25%Load forecasting 32%Outage mgmt 40%Power quality monitoring 41%Tamper detection 52%Enhanced customer service 73%
Source: FERC Survey
Figure III-10. Large AMI deployments Year Fixed RF Power Line Comm Broadband Over
Power Lines Pending Grand Total
1994 450,000 450,0001995 1,950,000 1,950,0001996 1,900,000 1,900,0001997 2,190,000 2,190,0001999 2,420,000 650,000 3,070,0002000 200,000 200,0002001 450,000 450,0002002 1,000,000 1,300,000 2,300,0002004 125,000 125,0002005 2,050,000 265,000 2,000,000 4,315,0002006 4,100,000 5,100,000 4,300,000 13,500,0002007 8,775,000 8,775,0002008 4,475,000 4,475,000
Source: UtiliPoint International
Figure III-11. Total AMI capital and hardware costs per meter Year Hardware Per Meter Total Capital per Meter
1996 $99.23 1997 $97.78 1998 $100.00 2000 $89.10 2001 $86.15 $214.49 2002 $86.15 $123.08 2004 $68.18 $136.36 2005 $75.60 $150.00 2005 $73.57 $135.48 2006 $86.43 $143.04
Source: UtiliPoint International

Appendix I: Data and Sources for Figures
Assessment of Demand Response and Advanced Metering Federal Energy Regulatory Commission
I-4
Figure III-12. AMI System Cost Breakdown
Cost Component Cost Endpoint Hardware 0.45 Network Hardware 0.2 Installation 0.15 Project Management 0.11 IT 0.09
Source: David Prins et. al. (CRA International), “Interval Metering Advanced Communications Study,” August 2005 Figure III-14. Number of customers receiving interval usage information by customer class and
source of information Source Residential Commercial Industrial Transportation Other TOTAL Via the internet 24,789 69,021 16,123 3 2,628 112,564On their bills 75,836 24,421 3,708 4 2,914 106,883Via the AMI network 5,641 789 249 0 35 6,714TOTAL 106,266 94,231 20,080 7 5,577 226,161
Source: FERC Survey
Chapter IV
Figure IV-3. California CPP: Residential CPP Response by Attribute
High vs. Low User 200% Average Use 17.2%50% Average Use 9.8%Income >$100,000 15.1%<$40,000 12.1%Single vs. Multi-Family Single Family 13.5%Multi-Family 9.8%Central AC Ownership YES 12.8%NO 12.3%Pool Ownership YES 19.2%NO 12.1%State-wide Average 12.5%
Source: Roger Levy, Joint California Workshop, “Advanced Metering Results and Issues” September 2004.
Figure IV-4. Average Residential Critical Peak Impacts by Rate Treatment Rate Type Peak Load Reduction
Time of Use 4.1%CPP-Fixed 12.5%CPP-Variable 34.5%Hottest CPP-Variable 47.4%
Source: Roger Levy, Joint California Workshop, “Advanced Metering Results and Issues” September 2004.

Appendix I: Data and Sources for Figures
Assessment of Demand Response and Advanced Metering Federal Energy Regulatory Commission
I-5
Figure IV-6. Direct Load Control programs offered by region and entity type Region Cooperative Utilities and
Political Sub-divisions Federal and
State Utilities Investor-Owned
Utilities Municipal
Entities ERCOT 2FRCC 3 2 1MRO 43 1 14 33NPCC 1 1 4 9RFC 23 12 5SERC 28 6 6SPP 12 2 WECC 5 5 2Other 5 1 4
Source: FERC Survey
Figure IV-7. Number of customers enrolled in DLC programs Region Cooperative Utilities and
Political Sub-divisions Federal and
State Utilities Investor-Owned
Utilities Municipal
Entities ERCOT 48,624FRCC 68,482 1,142,290 3,079MRO 432,817 347,750 468,569 39,678NPCC 1,500 31,887 93,067 4,904RFC 129,710 841,731 1042SERC 222,791 334,551 31,828SPP 29,113 17,147 WECC 204,949 231,334 2,093Other 20,797 7,837 2,219 1,161
Source: FERC Survey
Figure IV-8. Number of entities offering interruptible/curtailable tariffs by region and entity type
Region Cooperative Utilities and Political Sub-divisions
Federal and State Utilities
Investor-Owned Utilities
Municipal Entities
ERCOT 1 1FRCC 3 2 3MRO 24 1 15 17NPCC 1 7 16RFC 15 22 2SERC 31 2 8 2SPP 16 2 2 4WECC 2 7 2Other 3 1 3
Source: FERC Survey

Appendix I: Data and Sources for Figures
Assessment of Demand Response and Advanced Metering Federal Energy Regulatory Commission
I-6
Figure IV-9. Number of entities offering capacity, demand bidding, and emergency programs by region
Region Capacity Programs Demand Bidding Emergency ERCOT 0 1 0 FRCC 0 0 0 MRO 3 4 4 NPCC 4 2 15 RFC 3 1 3 SERC 0 3 0 SPP 1 0 0 WECC 5 7 5 Other 0 0 0
Source: FERC Survey
Figure IV-10. TOU tariffs offered to residential customers by entity type Region Cooperative Utilities and
Political Sub-Divisions Federal and
State Utilities Investor-Owned
Utilities Municipal
Entities ERCOT 1 1 1FRCC 1 2 2MRO 7 12 21NPCC 1 15 3RFC 6 15 SERC 23 1 12 2SPP 4 5 WECC 19 1 10 3Other 1
Source: FERC Survey
Figure IV-11. Residential customers on TOU tariffs by region and entity type Region Cooperative Utilities and
Political Sub-divisions Federal and
State Utilities Investor-Owned
Utilities Municipal
Entities ERCOT 60 1FRCC 250 2MRO 736 44003 215NPCC 10818 55827 104RFC 2424 681317 SERC 5777 4 8107 58SPP 6091 143870 WECC 157483 3 447745 1845Other 148
Source: FERC Survey

Appendix I: Data and Sources for Figures
Assessment of Demand Response and Advanced Metering Federal Energy Regulatory Commission
I-7
Figure IV-12. RTP tariffs offered by region and entity type
Region Cooperative Utilities and Political Sub-divisions
Federal and State Utilities
Investor-Owned Utilities
Municipal Entities
ERCOT 0 0 0 0FRCC 0 0 0 1MRO 1 0 8 0NPCC 1 1 9 1RFC 0 0 11 0
SERC 0 2 4 0SPP 1 0 1 0
WECC 1 0 1 1Other 0 0 1 0
Source: FERC Survey
Figure IV-13. Drivers for developing or expanding demand response programs Drivers Percentage Less Pollution 18% Genreation Shortage 22% Add'l Power to Sell 22% Reduce Local Congestion 26% Fewer Brownouts/Blackouts 28% Reduce Energy Costs 30% Lower Energy Bills for Participants 36% Reliability 52% Regulatory 55% Reduce Utility Costs 55%
Source: FERC Survey
Chapter V
Figure V-2. Demand response potential peak reduction
by region and customer class Region Residential Commercial Industrial Other (Agriculture) Wholesale
ERCOT 53 9 315 0 1,485FRCC 1,513 616 251 0 244MRO 1,307 317 2,804 176 275NPCC 236 822 591 33 1,618RFC 1,033 1,502 660 8 3,962SERC 758 243 3,586 51 248SPP 84 168 99 17 635WECC 807 1,054 1,251 304 431Other 12 71 3 0 1
Source: FERC Survey Notes: Other reliability region includes Alaska and Hawaii

Appendix I: Data and Sources for Figures
Assessment of Demand Response and Advanced Metering Federal Energy Regulatory Commission
I-8
Figure V-3. Demand response potential peak load reduction by type of entity and customer class
Utility Type Residential Commercial Industrial Other (Agriculture)
Wholesale
Investor-Owned Utility 3,927 3,377 5,158 246 395Cooperative Utility and Political Sub-division
1,232 406 930 306 941
Municipal Utility and Municipal Marketing Authority
227 333 538 3 61
Curtailment Service Provider and Power Marketer
0 162 387 0 0
Federal and State Utilities 416 517 2,541 33 367ISO/RTO 0 0 0 0 7,134
Source: FERC Survey
Figure V-4. Resource potential of various types of demand response programs and time-based tariffs
Program Residential Commercial Industrial Other (Agriculture)
ISO/RTO
Interruptible 82 1,103 6,266 58 Direct Load Control 5,541 768 62 257 Emergency Demand Response 62 892 252 12 1760Capacity 350 150 2,091Ancillary Services 10 1,547Demand Bidding 104 250 2,414Multiple 35 1,218 1,358 25 Other 6 162 439 236 Real-Time Pricing 0 445 659 Critical Peak Pricing 16 39 57 0 Time-of-Use 63 10 95
Source: FERC Survey
Figure V-5. Demand response resource potential versus actual deployed demand response resources by region
Region Potential Peak Reduction Actual Peak Reduction ERCOT 1,862 62 FRCC 2,624 1,297 MRO 4,878 2,227 NPCC 3,301 447 RFC 7,165 1,212 SERC 4,887 1,606 SPP 1,003 136 WECC 3,847 1,675 Other 88 55
Source: FERC Survey Notes: Other reliability region includes Alaska and Hawaii
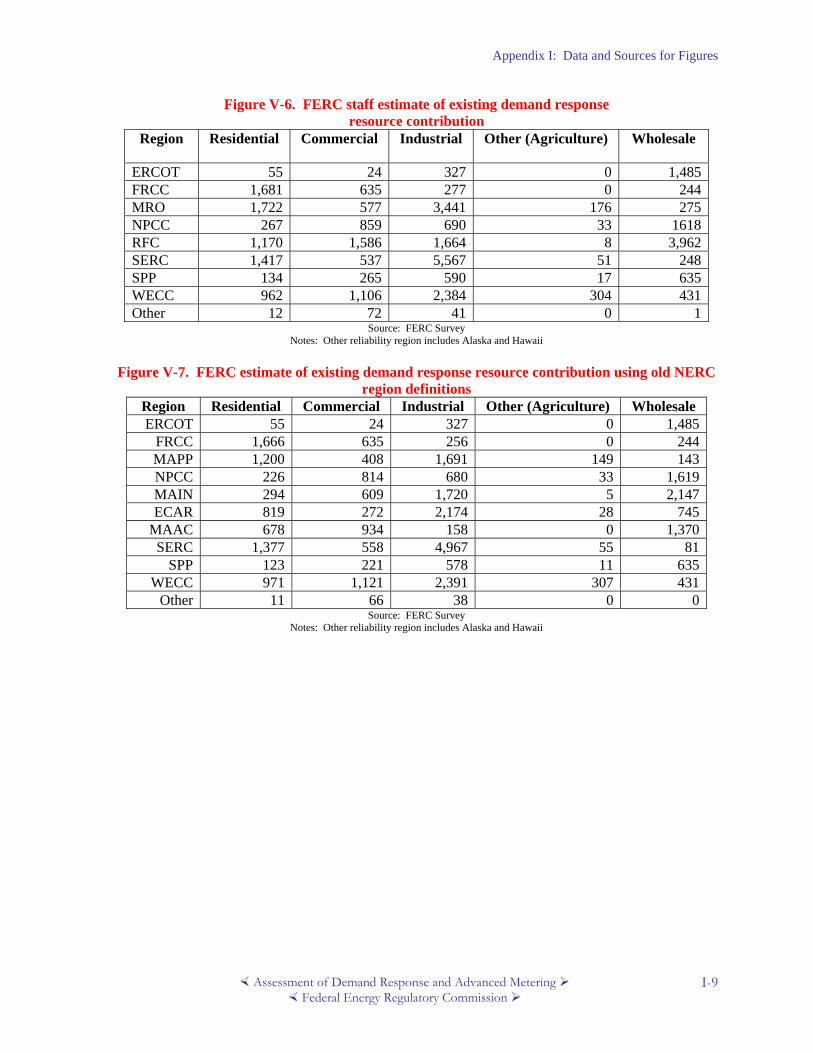
Appendix I: Data and Sources for Figures
Assessment of Demand Response and Advanced Metering Federal Energy Regulatory Commission
I-9
Figure V-6. FERC staff estimate of existing demand response resource contribution
Region Residential Commercial Industrial Other (Agriculture) Wholesale
ERCOT 55 24 327 0 1,485FRCC 1,681 635 277 0 244MRO 1,722 577 3,441 176 275NPCC 267 859 690 33 1618RFC 1,170 1,586 1,664 8 3,962SERC 1,417 537 5,567 51 248SPP 134 265 590 17 635WECC 962 1,106 2,384 304 431Other 12 72 41 0 1
Source: FERC Survey Notes: Other reliability region includes Alaska and Hawaii
Figure V-7. FERC estimate of existing demand response resource contribution using old NERC
region definitions Region Residential Commercial Industrial Other (Agriculture) Wholesale ERCOT 55 24 327 0 1,485
FRCC 1,666 635 256 0 244MAPP 1,200 408 1,691 149 143NPCC 226 814 680 33 1,619MAIN 294 609 1,720 5 2,147ECAR 819 272 2,174 28 745
MAAC 678 934 158 0 1,370SERC 1,377 558 4,967 55 81
SPP 123 221 578 11 635WECC 971 1,121 2,391 307 431
Other 11 66 38 0 0Source: FERC Survey
Notes: Other reliability region includes Alaska and Hawaii

Appendix I: Data and Sources for Figures
Assessment of Demand Response and Advanced Metering Federal Energy Regulatory Commission
I-10
Figure V-8. FERC staff estimate of existing demand response resource contribution by entity type and customer class
Utility Type Residential Commercial Industrial Other (Agriculture)
Wholesale
Investor-Owned Utility 4,235 3,626 9,029 246 395Cooperative Utility and Political Sub-division
2,360 915 1,899 306 941
Municipal Utility and Municipal Marketing Authority
338 433 903 3 61
Curtailment Service Provider and Power Marketer
0 162 387 0 0
Federal and State Utilities 486 518 2,757 33 367ISO/RTO 7,134
Source: FERC Survey
Chapter VII
Figure VII-1. Regulator treatment of AMI and Demand Response
Regulator Response Percent Yes - some recovery of prudent expenses 39% Yes - full recovery of prudent expenses 35% No 17% No reply 9%
Source: Patti Harper-Slaboszewicz, UtiliPoint, “Regulator Interest in AMI and Demand Response,” written remarks submitted as panelist, FERC Technical Conference, 5

Appendix J: Acknowledgements
Assessment of Demand Response and Advanced Metering Federal Energy Regulatory Commission
J-1
Appendix J: Acknowledgements
Federal Energy Regulatory CommissionTeam David Kathan, Team Lead Michael Goldenberg Norma McOmber Eileen Merrigan Aileen Roder Carol Brotman White Information Clearance Officer Michael P. Miller
Editor John Jennrich Graphics Judy Eastwood Production and Logistics Commission Publishing Services Staff Valerie Mersier, Team Lead for Publishing Services Michael Brown Kevin Wormley
Technical Support and Advice UtiliPoint International, Inc Patti Harper-Slaboszewicz, Project Manager Ethan Cohen J. Christopher Purdue Maria Elena West Lawrence Berkeley National Laboratory Chuck Goldman Ranjit Bharvirkar
Oak Ridge National Laboratory Brendan Kirby Demand Response and Advanced Metering Coalition (DRAM) Dan Delurey Mid-Atlantic Demand Response Initiative (MADRI) Richard E. Morgan
Survey Authorization Office of Management and Budget John A. Asalone, Desk Officer (FERC) Coordination of Efforts Government Energy Information Administration Robert Schnapp, Director Electric Power Division National Association of Regulatory Commissioners Grace D. Soderberg, Assistant General Counsel
Industry American Public Power Association John Kelly Edison Electric Institute Richard Tempchin National Rural Electric Cooperative Association Jay Morrison Richard Meyer

Appendix J: Acknowledgements
Assessment of Demand Response and Advanced Metering Federal Energy Regulatory Commission
J-2

Errata to the 2006 Report
Assessment of Demand Response and Advanced Metering Federal Energy Regulatory Commission
Errata-1
Errata: Corrected Advanced Metering and Demand Response Figures and Tables
During the analysis of the 2008 FERC Survey, Commission staff identified several errors in the reported 2006 FERC Survey findings. The figures and tables below represent the corrected data for 2006. Please use the figures and tables below in place of those similarly named in the Executive Summary and Chapters III and IV of the 2006 FERC Demand Response report.

Errata to the 2006 Report
Assessment of Demand Response and Advanced Metering Federal Energy Regulatory Commission
Errata-2
Table ES-1. States with the highest penetration of advanced metering
Source: FERC Survey Revised December 2008
Figure ES-1. Penetration of advanced metering by region
3.0%
1.2%
0.7%0.6% 0.5% 0.4%
0.1% 0.1% 0.0%0%
1%
1%
2%
2%
3%
3%
4%
SPP SERC ERCOT MRO WECC RFC NPCC FRCC Other
NERC Region
Adva
nced
Met
erin
g Pe
netr
atio
n
Source: FERC Survey
Revised December 2008
State Advanced Metering Penetration
Arkansas 5.0%Idaho 3.9%Alabama 3.3%Oklahoma 3.0%Colorado 1.7%Georgia 1.7%Kansas 1.3%Kentucky 1.2%South Carolina 1.0%Illinois 0.8%

Errata to the 2006 Report
Assessment of Demand Response and Advanced Metering Federal Energy Regulatory Commission
Errata-3
Figure III-4. United States penetration of advanced metering
Non-Advanced Metering, 99.3%
Advanced Metering, 0.7%
Advanced MeteringNon-Advanced Metering
Source: FERC Survey
Revised December 2008
Figure III-5. Penetration of advanced metering by customer class
2.2%
4.5%
3.7%
0.8%0.6%
0.0%
0.5%
1.0%
1.5%
2.0%
2.5%
3.0%
3.5%
4.0%
4.5%
5.0%
Other Transportation Industrial Commercial Residential
Customer Class
Adv
ance
d M
eter
ing
Pene
trat
ion
Source: FERC Survey Revised December 2008
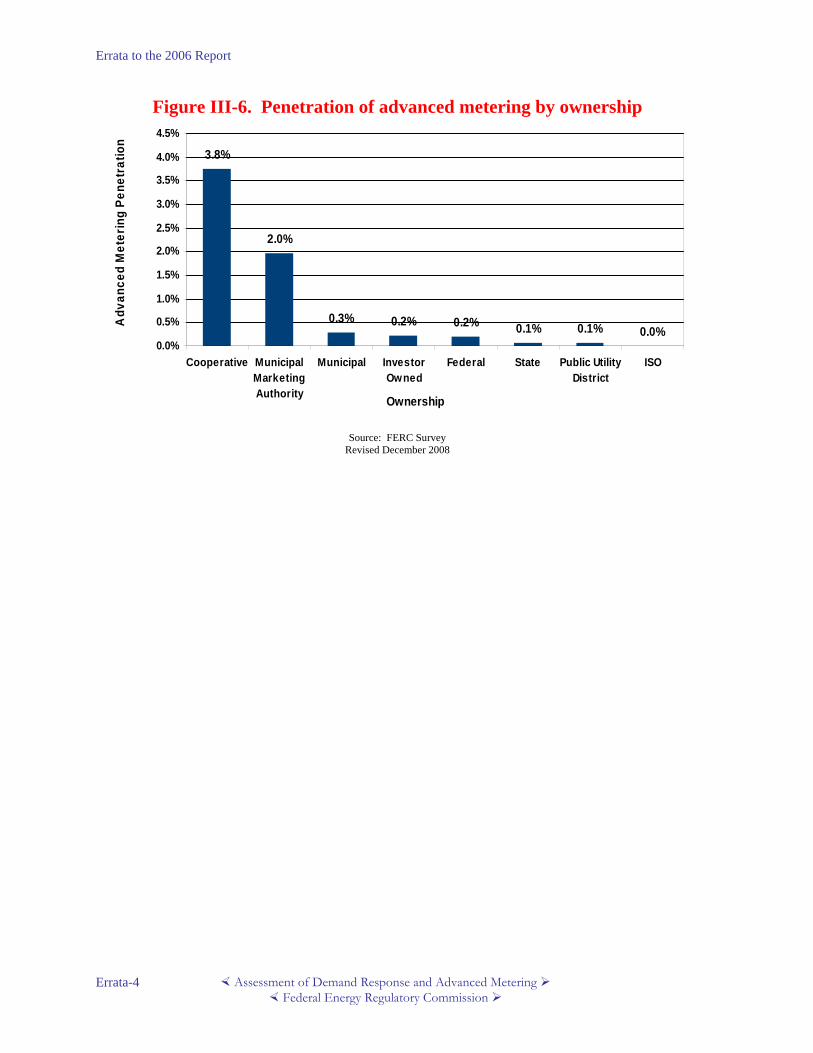
Errata to the 2006 Report
Assessment of Demand Response and Advanced Metering Federal Energy Regulatory Commission
Errata-4
Figure III-6. Penetration of advanced metering by ownership
3.8%
2.0%
0.3% 0.2% 0.2% 0.1% 0.1% 0.0%0.0%
0.5%
1.0%
1.5%
2.0%
2.5%
3.0%
3.5%
4.0%
4.5%
Cooperative MunicipalMarketingAuthority
Municipal InvestorOwned
Federal State Public UtilityDistrict
ISO
Ownership
Adv
ance
d M
eter
ing
Pene
trat
ion
Source: FERC Survey Revised December 2008

Errata to the 2006 Report
Assessment of Demand Response and Advanced Metering Federal Energy Regulatory Commission
Errata-5
Figure III-7. Penetration of advanced metering by NERC region
1.1%
15.5%
3.0% 2.5%
0.0%
4.0%4.1%
16.4%
4.8%
0.1%0.1%0.4%0.7%1.2%
3.0%
0.6% 0.0%0.5%
0%
2%
4%
6%
8%
10%
12%
14%
16%
18%
SPP SERC ERCOT MRO WECC RFC NPCC FRCC Other
NERC Region
Adv
ance
d M
eter
ing
Pene
trat
ion
Capable of AMI Used for AMI
Source: FERC Survey Revised December 2008
Table III-1. Penetration of AMI by region and customer class
Region Residential Commercial Industrial Transportation Other
RFC 0.3% 0.5% 6.1% 89.8% 0.4% SPP 3.3% 1.4% 0.5% 48.6% 5.5% SERC 1.3% 0.8% 1.5% 6.5% 2.9% ERCOT 0.7% 0.7% 0.6% 0.0% 0.0% MRO 0.5% 0.7% 10.0% 0.0% 0.2% NPCC 0.1% 0.6% 4.8% 1.4% 3.4% FRCC 0.1% 0.2% 35.0% 0.0% 0.0% WECC 0.3% 1.2% 6.4% 0.5% 4.6% Other 0.0% 0.0% 0.1% 0.0% 0.1% Total 0.6% 0.8% 3.7% 4.5% 2.2%
Source: FERC Survey
Revised December 2008

Errata to the 2006 Report
Assessment of Demand Response and Advanced Metering Federal Energy Regulatory Commission
Errata-6
Table III-2. Penetration of advanced metering by state
State Advanced Meters Total Meters Penetration Alabama 89,702 2,738,519 3.3% Alaska 6 305,949 0.0% Arizona 5,521 2,783,083 0.2% Arkansas 75,118 1,494,383 5.0% California 40,153 14,253,873 0.3% Colorado 39,274 2,263,873 1.7% Connecticut 3,862 1,580,365 0.2% Delaware 16 421,331 0.0% District of Columbia 0 809,412 0.0% Florida 8,479 9,679,565 0.1% Georgia 73,312 4,404,447 1.7% Hawaii 45 465,314 0.0% Idaho 29,062 739,199 3.9% Illinois 43,043 5,510,470 0.8% Indiana 13,137 3,217,359 0.4% Iowa 110 1,591,985 0.0% Kansas 18,913 1,430,953 1.3% Kentucky 27,501 2,225,485 1.2% Louisiana 44 1,037,355 0.0% Maine 716 773,164 0.1% Maryland 130 1,972,886 0.0% Massachusetts 6,940 3,244,778 0.2% Michigan 31,254 4,877,345 0.6% Minnesota 11,780 2,537,414 0.5% Mississippi 82 1,015,493 0.0% Missouri 8,986 3,087,821 0.3% Montana 162 529,135 0.0% Nebraska 1,520 937,148 0.2% Nevada 17 1,193,873 0.0% New Hampshire 306 759,514 0.0% New Jersey 25,222 3,884,140 0.6% New Mexico 1 875,393 0.0% New York 3,071 7,906,309 0.0% North Carolina 29,411 4,681,178 0.6% North Dakota 29 367,776 0.0% Ohio 1,958 6,307,050 0.0% Oklahoma 60,273 2,024,592 3.0% Oregon 2,960 1,821,710 0.2% Pennsylvania 18,200 6,053,110 0.3% Rhode Island 398 480,275 0.1% South Carolina 19,655 2,007,339 1.0% South Dakota 7 484,728 0.0% Tennessee 426 3,165,211 0.0% Texas 28,200 10,195,134 0.3% Utah 1 1,036,605 0.0% Vermont 1 331,161 0.0% Virginia 5,016 3,412,011 0.1% Washington 477 3,061,233 0.0% West Virginia 17 1,234,035 0.0% Wisconsin 19,882 2,983,075 0.7% Wyoming 0 272,033 0.0%
Source: FERC Survey – Revised December 2008
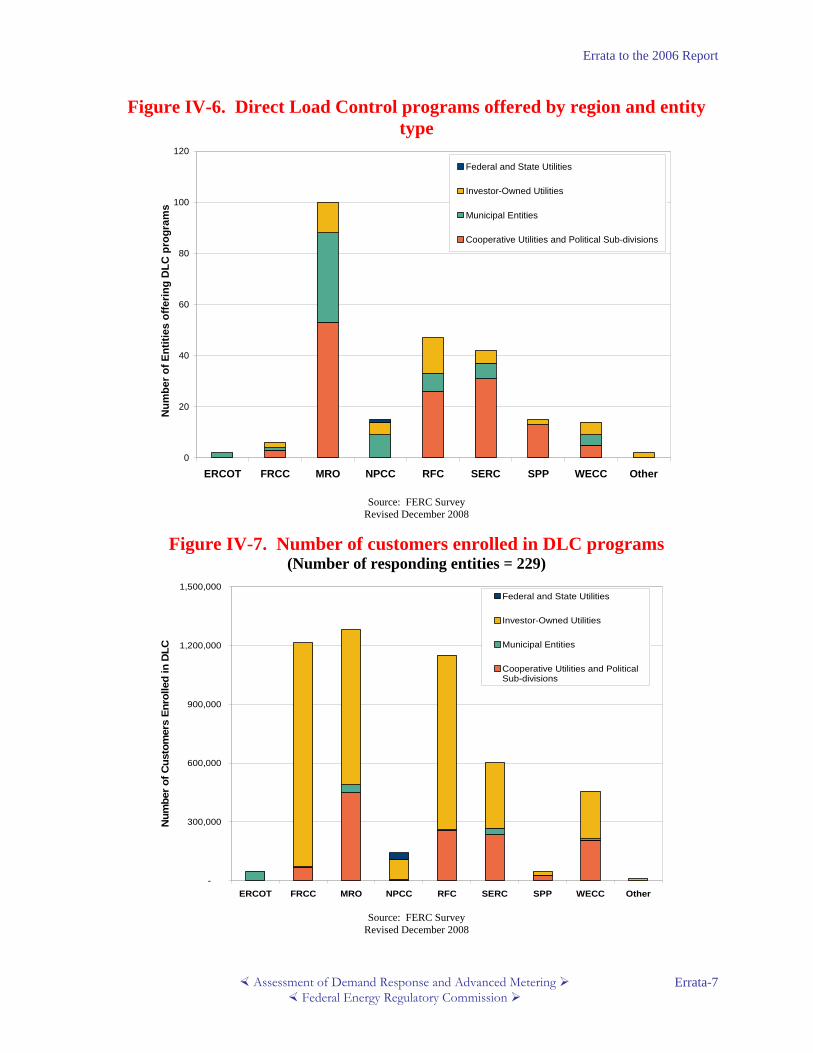
Errata to the 2006 Report
Assessment of Demand Response and Advanced Metering Federal Energy Regulatory Commission
Errata-7
Figure IV-6. Direct Load Control programs offered by region and entity type
0
20
40
60
80
100
120
ERCOT FRCC MRO NPCC RFC SERC SPP WECC Other
Num
ber o
f Ent
ities
offe
ring
DLC
pro
gram
sFederal and State Utilities
Investor-Owned Utilities
Municipal Entities
Cooperative Utilities and Political Sub-divisions
Source: FERC Survey
Revised December 2008
Figure IV-7. Number of customers enrolled in DLC programs (Number of responding entities = 229)
-
300,000
600,000
900,000
1,200,000
1,500,000
ERCOT FRCC MRO NPCC RFC SERC SPP WECC Other
Num
ber o
f Cus
tom
ers
Enro
lled
in D
LC
Federal and State Utilities
Investor-Owned Utilities
Municipal Entities
Cooperative Utilities and PoliticalSub-divisions
Source: FERC Survey
Revised December 2008

Errata to the 2006 Report
Assessment of Demand Response and Advanced Metering Federal Energy Regulatory Commission
Errata-8
Table IV-1. Number of entities offering incentive-based demand response
programs in the United States Type of Program Number of Entities
Direct Load Control 245 Interruptible/Curtailable 253
Emergency Demand Response Program 59 Capacity Market Program 34 Demand Bidding/Buyback 30
Ancillary Services 19 Source: FERC Survey
Revised December 2008
Table IV-2. Top 10 entities by customers enrolled in DLC programs
Name of Utility Number of Customers Enrolled in DLC
Florida Power and Light 721,728 Progress Energy Florida 401,392
Detroit Edison 347,750 Baltimore Gas and Electric 322,190
Northern States Power 271,744 Duke Power 207,772
Southern California Edison 163,545 Public Service Electric & Gas 119,310
Buckeye Power 114,500 Dairyland Power Cooperative 112,000
Source: FERC Survey Revised December 2008

Errata to the 2006 Report
Assessment of Demand Response and Advanced Metering Federal Energy Regulatory Commission
Errata-9
Figure IV-8. Number of entities offering interruptible / curtailable tariffs by region and entity type
0
10
20
30
40
50
60
70
ERCOT FRCC MRO NPCC RFC SERC SPP WECC Other
Num
ber o
f Ent
ities
offe
ring
I/C P
rogr
ams
Federal and State Utilities
Investor-Owned Utilities
Municipal Entities
Cooperative Utilities andPolitical Sub-divisions
Source: FERC Survey
Revised December 2008
Figure IV-9. Number of entities offering capacity, demand bidding, and
emergency programs by region
0
5
10
15
20
25
30
ERCOT FRCC MRO NPCC RFC SERC SPP WECC Other
Num
ber o
f Ent
ities
Capacity Programs
Demand Bidding
Emergency
Source: FERC Survey
Revised December 2008

Errata to the 2006 Report
Assessment of Demand Response and Advanced Metering Federal Energy Regulatory Commission
Errata-10
Table IV-3. Number of entities offering time-based rates in the United States
Type of Program Number of Entities Time-of-Use Rates 366 Real-time Pricing 60
Critical Peak Pricing 36
Source: FERC Survey Revised December 2008
Figure IV-10. TOU tariffs offered to residential customers by entity type
-
20
40
60
80
100
120
ERCOT FRCC MRO NPCC RFC SERC SPP WECC Other
Num
ber o
f Ent
ities
that
offe
r TO
U T
arrif
s to
Res
iden
tial C
usto
mer
s
Federal and State Utilities
Investor-Owned Utilities
Municipal Entities
Cooperative Utilities and Political Sub-divisions
Source: FERC Survey
Revised December 2008
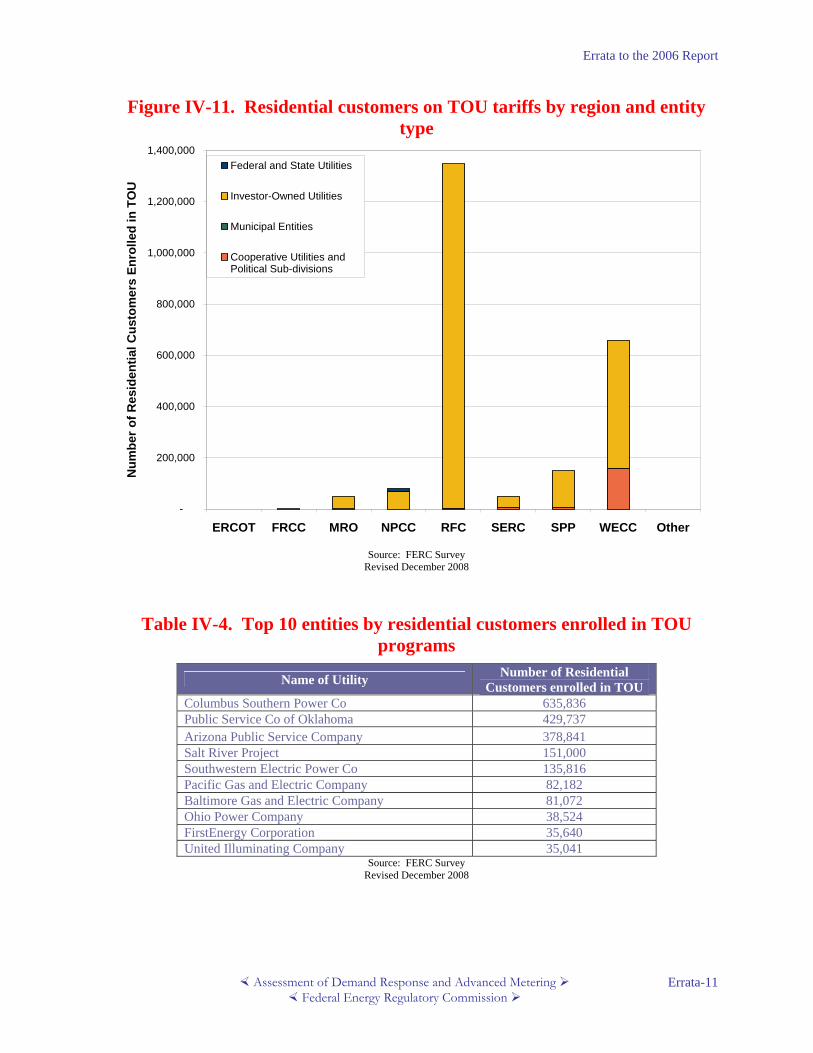
Errata to the 2006 Report
Assessment of Demand Response and Advanced Metering Federal Energy Regulatory Commission
Errata-11
Figure IV-11. Residential customers on TOU tariffs by region and entity type
-
200,000
400,000
600,000
800,000
1,000,000
1,200,000
1,400,000
ERCOT FRCC MRO NPCC RFC SERC SPP WECC Other
Num
ber o
f Res
iden
tial C
usto
mer
s En
rolle
d in
TO
U
Federal and State Utilities
Investor-Owned Utilities
Municipal Entities
Cooperative Utilities andPolitical Sub-divisions
Source: FERC Survey
Revised December 2008
Table IV-4. Top 10 entities by residential customers enrolled in TOU programs
Name of Utility Number of Residential Customers enrolled in TOU
Columbus Southern Power Co 635,836 Public Service Co of Oklahoma 429,737 Arizona Public Service Company 378,841 Salt River Project 151,000 Southwestern Electric Power Co 135,816 Pacific Gas and Electric Company 82,182 Baltimore Gas and Electric Company 81,072 Ohio Power Company 38,524 FirstEnergy Corporation 35,640 United Illuminating Company 35,041
Source: FERC Survey Revised December 2008

Errata to the 2006 Report
Assessment of Demand Response and Advanced Metering Federal Energy Regulatory Commission
Errata-12
Table IV-5. Top five entities by number of customers enrolled in CPP programs
Name of Utility Number of Customers enrolled in CPP
Constellation NewEnergy 63,500 Gulf Power Company 6,878 Cass County Electric Cooperative 2,892 San Diego Gas and Electric 1,410
Source: FERC Survey Revised December 2008
Figure IV-12. RTP tariffs offered by region and entity type
-
5
10
15
20
ERCOT FRCC MRO NPCC RFC SERC SPP WECC Other
Num
ber o
f Ent
ities
Offe
ring
RTP
rate
s
Federal and State Utilities
Investor-Owned Utilities
Municipal Entities
Cooperative Utilities and PoliticalSub-divisions
Source: FERC Survey
Revised December 2008
