deloitte consumer insights adapting to the new normal in
TRANSCRIPT
Deloitte Consumer InsightsAdapting to the new normal in IndonesiaFebruary 2021
Foreword 03
Adapting to the new normal in Indonesia 04
Deloitte Consumer Insights 10
1. Heart: Understanding changes in consumer sentiment 12
2. Wallet: Observing changes in consumer expenditure 17
3. Mind: Deciphering new purchase drivers 24
Looking ahead 45
Contact us 46
03
Foreword
For consumer companies in Indonesia, the outbreak of the COVID-19 pandemic has brought numerous challenges and opportunities. Despite the overall economic uncertainty, we have observed the resilience and agility of consumers and businesses as they adapt to the new normal, making adjustments to adopt new ways of working – and indeed, living.
As it becomes increasingly clear that many of these new shifts are here to stay, this seventh edition of the Deloitte Consumer Insights will explore some of the key changes in consumer behaviour and purchasing patterns that we believe will shape the mid- to long-term trajectory of the consumer industry in Indonesia.
In this report, we present our findings from the recent survey conducted between June and September 2020 across 1,500 households through face-to-face interviews in five major cities: Bandung, Jakarta, Makassar, Medan and Surabaya. To facilitate discussions on the consumer journey and highlight segment-specific insights where possible, we have also developed four personas to represent the various key consumer segments in Indonesia: Siti, Gus, Udin, and Tina.
Through their lenses, we will explore the consumer journey while analysing the impact of the pandemic and other macro trends on the Indonesian consumer’s heart, wallet, and mind. We will begin by examining the overall consumer sentiment, including their economic and employment outlook, as well as income expectations. Overall, we observed that the consumer sentiment remains moderate despite economic headwinds, with high-income households and younger consumers exhibiting a more positive outlook.
Next, we explore some of the shifts in consumer spending, which reflect not only a greater prudence amidst the ongoing pandemic, but also a shift in priorities as consumers adapt to new ways of remote working and the accompanying lifestyle changes.
Finally, we take a look at the purchasing drivers and other behaviours exhibited throughout the purchasing journey from pre-purchase, to purchase, and post-purchase. While COVID-19 has undoubtedly accelerated the use of digital channels across Indonesia, we found that several assurance-related considerations still continue to hinder its uptake. Looking ahead, consumer companies should also consider ways to stay ahead of the game by leveraging next-generation technologies to better integrate their offline-online experiences.
We hope that this report will provide you with some insights into the Indonesian consumer, and the considerations that you will need to make as we adapt to this new normal.
Pua Wee MengConsumer Industry LeaderDeloitte Southeast Asia

04
Deloitte Consumer Insights | Adapting to the new normal in Indonesia
Adapting to the new normal in Indonesia
The widespread impact of COVID-19 has undoubtedly acted as a catalyst for many existing trends that had already been in motion in the pre-pandemic era. Although Indonesia had already possessed a relatively young and digitally-savvy population with one of the world’s highest number of active Internet and social media users even before the outbreak, the pandemic has resulted in a rapid acceleration of e-commerce adoption and increase in the overall digital readiness amongst Indonesian consumers as they adapted to new ways of working, shopping, and living. Given Indonesia’s market size as the world’s fourth most populous nation and tenth largest economy in terms of purchasing power parity1, consumer companies are now, more than ever, exploring various means to acquire, retain, and expand their consumer base in response to these new consumer habits, moving swiftly to digitalise their purchasing experience, leverage social media platforms, and implement other innovative strategies.
In this section, we will explore four characteristics of the Indonesian consumer in the new normal, and present four consumer personas whose journeys we will follow over the course of the report as we discuss the impact of the pandemic and other macro consumer trends on the three dimensions of the Indonesian consumer’s heart, wallet, and mind.
Four characteristics of the Indonesian consumerOverall, our latest research findings based on the Deloitte Consumer Insights survey conducted in Indonesia in the midst of the COVID-19 pandemic between June and September 2020 (see ‘Methodology’ section for more details) revealed four key characteristics of the Indonesian consumer in the new normal:
• Moderate consumer sentiment Despite the impact of COVID-19 on the economy, consumer sentiment has remained moderate. This resilience of the Indonesian consumer provides generally favourable conditions for consumer companies to thrive in the mid- to long-term future.
• Shift in priorities towards necessities Changes in the Indonesian consumer’s expenditures have reflected a shift in priorities towards necessities, and away from discretionary spending. This also suggests an increasing price sensitivity, which consumer companies will need to adapt to in order to acquire and retain their customers.
1 “Indonesia: Overview”. The World Bank. 1 October 2020.
05
Deloitte Consumer Insights | Adapting to the new normal in Indonesia
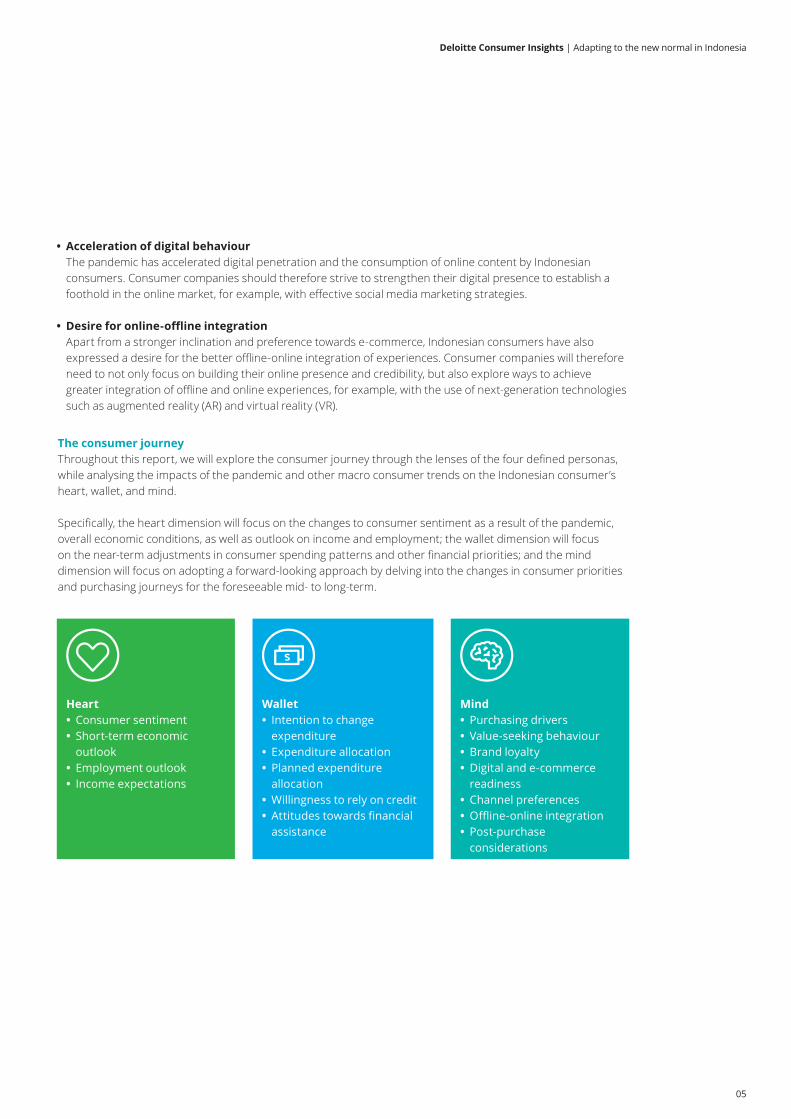
The consumer journeyThroughout this report, we will explore the consumer journey through the lenses of the four defined personas, while analysing the impacts of the pandemic and other macro consumer trends on the Indonesian consumer’s heart, wallet, and mind.
Specifically, the heart dimension will focus on the changes to consumer sentiment as a result of the pandemic, overall economic conditions, as well as outlook on income and employment; the wallet dimension will focus on the near-term adjustments in consumer spending patterns and other financial priorities; and the mind dimension will focus on adopting a forward-looking approach by delving into the changes in consumer priorities and purchasing journeys for the foreseeable mid- to long-term.
Heart • Consumer sentiment • Short-term economic outlook
• Employment outlook • Income expectations
Wallet • Intention to change expenditure
• Expenditure allocation • Planned expenditure allocation
• Willingness to rely on credit • Attitudes towards financial assistance
Mind • Purchasing drivers • Value-seeking behaviour • Brand loyalty • Digital and e-commerce readiness
• Channel preferences • Offline-online integration • Post-purchase considerations
• Acceleration of digital behaviour The pandemic has accelerated digital penetration and the consumption of online content by Indonesian consumers. Consumer companies should therefore strive to strengthen their digital presence to establish a foothold in the online market, for example, with effective social media marketing strategies.
• Desire for online-offline integration Apart from a stronger inclination and preference towards e-commerce, Indonesian consumers have also expressed a desire for the better offline-online integration of experiences. Consumer companies will therefore need to not only focus on building their online presence and credibility, but also explore ways to achieve greater integration of offline and online experiences, for example, with the use of next-generation technologies such as augmented reality (AR) and virtual reality (VR).
06
Deloitte Consumer Insights | Adapting to the new normal in Indonesia
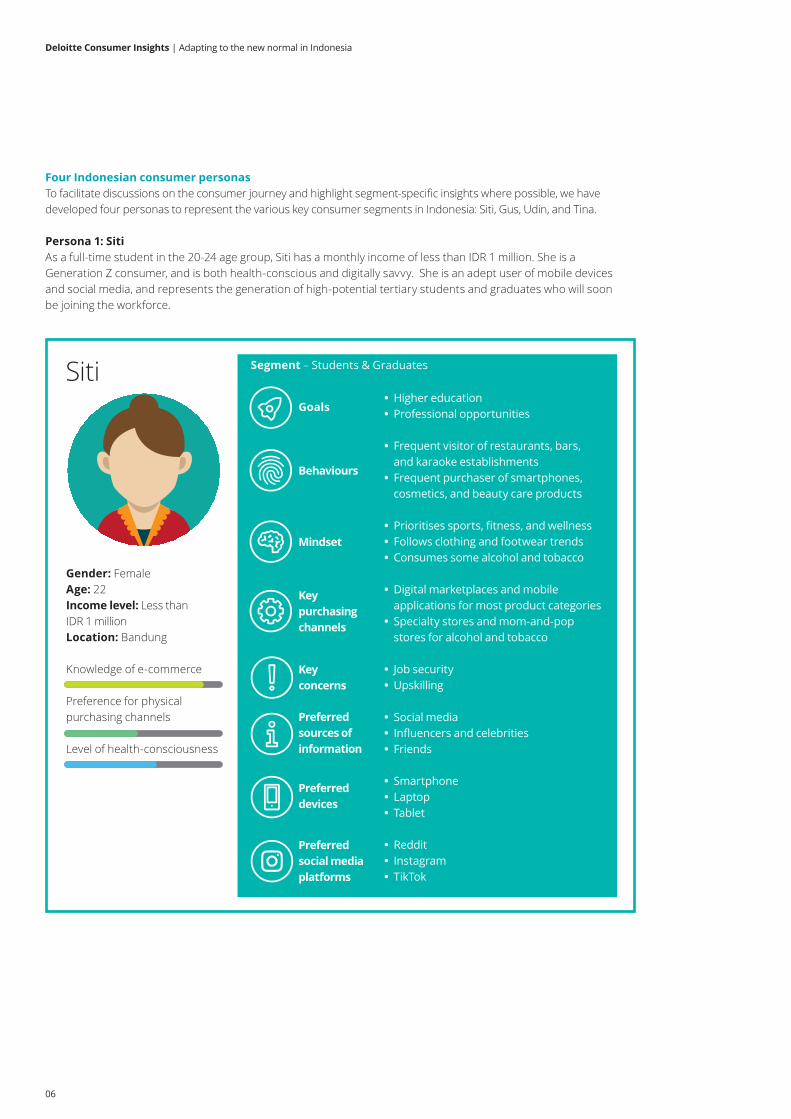
Four Indonesian consumer personasTo facilitate discussions on the consumer journey and highlight segment-specific insights where possible, we have developed four personas to represent the various key consumer segments in Indonesia: Siti, Gus, Udin, and Tina.
Persona 1: SitiAs a full-time student in the 20-24 age group, Siti has a monthly income of less than IDR 1 million. She is a Generation Z consumer, and is both health-conscious and digitally savvy. She is an adept user of mobile devices and social media, and represents the generation of high-potential tertiary students and graduates who will soon be joining the workforce.
Preferredsources of information
Gender: FemaleAge: 22Income level: Less than IDR 1 millionLocation: Bandung
Knowledge of e-commerce
Preference for physical purchasing channels
Level of health-consciousness
Segment – Students & Graduates
Goals
Behaviours
Mindset
Key purchasing channels
Key concerns
Preferred sources of information
Preferred devices
Preferred social media platforms
Siti • Higher education • Professional opportunities
• Frequent visitor of restaurants, bars, and karaoke establishments
• Frequent purchaser of smartphones, cosmetics, and beauty care products
• Prioritises sports, fitness, and wellness • Follows clothing and footwear trends • Consumes some alcohol and tobacco
• Digital marketplaces and mobile applications for most product categories
• Specialty stores and mom-and-pop stores for alcohol and tobacco
• Job security • Upskilling
• Social media • Influencers and celebrities • Friends
• Smartphone • Laptop • Tablet
• Reddit • Instagram • TikTok
07
Deloitte Consumer Insights | Adapting to the new normal in Indonesia
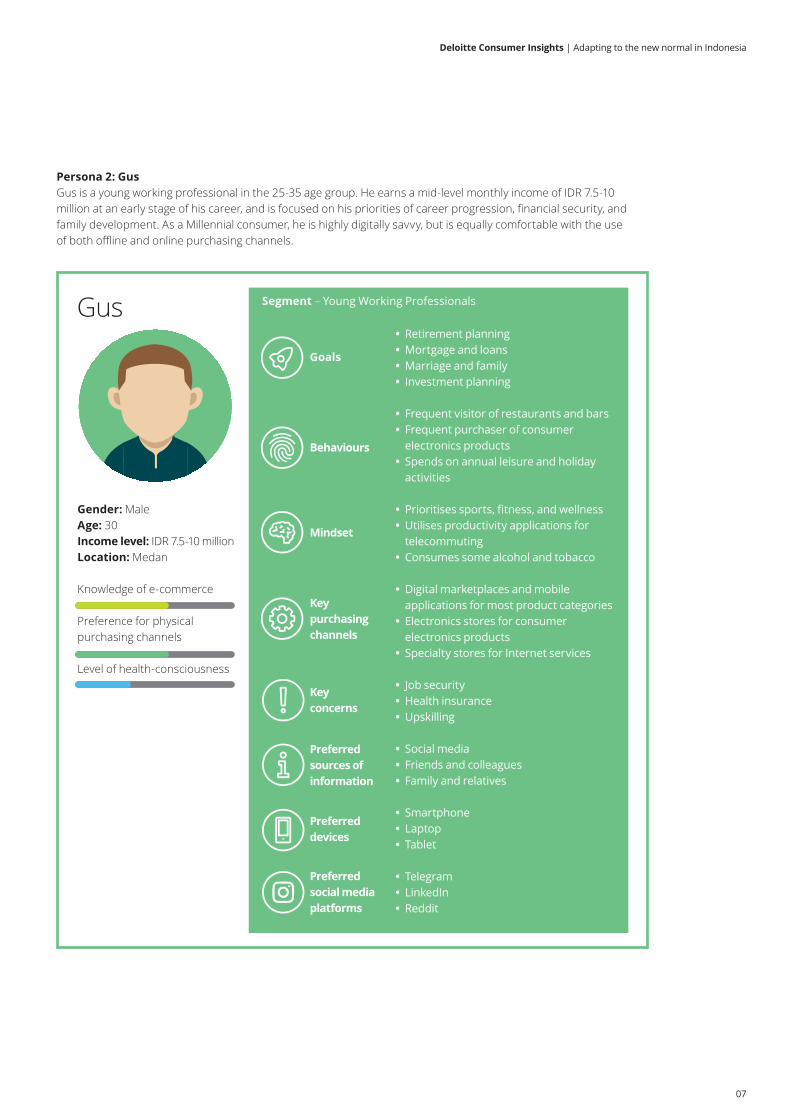
Persona 2: GusGus is a young working professional in the 25-35 age group. He earns a mid-level monthly income of IDR 7.5-10 million at an early stage of his career, and is focused on his priorities of career progression, financial security, and family development. As a Millennial consumer, he is highly digitally savvy, but is equally comfortable with the use of both offline and online purchasing channels.
Gender: MaleAge: 30Income level: IDR 7.5-10 millionLocation: Medan
Knowledge of e-commerce
Preference for physical purchasing channels
Level of health-consciousness
Segment – Young Working Professionals
Goals
Behaviours
Mindset
Key purchasing channels
Key concerns
Preferred sources of information
Preferred devices
Preferred social media platforms
Gus • Retirement planning • Mortgage and loans • Marriage and family • Investment planning
• Frequent visitor of restaurants and bars • Frequent purchaser of consumer electronics products
• Spends on annual leisure and holiday activities
• Prioritises sports, fitness, and wellness • Utilises productivity applications for telecommuting
• Consumes some alcohol and tobacco
• Digital marketplaces and mobile applications for most product categories
• Electronics stores for consumer electronics products
• Specialty stores for Internet services
• Job security • Health insurance • Upskilling
• Social media • Friends and colleagues • Family and relatives
• Smartphone • Laptop • Tablet
• Telegram • LinkedIn • Reddit
08
Deloitte Consumer Insights | Adapting to the new normal in Indonesia
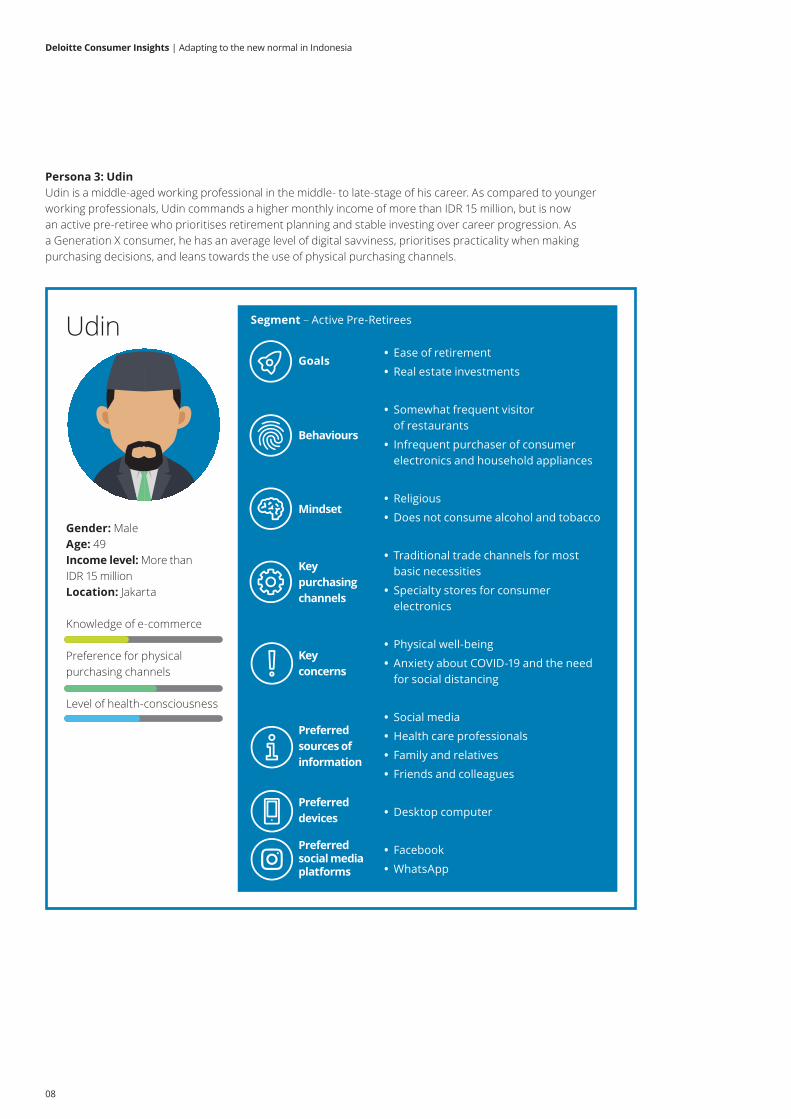
Persona 3: UdinUdin is a middle-aged working professional in the middle- to late-stage of his career. As compared to younger working professionals, Udin commands a higher monthly income of more than IDR 15 million, but is now an active pre-retiree who prioritises retirement planning and stable investing over career progression. As a Generation X consumer, he has an average level of digital savviness, prioritises practicality when making purchasing decisions, and leans towards the use of physical purchasing channels.
Goals Key concerns
Preferredsources of informationMind Set
Keypurchasingchannels
Behaviours
Gender: MaleAge: 49Income level: More than IDR 15 millionLocation: Jakarta
Knowledge of e-commerce
Preference for physical purchasing channels
Level of health-consciousness
Segment – Active Pre-Retirees
Goals
Behaviours
Mindset
Key purchasing channels
Key concerns
Preferred sources of information
Preferred devices
Preferred social media platforms
Udin • Ease of retirement
• Real estate investments
• Somewhat frequent visitor of restaurants
• Infrequent purchaser of consumer electronics and household appliances
• Religious
• Does not consume alcohol and tobacco
• Traditional trade channels for most basic necessities
• Specialty stores for consumer electronics
• Physical well-being
• Anxiety about COVID-19 and the need for social distancing
• Social media
• Health care professionals
• Family and relatives
• Friends and colleagues
• Desktop computer
09
Deloitte Consumer Insights | Adapting to the new normal in Indonesia
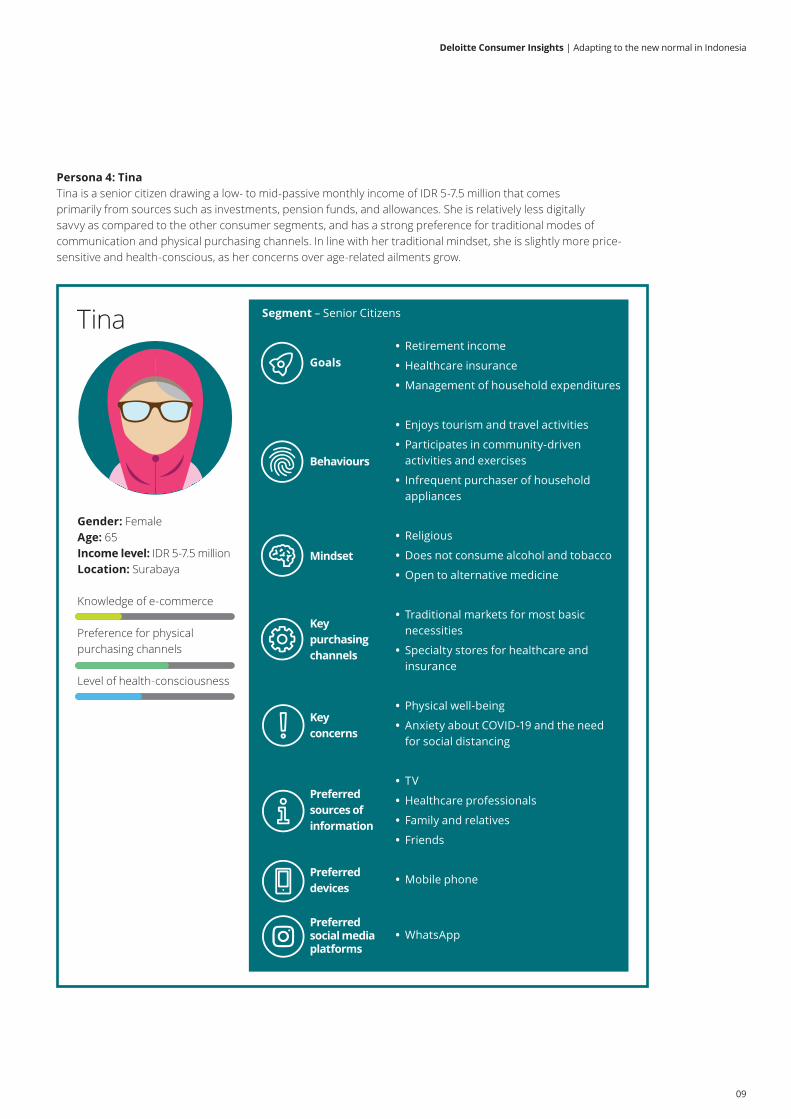
Persona 4: TinaTina is a senior citizen drawing a low- to mid-passive monthly income of IDR 5-7.5 million that comes primarily from sources such as investments, pension funds, and allowances. She is relatively less digitally savvy as compared to the other consumer segments, and has a strong preference for traditional modes of communication and physical purchasing channels. In line with her traditional mindset, she is slightly more price-sensitive and health-conscious, as her concerns over age-related ailments grow.
Gender: FemaleAge: 65Income level: IDR 5-7.5 millionLocation: Surabaya
Knowledge of e-commerce
Preference for physical purchasing channels
Level of health-consciousness
Segment – Senior Citizens
Goals
Behaviours
Mindset
Key purchasing channels
Key concerns
Preferred sources of information
Preferred devices
Preferred social media platforms
Tina • Retirement income
• Healthcare insurance
• Management of household expenditures
• Enjoys tourism and travel activities
• Participates in community-driven activities and exercises
• Infrequent purchaser of household appliances
• Religious
• Does not consume alcohol and tobacco
• Open to alternative medicine
• Traditional markets for most basic necessities
• Specialty stores for healthcare and insurance
• Physical well-being
• Anxiety about COVID-19 and the need for social distancing
• TV
• Healthcare professionals
• Family and relatives
• Friends
• Mobile phone
10
Deloitte Consumer Insights | Adapting to the new normal in Indonesia
Deloitte Consumer Insights
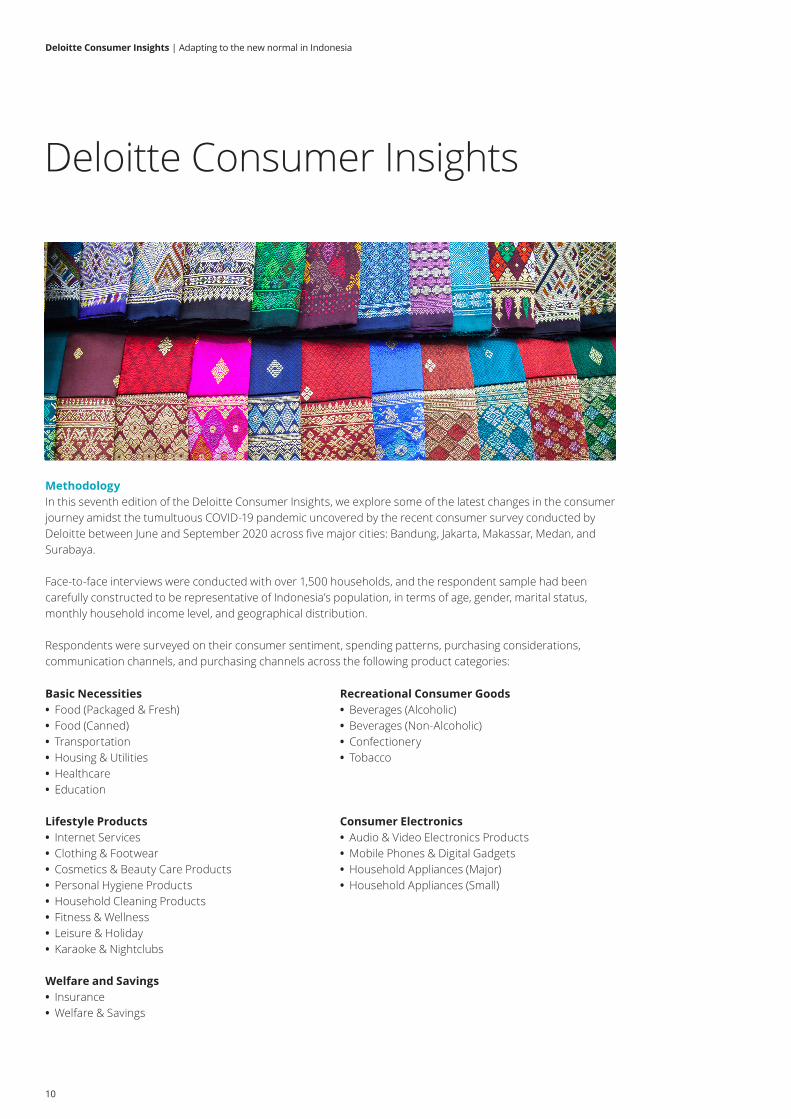
MethodologyIn this seventh edition of the Deloitte Consumer Insights, we explore some of the latest changes in the consumer journey amidst the tumultuous COVID-19 pandemic uncovered by the recent consumer survey conducted by Deloitte between June and September 2020 across five major cities: Bandung, Jakarta, Makassar, Medan, and Surabaya.
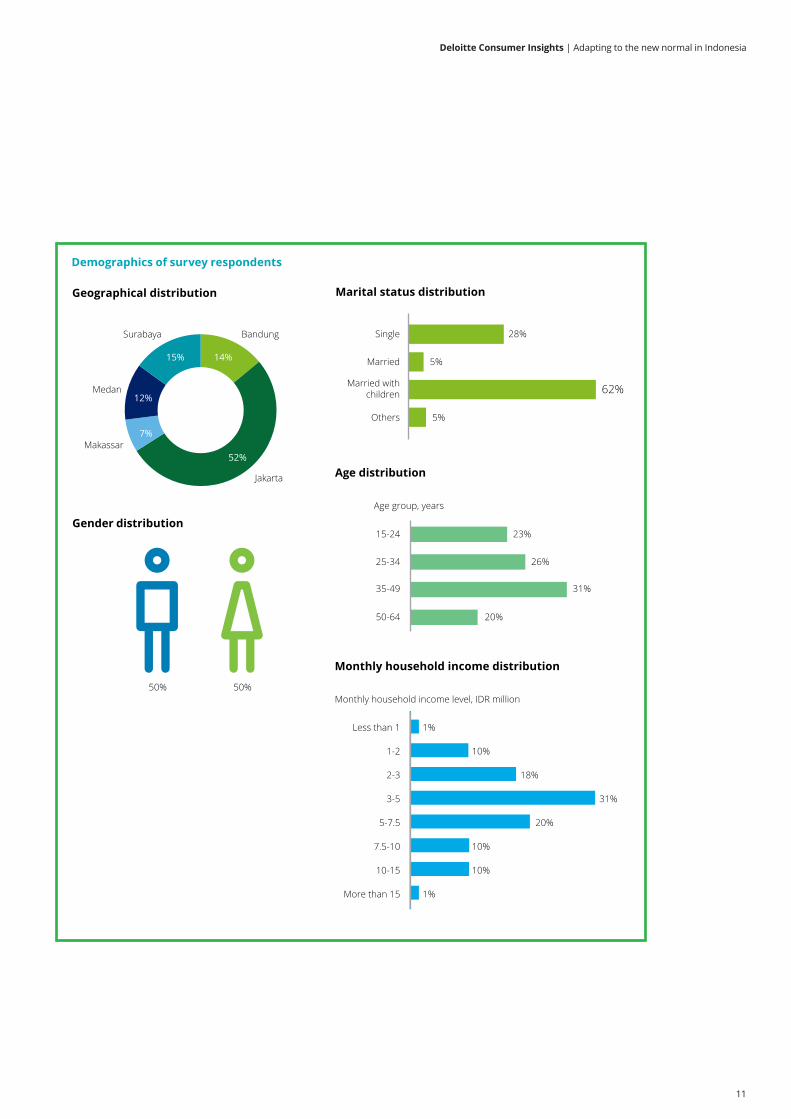
Face-to-face interviews were conducted with over 1,500 households, and the respondent sample had been carefully constructed to be representative of Indonesia’s population, in terms of age, gender, marital status, monthly household income level, and geographical distribution.
Respondents were surveyed on their consumer sentiment, spending patterns, purchasing considerations, communication channels, and purchasing channels across the following product categories:
Basic Necessities • Food (Packaged & Fresh) • Food (Canned) • Transportation • Housing & Utilities • Healthcare • Education
Lifestyle Products • Internet Services • Clothing & Footwear • Cosmetics & Beauty Care Products • Personal Hygiene Products • Household Cleaning Products • Fitness & Wellness • Leisure & Holiday • Karaoke & Nightclubs
Welfare and Savings • Insurance • Welfare & Savings
Recreational Consumer Goods • Beverages (Alcoholic) • Beverages (Non-Alcoholic) • Confectionery • Tobacco
Consumer Electronics • Audio & Video Electronics Products • Mobile Phones & Digital Gadgets • Household Appliances (Major) • Household Appliances (Small)
11
Deloitte Consumer Insights | Adapting to the new normal in Indonesia
Demographics of survey respondents
Gender distribution
14%
52%
7%
12%
15%
Geographical distribution
Jakarta
BandungSurabaya
Medan
Makassar
50% 50%
28%Single
5%Married
62%Married withchildren
5%Others
Marital status distribution
Age distribution
23%
26%
31%
20%
15-24
25-34
35-49
50-64
Monthly household income distribution
1%
1%
10%
18%
31%
20%
10%
10%
Less than 1
1-2
2-3
3-5
5-7.5
7.5-10
10-15
More than 15
Age group, years
Monthly household income level, IDR million
12
Deloitte Consumer Insights | Adapting to the new normal in Indonesia
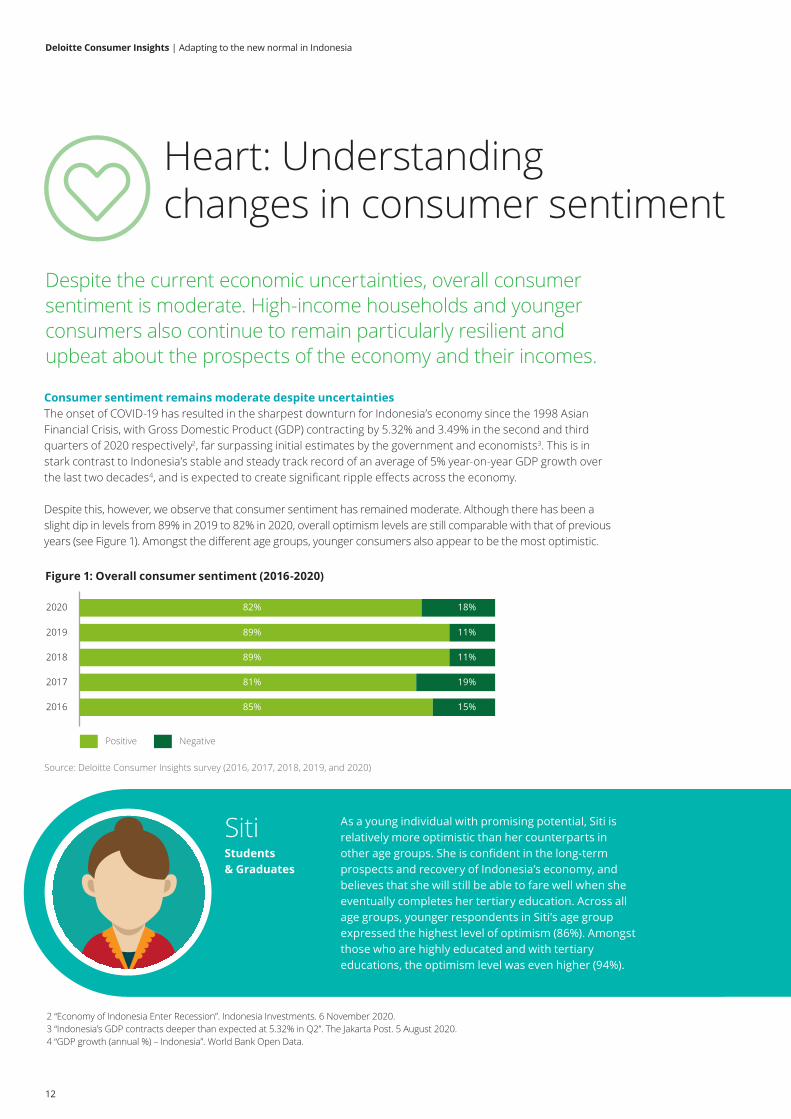
Despite the current economic uncertainties, overall consumer sentiment is moderate. High-income households and younger consumers also continue to remain particularly resilient and upbeat about the prospects of the economy and their incomes.
Figure 1: Overall consumer sentiment (2016-2020)
Heart: Understanding changes in consumer sentiment
Consumer sentiment remains moderate despite uncertainties The onset of COVID-19 has resulted in the sharpest downturn for Indonesia’s economy since the 1998 Asian Financial Crisis, with Gross Domestic Product (GDP) contracting by 5.32% and 3.49% in the second and third quarters of 2020 respectively2, far surpassing initial estimates by the government and economists3. This is in stark contrast to Indonesia’s stable and steady track record of an average of 5% year-on-year GDP growth over the last two decades4, and is expected to create significant ripple effects across the economy.
Despite this, however, we observe that consumer sentiment has remained moderate. Although there has been a slight dip in levels from 89% in 2019 to 82% in 2020, overall optimism levels are still comparable with that of previous years (see Figure 1). Amongst the different age groups, younger consumers also appear to be the most optimistic.
Figure 1: Overall consumer sentiment (2016-2020)
Source: Deloitte Consumer Insights survey (2016, 2017, 2018, 2019, and 2020)
85% 15%2016
2017
2018
2019
2020
NegativePositive
19%81%
11%89%
11%89%
18%82%
2 “Economy of Indonesia Enter Recession”. Indonesia Investments. 6 November 2020. 3 “Indonesia’s GDP contracts deeper than expected at 5.32% in Q2”. The Jakarta Post. 5 August 2020. 4 “GDP growth (annual %) – Indonesia”. World Bank Open Data.Preferred
sources of information
Siti As a young individual with promising potential, Siti is relatively more optimistic than her counterparts in other age groups. She is confident in the long-term prospects and recovery of Indonesia’s economy, and believes that she will still be able to fare well when she eventually completes her tertiary education. Across all age groups, younger respondents in Siti’s age group expressed the highest level of optimism (86%). Amongst those who are highly educated and with tertiary educations, the optimism level was even higher (94%).
Students & Graduates
13
Deloitte Consumer Insights | Adapting to the new normal in Indonesia
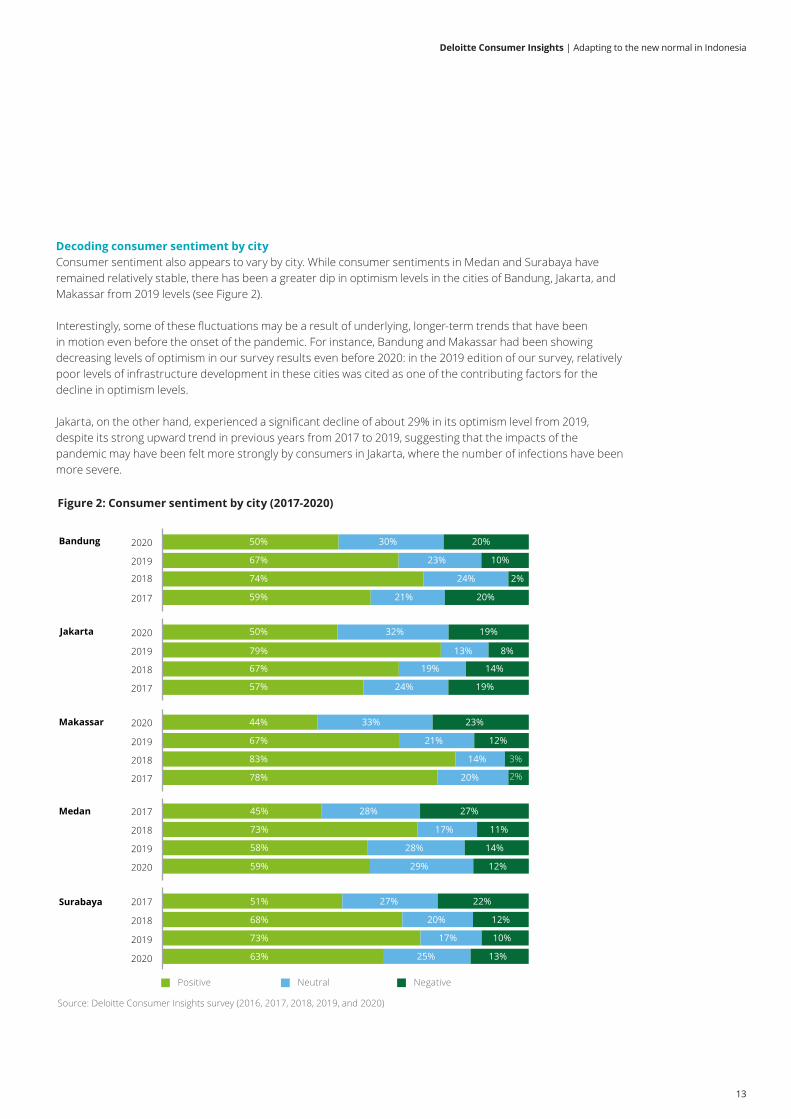
Decoding consumer sentiment by cityConsumer sentiment also appears to vary by city. While consumer sentiments in Medan and Surabaya have remained relatively stable, there has been a greater dip in optimism levels in the cities of Bandung, Jakarta, and Makassar from 2019 levels (see Figure 2).
Interestingly, some of these fluctuations may be a result of underlying, longer-term trends that have been in motion even before the onset of the pandemic. For instance, Bandung and Makassar had been showing decreasing levels of optimism in our survey results even before 2020: in the 2019 edition of our survey, relatively poor levels of infrastructure development in these cities was cited as one of the contributing factors for the decline in optimism levels.
Jakarta, on the other hand, experienced a significant decline of about 29% in its optimism level from 2019, despite its strong upward trend in previous years from 2017 to 2019, suggesting that the impacts of the pandemic may have been felt more strongly by consumers in Jakarta, where the number of infections have been more severe.
Figure 2: Consumer sentiment by city (2017-2020)
Bandung
74% 24% 2%
59% 21% 20%
67% 23% 10%
50% 30% 20%
2017
2018
2019
2020
Medan
Surabaya
Positive Neutral Negative
Source: Deloitte Consumer Insights survey (2016, 2017, 2018, 2019, and 2020)
51% 27% 22%
68% 20% 12%
73% 17% 10%
63% 25% 13%
2017
2018
2019
2020
2017
2018
2019
2020
45% 28% 27%
73% 17% 11%
58% 28% 14%
59% 29% 12%
78% 20% 2%
83% 14% 3%
67% 21% 12%
44% 33% 23%
2017
2018
2019
2020Makassar
57% 24% 19%
67% 19% 14%
79% 13% 8%
50% 32% 19%
2017
2018
2019
2020Jakarta
Figure 2: Consumer sentiment by city (2017-2020)
14
Deloitte Consumer Insights | Adapting to the new normal in Indonesia
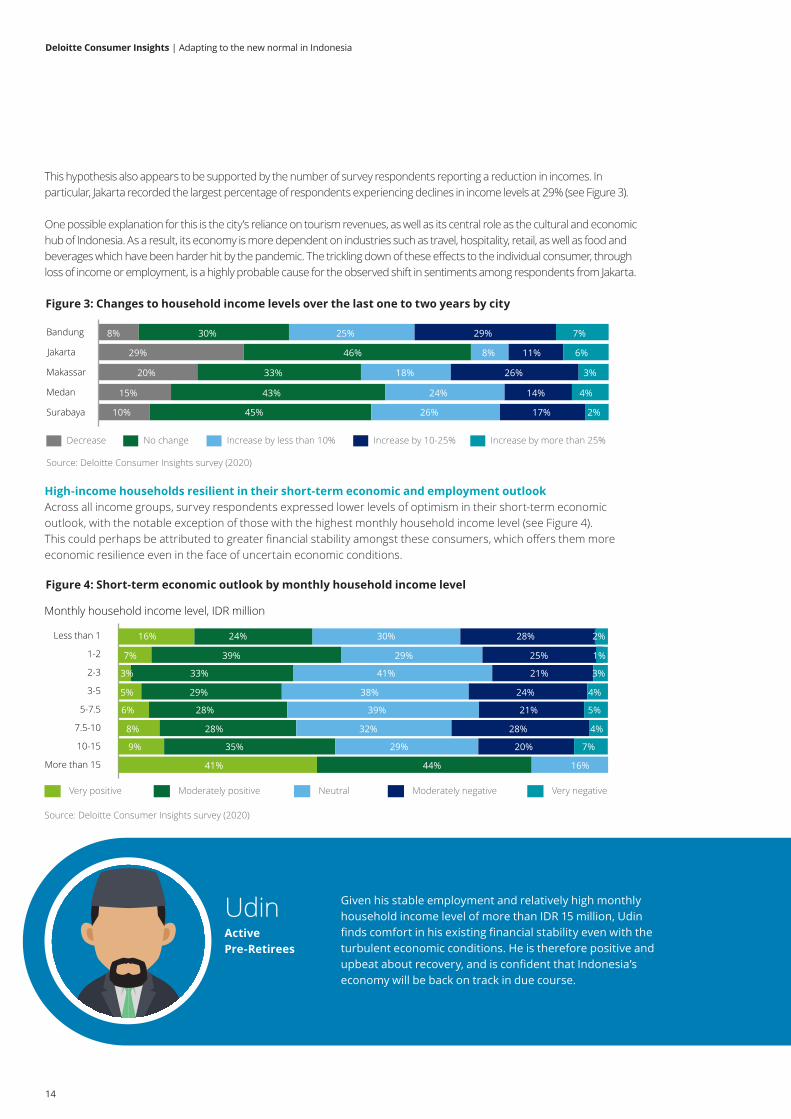
Figure 3: Changes to household income levels over the last one to two years by city
8% 30% 25% 29% 7%
20% 33% 18% 26% 3%
15% 43% 24% 14% 4%
10%
No changeDecrease Increase by more than 25%Increase by less than 10% Increase by 10-25%
-
Jakarta
Makassar
Bandung
Surabaya
Medan
Source: Deloitte Consumer Insights survey (2020)
46% 8% 11% 6%29%
45% 26% 17% 2%10%
High-income households resilient in their short-term economic and employment outlookAcross all income groups, survey respondents expressed lower levels of optimism in their short-term economic outlook, with the notable exception of those with the highest monthly household income level (see Figure 4). This could perhaps be attributed to greater financial stability amongst these consumers, which offers them more economic resilience even in the face of uncertain economic conditions.Figure 4: Short-term economic outlook by monthly household income level
41% 44% 16%
16% 24% 30% 28% 2%
7% 39% 29% 25% 1%
3% 33% 41% 21% 3%
5% 29% 38% 24% 4%
6% 28% 39% 21% 5%
8% 28% 32% 28% 4%
9% 35% 29% 20% 7%
7.5-10
2-3
Less than 1
1-2
3-5
5-7.5
10-15
More than 15
Very negativeNeutralVery positive Moderately negativeModerately positive
Monthly household income level, IDR million
Source: Deloitte Consumer Insights survey (2020)
Figure 4: Short-term economic outlook by monthly household income level
Udin Given his stable employment and relatively high monthly household income level of more than IDR 15 million, Udin finds comfort in his existing financial stability even with the turbulent economic conditions. He is therefore positive and upbeat about recovery, and is confident that Indonesia’s economy will be back on track in due course.
Active Pre-Retirees
Goals Key concerns
Preferredsources of informationMind Set
Keypurchasingchannels
Behaviours
This hypothesis also appears to be supported by the number of survey respondents reporting a reduction in incomes. In particular, Jakarta recorded the largest percentage of respondents experiencing declines in income levels at 29% (see Figure 3).
One possible explanation for this is the city’s reliance on tourism revenues, as well as its central role as the cultural and economic hub of Indonesia. As a result, its economy is more dependent on industries such as travel, hospitality, retail, as well as food and beverages which have been harder hit by the pandemic. The trickling down of these effects to the individual consumer, through loss of income or employment, is a highly probable cause for the observed shift in sentiments among respondents from Jakarta.
Figure 3: Changes to household income levels over the last one to two years by city

15
Deloitte Consumer Insights | Adapting to the new normal in Indonesia
Figure 5: Employment outlook and monthly household income distribution by city
Correlation between employment outlook and consumer sentimentFor most cities, there appears to be a close correlation between employment outlook and consumer sentiment. In Medan and Surabaya, where consumer sentiment has been fairly stable over time, there has been relatively little fluctuation in the employment outlook. On the other hand, Bandung, Jakarta, and Makassar – cities where there have been more significant dips in consumer sentiment – experienced more significant decline in optimism for the employment outlook.
At this juncture, it is worthwhile taking a closer look at Bandung, which reported the poorest employment outlook despite experiencing the highest rate of income growth over the last two years (see Figure 5). Nearly 30% of survey respondents in Bandung reported pessimism in their employment outlook, which may be attributed to the fact that Bandung also has the highest proportion of low-income respondents (monthly household income levels of less than IDR 2 million) who also tend have lower levels of job security. With unemployment potentially on the rise, the competition for generally low-skilled or temporary jobs may also increase, exacerbating their overall pessimism.
Younger consumers most upbeat about employment outlook and income expectationsOn average, survey respondents across cities are moderately optimistic about their employment outlook and income expectations: about 51% of them are optimistic about their employment outlook, and 35% of them expect their monthly household incomes levels to increase over the next two years. Even in the face of economic turbulence, a significant 43% of overall survey respondents have indicated that they do not expect to see any changes to their monthly household income levels, suggesting a strong level of resilience (see Figure 6).
Employment outlook Monthly household income distribution
2%
10%
11%
6%
21%
26%
45%
31%
55%
44%
45%
29%
41%
30%
30%
26%
14%
13%
9%
5%
1%
2%
4%
1%
Very positive NeutralModerately positiveModerately negative Very negative
3%
1%
1%
1%
2%
16%
5%
15%
16%
12%
16%
16%
20%
17%
21%
29%
30%
32%
29%
32%
20%
21%
18%
19%
18%
8%
12%
10%
10%
6%
8%
13%
3%
8%
6%
1%
1%
2%
Less than IDR 1 million IDR 1-2 million IDR 2-3 million IDR 3-5 millionIDR 10-15 million More than 15 millionIDR 7.5-10 millionIDR 5-7.5 million
Jakarta
Makassar
Bandung
Surabaya
Medan
Jakarta
Makassar
Bandung
Surabaya
Medan
Source: Deloitte Consumer Insights survey (2020)
Overall employment outlook
10%
42%33%
14%
1%
Very positive Very negativeNeutralModerately positive Moderately negative
Income expectationsMonthly household income level, IDR million
62% 38%
25% 14% 62%
9% 56% 23% 12%
3% 35% 42% 20% 1%
8% 38% 37% 16% 1%
11% 42% 32% 13% 2%
23% 34% 24% 15% 4%
7.5-10
2-3
Less than 1
1-2
3-5
5-7.5
10-15
More than 15
Source: Deloitte Consumer Insights survey (2020)
6% 49% 34% 10%
Figure 6: Overall employment outlook and income expectations
16
Deloitte Consumer Insights | Adapting to the new normal in Indonesia
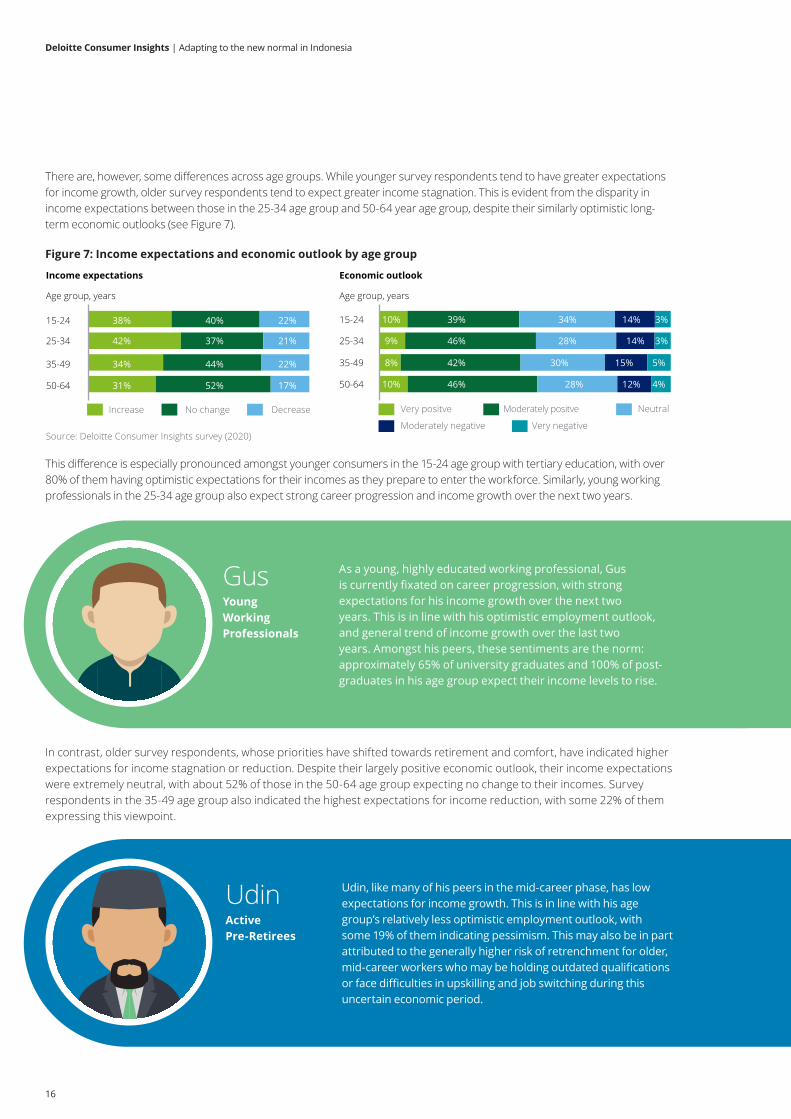
There are, however, some differences across age groups. While younger survey respondents tend to have greater expectations for income growth, older survey respondents tend to expect greater income stagnation. This is evident from the disparity in income expectations between those in the 25-34 age group and 50-64 year age group, despite their similarly optimistic long-term economic outlooks (see Figure 7).
This difference is especially pronounced amongst younger consumers in the 15-24 age group with tertiary education, with over 80% of them having optimistic expectations for their incomes as they prepare to enter the workforce. Similarly, young working professionals in the 25-34 age group also expect strong career progression and income growth over the next two years.
Gus As a young, highly educated working professional, Gus is currently fixated on career progression, with strong expectations for his income growth over the next two years. This is in line with his optimistic employment outlook, and general trend of income growth over the last two years. Amongst his peers, these sentiments are the norm: approximately 65% of university graduates and 100% of post-graduates in his age group expect their income levels to rise.
Young Working Professionals
Figure 7: Income expectations and economic outlook by age groupFigure 7: Income expectations and economic outlook by age group
Income expectations
38% 40% 22%
42% 37% 21%
34% 44% 22%
31% 52% 17%
15-24
25-34
35-49
50-64
15-24
25-34
35-49
50-64
Increase DecreaseNo change
Age group, years
Economic outlook
Very negative
Moderately positveVery positve
Moderately negative
Neutral
10% 39% 3%
9% 46% 3%
8% 42% 5%
10% 46%
34%
28%
30%
28%
14%
14%
15%
12% 4%
Age group, years
Source: Deloitte Consumer Insights survey (2020)
Udin Udin, like many of his peers in the mid-career phase, has low expectations for income growth. This is in line with his age group’s relatively less optimistic employment outlook, with some 19% of them indicating pessimism. This may also be in part attributed to the generally higher risk of retrenchment for older, mid-career workers who may be holding outdated qualifications or face difficulties in upskilling and job switching during this uncertain economic period.
Active Pre-Retirees
Goals Key concerns
Preferredsources of informationMind Set
Keypurchasingchannels
Behaviours
In contrast, older survey respondents, whose priorities have shifted towards retirement and comfort, have indicated higher expectations for income stagnation or reduction. Despite their largely positive economic outlook, their income expectations were extremely neutral, with about 52% of those in the 50-64 age group expecting no change to their incomes. Survey respondents in the 35-49 age group also indicated the highest expectations for income reduction, with some 22% of them expressing this viewpoint.
17
Deloitte Consumer Insights | Adapting to the new normal in Indonesia
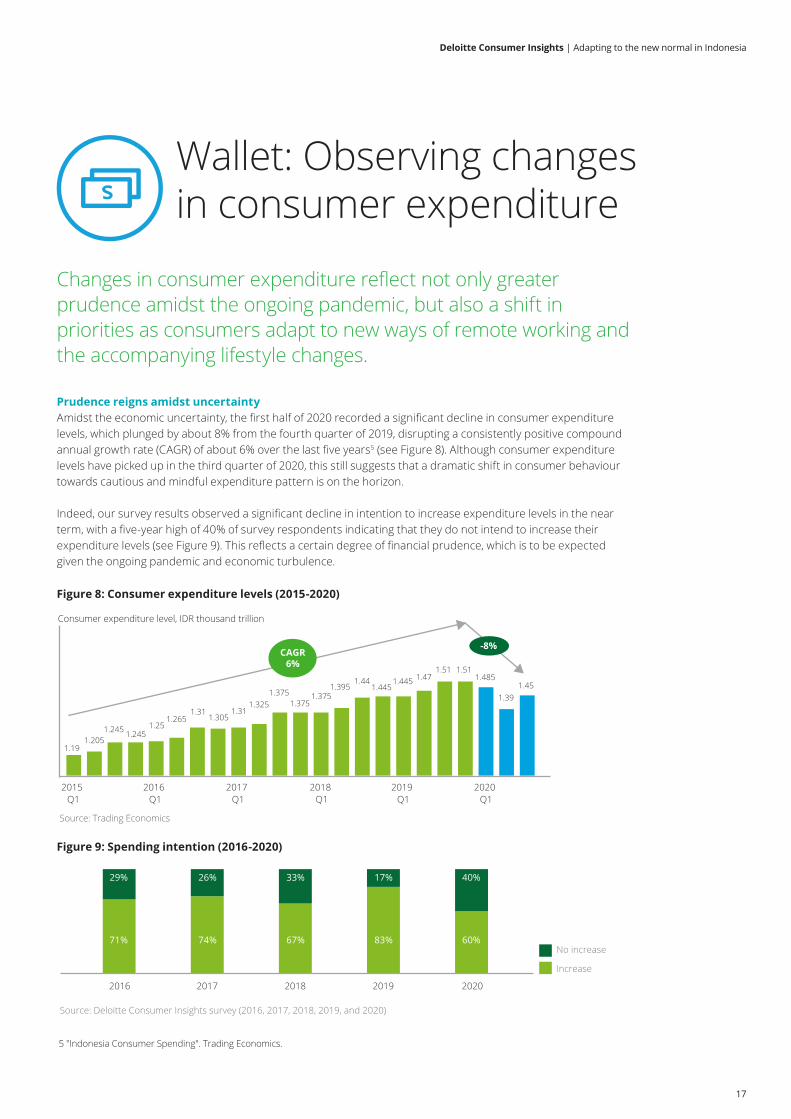
Prudence reigns amidst uncertaintyAmidst the economic uncertainty, the first half of 2020 recorded a significant decline in consumer expenditure levels, which plunged by about 8% from the fourth quarter of 2019, disrupting a consistently positive compound annual growth rate (CAGR) of about 6% over the last five years5 (see Figure 8). Although consumer expenditure levels have picked up in the third quarter of 2020, this still suggests that a dramatic shift in consumer behaviour towards cautious and mindful expenditure pattern is on the horizon.
Indeed, our survey results observed a significant decline in intention to increase expenditure levels in the near term, with a five-year high of 40% of survey respondents indicating that they do not intend to increase their expenditure levels (see Figure 9). This reflects a certain degree of financial prudence, which is to be expected given the ongoing pandemic and economic turbulence.
Figure 8: Consumer expenditure levels (2015-2020)
Figure 9: Spending intention (2016-2020)
Wallet: Observing changes in consumer expenditure
Changes in consumer expenditure reflect not only greater prudence amidst the ongoing pandemic, but also a shift in priorities as consumers adapt to new ways of remote working and the accompanying lifestyle changes.
1.191.205
1.245 1.2451.25
1.2651.31
1.3051.31
1.3251.375
1.3751.375
1.3951.44
1.4451.445 1.47
1.51 1.511.485
1.391.45
2015 Q1
2018 Q1
2016 Q1
2017 Q1
2019 Q1
2020 Q1
CAGR6%
-8%
Source: Trading Economics
Consumer expenditure level, IDR thousand trillion
Figure 9: Spending intention (2016-2020)
71%
29%
74%
26%
67%
33%
83%
17%
60%
40%
2016 2017 2018 2019 2020
Increase
No increase
Source: Deloitte Consumer Insights survey (2016, 2017, 2018, 2019, and 2020)
5 "Indonesia Consumer Spending". Trading Economics.

18
Deloitte Consumer Insights | Adapting to the new normal in Indonesia
Necessities are prioritised in expenditure allocationOverall, we observed that Basic Necessities have been prioritised by consumers in their expenditure allocation. In particular, the Food (Packaged & Fresh) category accounts for about 15% of overall expenditure allocation, demonstrating the prioritisation of basic needs during this uncertain period (see Figure 10).
This trend is especially pronounced in Surabaya, where the allocation for the Food (Packaged & Fresh) category is nearly double that of other cities, perhaps also a result of its local food-centric culture. Accordingly, expenditure allocation to other product categories, such as Recreational Consumer Goods and Consumer Electronics, are lower than the overall average. The lower allocations of expenditure to the Beverages (Alcoholic), Confectionery, and Tobacco categories may also suggest a heightened level of health-consciousness in Surabaya.
Since the 2014 edition of the survey, we have observed a point of inflection at the monthly household income level of IDR 5-7.5 million, where expenditure allocation to the Consumer Electronics category begins to spike. This inflection point has remained a reliable indicator across the subsequent editions of our survey, at which point consumer priorities begin to shift towards greater discretionary purchases as they transition from the low- to middle-income bracket to the middle- to high-income bracket.
This year, however, there has been a disruption to this trend. Rather than a point of inflection, we now observe a constant expenditure allocation to Consumer Electronics across all monthly household income levels. Taking into consideration the general differences in expenditure allocation between consumers in the higher income and those in the lower income brackets – for example, allocation to Food (Packaged & Fresh) is typically higher for lower income brackets, and other discretionary spending, such as on Leisure & Holiday, Fitness & Wellness, Personal Hygiene Products, and Cosmetics & Beauty Products tend to be higher for those in the higher income brackets – we can nevertheless deduce a clear trend towards greater prudence across the board.
Figure 10: Overall expenditure allocation Figure 10: Overall expenditure allocation
13%
3%
4%
6%
6%
6%
3%3%4%
4%
6%
4%
3%
4%
4%3%3%2%3%4%
2.663%3%4%
Overall
Household Appliances (Major)
Welfare & Savings
Household Appliances (Small)
Mobile Phones & Digital Gadgets
Insurance
Audio & Video Electronics Products
Karaoke & Nightclubs
Clothing & Footwear
Personal Hygiene Products
Beverages (Non-Alcoholic)
Fitness & Wellness
Household Cleaning Products
Internet Services
Confectionery
Food (Canned)
Healthcare
Education
Leisure & Holiday
Cosmetics & Beauty Care Products
Tobacco
Housing & Utilities
Food (Packaged & Fresh)
Transportation
Beverages (Alcoholic)
Jakarta
10%
4%
4%
5%
6%
6%
3%4%
4%
4%
6%
4%
4%
4%
4%
3%3%3%3%
4%3%3%3%4%
Bandung
11%
3%
4%
5%
6%
7%
4%
3%4%
4%
6%
4%3%
4%
4%3%3%3%3%
4%
3%3%3%4%
Surabaya
12%
5%
4%
4%
6%
6%
2%3%
4%
4%
6%
4%
4%
4%
4%3%3%2%3%
4%
3%3%3%3%
Medan
12%
3%
4%
6%
6%
6%
3%3%
4%
5%
5%
3%3%
4%
4%2%4%2%3%4%3%3%4%
4%
Makassar
20%
4%
4%
6%
5%
6%
2%3%3%4%
4%
3%3%4%
4%2%2%2%2%3%2%2%3%
5%
Source: Deloitte Consumer Insights survey (2020)
19
Deloitte Consumer Insights | Adapting to the new normal in Indonesia
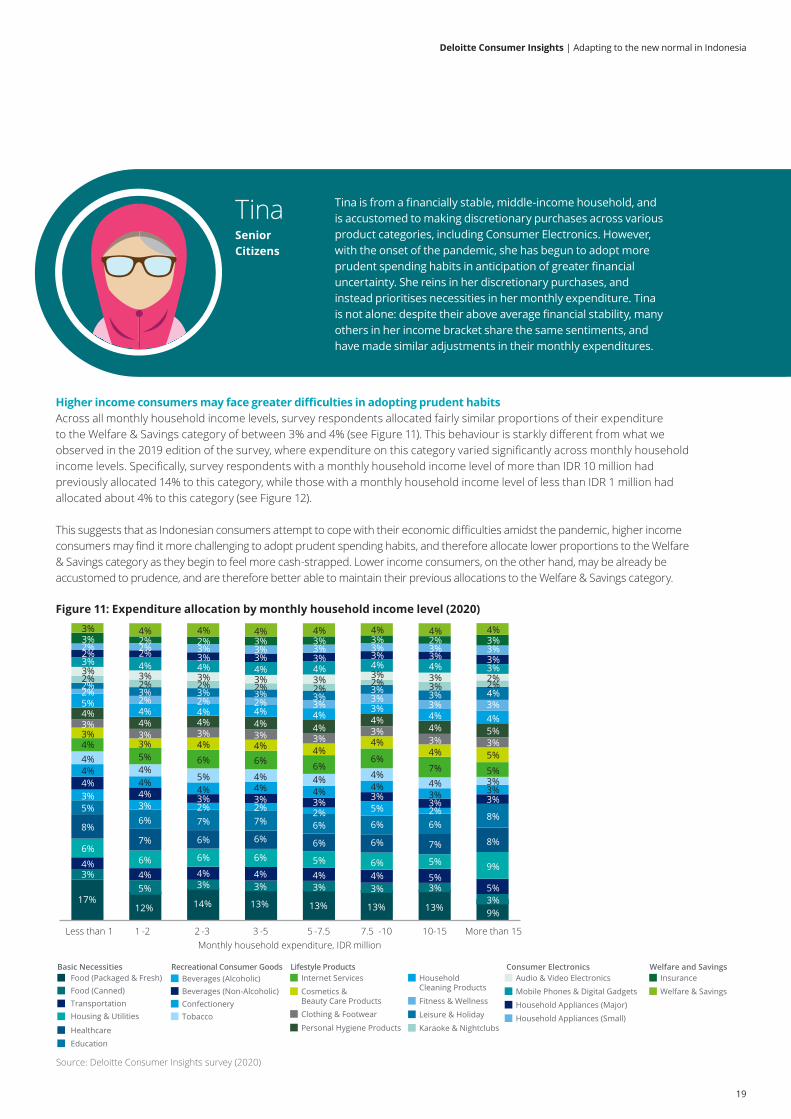
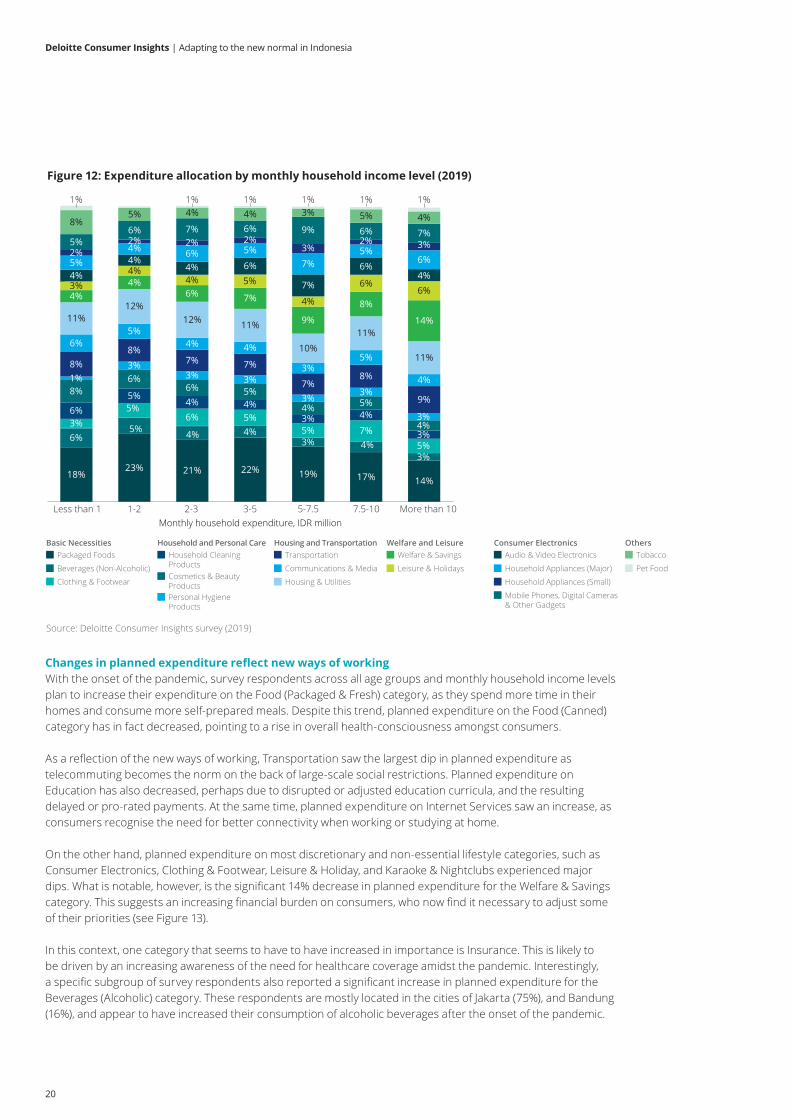
Higher income consumers may face greater difficulties in adopting prudent habitsAcross all monthly household income levels, survey respondents allocated fairly similar proportions of their expenditure to the Welfare & Savings category of between 3% and 4% (see Figure 11). This behaviour is starkly different from what we observed in the 2019 edition of the survey, where expenditure on this category varied significantly across monthly household income levels. Specifically, survey respondents with a monthly household income level of more than IDR 10 million had previously allocated 14% to this category, while those with a monthly household income level of less than IDR 1 million had allocated about 4% to this category (see Figure 12).
This suggests that as Indonesian consumers attempt to cope with their economic difficulties amidst the pandemic, higher income consumers may find it more challenging to adopt prudent spending habits, and therefore allocate lower proportions to the Welfare & Savings category as they begin to feel more cash-strapped. Lower income consumers, on the other hand, may be already be accustomed to prudence, and are therefore better able to maintain their previous allocations to the Welfare & Savings category.
Tina Tina is from a financially stable, middle-income household, and is accustomed to making discretionary purchases across various product categories, including Consumer Electronics. However, with the onset of the pandemic, she has begun to adopt more prudent spending habits in anticipation of greater financial uncertainty. She reins in her discretionary purchases, and instead prioritises necessities in her monthly expenditure. Tina is not alone: despite their above average financial stability, many others in her income bracket share the same sentiments, and have made similar adjustments in their monthly expenditures.
Senior Citizens
Figure 11: Expenditure allocation by monthly household income level (2020)
Figure 11: Expenditure allocation by monthly household income level (2020)
2 -3 10-15 More than 151 -2Less than 1 3 -5 7.5 -105 -7.5
17%12% 14% 13% 13% 13% 13% 9%
3%5% 3% 3% 3% 3% 3%
3%
4%4% 4% 4% 4% 4% 5%
5%
6%6% 6% 6% 5% 6% 5% 9%
8%7% 6% 6% 6% 6% 7% 8%
5%6% 7% 7% 6% 6% 6%
8%
3%3% 2% 2% 2% 5% 2%
4%4% 3% 3% 3% 3%
3% 3%
4%4%
4% 4% 4% 4%3% 3%
4%4%
5% 4% 4% 4%4% 3%
4%5% 6% 6% 6%
6%7% 5%
3%3% 4% 4% 4%
4%4% 5%
3%3% 3% 3% 3%
3%3% 3%
4%4% 4% 4% 4%
4%4% 5%
5%4% 4% 4% 4%
3%
4% 4%
2%2% 2% 2% 3% 3% 3% 3%
2%3% 3% 3% 3%
3% 3% 4%2% 2% 2% 2% 2%
2% 3% 2%3% 3% 3% 3% 3% 3% 3% 2%
3% 4% 4% 4% 4% 4% 4% 3%2% 2% 3% 3% 3%
3%3% 3%
2% 2% 3% 3% 3%3%
3% 3%3% 2% 2% 3% 3% 3% 2% 3%3% 4% 4% 4% 4% 4% 4% 4%
Source: Deloitte Consumer Insights survey (2020)
Monthly household expenditure, IDR million
Education
Beverages (Alcoholic)Beverages (Non-Alcoholic)ConfectioneryTobacco
Healthcare
Cosmetics &Beauty Care Products
Clothing & Footwear
Personal Hygiene Products
Internet Services
Fitness & Wellness
Leisure & Holiday
Karaoke & Nightclubs
HouseholdCleaning Products Mobile Phones & Digital Gadgets
Household Appliances (Major)
Household Appliances (Small)
Audio & Video Electronics
Welfare & Savings
InsuranceFood (Canned)
Housing & Utilities
Food (Packaged & Fresh)
Transportation
Basic Necessities Recreational Consumer Goods Lifestyle Products Consumer Electronics Welfare and Savings
20
Deloitte Consumer Insights | Adapting to the new normal in Indonesia
Figure 12: Expenditure allocation by monthly household income level (2019)Figure 12: Expenditure allocation by monthly household income level (2019)
Source: Deloitte Consumer Insights survey (2019)
18%23% 21% 22% 19% 17% 14%
6%5% 4% 4%
3%
3% 6% 5%5% 7%
6%5%
4% 4%3% 4%
3%
8%6%
6% 5%
4% 5%
4%
3%3% 3%
3%
8%8%
7% 7%
7%8%
9%
6%5%
4% 4%
3%5%
4%
11%12%
12% 11%
10%11%
11%
4%4%
6% 7%
9%
8%
14%
3% 6%6%
4%6%
7%
6%5%6% 5%
7%5%
6%3%5%
6% 7% 6% 9% 6% 7%8%
5% 4% 4% 3% 5% 4%
1% 1% 1% 1% 1% 1%
3%
5-7.5
4%3%
1%
2%
More than 107.5-10
5%
3%
4%
3%
5%
2%
4%
2%
4%
4%
4%
1-2
4%4%
2%
2-3
5%
2%
Less than 1 3-5 Monthly household expenditure, IDR million
Beverages (Non-Alcoholic)
Clothing & Footwear
Packaged FoodsBasic Necessities
Cosmetics & Beauty ProductsPersonal HygieneProducts
Household Cleaning Products
Household and Personal Care
Communications & Media
Housing & Utilities
TransportationHousing and Transportation
Leisure & Holidays
Welfare & SavingsWelfare and Leisure
Household Appliances (Major)
Household Appliances (Small)
Mobile Phones, Digital Cameras & Other Gadgets
Audio & Video ElectronicsConsumer Electronics
Pet Food
TobaccoOthers
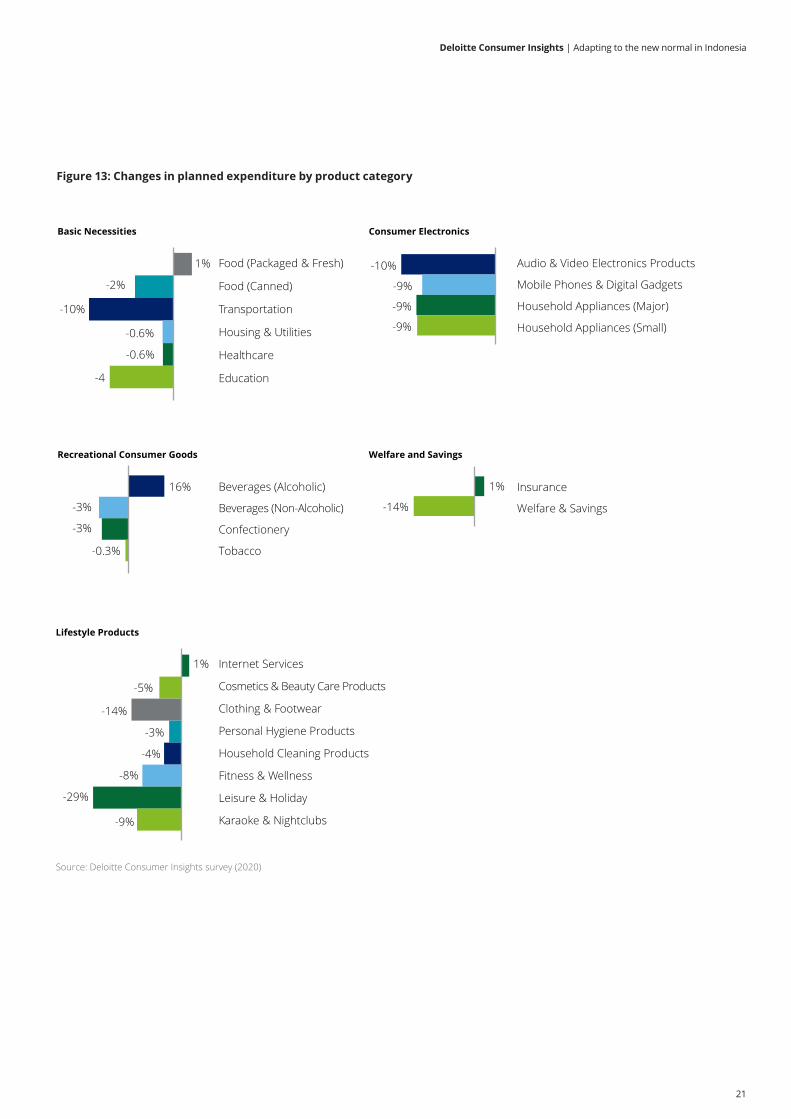
Changes in planned expenditure reflect new ways of workingWith the onset of the pandemic, survey respondents across all age groups and monthly household income levels plan to increase their expenditure on the Food (Packaged & Fresh) category, as they spend more time in their homes and consume more self-prepared meals. Despite this trend, planned expenditure on the Food (Canned) category has in fact decreased, pointing to a rise in overall health-consciousness amongst consumers.
As a reflection of the new ways of working, Transportation saw the largest dip in planned expenditure as telecommuting becomes the norm on the back of large-scale social restrictions. Planned expenditure on Education has also decreased, perhaps due to disrupted or adjusted education curricula, and the resulting delayed or pro-rated payments. At the same time, planned expenditure on Internet Services saw an increase, as consumers recognise the need for better connectivity when working or studying at home.
On the other hand, planned expenditure on most discretionary and non-essential lifestyle categories, such as Consumer Electronics, Clothing & Footwear, Leisure & Holiday, and Karaoke & Nightclubs experienced major dips. What is notable, however, is the significant 14% decrease in planned expenditure for the Welfare & Savings category. This suggests an increasing financial burden on consumers, who now find it necessary to adjust some of their priorities (see Figure 13).
In this context, one category that seems to have to have increased in importance is Insurance. This is likely to be driven by an increasing awareness of the need for healthcare coverage amidst the pandemic. Interestingly, a specific subgroup of survey respondents also reported a significant increase in planned expenditure for the Beverages (Alcoholic) category. These respondents are mostly located in the cities of Jakarta (75%), and Bandung (16%), and appear to have increased their consumption of alcoholic beverages after the onset of the pandemic.
21
Deloitte Consumer Insights | Adapting to the new normal in Indonesia
Figure 13: Changes in planned expenditure by product category
-
Food (Canned)
Food (Packaged & Fresh)
Transportation
Housing & Utilities
Healthcare
Education
16%
-3%
-3%
-0.3%
Confectionery
Beverages (Non-Alcoholic)
Beverages (Alcoholic)
Tobacco
Internet Services
Household Cleaning Products
Clothing & Footwear
Cosmetics & Beauty Care Products
Personal Hygiene Products
Karaoke & Nightclubs
Fitness & Wellness
Leisure & Holiday
Audio & Video Electronics Products
Mobile Phones & Digital Gadgets
Household Appliances (Small)
Household Appliances (Major)
Insurance
Welfare & Savings
Basic Necessities
Recreational Consumer Goods Welfare and Savings
1%
-2%
-10%
-0.6%
-0.6%
-4
1%
-5%
-14%
-3%
-4%
-8%
-29%
-9%
Lifestyle Products
Consumer Electronics
-10%
-9%
-9%
-9%
1%
-14%
Source: Deloitte Consumer Insights survey (2020)
22
Deloitte Consumer Insights | Adapting to the new normal in Indonesia
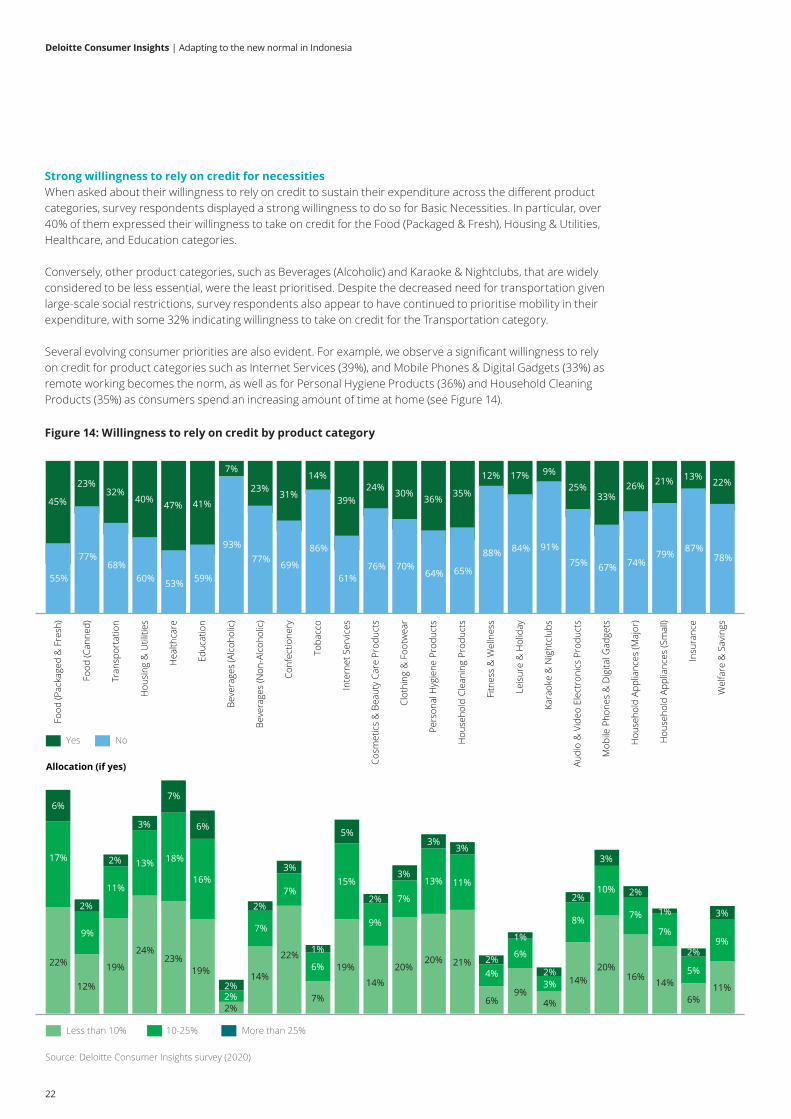
Strong willingness to rely on credit for necessitiesWhen asked about their willingness to rely on credit to sustain their expenditure across the different product categories, survey respondents displayed a strong willingness to do so for Basic Necessities. In particular, over 40% of them expressed their willingness to take on credit for the Food (Packaged & Fresh), Housing & Utilities, Healthcare, and Education categories.
Conversely, other product categories, such as Beverages (Alcoholic) and Karaoke & Nightclubs, that are widely considered to be less essential, were the least prioritised. Despite the decreased need for transportation given large-scale social restrictions, survey respondents also appear to have continued to prioritise mobility in their expenditure, with some 32% indicating willingness to take on credit for the Transportation category.
Several evolving consumer priorities are also evident. For example, we observe a significant willingness to rely on credit for product categories such as Internet Services (39%), and Mobile Phones & Digital Gadgets (33%) as remote working becomes the norm, as well as for Personal Hygiene Products (36%) and Household Cleaning Products (35%) as consumers spend an increasing amount of time at home (see Figure 14).
Figure 14: Willingness to rely on credit by product category
Figure 14: Willingness to rely on credit by product category
55%
45%
77%
23%
68%
32%
60%
40%
53%
47%
59%
41%
93%
7%
77%
23%
69%
31%
86%
14%
61%
39%
76%
24%
70%
30%
64%
36%
65%
35%
88%
12%
84%
17%
91%
9%
75%
25%
67%
33%
74%
26%
79%
21%
87%
13%
78%
22%
Food
(Pac
kage
d &
Fre
sh)
Conf
ectio
nery
Food
(Can
ned)
Leis
ure
& H
olid
ay
Beve
rage
s (A
lcoh
olic
)
Tran
spor
tatio
n
Hou
sing
& U
tiliti
es
Inte
rnet
Ser
vice
s
Insu
ranc
e
Hea
lthca
re
Bev
erag
es (N
on-A
lcoh
olic
)
Educ
atio
n
Hou
seho
ld C
lean
ing
Prod
ucts
Toba
cco
Cosm
etic
s &
Bea
uty
Care
Pro
duct
s
Audi
o &
Vid
eo E
lect
roni
cs P
rodu
cts
Clot
hing
& F
ootw
ear
Pers
onal
Hyg
iene
Pro
duct
s
Fitn
ess
& W
elln
ess
Kara
oke
& N
ight
club
s
Mob
ile P
hone
s &
Dig
ital G
adge
ts
Hou
seho
ld A
pplia
nces
(Maj
or)
Wel
fare
& S
avin
gs
Hou
seho
ld A
pplia
nces
(Sm
all)
Allocation (if yes)
Less than 10% More than 25%10-25%
Yes No
22%
12%
19%
24%23%
19%
2%
14%
22%
7%
19%
14%
20%20% 21%
6%9%
4%
14%20%
16% 14%
6%11%
17%
9%
11%
13% 18%
16%
2%
7%
7%
6%
15%
9%
7%
13% 11%
4%
6%
3%
8%
10%
7%
7%
5%
9%
6%
2%
2%
3%
7%
6%
2%
2%
3%
1%
5%
2%
3%
3%3%
2%
1%
2%
2%
3%
2%
1%
2%
3%
Source: Deloitte Consumer Insights survey (2020)
23
Deloitte Consumer Insights | Adapting to the new normal in Indonesia
High levels of support for financial assistanceOverall, the majority of survey respondents (76%) were in favour of the fiscal package recently announced by the Indonesia government for health sector improvements and social assistance, which would amount to some 4.3% of Indonesia’s GDP6.
Furthermore, 42% of survey respondents believed that financial assistance, in the form of monthly unemployment allowances to subsidise expenditure on basic necessities, should lie somewhere between IDR 0.5-1 million. This high level of support for financial assistance sheds light on the increasing social awareness and empathy for unemployed individuals during this period – especially from younger and more highly educated consumers.
However, attitudes towards financial assistance differ across income levels and age groups. While support for financial assistance is highest amongst survey respondents at the extremities of the income brackets – those whose monthly household income levels are less than IDR 1 million, and those whose monthly household income levels are more than IDR 15 million – support for financial assistance tends to decrease with income.
Support for financial assistance also appears to decrease with age: amongst survey respondents in the 50-64 age group, more than quarter (28%) of them expressed disagreement with financial assistance. This could perhaps be attributed to a more traditional mindset amongst this demographic, who may place greater emphasis on financial independence and self-sufficiency.
Preferredsources of information
Siti Siti, like many other younger and highly educated consumers in her 15-24 age group, has expressed overwhelming support for financial assistance. Amongst her peers, 93% of academy students and 84% of university students support these schemes – higher than any other age group. There are two possible motivations for this: • Empathy: They are increasingly aware of the social and financial plight of the unemployed amid such difficult times.
• Job uncertainty: As future breadwinners, they are burdened with the fear of personally experiencing unemployment as they enter an uncertain job market.
Students & Graduates
6 “Indonesia Economic Prospects: The Long Road to Recovery”. The World Bank. July 2020.
24
Deloitte Consumer Insights | Adapting to the new normal in Indonesia
Mind: Deciphering new purchase drivers
While COVID-19 has accelerated the use of digital channels, assurance-related considerations continue to hinder uptake by consumers. Consumer companies should also consider ways to leverage next-generation technologies to better integrate their offline-online experiences.
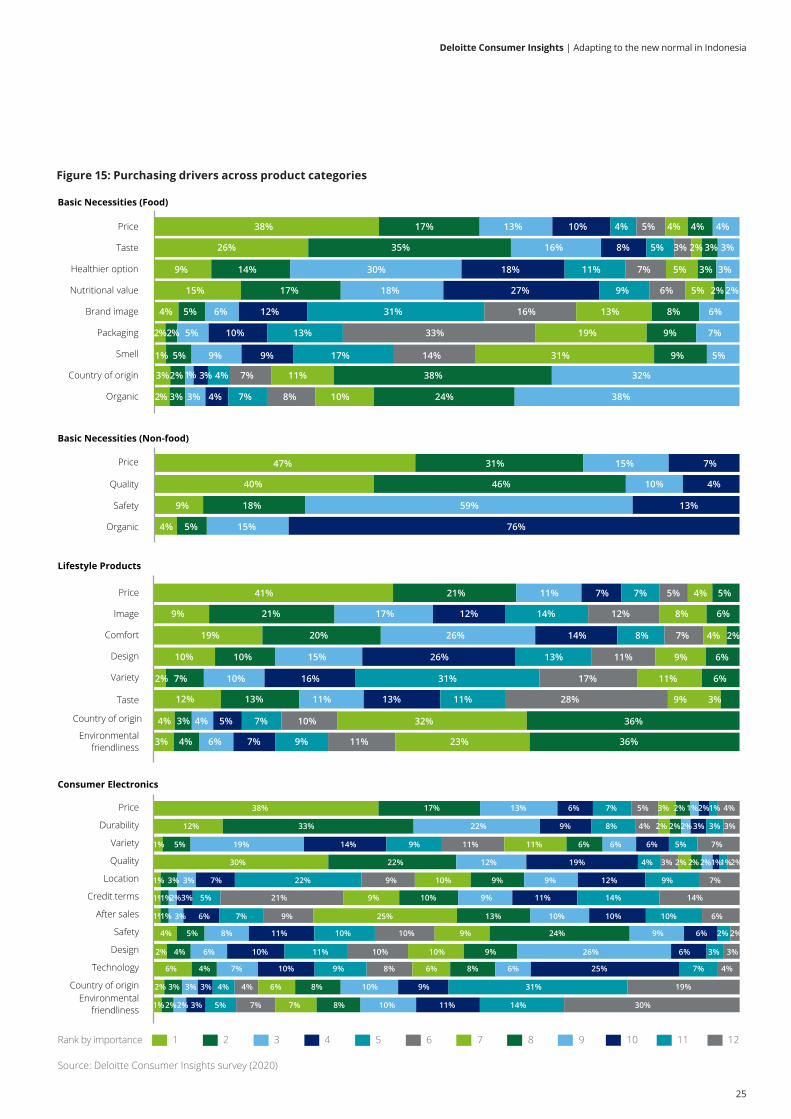
More deliberate purchase decisionsAs consumers become more prudent amidst the economic uncertainty, they have been observed to be more deliberate about their purchases. According to our latest results, 83% of survey respondents have indicated that they do not make impulse purchases. In a similar vein, survey respondents are also placing an increasing focus on Price, followed by Quality, across all product categories. For many categories – such as Food, Lifestyle Products, and Consumer Electronics – Price is now the overwhelming consideration.
But apart from their price considerations, survey respondents have also demonstrated an overall shift towards greater health-consciousness in the Food category, with Taste, Healthiness and Nutritional Value coming in as the next three considerations after Price. This is perhaps also due in part to the adjustments that they have made in their lifestyles and new ways of working, which enable them to spend more time at home and therefore exert more control over their diets and food preparation methods. Several marketplace observations also seem to support this trend, with many online organic and health foods businesses experiencing a boom during the pandemic.
In their purchase of discretionary products, such as Lifestyle Products and Consumer Electronics, survey respondents prioritised more practical considerations such as Comfort, Quality, and Durability, while other factors such as Design, Technology, and After-Sales were viewed as relatively less important.
This overall shift in priorities is especially stark for the Consumer Electronics product category. Specifically, in the 2019 edition of the survey, we found that survey respondents had in fact prioritised Quality considerations over Price, and also took into consideration factors such as Trust. In this latest edition, however, Price has emerged as the top consideration by a significantly wide margin.
Overall, across all product categories, other considerations such as Country of Origin and Environmental Friendliness were largely neglected, suggesting that under these current circumstances, price sensitivity far outweighs any preference for foreign or local products, or concerns about environmental friendliness (see Figure 15).
Pre-purchase
25
Deloitte Consumer Insights | Adapting to the new normal in Indonesia
Figure 15: Purchasing drivers across product categories Figure 15: Purchasing drivers across product categories (part 1)
Basic Necessities (Non-food)
Quality
Price
Safety
Organic
47%
40%
9%
4%
31%
46%
18%
5%
15%
10%
59%
15%
7%
4%
13%
76%
Basic Necessities (Food)
38% 17% 13% 10% 4% 5% 4% 4% 4%
26% 35% 16% 8% 5% 3% 2% 3% 3%
9% 14% 30% 18% 11% 7% 5% 3% 3%
15% 17% 18% 27% 9% 6% 5% 2% 2%
4% 5% 6% 12% 31% 16% 13% 8% 6%
2%2% 5% 10% 13% 33% 19% 9% 7%
3%2% 1% 3% 4% 7% 11% 38% 32%
2% 3% 3% 4% 7% 8% 10% 24% 38%
Brand image
Packaging
Organic
Nutritional value
Price
Taste
Country of origin
Healthier option
Smell
Source: Deloitte Consumer Insights survey (2020)
Rank by importance 71 32 984 65 10 1211
Variety
Taste
Design
Price
Image
Environmentalfriendliness
Environmentalfriendliness
Comfort
Country of origin
Lifestyle Products
41%
9%
19%
10%
2%
12%
4%
3%
21%
21%
20%
10%
7%
13%
3%
4%
11%
17%
26%
15%
10%
11%
4%
6%
7%
12%
14%
26%
16%
13%
5%
7%
7%
14%
8%
13%
31%
11%
7%
9%
5%
12%
7%
11%
17%
28%
10%
11%
4%
8%
4%
9%
11%
9%
32%
23%
5%
6%
2%
6%
6%
3%
36%
36%
Consumer Electronics
38% 17% 13% 6% 7% 5% 3% 2% 1%2%1% 4%
12% 33% 22% 9% 8% 4% 2% 2%2% 3% 3% 3%
1% 5% 19% 14% 9% 11% 11% 6% 6% 6% 5% 7%
30% 22% 12% 19% 4% 3% 2% 2% 2%1%1%2%
1% 3% 3% 7% 22% 9% 10% 9% 9% 12% 9% 7%
4% 5% 8% 11% 10% 10% 9% 24% 9% 6% 2% 2%
2% 4% 6% 10% 11% 10% 10% 9% 26% 6% 3% 3%
6% 4% 7% 10% 9% 8% 6% 8% 6% 25% 7% 4%
2% 3% 3% 3% 4% 4% 6% 8% 10% 9% 31% 19%
Technology
Safety
Durability
Variety
Price
Quality
Location
Credit terms
After sales
Design
Country of origin
5% 9% 9% 17% 14% 31% 9% 5%1%
1% 2%3% 5% 21% 9% 10% 9% 11% 14% 14%1%
2%2% 3% 5% 7% 7% 8% 10% 11% 14% 30%1%
3% 6% 7% 9% 25% 13% 10% 10% 10% 6%1%1%
26
Deloitte Consumer Insights | Adapting to the new normal in Indonesia
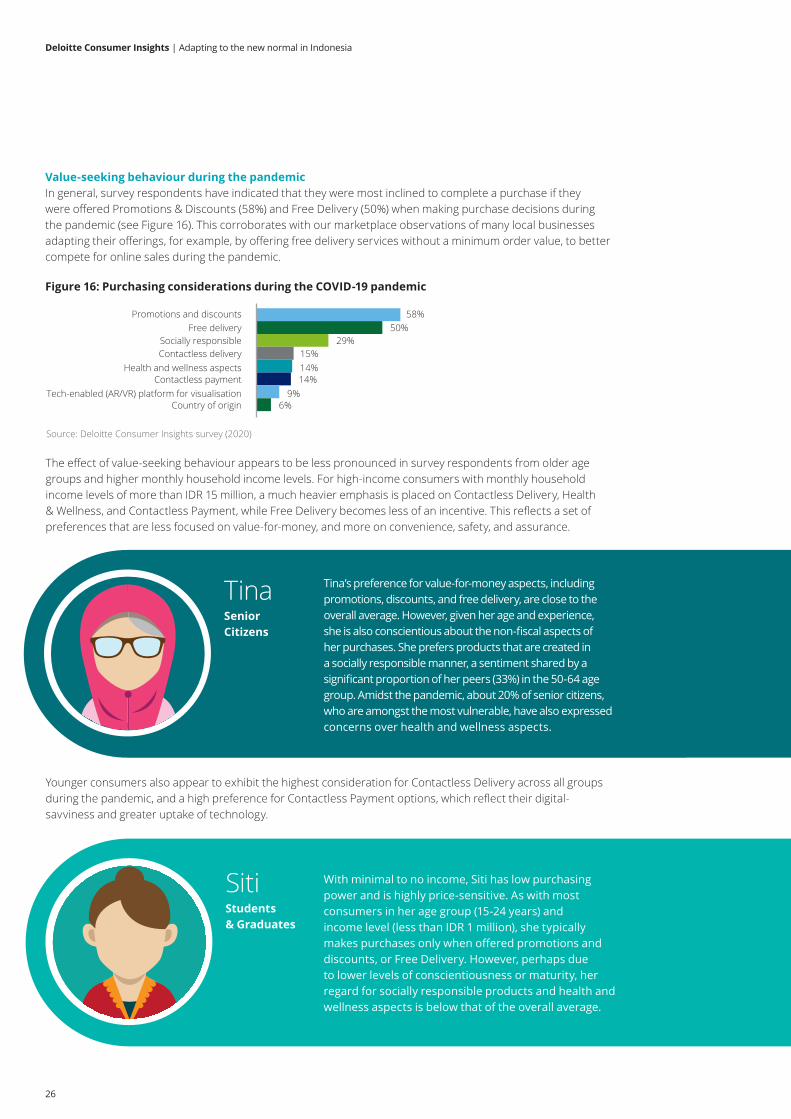
Value-seeking behaviour during the pandemicIn general, survey respondents have indicated that they were most inclined to complete a purchase if they were offered Promotions & Discounts (58%) and Free Delivery (50%) when making purchase decisions during the pandemic (see Figure 16). This corroborates with our marketplace observations of many local businesses adapting their offerings, for example, by offering free delivery services without a minimum order value, to better compete for online sales during the pandemic.
The effect of value-seeking behaviour appears to be less pronounced in survey respondents from older age groups and higher monthly household income levels. For high-income consumers with monthly household income levels of more than IDR 15 million, a much heavier emphasis is placed on Contactless Delivery, Health & Wellness, and Contactless Payment, while Free Delivery becomes less of an incentive. This reflects a set of preferences that are less focused on value-for-money, and more on convenience, safety, and assurance.
Figure 16: Purchasing considerations during the COVID-19 pandemicFigure 16: Purchasing considerations during the COVID-19 pandemic
58%50%
29%15%14%14%
9%6%
Promotions and discounts
Health and wellness aspects
Tech-enabled (AR/VR) platform for visualisation
Free deliverySocially responsibleContactless delivery
Contactless payment
Country of origin
Source: Deloitte Consumer Insights survey (2020)
Tina Tina’s preference for value-for-money aspects, including promotions, discounts, and free delivery, are close to the overall average. However, given her age and experience, she is also conscientious about the non-fiscal aspects of her purchases. She prefers products that are created in a socially responsible manner, a sentiment shared by a significant proportion of her peers (33%) in the 50-64 age group. Amidst the pandemic, about 20% of senior citizens, who are amongst the most vulnerable, have also expressed concerns over health and wellness aspects.
Senior Citizens
Younger consumers also appear to exhibit the highest consideration for Contactless Delivery across all groups during the pandemic, and a high preference for Contactless Payment options, which reflect their digital-savviness and greater uptake of technology.
Preferredsources of information
Siti With minimal to no income, Siti has low purchasing power and is highly price-sensitive. As with most consumers in her age group (15-24 years) and income level (less than IDR 1 million), she typically makes purchases only when offered promotions and discounts, or Free Delivery. However, perhaps due to lower levels of conscientiousness or maturity, her regard for socially responsible products and health and wellness aspects is below that of the overall average.
Students & Graduates
27
Deloitte Consumer Insights | Adapting to the new normal in Indonesia
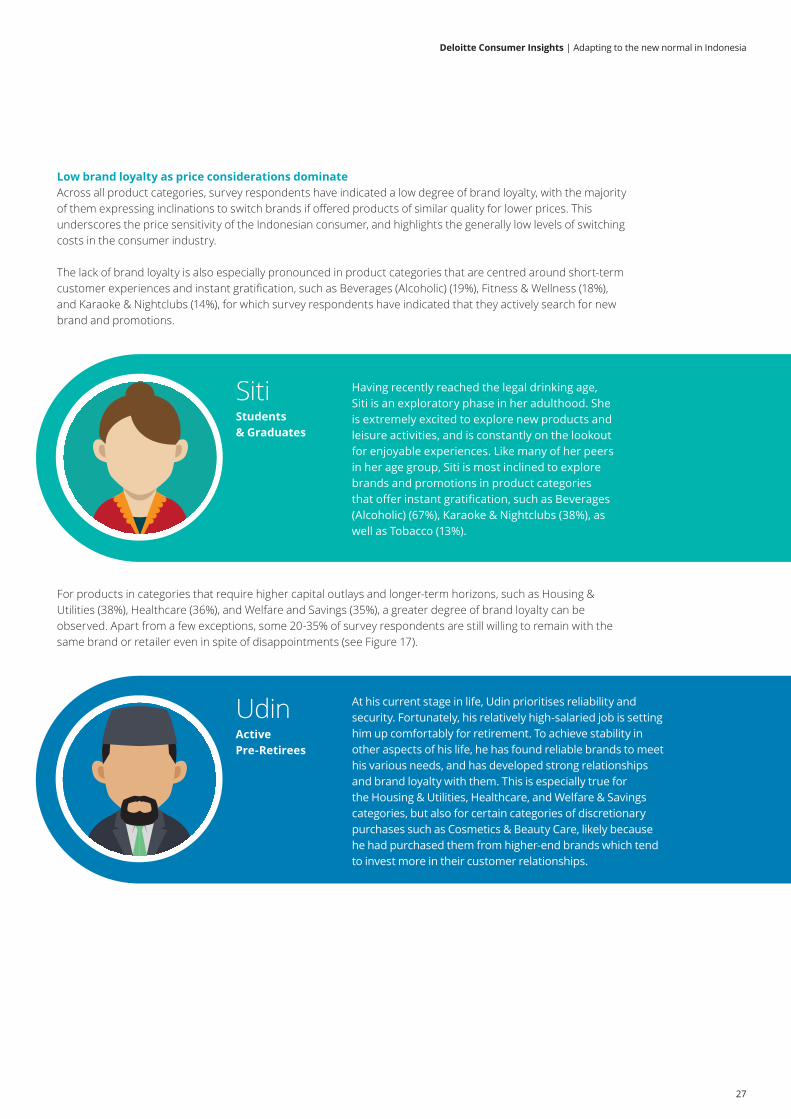
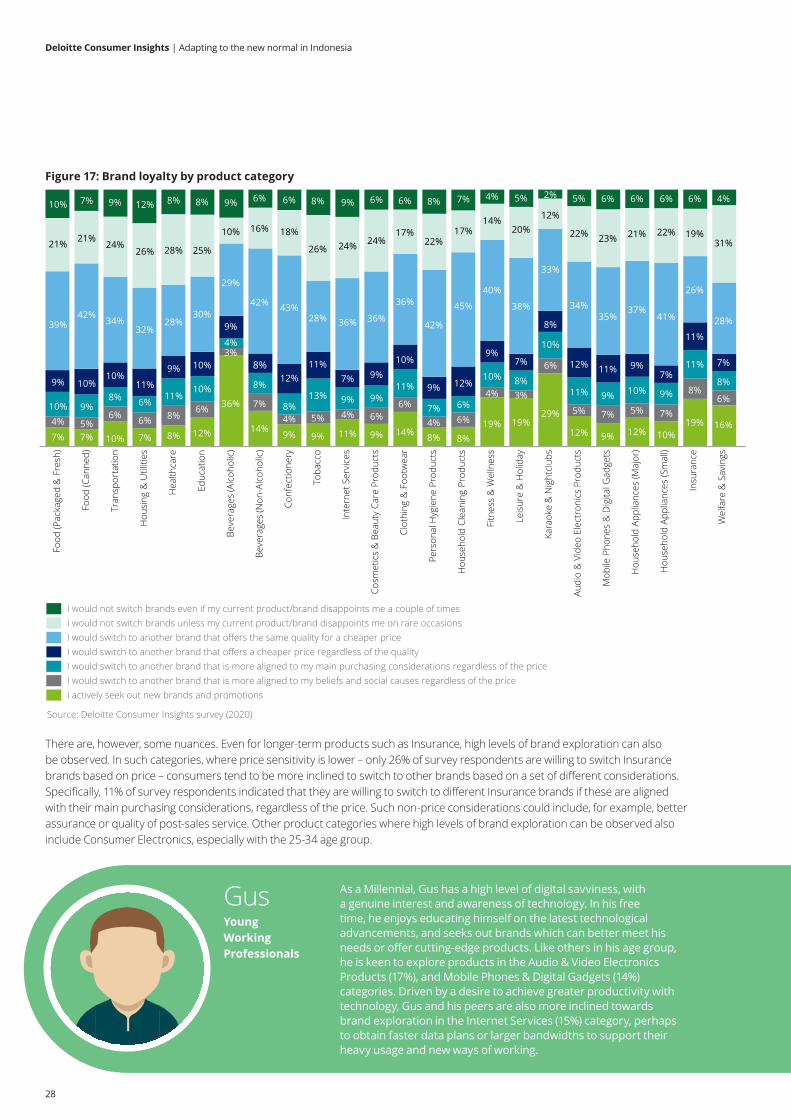
Low brand loyalty as price considerations dominateAcross all product categories, survey respondents have indicated a low degree of brand loyalty, with the majority of them expressing inclinations to switch brands if offered products of similar quality for lower prices. This underscores the price sensitivity of the Indonesian consumer, and highlights the generally low levels of switching costs in the consumer industry.
The lack of brand loyalty is also especially pronounced in product categories that are centred around short-term customer experiences and instant gratification, such as Beverages (Alcoholic) (19%), Fitness & Wellness (18%), and Karaoke & Nightclubs (14%), for which survey respondents have indicated that they actively search for new brand and promotions.
Preferredsources of information
Siti Having recently reached the legal drinking age, Siti is an exploratory phase in her adulthood. She is extremely excited to explore new products and leisure activities, and is constantly on the lookout for enjoyable experiences. Like many of her peers in her age group, Siti is most inclined to explore brands and promotions in product categories that offer instant gratification, such as Beverages (Alcoholic) (67%), Karaoke & Nightclubs (38%), as well as Tobacco (13%).
Students & Graduates
For products in categories that require higher capital outlays and longer-term horizons, such as Housing & Utilities (38%), Healthcare (36%), and Welfare and Savings (35%), a greater degree of brand loyalty can be observed. Apart from a few exceptions, some 20-35% of survey respondents are still willing to remain with the same brand or retailer even in spite of disappointments (see Figure 17).
Udin At his current stage in life, Udin prioritises reliability and security. Fortunately, his relatively high-salaried job is setting him up comfortably for retirement. To achieve stability in other aspects of his life, he has found reliable brands to meet his various needs, and has developed strong relationships and brand loyalty with them. This is especially true for the Housing & Utilities, Healthcare, and Welfare & Savings categories, but also for certain categories of discretionary purchases such as Cosmetics & Beauty Care, likely because he had purchased them from higher-end brands which tend to invest more in their customer relationships.
Active Pre-Retirees
Goals Key concerns
Preferredsources of informationMind Set
Keypurchasingchannels
Behaviours
28
Deloitte Consumer Insights | Adapting to the new normal in Indonesia
Figure 17: Brand loyalty by product categoryFigure 17: Brand loyalty by product category
7% 7% 10% 7% 8% 12%
36%
14%9% 9% 11% 9% 14% 8% 8%
19% 19%29%
12% 9% 12% 10%19% 16%4% 5%
6% 6% 8%6%
3%
7%4% 5% 4% 6%
6%
4% 6%
4% 3%
6%
5% 7% 5% 7%
8%6%
10% 9%8% 6%
11%10%
4%
8%
8%13% 9% 9%
11%
7% 6%
10% 8%
10%
11% 9% 10% 9%
11%
8%9% 10%10%
11%
9% 10%
9%
8%12%
11%7% 9%
10%
9% 12%
9%7%
8%
12% 11% 9%7%
11%
7%
39%42%
34%32%
28%30%
29%
42% 43%28% 36% 36%
36%
42%
45%
40%
38%
33%
34%35%
37%41%
26%
28%
21% 21%24%
26% 28% 25%
10% 16% 18%
26% 24% 24%17%
22%17%
14%20%
12%
22% 23% 21% 22% 19%31%
10% 7% 9% 12% 8% 8% 9% 6% 6% 8% 9% 6% 6% 8% 7% 4% 5% 5% 6% 6% 6% 6% 4%
Beve
rage
s (A
lcoh
olic
)
Food
(Pac
kage
d &
Fre
sh)
Food
(Can
ned)
Tran
spor
tatio
n
Hou
sing
& U
tiliti
es
Hea
lthca
re
Educ
atio
n
Beve
rage
s (N
on-A
lcoh
olic
)
Conf
ectio
nery
Toba
cco
Hou
seho
ld A
pplia
nces
(Sm
all)
Inte
rnet
Ser
vice
s
Cosm
etic
s &
Bea
uty
Care
Pro
duct
s
Audi
o &
Vid
eo E
lect
roni
cs P
rodu
cts
Clot
hing
& F
ootw
ear
2%
Pers
onal
Hyg
iene
Pro
duct
s
Hou
seho
ld C
lean
ing
Prod
ucts
Hou
seho
ld A
pplia
nces
(Maj
or)
Fitn
ess
& W
elln
ess
Leis
ure
& H
olid
ay
Kara
oke
& N
ight
club
s
Mob
ile P
hone
s &
Dig
ital G
adge
ts
Insu
ranc
e
Wel
fare
& S
avin
gs
I would not switch brands even if my current product/brand disappoints me a couple of timesI would not switch brands unless my current product/brand disappoints me on rare occasionsI would switch to another brand that offers the same quality for a cheaper priceI would switch to another brand that offers a cheaper price regardless of the qualityI would switch to another brand that is more aligned to my main purchasing considerations regardless of the priceI would switch to another brand that is more aligned to my beliefs and social causes regardless of the priceI actively seek out new brands and promotions
Source: Deloitte Consumer Insights survey (2020)
There are, however, some nuances. Even for longer-term products such as Insurance, high levels of brand exploration can also be observed. In such categories, where price sensitivity is lower – only 26% of survey respondents are willing to switch Insurance brands based on price – consumers tend to be more inclined to switch to other brands based on a set of different considerations. Specifically, 11% of survey respondents indicated that they are willing to switch to different Insurance brands if these are aligned with their main purchasing considerations, regardless of the price. Such non-price considerations could include, for example, better assurance or quality of post-sales service. Other product categories where high levels of brand exploration can be observed also include Consumer Electronics, especially with the 25-34 age group.
Gus As a Millennial, Gus has a high level of digital savviness, with a genuine interest and awareness of technology. In his free time, he enjoys educating himself on the latest technological advancements, and seeks out brands which can better meet his needs or offer cutting-edge products. Like others in his age group, he is keen to explore products in the Audio & Video Electronics Products (17%), and Mobile Phones & Digital Gadgets (14%) categories. Driven by a desire to achieve greater productivity with technology, Gus and his peers are also more inclined towards brand exploration in the Internet Services (15%) category, perhaps to obtain faster data plans or larger bandwidths to support their heavy usage and new ways of working.
Young Working Professionals
29
Deloitte Consumer Insights | Adapting to the new normal in Indonesia
Figure 18: Overall digital activity
Bandung
Jakarta
Surabaya
Medan
Makassar
14%
36%29%
13%
7%
Very frequent (More than 40 hours per week)
Frequent (20-40 hours per week)Never Occasional (5-20 hours per week)Seldom (Less than 5 hours per week)
2% 17% 42% 35% 4%
5% 11% 27% 42% 15%
8% 26% 33% 24% 9%
24% 9% 18% 31% 19%
7% 15% 34% 25% 19%
Source: Deloitte Consumer Insights survey (2020)
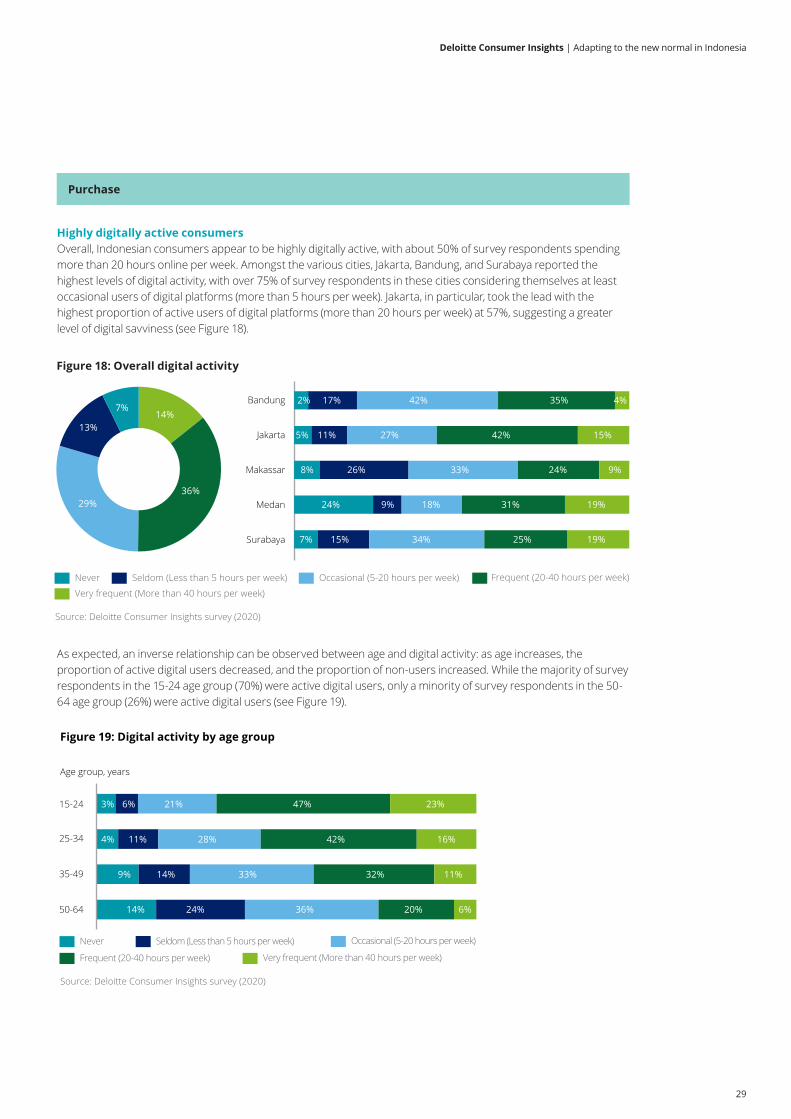
As expected, an inverse relationship can be observed between age and digital activity: as age increases, the proportion of active digital users decreased, and the proportion of non-users increased. While the majority of survey respondents in the 15-24 age group (70%) were active digital users, only a minority of survey respondents in the 50-64 age group (26%) were active digital users (see Figure 19).
Figure 19: Digital activity by age group
Very frequent (More than 40 hours per week)Frequent (20-40 hours per week)
Never Occasional (5-20 hours per week)Seldom (Less than 5 hours per week)
15-24
25-34
35-49
50-64
Age group, years
3%
4%
9%
14%
6%
11%
14%
24%
21%
28%
33%
36%
47%
42%
32%
20%
23%
16%
11%
6%
Source: Deloitte Consumer Insights survey (2020)
Figure 18: Overall digital activity
Highly digitally active consumersOverall, Indonesian consumers appear to be highly digitally active, with about 50% of survey respondents spending more than 20 hours online per week. Amongst the various cities, Jakarta, Bandung, and Surabaya reported the highest levels of digital activity, with over 75% of survey respondents in these cities considering themselves at least occasional users of digital platforms (more than 5 hours per week). Jakarta, in particular, took the lead with the highest proportion of active users of digital platforms (more than 20 hours per week) at 57%, suggesting a greater level of digital savviness (see Figure 18).
Purchase
30
Deloitte Consumer Insights | Adapting to the new normal in Indonesia
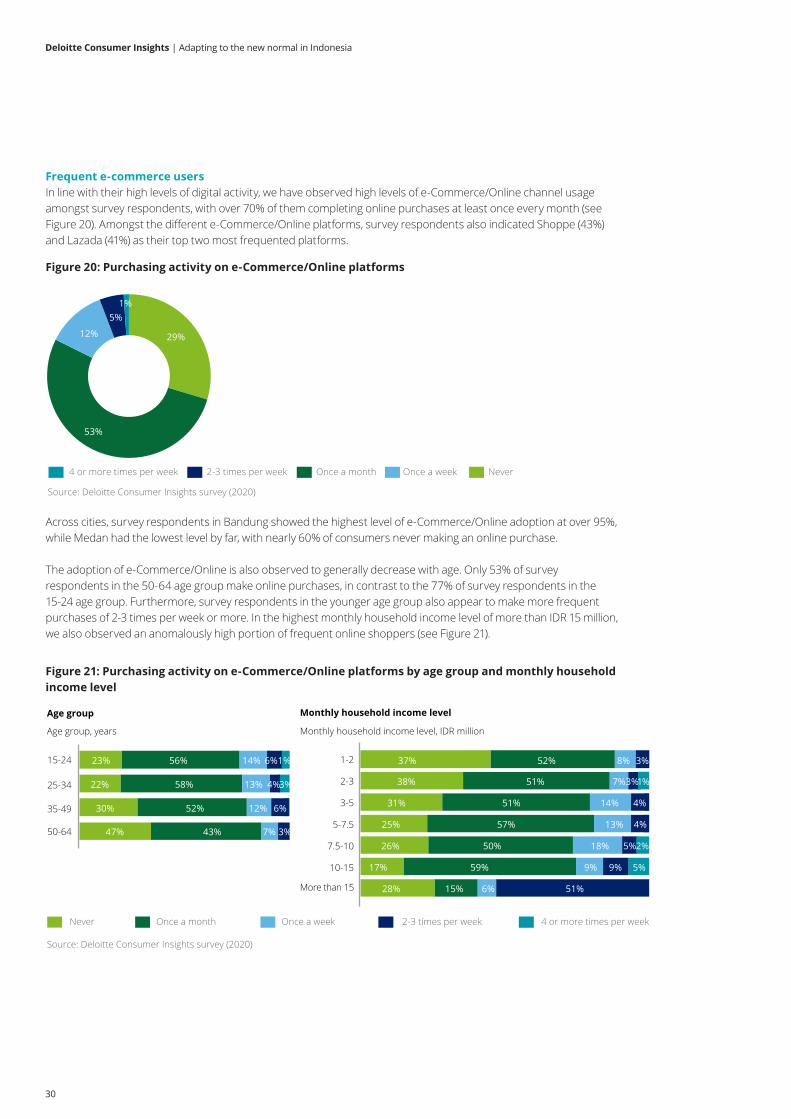
Frequent e-commerce usersIn line with their high levels of digital activity, we have observed high levels of e-Commerce/Online channel usage amongst survey respondents, with over 70% of them completing online purchases at least once every month (see Figure 20). Amongst the different e-Commerce/Online platforms, survey respondents also indicated Shoppe (43%) and Lazada (41%) as their top two most frequented platforms.
Across cities, survey respondents in Bandung showed the highest level of e-Commerce/Online adoption at over 95%, while Medan had the lowest level by far, with nearly 60% of consumers never making an online purchase.
The adoption of e-Commerce/Online is also observed to generally decrease with age. Only 53% of survey respondents in the 50-64 age group make online purchases, in contrast to the 77% of survey respondents in the 15-24 age group. Furthermore, survey respondents in the younger age group also appear to make more frequent purchases of 2-3 times per week or more. In the highest monthly household income level of more than IDR 15 million, we also observed an anomalously high portion of frequent online shoppers (see Figure 21).
Figure 20: Purchasing activity on e-Commerce/Online platforms
Figure 21: Purchasing activity on e-Commerce/Online platforms by age group and monthly household income level
Figure 19: Purchasing activity on e-commerce platforms
29%
53%
12%
5%1%
NeverOnce a month Once a week2-3 times per week4 or more times per week
Source: Deloitte Consumer Insights survey (2020)
Age group
23%
22%
30%
56%
58%
52%
14%
13%
12%
6%
4%
6%
3%
15-24
25-34
35-49
50-64
Never Once a month Once a week 2-3 times per week 4 or more times per week
Source: Deloitte Consumer Insights survey (2020)
Age group, years
Monthly household income level
Monthly household income level, IDR million
47% 43% 7% 3%
1%
38% 51% 7%3%
31% 51% 14% 4%
25% 57% 13% 4%
26% 50% 18% 5%2%
17% 59% 9% 9% 5%
28% 15% 6% 51%
1-2
2-3
3-5
5-7.5
7.5-10
10-15
More than 15
37% 52% 8% 3%
1%

31
Deloitte Consumer Insights | Adapting to the new normal in Indonesia
e-Commerce strengthens foothold in diverse channel mixOver the previous editions of the survey, we have observed a diverse channel mix across Indonesia’s retail landscape. In this latest edition, we continue to witness a decreasing preference for Traditional Trade channels, such as Warungs, Wet Markets, and Street Hawkers, with only 32% of survey respondents expressing a preference for these channels – the lowest level in four years (see Figure 22). Even prior to the pandemic, evolving consumer preferences have already led to this noticeable shift in channel preferences – but the pandemic has evidently accelerated it significantly.
Udin Despite the stereotype that older consumers tend to lack digital savviness, Udin has become an avid e-commerce user ever since he realised its benefits during the pandemic. With his high purchasing power, he is now a frequent e-Commerce/Online platform user, along with his peers with the same household income level (more than IDR 10 million) and age group (35-49 years). Furthermore, consumers in his monthly household income level and age group also tend to be more inclined to make impulse and discretionary purchases. With their increasing digital readiness accelerated by the onset of COVID-19, consumers like Udin could prove to become the ideal targets for online consumer companies in the future.
Active Pre-Retirees
Goals Key concerns
Preferredsources of informationMind Set
Keypurchasingchannels
Behaviours
Figure 21: Overall channel preferences
Before COVID-19 After COVID-19
Source: Deloitte Consumer Insights survey (2020)
33% 32%
58% 57%
10% 11%
Traditional Trade Modern Trade e-Commerce/Online
Figure 22: Overall channel preferences (2016-2020)
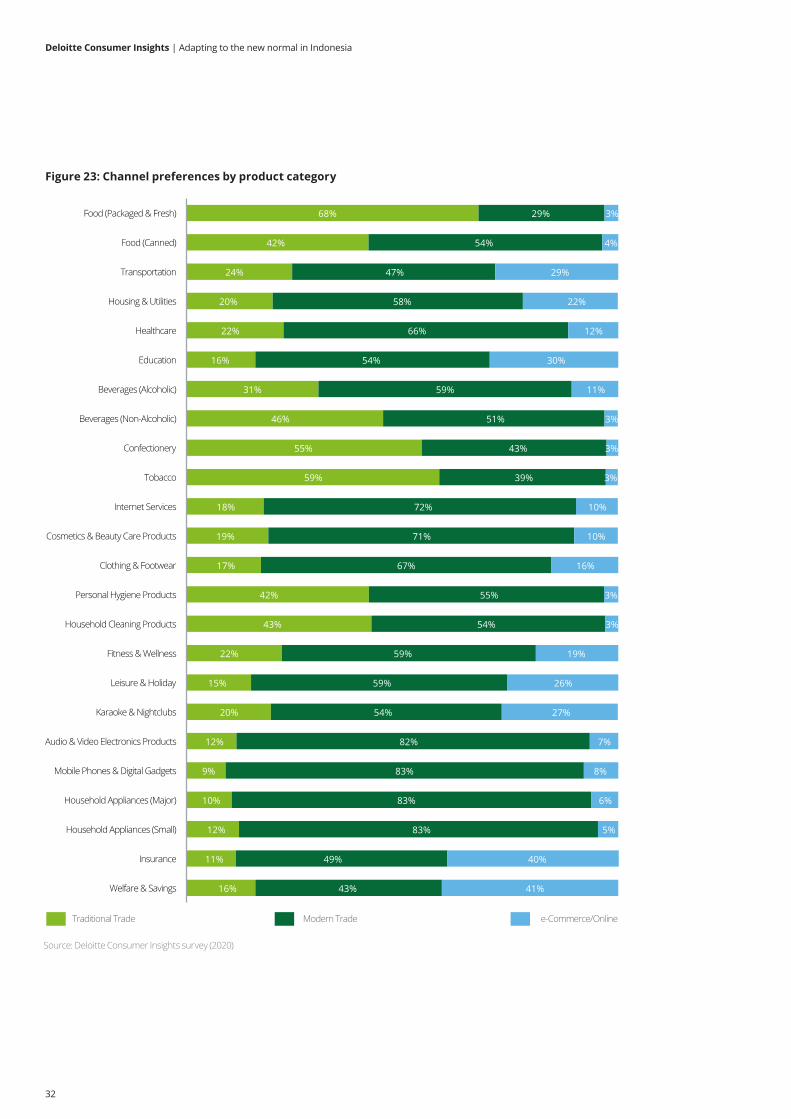
Modern Trade channels, such as supermarkets, department stores, and specialty stores, were preferred by most survey respondents for a number of product categories, including Internet Services (72%), Cosmetics & Beauty Care Products (71%), Clothing & Footwear (67%), Household Appliances (Major) (83%), Household Appliances (Small) (83%), and Mobile Phones & Digital Gadgets (83%).
What is more notable, however, is the strengthening foothold of e-Commerce/Online channels: more than a quarter of overall survey respondents have indicated their preference for online channels for product categories such as Welfare & Savings (41%), Insurance (40%), Education (30%) and Transportation (29%).
The higher levels of e-Commerce/Online adoption in these categories could be attributed to the nature of the transactions, such as monthly savings deposits, insurance premium payments, and school fees payments, which are generally regular and recurring. In other product categories, such as Consumer Electronics, where transactions may entail greater consideration on the part of the consumer, we see a lower preference for e-Commerce/Online platforms.
However, in certain product categories where Traditional Trade channels have always been dominant, both Modern Trade and e-Commerce/Online channels continue to lag. The results show that Traditional Trade channels remain the preferred choice for product categories such as Food (Packaged & Fresh) (68%), Food (Canned) (42%), Confectionery (55%), Beverages (Non-Alcoholic) (46%), and Tobacco (59%), where channels such as Warungs benefit not only from the customer perception of lower prices, but are also able to capitalise on their localised knowledge to cater to the specific demands and preferences of their small bases of customers.
In terms of channel preferences, survey respondents also indicated that their decisions are mostly based on their considerations for convenience, long-standing relationships, competitive prices, and product variety (see Figure 23).
32
Deloitte Consumer Insights | Adapting to the new normal in Indonesia
Figure 23: Channel preferences by product category
Beverages (Alcoholic)
Food (Packaged & Fresh)
Food (Canned)
Transportation
Housing & Utilities
Beverages (Non-Alcoholic)
Healthcare
Education
Confectionery
Cosmetics & Beauty Care Products
Tobacco
Internet Services
Clothing & Footwear
Personal Hygiene Products
Household Cleaning Products
Fitness & Wellness
Leisure & Holiday
Karaoke & Nightclubs
Audio & Video Electronics Products
Mobile Phones & Digital Gadgets
Household Appliances (Major)
Household Appliances (Small)
Insurance
Welfare & Savings
Traditional Trade Modern Trade e-Commerce/Online
68%
42%
24%
20%
22%
16%
31%
46%
55%
59%
18%
19%
17%
42%
43%
22%
15%
20%
12%
9%
10%
12%
11%
16%
29%
54%
47%
58%
66%
54%
59%
51%
43%
39%
72%
71%
67%
55%
54%
59%
59%
54%
82%
83%
83%
83%
49%
43%
3%
4%
29%
22%
12%
30%
11%
3%
3%
3%
10%
10%
16%
3%
3%
19%
26%
27%
7%
8%
6%
5%
40%
41%
Figure 22: Channel preferences by product category
Source: Deloitte Consumer Insights survey (2020)
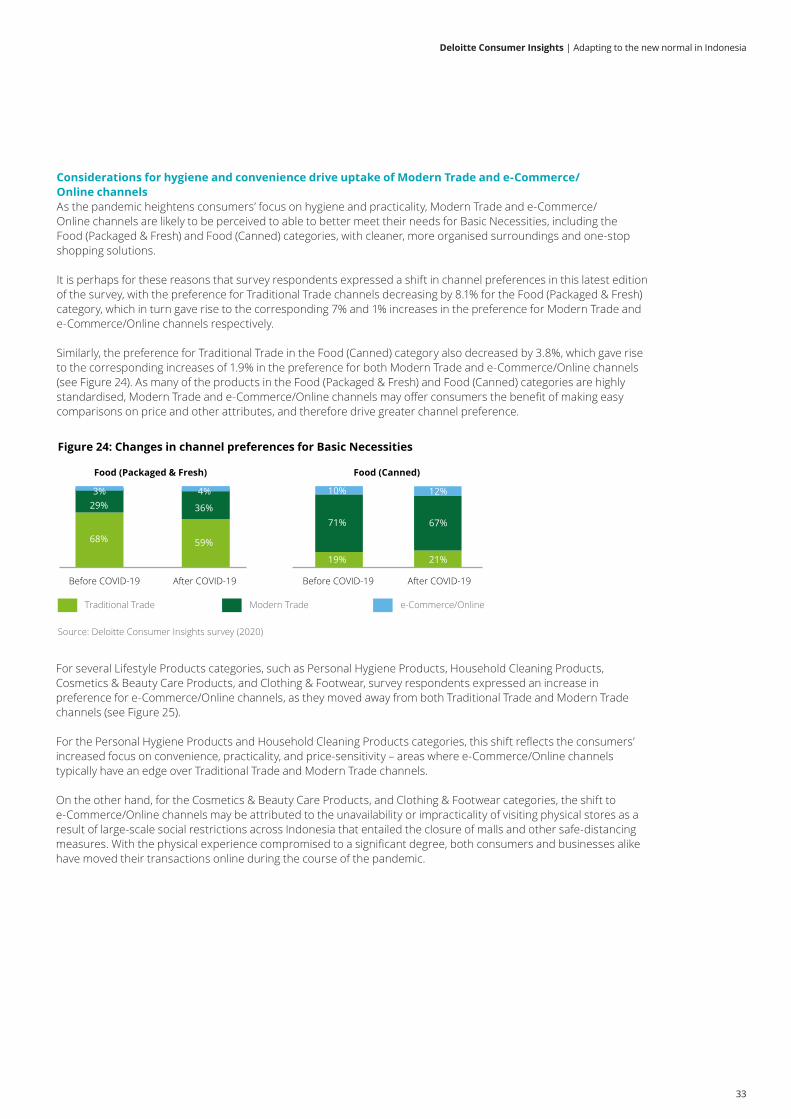
33
Deloitte Consumer Insights | Adapting to the new normal in Indonesia
Food (Packaged & Fresh)
Figure 24: Changes in channel preferences for Basic Necessities
68% 59%
29% 36%
3% 4%
Food (Canned)
19% 21%
71% 67%
10% 12%
Before COVID-19 After COVID-19
Source: Deloitte Consumer Insights survey (2020)
Before COVID-19 After COVID-19
Traditional Trade Modern Trade e-Commerce/Online
Considerations for hygiene and convenience drive uptake of Modern Trade and e-Commerce/ Online channelsAs the pandemic heightens consumers’ focus on hygiene and practicality, Modern Trade and e-Commerce/Online channels are likely to be perceived to able to better meet their needs for Basic Necessities, including the Food (Packaged & Fresh) and Food (Canned) categories, with cleaner, more organised surroundings and one-stop shopping solutions.
It is perhaps for these reasons that survey respondents expressed a shift in channel preferences in this latest edition of the survey, with the preference for Traditional Trade channels decreasing by 8.1% for the Food (Packaged & Fresh) category, which in turn gave rise to the corresponding 7% and 1% increases in the preference for Modern Trade and e-Commerce/Online channels respectively.
Similarly, the preference for Traditional Trade in the Food (Canned) category also decreased by 3.8%, which gave rise to the corresponding increases of 1.9% in the preference for both Modern Trade and e-Commerce/Online channels (see Figure 24). As many of the products in the Food (Packaged & Fresh) and Food (Canned) categories are highly standardised, Modern Trade and e-Commerce/Online channels may offer consumers the benefit of making easy comparisons on price and other attributes, and therefore drive greater channel preference.
For several Lifestyle Products categories, such as Personal Hygiene Products, Household Cleaning Products, Cosmetics & Beauty Care Products, and Clothing & Footwear, survey respondents expressed an increase in preference for e-Commerce/Online channels, as they moved away from both Traditional Trade and Modern Trade channels (see Figure 25).
For the Personal Hygiene Products and Household Cleaning Products categories, this shift reflects the consumers’ increased focus on convenience, practicality, and price-sensitivity – areas where e-Commerce/Online channels typically have an edge over Traditional Trade and Modern Trade channels.
On the other hand, for the Cosmetics & Beauty Care Products, and Clothing & Footwear categories, the shift to e-Commerce/Online channels may be attributed to the unavailability or impracticality of visiting physical stores as a result of large-scale social restrictions across Indonesia that entailed the closure of malls and other safe-distancing measures. With the physical experience compromised to a significant degree, both consumers and businesses alike have moved their transactions online during the course of the pandemic.
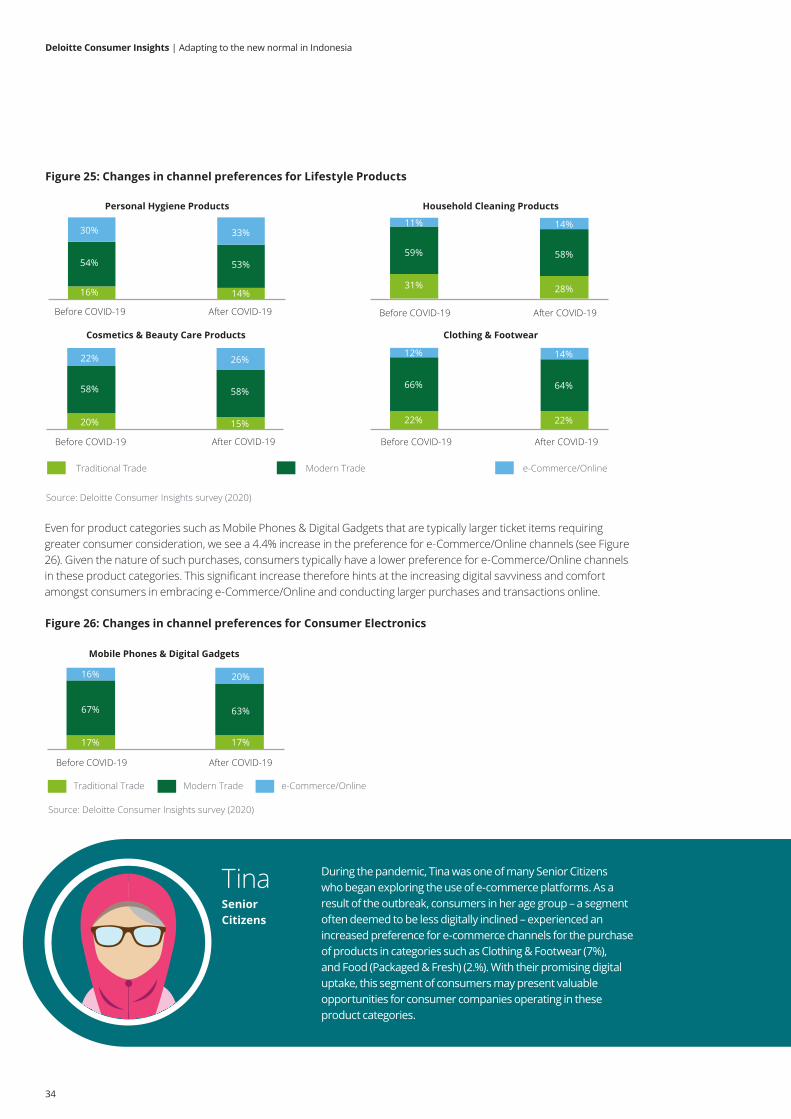
34
Deloitte Consumer Insights | Adapting to the new normal in Indonesia
Personal Hygiene Products
16% 14%
54% 53%
30% 33%
Household Cleaning Products
31% 28%
59% 58%
11% 14%
Cosmetics & Beauty Care Products
20% 15%
58% 58%
22% 26%
Clothing & Footwear
22% 22%
66% 64%
12% 14%
Before COVID-19 After COVID-19 Before COVID-19 After COVID-19
Before COVID-19 After COVID-19 Before COVID-19 After COVID-19
Source: Deloitte Consumer Insights survey (2020)
Traditional Trade Modern Trade e-Commerce/Online
Figure 25: Changes in channel preferences for Lifestyle Products
Even for product categories such as Mobile Phones & Digital Gadgets that are typically larger ticket items requiring greater consumer consideration, we see a 4.4% increase in the preference for e-Commerce/Online channels (see Figure 26). Given the nature of such purchases, consumers typically have a lower preference for e-Commerce/Online channels in these product categories. This significant increase therefore hints at the increasing digital savviness and comfort amongst consumers in embracing e-Commerce/Online and conducting larger purchases and transactions online.
Tina During the pandemic, Tina was one of many Senior Citizens who began exploring the use of e-commerce platforms. As a result of the outbreak, consumers in her age group – a segment often deemed to be less digitally inclined – experienced an increased preference for e-commerce channels for the purchase of products in categories such as Clothing & Footwear (7%), and Food (Packaged & Fresh) (2.%). With their promising digital uptake, this segment of consumers may present valuable opportunities for consumer companies operating in these product categories.
Senior Citizens
Figure 26: Changes in channel preferences for Consumer Electronics
Mobile Phones & Digital Gadgets
17% 17%
67% 63%
16% 20%
Source: Deloitte Consumer Insights survey (2020)
Traditional Trade Modern Trade e-Commerce/Online
Before COVID-19 After COVID-19
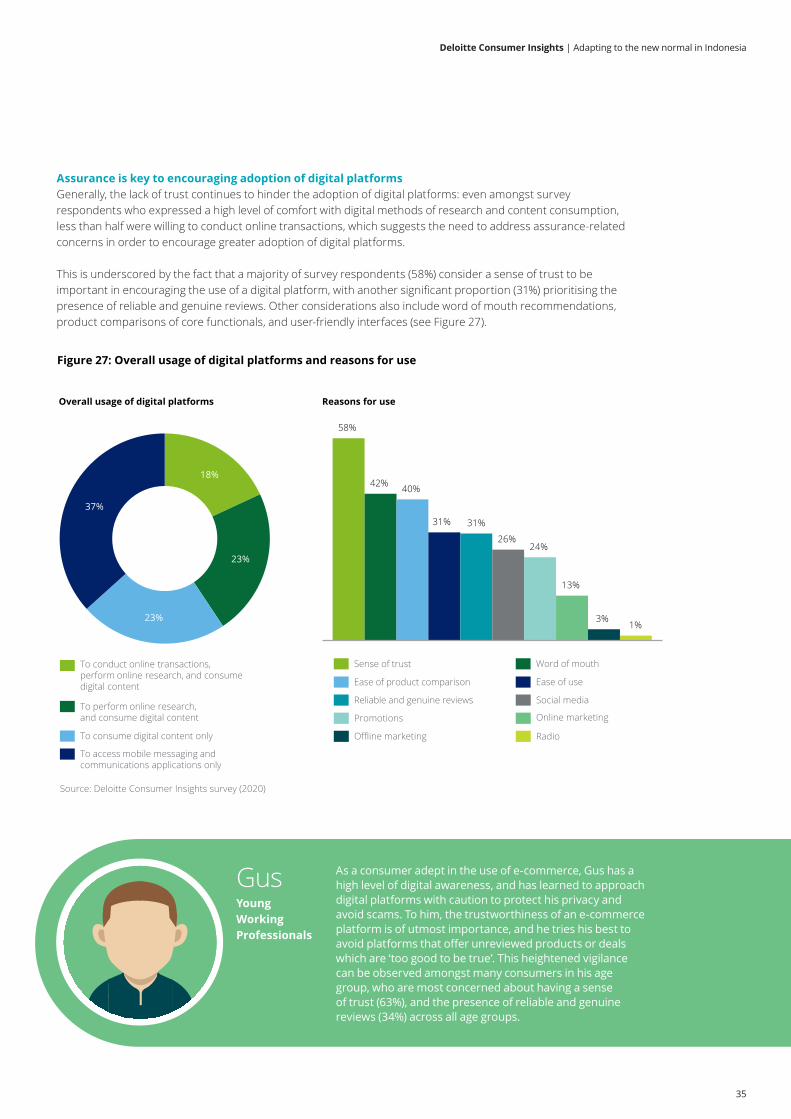
35
Deloitte Consumer Insights | Adapting to the new normal in Indonesia
Assurance is key to encouraging adoption of digital platformsGenerally, the lack of trust continues to hinder the adoption of digital platforms: even amongst survey respondents who expressed a high level of comfort with digital methods of research and content consumption, less than half were willing to conduct online transactions, which suggests the need to address assurance-related concerns in order to encourage greater adoption of digital platforms.
This is underscored by the fact that a majority of survey respondents (58%) consider a sense of trust to be important in encouraging the use of a digital platform, with another significant proportion (31%) prioritising the presence of reliable and genuine reviews. Other considerations also include word of mouth recommendations, product comparisons of core functionals, and user-friendly interfaces (see Figure 27).
Figure 27: Overall usage of digital platforms and reasons for use
18%
23%
23%
37%
To conduct online transactions,perform online research, and consumedigital content
To access mobile messaging andcommunications applications only
To perform online research,and consume digital content
To consume digital content only
Overall usage of digital platforms Reasons for use
58%
42% 40%
31% 31%
26%24%
13%
3%1%
Ease of use
Sense of trust Word of mouth
Ease of product comparison
Reliable and genuine reviews Social media
Promotions Online marketing
Offline marketing Radio
Source: Deloitte Consumer Insights survey (2020)
Gus As a consumer adept in the use of e-commerce, Gus has a high level of digital awareness, and has learned to approach digital platforms with caution to protect his privacy and avoid scams. To him, the trustworthiness of an e-commerce platform is of utmost importance, and he tries his best to avoid platforms that offer unreviewed products or deals which are ‘too good to be true’. This heightened vigilance can be observed amongst many consumers in his age group, who are most concerned about having a sense of trust (63%), and the presence of reliable and genuine reviews (34%) across all age groups.
Young Working Professionals
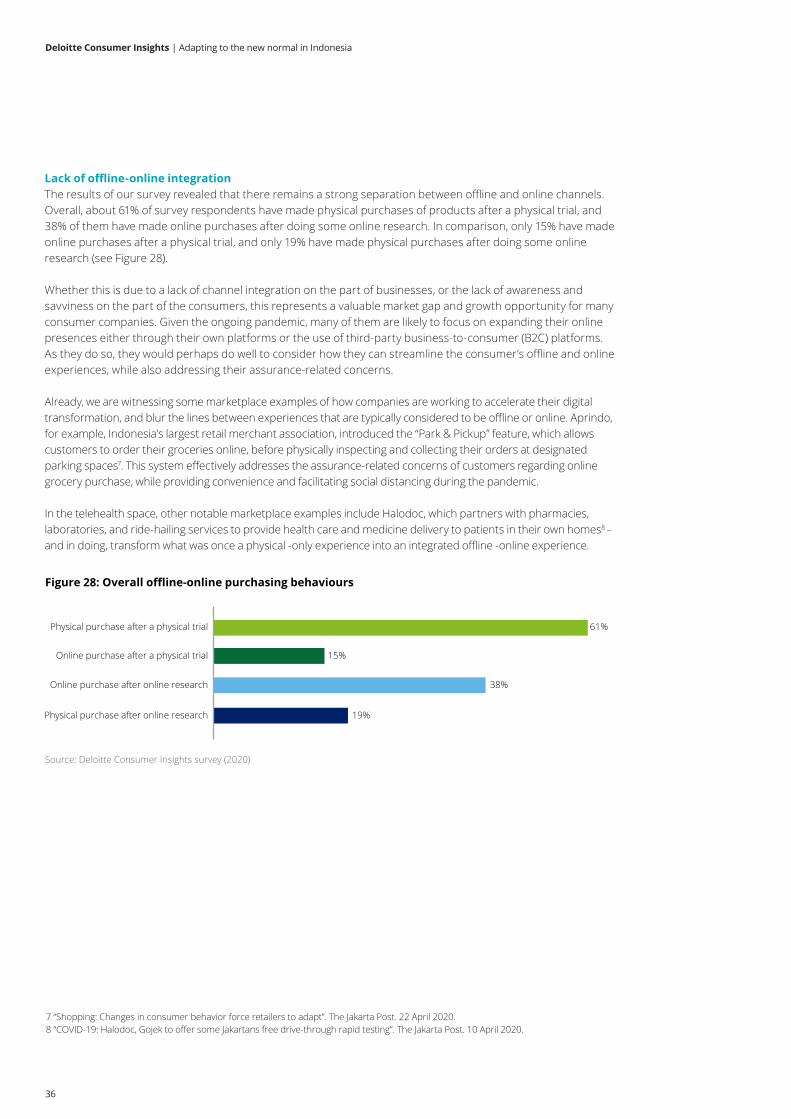
36
Deloitte Consumer Insights | Adapting to the new normal in Indonesia
Lack of offline-online integrationThe results of our survey revealed that there remains a strong separation between offline and online channels. Overall, about 61% of survey respondents have made physical purchases of products after a physical trial, and 38% of them have made online purchases after doing some online research. In comparison, only 15% have made online purchases after a physical trial, and only 19% have made physical purchases after doing some online research (see Figure 28).
Whether this is due to a lack of channel integration on the part of businesses, or the lack of awareness and savviness on the part of the consumers, this represents a valuable market gap and growth opportunity for many consumer companies. Given the ongoing pandemic, many of them are likely to focus on expanding their online presences either through their own platforms or the use of third-party business-to-consumer (B2C) platforms. As they do so, they would perhaps do well to consider how they can streamline the consumer’s offline and online experiences, while also addressing their assurance-related concerns.
Already, we are witnessing some marketplace examples of how companies are working to accelerate their digital transformation, and blur the lines between experiences that are typically considered to be offline or online. Aprindo, for example, Indonesia’s largest retail merchant association, introduced the “Park & Pickup” feature, which allows customers to order their groceries online, before physically inspecting and collecting their orders at designated parking spaces7. This system effectively addresses the assurance-related concerns of customers regarding online grocery purchase, while providing convenience and facilitating social distancing during the pandemic.
In the telehealth space, other notable marketplace examples include Halodoc, which partners with pharmacies, laboratories, and ride-hailing services to provide health care and medicine delivery to patients in their own homes8 – and in doing, transform what was once a physical -only experience into an integrated offline -online experience.
7 “Shopping: Changes in consumer behavior force retailers to adapt”. The Jakarta Post. 22 April 2020. 8 “COVID-19: Halodoc, Gojek to offer some Jakartans free drive-through rapid testing”. The Jakarta Post. 10 April 2020.
Figure 28: Overall offline-online purchasing behaviours
61%
15%
38%
19%
Physical purchase after a physical trial
Online purchase after a physical trial
Online purchase after online research
Physical purchase after online research
Source: Deloitte Consumer Insights survey (2020)
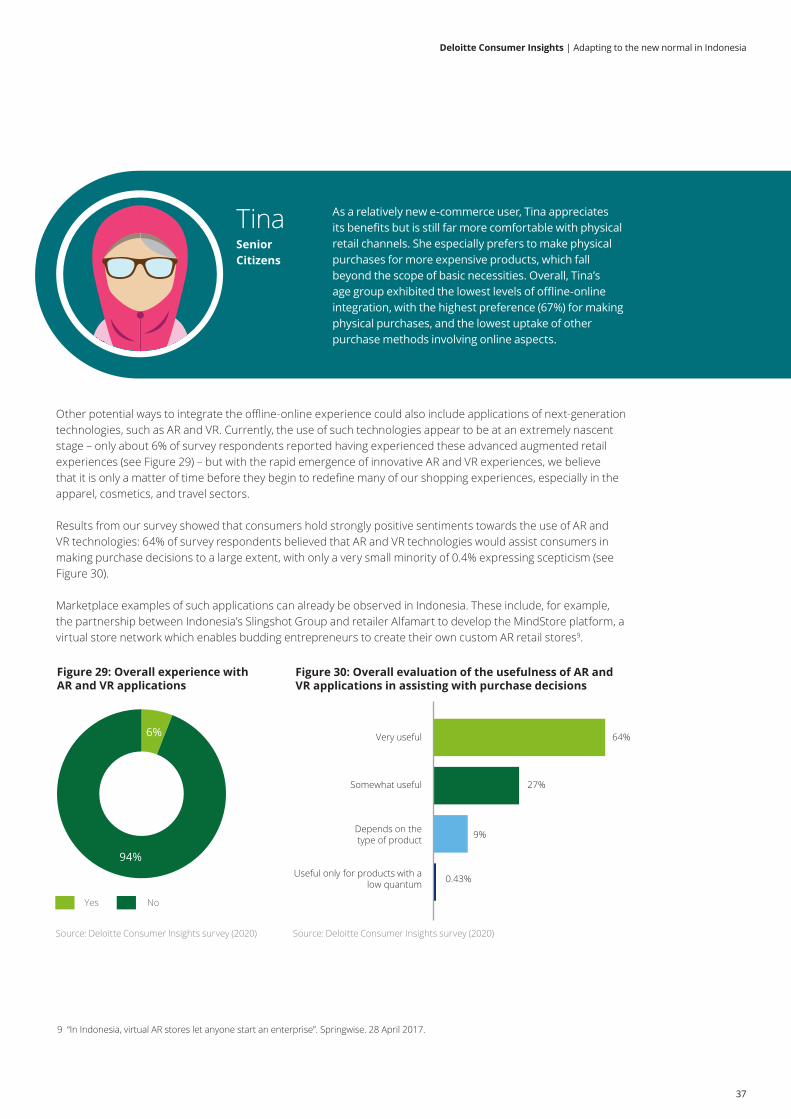
37
Deloitte Consumer Insights | Adapting to the new normal in Indonesia
Tina As a relatively new e-commerce user, Tina appreciates its benefits but is still far more comfortable with physical retail channels. She especially prefers to make physical purchases for more expensive products, which fall beyond the scope of basic necessities. Overall, Tina’s age group exhibited the lowest levels of offline-online integration, with the highest preference (67%) for making physical purchases, and the lowest uptake of other purchase methods involving online aspects.
Senior Citizens
Other potential ways to integrate the offline-online experience could also include applications of next-generation technologies, such as AR and VR. Currently, the use of such technologies appear to be at an extremely nascent stage – only about 6% of survey respondents reported having experienced these advanced augmented retail experiences (see Figure 29) – but with the rapid emergence of innovative AR and VR experiences, we believe that it is only a matter of time before they begin to redefine many of our shopping experiences, especially in the apparel, cosmetics, and travel sectors.
Results from our survey showed that consumers hold strongly positive sentiments towards the use of AR and VR technologies: 64% of survey respondents believed that AR and VR technologies would assist consumers in making purchase decisions to a large extent, with only a very small minority of 0.4% expressing scepticism (see Figure 30).
Marketplace examples of such applications can already be observed in Indonesia. These include, for example, the partnership between Indonesia’s Slingshot Group and retailer Alfamart to develop the MindStore platform, a virtual store network which enables budding entrepreneurs to create their own custom AR retail stores9.
9 “In Indonesia, virtual AR stores let anyone start an enterprise”. Springwise. 28 April 2017.
Figure 29: Overall experience withAR and VR applications
6%
94%
Source: Deloitte Consumer Insights survey (2020)
Yes No
Figure 30: Overall evaluation of the usefulness of AR andVR applications in assisting with purchase decisions
Very useful
Somewhat useful
Depends on thetype of product
Useful only for products with alow quantum
64%
27%
9%
0.43%
Source: Deloitte Consumer Insights survey (2020)Source: Deloitte Consumer Insights survey (2020) Source: Deloitte Consumer Insights survey (2020)
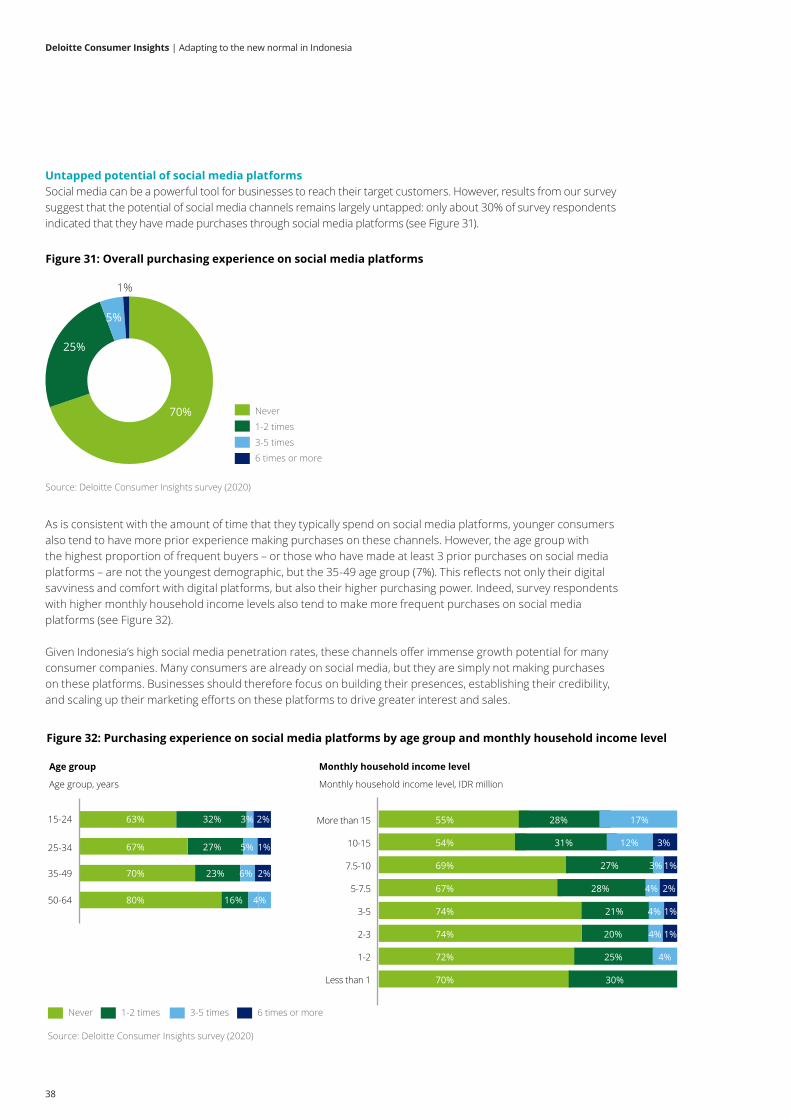
38
Deloitte Consumer Insights | Adapting to the new normal in Indonesia
Untapped potential of social media platformsSocial media can be a powerful tool for businesses to reach their target customers. However, results from our survey suggest that the potential of social media channels remains largely untapped: only about 30% of survey respondents indicated that they have made purchases through social media platforms (see Figure 31).
As is consistent with the amount of time that they typically spend on social media platforms, younger consumers also tend to have more prior experience making purchases on these channels. However, the age group with the highest proportion of frequent buyers – or those who have made at least 3 prior purchases on social media platforms – are not the youngest demographic, but the 35-49 age group (7%). This reflects not only their digital savviness and comfort with digital platforms, but also their higher purchasing power. Indeed, survey respondents with higher monthly household income levels also tend to make more frequent purchases on social media platforms (see Figure 32).
Given Indonesia’s high social media penetration rates, these channels offer immense growth potential for many consumer companies. Many consumers are already on social media, but they are simply not making purchases on these platforms. Businesses should therefore focus on building their presences, establishing their credibility, and scaling up their marketing efforts on these platforms to drive greater interest and sales.
Figure 31: Overall purchasing experience on social media platforms
70%
25%
5%
1%
Never
6 times or more
1-2 times
3-5 times
Source: Deloitte Consumer Insights survey (2020)
Figure 32: Purchasing experience on social media platforms by age group and monthly household income level
Age group Monthly household income level
32% 3% 2%
27% 5% 1%
23% 6% 2%
16% 4%
15-24
25-34
35-49
50-64
70% 30%
55% 28% 17%
72% 25% 4%
74% 20% 4% 1%
74% 21% 4% 1%
67% 28% 4% 2%
69% 27% 3% 1%
54% 31% 12% 3%
Less than 1
1-2
2-3
3-5
5-7.5
7.5-10
10-15
More than 15
Age group, years
Source: Deloitte Consumer Insights survey (2020)
Never 6 times or more1-2 times 3-5 times
Monthly household income level, IDR million
63%
70%
80%
67%
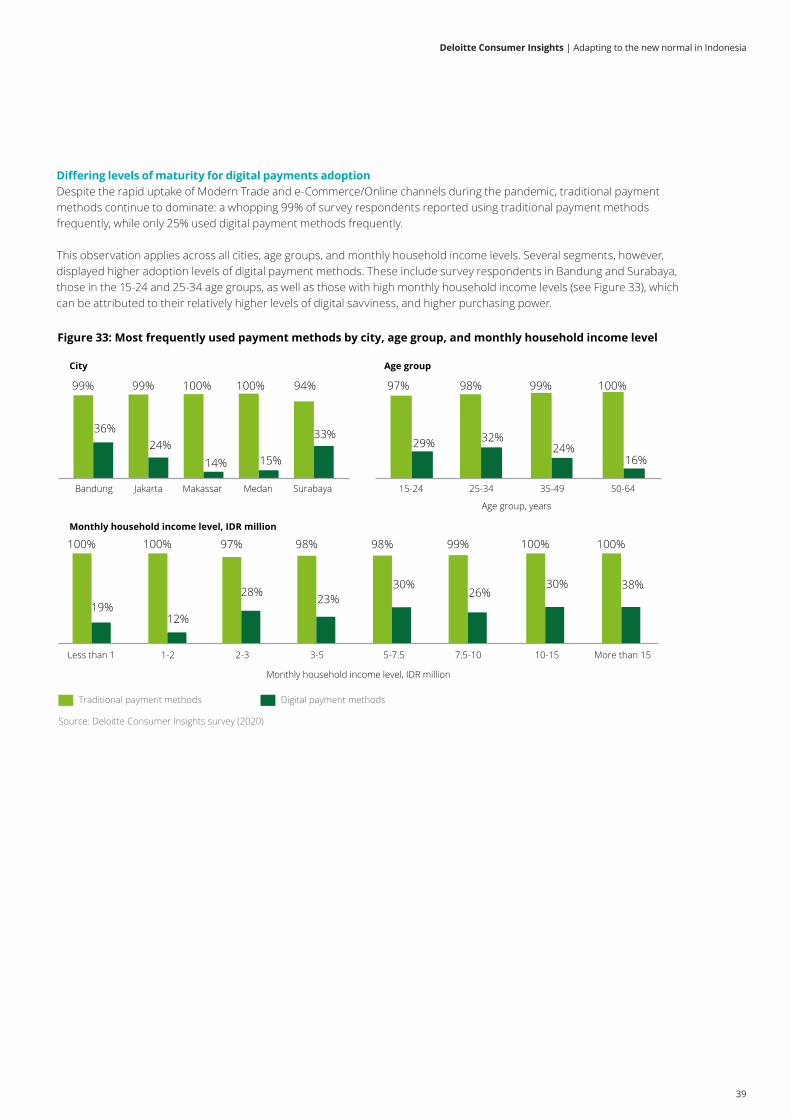
39
Deloitte Consumer Insights | Adapting to the new normal in Indonesia
Differing levels of maturity for digital payments adoptionDespite the rapid uptake of Modern Trade and e-Commerce/Online channels during the pandemic, traditional payment methods continue to dominate: a whopping 99% of survey respondents reported using traditional payment methods frequently, while only 25% used digital payment methods frequently.
This observation applies across all cities, age groups, and monthly household income levels. Several segments, however, displayed higher adoption levels of digital payment methods. These include survey respondents in Bandung and Surabaya, those in the 15-24 and 25-34 age groups, as well as those with high monthly household income levels (see Figure 33), which can be attributed to their relatively higher levels of digital savviness, and higher purchasing power.
Figure 33: Most frequently used payment methods by city, age group, and monthly household income level
City
99% 99% 100% 100% 94%
36%24%
14% 15%
33%
Bandung Jakarta Makassar Medan Surabaya
Traditional payment methods Digital payment methods
Age group
Age group, years
Monthly household income level, IDR million
97%
29%
98%
32%
99%
24%
100%
16%
15-24 25-34 35-49 50-64
100%
19%
100%
12%
97%
28%
98%
23%
98%
30%
99%
26%
100%
30%
100%
38%
Less than 1 1-2 2-3 3-5 5-7.5 7.5-10 10-15 More than 15
Monthly household income level, IDR million
Source: Deloitte Consumer Insights survey (2020)

40
Deloitte Consumer Insights | Adapting to the new normal in Indonesia
Broadly, consumers can be classified into four main stages based on their attitudes and adoption of digital payments (see Figure 34):
• Adoption: Consumers are highly comfortable with the use of digital payment methods, and conduct most of their transactions without cash. About 10% of our survey respondents are in this stage.
• Awareness: Consumers are aware of the practical benefits of the use of digital payments methods, and their willingness to explore these methods will gradually improve their level of comfort. About 35% of our survey respondents are in this stage, and they represent the highest potential for the near-term growth in digital payments adoption.
• Indifference: Consumers are indifferent towards the use of digital payment methods, most likely due to a lack of awareness of the practical benefits, and their lack of preference means that they continue to remain in their comfort zone where they predominantly rely on traditional payment methods. About 34% of our survey respondents are in this stage. To cater to these consumers, companies should devise strategies to increase their awareness of digital payments, and to make these methods of payment more easily accessible.
• Resistance: Consumers are resistant to the use of digital payment methods, and will only consider using them if they are forced to do so by the government. About 22% of our survey respondents are in this stage. This intentional avoidance likely stems from a fear and lack of trust towards digital channels, which can be alleviated through longer-term strategies to improve transaction security and reliability.
15-24
Figure 34: Overall attitudes and adoption of digital payments
25-34 35-49 50-64
Indifference: No preference for either traditionalor digital payment methods
Adoption: High level of comfort conducting mosttransactions without cash
Awareness (High): Tried digital payment methods,and likely to continue
Awareness (Low): Tried digital payment methods,but still prefer traditional cash
Resistance: Will only use digital payment methodsif forced to do so by the government
22%
34%
29%
6%
10%
Source: Deloitte Consumer Insights survey (2020)
Age group, years
22%
28%
30%
8%
12%
16%
36%
31%
6%
11%
22%
33%
33%
4%9%
28%
39%
18%
7%8%
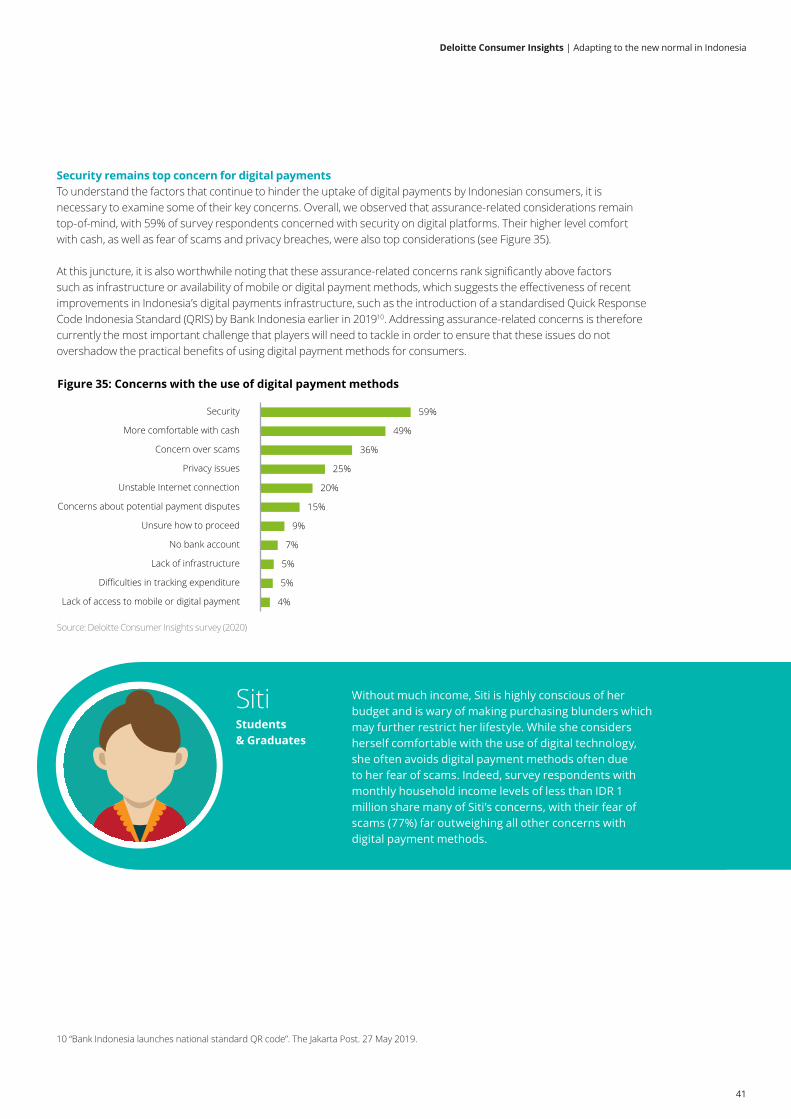
41
Deloitte Consumer Insights | Adapting to the new normal in Indonesia
Security remains top concern for digital paymentsTo understand the factors that continue to hinder the uptake of digital payments by Indonesian consumers, it is necessary to examine some of their key concerns. Overall, we observed that assurance-related considerations remain top-of-mind, with 59% of survey respondents concerned with security on digital platforms. Their higher level comfort with cash, as well as fear of scams and privacy breaches, were also top considerations (see Figure 35).
At this juncture, it is also worthwhile noting that these assurance-related concerns rank significantly above factors such as infrastructure or availability of mobile or digital payment methods, which suggests the effectiveness of recent improvements in Indonesia’s digital payments infrastructure, such as the introduction of a standardised Quick Response Code Indonesia Standard (QRIS) by Bank Indonesia earlier in 201910. Addressing assurance-related concerns is therefore currently the most important challenge that players will need to tackle in order to ensure that these issues do not overshadow the practical benefits of using digital payment methods for consumers.
Figure 35: Concerns with the use of digital payment methods
59%
49%
36%
25%
20%
15%
9%
7%
5%
5%
4%
Security
More comfortable with cash
Concern over scams
Privacy issues
Unstable Internet connection
Concerns about potential payment disputes
Unsure how to proceed
No bank account
Lack of infrastructure
Difficulties in tracking expenditure
Lack of access to mobile or digital payment
Preferredsources of information
Siti Without much income, Siti is highly conscious of her budget and is wary of making purchasing blunders which may further restrict her lifestyle. While she considers herself comfortable with the use of digital technology, she often avoids digital payment methods often due to her fear of scams. Indeed, survey respondents with monthly household income levels of less than IDR 1 million share many of Siti’s concerns, with their fear of scams (77%) far outweighing all other concerns with digital payment methods.
Students & Graduates
10 “Bank Indonesia launches national standard QR code”. The Jakarta Post. 27 May 2019.
Source: Deloitte Consumer Insights survey (2020)
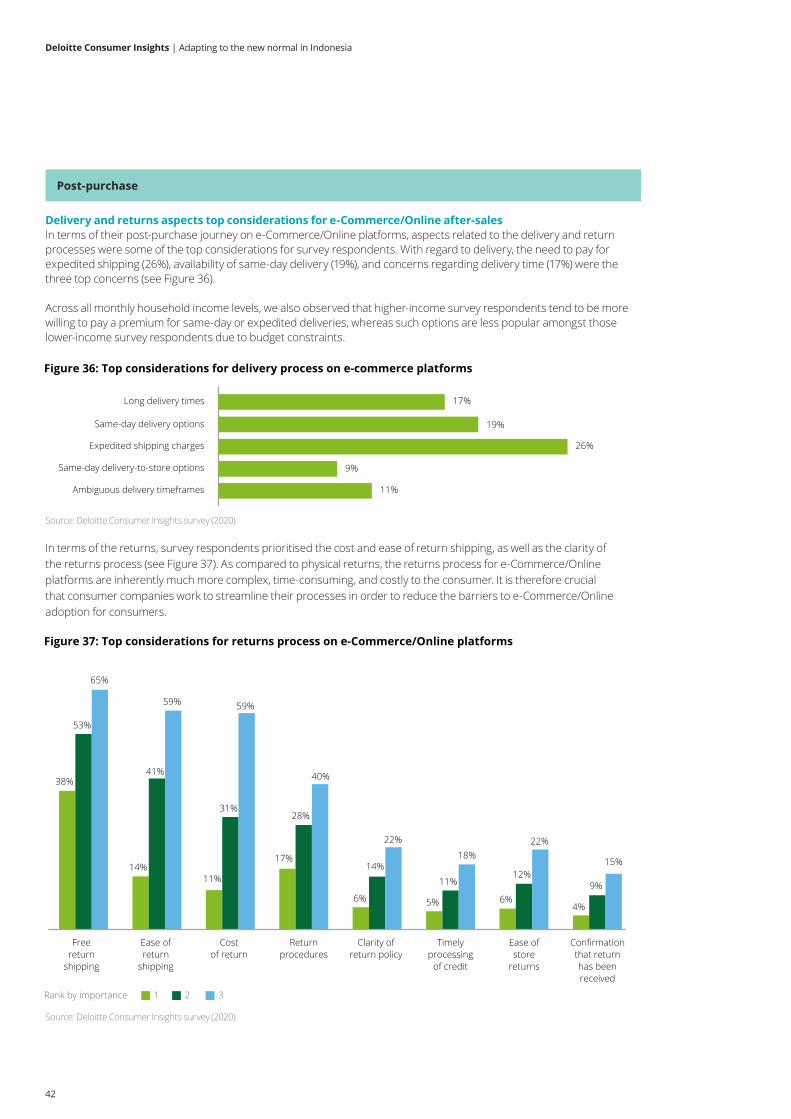
42
Deloitte Consumer Insights | Adapting to the new normal in Indonesia
Figure 36: Top considerations for delivery process on e-commerce platforms
17%
9%
Long delivery times
19%Same-day delivery options
26%Expedited shipping charges
Same-day delivery-to-store options
11%Ambiguous delivery timeframes
Figure 37: Top considerations for returns process on e-Commerce/Online platforms
38%
14%11%
17%
6% 5% 6%4%
53%
41%
31%28%
14%11%
12%9%
65%
59% 59%
40%
22%
18%22%
15%
Freereturn
shipping
Ease ofreturn
shipping
Costof return
Returnprocedures
Clarity ofreturn policy
Timelyprocessing
of credit
Ease ofstore
returns
Confirmationthat returnhas beenreceived
1 2 3Rank by importance
In terms of the returns, survey respondents prioritised the cost and ease of return shipping, as well as the clarity of the returns process (see Figure 37). As compared to physical returns, the returns process for e-Commerce/Online platforms are inherently much more complex, time-consuming, and costly to the consumer. It is therefore crucial that consumer companies work to streamline their processes in order to reduce the barriers to e-Commerce/Online adoption for consumers.
Delivery and returns aspects top considerations for e-Commerce/Online after-salesIn terms of their post-purchase journey on e-Commerce/Online platforms, aspects related to the delivery and return processes were some of the top considerations for survey respondents. With regard to delivery, the need to pay for expedited shipping (26%), availability of same-day delivery (19%), and concerns regarding delivery time (17%) were the three top concerns (see Figure 36).
Across all monthly household income levels, we also observed that higher-income survey respondents tend to be more willing to pay a premium for same-day or expedited deliveries, whereas such options are less popular amongst those lower-income survey respondents due to budget constraints.
Post-purchase
Source: Deloitte Consumer Insights survey (2020)
Source: Deloitte Consumer Insights survey (2020)
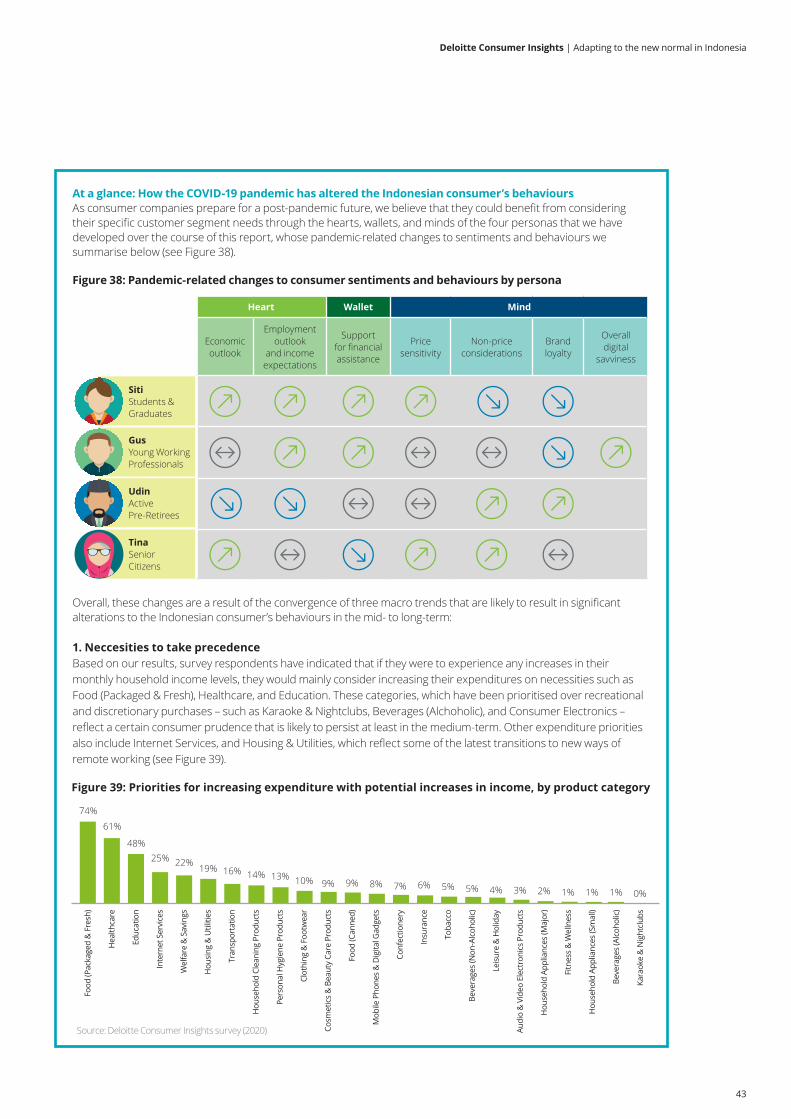
43
Deloitte Consumer Insights | Adapting to the new normal in Indonesia
At a glance: How the COVID-19 pandemic has altered the Indonesian consumer’s behavioursAs consumer companies prepare for a post-pandemic future, we believe that they could benefit from considering their specific customer segment needs through the hearts, wallets, and minds of the four personas that we have developed over the course of this report, whose pandemic-related changes to sentiments and behaviours we summarise below (see Figure 38).
Overall, these changes are a result of the convergence of three macro trends that are likely to result in significant alterations to the Indonesian consumer’s behaviours in the mid- to long-term:
Figure 38: Pandemic-related changes to consumer sentiments and behaviours by persona
1. Neccesities to take precedence Based on our results, survey respondents have indicated that if they were to experience any increases in their monthly household income levels, they would mainly consider increasing their expenditures on necessities such as Food (Packaged & Fresh), Healthcare, and Education. These categories, which have been prioritised over recreational and discretionary purchases – such as Karaoke & Nightclubs, Beverages (Alchoholic), and Consumer Electronics – reflect a certain consumer prudence that is likely to persist at least in the medium-term. Other expenditure priorities also include Internet Services, and Housing & Utilities, which reflect some of the latest transitions to new ways of remote working (see Figure 39).
Heart Wallet Mind
Economic outlook
Employment outlook
and income expectations
Support for financial assistance
Price sensitivity
Non-price considerations
Brand loyalty
Overall digital
savviness
Preferredsources of information
Goals Key concerns
Preferredsources of informationMind Set
Keypurchasingchannels
Behaviours
SitiStudents &Graduates
Gus Young Working Professionals
UdinActive Pre-Retirees
TinaSenior Citizens
Figure 39: Priorities for increasing expenditure with potential increases in income, by product category
Beve
rage
s (N
on-A
lcoh
olic
)
Hea
lthca
re
Food
(Pac
kage
d &
Fre
sh)
Educ
atio
n
Inte
rnet
Ser
vice
s
Wel
fare
& S
avin
gs
Hou
seho
ld A
pplia
nces
(Sm
all)
Hou
sing
& U
tiliti
es
Tran
spor
tatio
n
Hou
seho
ld C
lean
ing
Prod
ucts
Pers
onal
Hyg
iene
Pro
duct
s
Clot
hing
& F
ootw
ear
Cosm
etic
s &
Bea
uty
Care
Pro
duct
s
Food
(Can
ned)
Mob
ile P
hone
s &
Dig
ital G
adge
ts
Leis
ure
& H
olid
ay
Insu
ranc
e
Conf
ectio
nery
Toba
cco
Audi
o &
Vid
eo E
lect
roni
cs P
rodu
cts
Hou
seho
ld A
pplia
nces
(Maj
or)
Fitn
ess
& W
elln
ess
Beve
rage
s (A
lcoh
olic
)
Kara
oke
& N
ight
club
s
74%
61%
48%25% 22% 19% 16% 14% 13% 10% 9% 9% 8% 7% 6% 5% 5% 4% 3% 2% 1% 1% 1% 0%
Source: Deloitte Consumer Insights survey (2020)
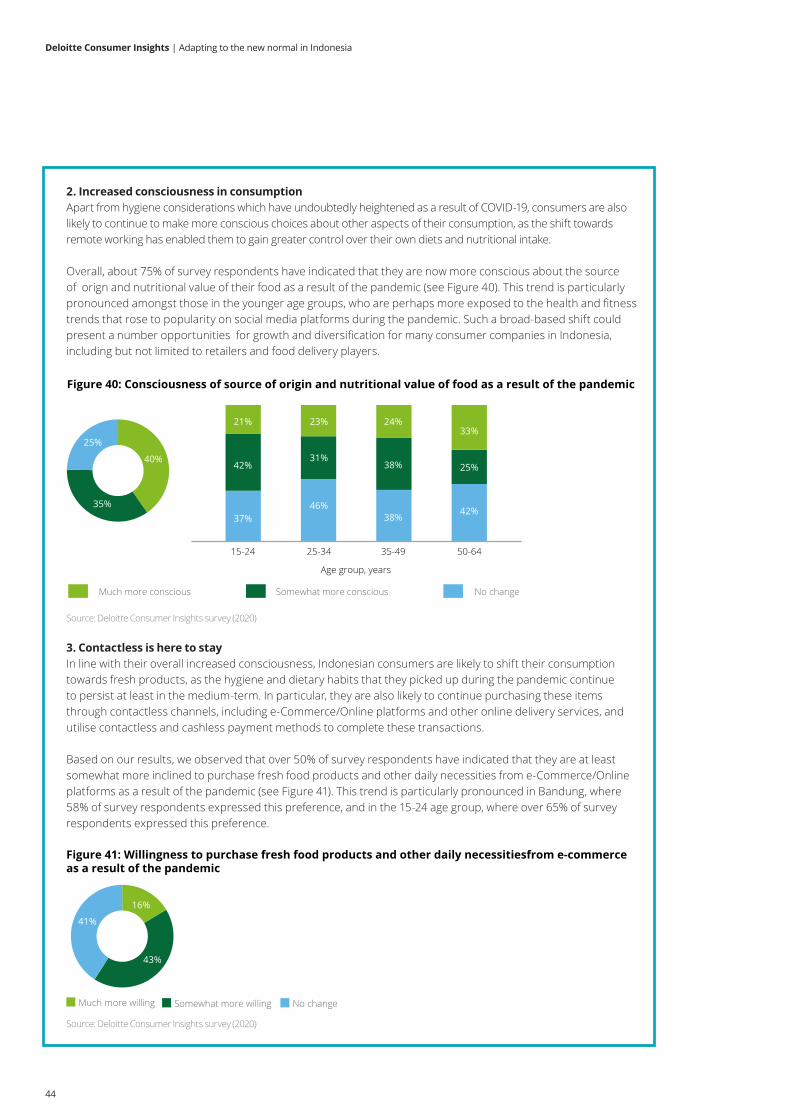
44
Deloitte Consumer Insights | Adapting to the new normal in Indonesia
2. Increased consciousness in consumption Apart from hygiene considerations which have undoubtedly heightened as a result of COVID-19, consumers are also likely to continue to make more conscious choices about other aspects of their consumption, as the shift towards remote working has enabled them to gain greater control over their own diets and nutritional intake. Overall, about 75% of survey respondents have indicated that they are now more conscious about the source of orign and nutritional value of their food as a result of the pandemic (see Figure 40). This trend is particularly pronounced amongst those in the younger age groups, who are perhaps more exposed to the health and fitness trends that rose to popularity on social media platforms during the pandemic. Such a broad-based shift could present a number opportunities for growth and diversification for many consumer companies in Indonesia, including but not limited to retailers and food delivery players.
Figure 40: Consciousness of source of origin and nutritional value of food as a result of the pandemic
-
Much more conscious Somewhat more conscious No change
15-24 25-34 35-49 50-64
40%
35%
25%
37%
42%
21%
46%
31%
23%
38%
38%
24%
42%
25%
33%
Age group, years
3. Contactless is here to stay In line with their overall increased consciousness, Indonesian consumers are likely to shift their consumption towards fresh products, as the hygiene and dietary habits that they picked up during the pandemic continue to persist at least in the medium-term. In particular, they are also likely to continue purchasing these items through contactless channels, including e-Commerce/Online platforms and other online delivery services, and utilise contactless and cashless payment methods to complete these transactions. Based on our results, we observed that over 50% of survey respondents have indicated that they are at least somewhat more inclined to purchase fresh food products and other daily necessities from e-Commerce/Online platforms as a result of the pandemic (see Figure 41). This trend is particularly pronounced in Bandung, where 58% of survey respondents expressed this preference, and in the 15-24 age group, where over 65% of survey respondents expressed this preference.
Figure 41: Willingness to purchase fresh food products and other daily necessitiesfrom e-commerce platformsas a result of the pandemic
16%
43%
41%
Much more willing Somewhat more willing No change
Source: Deloitte Consumer Insights survey (2020)
Source: Deloitte Consumer Insights survey (2020)
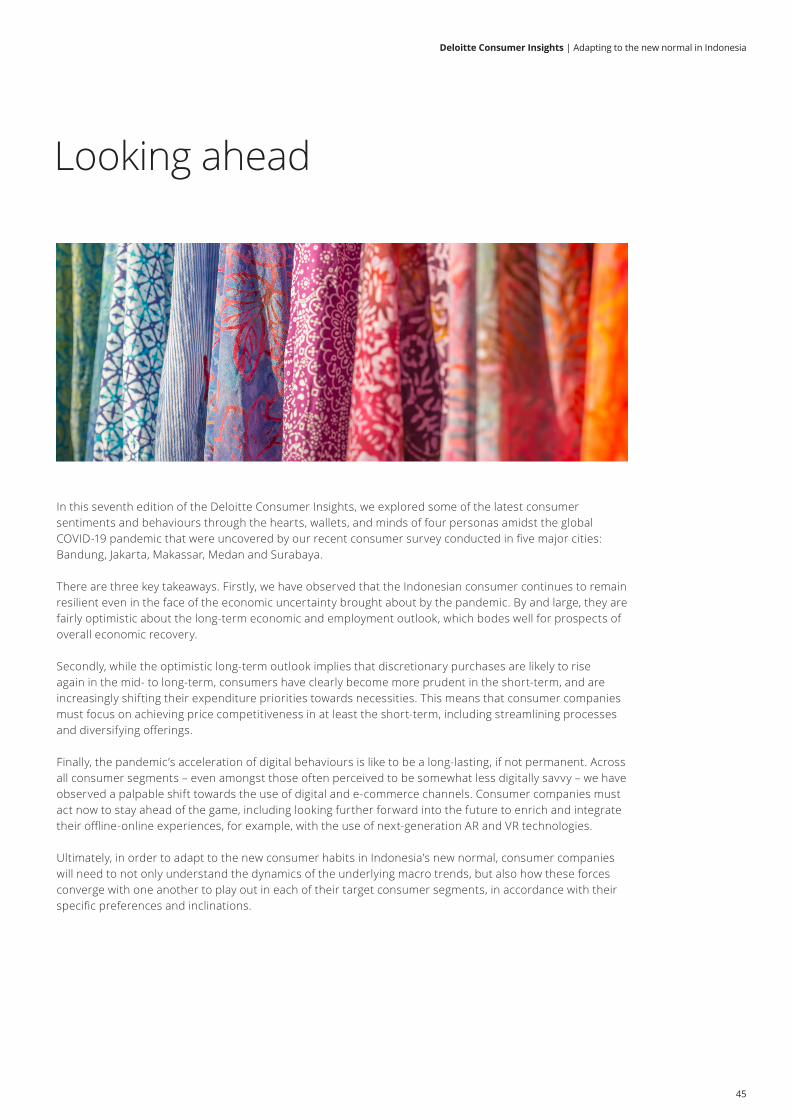
45
Deloitte Consumer Insights | Adapting to the new normal in Indonesia
In this seventh edition of the Deloitte Consumer Insights, we explored some of the latest consumer sentiments and behaviours through the hearts, wallets, and minds of four personas amidst the global COVID-19 pandemic that were uncovered by our recent consumer survey conducted in five major cities: Bandung, Jakarta, Makassar, Medan and Surabaya.
There are three key takeaways. Firstly, we have observed that the Indonesian consumer continues to remain resilient even in the face of the economic uncertainty brought about by the pandemic. By and large, they are fairly optimistic about the long-term economic and employment outlook, which bodes well for prospects of overall economic recovery.
Secondly, while the optimistic long-term outlook implies that discretionary purchases are likely to rise again in the mid- to long-term, consumers have clearly become more prudent in the short-term, and are increasingly shifting their expenditure priorities towards necessities. This means that consumer companies must focus on achieving price competitiveness in at least the short-term, including streamlining processes and diversifying offerings.
Finally, the pandemic’s acceleration of digital behaviours is like to be a long-lasting, if not permanent. Across all consumer segments – even amongst those often perceived to be somewhat less digitally savvy – we have observed a palpable shift towards the use of digital and e-commerce channels. Consumer companies must act now to stay ahead of the game, including looking further forward into the future to enrich and integrate their offline-online experiences, for example, with the use of next-generation AR and VR technologies.
Ultimately, in order to adapt to the new consumer habits in Indonesia’s new normal, consumer companies will need to not only understand the dynamics of the underlying macro trends, but also how these forces converge with one another to play out in each of their target consumer segments, in accordance with their specific preferences and inclinations.
Looking ahead
Contact us
Southeast Asia Consumer industry practice
Southeast Asia and Singapore Pua Wee Meng [email protected]+65 6232 7244
BruneiNg Hui [email protected]+673 222 5880
CambodiaKimleng [email protected]+855 2396 3788
GuamMike [email protected]+1 671 646 3884
IndonesiaMaria [email protected]+62 21 5081 9300
MalaysiaPua Wee Meng [email protected]+65 623 2 7244
MyanmarAye [email protected]+65 6800 2255
Lao PDRChoopong [email protected]+66 2034 0114
PhilippinesMelissa [email protected]+63 2 581 9000
ThailandManoon [email protected]+66 2034 0123
VietnamNguyen Vu [email protected]+84 4 6288 3568
Researched and written by
Pua Wee Meng Executive Director, Consulting [email protected]+65 6232 7244
Tushar Milind OkaSenior Manager, [email protected]+60 111 426 9814

Deloitte refers to one or more of Deloitte Touche Tohmatsu Limited (“DTTL”), its global network of member firms, and their related entities (collectively, the “Deloitte organization”). DTTL (also referred to as “Deloitte Global”) and each of its member firms and related entities are legally separate and independent entities, which cannot obligate or bind each other in respect of third parties. DTTL and each DTTL member firm and related entity is liable only for its own acts and omissions, and not those of each other. DTTL does not provide services to clients. Please see www.deloitte.com/about to learn more.
Deloitte Asia Pacific Limited is a company limited by guarantee and a member firm of DTTL. Members of Deloitte Asia Pacific Limited and their related entities, each of which are separate and independent legal entities, provide services from more than 100 cities across the region, including Auckland, Bangkok, Beijing, Hanoi, Hong Kong, Jakarta, Kuala Lumpur, Manila, Melbourne, Osaka, Seoul, Shanghai, Singapore, Sydney, Taipei and Tokyo.
This communication contains general information only, and none of Deloitte Touche Tohmatsu Limited (“DTTL”), its global network of member firms or their related entities (collectively, the “Deloitte organization”) is, by means of this communication, rendering professional advice or services. Before making any decision or taking any action that may affect your finances or your business, you should consult a qualified professional adviser.
No representations, warranties or undertakings (express or implied) are given as to the accuracy or completeness of the information in this communication, and none of DTTL, its member firms, related entities, employees or agents shall be liable or responsible for any loss or damage whatsoever arising directly or indirectly in connection with any person relying on this communication. DTTL and each of its member firms, and their related entities, are legally separate and independent entities. © 2021 Deloitte Southeast Asia Ltd
For information, contact Deloitte SEA. CoRe Creative Services. RITM0646018