deliverable 5.3: industrial roi, assessment, and feedback · modelware – 511731 – d5.3...
TRANSCRIPT

MODELWARE – 511731 – D5.3 Industrial ROI, Assessment, and Feedback – Revision 2.1 date: 11/09/06
Page 1 of 23
FP6-IP 511731
MODELWARE MODELling solution for
softWARE systems
Deliverable 5.3: Industrial
ROI, Assessment,
and Feedback
Due date of deliverable: 30/08/06
Actual submission date: 30/08/06
Start date of project: 01/08/2004 Duration: 24 months
Organisation name of lead contractor for this deliverable: IBM-HRL
Revision: 2.1
Dissemination level:
PU Public
PP Restricted to other programme participants (including the Commission Services)
RE Restricted to a group specified by the consortium (including the Commission Services)
CO Confidential, only for members of the consortium (including the Commission Services)
Project co-funded by the European Commission under the “Information Society Technologies” Sixth Framework Programme (2002-2006)

MODELWARE – 511731 – D5.3 Industrial ROI, Assessment, and Feedback – Revision 2.1 date: 11/09/06
Page 2 of 23
Rev. Date
(dd/mm/yy) Author Checked by
Internal approval
Commission approval
Description
1.0 7/09/06 Yael Dubinsky,
Alan Hartman,
Mila Keren
First Draft
2.0 10/09/06 Yael Dubinsky,
Alan Hartman,
Mila Keren
Incorporating TATM figures and Enabler Development study
2.1 11/09/06 Yael Dubinsky,
Alan Hartman,
Mila Keren
Updating Introduction, conclusions, references
2.1 13/09/06 Regis Vogel
Correction in –Enabler part

MODELWARE – 511731 – D5.3 Industrial ROI, Assessment, and Feedback – Revision 2.1 date: 11/09/06
Page 3 of 23
Table of contents
Table of contents ...................................................................................................................... 3
Tables list .................................................................................................................................. 4
Figures list ................................................................................................................................. 4
1. Introduction .................................................................................................................. 5
1.1. Acronyms and Terminology .................................................................................................... 6
2. MODELWARE Project and the Industrial Work Package Overview ................... 7
3. Research Settings ......................................................................................................... 9
3.1. Research Hypotheses and Methods ......................................................................................... 9
3.2. Experiment Team Background and Baseline Establishment Process ............................... 11
3.2.1. WM-Data (former Aprote) ....................................................................................................... 11 3.2.2. Enabler ................................................................................................................................... 11 3.2.3. France Telecom ..................................................................................................................... 11 3.2.4. Western Geco (WGO) ............................................................................................................ 12 3.2.5. Thales Air Traffic Management (TATM) ................................................................................. 13
4. Experiment Results and Data Analysis .................................................................... 14
4.1. System Engineering Perspective ............................................................................................ 14
4.2. Development Perspective – Design and Implementation .................................................... 15
4.3. Maintenance Perspective........................................................................................................ 17
4.4. Attitudes to MDD .................................................................................................................... 20
4.5. Working with MODELWARE Tools .................................................................................... 20
4.6. MODELWARE Training ....................................................................................................... 21
5. Conclusion ................................................................................................................... 22
References ............................................................................................................................... 23

MODELWARE – 511731 – D5.3 Industrial ROI, Assessment, and Feedback – Revision 2.1 date: 11/09/06
Page 4 of 23
Tables list
Table 1: Research hypotheses of two teams 9
Table 2: Research methods of two teams 10
Table 3: Estimates of productivity increases using MDD in the development of an air traffic management system. 14
Table 4: Time in hours to complete two design and implementation tasks by subjects who completed both tasks 15
Table 5: Paired samples statistics 15
Table 6: Time in hours to perform design and implementation of a module using traditional and MDD approaches 16
Table 7: Time in hours to add functionality to a module using traditional and MDD approaches 16
Table 8: Time spent on a large development task using traditional and MDD methods. 16
Table 9: Time taken to perform a maintenance task using the traditional approach 17
Table 10: Task achievement on a maintenance task using the traditional approach 17
Table 11: Time taken to perform a maintenance task using the MDD approach. 18
Table 12: Task achievement on a maintenance task using the MDD approach 18
Table 13: Effort spent on requirement changing activities 19
Table 14: Average effort spent by specific type of development activity 19
Table 15: Attitudes to MDD 20
Figures list
Figure 1: Organization of industrial teams in the MODELWARE project 7

MODELWARE – 511731 – D5.3 Industrial ROI, Assessment, and Feedback – Revision 2.1 date: 11/09/06
Page 5 of 23
1. Introduction
Model centric development has evolved in the last decade as a software engineering process that aims at dealing with the high complexity of software development. This technology as part of Model Driven Development (MDD) focuses on modelling as the main activity that enables the automatic generation of artefacts like code, configuration files, and tests; and the efficient implementation of changes in requirements.
The adoption of MDD in industry raises many questions including: Which parts of the existing process should be changed? Which program of training to follow? Which MDD tools to use? How to measure an MDD maturity level? How to measure the effect of MDD on productivity?
Modelling is a well developed strategy for dealing with complexity in many engineering fields. It has been less frequently applied in the domain of software engineering. A high quality software system can be developed and maintained with little or no modelling. We refer to this as the traditional approach and compare it with the MDD approach in order to investigate the effect of using models on software productivity.
An example of when we expect to benefit from implementing MDD is in the generation of large portions of the code, thus reducing the number of defects inserted manually by programmers of different experience levels. The test process is also expected to benefit from MDD. Using the traditional approach, software quality is ensured by preparing test plans, developing unit and functional tests, and updating these whenever requirements, design, or interfaces change. The maintenance of test suites is an expensive and error-prone task. The MDD approach treats test cases as artefacts that are automatically generated from models, thus ensuring higher quality and greater resilience to change.
Another example is in the maintenance of traceability among the various software development artefacts. Using the traditional approach, traceability links are created and maintained by manual processes involving both formal and informal communication between engineers. The MDD approach automates the work of creating traceability links when model transformations are used to derive artefacts from model elements. The maintenance of traceability links in MDD can also be partially automated by the use of appropriate traceability models.
In the famous survey of Boehm [ 1], 63 software development projects in large scale corporations were examined. It was found that when dealing with a change request, if the cost ratio at the requirements phase is 1, then the cost ratio at the maintenance phase is between 40 and 1000 (known as the Boehm Curve). Even though this survey is from 1981, it is still relevant. The software industry is still searching for innovative ways to flatten the curve by changing the process of software development [ 16] or, as in MODELWARE, by introducing modelling to the process activities.
The effort expended in modelling may increase the time spent in the design phase, however software productivity is expected to improve with the adoption of MDD. This expectation stems from the fact that MDD deals with some of the main problems that occur when using the traditional approach for software development. In [ 20] the authors implemented MDD tools for the development of a module within a distributed real-time embedded system at Lockheed Martin. An increase in productivity is assumed but not measured. In [ 2, 17, 18] software productivity was measured when using MDD; but the validity of these studies is questionable since they were carried out by the vendors of MDD tools. Studies that were conducted at Motorola show productivity increase when adopting a specific modelling activity, like modelling project knowledge [ 22] or

MODELWARE – 511731 – D5.3 Industrial ROI, Assessment, and Feedback – Revision 2.1 date: 11/09/06
Page 6 of 23
modelling testing [ 21]. The aim of this study is to provide a range of experimental evidence from unbiased sources in real industrial settings that adopt modelling for the entire development process.
In this document we report results on the effect on software productivity of using MDD. This work is part of a comprehensive research and development project named MODELWARE that develops and fosters MDD research, processes, tools, and technology adoption strategies.
This document contains a brief presentation of the industrial MDD work package of the MODELWARE project in Section 2. In Section 3 we describe the research setting and the baseline establishment process for each of the companies involved. In Section 4 we provide the data analysis, and conclude in Section 5. More details on each of the experiments may be found in the accompanying documents written by the five industrial teams.
1.1. Acronyms and Terminology
ATM Air Traffic Management
BI Business Integration
ECR Engineering Change Request
GUI Graphical User Interface
IBM-HRL IBM Haifa Research Laboratory
JDBC Java Database Connectivity
LSDS Large Scale Distributed Systems
MDAC Model Driven Architecture Component
MDD Model Driven Development
MDSysE Model Driven System Engineering
MS SQL Microsoft Structured Query Language
PCR Problem Change Request
ROI Return On Investment
RUP Rational Unified Process
SME Small and Medium Enterprise
TATM Thales Air Traffic Management
TRT Thales Research and Technology
WGO Western Geco
WP Work Package

MODELWARE – 511731 – D5.3 Industrial ROI, Assessment, and Feedback – Revision 2.1 date: 11/09/06
Page 7 of 23
2. MODELWARE Project and the Industrial Work Package Overview The main goals of the MODELWARE project are to develop MDD processes and tools, and promote their adoption in the software industry to achieve an increase in software productivity. MODELWARE provides a framework that enables and supports modelling throughout the software development process. This framework automates the production of many software artifacts (tests, documentation, code, etc.) from models and allows better capitalization of the organization’s knowledge.
The objective of the industrial MDD work package is to provide industrial validation of the global approaches developed in the three work packages that deal with modelling technologies, process and methodologies, and tools infrastructure. This validation is performed in five separate teams, as shown in Figure 1, representing different application domains, levels of MDD maturity, and company sizes. Each team involves one industrial partner and one or more academic partners.
The retail industry team comprises Enabler and IBM-UK; the small and medium enterprise (SME) team comprises WM-Data, imbus and IBM-HRL; the voice based systems team comprises France Telecom and IBM-HRL; the data centric systems team comprises Western Geco (WGO) and Sintef; and the safety critical systems team comprises Thales Air Traffic Management (TATM), Thales Research and Technology, and the Universidad Politecnica de Madrid.
WP5Industrial MDD
BusinessIntegrationWP 5A: BI
Large ScaleDistributed Systems
WP 5B: LSDS
BIRetail
Industry
BISMEs
BIVoice Based
Systems
LSDSData Centric
Systems
LSDSSafety Critical
Systems
Figure 1: Organization of industrial teams in the MODELWARE project
All five teams followed a similar process at the highest level of abstraction. This process involved the following steps: Defining an industrial scenario for software or systems development. Describing their current development process. Measuring a baseline level of productivity. Deriving requirements from an MDD process and tooling for their scenario. Customizing the tools and processes from the other work packages to their specific industry domain. Training their engineers in the MDD processes and tools. Performing the predefined scenarios using MDD processes and tools and measuring the effect on productivity.
We define software productivity as the amount of work done divided by the effort needed to produce it. In order to provide real-world field evidence, we measure in strictly controlled experimental environments, and also in the less controlled environment of a real production floor.

MODELWARE – 511731 – D5.3 Industrial ROI, Assessment, and Feedback – Revision 2.1 date: 11/09/06
Page 8 of 23
The risks entailed in conducting industrial scale research are that it can also be discredited on the grounds of lack of control, lack of a statistical significance, and lack of objectivity. Using the resources of the MODELWARE project, we use as research approaches, both controlled experiments and industrial measurements, with the aim of achieving credibility for our results.
Due to the different industrial contexts it is difficult to have a uniform research approach, and each team has created its own method of exploring productivity change. The nature of business integration (BI) projects is completely different from large scale distributed systems (LSDS), and even within the LSDS stream, there is a huge difference between the methodologies and processes used by the two teams. Two of the BI partners are small enterprises, whereas the other three industrial team leaders are large companies.

MODELWARE – 511731 – D5.3 Industrial ROI, Assessment, and Feedback – Revision 2.1 date: 11/09/06
Page 9 of 23
3. Research Settings
In this section we describe the research setting used to investigate the effect of MDD on software productivity when compared to the traditional approach. We specify the research hypotheses and research methods, and also describe the baseline establishment process for each of the companies.
3.1. Research Hypotheses and Methods
The research hypotheses were defined by the different teams. Table 1 shows examples of the definitions of two teams (without editing) and the different emphases adopted.
Research Hypotheses - Enabler
H1: Components developed with MDD reveal higher performance (in software development and maintenance) than components developed using traditional methods.
H2: The tools’ maturity will moderate the effect of MDD adoption on the software development performance.
H3: The perceived value of MDD moderates the effect of MDD adoption on the software development performance.
Research Hypotheses - WGO
H1: Modules developed with MDD will reveal higher productivity than modules developed with traditional methods.
H2: The perceived usefulness of MDD will moderate the effect of MDD infusion on productivity.
H3: The perceived ease of using MDD will moderate the effect of MDD infusion on productivity.
H4: The perceived compatibility of using MDD will moderate the effect of MDD infusion on productivity.
H5: The joint contribution of the three variables of the perceived attributes of using MDD will explain a large amount of the variance in future use intentions.
Table 1: Research hypotheses of two teams
In addition to the research hypotheses, it is also important to understand the adoption process of MDD. How it influences the organization, the team and the individual. Which organizational changes are introduced by the technology changes, and how these organizational changes are implemented.
Different research methods were used by the teams. Table 2 shows the research methods of the same two teams (without editing) illustrating the different perspectives we gain from this study. Both

MODELWARE – 511731 – D5.3 Industrial ROI, Assessment, and Feedback – Revision 2.1 date: 11/09/06
Page 10 of 23
quantitative and qualitative research approaches were taken. In this study these two approaches are complementary and provide a comprehensive framework to analyze the outcomes.
Research Methods - Enabler
Scientific Research: Research techniques and methodologies proven to produce scientifically and statistically valid results minimizing deviation within a controlled or semi-controlled environment.
Interpretative Research: Research techniques aimed at producing an understanding of the context of the information system, focused on understanding the organizational changes introduced by technology changes.
Industrial Experience: Industrial experience of the researchers will introduce industrial concerns in this study. Examples of such concerns include the human complexity factor associated with organizational changes, being technical or of other nature.
Research Methods - WGO
The research design of this study is a field experiment with a pretest-posttest control group crossover design. The design can be represented as:
R O1 XA O2 XB O3
R O1 XB O2 XA O3
where O refers to a measurement of the dependent variable and X represents the exposure of the test groups to the experimental treatment (independent variable). The preceding Rs indicate random assignment to treatments [ 19]. We will also seek random assignment of modules to developers and random assignment of order of method to developers.
The intended treatments are:
XA Use of model-driven development
XB Use of traditional development method
The design contains two orthogonal classifications: treatment and sequence group, each with two levels. The two treatment levels are: “XA” (MDD) and “XB” (traditional development), while the sequence groups are: “XA then XB” and “XB then XA”.
Table 2: Research methods of two teams
In general, the validity of the entire study is ensured by using several resources (five different industrial settings), different research methods and different methods for data analysis. Further, thirty two (32) participants who are software practitioners with different background and culture are involved in this research. Finally, in order to increase the reliability of the research, the data is analyzed by different teams.

MODELWARE – 511731 – D5.3 Industrial ROI, Assessment, and Feedback – Revision 2.1 date: 11/09/06
Page 11 of 23
3.2. Experiment Team Background and Baseline Establishment Process
3.2.1. WM-Data (former Aprote)
Before ModelWare, WM-DATA (former Aprote) employed a code-centric process that is typical of a small company developing desktop business applications. The main characteristics of their traditional development process were [ 3]: No models or CASE tools were used. Most documents, including requirements and design, were managed as Word documents. These
documents were not always up-to-date. Engineers involved in different phases of development used a variety of incompatible tools and
methods.
The applications under development are typical business applications managing data repositories through user interface activities (GUI). It has a client/server architecture, works on Windows and Linux platforms, is developed in Java (Swing, JDBC) and currently supports the Adabas and MS SQL Server as database engines.
In the baseline scenario, several requirements were selected from the list of maintenance tasks as requests for updates or new features to be added to the application.
3.2.2. Enabler
Enabler is a specialist in the creation and integration of IT solutions for retailers. Enabler offers complete solutions to retailers that combine best-of-breed technologies with an enterprise-wide approach, such as: support business processes; manage implementation of end-to-end solutions; install and deploy application software; integrate legacy systems and third party applications. This software development/integration domain is characterized by short lifecycles, rapidly changing requirements and heterogeneous implementation platforms. The project management task is to guarantee the project planning, management and control and to meet the required quality standards (ISO9001:2000).
The objective for Enabler when defining the MDD process was adapting the existing development process to the use of MDD tools, techniques and roles. They used the MDD process framework to express the waterfall methodology in place, using models as the main artefacts, and generated documentation/code as an output of the process.
The project used in the baseline scenario was the Pricing Framework application [ 4]. This was an ongoing project that follows Enabler’s Solution Integration methodology. The application was analysed to determine the most appropriate functionalities for the MODELWARE experiment. An important criterion considered in the selection process was the potential ROI of using MDD methodologies and tools to produce (analyse, design, develop, test, etc.) each functionality. The Pricing Framework project is extremely complex and of long duration. As such, it has been decided to focus on User maintenance module that can have a high reusability in the product line.
3.2.3. France Telecom
The MDD application scenario that France Telecom experimented with in the MODELWARE project, can be divided into two aspects: Building an environment for the development of voice interactive applications, using MDD
techniques

MODELWARE – 511731 – D5.3 Industrial ROI, Assessment, and Feedback – Revision 2.1 date: 11/09/06
Page 12 of 23
Developing a specific voice-based service using the environment. This activity embraces all life-cycle phases, with a special focus on linking the design, simulation, and testing phases.
Since the advent of the W3C's VoiceXML standard, the typical architecture for realizing interactive voice-based applications is a multi-tier schema—similar to any Web-based application. This architecture defines a separation between the voice machine that processes all the specific voice treatment (such as text-to-speech, recognition of speech), and the application server, which is aware of all the business logic.
In the baseline scenario described in [ 5] a service is developed that offers voice-activated access to the user's address book. The main functionalities of this service are: Ability to consult the contents of the address book Ability to ask to call someone on the basis of a "name" pronounced by the user (identify
contact) Ability to add entries in the address book
This voice service has already been developed in France Telecom using a traditional approach, and thus served as the baseline to measure the added value of MDD. For each functional unit, they measure the time spent by the designer (in hours, one person per functionality) and the complexity of the state machine describing the interaction logic (see FRANCE TELECOM report [ 9]).
3.2.4. Western Geco (WGO)
WesternGeco works in the area of Oil and Gas Exploration, offering advanced seismic services to oil and gas companies. Their technology covers the range from high-speed embedded sensor networks to advanced instrument control and data processing on super-computers. The systems are characterized by being highly distributed and data-intensive. The following processes and tools are in use currently: The Rational Unified Process (RUP) customized for more agile development is used for
software projects. UML is used for use-cases and design modelling and documentation.
o Together Architect is the default UML modeling and code generation tool. o CaliberRM has been used for requirements on a few systems.
For the baseline scenario [ 7], they apply an MDD process framework to the base software development processes of the organization. This MDD process framework, provided from the MODELWARE project, define MDD-specific process roles, work products, and activities.
For the experiments, only a subset of a complete MDD process was used. The final experiment consisted of four different tasks that were to be carried out by the test subjects: Developing a component of a system using Java sockets for communication. A framework
abstracting away from the details of sockets was available for use. Developing adding persistence to the system using Hibernate. Developing a solution using Java Messaging Server. Developing an interface to a database using Hibernate.
To ensure statistical validity there were 20 developers developing both modules in the cross-over design, thus providing 20 observations for each design alternative. Furthermore, they repeated the experiment twice, i.e., once the experiment was performed within a development setting and twice within a maintenance setting.

MODELWARE – 511731 – D5.3 Industrial ROI, Assessment, and Feedback – Revision 2.1 date: 11/09/06
Page 13 of 23
3.2.5. Thales Air Traffic Management (TATM)
TATM maintains air traffic management systems produced from a product line called EUROCAT. These systems are made up of three main parts: a flight data processing system, a man machine interface and various surveillance systems. The EUROCAT product line builds an initial set of major capabilities and then the enhancements are done to add capabilities to this set, until it covers the full line of ATM capabilities requested by each customer.
Within the product baseline, the new capabilities requested by a customer are developed through an Engineering Change Request (ECR) process. User requirements are detailed in an ECR, which is managed as an independent development project. At the end of the project, the new documentation consists of the product line documentation upgraded with the requested ECRs. The links between documents describing the different phases (e.g. specification, design) are issued with requirements management tools. A traceability tool is used to verify the coverage of the added requirements and their validation. Safety analysis is done manually in parallel with the software development and may result in some rework if safety requirements are not fulfilled.
A selected set of capabilities were used for the WP5 ATM MODELWARE experiment whose baseline scenario is described in [ 6]. During the experiment, different measures were taken and compared to the efforts of the current EUROCAT product line (from 1999). These measurements are related to PCRs (Problem Change Requests) that were detected through integration activities for each ECR.

MODELWARE – 511731 – D5.3 Industrial ROI, Assessment, and Feedback – Revision 2.1 date: 11/09/06
Page 14 of 23
4. Experiment Results and Data Analysis
This section contains data analysis that is supported by comparative data between baseline and experimental results. The five industrial cases cannot be all aligned; therefore, each data set that is presented in the sequel describes an outcome from one specific industrial setting. We are not able to generalize from one case to another or draw conclusions from any specific case. We discuss the various results as different aspects of the study, each with its own value and lessons to be learnt.
In what follows, we present one case (TATM) in which system and safety engineering were examined, three cases (WGO, Enabler and France Telecom) of actual development studies, and two cases of a maintenance study (Enabler and WM-Data) - all are illustrated with their comparative data and analysis. All the cases are presented in a summarized form. The detailed documentation can be found in [ 8- 12]. We also provide data dealing with the attitudes of participants to MDD, the MDD tools, and the training program.
4.1. System Engineering Perspective
Requirement analysis is an important phase of system engineering. The purpose of this phase is to capture and understand the requirements, analyze them, and provide an overview of the architecture and high-level design. Safety engineering involves the annotation of the architecture overview with safety aspects.
Adopting the MODELWARE approach (TATM case study), an increase of 20% in the effort was observed during system engineering. This effort, however, is compensated by estimations of the productivity gains in future development phases. The estimates, given below in Table 3, represent conservative estimates based on observed rework activity in the baseline case that will be eliminated in the MDD development process. The actual development was not performed in the context of the MODELWARE project. This was due to the long development cycle of air traffic management systems which extends beyond the lifetime of a two year project.
Lower bound Upper bound
Interfaces management productivity increase 60% 80%
Interfaces management ratio in the overall system development effort 10% 30%
Global productivity increase due to interfaces management 6% 24%
System Engineering productivity reduction 20% 30%
System Engineering ratio in the overall system development effort 15% 25%Global productivity reduction due to MDD 3% 8% Net ROI From experiments. 3% 17% Estimated productivity increase in other activities 10% 20%Activities ratio in the overall system development effort 20% 40%Possible additional ROI 2% 8% Achievable ROI for system engineering 5% 25%
Table 3: Estimates of productivity increases using MDD in the development of an air traffic management system.

MODELWARE – 511731 – D5.3 Industrial ROI, Assessment, and Feedback – Revision 2.1 date: 11/09/06
Page 15 of 23
4.2. Development Perspective – Design and Implementation
Case 1 (WGO):
In this case the time to complete design and implementation tasks using traditional and MDD approaches was measured. Some participants in the study did not complete all of the tasks. One reason for this was the maturity level of the MODELWARE MDD tools.
For further analysis only participants who completed the tasks using both traditional and MDD methods were taken into account (see Table 4). Analyzing the data (in Table 5) we can see that the mean value for MDD and traditional approaches are extremely close, but that the standard deviation is large for both cases, meaning that the productivity is close to the same using each of the approaches. Investigating the significance level of the observations, we can say with a high degree of certainty (P= 0,996, matched paired T-test), that the result of the experiment gives no evidence to reject the hypothesis that there is no difference between the traditional and the MDD approaches.
Candidate Ex1_trad Ex1_mdd Ex3_trad Ex3_mdd Trad MDD
1 2,75 0,83 2,75 0,835 1,75 0,33 1,75 0,338 1,50 0,42 1,50 0,42
15 1,42 0,25 0,25 1,4217 1,00 0,67 0,67 1,0018 2,77 1,07 1,07 2,7722 0,75 0,83 0,83 0,7523 2,42 1,10 1,10 2,42
Table 4: Time in hours to complete two design and implementation tasks by subjects who completed both tasks
Mean N Std. Deviation Std. Error
Mean Pair 1 Trad 1,2400 8 ,76806 ,27155 MDD 1,2425 8 ,90490 ,31993
Table 5: Paired samples statistics
Case 2 (France Telecom):
In this case study, the effort required to specify, implement, and change a functional module was measured for 5 different functional units, and normalized by the weight of their complexity (for more details on the measure of complexity see [ 5]). Correction factors were applied in order to compensate for the fact that the MDD experiment had the advantage of reusing the analysis that was already done in the baseline experiment and also, in order to compensate for the time spent when encountering bugs in the MODELWARE tool chain. In the first case, a corrective factor of +30% to the design effort measure for the MDD experiment was estimated by focusing on evaluating the cost for formalizing a solution rather than on finding the solution itself. In the second case, a corrective factor of -10% to the implementation effort for the MDD experiment was estimated by keeping track of the time lost because of errors that are due to deficiencies in the MDD environment. Table 6 shows the computed times for design and implementation.

MODELWARE – 511731 – D5.3 Industrial ROI, Assessment, and Feedback – Revision 2.1 date: 11/09/06
Page 16 of 23
First Implementation Traditional experiment
MDD experiment (Incl. corrective factors)
Productivity gain
Design Effort 7,44 5,92 +20 %
Implementation Effort 12,6 3,9 +69 %
Table 6: Time in hours to perform design and implementation of a module using traditional and MDD approaches
A specific module was also enriched with an additional functionality. This addition was done in both the baseline application and in the MDD application by the same person. Table 7 shows the data measured.
Adding functionality Traditional MDD Productivity gain
Design Effort 4,6 3,3 +28 %
Implementation Effort 10 2,5 +75 %
Table 7: Time in hours to add functionality to a module using traditional and MDD approaches
As shown in Table 6 and Table 7, the productivity gain is high and this is explained by the fact that most of the code was generated automatically from the model. As observed in the system engineering study, high levels of automation in the implementation amply compensate for any additional effort invested in the design activity.
Case 3 (Enabler):
The Enabler team performed a development study using a module of the pricing framework application. The module was developed twice over a period of approximately 300 hours. The results show an overall loss in productivity of 27%. When discounting the problems with the use of immature tools. the loss in productivity was of 10%. Due to the design of the study only 2 persons with no cros over this value is not representative. .
Tasks T T/days Ratio V V/Days Ratio Prod Requirement 0 0,0 9,0 1,1 3%
Analysis 110 13,8 46% 72,0 9,0 24% 35% Design 0,0 34,0 4,3 11% Transformation/profile 30,0 3,8 10% Total modeling 110,0 13,8 46% 145,0 18,1 48% -32% Development 127 15,9 47,0 5,9 16% 63% Transformation/profile 0,0 60,0 7,5 20% Total developement 127,0 15,9 54% 107,0 13,4 35% 16%
Problems tools 0,0 50,0 6,3 17%
Time reported 237 29,6 100% 302,0 37,8 100% -27%
Table 8: Time spent on a large development task using traditional and MDD methods.

MODELWARE – 511731 – D5.3 Industrial ROI, Assessment, and Feedback – Revision 2.1 date: 11/09/06
Page 17 of 23
4.3. Maintenance Perspective
Case 1 (Enabler):
This study measured the time taken to apply two change requests to a specific module. Timers were used by the participants to monitor the time taken for each task, and also to measure the downtime of the platform. Participants in the study also recorded the task order and their impressions of the time spent. Since the time of the experiment was limited, the notion of “achievement” was used to ensure homogeneous task completion criteria. In order for the change to be considered implemented, each achievement was specified by a list of tasks that each participant was required to perform. There were four participants in the study whose initials are given in the tables. The experienced developers are X1 and X3, whereas the less experienced participants are X2 and X4. Table 9 and
Acheivements with traditional methodology
Tasks X1 X2 X3 X4 Average
Requirement 60% 4% 48% 4% 29% Analysis 20% 0% 10% 0% 8% Design 0% 0% 0% 0% 0%
Development 88% 38% 100% 16% 60%
Total 42% 10% 40% 5% 24%
Table 10, respectively, give the times taken and achievements of the participants using the traditional approach.
Time reported with Traditional Methodology
Tasks X1 X2 X3 X4 Average Installation tools 0:05:00 0:01:15Documentation gathering 0:15:00 0:15:00 0:10:00 0:30:00 0:17:30Getting knowledge 0:30:00 2:21:00 0:42:45Requirement 0:05:00 0:00:00 0:03:00 0:00:00 0:02:00Analysis 0:00:00 0:00:00 0:00:00 0:00:00 0:00:00Design 0:00:00 0:00:00 0:00:00 0:00:00 0:00:00Development 5:01:00 1:00:00 1:10:00 1:05:00 1:11:15Tools downtime 0:10:00 0:02:30waiting 0:04 0:01:00Time reported 5:26:00 2:40:00 4:56:00 5:00:00 4:30:30
General Result OK Only Server
OK OK NOT OK
Table 9: Time taken to perform a maintenance task using the traditional approach
Acheivements with traditional methodology
Tasks X1 X2 X3 X4 Average
Requirement 60% 4% 48% 4% 29% Analysis 20% 0% 10% 0% 8% Design 0% 0% 0% 0% 0%
Development 88% 38% 100% 16% 60%
Total 42% 10% 40% 5% 24%

MODELWARE – 511731 – D5.3 Industrial ROI, Assessment, and Feedback – Revision 2.1 date: 11/09/06
Page 18 of 23
Table 10: Task achievement on a maintenance task using the traditional approach
The maximum average achieved by any participant in the study was 42% of the highest possible output. The difference in achievement between experienced people and less experienced people is substantial (average 31%). The experienced people spent less time looking for documentation; rather, they went directly to the code. Less experienced participants tried to extract information from the documentation and spent more time reading it. This had a negative impact on their level of achievement. Only one person accomplished 100% of the development tasks, but this was achieved by reaching a poor quality solution. For the MDD approach, the information is presented in Table 11 and Table 12. The maximum achieved by any participant in the study was 92% of the highest possible output. The difference in achievement between experienced people and less experienced people is 21%. All participants addressed all the methodology phases, putting the average overall achievement value at 81% which is substantially higher than that of the traditional experiment (24%).
Time reported with MDD Methodology
Tasks X1 X2 X3 X4 Average Installation tools 0:00:00Documentation gathering 0:00:00Getting knowledge 0:10:00 0:30:00 0:10:00Requirement 0:15:00 0:11:00 0:10:00 0:10:00 0:11:30Analysis 0:30:00 0:30:00 0:30:00 0:35:00 0:31:15Design 0:30:00 0:30:00 0:30:00 0:30:00 0:30:00Development 1:30:00 1:00:00 1:10:00 1:05:00 1:11:15Tools downtime 1:00:00 1:45:00 0:20:00 0:30:00 0:53:45waiting 0:00:00Time reported 3:45:00 4:06:00 2:40:00 3:20:00 3:27:45
General Result OK Still Bugs OK Still bugs
Table 11: Time taken to perform a maintenance task using the MDD approach.
Acheivements
Tasks X1 X2 X3 X4 Average
Requirement 100% 65% 85% 65% 79% Analysis 90% 70% 90% 70% 80% Design 90% 90% 90% 90% 90% Development 88% 69% 100% 50% 77% Averaged achievement 92% 73% 91% 69% 81%
Table 12: Task achievement on a maintenance task using the MDD approach
When using MDD the percentage of achievement for each participant increased on average by 57%, despite the reduced duration of the MDD experiment and the tool chain stability problem. Considering achievement averages, the best results were in the MDD environment where participants actually completed tasks instead of being lost in reading or looking for difficult-to-find or non-existent information. We note that the discrepancy in achievement levels favouring the MDD environment over the traditional environment would probably be more marked had the

MODELWARE – 511731 – D5.3 Industrial ROI, Assessment, and Feedback – Revision 2.1 date: 11/09/06
Page 19 of 23
developers been subjected to an unknown traditional environment rather than the company standard environment, with which they were already very familiar.
Case 2 (WM-Data):
For this experiment, the programmers applied the MDD tools and process for re-implementing a subset of the requirements used for the baseline establishment on a snapshot of the application taken just before the baseline establishment. The developers who participated in the experiment were familiar with the application in general and the MDD tools to be used in the experiment (in particular, they participated in preparing the MDD tool-chain), but not the specific requirements to be implemented during the experiment (in particular, none of them participated in the baseline establishment). Otherwise their qualifications are on par with the developers who worked in establishing the baseline. Two developers participated in the MDD experiment, spending 25 and 10 days of full-time work respectively. The time spent on each activity was measured (in hours). The results presented in Table 13 and Table 14, are: Real working time - the developer spent working on the requirement or in the activity. Clean working time - discounting any time lost due to malfunctions of the prototype tools that
should not happen with production-quality tools. The following engineering metrics were presented in these tables: Modelling effort on whole project (person-hours) Coding effort on whole project (person-hours)
Requirement Name
Baseline MDD experiment
(%) change from Baseline
Real Clean Real Clean Req-Adm-001 6,6 6,0 4,0 -9% -39% Req-Adm-002 6,8 2,1 2,1 -69% -69% Req-Adm-003 6,6 1,8 1,8 -73% -73% Req-Cus-001 14,1 15,0 15,0 +6% +6% Req-Cus-002 13,3 14,0 13,0 +5% -2% Req-Cus-003 28,5 29,5 28,5 +4% 0% Req-Cus-004 31,5 30,0 30,0 -5% -5% Req-Doc-001 31,1 28,5 28,5 -8% -8% Req-Doc-002 40,1 36,5 36,5 -9% -9% Req-Doc-003 27,2 24,0 24,0 -12% -12% Req-Hlp-001 53,9 45,0 42,5 -17% -21% Total 259,7 232,4 225,9 -11% -13% Average 23,6 21,1 20,5 -11% -13%
Table 13: Effort spent on requirement changing activities
Modelling Manual coding
Coding (Modelling+
Manual coding) Documentation Total Real* Clean** Real* Clean** Real* Clean** Real* Clean** Real* Clean**
70,1 66,1 135,0 132,5 205,1 198,6 27,3 27,3 232,4 225,9
Table 14: Average effort spent by specific type of development activity
MODELWARE – 511731 – D5.3 Industrial ROI, Assessment, and Feedback – Revision 2.1 date: 11/09/06
Page 20 of 23
Based on Table 14, we learn that the Modeling Effort Ratio is 33% (66,1 / 198,6). Based on examining the resultant application and counting lines of code that were generated automatically per total lines of code, we receive a Code Generation Ratio of 68%.
In terms of productivity, we conclude that MDD had positive impact for most of requirement changing tasks, from 69% as the highest value, to 0% and even a negative impact of 6% for one requirement. The average improvement value is 11-13% per task. The variation in results can be explained mostly by the task differences and their compliance with the MDD approach.
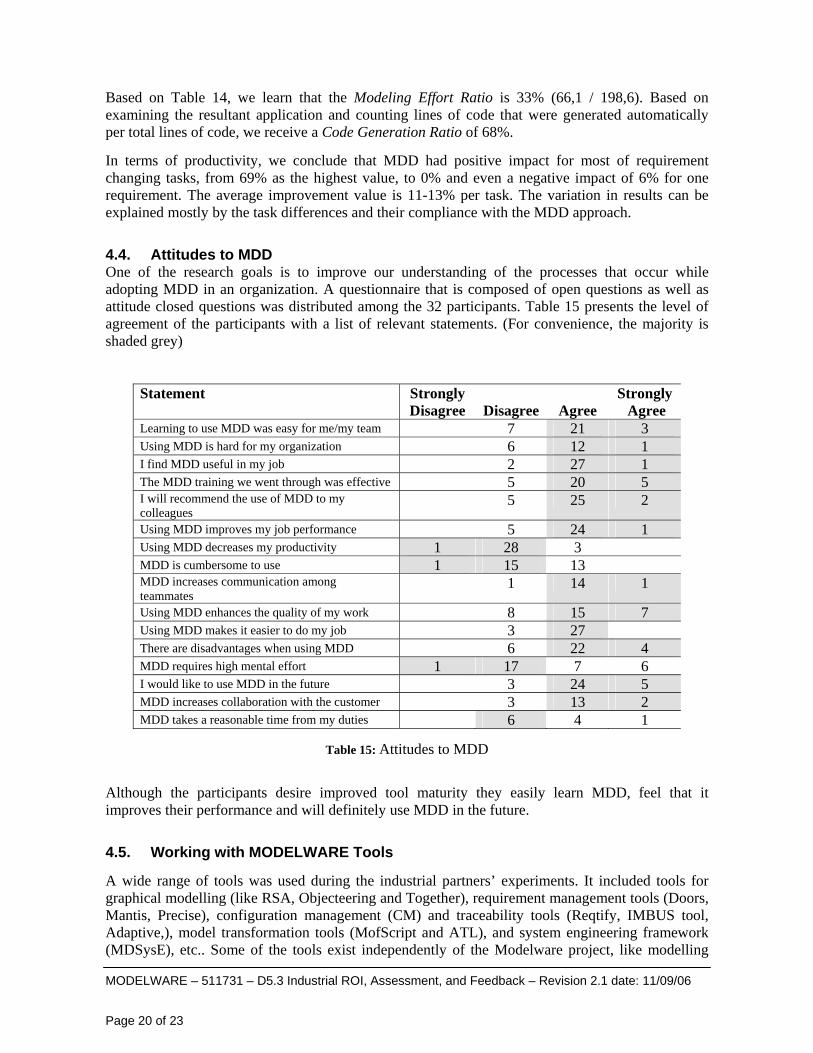
4.4. Attitudes to MDD One of the research goals is to improve our understanding of the processes that occur while adopting MDD in an organization. A questionnaire that is composed of open questions as well as attitude closed questions was distributed among the 32 participants. Table 15 presents the level of agreement of the participants with a list of relevant statements. (For convenience, the majority is shaded grey)
Statement Strongly
Disagree
Disagree
Agree Strongly Agree
Learning to use MDD was easy for me/my team 7 21 3 Using MDD is hard for my organization 6 12 1 I find MDD useful in my job 2 27 1 The MDD training we went through was effective 5 20 5 I will recommend the use of MDD to my colleagues
5 25 2
Using MDD improves my job performance 5 24 1 Using MDD decreases my productivity 1 28 3 MDD is cumbersome to use 1 15 13 MDD increases communication among teammates
1 14 1
Using MDD enhances the quality of my work 8 15 7 Using MDD makes it easier to do my job 3 27 There are disadvantages when using MDD 6 22 4 MDD requires high mental effort 1 17 7 6 I would like to use MDD in the future 3 24 5 MDD increases collaboration with the customer 3 13 2 MDD takes a reasonable time from my duties 6 4 1
Table 15: Attitudes to MDD
Although the participants desire improved tool maturity they easily learn MDD, feel that it improves their performance and will definitely use MDD in the future.
4.5. Working with MODELWARE Tools
A wide range of tools was used during the industrial partners’ experiments. It included tools for graphical modelling (like RSA, Objecteering and Together), requirement management tools (Doors, Mantis, Precise), configuration management (CM) and traceability tools (Reqtify, IMBUS tool, Adaptive,), model transformation tools (MofScript and ATL), and system engineering framework (MDSysE), etc.. Some of the tools exist independently of the Modelware project, like modelling

MODELWARE – 511731 – D5.3 Industrial ROI, Assessment, and Feedback – Revision 2.1 date: 11/09/06
Page 21 of 23
and CM tools; others were developed as a part of the project or during its execution, like transformation tools, ModelBus adaptors and MDA components.
Some companies, like France Telecom and Enabler, have used the methodology developed by WP2 to describe the MDA tool chain and the process for developing specific applications (voice-based services or retailer systems).
Among the MODELWARE tools, the tools that were used the most are MOFscript, and ATL. Though the survey results show the satisfaction of medium level for MofScript and even low for ATL, these tools have been improved significantly during the experiment, following the industry partners’ feedback. MDSysE was extensively used in system engineering.
All participants experienced problems with stability of the tools or their integration, which represents on average 15% of the total time. The WM-data participants mentioned that "The most important things we need are high-quality tools, which we are missing at the moment.". An Enabler subject wrote:, "Even though the platform was not stable, the tool chain was appreciated by the participants, especially the seamless integration of the traceability tools, the validation tools and the repository within RSA. This integration gave a lot of power as it increased visibility over the impact of changes and avoided changing environments. However the stability problem reflected the relative immaturity of the tools, and experienced participants were hesitant to endorse this methodology within the production environment."
4.6. MODELWARE Training
During the MDD adoption process, the most organized MDD training support was provided by Enabler because their people had no previous experience in this area. This included a basic education program, "MDD education series". Other partners, like WGO and FRANCE TELECOM, provided few MDD training and introduction sessions for their teams a few days before the experiment. Some partners (WM-DATA) participated in a workshop at an early stage of the project, then relied on self-study through written guides and on-line support for the relevant parts. In TATM, the system and safety engineering team were trained in the MDSysE Tools and process and the Safety tooling with the industry specific MODELWARE training materials [ 14]. Their training process included also some open source and generic training materials available through the Eclipse project ECESIS [ 15]. Other partners remarked that the generic training material was released too late for timely use in the experiment.
In general, most of the participants (25 out of 30 who answered) perceive the MODELWARE training program as effective. When asked ‘In your experience, what improvements should be made to the MDD adoption process’ one answered “more training time for some activities”. Another participant from another company answered the question ‘Do you find using MDD beneficial to your work? If yes, what were the benefits?’ : “Yes. It will if adopt more training and the actual implementation of MDD is more stable.”

MODELWARE – 511731 – D5.3 Industrial ROI, Assessment, and Feedback – Revision 2.1 date: 11/09/06
Page 22 of 23
5. Conclusion
Implementing MDD concepts and tools into software development teamwork is a process that involves a paradigm shift. Team members that have been working at a low level of abstraction, writing code, are required to work at a higher level of abstraction and develop the models from which code, tests, and documentation are generated automatically. There are many aspects of this paradigm shift that bear further investigation. This document focuses on the economic impact of the shift by measuring software productivity gain from the baseline traditional approach to the MDD approach. We have also studied the subjective impressions of software engineers engaged in the process of moving to a model-centric development environment.
Our main result is a collection of field evidence from the adoption of an MDD approach to the software lifecycle in five industrial settings.
Comparing traditional and MDD approaches, we found that when using modelling for the development of defined discrete tasks, no significant difference between the approaches was observed. However, in a different context, a productivity gain of 20% was found during design activity and 69% during coding. A system engineering case study found that the effort in the design phase increases by 20%, but the productivity gain estimated for the subsequent development phase is in the region of 60%. For time-constrained maintenance tasks, we found an 81% task completion rate using MDD versus only 24% using the traditional approach. Another study concerning with maintenance tasks, finds an average of 11-13% of productivity gain.
Qualitative data shows that although the participants in the study were dissatisfied with the maturity of the tools, they learn MDD easily, feel that it improves their performance, and definitely intend to use MDD in the future.
To summarize, the development of new functionality in both traditional and MDD approaches can lead to situations in which the effort is the same. However, when introducing a change request during the maintenance phase, MDD returns the investment in modelling and shortens the time of coping with the change, thus gain better productivity than the traditional approach. We note that this is an important result since maintenance is both the longest and most costly phase in the lifecycle of most software products.
MODELWARE – 511731 – D5.3 Industrial ROI, Assessment, and Feedback – Revision 2.1 date: 11/09/06
Page 23 of 23
References
1. Boehm B.W. (1981). Software Engineering Economics, Englewood Cliffs, N.J.: Prentice Hall.
2. Compuware study: http://www.compuware.com/dl/maintainmda.pdf
3. D5.1 Baseline Establishment_Aprote [D5.1 - Baseline Establishment - Aprote R3.1.doc]
4. D5.1 Baseline Establishment_Enabler [D5.1 - BI Baseline Establishment - Enabler R3.1.doc]
5. D5.1 Baseline Establishment_FRANCE TELECOM [D5 1 - Baseline Establishment - France Telecom R3.1.doc]
6. D5.1 Baseline Establishment_TATM [D5.1 Baseline EstablishmentTATM+UPM+TRT1.0withoutmacro.doc]
7. D5.1 Baseline Establishment_WGO [D5.1 - Baseline Establishment - WGO_2006.doc]
8. D5.3 Assessment feedback report for Enabler [web link]
9. D5.3 Assessment feedback report for France Telecom [web link]
10. D5.3 Assessment feedback report for TATM [web link]
11. D5.3 Assessment feedback report for WGO [web link]
12. D5.3 Assessment feedback report for WM-Data [web link]
13. D5.3 Survey summary [web link]
14. D5B.7 LSDS Training Material
15. Eclipse Project ECESIS: MODELWARE and Open Source Training Materials [http://www.eclipse.org/ecesis/]
16. Highsmith, J., 2002. Agile Software development Ecosystems, Addison-Wesley. 17. Interactive Objects studies:
http://www.omg.org/mda/mda_files/SuccesStory_DC_TSS_MDO_English.pdf; and at http://www.omg.org/mda/mda_files/SuccessStory_DBB_4pages.pdf
18. Kennedy Carter case study: http://www.omg.org/mda/mda_files/LockheedMartin.pdf
19. Shadish, W.R., Cook, T.D, and Campbell, D.T. (2002) Experimental and Quasi-Experimental Designs for Generalized Causal Inference, Boston: Houghton Mifflin Company.
20. Trombetti, G., Gokhale, A., Schmidt, D. C., Hatcliff, J., Singh, G. and Greenwald, J. “A Integrated Model-driven Development Environment for Composing and Validating Distributed Real-time and Embedded Systems,” in Model Driven Software Development- Volume II of Research and Practice in Software Engineering (S. Beydeda, M. Book, and V. Gruhn, eds.), New York: Springer-Verlag, 2005.
21. Zhang Y.: Test-Driven Modeling for Model-Driven Development. IEEE Software 21(5): 80-86, 2004.
22. Zhang, Y. and Sheth, D.: Mining Software Repositories for Model-Driven Development. IEEE Software 23(1): 82-90, 2006.