definition and significance of polycystic …definition and significance of polycystic...
TRANSCRIPT
...........................................................................................................................
Definition and significance of polycysticovarian morphology: a task force reportfrom the Androgen Excess andPolycystic Ovary Syndrome SocietyDidier Dewailly1,*,Marla E.Lujan2,Enrico Carmina3,Marcelle I. Cedars4,Joop Laven5, Robert J. Norman6, and Hector F. Escobar-Morreale7
1Department of Endocrine Gynaecology and Reproductive Medicine, Hopital Jeanne de Flandre, Centre Hospitalier de Lille, University of Lille,Lille, France 2Division of Nutritional Sciences, Human Metabolic Research Unit, Cornell University, Ithaca, NY, USA 3Endocrinology Unit,DISMOT Department, University of Palermo, Palermo, Italy 4Division of Reproductive Endocrinology and Infertility, Department of Obstetrics,Gynecology and Reproductive Sciences, University of California San Francisco, San Francisco, CA, USA 5Division of Reproductive Medicine,Department of Obstetrics and Gynecology, Erasmus MC University Medical Center, Rotterdam, Netherlands 6Robinson Institute, School ofPaediatrics and Reproductive Health, University of Adelaide, Adelaide, SA, Australia 7Diabetes, Obesity and Human Reproduction ResearchGroup, University of Alcala & Hospital Ramon y Cajal & Centro de Investigacion Biomedica en Red Diabetes y Enfermedades MetabolicasAsociadas CIBERDEM & Instituto Ramon y Cajal de Investigacion Sanitaria IRYCIS, Madrid, Spain
*Correspondence address. Department of Endocrine Gynaecology and Reproductive Medicine, Hopital Jeanne de Flandre, C.H.R.U., 59037 Lille,France; E-mail: [email protected]
Submitted on August 27, 2013; resubmitted on November 12, 2013; accepted on November 21, 2013
table of contents
† Introduction† Methods
PanelDataProcess
† Follicle Excess to Define PCOMDoes ultrasound afford a reliable estimate of the follicle excess of polycystic ovaries?Proposed thresholds for follicle excess in PCOMWhy such variability and controversy about the threshold for follicle excess?Recommendations
† Ovarian Size to Define PCOMProposed thresholds for ovarian enlargement in PCOMOvarian size over the lifespanMeasurements of ovarian size by 3D ultrasonographyRecommendations
† Other Imaging Variables Used to Define PCOMSpecific assessment of ovarian stromaOvarian blood flow in PCOS
† Increased Serum AMH Concentrations as a Surrogate Marker of PCOMRationale for the use of the serum AMH concentrationsThe difficult issue of assaying serum AMH concentrationsWhat are the results so far?Recommendations
† What Is the Meaning of PCOM?PCOM in hyperandrogenic and/or dysovulatory women
& The Author 2013. Published by Oxford University Press on behalf of the European Society of Human Reproduction and Embryology. All rights reserved.For Permissions, please email: [email protected]
Human Reproduction Update, Vol.20, No.3 pp. 334–352, 2014
Advanced Access publication on December 16, 2013 doi:10.1093/humupd/dmt061
at Cornell U
niversity Library on June 12, 2015
http://humupd.oxfordjournals.org/
Dow
nloaded from
PCOM in the general populationPCOM in particular situations
† Polycystic Ovaries as an Indicator of Ill HealthIs there any evidence in healthy women that PCOM confers risk of ill health?Does PCOM in PCOS confer any extra health risk?
† Defining PCOM in 2013: Which Guidelines?Guidelines for clinical practiceGuidelines for research
† Conclusions
background: The diagnosis of polycystic ovary syndrome (PCOS) relies on clinical, biological and morphological criteria. With the adventof ultrasonography, follicle excess has become the main aspect of polycystic ovarian morphology (PCOM). Since 2003, most investigators haveused a threshold of 12 follicles (measuring 2–9 mm in diameter) per whole ovary, but that now seems obsolete. An increase in ovarian volume(OV) and/or area may also be considered accurate markers of PCOM, yet their utility compared with follicle excess remains unclear.
methods: Published peer-reviewed medical literature about PCOM was searched using PubMed.gov online facilities and was submitted tocritical assessment by a panel of experts. Studies reporting antral follicle counts (AFC) or follicle number per ovary (FNPO) using transvaginalultrasonography in healthy women of reproductive age were also included. Only studies that reported the mean or median AFC or FNPO offollicles measuring 2–9 mm, 2–10 mm or ,10 mm in diameter, or visualized all follicles, were included.
results: Studies addressing women recruited from the general population and studies comparing control and PCOS populations with appro-priate statistics were convergent towards setting the threshold for increased FNPO at ≥25 follicles, in women aged 18–35 years. These studiessuggested maintaining the threshold for increased OVat ≥10 ml. Critical analysis of the literature showed that OV had less diagnostic potential forPCOM compared with FNPO. The review did not identify any additional diagnostic advantage for other ultrasound metrics such as specific mea-surements of ovarian stroma or blood flow. Even though serum concentrations of anti-Mullerian hormone (AMH) showed a diagnostic perform-ance for PCOM that was equal to or better than that of FNPO in some series, the accuracy and reproducibility issues of currently available AMHassays preclude the establishment of a threshold value for its use as a surrogate marker of PCOM. PCOM does not associate with significant con-sequences for health in the absence of other symptoms of PCOS but, because of the use of inconsistent definitions of PCOM among studies, thisquestion cannot be answered with absolute certainty.
conclusions: The Task Force recommends using FNPO for the definition of PCOM setting the threshold at ≥25, but only when usingnewer technology that affords maximal resolution of ovarian follicles (i.e. transducer frequency ≥8 MHz). If such technology is not available,we recommend using OV rather than FNPO for the diagnosis of PCOM for routine daily practice but not for research studies that require theprecise full characterization of patients. The Task Force recognizes the still unmet need for standardization of the follicle counting techniqueand the need for regularly updating the thresholds used to define follicle excess, particularly in diverse populations. Serum AMH concentrationgenerated great expectations as a surrogate marker for the follicle excess of PCOM, but full standardization of AMH assays is needed beforethey can be routinely used for clinical practice and research. Finally, the finding of PCOM in ovulatory women not showing clinical or biochemicalandrogen excess may be inconsequential, even though some studies suggest that isolated PCOM may represent the milder end of the PCOSspectrum.
Key words: Anti-Mullerian hormone / antral follicle count / follicle number per ovary / ovarian volume / polycystic ovaries
IntroductionThe combination of oligomenorrhoea, infertility, hirsutism and bilateralenlarged polycystic ovaries was identified as an entity by Stein andLeventhal (1935), who for some time gave their name to the syndrome.The term ‘polycystic ovary syndrome’ and its acronym PCOS appearedin the 1960s and gradually replaced the Stein–Leventhal syndrome des-ignation.
Meanwhile, the progressive decline in the practice of wedge resectionof the ovaries deprived researchers of a source of valuable study material.The last major histological study dates back to 1982 (Hughesdon, 1982)and provides a detailed description of the ‘polycystic’ appearance of theovaries as being simply an increase in the number of growing folliclesmeasuring ,10 mm in diameter.
Because the ovarian follicle mayvisually resemble a ‘cyst’, the presenceof ‘cystic’ images in the ovary must be considered a normal event. It isonly their excessive number that must be regarded as pathologic withPCOS being the major if not the exclusive cause. Therefore, it wouldhave been more accurate to speak of ‘multifollicular ovaries’ but thename ‘polycystic’ was time-honoured and has lasted until now. This is un-fortunate because this term wrongly worries patients and is sometimesmisinterpreted by physicians who arenot familiar with ovarian pathology.
With the advent of ultrasonography, follicle excess has become themain aspect of polycystic ovarian morphology (PCOM). An increase inovarian volume (OV) and an increased ovarian area (OA) are also con-sidered accurate markers of PCOM, provided the measurements arecarried out on a median section of the ovaries. Histopathologic studiesalso confirm that both OV and OA are indeed a good reflection of
Polycystic ovarian morphology 335
at Cornell U
niversity Library on June 12, 2015
http://humupd.oxfordjournals.org/
Dow
nloaded from
stromal hypertrophy and follicle excess, which are the anatomical hall-marks of PCOM (Hughesdon, 1982).
Nowadays there is an almost universal consensus on the choice offollicular excess and ovarian enlargement as criteria to define PCOMby ultrasound. However, establishing the normal values for folliclenumber per ovary (FNPO) and OV, and especially the setting of accuratethresholds for distinguishing normal ovaries from PCOM, is stillthe subject of great controversy. This poses a real problem becausethe item PCOM is included in the most commonly used classificationsfor the diagnosis of PCOS (The Rotterdam ESHRE/ASRM-SponsoredPCOS Consensus Workshop Group, 2004b; Azziz et al., 2009) andalso included in the latest recommendations from the National Institutesof Health (Johnson et al., 2012). But it is clear that the threshold of FNPOcurrently proposed for the diagnosis of PCOM needs to be revisited, asthis threshold is currently met by .50% of normal young ovulatorywomen in some series (Johnstone et al., 2010). The aim of this systematicreview was therefore to analyse the available literature and determinewhether we can now achieve a new consensus on the definition ofPCOM.
Methods
PanelThe Androgen Excess and PCOS (AE-PCOS) Society Board appointed apanel of experts on PCOM, selected from those researchers who hadauthoredmanyoriginal articles in the field. Panel members and the Board Dir-ector constituted the Writing Committee.
DataPublished peer-reviewed medical literature about PCOM was searched usingPubMed.gov online facilities (http://www.ncbi.nlm.nih.gov/pubmed) intro-ducing the following search terms: ‘polycystic appearing ovary’, ‘polycysticovarian morphology’, ‘polycystic ovaries’, ‘polycystic ovary’, ‘polyfollicularovary’, ‘multifollicular ovary’ ‘multicystic ovaries’, ‘ovarian area’, ‘ovarianvolume’, ‘subcortical stroma’, ‘ovarian stroma’, ‘ovarian stromal hyper-trophy’, ‘AMH’, ‘anti-Mullerian factor’, ‘anti-Mullerian hormone’, ‘Mullerianinhibiting factor’, ‘Mullerian-inhibiting hormone’, ‘Mullerian-inhibiting sub-stance’, ‘receiver operating characteristic curve’, ‘sensitivity and specificity’,‘inter-observer agreement’, ‘intra-observer agreement’, ‘reliability’, ‘repro-ducibility’, ‘prevalence’ and ‘Rotterdam’.
In parallel, a search of studies reporting antral follicle count (AFC) orFNPO using transvaginal ultrasonography in healthy women of reproductiveage was performed using as search terms: ‘antral follicle count’, ‘transvaginalultrasonography’, ‘regular menstrual cycles’ and ‘follicle number’. Resultswere limited to studies published after the year 2000 because the aim ofthis search was to identify the upper limits of normal of these variables in ovu-latory women when using modern ultrasound equipment. Studies in whichthe time-span of data collection or transducer frequency could not be con-firmed were excluded. Control populations were defined as healthywomen with regular menstrual cycles recruited from the general population,women with regular menstrual cycles with confirmed male factor or tubal in-fertility, and/or those with regular menstrual cycles in which hyperandrogen-ism, PCOS and/or other endocrine disorders were excluded. Only studiesthat reported means or medians of AFC and/or FNPO of follicles measuring2–9, 2–10, ,10 mm in diameter, or reported all follicles being visualized,were included. In instances where AFC was reported, values were dividedby two to generate an FNPO.
More than 300 articles were initially available for review. Some studieswere eliminated because data were not related to the focus of the guidelines,
were insufficient for analysis or were duplicated in several publications. Alldata sources were analysed recognizing positive publication bias.
ProcessThe review process included individual studies, systematic reviews, handsearches, abstracts, and individual databases and expert data. Each reviewwas conducted by at least two investigators, and the criteria for inclusion/exclusion were agreed upon by at least two reviewers in each area and arbi-trated by a third when necessary. The position statement applied part ofthe Grading of Recommendations, Assessment, Development and Evaluationgroup criteria (Atkins et al., 2004; Swiglo et al., 2008) in which the strength of arecommendation was indicated by ‘recommend’ or, if a weaker recommen-dation was indicated, by ‘suggest’. Recommendations were made based onevidence that was considered appropriate in making the recommendation.The writing committee critically reviewed the manuscript for intellectualcontent before submitting the manuscript to the AE-PCOS Society Boardfor endorsement. Institutional Review Board approval was not obtainedbecause the study reviewed publicly available medical literature.
Follicle Excess to Define PCOM
Does ultrasound afford a reliable estimate ofthe follicle excess of polycystic ovaries?Validation of follicle countsWhile sonohistopathological assessments confirmed a high accuracy indetecting PCOM by transabdominal ultrasonography, these conclusionswere based on qualitativeassessments of ovarian morphologyand not onquantitative measurements such as follicle counts (Saxton et al., 1990).Likewise, using ovarian laparoscopy as the gold-standard, ultrasonog-raphy was calculated to have a sensitivity of 91% and a specificity of100% in detecting PCOM, but this did not apply specifically to FNPO(Fox and Hull, 1993).
In fact, there are few data addressing the accuracy of ultrasonographicestimates of follicle counts in polycystic ovaries. Takahashi et al. (1994)demonstrated a good correlation between follicle counts obtained byhistopathology and transvaginal ultrasonography. However, the folliclecounts were higher when estimated by ultrasound than when measuredby histopathology (Takahashi et al., 1994), a result that should not be un-expected because histological assessment was conducted on ovarianwedge resections and did not rely on the examination of whole ovaries(Takahashi et al., 1994). Current ethical restrictions preclude the histo-logical validation of ultrasonographic assessment of follicle counts usingnewer ultrasound technology because of the invasive nature of the tech-niques needed to obtain ovarian tissue for histopathology.
Limitations inherent to the ultrasound assessment of polycystic ovariesThere can be doubt as to whether or not every sonolucency in the ovaryactually represents a follicle, given the variability in size and shape ofovarian follicles (Broekmans et al., 2010). This is especially true forsmall follicles (≤2 mm in diameter) and it is questioned whether thosefollicles should be counted since there is lack of data supporting the reli-ability of ultrasound in the quantification of such small follicles. Likewise,there can be difficulty in interpreting contiguous follicles as being one ormore than one (Broekmans et al., 2010).
Moreover, there isalsoriskof recountingoroverlooking folliclesparticu-larly in real-time examination, where there is no opportunity to flag folliclesas they are counted. To that end, a standardized approach to quantifyingfollicle populations in polycystic ovaries has recently been proposed.
336 Dewailly et al.
at Cornell U
niversity Library on June 12, 2015
http://humupd.oxfordjournals.org/
Dow
nloaded from
The method is limited to offline assessments in which medical imaging soft-ware allows for the flagging of individual follicles as they are counted (Lujanet al., 2010). The method involves compartmentalizing the ovary into gridsections and performing focused follicle counts on individual segments ofthe ovary to generate estimations of FNPO. The investigators demon-strated a high degree of agreement between multiple observers when agrid system was used and that little to no variation was evident when asingle observer assessed the same images for FNPO (Lujan et al., 2010).Unfortunately, since the grid technique is restricted to offline analysis, itis mainly helpful for clinical research but not for clinical practice.
Follicle counting by three-dimensional ultrasonography: is it morereliable?It is now possible to count follicles from stored three-dimensional (3D)datasets while simultaneously visualizing three perpendicular planes.The ability to cross-check follicles in multi-planar view aids in identifyingfollicles and this method was shown to have higher levels of reliabilitycompared with two-dimensional (2D) methods when used to assessnon-polycystic ovaries (Scheffer et al., 2002; Merce et al., 2005; Jayapra-kasan et al., 2007; Deb et al., 2009). Another option for estimating folliclepopulations involves the use of 3D reconstruction volume calculationsoftware (e.g. VOCALTM and SonoAVCTM), which can detect andquantify anechoic structures within an acquired 3D dataset. Use of thissoftware showed better accuracy in determining follicular volume(Raine-Fenning et al., 2008; Lamazou et al., 2010; Salama et al., 2010)and reduced observer variation in follicle counts (Jayaprakasan et al.,2007; Deb et al., 2009) compared with manual 2D measurements.Because use of this software involves variable degrees of image process-ing, the reliability of follicle counts would be expected to depend heavilyon image quality (Jayaprakasan et al., 2007) and on the aptitude of the in-terpreter for using the software. Moreover, the reliability of software indetecting small follicles (,5 mm in diameter) (Deb et al., 2010) and fol-licle counts .15 (Scheffer et al., 2002) was associated with substantiallylower levels of agreement compared with other methods, which has im-portant implications for their use in assessing polycystic ovaries.
To date, data attesting to the reliability of 3D ultrasonography to esti-mate follicle populations in polycystic ovaries are sparse as only a fewstudies have attempted to use 3D ultrasonography in this setting (Alle-mand et al., 2006; Ng et al., 2006; Lam et al., 2007, 2009; Sun and Fu,2007; Pascual et al., 2008; Battaglia et al., 2012). In the only study toderive follicle thresholds for PCOM using 3D volume-based software,an agreement level of 0.82 among two observers was reported as partof an internal validation assessment (Allemand et al., 2006). Comparedwith 2D estimates, the 3D method counted more follicles in subjectswith polycystic ovaries, which was the opposite to that observed whenimaging normal ovaries (Jayaprakasan et al., 2007; Deb et al., 2009,2010) and is in contrast with the findings of Battaglia et al. (2012) whoreported similar follicle counts with 2D and 3D methodology in polycys-tic ovaries. Taken together, these data suggest that 3D ultrasonographyholds promise in the evaluation of PCOM but that further studies arerequired before its routine use can be recommended.
Proposed thresholds for follicle excessin PCOMSelection of the threshold value for defining follicle excess is a highlycomplex issue. Our review of the available literature demonstrated
that three approaches have been previously used, namely: (i) arbitrary(i.e. choice of threshold based on clinical experience); (ii) use of receiveroperator characteristic (ROC) curve analyses (which report the diagnos-tic power of a parameter to distinguish between the diseased and non-diseased conditions and propose thresholds that balance test sensitivityand test specificity) or (iii) use of the 95th percentile of age-matchedcontrol populations considered as normal.
Each approach has its drawbacks. Arbitrary choice cannot be acceptedany longer as no consensus can be reached through this approach.Whether ROC curve analysis is appropriate for a condition like PCOS,in which there is controversy in defining criteria for the ‘diseased condi-tion’, is debatable. Lastly, the use of a control population raises the issueas to what extent the population is truly normal. Many authors have usednon-hyperandrogenic normo-ovulatory patients referred to their clinic,using various and debatable exclusion criteria. Others have used sup-posedly healthy women recruited from the generalpopulations, althoughwith variable definitions of ‘healthy’.
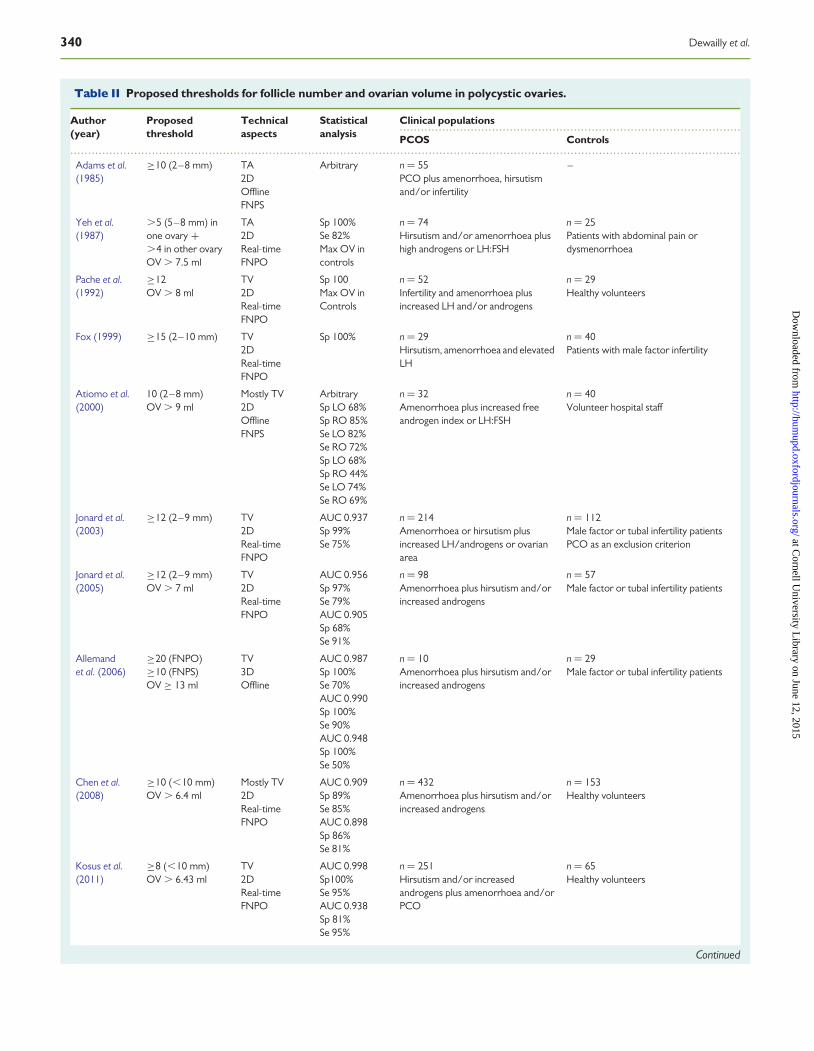
The first set of most widely adopted criteria, proposed by Adams et al.(1985, 1986) in the 1980s, arbitrarily described PCOM as an ovary con-taining 10 or more follicles (measuring 2–8 mm in diameter) in one crosssection of the ovary by using transabdominal ultrasonography. Sincethen, transabdominal approaches have been replaced by higher fre-quency transvaginal approaches which afford a greater likelihood ofdetecting the ovaries and a much better resolution for imaging small fol-licles. Moreover, thresholds for follicle counts now rely primarily on esti-mates of follicle populations throughout the entire ovary (FNPO), ratherthan in a single cross section (follicle number per section, FNPS), which isa highly important distinction that has led to confusion in both clinicalpractice and the literature.
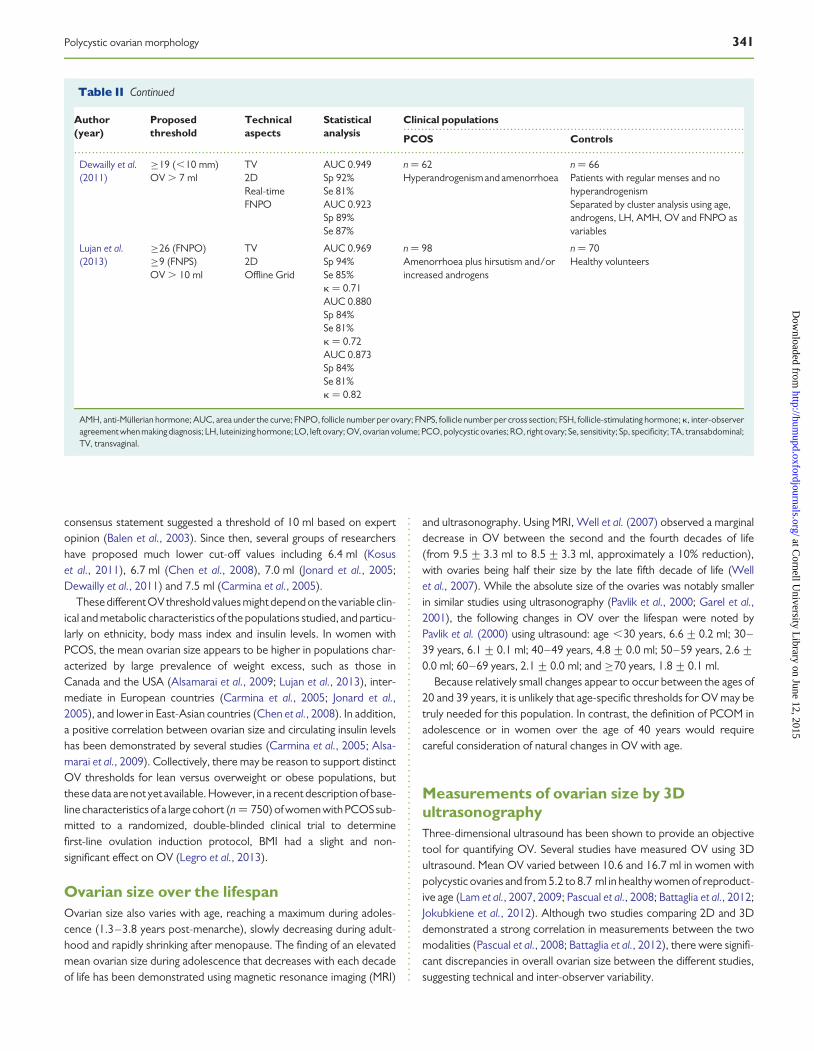
The first study that used the ROC curve analyses for defining a thresh-old for FNPO was that of Jonard et al. (2003), demonstrating a 75% sen-sitivity and 99% specificity in distinguishing PCOS cases from controls asjudged by transvaginal ultrasonography, with an FNPO threshold of ≥12follicles measuring 2–9 mm in diameter (mean of both ovaries). The2003 Rotterdam consensus, the most common ultrasound definitionemployed to date, was based on this single study and on expert agree-ment (Balen et al., 2003). This approach has been repeated recently intwo studies comparing PCOS to controls by means of ROC curve ana-lysis (Dewailly et al., 2011; Lujan et al., 2013). The conclusions of thesestudies were to raise the diagnostic threshold substantially to ≥19 andto ≥26 follicles per ovary, respectively. The different thresholds pro-posed by the two studies may be explained by differences in the analysisof the control populations because Dewailly et al. (2011) applied clusteranalysis in order to exclude clinically normal women with PCOM (seesection 7–2) prior to determining the threshold for FNPO. Had this pre-liminary step been omitted, their analysis would have yielded a cut-offvalue of 25 follicles, similar to the results obtained by Lujan et al. (2013).
However, these data differ from findings obtained in non-European ornon-Caucasian populations. Chen et al. (2008) confirmed the ≥12threshold for FNPO applying ROC analysis in the Chinese population,whereas Kosus et al. (2011) proposed an FNPO threshold of 8 folliclesper ovary for Turkish women. These cut-offs are far below the newlyproposed values for Western countries. Whether such a difference issolely due to ethnic variation or derived from the use of lower frequencytransducers remains unclear.
The difficulty in choosing the threshold for FNPO that defines PCOMis confirmed by studies reporting on so-called ‘normal’ or ‘general’
Polycystic ovarian morphology 337
at Cornell U
niversity Library on June 12, 2015
http://humupd.oxfordjournals.org/
Dow
nloaded from
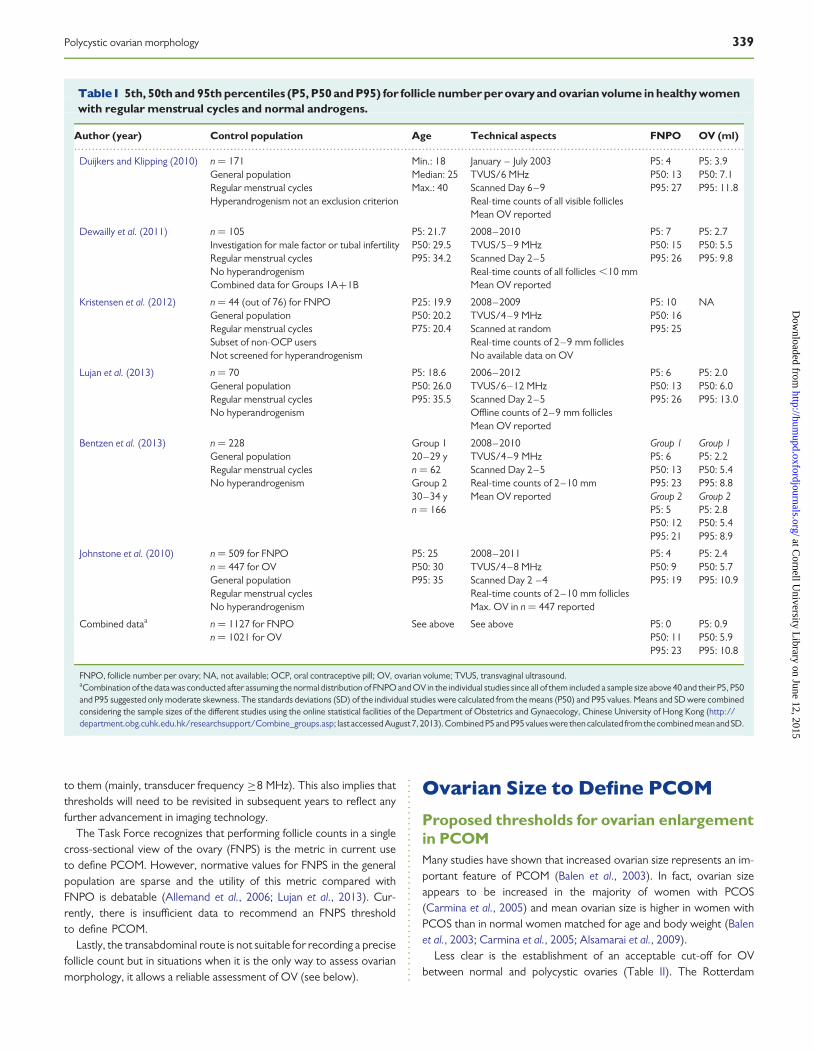
populations. In several recent studies of women of child-bearing age, theprevious FNPO ≥12 threshold resulted in very large prevalences ofPCOM in women from the general population, especially in thoseunder 30 years old (Duijkers and Klipping, 2010; Johnstone et al.,2010; Kristensen et al., 2010, 2012; Rosen et al., 2010; Jokubkieneet al., 2012) (Table I).
In selected populations of women with regular menstrual cycles andno evidence for hyperandrogenism, three recent studies (Bentzenet al., 2013; Deb et al., 2013; Lujan et al., 2013) yielded median valuesof FNPO between 11 and 13 (Table I), indicating that at least half ofthe controls aged 20–35 years had PCOM when using an FNPO ≥12threshold.
Therefore, these studies published in the 10 years after the 2003 Rot-terdam consensus was made available strongly suggest that the FNPO≥12 threshold is no longer valid for defining PCOM. Some investigatorshave interpreted these findings as evidence for the inadequacy of folliclecounts as a criterion for PCOS (Johnstone et al., 2010) while others haveconsidered these findings as indicative of the need to re-evaluate theFNPO threshold diagnostic of PCOM (Kristensen et al., 2010; Bentzenet al., 2013).
The systematic review and analysis of the literature identified severalstudies in which data regarding FNPO in the ‘general’ or ‘normal’ popula-tions were sufficiently well documented (Table I). Interestingly, theFNPO 95th percentiles in most of these populations are quite similarto the FNPO thresholds proposed by the two recent studies thatrelied on ROC curve analysis (Dewailly et al., 2011; Lujan et al., 2013)(Table II), indicating that an FNPO threshold of around 25 follicles maybe best used to distinguish normal ovarian morphology from PCOM inmost populations (Table I).
Why such variability and controversy aboutthe threshold for FNPO?The appropriateness of proposed thresholds for FNPO can be influ-enced by several factors as described below (Table III).
Differences in the methods of counting folliclesConsiderable variability exists in both published studies and in clinicalpractice in the technical methods used to count, measure and reportfollicles. A consortium of experts recently met with the aim of stand-ardizing real-time methods for estimating antral follicle populations(Broekmans et al., 2010). Their recommendation for a systematicmethod of counting follicles included performing initially a ‘scoutsweep’ of the ovary in two planes to discern its boundaries, and estab-lishing then the size of the largest follicle by making orthogonal mea-surements of the follicular antrum. It was recommended thatcalliper-based measurements should be made of all follicles .10 mmin diameter before proceeding to counting all remaining folliclesbetween 2 and 10 mm in the preferred (longitudinal) sweep of theovary. Counts for both ovaries should be summed, and follicles.10 mm subtracted, to obtain a total AFC.
This approach differs from that proposed by Balen et al. (2003) whorecommended estimating the follicles in multiple planes and reportingthe mean follicle counts of the left and right ovary when assessingPCOM (i.e. to generate an FNPO). Moreover, they recommended per-forming these estimates only in the absence of a dominant follicle, whichcould interfere with obtaining accurate measurements of OV and could
influence the accurate estimation of the follicle count. Whether there hasbeen widespread adoption of either method for estimating follicle popu-lations is uncertain. Moreover, we are unaware of any systematic evalu-ation of these real-time methods to reduce observer variability.
Observer variability in assessing follicle numberIn the first prospective evaluation of the variability associated withassessing PCOM by ultrasound, Amer et al. (2002) demonstrated thatthe ultrasonographic diagnosis was highly subjective and called into ques-tion its utility as an aid in the diagnosis of PCOS. Two recent studies(Lujan et al., 2008, 2009) have evaluated prospectively the variabilityassociated with counting follicles in polycystic ovaries and reportedpoor agreement between observers when estimating FNPO. Thesedata stand in contrast to past reports of good agreement in the assess-ment of FNPO in subfertile women without PCOS (Scheffer et al.,2002; Jayaprakasan et al., 2007).
Differences among studies might be best explained by differences infollicle populations among the clinical populations. Better agreementwould be expected for normal ovaries since they contain fewer follicles,and those present are typically larger and not as densely packed as thosefound in polycystic ovaries. Groups evaluating follicle counts in normalovaries have noted a distinct decrease in agreement when folliclecounts (sum of both ovaries) exceed 15 (Scheffer et al., 2002), consistentwith the notion that the higher numbers of follicles in polycystic ovarieswould result in a greater inter-observer variability in FNPO. Collectively,these studies indicate that obtaining accurate estimates of FNPO inpolycystic ovaries is challenging and prone to significant inter-observervariability.
Impact of recent advancements in imaging technologyon the variability in follicle countsThere have been marked improvements in the level of spatial resolutionafforded by newer ultrasound scanners. Some investigators credit theimproved spatial resolution that has occurred in the 10 years since theRotterdam consensus for primarily driving the need to re-evaluate cri-teria for PCOM (Dewailly et al., 2011) (Fig. 1). Considering the firstyear of patient inclusion in studies evaluating follicle populations inhealthy women of reproductive age, there is a clear increase in themedian values for FNPO over time, consistent with notion that the in-creasing transducer frequency of newer ultrasound scanners facilitatesthe detection of more follicles (Fig. 2). Regression analysis confirmed asignificant effect of Max Transducer Frequency on FNPO (P ¼ 0.023), in-dependent of the mean age of the patients reported for each study. Posthoc analysis of FNPO at different transducer frequencies revealed a sig-nificant increase in reported FNPO when the transducer frequencywas ≥8 MHz (P , 0.0001).
This has very important implications for when choosing the FNPOthreshold diagnostic of PCOM in clinical practice and research.
RecommendationsAfter critical analysis of the recent and pertinent literature, this TaskForce recommends setting the FNPO threshold for the definition ofPCOM at ≥25 follicles for most populations.
However, because the age of equipment likely impacts the number offollicles that might be visible on ultrasound, practitioners should be cau-tioned to check whether this threshold fits with the technology available
338 Dewailly et al.
at Cornell U
niversity Library on June 12, 2015
http://humupd.oxfordjournals.org/
Dow
nloaded from
to them (mainly, transducer frequency ≥8 MHz). This also implies thatthresholds will need to be revisited in subsequent years to reflect anyfurther advancement in imaging technology.
The Task Force recognizes that performing follicle counts in a singlecross-sectional view of the ovary (FNPS) is the metric in current useto define PCOM. However, normative values for FNPS in the generalpopulation are sparse and the utility of this metric compared withFNPO is debatable (Allemand et al., 2006; Lujan et al., 2013). Cur-rently, there is insufficient data to recommend an FNPS thresholdto define PCOM.
Lastly, the transabdominal route is not suitable for recording a precisefollicle count but in situations when it is the only way to assess ovarianmorphology, it allows a reliable assessment of OV (see below).
Ovarian Size to Define PCOM
Proposed thresholds for ovarian enlargementin PCOMMany studies have shown that increased ovarian size represents an im-portant feature of PCOM (Balen et al., 2003). In fact, ovarian sizeappears to be increased in the majority of women with PCOS(Carmina et al., 2005) and mean ovarian size is higher in women withPCOS than in normal women matched for age and body weight (Balenet al., 2003; Carmina et al., 2005; Alsamarai et al., 2009).
Less clear is the establishment of an acceptable cut-off for OVbetween normal and polycystic ovaries (Table II). The Rotterdam
.............................................................................................................................................................................................
Table I 5th, 50th and 95th percentiles (P5, P50 and P95) for follicle number per ovary and ovarian volume in healthy womenwith regular menstrual cycles and normal androgens.
Author (year) Control population Age Technical aspects FNPO OV (ml)
Duijkers and Klipping (2010) n ¼ 171General populationRegular menstrual cyclesHyperandrogenism not an exclusion criterion
Min.: 18Median: 25Max.: 40
January – July 2003TVUS/6 MHzScanned Day 6–9Real-time counts of all visible folliclesMean OV reported
P5: 4P50: 13P95: 27
P5: 3.9P50: 7.1P95: 11.8
Dewailly et al. (2011) n ¼ 105Investigation for male factor or tubal infertilityRegular menstrual cyclesNo hyperandrogenismCombined data for Groups 1A+1B
P5: 21.7P50: 29.5P95: 34.2
2008–2010TVUS/5–9 MHzScanned Day 2–5Real-time counts of all follicles ,10 mmMean OV reported
P5: 7P50: 15P95: 26
P5: 2.7P50: 5.5P95: 9.8
Kristensen et al. (2012) n ¼ 44 (out of 76) for FNPOGeneral populationRegular menstrual cyclesSubset of non-OCP usersNot screened for hyperandrogenism
P25: 19.9P50: 20.2P75: 20.4
2008–2009TVUS/4–9 MHzScanned at randomReal-time counts of 2–9 mm folliclesNo available data on OV
P5: 10P50: 16P95: 25
NA
Lujan et al. (2013) n ¼ 70General populationRegular menstrual cyclesNo hyperandrogenism
P5: 18.6P50: 26.0P95: 35.5
2006–2012TVUS/6–12 MHzScanned Day 2–5Offline counts of 2–9 mm folliclesMean OV reported
P5: 6P50: 13P95: 26
P5: 2.0P50: 6.0P95: 13.0
Bentzen et al. (2013) n ¼ 228General populationRegular menstrual cyclesNo hyperandrogenism
Group 120–29 yn ¼ 62Group 230–34 yn ¼ 166
2008–2010TVUS/4–9 MHzScanned Day 2–5Real-time counts of 2–10 mmMean OV reported
Group 1P5: 6P50: 13P95: 23Group 2P5: 5P50: 12P95: 21
Group 1P5: 2.2P50: 5.4P95: 8.8Group 2P5: 2.8P50: 5.4P95: 8.9
Johnstone et al. (2010) n ¼ 509 for FNPOn ¼ 447 for OVGeneral populationRegular menstrual cyclesNo hyperandrogenism
P5: 25P50: 30P95: 35
2008–2011TVUS/4–8 MHzScanned Day 2 –4Real-time counts of 2–10 mm folliclesMax. OV in n ¼ 447 reported
P5: 4P50: 9P95: 19
P5: 2.4P50: 5.7P95: 10.9
Combined dataa n ¼ 1127 for FNPOn ¼ 1021 for OV
See above See above P5: 0P50: 11P95: 23
P5: 0.9P50: 5.9P95: 10.8
FNPO, follicle number per ovary; NA, not available; OCP, oral contraceptive pill; OV, ovarian volume; TVUS, transvaginal ultrasound.aCombination of the data was conducted after assuming the normal distribution of FNPO and OV in the individual studies since all of them included a sample size above 40 and their P5, P50and P95 suggested only moderate skewness. The standards deviations (SD) of the individual studies were calculated from the means (P50) and P95 values. Means and SD were combinedconsidering the sample sizes of the different studies using the online statistical facilities of the Department of Obstetrics and Gynaecology, Chinese University of Hong Kong (http://department.obg.cuhk.edu.hk/researchsupport/Combine_groups.asp; last accessed August7, 2013). Combined P5 and P95 values were then calculated fromthe combined mean and SD.
Polycystic ovarian morphology 339
at Cornell U
niversity Library on June 12, 2015
http://humupd.oxfordjournals.org/
Dow
nloaded from
................................................................................................
.............................................................................................................................................................................................
Table II Proposed thresholds for follicle number and ovarian volume in polycystic ovaries.
Author(year)
Proposedthreshold
Technicalaspects
Statisticalanalysis
Clinical populations
PCOS Controls
Adams et al.(1985)
≥10 (2–8 mm) TA2DOfflineFNPS
Arbitrary n ¼ 55PCO plus amenorrhoea, hirsutismand/or infertility
–
Yeh et al.(1987)
.5 (5–8 mm) inone ovary +.4 in other ovaryOV . 7.5 ml
TA2DReal-timeFNPO
Sp 100%Se 82%Max OV incontrols
n ¼ 74Hirsutism and/or amenorrhoea plushigh androgens or LH:FSH
n ¼ 25Patients with abdominal pain ordysmenorrhoea
Pache et al.(1992)
≥12OV . 8 ml
TV2DReal-timeFNPO
Sp 100Max OV inControls
n ¼ 52Infertility and amenorrhoea plusincreased LH and/or androgens
n ¼ 29Healthy volunteers
Fox (1999) ≥15 (2–10 mm) TV2DReal-timeFNPO
Sp 100% n ¼ 29Hirsutism, amenorrhoea and elevatedLH
n ¼ 40Patients with male factor infertility
Atiomo et al.(2000)
10 (2–8 mm)OV . 9 ml
Mostly TV2DOfflineFNPS
ArbitrarySp LO 68%Sp RO 85%Se LO 82%Se RO 72%Sp LO 68%Sp RO 44%Se LO 74%Se RO 69%
n ¼ 32Amenorrhoea plus increased freeandrogen index or LH:FSH
n ¼ 40Volunteer hospital staff
Jonard et al.(2003)
≥12 (2–9 mm) TV2DReal-timeFNPO
AUC 0.937Sp 99%Se 75%
n ¼ 214Amenorrhoea or hirsutism plusincreased LH/androgens or ovarianarea
n ¼ 112Male factor or tubal infertility patientsPCO as an exclusion criterion
Jonard et al.(2005)
≥12 (2–9 mm)OV . 7 ml
TV2DReal-timeFNPO
AUC 0.956Sp 97%Se 79%AUC 0.905Sp 68%Se 91%
n ¼ 98Amenorrhoea plus hirsutism and/orincreased androgens
n ¼ 57Male factor or tubal infertility patients
Allemandet al. (2006)
≥20 (FNPO)≥10 (FNPS)OV ≥ 13 ml
TV3DOffline
AUC 0.987Sp 100%Se 70%AUC 0.990Sp 100%Se 90%AUC 0.948Sp 100%Se 50%
n ¼ 10Amenorrhoea plus hirsutism and/orincreased androgens
n ¼ 29Male factor or tubal infertility patients
Chen et al.(2008)
≥10 (,10 mm)OV . 6.4 ml
Mostly TV2DReal-timeFNPO
AUC 0.909Sp 89%Se 85%AUC 0.898Sp 86%Se 81%
n ¼ 432Amenorrhoea plus hirsutism and/orincreased androgens
n ¼ 153Healthy volunteers
Kosus et al.(2011)
≥8 (,10 mm)OV . 6.43 ml
TV2DReal-timeFNPO
AUC 0.998Sp100%Se 95%AUC 0.938Sp 81%Se 95%
n ¼ 251Hirsutism and/or increasedandrogens plus amenorrhoea and/orPCO
n ¼ 65Healthy volunteers
Continued
340 Dewailly et al.
at Cornell U
niversity Library on June 12, 2015
http://humupd.oxfordjournals.org/
Dow
nloaded from
consensus statement suggested a threshold of 10 ml based on expertopinion (Balen et al., 2003). Since then, several groups of researchershave proposed much lower cut-off values including 6.4 ml (Kosuset al., 2011), 6.7 ml (Chen et al., 2008), 7.0 ml (Jonard et al., 2005;Dewailly et al., 2011) and 7.5 ml (Carmina et al., 2005).
These differentOVthreshold values might depend on the variable clin-ical and metabolic characteristics of the populations studied, and particu-larly on ethnicity, body mass index and insulin levels. In women withPCOS, the mean ovarian size appears to be higher in populations char-acterized by large prevalence of weight excess, such as those inCanada and the USA (Alsamarai et al., 2009; Lujan et al., 2013), inter-mediate in European countries (Carmina et al., 2005; Jonard et al.,2005), and lower in East-Asian countries (Chen et al., 2008). In addition,a positive correlation between ovarian size and circulating insulin levelshas been demonstrated by several studies (Carmina et al., 2005; Alsa-marai et al., 2009). Collectively, there may be reason to support distinctOV thresholds for lean versus overweight or obese populations, butthese data are not yet available. However, in a recent description of base-line characteristics of a large cohort (n ¼ 750) of women with PCOS sub-mitted to a randomized, double-blinded clinical trial to determinefirst-line ovulation induction protocol, BMI had a slight and non-significant effect on OV (Legro et al., 2013).
Ovarian size over the lifespanOvarian size also varies with age, reaching a maximum during adoles-cence (1.3–3.8 years post-menarche), slowly decreasing during adult-hood and rapidly shrinking after menopause. The finding of an elevatedmean ovarian size during adolescence that decreases with each decadeof life has been demonstrated using magnetic resonance imaging (MRI)
and ultrasonography. Using MRI, Well et al. (2007) observed a marginaldecrease in OV between the second and the fourth decades of life(from 9.5+3.3 ml to 8.5+3.3 ml, approximately a 10% reduction),with ovaries being half their size by the late fifth decade of life (Wellet al., 2007). While the absolute size of the ovaries was notably smallerin similar studies using ultrasonography (Pavlik et al., 2000; Garel et al.,2001), the following changes in OV over the lifespan were noted byPavlik et al. (2000) using ultrasound: age ,30 years, 6.6+0.2 ml; 30–39 years, 6.1+0.1 ml; 40–49 years, 4.8+0.0 ml; 50–59 years, 2.6+0.0 ml; 60–69 years, 2.1+0.0 ml; and ≥70 years, 1.8+0.1 ml.
Because relatively small changes appear to occur between the ages of20 and 39 years, it is unlikely that age-specific thresholds for OV may betruly needed for this population. In contrast, the definition of PCOM inadolescence or in women over the age of 40 years would requirecareful consideration of natural changes in OV with age.
Measurements of ovarian size by 3DultrasonographyThree-dimensional ultrasound has been shown to provide an objectivetool for quantifying OV. Several studies have measured OV using 3Dultrasound. Mean OV varied between 10.6 and 16.7 ml in women withpolycystic ovaries and from 5.2 to 8.7 ml in healthy women of reproduct-ive age (Lam et al., 2007, 2009; Pascual et al., 2008; Battaglia et al., 2012;Jokubkiene et al., 2012). Although two studies comparing 2D and 3Ddemonstrated a strong correlation in measurements between the twomodalities (Pascual et al., 2008; Battaglia et al., 2012), there were signifi-cant discrepancies in overall ovarian size between the different studies,suggesting technical and inter-observer variability.
................................................................................................
.............................................................................................................................................................................................
Table II Continued
Author(year)
Proposedthreshold
Technicalaspects
Statisticalanalysis
Clinical populations
PCOS Controls
Dewailly et al.(2011)
≥19 (,10 mm)OV . 7 ml
TV2DReal-timeFNPO
AUC 0.949Sp 92%Se 81%AUC 0.923Sp 89%Se 87%
n ¼ 62Hyperandrogenism and amenorrhoea
n ¼ 66Patients with regular menses and nohyperandrogenismSeparated by cluster analysis using age,androgens, LH, AMH, OV and FNPO asvariables
Lujan et al.(2013)
≥26 (FNPO)≥9 (FNPS)OV . 10 ml
TV2DOffline Grid
AUC 0.969Sp 94%Se 85%k ¼ 0.71AUC 0.880Sp 84%Se 81%k ¼ 0.72AUC 0.873Sp 84%Se 81%k ¼ 0.82
n ¼ 98Amenorrhoea plus hirsutism and/orincreased androgens
n ¼ 70Healthy volunteers
AMH, anti-Mullerian hormone; AUC, area under the curve; FNPO, follicle number per ovary; FNPS, follicle number per cross section; FSH, follicle-stimulating hormone; k, inter-observeragreement when making diagnosis; LH, luteinizing hormone; LO, left ovary; OV, ovarian volume; PCO, polycystic ovaries; RO, right ovary; Se, sensitivity; Sp, specificity; TA, transabdominal;TV, transvaginal.
Polycystic ovarian morphology 341
at Cornell U
niversity Library on June 12, 2015
http://humupd.oxfordjournals.org/
Dow
nloaded from
RecommendationsOV appears as a good surrogate marker of PCOM although, comparedwith FNPO, OV had lower sensitivity for discriminating between patientswith PCOS and controls in all the studies comparing both parameters(Table II). Therefore, this Task Force recommends using OV for thediagnosis of PCOM in instances when the image quality does not allowa reliable estimate of FNPO, especially when the transvaginal route isnot feasible. The use of in-house reference normal values is highly recom-mended but, if unavailable, the existing OV ≥10 ml threshold can beused conservatively.
Other Imaging Variables Used toDefine PCOMThere is considerable debate whether the following assessments shouldbe utilized and included in the criteria of PCOM.
Specific assessment of ovarian stromaBy 3D ultrasonography, stromal volume can be measured through calcu-lation and subtraction of total follicular volume from the total OV. Forexample, Chinese women with PCOS, although having smaller stromalvolumes than Caucasian women with PCOS (9.74 versus 10.79 ml),had higher ovarian stromal volume compared with women withoutPCOS (9.74 versus 4.07 ml) (Chen et al., 2008; Lam et al., 2009).
The ratio of ovarian stroma to total ovarian size may be a good criter-ion for diagnosis of PCOS, with a cut-off value of 0.32 indicating an asso-ciation with hyperandrogenaemia (Fulghesu et al., 2007). However, todate there are few studies corroborating the diagnostic potential ofthis variable. In general, ovarian stromal volume and total ovarian sizeare well correlated and hence, there may not be any additional valueto including stromal size measurements in clinical practice.
Ovarian blood flow in PCOSIncreased OV has been associated not only with enhanced stromal echo-genicity but also with increased vascularity. Even though the introductionof 3D ultrasound has allowed better and more objective assessment ofovarian morphology and vascularization (Raine-Fenning et al., 2003,2004), results pertaining to differences in ovarian blood flow in PCOShave been conflicting.
A prospective study by Adali et al. (2009) showed higher ovarianstromal blood flow and reduced uterine perfusion in patients withPCOS compared with age-matched women without PCOS. Similarly,Battaglia et al. (2012) reported that assessments of ovarian vasculariza-tion, as judged by 3D power Doppler, were significantly increased inPCOS patients compared with controls. These findings are consistentwith those of other studies (Battaglia et al., 1995; Zaidi et al., 1995; Lamet al., 2009) but disagree with the results of other studies using 2D and3D Doppler technology that did not observe any differences in vascular-ization between women with PCOS and controls (Jarvela et al., 2003;Ng et al., 2005; Younis et al., 2011).
.............................................................................................................................................................................................
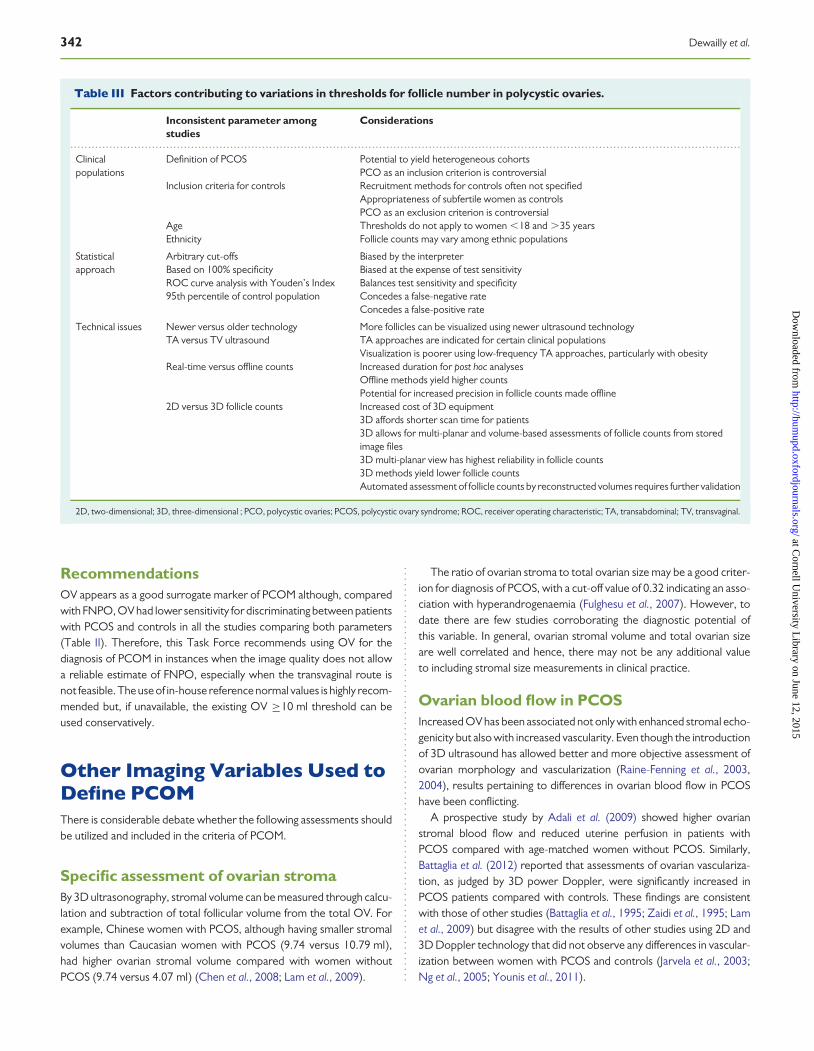
Table III Factors contributing to variations in thresholds for follicle number in polycystic ovaries.
Inconsistent parameter amongstudies
Considerations
Clinicalpopulations
Definition of PCOS Potential to yield heterogeneous cohortsPCO as an inclusion criterion is controversial
Inclusion criteria for controls Recruitment methods for controls often not specifiedAppropriateness of subfertile women as controlsPCO as an exclusion criterion is controversial
Age Thresholds do not apply to women ,18 and .35 yearsEthnicity Follicle counts may vary among ethnic populations
Statisticalapproach
Arbitrary cut-offs Biased by the interpreterBased on 100% specificity Biased at the expense of test sensitivityROC curve analysis with Youden’s Index95th percentile of control population
Balances test sensitivity and specificityConcedes a false-negative rateConcedes a false-positive rate
Technical issues Newer versus older technology More follicles can be visualized using newer ultrasound technologyTA versus TV ultrasound TA approaches are indicated for certain clinical populations
Visualization is poorer using low-frequency TA approaches, particularly with obesityReal-time versus offline counts Increased duration for post hoc analyses
Offline methods yield higher countsPotential for increased precision in follicle counts made offline
2D versus 3D follicle counts Increased cost of 3D equipment3D affords shorter scan time for patients3D allows for multi-planar and volume-based assessments of follicle counts from storedimage files3D multi-planar view has highest reliability in follicle counts3D methods yield lower follicle countsAutomated assessment of follicle counts by reconstructed volumes requires further validation
2D, two-dimensional; 3D, three-dimensional ; PCO, polycystic ovaries; PCOS, polycystic ovary syndrome; ROC, receiver operating characteristic; TA, transabdominal; TV, transvaginal.
342 Dewailly et al.
at Cornell U
niversity Library on June 12, 2015
http://humupd.oxfordjournals.org/
Dow
nloaded from
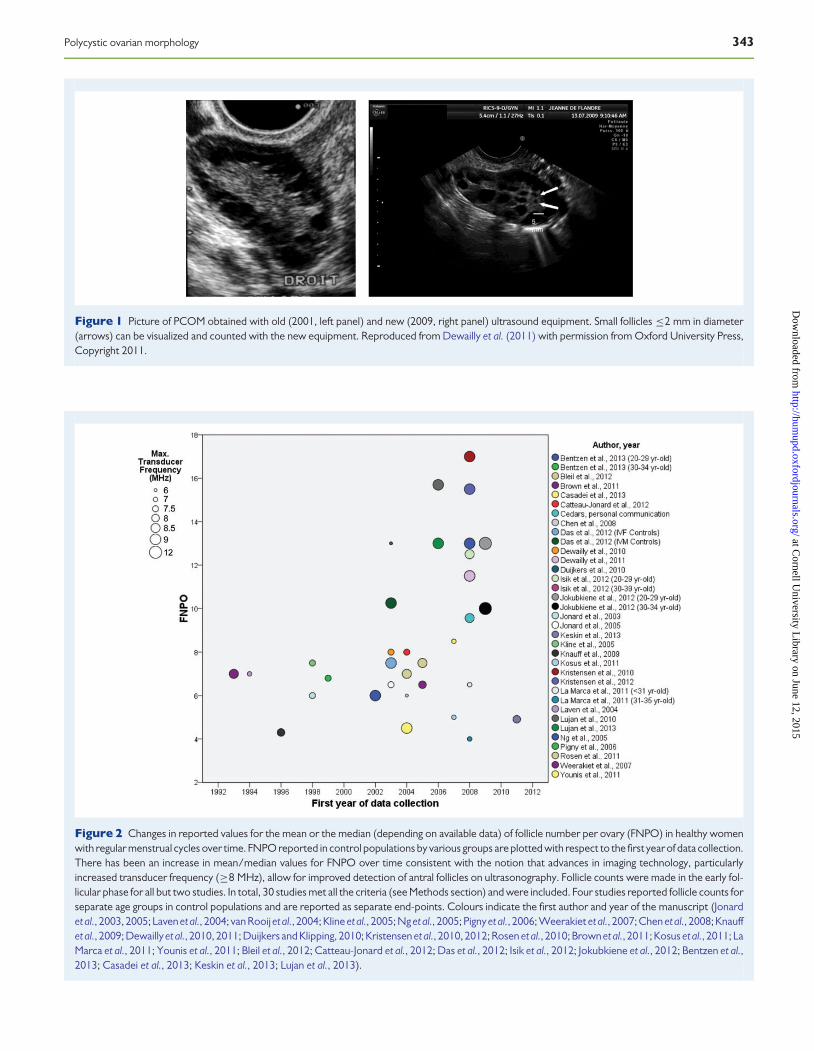
Figure 1 Picture of PCOM obtained with old (2001, left panel) and new (2009, right panel) ultrasound equipment. Small follicles ≤2 mm in diameter(arrows) can be visualized and counted with the new equipment. Reproduced from Dewailly et al. (2011) with permission from Oxford University Press,Copyright 2011.
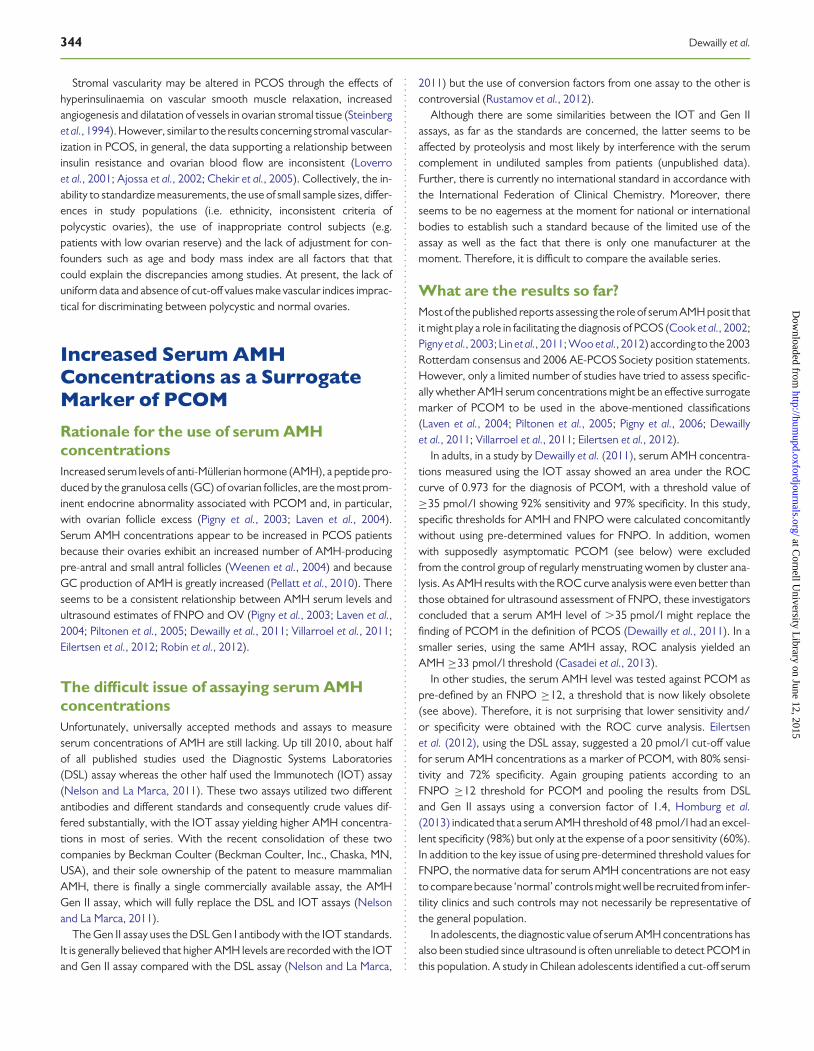
Figure 2 Changes in reported values for the mean or the median (depending on available data) of follicle number per ovary (FNPO) in healthy womenwith regular menstrual cycles over time. FNPO reported in control populations by various groups are plotted with respect to the first year of data collection.There has been an increase in mean/median values for FNPO over time consistent with the notion that advances in imaging technology, particularlyincreased transducer frequency (≥8 MHz), allow for improved detection of antral follicles on ultrasonography. Follicle counts were made in the early fol-licular phase for all but two studies. In total, 30 studies met all the criteria (see Methods section) and were included. Four studies reported follicle counts forseparate age groups in control populations and are reported as separate end-points. Colours indicate the first author and year of the manuscript (Jonardet al., 2003, 2005; Laven et al., 2004; van Rooijet al., 2004; Kline et al., 2005; Ng et al., 2005; Pignyet al., 2006; Weerakiet et al., 2007; Chen et al., 2008; Knauffet al., 2009; Dewaillyet al., 2010, 2011; Duijkers and Klipping, 2010; Kristensen et al., 2010, 2012; Rosen et al., 2010; Brown et al., 2011; Kosus et al., 2011; LaMarca et al., 2011; Younis et al., 2011; Bleil et al., 2012; Catteau-Jonard et al., 2012; Das et al., 2012; Isik et al., 2012; Jokubkiene et al., 2012; Bentzen et al.,2013; Casadei et al., 2013; Keskin et al., 2013; Lujan et al., 2013).
Polycystic ovarian morphology 343
at Cornell U
niversity Library on June 12, 2015
http://humupd.oxfordjournals.org/
Dow
nloaded from
Stromal vascularity may be altered in PCOS through the effects ofhyperinsulinaemia on vascular smooth muscle relaxation, increasedangiogenesis and dilatation of vessels in ovarian stromal tissue (Steinberget al., 1994). However, similar to the results concerning stromal vascular-ization in PCOS, in general, the data supporting a relationship betweeninsulin resistance and ovarian blood flow are inconsistent (Loverroet al., 2001; Ajossa et al., 2002; Chekir et al., 2005). Collectively, the in-ability to standardize measurements, the use of small sample sizes, differ-ences in study populations (i.e. ethnicity, inconsistent criteria ofpolycystic ovaries), the use of inappropriate control subjects (e.g.patients with low ovarian reserve) and the lack of adjustment for con-founders such as age and body mass index are all factors that thatcould explain the discrepancies among studies. At present, the lack ofuniform data and absence of cut-off values make vascular indices imprac-tical for discriminating between polycystic and normal ovaries.
Increased Serum AMHConcentrations as a SurrogateMarker of PCOM
Rationale for the use of serum AMHconcentrationsIncreased serum levels of anti-Mullerian hormone (AMH), a peptide pro-duced by the granulosa cells (GC) of ovarian follicles, are the most prom-inent endocrine abnormality associated with PCOM and, in particular,with ovarian follicle excess (Pigny et al., 2003; Laven et al., 2004).Serum AMH concentrations appear to be increased in PCOS patientsbecause their ovaries exhibit an increased number of AMH-producingpre-antral and small antral follicles (Weenen et al., 2004) and becauseGC production of AMH is greatly increased (Pellatt et al., 2010). Thereseems to be a consistent relationship between AMH serum levels andultrasound estimates of FNPO and OV (Pigny et al., 2003; Laven et al.,2004; Piltonen et al., 2005; Dewailly et al., 2011; Villarroel et al., 2011;Eilertsen et al., 2012; Robin et al., 2012).
The difficult issue of assaying serum AMHconcentrationsUnfortunately, universally accepted methods and assays to measureserum concentrations of AMH are still lacking. Up till 2010, about halfof all published studies used the Diagnostic Systems Laboratories(DSL) assay whereas the other half used the Immunotech (IOT) assay(Nelson and La Marca, 2011). These two assays utilized two differentantibodies and different standards and consequently crude values dif-fered substantially, with the IOT assay yielding higher AMH concentra-tions in most of series. With the recent consolidation of these twocompanies by Beckman Coulter (Beckman Coulter, Inc., Chaska, MN,USA), and their sole ownership of the patent to measure mammalianAMH, there is finally a single commercially available assay, the AMHGen II assay, which will fully replace the DSL and IOT assays (Nelsonand La Marca, 2011).
The Gen II assay uses the DSL Gen I antibody with the IOT standards.It is generally believed that higher AMH levels are recorded with the IOTand Gen II assay compared with the DSL assay (Nelson and La Marca,
2011) but the use of conversion factors from one assay to the other iscontroversial (Rustamov et al., 2012).
Although there are some similarities between the IOT and Gen IIassays, as far as the standards are concerned, the latter seems to beaffected by proteolysis and most likely by interference with the serumcomplement in undiluted samples from patients (unpublished data).Further, there is currently no international standard in accordance withthe International Federation of Clinical Chemistry. Moreover, thereseems to be no eagerness at the moment for national or internationalbodies to establish such a standard because of the limited use of theassay as well as the fact that there is only one manufacturer at themoment. Therefore, it is difficult to compare the available series.
What are the results so far?Most of the published reports assessing the role of serum AMH posit thatit might play a role in facilitating the diagnosis of PCOS (Cook et al., 2002;Pigny et al., 2003; Lin et al., 2011; Woo et al., 2012) according to the 2003Rotterdam consensus and 2006 AE-PCOS Society position statements.However, only a limited number of studies have tried to assess specific-ally whether AMH serum concentrations might be an effective surrogatemarker of PCOM to be used in the above-mentioned classifications(Laven et al., 2004; Piltonen et al., 2005; Pigny et al., 2006; Dewaillyet al., 2011; Villarroel et al., 2011; Eilertsen et al., 2012).
In adults, in a study by Dewailly et al. (2011), serum AMH concentra-tions measured using the IOT assay showed an area under the ROCcurve of 0.973 for the diagnosis of PCOM, with a threshold value of≥35 pmol/l showing 92% sensitivity and 97% specificity. In this study,specific thresholds for AMH and FNPO were calculated concomitantlywithout using pre-determined values for FNPO. In addition, womenwith supposedly asymptomatic PCOM (see below) were excludedfrom the control group of regularly menstruating women by cluster ana-lysis. As AMH results with the ROC curve analysis were even better thanthose obtained for ultrasound assessment of FNPO, these investigatorsconcluded that a serum AMH level of .35 pmol/l might replace thefinding of PCOM in the definition of PCOS (Dewailly et al., 2011). In asmaller series, using the same AMH assay, ROC analysis yielded anAMH ≥33 pmol/l threshold (Casadei et al., 2013).
In other studies, the serum AMH level was tested against PCOM aspre-defined by an FNPO ≥12, a threshold that is now likely obsolete(see above). Therefore, it is not surprising that lower sensitivity and/or specificity were obtained with the ROC curve analysis. Eilertsenet al. (2012), using the DSL assay, suggested a 20 pmol/l cut-off valuefor serum AMH concentrations as a marker of PCOM, with 80% sensi-tivity and 72% specificity. Again grouping patients according to anFNPO ≥12 threshold for PCOM and pooling the results from DSLand Gen II assays using a conversion factor of 1.4, Homburg et al.(2013) indicated that a serum AMH threshold of 48 pmol/l had an excel-lent specificity (98%) but only at the expense of a poor sensitivity (60%).In addition to the key issue of using pre-determined threshold values forFNPO, the normative data for serum AMH concentrations are not easyto comparebecause ‘normal’ controls might well be recruited from infer-tility clinics and such controls may not necessarily be representative ofthe general population.
In adolescents, the diagnostic value of serum AMH concentrations hasalso been studied since ultrasound is often unreliable to detect PCOM inthis population. A study in Chilean adolescents identified a cut-off serum
344 Dewailly et al.
at Cornell U
niversity Library on June 12, 2015
http://humupd.oxfordjournals.org/
Dow
nloaded from
AMH concentration of 60 pmol/l (with the IOT assay) to diagnosePCOM in regularly menstruating adolescents, with a sensitivity and spe-cificity of 64 and 90% (area under the ROC curve ¼ 0.873, confidenceinterval 0.782–0.963) (Villarroel et al., 2011). The results were not asgood in Australian adolescents with the same assay (area under theROC curve ¼ 0.67, confidence interval 0.60–0.75) leading theauthors to conclude that serum AMH concentrations were a question-able surrogate marker of PCOM in adolescents (Hart et al., 2010).
RecommendationsGiven the uncertainty around AMH assays, we decided not to systemat-ically review the currently available data concerning the value of serumAMH in diagnosing PCOM, although another group has done so recently(Iliodromiti et al., 2013). The Task Force recommends against consideringan increased serum AMH concentration as surrogate marker of PCOMforclinical practice and research until an accurate AMH assay, which producesreliable and reproducible results, is available in the future.
What Is the Meaning of PCOM?The answer to this question varies greatly depending on the populationunder study.
PCOM in hyperandrogenic and/ordysovulatory womenDespite not being included in the diagnostic criteria derived from theconsensus conference sponsored in 1990 by the National Institutes ofHealth (NIH) (Zawadzki and Dunaif, 1992), PCOM is now consideredone of the criteria for the diagnosis of PCOS in the two most recent defi-nitions of PCOS, namely the 2003 Rotterdam consensus (The Rotter-dam ESHRE/ASRM-sponsored PCOS consensus workshop group,2004a, b) and the 2006 Androgen Excess & PCOS (AE-PCOS) Societycriteria (Azziz et al., 2006, 2009). Of note, in the most recent NIH-sponsored evidence-based methodology workshop on PCOS held in2012, an independent panel of experts recommended that PCOM con-tinues to be considered as diagnostic criterion for PCOS (Johnson et al.,2012). However, some investigators still contest the inclusion of thisfeature in diagnostic classifications for PCOS, since it is also observedin apparently normal women (see below).
Available data suggest an inherited basis for the aggregation of PCOMwithin families with PCOS (Govind et al., 1999). There is also the near-universal finding of PCOM across ethnic and racial groups in womenotherwise diagnosed with PCOS. Besides the data from Northern Euro-pean Caucasian populations, the largest study from China (Zhang et al.,2013) evaluated 719 cases and 685 controls and confirmed that 92% ofcases met Rotterdam criteria for FNPO. Diamanti-Kandarakis andPanidis (2007) similarly found that 90% of Greek women presentingwith hirsutism and menstrual irregularity had PCOM. Kumarapeli et al.(2008) performed a population-based study in Southeast Asia, identify-ing probable PCOS cases by a questionnaire sampling menstrual historyand symptoms of hyperandrogenism. Only 1% of the defined controlpopulation fulfilled diagnostic criteria for PCOS upon clinical evaluationwhile 17.6% meet ultrasound criteria (Kumarapeli et al., 2008). Ofwomen defined as probable cases, 96.7% met ultrasound criteriadefined by Rotterdam criteria (Kumarapeli et al., 2008). An earlierstudy using the Adams criteria for PCOM (Welt et al., 2006) did identify
some ethnic differences, with African American women having higherfollicle counts and OV, but in all ethnicities .90% of women withPCOS showed PCOM on ultrasound examination.
The follicle excess in PCOS is tightly correlated with hyperandrogen-ism and experimental data on animal models (Vendola et al., 1999) orclinical data about female-to-male transsexuals (Baba et al., 2007)suggest that this is a causal relationship (reviewed in Homburg, 2009).
Recently it has been shown by Principal Component Analysis that theFNPO is one item of the androgen component of PCOS having evenbetter sensitivity than serum androgen measurements (Dewailly et al.,2010). Therefore, the presence of PCOM may be regarded as a sign ofhyperandrogenism and the same might apply for elevated serum AMHconcentrations (Dewailly et al., 2010).
The follicle excess and high serum AMH level are also intimately linkedto the ovulation disorder of PCOS (Catteau-Jonard et al., 2012). There-fore some authors propose a simplified diagnostic procedure for PCOS,i.e. oligo- or anovulation in conjunction with hyperandrogenism. In caseone of these criteria was lacking, PCOM and/or a high serum AMH levelcould be used as a substitute for either oligo- or anovulation or hyperan-drogenism, provided other specific disorders have been excluded(Dewailly et al., 2010). This reconciles the above-mentioned two defini-tions for PCOS (The Rotterdam ESHRE/ASRM-sponsored PCOSconsensus workshop group, 2004a, b; Azziz et al., 2006, 2009) thatwere conflicting about requiring or not hyperandrogenism as a manda-tory item.
PCOM in the general populationPCOM is also encountered in the general normal population in as manyas 30% of young women (Dewailly et al., 2010; Villarroel et al., 2011). Ac-tually, this figure is even higher if one applies the former FNPO ≥12threshold when using modern ultrasound equipment, such as in recentseries (Table I and Fig. 2). The relevance of this issue has been discussedabove.
Taken as a whole, most series showed that PCOM in adult premeno-pausal healthy women was not related to metabolic variables (seebelow), although their serum AMH and androgen concentrations wereoften slightly higher than those of women without PCOM (reviewed inJohnstone et al., 2010).
This does not mean, however, that every clinically normal woman withPCOM has an occult androgen excess disorder. This issue wasaddressedby Mortensen et al. (2009) who compared 32 asymptomatic volunteerswith PCOM to 21 similar volunteers showing normal ovaries on ultra-sound. The PCOM subjects showed variable response to GnRHagonist, ACTH and oral glucose testing. Of the women in the PCOMgroup, 47% showed a GnRH agonist response like that observed inpatients with PCOS, and 25% had elevated free testosterone of whoma third had an abnormal GnRH agonist response (Mortensen et al.,2009). It therefore seems as if PCOM formed a distinct but heteroge-neous population with respect to ovarian function, ranging fromnormal (53%) to occult PCOS (25%). However, these conclusionswere derived from the results of androgen testing whose specificityand sensitivity were not evaluated according to specific thresholds. Toavoid such a subjective bias, cluster analysis was recently used toisolate homogenous subgroups within a control population (Dewaillyet al., 2011). Two subgroups were yielded by the analysis, and the clus-tering was primarily based on the serum AMH level and then FNPO and
Polycystic ovarian morphology 345
at Cornell U
niversity Library on June 12, 2015
http://humupd.oxfordjournals.org/
Dow
nloaded from
OV. The subgroup with the highest values for these parameters repre-sented most likely control patients with PCOM (37% in this study) andwas mathematically homogeneous, as was the other subgroup with nomarker of PCOM.
The question thus arises as to whether asymptomatic women withPCOM constitute a heterogeneous population in terms of ovarian dys-function ranging from entirely healthy ovulatory women to womenwith mild occult PCOS (Mortensen et al., 2009) or, alternatively, consti-tute a homogenous population representing the milder end of the PCOSspectrum (Ng et al., 2006; Catteau-Jonard et al., 2012). This alternativehypothesis is not supported by the single study available that addressesthe follow-up of normal adult women presenting with PCOM. Indeed,PCOM did not predict the future development of PCOS, and evenwithin PCOS patients, not all women meeting PCOM criteria at baselinefulfilled such criteria later in life (Murphy et al., 2006). However, the pu-tative predictive value of PCOM for the future development of PCOS inyoung women has still to be evaluated, as the mean ages at baseline andfollow-up visits were 28 and 38, respectively. The finding that not allwomen diagnosed with PCOS at initial screening maintained such a diag-nosis later in life confirms studies showing that PCOS symptoms, includ-ing PCOM, may improve after the age of 30 (Brown et al., 2011).Therefore, the putative prediction of PCOS by PCOM should be inves-tigated in younger populations than the one used for this study.
To our best knowledge, only one longitudinal study about healthyado-lescent girls is available so far (Codner et al., 2011). PCOM was observedin 40, 35 and 33.3% of the ultrasonography studies prospectively per-formed at 2, 3 and 4 years after menarche, respectively, with a poor con-cordance among girls in the results during the follow-up and noassociation of PCOM with metabolic variables and androgen concentra-tions (Codner et al., 2011). One might question the performance ofultrasound in such a setting as only the transabdominal route wasused. There is no longitudinal data on the potential surrogate ofPCOM, namely increased serum AMH concentrations, which mayprove easier to use in such populations. Lastly, little is known aboutthe impact of a significant increase in weight in a previously normalweight woman with PCOM.
In summary, the actual meaning of PCOM in the asymptomaticgeneral population is unknown at present. Because other symptomsof PCOS including menstrual disturbances and cutaneous signs of an-drogen excess such as acne are very prevalent in the first years aftermenarche, the presence of PCOM in adolescents must be weightedcarefully before making a diagnosis of PCOS based solely on these find-ings. However, because the possibility exists that isolated PCOM maybe a forerunner of ovarian dysfunction in some cases, clinical and pos-sibly ultrasonographic and/or AMH follow-up of these women may bea reasonable approach. Finally, considering the major impact thatage exerts on ovarian follicle count and OV, establishing appropriateage-specific cut-off values for these variables is definitely needed inorder to improve the clinical usefulness of ultrasound evaluation ofPCOM and/or serum AMH determination as criteria for the diagnosisof PCOS.
PCOM in particular situationsWomen undergoing treatment with oral contraceptive pillsA small controlled study showed that oral contraceptive pill (OCP)administration may reduce ovarian size and follicle counts in women
with PCOS and controls (Somunkiran et al., 2007), whereas serumAMH concentrations, being independent from gonadotrophin influence,do not change during such treatment and might be considered a newPCOS marker in patients who are already on contraceptive treatment(Somunkiran et al., 2007). However, a larger study showed that OCPtreatment resulted in no differences in FNPO and OV among womenwith PCOS, even though serum androgens levels were reduced in thepatients who were receiving OCPs and still met criteria for PCOS(Mulders et al., 2005). Giving these conflicting results, ultrasound assess-ment of PCOM should be conducted preferably in women who have notreceived recent treatment with OCPs.
Women with functional hypothalamic anovulationand hyperprolactinaemiaIntriguingly, PCOM has been observed in as many as 30–50% of patientswith functional hypothalamic anovulation (FHA), a situation where theserum LH and insulin levels are low (reviewed in Sum and Warren,2009). However, the definition of PCOM was heterogeneous betweenthese different studies and the populations were small in some ofthem. These data have been recently revisited using cluster analysis(Robin et al., 2012). It turned out that the presence of PCOM inwomen with FHA could have different meanings. More often, it wouldreplicate what is observed in the general population with a similar preva-lence of �30%. In a minority (10%) of cases however, the presence ofPCOM could correspond to women with a pre-existing PCOS that hasbeen ‘switched-off’ by LH and insulin suppression and that could there-fore convert back to PCOS subsequently, as previously suggested byothers (Wang and Lobo, 2008).
A high prevalence of ‘polycystic’ or ‘multifollicular’ ovaries has beenreported in non-PCOS women diagnosed with hyperprolactinaemia(Ardaens et al., 1991). However, the literature is scarce about thisissue and has not been revisited with the new criteria for PCOM. A pos-sible explanation is a fortuitous association between hyperprolactinae-mia and the ‘common’ PCOM of the general population. This isdifferent from the association between genuine PCOS and hyperprolac-tinaemia, where symptoms of PCOS may be ‘switched-off’ by LH sup-pression due to hyperprolactinaemia and resume once prolactin levelsare corrected.
In these situations, there is a risk of misdiagnosing PCOS if the trueorigin of amenorrhoea or oligomenorrhoea were not recognized, asthese patients exhibit two items of the Rotterdam definition forPCOS. It is important to remember that this definition, as well asthose of the NIH and AE-PCOS cited above, cannot be applied ifother specific causes of ovulatory dysfunction and/or hyperandro-genism such as hyperprolactinaemia, nonclassic congenital adrenalhyperplasia or androgen-secreting tumours have not been previouslyruled out.
Polycystic Ovaries as an Indicatorof Ill HealthIt is important to establish whether PCOM on its own has any health con-sequences independent of the other features commonly found in PCOS.The literature is lacking on categorical answers to this question and there-fore less direct approaches are needed.
346 Dewailly et al.
at Cornell U
niversity Library on June 12, 2015
http://humupd.oxfordjournals.org/
Dow
nloaded from
Is there any evidence in healthy women thatPCOM confers risk of ill health?The only incontrovertible circumstance in which PCOM has been shownto be potentially dangerous is when a normal woman with PCOMrequires gonadotrophin therapy, for example, as part of in vitro fertiliza-tion treatment (Jayaprakasan et al., 2012). Under these iatrogenic cir-cumstances, the ovary responds to FSH extremely vigorously andthere is a substantial risk of ovarian hyperstimulation syndrome(OHSS) and its attendant side effects. This indicates an extreme sensitiv-ity of the ovary to FSH.
In a clinical study, Hassan and Killick (2003) were unable to show anyimpact of PCOM on time to pregnancy in women with no other symptomsof PCOS. There have been relatively few studies comparing IVF outcomesin patients with PCOM compared with PCOS. Those who have done casecontrol studies indicate pregnancy rates similar to those in women withnormal ovaries or PCOS but an OHSS occurrence similar to that ofpatients with PCOS (Swanton et al., 2010). There is therefore little evi-dence tosuggest the solepresence ofPCOMhas anysignificant risk to sub-sequent health when other symptoms are absent. While the hormonalprofile may be intermediate between normal and PCOS, there is lack ofevidence for significant metabolic consequences.
One of the problems in finding PCOM without PCOS is that in somecountries, health funds penalize individuals who might be construed tohave PCOS on the basis of solitary PCOM. This leads clinicians inthese jurisdictions not to do ultrasounds or to avoid using the Rotterdamcriteria. Solving this problem is not a medical issue but rather a matter ofeducating authorities that set the political and social agenda.
Does PCOM in PCOS confer any extrahealth risk?A number of studies suggest that the presence of PCOM in the diagnosisof PCOS does not seem to affect clinical or metabolic outcomes whenweight and body mass index are taken into consideration (Moran andTeede, 2009). The majority of women with PCOS also have PCOMand a comparison of those with and without PCOM has generallyshown similar glucose tolerance, insulin resistance and lipid profiles.One report suggests that PCOM may increase insulin resistance, butthis was a very small study (Najmabadi et al., 1997). Cardiovascularrisk does not appear to be accentuated by PCOM in PCOS groups(Loucks et al., 2000; Guastella et al., 2010) and, in patients with hyperan-drogenism and anovulation, having PCOM was not associated withhigher insulin or lipid levels (Guastella et al., 2010). In addition, in nor-moandrogenic anovulatory patients with PCOM, insulin levels andinsulin sensitivity were normal (Guastella et al., 2010).
The majority of studies report less adverse metabolic problems forwomen with ovulatory PCOS in whom hyperandrogenism and PCOMare combined. However, these women are generally less obese and,when weight is taken into consideration, there appear to be fewmetabol-ic differences between ovulatory and non-ovulatory women withPCOM. When non-hyperandrogenaemic women with anovulation andPCOM are compared with controls matched for obesity, there is littleevidence for an increased abnormal metabolic profile (Moran andTeede, 2009).
In conclusion, the presence or absence of PCOM does not appear toalter the degree of clinical or metabolic presentation in women withPCOS. PCOM has not been shown to have any significant health
consequences in isolation from other symptoms of PCOS. However,there may be some mild biochemical and hormonal features in normalovulatory non-hyperandrogenic women that might disqualify them ascontrols for comparative studies, as discussed above and below.
Defining PCOM in 2013: WhichGuidelines?Based on the current concern that PCOM may be over-diagnosed whenusing the former FNPO ≥12 threshold, and until we have newerand more accurate markers for PCOM, the Task Force recommendsthe following guidelines.
Guidelines for clinical practiceOn the one hand, assessing PCOM should not be considered mandatoryfor clinical practice. Assessing PCOM is not really useful if the patientalready meets the original 1990 NIH criteria of hyperandrogenism incombination with oligo-anovulation (after excluding specific aetiologies)because PCOM is present in most of these women, as discussed above.Wherein confirmation of PCOM might provide diagnostic confirmation,practitioners should use ultrasound judiciously in light of the negativeconsequences that a diagnosis of PCOM may have on access to careand insurability of patients in some countries. Nevertheless, cliniciansmust be aware that anovulation may indicate other ovarian disorders, in-cluding larger cysts or tumours, and ovarian ultrasound may prove usefulin ruling out such disorders.
On the other hand, in situations of isolated hyperandrogenism oroligo-anovulation, ‘mild’ PCOS is the most likely aetiology, once otherspecific diagnoses have been excluded. Establishing the presence ofPCOM in ultrasound is needed to confirm the diagnosis of PCOS.Using newer ultrasound technology that affords maximal resolution ofovarian follicles (i.e. transducer frequency ≥8 MHz), an FNPO ≥25 isdiagnostic of PCOM. When such precise ultrasound technology is notavailable, older ultrasound systems permit the careful measure of OVthat mayserveas surrogate marker for PCOM,using a≥10 ml threshold.However, this criterion has less sensitivity than FNPO for the diagnosis ofPCOM, as discussed above and shown in Table II.
From a pragmatic point of view, it is not strictly useful to make the dif-ference between mild PCOS and either idiopathic hyperandrogenism oridiopathic WHO type 2 anovulation, respectively, provided other diag-noses have been ruled out (see above). Ignoring PCOM and thusPCOS in these situations does not matter very much since therapeuticmanagement will be the same and no specific follow-up is required forthose mild cases of PCOS (see above).
PCOM is to be expected in a significant number of normo-ovulatorynon-hyperandrogenic women undergoing an infertility work-up (i.e.for tubal or male factor infertility). In these cases the issue is not todefine whether or not these women have PCOM, but actually topredict OHSS if ovarian stimulation is considered. No consensualFNPO or AMH predictive thresholds are available at this time (Broeret al., 2011). Therefore, it is the responsibility of each centre to definein-house values beyond which the risk of OHSS is clinically relevant.
Guidelines for researchResearch requires an exquisite phenotyping of the populations beingstudied, and this issue is especially important in control women. This
Polycystic ovarian morphology 347
at Cornell U
niversity Library on June 12, 2015
http://humupd.oxfordjournals.org/
Dow
nloaded from
has been deeply debated by the expert panel during the preparation ofthis manuscript. All members of the Task Force agreed that, in studiesdealing with mild PCOS cases, PCOM must be included as a criterionfor PCOS, according to well-defined thresholds for FNPO and OV.
However, there was some disagreement regarding how these thresh-olds are established, primarily as to whether or not PCOM should beexcluded a priori from the control populations used to establish suchthresholds.
One of the experts argued that PCOM has been shown to be asso-ciated with subtle ‘PCO-like’ abnormalities, mainly, an increasedserum AMH level (reviewed in Robin et al., 2012), that might pollutecontrol groups. Therefore, if one requires exclusion in case of hyperan-drogenism or oligo-anovulation, it seemed logical to this expert torequire also exclusion of controls presenting solely with the third itemof the Rotterdam classification (i.e. PCOM) inasmuch as excessiveFNPO has been shown to be an index of hyperandrogenism (Dewaillyet al., 2010).
Other experts argued that it is not possible to exclude PCOM fromcontrols without knowing the threshold values to make this exclusion,since these threshold values are exactly what we seek from suchcontrol population. Some studies have proceeded to such exclusion byusing the former FNPO ≥12 threshold (Eilertsen et al., 2012;Homburg et al., 2013). This may have biased the results if newer tech-nologies were used since presumably many controls without PCOMwere excluded. Despite not being optimal, using OV as a surrogate forFNPO might be acceptable since this variable does not appear to beaffected by the age of the ultrasound equipment (Casadei et al., 2013).There is also the possibility of recognizing the subgroup of normalwomen with PCOM without using any threshold by performing clusteranalysis (Dewailly et al., 2011). However, the adequacy of this approachhas to be confirmed by other groups.
The majority of the experts decided that the control populationsshould be constituted of women with normal menstrual cycles and noevidence of hyperandrogenism, regardless of their ovarian morphology.For the FNPO, it was decided to use the 95th percentiles of suchcontrol populations from the most complete recent studies, whichincluded a total of 1127 women aged 18–40 years (Table I). The com-bined 95th percentile of FNPO of all studies was 23 follicles. Note-worthy, this figure is very close to the FNPO ≥25 threshold showingexcellent diagnostic performance as analysed by ROC curve analysis intwo recent studies as described above (Dewailly et al., 2011; Lujanet al., 2013).
Therefore, the Task Force recommends using FNPO ≥25 as the mostappropriate threshold for the diagnosis of PCOM, as this threshold isconsistent with normative data obtained from the general populationand has an excellent diagnostic performance as a surrogate marker ofPCOM. To be valid, the FNPO ≥25 threshold requires the use ofnewer technology that affords maximal resolution of ovarian follicles(i.e. transducer frequency ≥8 MHz), but such equipment are usuallyavailable for research. Real-time methods should follow the standardiza-tion that has been recently proposed for obtaining a follicle count (Broek-mans et al., 2010), with the main difference being to continue to considerfollicle counts per individual ovary and not the sum of both ovaries.Offline methods, with either 2D or 3D ultrasound, must be appliedafter completion of a learning curve. With either technique, observervariability must be evaluated and incorporated into the appropriate sec-tions of manuscripts.
For OV, the Task Force recommends using the former threshold at10 ml since this is very close to the 95th percentile of the 1021 controlwomen described in Table I, although there was more spread with OVthan with FNPO. An OV ≥10 ml threshold should be used with either2D or 3D ultrasound when normative in-house values are not available.Possibly, a higher threshold should be used in adolescents (Carmina et al.,2010) and lower values should be applied to women .40 years old(Carmina et al., 2012) and some European and East-Asian countries(Jonard et al., 2005; Chen et al., 2008; Kosus et al., 2011). Hence, theTask Force recommends that normative data in populations, accordingto the ethnicity, age (adolescent, adult, adult aging women) and thebody weight (lean or obese women), be established. It must be empha-sized however, that OV has been shown consistently to have less diag-nostic potential than FNPO to discriminate between PCOS andcontrols (Table II).
ConclusionsOur main recommendations are summarized in Table IV. We recognizethat new technology is currently modifying previous criteria for PCOMand that the former threshold established for FNPO at the Rotterdamconference is no longer valid. Using an FNPO ≥12 threshold leads tothe over diagnosis of both PCOM and PCOS, especially if FNPO is deter-mined with newer ultrasound technology. On the contrary, the OV≥10 ml threshold remains valid, although this value might be lower orhigher in some specific populations (see above), and has a lower sensitiv-ity compared with FNPO.
Based on recent studies, the Task Force recommends setting the newthreshold for FNPO at ≥25 follicles per ovary and that the threshold forOVremains at≥10 ml. However, there is need for standardization of fol-licle counting techniques and for further validation of the threshold defin-ing follicle excess. Moreover, consideration of the relevance of thesethresholds in diverse populations in terms of age, race and ethnicity iswarranted.
Table IV Main recommendations.
(1) The threshold for FNPO defining PCOM should be ≥25 follicles perwhole ovary.
(a) This threshold applies to use of newer imaging technology(essentially transducer frequency ≥8 MHz),
(b) FNPO is recommended over OV since FNPO has been shown tohave greater predictive power for PCOS and less variability amongpopulations aged 18–35 years
(c) Real-time methods should follow recently proposedstandardization. Offline methods, with either 2D or 3Dultrasound, must be applied after completion of a learning curveand standardization.
(2) The threshold for OV should remain at ≥10 ml.
OV may have a role in instances when image quality does not allow forreliable estimates of FNPO.
(3) The use of the AMH assay as a surrogate to ultrasound is for researchpurpose only at the present time. Only in-house AMH thresholds forPCOM can be used until there is standardization of the assaytechniques.
FNPO, follicle number pre ovary; OV, ovarian volume.
348 Dewailly et al.
at Cornell U
niversity Library on June 12, 2015
http://humupd.oxfordjournals.org/
Dow
nloaded from
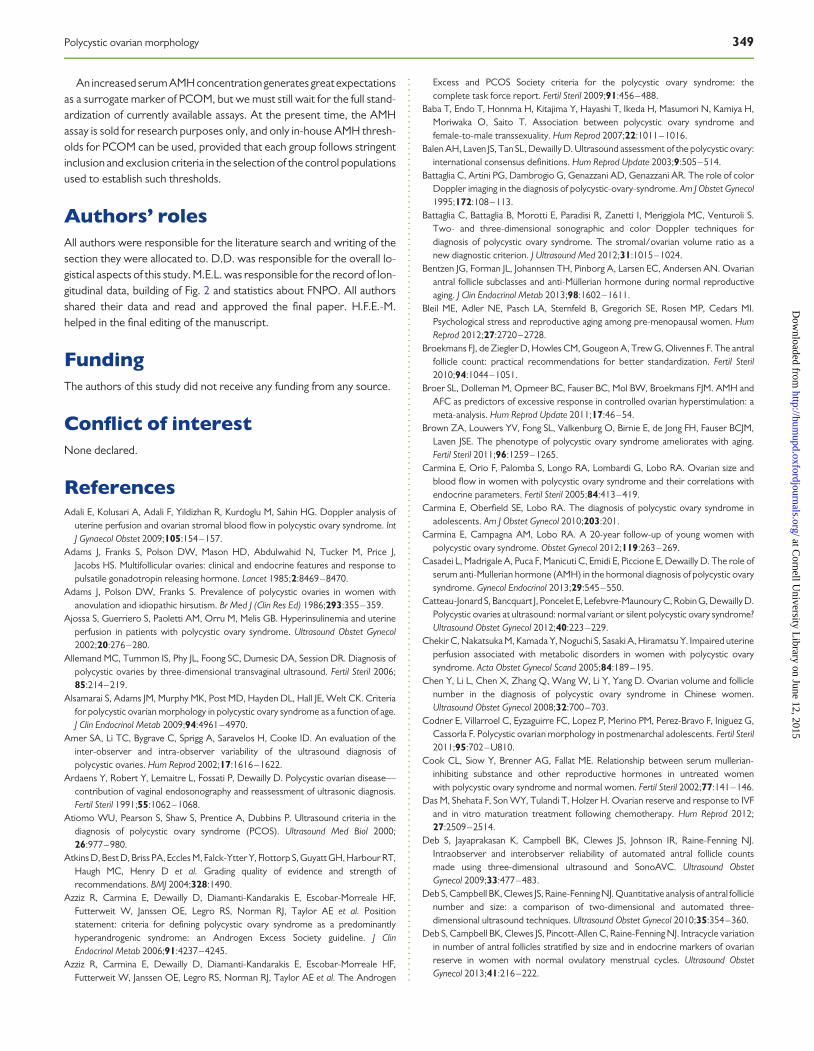
An increased serum AMH concentration generates great expectationsas a surrogate marker of PCOM, but we must still wait for the full stand-ardization of currently available assays. At the present time, the AMHassay is sold for research purposes only, and only in-house AMH thresh-olds for PCOM can be used, provided that each group follows stringentinclusion and exclusion criteria in the selection of the control populationsused to establish such thresholds.
Authors’ rolesAll authors were responsible for the literature search and writing of thesection they were allocated to. D.D. was responsible for the overall lo-gistical aspects of this study. M.E.L. was responsible for the record of lon-gitudinal data, building of Fig. 2 and statistics about FNPO. All authorsshared their data and read and approved the final paper. H.F.E.-M.helped in the final editing of the manuscript.
FundingThe authors of this study did not receive any funding from any source.
Conflict of interestNone declared.
ReferencesAdali E, Kolusari A, Adali F, Yildizhan R, Kurdoglu M, Sahin HG. Doppler analysis of
uterine perfusion and ovarian stromal blood flow in polycystic ovary syndrome. IntJ Gynaecol Obstet 2009;105:154–157.
Adams J, Franks S, Polson DW, Mason HD, Abdulwahid N, Tucker M, Price J,Jacobs HS. Multifollicular ovaries: clinical and endocrine features and response topulsatile gonadotropin releasing hormone. Lancet 1985;2:8469–8470.
Adams J, Polson DW, Franks S. Prevalence of polycystic ovaries in women withanovulation and idiopathic hirsutism. Br Med J (Clin Res Ed) 1986;293:355–359.
Ajossa S, Guerriero S, Paoletti AM, Orru M, Melis GB. Hyperinsulinemia and uterineperfusion in patients with polycystic ovary syndrome. Ultrasound Obstet Gynecol2002;20:276–280.
Allemand MC, Tummon IS, Phy JL, Foong SC, Dumesic DA, Session DR. Diagnosis ofpolycystic ovaries by three-dimensional transvaginal ultrasound. Fertil Steril 2006;85:214–219.
Alsamarai S, Adams JM, Murphy MK, Post MD, Hayden DL, Hall JE, Welt CK. Criteriafor polycystic ovarian morphology in polycystic ovary syndrome as a function of age.J Clin Endocrinol Metab 2009;94:4961–4970.
Amer SA, Li TC, Bygrave C, Sprigg A, Saravelos H, Cooke ID. An evaluation of theinter-observer and intra-observer variability of the ultrasound diagnosis ofpolycystic ovaries. Hum Reprod 2002;17:1616–1622.
Ardaens Y, Robert Y, Lemaitre L, Fossati P, Dewailly D. Polycystic ovarian disease—contribution of vaginal endosonography and reassessment of ultrasonic diagnosis.Fertil Steril 1991;55:1062–1068.
Atiomo WU, Pearson S, Shaw S, Prentice A, Dubbins P. Ultrasound criteria in thediagnosis of polycystic ovary syndrome (PCOS). Ultrasound Med Biol 2000;26:977–980.
Atkins D, Best D, Briss PA, Eccles M, Falck-Ytter Y, Flottorp S, Guyatt GH, Harbour RT,Haugh MC, Henry D et al. Grading quality of evidence and strength ofrecommendations. BMJ 2004;328:1490.
Azziz R, Carmina E, Dewailly D, Diamanti-Kandarakis E, Escobar-Morreale HF,Futterweit W, Janssen OE, Legro RS, Norman RJ, Taylor AE et al. Positionstatement: criteria for defining polycystic ovary syndrome as a predominantlyhyperandrogenic syndrome: an Androgen Excess Society guideline. J ClinEndocrinol Metab 2006;91:4237–4245.
Azziz R, Carmina E, Dewailly D, Diamanti-Kandarakis E, Escobar-Morreale HF,Futterweit W, Janssen OE, Legro RS, Norman RJ, Taylor AE et al. The Androgen
Excess and PCOS Society criteria for the polycystic ovary syndrome: thecomplete task force report. Fertil Steril 2009;91:456–488.
Baba T, Endo T, Honnma H, Kitajima Y, Hayashi T, Ikeda H, Masumori N, Kamiya H,Moriwaka O, Saito T. Association between polycystic ovary syndrome andfemale-to-male transsexuality. Hum Reprod 2007;22:1011–1016.
Balen AH, Laven JS, Tan SL, Dewailly D. Ultrasound assessment of the polycystic ovary:international consensus definitions. Hum Reprod Update 2003;9:505–514.
Battaglia C, Artini PG, Dambrogio G, Genazzani AD, Genazzani AR. The role of colorDoppler imaging in the diagnosis of polycystic-ovary-syndrome. Am J Obstet Gynecol1995;172:108–113.
Battaglia C, Battaglia B, Morotti E, Paradisi R, Zanetti I, Meriggiola MC, Venturoli S.Two- and three-dimensional sonographic and color Doppler techniques fordiagnosis of polycystic ovary syndrome. The stromal/ovarian volume ratio as anew diagnostic criterion. J Ultrasound Med 2012;31:1015–1024.
Bentzen JG, Forman JL, Johannsen TH, Pinborg A, Larsen EC, Andersen AN. Ovarianantral follicle subclasses and anti-Mullerian hormone during normal reproductiveaging. J Clin Endocrinol Metab 2013;98:1602–1611.
Bleil ME, Adler NE, Pasch LA, Sternfeld B, Gregorich SE, Rosen MP, Cedars MI.Psychological stress and reproductive aging among pre-menopausal women. HumReprod 2012;27:2720–2728.
Broekmans FJ, de Ziegler D, Howles CM, Gougeon A, Trew G, Olivennes F. The antralfollicle count: practical recommendations for better standardization. Fertil Steril2010;94:1044–1051.
Broer SL, Dolleman M, Opmeer BC, Fauser BC, Mol BW, Broekmans FJM. AMH andAFC as predictors of excessive response in controlled ovarian hyperstimulation: ameta-analysis. Hum Reprod Update 2011;17:46–54.
Brown ZA, Louwers YV, Fong SL, Valkenburg O, Birnie E, de Jong FH, Fauser BCJM,Laven JSE. The phenotype of polycystic ovary syndrome ameliorates with aging.Fertil Steril 2011;96:1259–1265.
Carmina E, Orio F, Palomba S, Longo RA, Lombardi G, Lobo RA. Ovarian size andblood flow in women with polycystic ovary syndrome and their correlations withendocrine parameters. Fertil Steril 2005;84:413–419.
Carmina E, Oberfield SE, Lobo RA. The diagnosis of polycystic ovary syndrome inadolescents. Am J Obstet Gynecol 2010;203:201.
Carmina E, Campagna AM, Lobo RA. A 20-year follow-up of young women withpolycystic ovary syndrome. Obstet Gynecol 2012;119:263–269.
Casadei L, Madrigale A, Puca F, Manicuti C, Emidi E, Piccione E, Dewailly D. The role ofserum anti-Mullerian hormone (AMH) in the hormonal diagnosis of polycystic ovarysyndrome. Gynecol Endocrinol 2013;29:545–550.
Catteau-Jonard S, Bancquart J, Poncelet E, Lefebvre-Maunoury C, Robin G, Dewailly D.Polycystic ovaries at ultrasound: normal variant or silent polycystic ovary syndrome?Ultrasound Obstet Gynecol 2012;40:223–229.
Chekir C, Nakatsuka M, Kamada Y, Noguchi S, Sasaki A, Hiramatsu Y. Impaired uterineperfusion associated with metabolic disorders in women with polycystic ovarysyndrome. Acta Obstet Gynecol Scand 2005;84:189–195.
Chen Y, Li L, Chen X, Zhang Q, Wang W, Li Y, Yang D. Ovarian volume and folliclenumber in the diagnosis of polycystic ovary syndrome in Chinese women.Ultrasound Obstet Gynecol 2008;32:700–703.
Codner E, Villarroel C, Eyzaguirre FC, Lopez P, Merino PM, Perez-Bravo F, Iniguez G,Cassorla F. Polycystic ovarian morphology in postmenarchal adolescents. Fertil Steril2011;95:702–U810.
Cook CL, Siow Y, Brenner AG, Fallat ME. Relationship between serum mullerian-inhibiting substance and other reproductive hormones in untreated womenwith polycystic ovary syndrome and normal women. Fertil Steril 2002;77:141–146.
Das M, Shehata F, Son WY, Tulandi T, Holzer H. Ovarian reserve and response to IVFand in vitro maturation treatment following chemotherapy. Hum Reprod 2012;27:2509–2514.
Deb S, Jayaprakasan K, Campbell BK, Clewes JS, Johnson IR, Raine-Fenning NJ.Intraobserver and interobserver reliability of automated antral follicle countsmade using three-dimensional ultrasound and SonoAVC. Ultrasound ObstetGynecol 2009;33:477–483.
Deb S, Campbell BK, Clewes JS, Raine-Fenning NJ. Quantitative analysis of antral folliclenumber and size: a comparison of two-dimensional and automated three-dimensional ultrasound techniques. Ultrasound Obstet Gynecol 2010;35:354–360.
Deb S, Campbell BK, Clewes JS, Pincott-Allen C, Raine-Fenning NJ. Intracycle variationin number of antral follicles stratified by size and in endocrine markers of ovarianreserve in women with normal ovulatory menstrual cycles. Ultrasound ObstetGynecol 2013;41:216–222.
Polycystic ovarian morphology 349
at Cornell U
niversity Library on June 12, 2015
http://humupd.oxfordjournals.org/
Dow
nloaded from
Dewailly D, Pigny P, Soudan B, Catteau-Jonard S, Decanter C, Poncelet E, Duhamel A.Reconciling the definitions of polycystic ovary syndrome: the ovarian follicle numberand serum anti-Mullerian hormone concentrations aggregate with the markers ofhyperandrogenism. J Clin Endocrinol Metab 2010;95:4399–4405.
Dewailly D, Gronier H, Poncelet E, Robin G, Leroy M, Pigny P, Duhamel A,Catteau-Jonard S. Diagnosis of polycystic ovary syndrome (PCOS): revisiting thethreshold values of follicle count on ultrasound and of the serum AMH level forthe definition of polycystic ovaries. Hum Reprod 2011;26:3123–3129.
Diamanti-Kandarakis E, Panidis D. Unravelling the phenotypic map of polycystic ovarysyndrome (PCOS): a prospective study of 634 women with PCOS. Clin Endocrinol(Oxf) 2007;67:735–742.
Duijkers IJM, Klipping C. Polycystic ovaries, as defined by the 2003 Rotterdamconsensus criteria, are found to be very common in young healthy women.Gynecol Endocrinol 2010;26:152–160.
Eilertsen TB, Vanky E, Carlsen SM. Anti-Mullerian hormone in the diagnosis ofpolycystic ovary syndrome: can morphologic description be replaced? Hum Reprod2012;27:2494–2502.
Fox R. Transvaginal ultrasound appearances of the ovary in normal women and hirsutewomen with oligomenorrhoea. Aust N Z J Obstet Gynaecol 1999;39:63–68.
Fox R, Hull M. Ultrasound diagnosis of polycystic ovaries. Ann N Y Acad Sci 1993;687:217–223.
Fulghesu AM, Angioni S, Frau E, Belosi C, Apa R, Mioni R, Xamin N, Capobianco GP,Dessole S, Fruzzetti F et al. Ultrasound in polycystic ovary syndrome—themeasuring of ovarian stroma and relationship with circulating androgens: results ofa multicentric study. Hum Reprod 2007;22:2501–2508.
Garel L, Dubois J, Grignon A, Filiatrault D, Van Vliet G. US of the pediatric female pelvis:a clinical perspective. Radiographics 2001;21:1393–1407.
Govind A, Obhrai MS, Clayton RN. Polycystic ovaries are inherited as an autosomaldominant trait: Analysis of 29 polycystic ovary syndrome and 10 control families.J Clin Endocrinol Metab 1999;84:38–43.
Guastella E, Longo RA, Carmina E. Clinical and endocrine characteristics of the mainpolycystic ovary syndrome phenotypes. Fertil Steril 2010;94:2197–2201.
Hart R, Doherty DA, Norman RJ, Franks S, Dickinson JE, Hickey M, Sloboda DM. Serumantimullerian hormone (AMH) levels are elevated in adolescent girls with polycysticovaries and the polycystic ovarian syndrome (PCOS). Fertil Steril 2010;94:1118–1121.
Hassan MAM, Killick SR. Ultrasound diagnosis of polycystic ovaries in women who haveno symptoms of polycystic ovary syndrome is not associated with subfecundity orsubfertility. Fertil Steril 2003;80:966–975.
Homburg R. Androgen circle of polycystic ovary syndrome. Hum Reprod 2009;24:1548–1555.
Homburg R, Ray A, Bhide P, Gudi A, Shah A, Timms P, Grayson K. The relationship ofserum anti-Mullerian hormone with polycystic ovarian morphology and polycysticovary syndrome: a prospective cohort study. Hum Reprod 2013;28:1077–1083.
Hughesdon PE. Morphology and morphogenesis of the Stein-Leventhal ovary and ofso-called ‘hyperthecosis’. Obstet Gynecol Surv 1982;37:59–77.
Iliodromiti S, Kelsey TW, Anderson RA, Nelson SM. Can anti-Mullerian hormone predictthe diagnosis of polycystic ovary syndrome? A systematic review and meta-analysis ofextracted data. J Clin Endocrinol Metab 2013. doi: 10.1210/jc.2013-1393.
Isik S, Ozcan HN, Ozuguz U, Tutuncu YA, Berker D, Alimli AG, Akbaba G,Karademir MA, Guler S. Evaluation of ovarian reserve based on hormonalparameters, ovarian volume, and antral follicle count in women with type 2diabetes mellitus. J Clin Endocrinol Metab 2012;97:261–269.
Jarvela IY, Sladkevicius P, Tekay AH, Campbell S, Nargund G. Intraobserver andinterobserver variability of ovarian volume, gray-scale and color flow indicesobtained using transvaginal three-dimensional power Doppler ultrasonography.Ultrasound Obstet Gynecol 2003;21:277–282.
Jayaprakasan K, Walker KF, Clewes JS, Johnson IR, Raine-Fenning NJ. The interobserverreliability of off-line antral follicle counts made from stored three-dimensionalultrasound data: a comparative study of different measurement techniques.Ultrasound Obstet Gynecol 2007;29:335–341.
Jayaprakasan K, Chan Y, Islam R, Haoula Z, Hopkisson J, Coomarasamy A, Raine-Fenning N. Prediction of in vitro fertilization outcome at different antral follicle countthresholds in a prospective cohort of 1,012 women. Fertil Steril 2012;98:657–663.
Johnson TRB, Kaplan LK, Ouyang P, Rizza RA. Evidence-Based Methodology Workshop onPolycystic Ovary Syndrome. Bethesda, Maryland: National Institutes of Health, 2012.
Johnstone EB, Rosen MP, Neril R, Trevithick D, Sternfeld B, Murphy R,Addauan-Andersen C, McConnell D, Reijo Pera R, Cedars MI. The polycystic
ovary post-Rotterdam: a common, age-dependent finding in ovulatory womenwithout metabolic significance. J Clin Endocrinol Metab 2010;95:4965–4972.
Jokubkiene L, Sladkevicius P, Valentin L. Number of antral follicles, ovarian volume, andvascular indices in asymptomatic women 20 to 39 years old as assessed by3-dimensional sonography: a prospective cross-sectional study. J Ultrasound Med2012;31:1635–1649.
Jonard S, Robert Y, Cortet-Rudelli C, Pigny P, Decanter C, Dewailly D. Ultrasoundexamination of polycystic ovaries: is it worth counting the follicles? Hum Reprod2003;18:598–603.
Jonard S, Robert Y, Dewailly D. Revisiting the ovarian volume as a diagnostic criterionfor polycystic ovaries. Hum Reprod 2005;20:2893–2898.
Keskin U, Duru NK, Ercan CM, Dede M, Yenen MC, Ergun A. Changes in the ovarianstromal blood flow in patients treated with laparoscopic salpingostomy for ectopicpregnancy. J Obstet Gynaecol 2013;33:399–402.
Kline J, Kinney A, Kelly A, Reuss ML, Levin B. Predictors of antral follicle count during thereproductive years. Hum Reprod 2005;20:2179–2189.
Knauff EA, Eijkemans MJ, Lambalk CB, ten Kate-Booij MJ, Hoek A, Beerendonk CC,Laven JS, Goverde AJ, Broekmans FJ, Themmen AP et al. Anti-Mullerian hormone,inhibin B, and antral follicle count in young women with ovarian failure. J ClinEndocrinol Metab 2009;94:786–792.
Kosus N, Kosus A, Turhan NO, Kamalak Z. Do threshold values of ovarian volumeand follicle number for diagnosing polycystic ovarian syndrome in Turkishwomen differ from western countries? Eur J Obstet Gynecol Reprod Biol 2011;154:177–181.
Kristensen SL, Ramlau-Hansen CH, Ernst E, Olsen SF, Bonde JP, Vested A, Toft G. Avery large proportion of young Danish women have polycystic ovaries: is arevision of the Rotterdam criteria needed? Hum Reprod 2010;25:3117–3122.
Kristensen SL, Ramlau-Hansen CH, Andersen CY, Ernst E, Olsen SF, Bonde JP,Vested A, Toft G. The association between circulating levels of antimullerianhormone and follicle number, androgens, and menstrual cycle characteristics inyoung women. Fertil Steril 2012;97:779–785.
Kumarapeli V, Seneviratne RD, Wijeyaratne CN, Yapa RMSC, Dodampahala SH. Asimple screening approach for assessing community prevalence and phenotype ofpolycystic ovary syndrome in a semiurban population in Sri Lanka. Am J Epidemiol2008;168:321–328.
Lam PM, Johnson IR, Raine-Fenning NJ. Three-dimensional ultrasound features of thepolycystic ovary and the effect of different phenotypic expressions on theseparameters. Hum Reprod 2007;22:3116–3123.
Lam P, Raine-Fenning N, Cheung L, Haines C. Three-dimensional ultrasoundfeatures of the polycystic ovary in Chinese women. Ultrasound Obstet Gynecol2009;34:196–200.
La Marca A, Spada E, Sighinolfi G, Argento C, Tirelli A, Giulini S, Milani S, Volpe A.Age-specific nomogram for the decline in antral follicle count throughout thereproductive period. Fertil Steril 2011;95:684–688.
Lamazou F, Arbo E, Salama S, Grynberg M, Frydman R, Fanchin R. Reliability ofautomated volumetric measurement of multiple growing follicles in controlledovarian hyperstimulation. Fertil Steril 2010;94:2172–2176.
Laven JSE, Mulders AGMGJ, Visser JA, Themmen AP, De Jong FH, Fauser BCJM.Anti-Mullerian hormone serum concentrations in normoovulatory and anovu-latory women of reproductive age. J Clin Endocrinol Metab 2004;89:318–323.
Legro RS, Brzyski RG, Diamond MP, Coutifaris C, Schlaff WD, Alvero R, Casson P,Christman GM, Huang H, Yan Q et al.; for the National Institute of Child Healthand Human Development Reproductive Medicine Network. The Pregnancy inPolycystic Ovary Syndrome II study: baseline characteristics and effects of obesityfrom a multicenter randomized clinical trial. Fertil Steril 2013 Oct 21. (Epub aheadof print)
Lin YH, Chiu WC, Wu CH, Tzeng CR, Hsu CS, Hsu MI. Antimullerian hormone andpolycystic ovary syndrome. Fertil Steril 2011;96:230–235.
Loucks TL, Talbott EO, McHugh KP, Keelan M, Berga SL, Guzick DS. Dopolycystic-appearing ovaries affect the risk of cardiovascular disease amongwomen with polycystic ovary syndrome? Fertil Steril 2000;74:547–552.
Loverro G, Vicino M, Lorusso F, Vimercati A, Greco P, Selvaggi L. Polycystic ovarysyndrome: relationship between insulin sensitivity, sex hormone levels and ovarianstromal blood flow. Gynecol Endocrinol 2001;15:142–149.
Lujan ME, Chizen DR, Peppin AK, Kriegler S, Leswick DA, Blotski TG, Pierson RA.Improving inter-observer variability in the evaluation of ultrasonographic featuresof polycystic ovaries. Reprod Biol Endocrinol 2008;6:30–41.
350 Dewailly et al.
at Cornell U
niversity Library on June 12, 2015
http://humupd.oxfordjournals.org/
Dow
nloaded from
Lujan ME, Chizen DR, Peppin AK, Dhir A, Pierson RA. Assessment of ultrasonographicfeatures of polycystic ovaries is associated with modest levels of inter-observeragreement. J Ovarian Res 2009;2:6.
Lujan ME, Brooks ED, Kepley AL, Chizen DR, Pierson RA, Peppin AK. Grid analysisimproves reliability in follicle counts made by ultrasonography in women withpolycystic ovary syndrome. Ultrasound Med Biol 2010;36:712–718.
Lujan ME, Jarrett BY, Brooks ED, Reines JK, Peppin AK, Muhn N, Haider E, Pierson RA,Chizen DR. Updated ultrasound criteria for polycystic ovary syndrome: reliablethresholds for elevated follicle population and ovarian volume. Hum Reprod 2013;28:1361–1368.
Merce LT, Gomez B, Engels V, Bau S, Bajo JM. Intraobserver and interobserverreproducibility of ovarian volume, antral follicle count, and vascularity indicesobtained with transvaginal 3-dimensional ultrasonography, power Dopplerangiography, and the virtual organ computer-aided analysis imaging program.J Ultrasound Med 2005;24:1279–1287.
Moran L, Teede H. Metabolic features of the reproductive phenotypes of polycysticovary syndrome. Hum Reprod Update 2009;15:477–488.
Mortensen M, Ehrmann DA, Littlejohn E, Rosenfield RL. Asymptomatic volunteers witha polycystic ovary are a functionally distinct but heterogeneous population. J ClinEndocrinol Metab 2009;94:1579–1586.
Mulders AG, ten Kate-Booij M, Pal R, De Kruif M, Nekrui L, Oostra BA, Fauser BC,Laven JS. Influence of oral contraceptive pills on phenotype expression inwomen with polycystic ovary syndrome. Reprod Biomed Online 2005;11:690–696.
Murphy MK, Hall JE, Adams JM, Lee H, Welt CK. Polycystic ovarian morphology innormal women does not predict the development of polycystic ovary syndrome.J Clin Endocrinol Metab 2006;91:3878–3884.
Najmabadi S, Wilcox JG, Acacio BD, Thornton MH, Kolb BA, Paulson RJ. Thesignificance of polycystic-appearing ovaries versus normal-appearing ovaries inpatients with polycystic ovary syndrome. Fertil Steril 1997;67:631–635.
Nelson SM, La Marca A. The journey from the old to the new AMH assay: how to avoidgetting lost in the values. Reprod Biomed Online 2011;23:411–420.
Ng EHY, Chan CCW, Yeung WSB, Ho PC. Comparison of ovarian stromal blood flowbetween fertile women with normal ovaries and infertile women with polycysticovary syndrome. Hum Reprod 2005;20:1881–1886.
Ng EHY, Chan CCW, Ho PC. Are there differences in ultrasound parameters betweenChinese women with polycystic ovaries only and with polycystic ovary syndrome?Eur J Obstet Gynecol Reprod Biol 2006;125:92–98.
Pache TD, Wladimiroff JW, Hop WC, Fauser BC. How to discriminate be-tween normal and polycystic ovaries: transvaginal US study. Radiology 1992;183:421–423.
Pascual MA, Graupera B, Hereter L, Tresserra F, Rodriguez I, Alcazar JL. Assessment ofovarian vascularization in the polycystic ovary by three-dimensional power Dopplerultrasonography. Gynecol Endocrinol 2008;24:631–636.
Pavlik EJ, DePriest PD, Gallion HH, Ueland FR, Reedy MB, Kryscio RJ, van Nagell JR.Ovarian volume related to age. Gynecol Oncol 2000;77:410–412.
Pellatt L, Rice S, Mason HD. Anti-Mullerian hormone and polycystic ovary syndrome: amountain too high? Reproduction 2010;139:825–833.
Pigny P, Merlen E, Robert Y, Cortet-Rudelli C, Decanter C, Jonard S, Dewailly D.Elevated serum level of anti-mullerian hormone in patients with polycystic ovarysyndrome: relationship to the ovarian follicle excess and to the follicular arrest.J Clin Endocrinol Metab 2003;88:5957–5962.
Pigny P, Jonard S, Robert Y, Dewailly D. Serum anti-Mullerian hormone as a surrogatefor antral follicle count for definition of the polycystic ovary syndrome. J ClinEndocrinol Metab 2006;91:941–945.
Piltonen T, Morin-Papunen L, Koivunen R, Perheentupa A, Ruokonen A, Tapanainen JS.Serum anti-Mullerian hormone levels remain high until late reproductive age anddecrease during metformin therapy in women with polycystic ovary syndrome.Hum Reprod 2005;20:1820–1826.
Raine-Fenning NJ, Campbell BK, Clewes JS, Johnson IR. The interobserver reliability ofovarian volume measurement is improved with three-dimensional ultrasound, butdependent upon technique. Ultrasound Med Biol 2003;29:1685–1690.
Raine-Fenning NJ, Campbell BK, Clewes JS, Kendall NR, Johnson IR. The interobserverreliability of three-dimensional power Doppler data acquisition within the femalepelvis. Ultrasound Obstet Gynecol 2004;23:501–508.
Raine-Fenning N, Jayaprakasan K, Clewes J, Joergner I, Bonaki SD, Chamberlain S,Devlin L, Priddle H, Johnson I. SonoAVC: a novel method of automatic volumecalculation. Ultrasound Obstet Gynecol 2008;31:691–696.
Robin G, Gallo C, Catteau-Jonard S, Lefebvre-Maunoury C, Pigny P, Duhamel A,Dewailly D. Polycystic ovary-like abnormalities (PCO-L) in women with functionalhypothalamic amenorrhea. J Clin Endocrinol Metab 2012;97:4236–4243.
Rosen MP, Sternfeld B, Schuh-Huerta SM, Reijo Pera RA, McCulloch CE, Cedars MI.Antral follicle count: absence of significant midlife decline. Fertil Steril 2010;94:2182–2185.
Rustamov O, Smith A, Roberts SA, Yates AP, Fitzgerald C, Krishnan M, Nardo LG,Pemberton PW. Anti-Mullerian hormone: poor assay reproducibility in a largecohort of subjects suggests sample instability. Hum Reprod 2012;27:3085–3091.
Salama S, Arbo E, Lamazou F, Levaillant JM, Frydman R, Fanchin R. Reproducibility andreliabilityof automated volumetric measurement of single preovulatory follicles usingSonoAVC. Fertil Steril 2010;93:2069–2073.
Saxton DW, Farquhar CM, Rae T, Beard RW, Anderson MC, Wadsworth J. Accuracyof ultrasound measurements of female pelvic organs. Br J Obstet Gynaecol 1990;97:695–699.
Scheffer GJ, Broekmans FJM, Bancsi LF, Habbema JDF, Te Velde ER. Quantitativetransvaginal two- and three-dimensional sonography of the ovaries: reproducibilityof antral follicle counts. Ultrasound Obstet Gynecol 2002;20:270–275.
Somunkiran A, Yavuz T, Yucel O, Ozdemir I. Anti-Mullerian hormone levels duringhormonal contraception in women with polycystic ovary syndrome. Eur J ObstetGynecol Reprod Biol 2007;134:196–201.
Stein IF, Leventhal ML. Amenorrhea associated with bilateral polycystic ovaries. Am JObstet Gynecol 1935;29:181–191.
Steinberg HO, Brechtel G, Johnson A, Fineberg N, Baron AD. Insulin-mediatedskeletal-muscle vasodilation is nitric-oxide dependent—a novel action of insulin toincrease nitric-oxide release. J Clin Invest 1994;94:1172–1179.
Sum M, Warren MP. Hypothalamic amenorrhea in young women with underlyingpolycystic ovary syndrome. Fertil Steril 2009;92:2106–2108.
Sun L, Fu QZ. Three-dimensional transrectal ultrasonography in adolescent patientswith polycystic ovarian syndrome. Int J Gynaecol Obstet 2007;98:34–38.
Swanton A, Storey L, McVeigh E, Child T. IVF outcome in women with PCOS, PCO andnormal ovarian morphology. Eur J Obstet Gynecol Reprod Biol 2010;149:68–71.
Swiglo BA, Murad MH, Schunemann HJ, Kunz R, Vigersky RA, Guyatt GH,Montori VM. A case for clarity, consistency, and helpfulness: state-of-the-artclinical practice guidelines in endocrinology using the grading of recommendations,assessment, development, and evaluation system. J Clin Endocrinol Metab 2008;93:666–673.
Takahashi K, Ozaki T, Okada M, Uchida A, Kitao M. Relationship betweenultrasonography and histopathological changes in polycystic ovarian syndrome.Hum Reprod 1994;9:2255–2258.
The Rotterdam ESHRE/ASRM-sponsored PCOS consensus workshop group. Revised2003 consensus on diagnostic criteria and long-term health risks related to polycysticovary syndrome (PCOS). Hum Reprod 2004a;19:41–47.
The Rotterdam ESHRE/ASRM-Sponsored PCOS Consensus Workshop Group.Revised 2003 consensus on diagnostic criteria and long-term health risks relatedto polycystic ovary syndrome. Fertil Steril 2004b;81:19–25.
van Rooij IA, Tonkelaar I, Broekmans FJ, Looman CW, Scheffer GJ, de Jong FH,Themmen AP, te Velde ER. Anti-mullerian hormone is a promising predictor forthe occurrence of the menopausal transition. Menopause 2004;11:601–606.
Vendola K, Zhou J, Wang J, Bondy CA. Androgens promote insulin-like growth factor-Iand insulin-like growth factor-I receptor gene expression in the primate ovary. HumReprod 1999;14:2328–2332.
Villarroel C, Merino PM, Lopez P, Eyzaguirre FC, Van Velzen A, Iniguez G, Codner E.Polycystic ovarian morphology in adolescents with regular menstrual cyclesis associated with elevated anti-Mullerian hormone. Hum Reprod 2011;26:2861–2868.
Wang JG, Lobo RA. The complex relationship between hypothalamic amenorrhea andpolycystic ovary syndrome. J Clin Endocrinol Metab 2008;93:1394–1397.
Weenen C, Laven JS, Von Bergh AR, Cranfield M, Groome NP, Visser JA, Kramer P,Fauser BC, Themmen AP. Anti-Mullerian hormone expression pattern in thehuman ovary: potential implications for initial and cyclic follicle recruitment. MolHum Reprod 2004;10:77–83.
Weerakiet S, Lertvikool S, Tingthanatikul Y, Wansumrith S, Leelaphiwat S, Jultanmas R.Ovarian reserve in women with polycystic ovary syndrome who underwentlaparoscopic ovarian drilling. Gynecol Endocrinol 2007;23:455–460.
Well D, Yang H, Houseni M, Iruvuri S, Alzeair S, Sansovini M, Wintering N, Alavi A,Torigian DA. Age-related structural and metabolic changes in the pelvicreproductive end organs. Semin Nucl Med 2007;37:173–184.
Polycystic ovarian morphology 351
at Cornell U
niversity Library on June 12, 2015
http://humupd.oxfordjournals.org/
Dow
nloaded from
Welt CK, Arason G, Gudmundsson JA, Adams J, Palsdottir H, Gudlaugsdottir G,Ingadottir G, Crowley WF. Defining constant versus variable phenotypic featuresof women with polycystic ovary syndrome using different ethnic groups andpopulations. J Clin Endocrinol Metab 2006;91:4361–4368.
Woo HY, Kim KH, Rhee EJ, Park H, Lee MK. Differences of the association ofanti-Mullerian hormone with clinical or biochemical characteristics betweenwomen with and without polycystic ovary syndrome. Endocr J 2012;59:781–790.
Yeh HC, Futterweit W, Thornton JC. Polycystic ovarian disease: US features in 104patients. Radiology 1987;163:111–116.
Younis JS, Jadaon JE, Haddad S, Izhaki I, Ben-Ami M. Prospective evaluation ofbasal stromal Doppler studies in women with good ovarian reserve andinfertility undergoing in vitro fertilization-embryo transfer treatment: patients
with polycystic ovary syndrome versus ovulatory patients. Fertil Steril 2011;95:1754–1758.
Zaidi J, Campbell S, Pittrof R, Kyeimensah A, Shaker A, Jacobs HS, Tan SL. Ovarianstromal blood-flow in women with polycystic ovaries—a possible new marker fordiagnosis. Hum Reprod 1995;10:1992–1996.
Zawadzki JA, Dunaif A. Diagnostic criteria for polycystic ovary syndrome: towards arational approach. In: Dunaif A, Givens JR, Haseltine FP, Merriam GR (eds).Polycystic Ovary Syndrome. Boston: Blackwell Scientific, 1992, 377–384.
Zhang H, Guo C, Zhu F, Qu P, Lin W, Xiong J. Clinical characteristics,metabolic features, and phenotype of Chinese women with polycystic ovarysyndrome: a large-scale case–control study. Arch Gynecol Obstet 2013;287:525–531.
352 Dewailly et al.
at Cornell U
niversity Library on June 12, 2015
http://humupd.oxfordjournals.org/
Dow
nloaded from