deeply cooled and temperature controlled microjets: liquid
TRANSCRIPT
AIP/123-QED
Deeply Cooled and Temperature Controlled Microjets: Liquid Ammonia
Solutions Released into Vacuum for Analysis by Photoelectron Spectroscopy.
Tillmann Buttersack∗
Institute of Organic Chemistry and Biochemistry,
Czech Academy of Sciences, Flemingovo nam. 2,
16610 Prague 6, Czech Republic and
Department of Chemistry, University of Southern California, Los Angeles, CA 90089-0482, USA
Philip E. Mason and Pavel Jungwirth
Institute of Organic Chemistry and Biochemistry, Czech Academy of Sciences,
Flemingovo nam. 2, 16610 Prague 6, Czech Republic
H. Christian Schewe and Bernd Winter
Fritz-Haber-Institut der Max-Planck-Gesellschaft,
Molekülphysik, Faradayweg 4–6, 14195 Berlin, Germany
Robert Seidel
Helmholtz-Zentrum Berlin für Materialien und Energie,
Albert-Einstein-Straße 15, 12489 Berlin,
Germany and Humboldt-Universität zu Berlin, Department of Chemistry,
Brook-Taylor-Straße 2, 12489 Berlin, Germany
Ryan S. McMullen and Stephen E. Bradforth
Department of Chemistry, University of Southern California, Los Angeles, CA 90089-0482, USA
(Dated: February 25, 2020)
1

Abstract
A versatile, temperature controlled apparatus is presented, which generates deeply cooled liquid microjets
of condensed gases, expelling them via a small aperture into vacuum for use in photoelectron spectroscopy
(PES). The functionality of the design is demonstrated by temperature and concentration dependent PES
measurements of liquid ammonia and solutions of KI and NH4I in liquid ammonia. The experimental setup
is not limited to the usage of liquid ammonia solutions solely.
2

I. INTRODUCTION
Since its introduction about 20 years ago the vacuum-based liquid microjet (LJ) technology has
evolved as a powerful tool for exploring the electronic structure of liquid, mostly aqueous solu-
tion, by photoelectron spectroscopy (PES).[1–13] Also, other measurement techniques (e.g. elec-
trospray ionization in mass spectroscopy, X-ray emission or Raman scattering) benefit from the
development of liquid microjets.[13–20] LJ-PES has primarily been used to investigate the proper-
ties of water and aqueous solutions, starting with the measurement of the full valence photoelectron
spectrum from pure water and followed by studies of orbital energies of dissolved molecules and
ions.[2–5] Meanwhile, other experimentalists have produced cryogenic liquid microjets of non-
polar gases (nitrogen, argon, hydrogen, methane).[21–27] However, for PES – where studying the
effects of solvation environments of varying polarity on solutes is of interest – a more versatile
apparatus is required.
For our purposes, we aimed at investigating pure liquid ammonia and liquid ammonia with dis-
solved solutes. Since ammonia is a liquid between 196 K and 240 K (vapor pressure between 0.06
and 1 bar),[28] an additional technical challenge is the ability to stabilize the setup at variable tem-
peratures with a reliable and fast-responding temperature control system. Furthermore, one of our
motivations for conducting a PES study of liquid ammonia was to make direct comparisons with
liquid water regarding the effect of bulk hydrogen bonding (H-bonds). The binding energies (BE)
of the valence electrons, particularly those involved in H-bonds, can vary considerably depending
on the number of H-bonds, which can be expected to change with temperature.[18, 29, 30]
Perhaps the most prominent example of liquid ammonia solvation chemistry is represented by
the colorful solutions of alkali metals in liquid ammonia. As the concentration of alkali metals is
increased, the solution color changes from blue to bronze, corresponding to the phase transition
from an electrolyte solution of solvated (di-)electrons into a metallic solution. Recent reviews pro-
vide the reader with a detailed overview about the history and current status of the spectroscopy of
solvated electrons in liquid ammonia.[31, 32] There is no shortage of solvation chemistry unique
to ammonia for which photoelectron spectroscopy of the liquid, which requires the use of micro-
jets, would be an immense resource. Photoelectron studies have been conducted for gas as well
as solid phases of ammonia by others previously.[33, 34] By developing a device to create a liq-
uid ammonia microjet in vacuum, we recently enabled the respective liquid phase PES studies of
ammonia.[35] The purpose of the present manuscript is to describe two versions of the experimen-
3

tal setup with focus on temperature control and suitability for various solutes which is presented
in section II. We conclude by showing representative valence PE spectra from the neat solvent at
several distinct temperatures as well as from iodide salts dissolved in liquid ammonia.
II. EXPERIMENTAL DESCRIPTION AND SPECIFICATIONS
A. Experimental design
The first design of the apparatus for liquid ammonia (Fig. 1), that we developed, consists of
two connected vessels, made of borosilicate glass and stainless steel, respectively. Both vessels
are placed in a cold bath of ethanol cooled with liquid nitrogen. Ammonia is condensed in the glass
vessel so that the amount of condensate can be observed visually. Then, the ammonia solution is
transferred into the stainless steel cylinder.
The cylinder headspace is pressurized with nitrogen gas to 2–5 bar, which presses the solution
through a stainless steel micron filter and then via a 1/8" OD tubing to a commercially available
quartz micro-nozzle (25 micron aperture diameter, Microliquid GmbH). When pushed through the
nozzle the ammonia solution forms a liquid microjet in the vacuum chamber.
The choice of backing pressure alters the length of the laminar region the microjet. The 1/8"
tubing is kept cold by cooled ethanol circulated from the solvent bath using an aquarium pump
sitting inside an insulating metal jacket. However, several adapters are needed to connect the
tubing with the commercially available nozzle,[36] and therefore, copper wires were wrapped
around this part to support its cooling.
This jacketed feed line was suspended in the vacuum chamber by an XYZ manipulator, al-
lowing the nozzle to be accurately positioned in front of the skimmer of the SOL3 PES setup
at BESSY II.[11] This experimental apparatus allowed us to collect the first photoelectron (PE)
spectra of liquid ammonia with a run time for the jet of up to eight hours. However, the apparatus
had two main shortcomings. First, no accurate temperature control was possible. Second, the jet
was not self-starting, as the nozzle frequently clogged almost immediately after initiating. This
was rectified by pressing solvents (isopropanol, water) backwards into the nozzle using a 1 mL
polypropylene syringe. An iterative improvement of this original design was made by extending
the active cooling all the way to the nozzle, by embedding the nozzle partially into the metal frame
which ameliorated the cooling time of the insulating quartz material. Additionally, a 2-micron
4

filter was added approximately 5 cm before the nozzle. The material of the custom made plas-
tic gasket between the metal tubing and quartz nozzle is absolutely crucial. The surface of the
material must be extreme smooth, otherwise microfibers can shear of easily and clog the nozzle.
Therefore, PTFE is an optimum choice even though it will not be compatible with any alkali metal
solutions in future experiments. After this adaption it was possible to obtain self-starting liquid
ammonia microjets of 20 µm diameter. Such an apparatus is still in use at USC.
Clogging of the nozzle is particularly likely and undesirable in the case of alkali-metal so-
lutions. Therefore a second apparatus was built for flowing alkali solutions. The most crucial
change is the use of larger aperture jet nozzles with a 0.45-µm filter immediately preceding the
nozzle (Fig. 2). Furthermore, the high pressure reservoir (1–5 bar) is now placed into the vacuum
chamber, mounted on a large XYZ-manipulator (CF63, VAB, model: PMM 12). This minimizes
the traveled path of the solution when exiting the reservoir, and keeps the pyrophoric material
safely inside the vacuum system.
In our previous work on PES of liquid ammonia,[35] we maintained the temperature of the
reservoir roughly within the required temperature regime by filling liquid nitrogen into the ethanol
bath once the temperature began to rise (Fig. 1). In order to achieve a much more stable tem-
perature control over time, we implemented a proportional–integral–derivative (PID) feed-back-
system which actively stabilizes the cryostat at a desired set temperature by cooling or heating an
adjustable flow of precooled nitrogen gas.
A borosilicate glass vessel (400 mL), in which the liquid ammonia is condensed by immersion
within an insulated homemade container (4 L), is cooled using a bath of ethanol and liquid nitro-
gen. Circulation of the coolant was facilitated by an aquarium pump (Eheim, compactON 300)
submerged in the cold ethanol, providing a homogeneous temperature (200 – 220 K) inside the
insulated container. We found a glass vessel useful for for collecting condensed ammonia as it
allows for visual inspection of the interior of the reservoir. Consequently, for this purpose, the
container of the cold bath is fit with a window to see the filling level of the liquid. The concentra-
tion of added solutes can hence be determined with the aid of volumetric gradations on the glass
(Fig. 2).
The condensation vessel has three connections: i. an inlet for gases (helium, ammonia) which
can also be connected to a vacuum pump. The direction of gas flow is controlled by a 6 mm ball
valve. ii. an inner joint for addition of solutes (e.g., salts or alkali metals), and iii. a glass sidearm,
originating at the base of the condensation vessel and running parallel to the walls of the vessel,
5

connects the condensation vessel with a high-pressure reservoir (stainless steel 316L, 300 mL).
Owing to the fragility of metal-to-glass seals, a short piece of silicone hose (red) connects the glass
sidearm to the sample cylinder, providing flexibility. Both the glassware and sample cylinder can
be evacuated independently and kept mutually isolated via a low-temperature bellow-sealed valve
(Swagelok, SS-4UW-TF "bridge-valve") separating the two parts of the experimental setup. The
purpose of the sample cylinder is that it can be pressurized by a pusher gas via the headspace of the
cylinder, which ultimately provides the driving force to expel the solutions through a small aperture
(nozzle). A similar approach is used for the characterization of microthrusters.[37] Helium is
preferred as a pusher gas because it does not react at all (e.g. N2 would react with lithium) and
because of its low solubility in liquid ammonia compared to argon or nitrogen.[38]
1. Controlled temperature-stabilization of the cryostat
In principle, the binding energies of solute and solvent electrons are sensitive to the temperature
dependent hydrogen bonding.[39] In our LJ-PES measurements we used an active temperature sta-
bilization to assure constant and reproducible results at a given temperature(±0.5 K). We installed
a home-built temperature control system where an adjustable flow of cold nitrogen gas is used as
coolant. Gaseous nitrogen flow from a cylinder is transported via 6-mm copper tubing, guiding
the nitrogen gas through a liquid nitrogen-cooled dewar. The copper tubing is then curled into a
short helix inside the dewar to maximize the surface area contact with the liquid nitrogen, in order
to efficiently cool the gas. The pre-cooled gas is then heated to the temperature range in which
ammonia is a liquid using a cartridge heater (LakeShore Cryogenics, model: HTR-50). The control
unit (LakeShore Cryogenics, model 350) uses a silicon diode to monitor the temperature measured
at the outlet of the cryostat, allowing for adjusting the heating current via feedback from a PID. The
cold gas kept at the required temperature is guided through a 3-mm copper tube wrapped around
the stainless steel reservoir (see Fig. 2). The distance between individual loops of the copper tube
is approximately 3 cm to guarantee a high flow rate, which would decrease if more loops were
used. Between the stainless steel container and the copper cooling coil, a thin layer of copper tape
provides homogeneous cooling. The reservoir is embedded inside an ISO-K 100 flange within the
vacuum chamber for safety concerns regarding the reactivity of the solutions (Fig. 2). The outside
of the cryostat is covered with alternating layers of polyethylene-spacer material and aluminum
foil to avoid condensation at the outer walls. The connecting tube between glass and stainless steel
6
vessel is cooled in the same way just before the solution is transferred from one vessel to the other
to keep the ammonia liquid during the transfer.
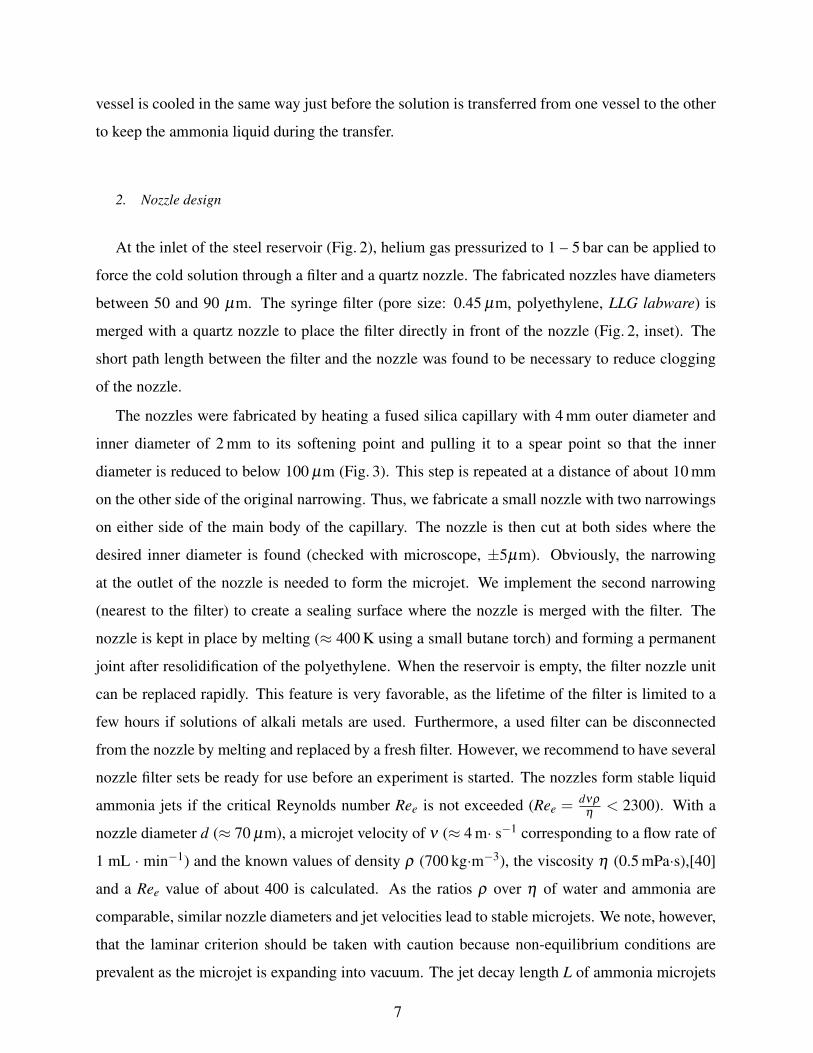
2. Nozzle design
At the inlet of the steel reservoir (Fig. 2), helium gas pressurized to 1 – 5 bar can be applied to
force the cold solution through a filter and a quartz nozzle. The fabricated nozzles have diameters
between 50 and 90 µm. The syringe filter (pore size: 0.45 µm, polyethylene, LLG labware) is
merged with a quartz nozzle to place the filter directly in front of the nozzle (Fig. 2, inset). The
short path length between the filter and the nozzle was found to be necessary to reduce clogging
of the nozzle.
The nozzles were fabricated by heating a fused silica capillary with 4 mm outer diameter and
inner diameter of 2 mm to its softening point and pulling it to a spear point so that the inner
diameter is reduced to below 100 µm (Fig. 3). This step is repeated at a distance of about 10 mm
on the other side of the original narrowing. Thus, we fabricate a small nozzle with two narrowings
on either side of the main body of the capillary. The nozzle is then cut at both sides where the
desired inner diameter is found (checked with microscope, ±5µm). Obviously, the narrowing
at the outlet of the nozzle is needed to form the microjet. We implement the second narrowing
(nearest to the filter) to create a sealing surface where the nozzle is merged with the filter. The
nozzle is kept in place by melting (≈ 400 K using a small butane torch) and forming a permanent
joint after resolidification of the polyethylene. When the reservoir is empty, the filter nozzle unit
can be replaced rapidly. This feature is very favorable, as the lifetime of the filter is limited to a
few hours if solutions of alkali metals are used. Furthermore, a used filter can be disconnected
from the nozzle by melting and replaced by a fresh filter. However, we recommend to have several
nozzle filter sets be ready for use before an experiment is started. The nozzles form stable liquid
ammonia jets if the critical Reynolds number Ree is not exceeded (Ree =dνρ
η< 2300). With a
nozzle diameter d (≈ 70 µm), a microjet velocity of ν (≈ 4 m· s−1 corresponding to a flow rate of
1 mL · min−1) and the known values of density ρ (700 kg·m−3), the viscosity η (0.5 mPa·s),[40]
and a Ree value of about 400 is calculated. As the ratios ρ over η of water and ammonia are
comparable, similar nozzle diameters and jet velocities lead to stable microjets. We note, however,
that the laminar criterion should be taken with caution because non-equilibrium conditions are
prevalent as the microjet is expanding into vacuum. The jet decay length L of ammonia microjets
7

is comparable to those of aqueous solutions and can be estimated with the following equation to
about 1–3 mm:[41] L ≈ 3u√
ρd3
σ, where σ is the surface tension of liquid ammonia.[42]
B. Experimental procedure
The apparatus without the nozzle is rinsed with water, ethanol and acetone. After that a clean
nozzle is mounted and the complete apparatus is dried and purged with helium, at least three
times. The absence of oxygen and compounds with disociable protons is extremely important
when dissolving alkali metals. After the apparatus is evacuated, gaseous ammonia (Linde, 6.0) is
condensed. As the enthalpy of vaporization of ammonia is large (23 kJ·mol−1),[43] liquid nitrogen
has to be added to the cold bath every few minutes to ensure a constant rate of condensation.
Meanwhile, the volume of liquefied ammonia can be monitored by eye through the window of the
cold bath. Once the required amount of liquid ammonia – typically 150 mL – is condensed, it is
set under a helium atmosphere (slight over-pressure). We then add the desired solute, e.g. NH4I,
KI or pure alkali metal, while flushing the condensation vessel with helium at a low flow rate. To
speed up the process of dissolution, the solution is set under vacuum for several seconds (ammonia
is boiling). The alkali metals were cut and stored under an argon atmosphere before they are added
to the liquid ammonia.
Prior to the transfer of the liquid ammonia solution into the high-pressure reservoir, the con-
nection tube and the bridge-valve are evacuated and then cooled down (see Fig. 2) to prevent the
liquid ammonia from boiling. The cold solution is pressed by its own vapor pressure smoothly
into the evacuated cryostat when the bridge-valve is opened. Eventually, the remaining solution
is transferred by gentle pressurization of the glass vessel with helium. Once the transfer is com-
pleted, about 2 bar helium backing pressure is applied to the high-pressure reservoir to initiate the
liquid ammonia microjet. The jet can be started either under atmospheric pressure or under vac-
uum. A typical experimental procedure consists of the sample preparation, transfer and thermal
equilibration prior to the conduction of measurements, depicted in Fig. 4, where the temperature
of the cryostat is shown as a function of time. During the preparation periods, the temperature
usually fluctuates rather widely, particularly when the cryostat is evacuated for the first time, due
to the evaporative cooling from any residual liquid from previous experiments. Secondly, during
filling with a new sample solution the cryostat heats up upon thermalization with the new sample
solution. In the next step, the PID-control unit stabilizes the temperature actively, up (or down)
8

to the desired set-temperature value before measurements are conducted. The temperature of the
solution was stabilized at three different temperatures (e.g., 227 K to 223 K and to 218 K, see
Fig. 4) in a single run to perform temperature dependent LJ-PES measurements without changing
any other condition during the measurement. The cryostat can, in principle, be stabilized at any
temperature within the temperature range where ammonia is liquid. However, at temperatures
higher than 230 K the vapor pressure of ammonia increases as well, leading to a decrease of the
liquid-phase PES signal due to increasing electron scattering. On the other hand, at temperatures
below 210 K the liquid jet tends to freeze immediately at the nozzle since the jet evaporatively
cools when injected into vacuum. Whereas the vacuum pumps suck a fraction of the evaporated
ammonia to the exhaust, the other fraction of the ammonia condenses on two cold traps. After a
set of experiments, the cold traps have to be removed, transported in a closed system to a hood,
where the ammonia can evaporate safely.
III. PHOTOELECTRON SPECTROSCOPY
In order to perform X-ray photoelectron spectroscopy measurements from pure liquid ammonia
as well as from liquid ammonia salt solutions, the above described experimental kits were mounted
on top of the SOL3PES experimental setup [11] at the synchrotron radiation facility BESSY II.
All measurements are performed at the beamline UE52-SGM.[44] We first present measurements
with the setup shown in Fig. 1 from ions in liquid ammonia. The experimental obtained BEs are
compared to ions in aqueous solutions. Second, we demonstrate the performance of the cryostat‘s
temperature control with the 2nd-generation setup (Fig. 2).
1. Photoelectron spectra of dissolved salts in liquid ammonia
Ammonia is a good solvent (similar to water) for many polar solutes, including salts. As an
example, we present in Fig. 5 the liquid-jet valence PE spectra from 0.5 M NH4I as well as 0.5 M
KI dissolved in liquid ammonia. Here, we used the experimental apparatus described in Fig. 1
and the pressure in the main chamber was 4–7 ·10−3 mbar. Spectra from NH4I solutions were
measured with a photon energy of 640 eV. The KI solution spectra were measured with 640 eV
and 265 eV, respectively. Spectra are displayed such that the 3a1 liquid peak is at 9.09 eV.[35] In
addition, the intensity of the 3a1 liquid peak is displayed to yield the same peak height.
9

The signals near 14–18 eV and 8–12 eV are assigned to the 1e and 3a1 orbitals of ammonia (gas
and liquid), respectively. Whereas the most prominent peaks result from ionizing the gas phase
(due to a high vapor pressure, ≈400 mbar), the liquid signal is reflected by the smaller peaks at
lower BEs (14.3 eV and 9.09 eV).[35] Due to the high concentration of salt, the gas-phase peaks
are at slightly higher BE compared to a solution with lower concentration (gray line, 50 mM KI
solution). This is a known effect in aqueous solution jets, and reflects the change of electric field
arising from changes of the liquid solution surface potential.[5, 45]
In addition to the signals of ammonia, we observe electronic signatures near 7 eV and near
21 eV, which are assigned to the I− and K+ solute ions, respectively. Signals from the ammonium
cation could not be observed, presumably because it overlaps with the gas and liquid ammonia PE
signal between 9–12 eV. It is notable that the measurement with a 265 eV photon energy shows
a less intense peak (≈50%, Fig. 5C) for I− while exhibiting a similar peak height for the K+
(Fig. 5B). In a first approximation this can be explained with different cross sections of the ions.
The ratios of peak heights of K 3p to I 5p at 265 eV and 640 eV (7.5 and 2.8) roughly reflect the
ratios of the cross sections at the different photon energies (6.3 and 2.8), respectively.[46]
For a quantitative analysis of the K+ and I− spectral contributions we present peak fits for KI
and NH4I solutions in Fig. 5E and F, respectively. The results are summarized in Table I, along
with binding energy shifts between the gas phase and the liquid phase, ∆g−l , and corresponding
binding energies in aqueous solutions.[47, 48] Surprisingly, ∆g−l , which would be expected to be
greater for water for both ions, is larger for K+ in the less polar ammonia solution.
Solution K+ 3p I− 5p1/2 I− 5p3/2 ∆g−l Re f f
Center FWHM Center FWHM Center FWHM K+ I− K+ I−
0.5 M KI in NH3 21.0 1.1 7.5 0.7 6.6 0.63 -10.52 3.99 1.97 (1.78) 1.73 (2.07)
0.5 M NH4I in NH3 7.5 0.7 6.8 0.61 4.19 1.70 (2.07)
0.5 M KI in H2O 22.2a 1.4a 8.8a; 8.9b 1.1 7.7a; 8.03b 0.8a -9.42 5.15 2.27 (2.05) 1.38 (1.60)
TABLE I. BEs and FWHM values of K+ and I− in liquid ammonia. The data of K+ and I− in aqueous
solution are shown for comparison. a From ref. [47]. b From ref. [48]. All values are given in eV, except
for Re f f which are given in Å and calculated with the Born equation. The values given in brackets are
calculated with the estimated onset energies instead of the peak centers.
10

A convenient approach to calculate the BEs of dissolved ions in solution and compare them to
the measured values is based on the Born equation, which describes the screening contribution of
the liquid to the dissolved ions as a function of the relative permittivity of the solvent ε and the
ionic radius of the solute Re f f .[47, 49] Here, we assume a homogeneous relative permittivity of
the solvent. This may be questioned, as the mobility of the dipole orientations (dielectric satura-
tion) and the excess volume of the solute (electrostriction) are decreased due to the electrostatic
interactions between solute and nearest solvent molecules.[50–52] The Born Equation is not pre-
dictive if we employ the crystallographic radii for the ions - for example, it would predict a larger
∆g−l for water than ammonia, which is not observed for K+. Instead we can explore what values
of Re f f are required for water and ammonia to reproduce the experimental binding energies.[53]
The results are shown in Table I. This approach suggests that the Re f f of K+ shrinks by ≈ 0.3 Å
whereas the Re f f of I− expands by ≈ 0.3 Å if the solvent is switched from water to ammonia. As
the Born equation predicts the onset energies and not the vertical peak center,[54] we have also
calculated Re f f with estimated onset values and the qualitative picture does not change. More pre-
dictive approaches to analyzing the solvation shift to the electron binding energy include QM/MM
and AIMD which have been successfully applied for aqueous ions.[47, 55]
2. Liquid ammonia PES at different temperatures
To characterize the performance of temperature-control of the experimental setup, photoelec-
tron spectra of a liquid ammonia solution were measured. We added 50 mM KBr to eliminate
effects arising from the streaming potential,[48] while the temperature of the cryostat was stabi-
lized at 227 K, 223 K and 218 K. The jet flow rate was 0.6 ml·min−1 and the pressure in the main
chamber was 5–8 ·10−3 mbar. We used the apparatus shown in Fig. 2. Results are presented in
Fig. 6.
The observed 70% increase of the gas-peak signal (near 16 eV and 10.5 eV) upon raising the
temperature from 218 to 227 K well reflects the change in vapor pressures (300 mbar at 218 K and
510 mbar at 227 K, increase of 70%, Fig. 6 A).[28] This demonstrates the accurate temperature
control of the microjet and a preservation of the temperature difference even after considering
evaporative cooling as the jet flows into vacuum. Within the measured temperature range, we do
not observe any additional gas-liquid shift or a change of the peak shape of the liquid phase signals
(Fig. 6 B and C). Nevertheless, as accurate temperature control is now available, changes in the
11

hydrogen network on the solvent orbital energies might be detected for other liquids, measured
over a broader temperature range or if smaller nozzles are used to increase the ratio of liquid to
gas signal for volatile solvents like ammonia. Under extreme non-equilibrium conditions (IR laser
heating, 400 K) H-bonding dynamics in water and methanol has been tracked by time resolved
PES.[56, 57]
IV. SUMMARY
In summary, deeply cooled microjets of solutions of liquid ammonia can be investigated spec-
troscopically by the above described apparatus at temperature controlled conditions. The perfor-
mance of our experimental designs, in conjunction with PES, are demonstrated by two examples.
First, valence binding energies of I− and K+ in liquid ammonia are measured, and the results
compared to aqueous solutions. Second, a temperature-dependent study shows a good agreement
with the expected increase of gas to liquid ratio in the X-ray photoelectron spectrum as the vapor
pressure increases with temperature. Currently, studies of solvated electrons in liquid ammonia
are our immediate goal and the apparatus has been designed with this in mind. Finally, we note
that the present technique should allow spectroscopic probing of deeply cooled liquid microjets
of other solvents as well. The temperature range of this device is not limited to the current values
of 215 K to 240 K. Such liquids may include complex amines, hydrofluorocarbons and hydrocar-
bons. Last but not least, the experimental design might be adapted for experiments with flatjets as
well.[58–61]
ACKNOWLEDGMENTS
The authors thank the glass and mechanical workshops of the FHI in Berlin, the IOCB in
Prague, USC as well as the HZB staff prior to and during the beamtime for their assistance
at BESSY II. The authors appreciate helpful comments from Dr. Manfred Faubel. P.E.M. ac-
knowledges support from the viewers of his YouTube science channel. S.E.B. and R.S.M. are
supported by the U.S. National Science Foundation (CHE-1665532). R.S.M. received additional
funds from the States of Jersey Postgraduate Bursary. R.S. and B.W. gratefully acknowledge fi-
nancial support from the German Research Foundation (DFG) within the Collaborative Research
Center 1109. R.S. also acknowledges an Emmy Noether Young Investigator stipend through the
12

DFG (project SE 2253/3-1). T.B. was supported by the Czech Ministry of Education and the EU
(Grant CZ.02.2.69/0.0/0.0/16_ 027/0008477). P.J. thanks the European Regional Development
Fund (Project ChemBioDrug No. CZ.02.1.01/0.0/0.0/16_019/0000729).
[1] M. Faubel, B. Steiner, and J. P. Toennies, J. Chem. Phys. 106, 9013 (1997).
[2] B. Winter, R. Weber, W. Widdra, M. Dittmar, M. Faubel, and I. V. Hertel, J. Phys. Chem. A 108, 2625
(2004).
[3] B. Winter and M. Faubel, Chem. Rev. 106, 1176 (2006).
[4] B. Winter, M. Faubel, I. V. Hertel, C. Pettenkofer, S. E. Bradforth, B. Jagoda-Cwiklik, L. Cwiklik,
and P. Jungwirth, J. Am. Chem. Soc. 128, 3864 (2006).
[5] M. N. Pohl, E. Muchová, R. Seidel, H. Ali, Š. Sršen, I. Wilkinson, B. Winter, and P. Slavícek, Chem.
Sci. 10, 848 (2019).
[6] Y. Tang, H. Shen, K. Sekiguchi, N. Kurahashi, T. Mizuno, Y.-I. Suzuki, and T. Suzuki, Phys. Chem.
Chem. Phys. 12, 3653 (2010).
[7] R. Seidel, S. Thürmer, and B. Winter, J. Phys. Chem. Lett. 2, 633 (2011).
[8] A. T. Shreve, M. H. Elkins, and D. M. Neumark, Chem. Sci. 4, 1633 (2013).
[9] M. H. Elkins, H. L. Williams, A. T. Shreve, and D. M. Neumark, Science 342, 1496 (2013).
[10] R. Seidel, B. Winter, and S. E. Bradforth, Annu. Rev. Phys. Chem. 67, 283 (2016).
[11] R. Seidel, M. N. Pohl, H. Ali, B. Winter, and E. F. Aziz, Rev. Sci. Instrum. 88, 073107 (2017).
[12] H. L. Williams, B. A. Erickson, and D. M. Neumark, J. Chem. Phys. 148, 194303 (2018).
[13] J. A. Faust and G. M. Nathanson, Chem. Soc. Rev. 45, 3609 (2016).
[14] L. Chen, Z. Chen, Z. Li, J. Hu, and S. X. Tian, Rev. Sci. Instrum. 89, 103102 (2018).
[15] M. Schlenk, E. Hofmann, S. Seibt, S. Rosenfeldt, L. Schrack, M. Drechsler, A. Rothkirch, W. Ohm,
J. Breu, S. Gekle, and S. Förster, Langmuir 34, 4843 (2018).
[16] I. Jordan, M. Huppert, M. A. Brown, J. A. van Bokhoven, and H. J. Wörner, Rev. Sci. Instrum. 86,
123905 (2015).
[17] M. Kühnel, J. M. Fernández, G. Tejeda, A. Kalinin, S. Montero, and R. E. Grisenti, Phys. Rev. Lett.
106 (2011), 10.1103/physrevlett.106.245301.
[18] P. Wernet, D. Nordlund, U. Bergmann, M. Cavalleri, M. Odelius, H. Ogasawara, L. . Näslund, T. K.
Hirsch, L. Ojamäe, P. Glatzel, L. G. M. Pettersson, and A. Nilsson, Science 304, 995 (2004).
13

[19] J. D. Smith, C. D. Cappa, K. R. Wilson, B. M. Messer, R. C. Cohen, and R. J. Saykally, Science 306,
851 (2004).
[20] M. Ryazanov and D. J. Nesbitt, J. Chem. Phys. 150, 044201 (2019).
[21] L. Malmqvist, L. Rymell, M. Berglund, and H. M. Hertz, Rev. Sci. Instrum. 67, 4150 (1996).
[22] M. Berglund, L. Rymell, H. M. Hertz, and T. Wilhein, Rev. Sci. Instrum. 69, 2361 (1998).
[23] P. A. C. Jansson, B. A. M. Hansson, O. Hemberg, M. Otendal, A. Holmberg, J. de Groot, and H. M.
Hertz, Appl. Phys. Lett. 84, 2256 (2004).
[24] P. A. C. Jansson, U. Vogt, and H. M. Hertz, Rev. Sci. Instrum. 76, 043503 (2005).
[25] M. Wieland, T. Wilhein, M. Faubel, C. Ellert, M. Schmidt, and O. Sublemontier, Appl. Phys. B 72,
591 (2001).
[26] L. B. Fletcher, U. Zastrau, E. Galtier, E. J. Gamboa, S. Goede, W. Schumaker, A. Ravasio, M. Gauthier,
M. J. MacDonald, Z. Chen, E. Granados, H. J. Lee, A. Fry, J. B. Kim, C. Roedel, R. Mishra, A. Pelka,
D. Kraus, B. Barbrel, T. Döppner, and S. H. Glenzer, Review of Scientific Instruments 87, 11E524
(2016).
[27] J. B. Kim, C. Schoenwaelder, and S. H. Glenzer, Rev. Sci. Instrum. 89, 10K105 (2018).
[28] J. Speight, Lange’s Handbook of Chemistry, Seventeenth Edition (MCGRAW HILL BOOK CO,
2016).
[29] J. A. Sellberg, S. Kaya, V. H. Segtnan, C. Chen, T. Tyliszczak, H. Ogasawara, D. Nordlund, L. G. M.
Pettersson, and A. Nilsson, J. Chem. Phys. 141, 034507 (2014).
[30] T. Fransson, Y. Harada, N. Kosugi, N. A. Besley, B. Winter, J. J. Rehr, L. G. M. Pettersson, and
A. Nilsson, Chem. Rev. 116, 7551 (2016).
[31] E. Zurek, P. Edwards, and R. Hoffmann, Angew. Chem. Int. Ed. 48, 8198 (2009).
[32] P. Vöhringer, Annu. Rev. Phys. Chem. 66, 97 (2015).
[33] A. Lindblad, H. Bergersen, W. Pokapanich, M. Tchaplyguine, G. Öhrwall, and O. Björneholm, Phys.
Chem. Chem. Phys. 11, 1758 (2009).
[34] D. Edvardsson, P. Baltzer, L. Karlsson, B. Wannberg, D. M. P. Holland, D. A. Shaw, and E. E. Rennie,
J. Phys. B: At. Mol. Opt. Phys. 32, 2583 (1999).
[35] T. Buttersack, P. E. Mason, R. S. McMullen, T. Martinek, K. Brezina, D. Hein, H. Ali, C. Kolbeck,
C. Schewe, S. Malerz, B. Winter, R. Seidel, O. Marsalek, P. Jungwirth, and S. E. Bradforth, J. Am.
Chem. Soc. 141, 1838 (2019).
[36] J. Braun, P. K. Day, J. P. Toennies, G. Witte, and E. Neher, Rev. Sci. Instrum. 68, 3001 (1997).
14

[37] J. Blandino, M. McDevitt, J. Mueller, D. Bame, and A. Green, J. Propul. Power 22, 677 (2006).
[38] D. R. Lide, CRC Handbook Chemistry and Physics, 85th Edition (CRC Press, 2004).
[39] R. C. Dougherty, J. Chem. Phys. 109, 7372 (1998).
[40] G. Guevara-Carrion, J. Vrabec, and H. Hasse, Int. J. Thermophys. 33, 449 (2012).
[41] M. Faubel, in Photoionization and Photodetachment (WORLD SCIENTIFIC, 2000) pp. 634–690.
[42] R. A. Stairs and M. J. Sienko, Journal of the American Chemical Society 78, 920 (1956).
[43] N. S. Osborne and M. S. van Dusen, J. Am. Chem. Soc. 40, 14 (1918).
[44] P. S. Miedema, W. Quevedo, and M. Fondell, J. Large-Scale Res. Facilities 2, A (2016).
[45] N. Preissler, F. Buchner, T. Schultz, and A. Lübcke, J. Phys. Chem. B 117, 2422 (2013).
[46] J.-J. Yeh, Atomic Calculation of Photoionization Cross Sections and Asymmetry Parameters, edited
by Gordon and Breach (Langhorne PA, 1993).
[47] B. Winter, R. Weber, I. V. Hertel, M. Faubel, P. Jungwirth, E. C. Brown, and S. E. Bradforth, J. Am.
Chem. Soc. 127, 7203 (2005).
[48] N. Kurahashi, S. Karashima, Y. Tang, T. Horio, B. Abulimiti, Y.-I. Suzuki, Y. Ogi, M. Oura, and
T. Suzuki, J. Chem. Phys. 140, 174506 (2014).
[49] M. Born, Z. Phys. 1, 45 (1920).
[50] T. Abe, J. Phys. Chem. 90, 713 (1986).
[51] C. S. Babu and C. Lim, J. Chem. Phys. 114, 889 (2001).
[52] P. Koehl, H. Orland, and M. Delarue, J. Phys. Chem. B 113, 5694 (2009).
[53] Y. Marcus, Chem. Rev. 88, 1475 (1988).
[54] B. Jagoda-Cwiklik, P. Slavícek, L. Cwiklik, D. Nolting, B. Winter, and P. Jungwirth, J. Phys. Chem.
A 112, 3499 (2008).
[55] A. P. Gaiduk, M. Govoni, R. Seidel, J. H. Skone, B. Winter, and G. Galli, J. Am. Chem. Soc. 138,
6912 (2016).
[56] O. Link, E. Lugovoy, K. Siefermann, Y. Liu, M. Faubel, and B. Abel, Appl. Phys. A 96, 117 (2009).
[57] E. Vöhringer-Martinez, O. Link, E. Lugovoy, K. R. Siefermann, F. Wiederschein, H. Grubmüller, and
B. Abel, Phys. Chem. Chem. Phys. 16, 19365 (2014).
[58] M. Ekimova, W. Quevedo, M. Faubel, P. Wernet, and E. T. J. Nibbering, Structural Dynamics 2,
054301 (2015).
[59] L. Obst, S. Göde, M. Rehwald, F.-E. Brack, J. Branco, S. Bock, M. Bussmann, T. E. Cowan, C. B.
Curry, F. Fiuza, M. Gauthier, R. Gebhardt, U. Helbig, A. Huebl, U. Hübner, A. Irman, L. Kazak, J. B.
15

Kim, T. Kluge, S. Kraft, M. Loeser, J. Metzkes, R. Mishra, C. Rödel, H.-P. Schlenvoigt, M. Siebold,
J. Tiggesbäumker, S. Wolter, T. Ziegler, U. Schramm, S. H. Glenzer, and K. Zeil, Sci. Rep. 7 (2017),
10.1038/s41598-017-10589-3.
[60] B. Ha, D. P. DePonte, and J. G. Santiago, Phys. Rev.Fluids 3 (2018).
[61] J. D. Koralek, J. B. Kim, P. Bruža, C. B. Curry, Z. Chen, H. A. Bechtel, A. A. Cordones, P. Sperling,
S. Toleikis, J. F. Kern, S. P. Moeller, S. H. Glenzer, and D. P. DePonte, Nat. Comm. 9 (2018).
16

con
de
nsa
!o
n
(gla
ss)
hig
h p
re
serv
ior
(ste
el)
cold ethanol (210 K)
NH3
2 bar
microjetin vacuum
filter
pum
p
nozzle25 mm
FIG. 1. Sketch of the experimental design as used for first studies with liquid ammonia:[35] All parts
(condensation vessel, filter and high-pressure reservoir) except the micro nozzle were placed outside of the
vacuum chamber in a cold bath (ethanol + liquid nitrogen).
17

FIG. 2. Sketch of the experimental design with accurate temperature control. Left: Condensation and
mixing vessel (glass) in a cold bath (stainless steel with window). The glass part is connected via a short
silicon tube (red) to the high-pressure reservoir (right). The cryostat is built into the vacuum chamber and
can be moved by a XYZ manipulator. Inset: Nozzle with merged filter.
18

1.
2.
3.
4.
5.
6.
3 m
m
10 mm
I. D. ~ 75 mm
400 K
PE
FIG. 3. Custom nozzles are made by taking fused silica tubing (4 mm OD, 1 mm ID, 1) heating and pulling
on both sides to create two spear points, 2. Another spear point is made 10 mm away from the first, shown in
3 and the thinnest sections are analyzed under a microscope to determine if the aperture size is 75 microns
or less; if so, the nozzle is cleaved in that location using a tungsten carbide knife, giving a prototypical
nozzle, 4. The nozzle is then inserted into one end of a poly(ethylene) frit filter, 5; the luer-lock connection
of the filter is melted with a butane torch and which creates a seal with the nozzle when it resolidifies, giving
the filter-merged nozzle as shown in 6 and Fig. 2.
19
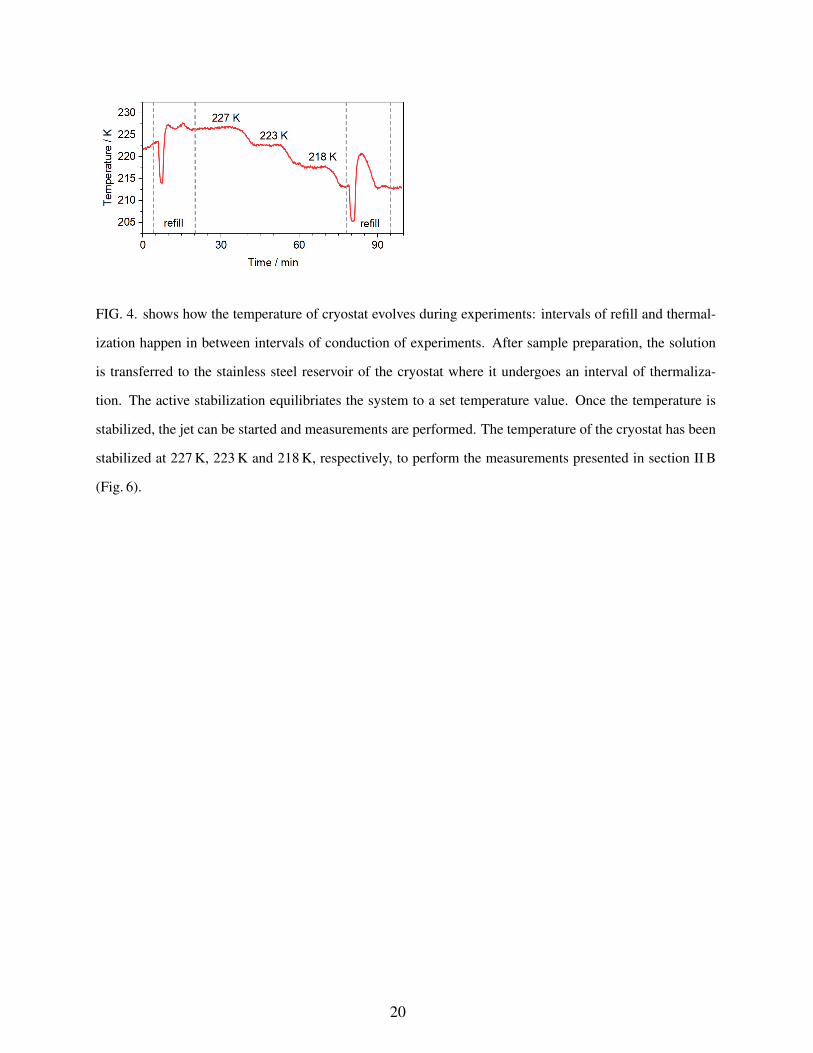
FIG. 4. shows how the temperature of cryostat evolves during experiments: intervals of refill and thermal-
ization happen in between intervals of conduction of experiments. After sample preparation, the solution
is transferred to the stainless steel reservoir of the cryostat where it undergoes an interval of thermaliza-
tion. The active stabilization equilibriates the system to a set temperature value. Once the temperature is
stabilized, the jet can be started and measurements are performed. The temperature of the cryostat has been
stabilized at 227 K, 223 K and 218 K, respectively, to perform the measurements presented in section II B
(Fig. 6).
20

0.5 M 0.05 M KI, 265 eV KI, 265 eV KI, 640 eV NH4I, 640 eV
A
1e 3a1
liquid
I- 5pC
PE s
igna
l / ar
b. u
. B
Binding energy / eV
E I- 5p1/2 I- 5p3/2 F I- 5p1/2 I- 5p3/2K+ 3p
K+ 3p
D
FIG. 5. A: Photoelectron spectra of 0.5 M KI (black) and 0.5 M NH4I (red) liquid ammonia solutions —
both measured at a photon energy of 640 eV — and 0.5 M KI solution (blue) and a 0.05 M KI solution (gray)
both measured at 265 eV. All measurements are calibrated to and normalized at the 3a1 peak of the liquid
phase of ammonia (9.09 eV). All spectra are measured at a detection angle parallel to the light polarization.
B and C: Magnification of the highlighted areas (in A) between 5.5 and 8.5 eV (I− 5p) and between 19 and
24 eV (K+ 3p). D to F: Gaussian fits of the K+ 3p and I− 5p peaks after subtraction of the ammonia signals.
These data have been measured with the design of the experimental setup, described in Fig. 1.
21

20 18 16 14 12 10 8
14 13 9 8
PE s
igna
l / ar
b. u
. 218 K 223 K 227 K
Binding energy / eV
A
1e 3a1
B C
FIG. 6. Valence PE spectra of liquid ammonia solutions (50 mM KBr) are measured at three different
temperatures: 218 K (blue), 223 K (black), 227 K (red). The spectra are measured for 8 min (8 sweeps)
using a photon energy of 265 eV, normalized and calibrated to the fitted 3a1 liquid phase peak at 9.09 eV (A).
Magnification of the liquid phase signal of the 3a1 and 1e liquid peaks does not show any shift or broadening
(B and C). The dashed line represents the gas phase spectra. Spectra were recorded with microjet design
shown in Fig. 2.
22