deep-space optical terminals (dot) systems engineering
TRANSCRIPT
1
IPN Progress Report 42-183 • November 15, 2010
Deep-space Optical Terminals (DOT) Systems Engineering
Abhijit Biswas,* Hamid Hemmati,* Sabino Piazzolla,* Bruce Moision,* Kevin Birnbaum,* and Kevin Quirk*
* Communication Architectures and Research Section.
The research described in this publication was carried out by the Jet Propulsion Laboratory, California Institute of Technology, under a contract with the National Aeronautics and Space Administration. © 2010 California Institute of Technology. Government sponsorship acknowledged.
Recently a conceptual design study titled Deep-space Optical Terminals (DOT) was com-pleted for a deep-space optical communication technology demonstration in the 2018 timeframe. This article provides an overview of the system engineering portion of the study. The Level 1 requirements received from the NASA Space Communications and Navigation Program Manager emphasized an order of magnitude higher data rate from Mars closest range relative to the Ka-band telecommunication system flown on the Mars Reconnaissance Orbiter (MRO) mission but utilizing comparable mass and power. The system-level concept design motivated by this driving requirement and reported here describes link performance of 267 Mb/s from 0.42 AU within an allocated mass and power of 38 kg and 110 W. Further-more, the concept design addresses link closure at the farthest Mars range of 2.7 AU. Maxi-mum uplink data rates of 292 kb/s and ranging with 30-cm precision are also addressed.
I. Introduction
Over the past five years, NASA’s Space Communications and Navigation (SCaN) Program Office under the Space Operations Mission Directorate (SOMD) has been developing a communications and tracking architecture to address NASA’s mission needs for the next two decades. This work is summarized in the SCaN Architecture Description Document (ADD) [1] where optical communications was identified as an emerging technology for providing a high-rate data-return service for NASA missions from lunar distances out to the farthest reaches of the solar system. Recognizing that optical technology was relatively new and needed validation from space, the SCaN Program Office developed a roadmap to initiate much-needed technology demonstrations that would lead to an initial operational capability (IOC). A two-pronged approach to validate optical communications from near Earth (Sun–Earth Lagrange range or closer) and deep space (beyond 0.01 AU) was articu-lated in the roadmap. The near-Earth technology validation will be initiated with the Lunar Laser Communications Demonstration (LLCD), which will downlink 625 Mb/s and uplink 20 Mb/s to an optical terminal on the Lunar Atmosphere and Dust Environment Explorer (LADEE) orbiting the Moon in 2013. For deep space, NASA had initiated the Mars Laser Communication Demonstration (MLCD) Project in 2003. The MLCD Project planned to fly

2
an optical terminal on board the Mars Telecom Orbiter (MTO) spacecraft. MLCD progressed through a successful preliminary design review but was aborted due to cancellation of MTO in mid-2005 [2,3]. MLCD was followed by several years of technology funding through the SCaN program and a pre–Phase A study titled Deep-space Optical Terminals (DOT) was initiated in early calendar year 2009. The DOT study objective was to develop an end-to-end instrument conceptual design that will demonstrate optical communication from deep space for the first time. A key objective was to demonstrate an order of magnitude higher downlink data rate with flight terminal mass and power comparable to current NASA deep-space telecommunication systems.
The primary motivation for augmenting NASA’s telecommunication data rates [4] is to en-hance the science data volume returned with higher-resolution instruments and prepare for future human deep-space exploration missions. Radio frequency (RF) telecommunications constraints on mass, power, and volume on the spacecraft, as well as bandwidth allocation restrictions, limit increases in data rate. Optical communication can potentially overcome all these limitations while providing increased data rates. Optical communications from low-Earth and geostationary orbit has been validated by several missions [5–11]; however, the unique challenges presented by deep-space optical links need separate risk retiring tech-nology demonstrations prior to implementing an IOC.
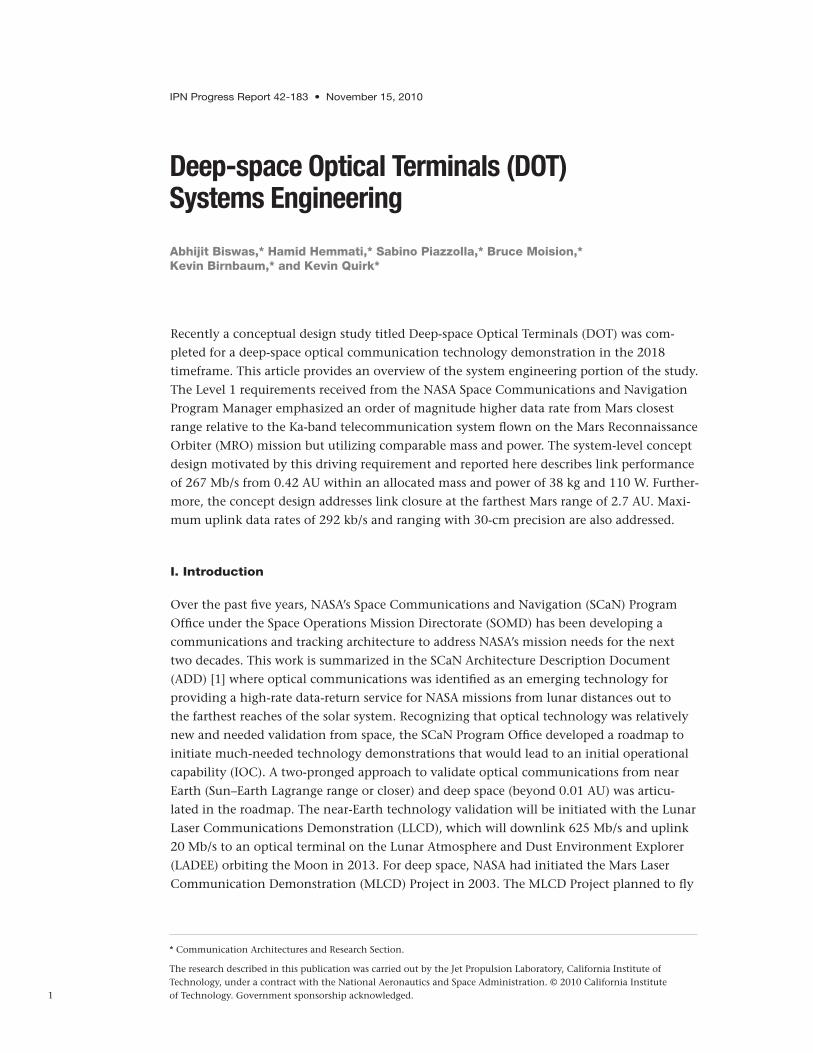
Figure 1 plots lines representing link difficulty [data rate (Mb/s) × distance squared (AU2)] in dB, for missions ranging from the Moon to Saturn, versus data rate, where 0 dB link difficul-
Figure 1. Plot of link difficulty, dB-(Mb/s × AU2) versus data rate for distances to the Moon,
Sun–Earth Lagrange point, Mars (near and far), and Saturn (near and far) with actual
RF and planned or predicted optical operating points.
Data Rate, Mb/s
MRO Ka-bandLink-Limited
Cassini
LRO
LLCD
MLCDMLCD
DOTDOT
MRO Ka-bandLink Actual
Kepler
Link
Diffi
culty
dB
, Mb
/s ×
AU
2
100
10–2 10–1 10–0 10–1 102 103
80
60
40
20
0
–20
–40
MoonLagrangeMars NearMars FarSaturn NearSaturn FarOpticalKa-/X-Band
3
ty represents 100 Mb/s from lunar distance (400,000 km). Operating points for the X-band telecommunication system flown on Cassini and the Ka-band system flown on Mars Recon-naissance Orbiter (MRO) are superimposed on this plot in blue squares. For Cassini, the maximum and minimum data rates (14 kb/s and 166 kb/s) shown are a result of both the varying distance of Saturn from Earth and the use of 34-m and 70-m-diameter receiving an-tennae on the ground [12]. For MRO, two sets of operating points are shown [13]. The link-limited points refer to performance that could have been achieved (25 Mb/s from 0.42 AU) using the available power and apertures, while the actual points represent the MRO imple-mentation where hardware limitations on the modulation restricted the highest achievable rates (6.6 Mb/s). The red squares in Figure 1 are predicted optical operating points for the MLCD, LLCD, and what we will show in this article for the DOT concept study. The 50 to 60 dB increased link difficulty for Mars near- and far-range shown in Figure 1 quantifies the unique challenges that motivate separate technology demonstrations for deep-space optical communication.
In this article, therefore, an overview of the DOT systems engineering is presented starting with the flowdown of Level 1 requirements provided by the SCaN Program Manager and culminating in a reference concept design for returning a maximum data rate of 0.27 Gb/s from Mars nearest range with spacecraft burden (mass and power) comparable to the Ka-band system flown on MRO. Thus, the downlink data rate enhancement targeted is 10 times the link-limited MRO Ka-band system and 40 times the actual hardware-limited Ka-band system (see Figure 1). Note that the DOT pre–Phase A study was conducted with-out a specific mission being selected. Reasonable assumptions for deep-space spacecraft were made in developing the concept design. The DOT conceptual design is meant to be matured into a system for performing an initial technology demonstration that will not only retire the risks posed by the unique challenges, but will also provide preoperational experience over an extended duration.
The requirements and unique challenges posed by deep-space optical communication and not encountered by near-Earth optical links are discussed next. We start this discussion by presenting a simplified link equation for deriving ns, the received signal photon flux in photons per second:
Rn EIRP L L Ghc
s space atm R# # # # #h m=
where the effective isotropically radiated power (EIRP ) in watts is defined as
EIRP P G Lav tx tx pointing# # #h=
where Pav is the average laser power, Gtx is the on-axis far-field antenna gain [14], htx is the efficiency with which the laser output power is coupled to the far-field, and Lpointing is the mispointing loss. Lspace and Latm are the space (inverse square distance) and atmospheric attenuation loss. GR and hR are the receiver gain and efficiency; m, h , and c are the laser transmitter wavelength, Planck’s constant, and the speed of light, respectively.
(1)
(1a)
4
In Equation (1), the inverse square distance dependent loss, Lspace, at deep-space distances dominates the increased link difficulty. This is illustrated in Figure 1 by the 30 to 40 dB increase in difficulty for MLCD and DOT relative to LLCD. The increase in Lspace can be partially made up by increasing EIRP and GR . Increasing EIRP is constrained by limited spacecraft resources (electrical power and mass) and increasing GR , the ground receiver gain, is limited by practical considerations of how large an effective diameter (DR) ground receiving telescope can be implemented. Asserting that the data throughput, R in bits/s, of an optical communication link is t # ns with t representing the photon efficiency in user bits/photon, the only other way of increasing R from deep space is by implementing efficient signaling schemes that maximize t over planetary distances [15]. Pulse-position modulation (PPM) [16] with single photon-counting detectors and efficient codes allow ef-ficient signaling for deep-space optical communications [17].
For a given point design, the PPM order can be increased to trade efficiency for bandwidth with increasing link distance. For the DOT design presented in this article, the derived PPM orders increase from 16 to 128 over the Mars nearest and farthest range. With increasing PPM order, more bits per pulse are transmitted but the reduced duty cycle of the laser re-sults in an increasing peak-to-average power ratio. Thus, the high average power (2 to 5 W, for example) combined with high peak-to-average power ratio is one of the unique aspects for deep-space laser transmitters and poses risks on implementation and extended periods of operation from space. Thus, for PPM 128 with a 25 percent “guard-time” or “dead-time,” this ratio is 160 times the average power. One of the key risk reduction objectives of the DOT technology demonstration will be to implement a deep-space laser transmitter design that retires the risk of premature failure in the space environment.
Controlling the pointing of narrow beam-divergence lasers from space in the presence of platform disturbance and attitude fluctuations is another formidable challenge. For near-Earth optical terminals, a local control loop with a beacon signal received from Earth is usually implemented. At near-Earth ranges, sufficient beacon signal can be delivered to spacecraft, so that the signal-to-noise ratio is relatively strong. Coupled with short light-travel time (1.3 s to the Moon), high-bandwidth control loops that use the received laser beacon signal from Earth as a pointing reference can be implemented to compensate for a wide spectrum of disturbances and correctly repointing the downlink laser beam to an Earth receiver. As link range increases, the latency or round-trip light time increases and the control loop bandwidth for compensating disturbances is compromised.
Furthermore, there are practical limitations to delivering a given mean irradiance to space-craft in deep space. First, atmospheric turbulence degradations limit the effective beam-width that leaves the atmosphere. Second, the pointing accuracy is limited by availability of mounts and the uncertainty in the location of the spacecraft, since open-loop pointing has to be relied on for illuminating deep-space spacecraft. Therefore, in addition to the increase in light travel time, the beacon irradiance limited by the optical power that can be practically transmitted from the ground will likely be dimmer. As a result, while the beacon received at Mars distances still serves as an absolute pointing reference for calibrating out
5
slowly varying biases, it is no longer possible to implement a sufficiently high-bandwidth control system to reject the wide spectrum of disturbances. Therefore, additional control measures are required for laser beam pointing control. In the past, the MLCD Project based the preliminary design of a Mars Laser Terminal (MLT) on a local inertial reference [18] source for stabilizing the line of sight against relatively high-frequency disturbances. An alternate method is the use of a vibration isolation platform [19], which is the implementa-tion chosen by the DOT study, as elaborated in [20]. To further add to the pointing dif-ficulty of deep-space missions, large point-ahead (PA) angles have to be implemented; for example, ±400 µrad [2] from Mars distances, compared to ±50 µrad [21] from near Earth. The larger PA angle also requires larger field-of-view detectors on the flight laser transceiver (FLT) in order to simultaneously monitor the transmitted beam position relative to the received beacon beam for robust and reliable laser beam pointing [22].
Deep-space optical communication in general involves month-long durations when both the spacecraft and the ground station need to point 3 to 5 deg from the Sun [23]. Specifi-cally for a Mars mission, both the Sun–Earth–probe (SEP) and Sun–probe–Earth (SPE) angles are simultaneously small (<5 deg) for at least a month. This proximity to the Sun drives the design of both the space [24] and ground terminals [25] required for deep-space optical communications. Consider that for an operational service, large effective diameter ground telescopes will be required for efficient collection of photons. In this case, near-Sun point-ing with the larger effective area ground collectors is more difficult than pointing a single meter-class aperture close to the Sun.
The brief introduction above motivates the concept design study to be presented next. The remainder of this article is organized as follows. In Section II, the customer Level 1 require-ments and investigation goals for the DOT Study are presented, followed by a discussion of possible mission options and how they relate to the Level 1 requirements. In Section III, a summary of the anticipated link and atmospheric channel conditions for a Mars orbiter mission are described. In Section IV, the system-level requirements are presented with some discussion of the rationale used in deriving them. Interface assumptions are also discussed in Section IV. In Section V, system-level trades that led to the DOT wavelength selection, signaling scheme, and downlink and uplink reference designs are presented, along with a brief description of a precision ranging scheme. In Section VI, we conclude the article.
II. Top-Level Requirements and Mission Scenarios
A. Level 1 Requirements
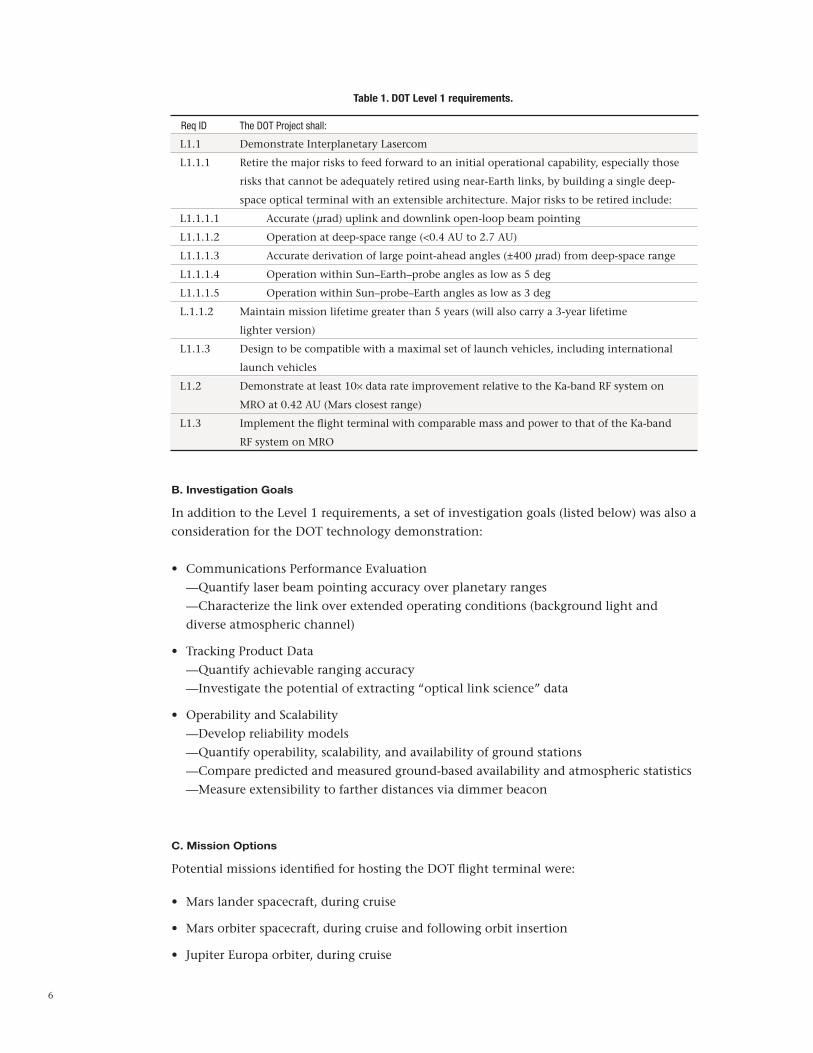
Demonstrating an order of magnitude enhanced data rate relative to the Ka-band telecom-munication system flown on MRO with comparable resource burden on the host spacecraft motivated the DOT Level 1 requirements. The performance enhancement was relative to the link-limited capability of the MRO Ka-band system, explained earlier in Section I; i.e., 25 Mb/s from a range of 0.42 AU [13]. Additionally, the capability to operate deep-space op-tical links over diverse link and atmospheric conditions in order to retire the risk of future operational implementation was articulated. The Level 1 requirements are listed in Table 1.
6
B. Investigation Goals
In addition to the Level 1 requirements, a set of investigation goals (listed below) was also a consideration for the DOT technology demonstration:
• CommunicationsPerformanceEvaluation —Quantify laser beam pointing accuracy over planetary ranges —Characterize the link over extended operating conditions (background light and
diverse atmospheric channel)
• TrackingProductData —Quantify achievable ranging accuracy —Investigate the potential of extracting “optical link science” data
• OperabilityandScalability —Develop reliability models —Quantify operability, scalability, and availability of ground stations —Compare predicted and measured ground-based availability and atmospheric statistics —Measure extensibility to farther distances via dimmer beacon
C. Mission Options
Potential missions identified for hosting the DOT flight terminal were:
• Marslanderspacecraft,duringcruise
• Marsorbiterspacecraft,duringcruiseandfollowingorbitinsertion
• JupiterEuropaorbiter,duringcruise
Table 1. DOT Level 1 requirements.
Req ID The DOT Project shall:
L1.1 Demonstrate Interplanetary Lasercom
L1.1.1 Retire the major risks to feed forward to an initial operational capability, especially those
risks that cannot be adequately retired using near-Earth links, by building a single deep-
space optical terminal with an extensible architecture. Major risks to be retired include:
L1.1.1.1 Accurate (µrad) uplink and downlink open-loop beam pointing
L1.1.1.2 Operation at deep-space range (<0.4 AU to 2.7 AU)
L1.1.1.3 Accurate derivation of large point-ahead angles (±400 µrad) from deep-space range
L1.1.1.4 Operation within Sun–Earth–probe angles as low as 5 deg
L1.1.1.5 Operation within Sun–probe–Earth angles as low as 3 deg
L.1.1.2 Maintain mission lifetime greater than 5 years (will also carry a 3-year lifetime
lighter version)
L1.1.3 Design to be compatible with a maximal set of launch vehicles, including international
launch vehicles
L1.2 Demonstrate at least 10× data rate improvement relative to the Ka-band RF system on
MRO at 0.42 AU (Mars closest range)
L1.3 Implement the flight terminal with comparable mass and power to that of the Ka-band
RF system on MRO
7
• Near-Earthobjectmission
• Venusmissionduringcruise
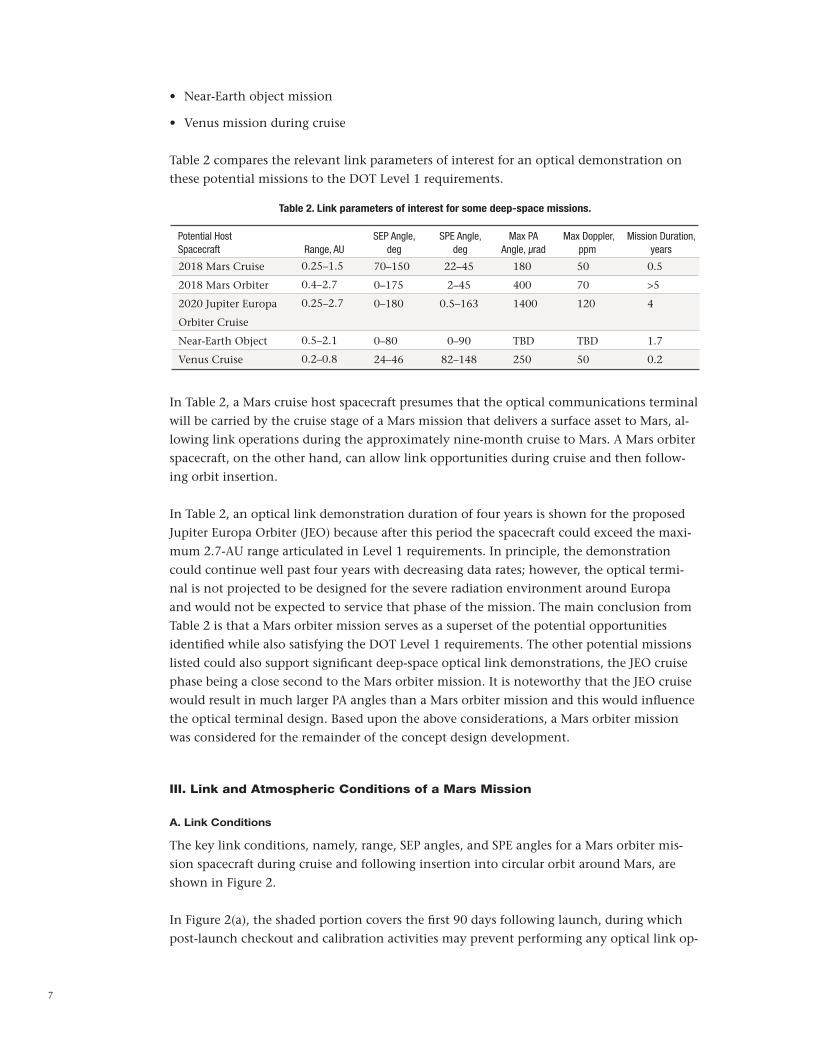
Table 2 compares the relevant link parameters of interest for an optical demonstration on these potential missions to the DOT Level 1 requirements.
In Table 2, a Mars cruise host spacecraft presumes that the optical communications terminal will be carried by the cruise stage of a Mars mission that delivers a surface asset to Mars, al-lowing link operations during the approximately nine-month cruise to Mars. A Mars orbiter spacecraft, on the other hand, can allow link opportunities during cruise and then follow-ing orbit insertion.
In Table 2, an optical link demonstration duration of four years is shown for the proposed Jupiter Europa Orbiter (JEO) because after this period the spacecraft could exceed the maxi-mum 2.7-AU range articulated in Level 1 requirements. In principle, the demonstration could continue well past four years with decreasing data rates; however, the optical termi-nal is not projected to be designed for the severe radiation environment around Europa and would not be expected to service that phase of the mission. The main conclusion from Table 2 is that a Mars orbiter mission serves as a superset of the potential opportunities identified while also satisfying the DOT Level 1 requirements. The other potential missions listed could also support significant deep-space optical link demonstrations, the JEO cruise phase being a close second to the Mars orbiter mission. It is noteworthy that the JEO cruise would result in much larger PA angles than a Mars orbiter mission and this would influence the optical terminal design. Based upon the above considerations, a Mars orbiter mission was considered for the remainder of the concept design development.
III. Link and Atmospheric Conditions of a Mars Mission
A. Link Conditions
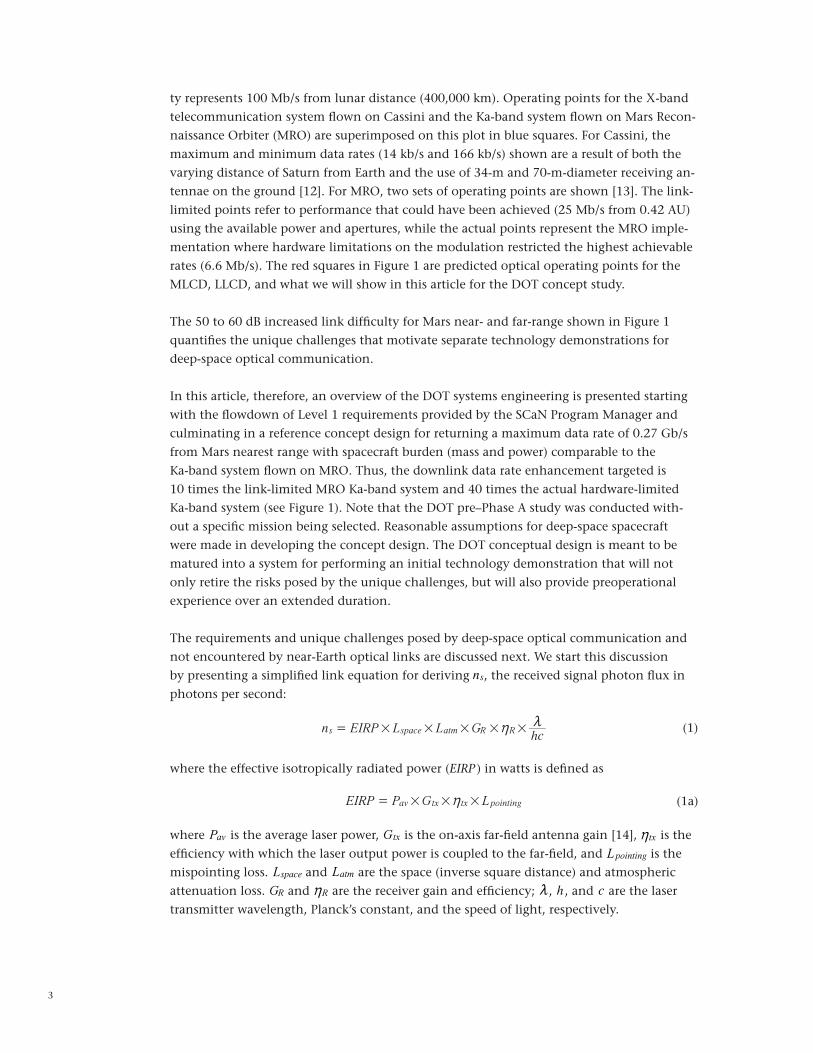
The key link conditions, namely, range, SEP angles, and SPE angles for a Mars orbiter mis-sion spacecraft during cruise and following insertion into circular orbit around Mars, are shown in Figure 2.
In Figure 2(a), the shaded portion covers the first 90 days following launch, during which post-launch checkout and calibration activities may prevent performing any optical link op-
Table 2. Link parameters of interest for some deep-space missions.
Potential HostSpacecraft
Range, AU
SEP Angle, deg
SPE Angle, deg
Max PA Angle, µrad
Max Doppler, ppm
Mission Duration, years
2018 Mars Cruise
2018 Mars Orbiter
2020 Jupiter Europa
Orbiter Cruise
Near-Earth Object
Venus Cruise
0.25–1.5
0.4–2.7
0.25–2.7
0.5–2.1
0.2–0.8
70–150
0–175
0–180
0–80
24–46
22–45
2–45
0.5–163
0–90
82–148
0.5
>5
4
1.7
0.2
50
70
120
TBD
50
180
400
1400
TBD
250

8
erations. Figure 2(b) shows the periodic variation of the range, SEP angles, and SPE angles. The apparent angular diameter of Earth as observed from Mars changes as does the Sun-illu-minated fraction. The extremes of this variation, namely, fully illuminated smallest angular diameter (32 µrad) Earth at the farthest Mars range, and crescent Earth with largest angu-lar diameter (225 µrad) at Mars nearest range are represented by icons in Figure 2(b). The upwelling radiance from the Sun-illuminated Earth is imaged on the flight optical terminal telescope focal plane; therefore, the brightness and angular diameter are of significance. The DOT demonstration is required to operate to within SEP and SPE angle limits of 5 deg and 3 deg, respectively, resulting in a one-month outage over two Earth years, as indicated in Figure 2(b).
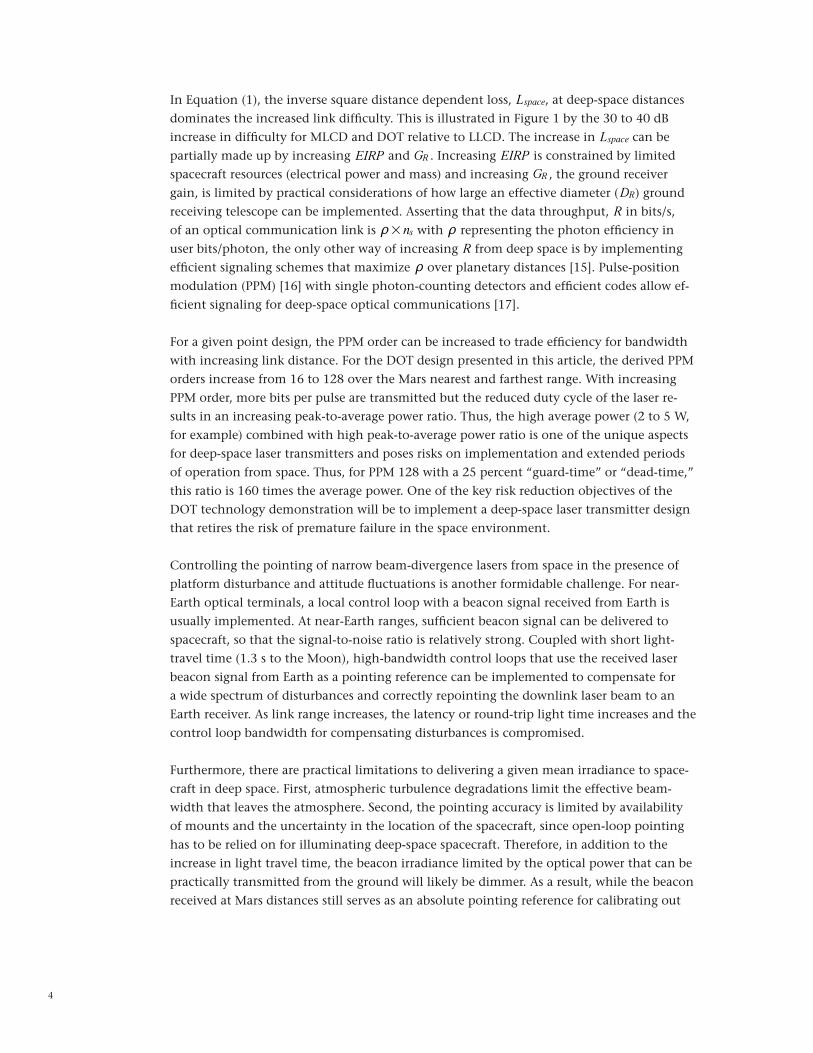
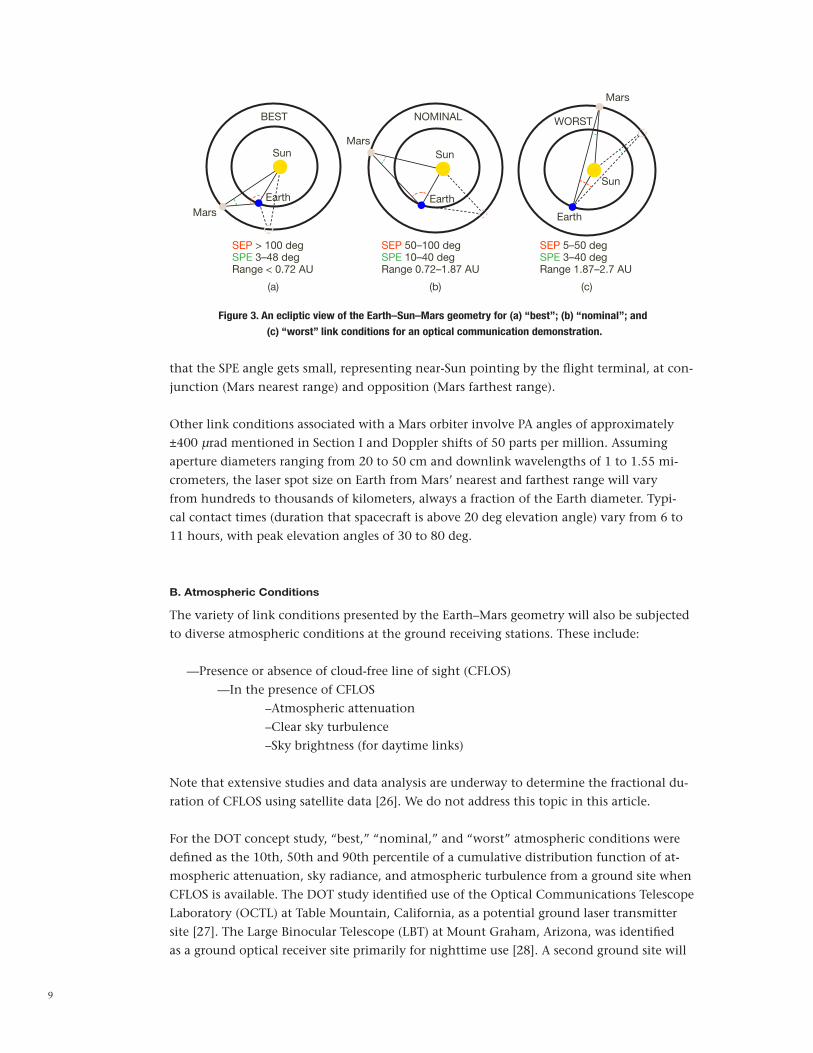
The link conditions are classified as “best,” “nominal,” and “worst,” shown graphically and defined in Figure 3 to describe the link in terms of range and increased additive background noise due to daytime conditions at the ground receiver as the SEP angles get smaller. Note
Figure 2. (a) Range, SEP, and SPE of Mars-bound spacecraft during cruise; (b) range, SEP, and SPE of Mars.
1.5
200
100
3
2
1
0200
150
100
50
0
1
150
0.5
100
50
0
50
00
Epoch May 25, 2018
Aug 28, 2019 (2.7 AU) Sep 24, 2021 (2.7 AU)
Days
Days, Epoch January 14, 2019
SP
E, d
egS
PE
, deg
Ran
ge, A
UR
ange
, AU
Sun
Ang
le, d
eg
Oct 15, 2020 (0.4 AU)
Bright Earth32 mrad
30-day OutageSEP < 5° SPE < 3°
CrescentEarth 225 mrad
50
(a)
(b)
100
0 200 400 600 800 1000 1200
SEPSPE
150 200 250
9
that the SPE angle gets small, representing near-Sun pointing by the flight terminal, at con-junction (Mars nearest range) and opposition (Mars farthest range).
Other link conditions associated with a Mars orbiter involve PA angles of approximately ±400 µrad mentioned in Section I and Doppler shifts of 50 parts per million. Assuming aperture diameters ranging from 20 to 50 cm and downlink wavelengths of 1 to 1.55 mi-crometers, the laser spot size on Earth from Mars’ nearest and farthest range will vary from hundreds to thousands of kilometers, always a fraction of the Earth diameter. Typi-cal contact times (duration that spacecraft is above 20 deg elevation angle) vary from 6 to 11 hours, with peak elevation angles of 30 to 80 deg.
B. Atmospheric Conditions
The variety of link conditions presented by the Earth–Mars geometry will also be subjected to diverse atmospheric conditions at the ground receiving stations. These include:
—Presence or absence of cloud-free line of sight (CFLOS) —In the presence of CFLOS –Atmospheric attenuation –Clear sky turbulence –Sky brightness (for daytime links)
Note that extensive studies and data analysis are underway to determine the fractional du-ration of CFLOS using satellite data [26]. We do not address this topic in this article.
For the DOT concept study, “best,” “nominal,” and “worst” atmospheric conditions were defined as the 10th, 50th and 90th percentile of a cumulative distribution function of at-mospheric attenuation, sky radiance, and atmospheric turbulence from a ground site when CFLOS is available. The DOT study identified use of the Optical Communications Telescope Laboratory (OCTL) at Table Mountain, California, as a potential ground laser transmitter site [27]. The Large Binocular Telescope (LBT) at Mount Graham, Arizona, was identified as a ground optical receiver site primarily for nighttime use [28]. A second ground site will
Figure 3. An ecliptic view of the Earth–Sun–Mars geometry for (a) “best”; (b) “nominal”; and
(c) “worst” link conditions for an optical communication demonstration.
BEST NOMINAL WORST
Mars
(a) (b) (c)
Mars
Mars
Earth Earth
Earth
Sun Sun
Sun
SEP > 100 degSPE 3–48 degRange < 0.72 AU
SEP 50–100 degSPE 10–40 degRange 0.72–1.87 AU
SEP 5–50 degSPE 3–40 degRange 1.87–2.7 AU
10
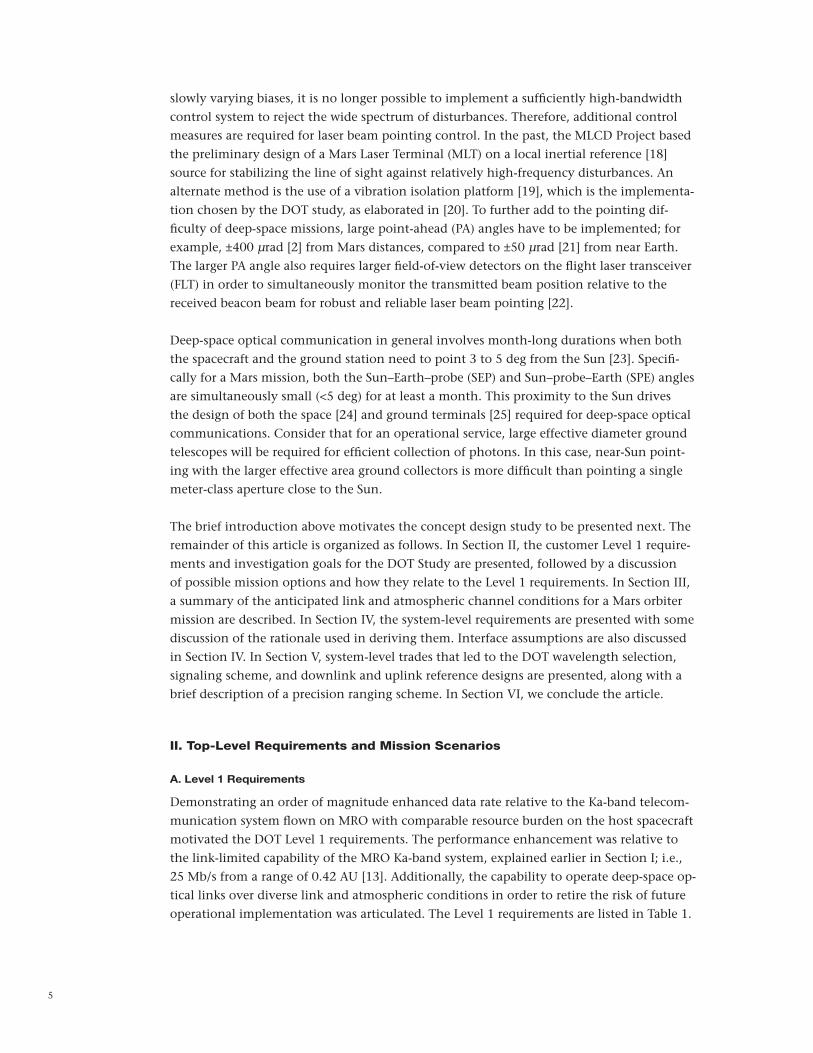
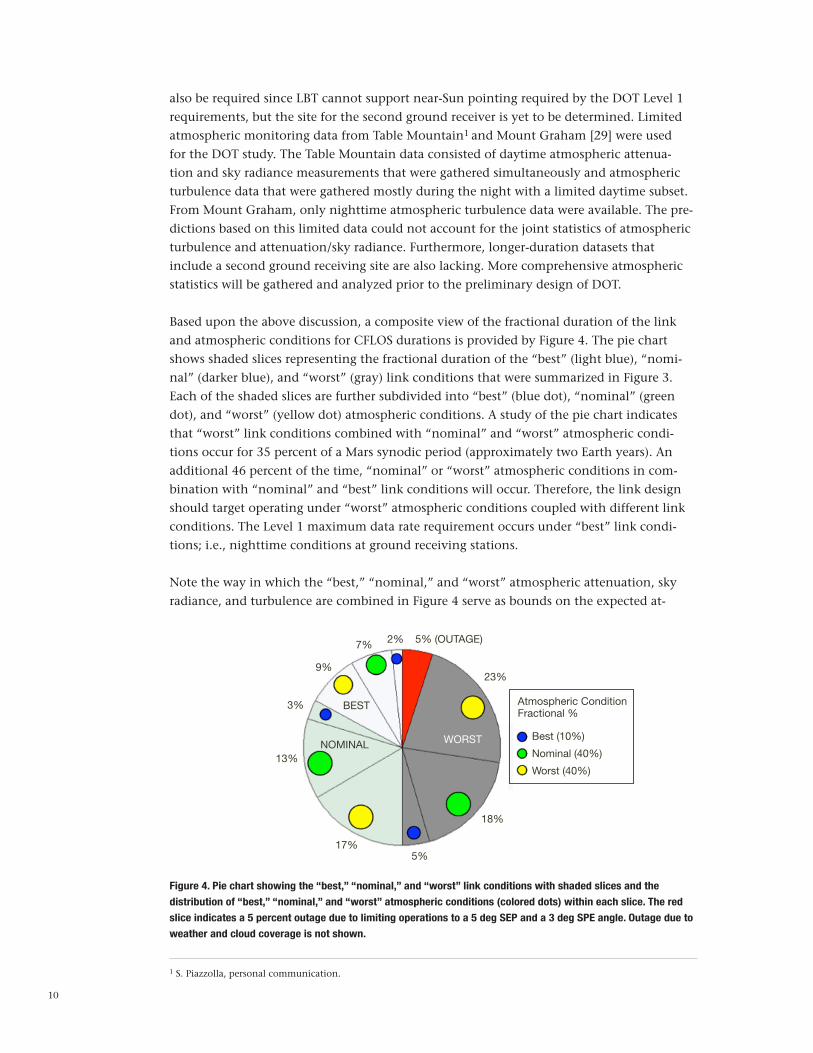
Figure 4. Pie chart showing the “best,” “nominal,” and “worst” link conditions with shaded slices and the
distribution of “best,” “nominal,” and “worst” atmospheric conditions (colored dots) within each slice. The red
slice indicates a 5 percent outage due to limiting operations to a 5 deg SEP and a 3 deg SPE angle. Outage due to
weather and cloud coverage is not shown.
1 S. Piazzolla, personal communication.
also be required since LBT cannot support near-Sun pointing required by the DOT Level 1 requirements, but the site for the second ground receiver is yet to be determined. Limited atmospheric monitoring data from Table Mountain1 and Mount Graham [29] were used for the DOT study. The Table Mountain data consisted of daytime atmospheric attenua-tion and sky radiance measurements that were gathered simultaneously and atmospheric turbulence data that were gathered mostly during the night with a limited daytime subset. From Mount Graham, only nighttime atmospheric turbulence data were available. The pre-dictions based on this limited data could not account for the joint statistics of atmospheric turbulence and attenuation/sky radiance. Furthermore, longer-duration datasets that include a second ground receiving site are also lacking. More comprehensive atmospheric statistics will be gathered and analyzed prior to the preliminary design of DOT.
Based upon the above discussion, a composite view of the fractional duration of the link and atmospheric conditions for CFLOS durations is provided by Figure 4. The pie chart shows shaded slices representing the fractional duration of the “best” (light blue), “nomi-nal” (darker blue), and “worst” (gray) link conditions that were summarized in Figure 3. Each of the shaded slices are further subdivided into “best” (blue dot), “nominal” (green dot), and “worst” (yellow dot) atmospheric conditions. A study of the pie chart indicates that “worst” link conditions combined with “nominal” and “worst” atmospheric condi-tions occur for 35 percent of a Mars synodic period (approximately two Earth years). An additional 46 percent of the time, “nominal” or “worst” atmospheric conditions in com-bination with “nominal” and “best” link conditions will occur. Therefore, the link design should target operating under “worst” atmospheric conditions coupled with different link conditions. The Level 1 maximum data rate requirement occurs under “best” link condi-tions; i.e., nighttime conditions at ground receiving stations.
Note the way in which the “best,” “nominal,” and “worst” atmospheric attenuation, sky radiance, and turbulence are combined in Figure 4 serve as bounds on the expected at-
Atmospheric ConditionFractional %
Best (10%)
Nominal (40%)
Worst (40%)
5% (OUTAGE)2%7%
9%
3%
13%
17%5%
18%
23%
BEST
NOMINAL WORST

11
mospheric conditions. This does not take into account how the actual attenuation, sky radiance, and turbulence distributions at a particular site combine. A known observation relative to daytime atmospheric turbulence, for example, is its correlation with time of day. When Mars is at the farthest range and the spacecraft rises in the morning, the attenuation and sky radiance are worst because of the large airmass through which the downlink laser propagates. However, the turbulence may be at its best based on the time of day. These real effects are not represented in the bounding approach in Figure 4.
IV. DOT CONOPS and System Requirements
A. Concept of Operations (CONOPS)
A strawman CONOPS to be further developed in the preliminary design stage is described next. We assume that the DOT FLT is body mounted to the spacecraft. Furthermore, we also assume that the spacecraft points the FLT to Earth with approximately ±3 mrad accuracy as reported for previously flown body-mounted telecommunications systems [30]2. This will serve as the coarse pointing of the FLT.
Following launch and initial checkout, link sessions will be scheduled at least once a month based on the best weather predictions and site statistics availability. The first activity for a scheduled link session will be to send a command file from the DOT Mission Operations Center (MOC) to the spacecraft Mission Operations Center (SMOC), for subsequent trans-mission to the spacecraft, at least a month in advance. The command file will be transmit-ted from the Deep Space Network (DSN), and the spacecraft command and data handling (C&DH) subsystem will route it to a command buffer on the FLT. The command file will include both schedule and command sequences required for establishing the link. Updates to this command file may be delivered at least a week in advance of the scheduled link ses-sion. At the scheduled time, the spacecraft will point the FLT to Earth. The optical terminal will then utilize onboard attitude and ephemeris knowledge updated through the spacecraft guidance, navigation, and control (GNC) subsystem and its own local steering capability of ±5 mrad (see Section IV.C) to refine FLT pointing in order to “stare” at Earth with a field of view (FOV) designed to accommodate the ±400 µrad point-ahead angle with some margin. The FOV is approximately 1 mrad. Note that the maximum angular diameter of Earth from near-Mars range is 225 µrad; thus, Earth will always be fully imaged on the focal plane. Co-ordinated through the MOC, the ground laser transmitter (GLT) will uplink a laser beacon to illuminate the FLT aperture at the scheduled time. The GLT will use spacecraft ephemeris predicts to transmit the laser beam to the spacecraft and the laser will be modulated. Under nominal operating conditions, the FLT will acquire the uplink laser both spatially and tem-porally and then use it as a pointing reference to accurately “dial-in” the PA angle so that the downlink laser can be sent back to the ground receiving station. The FLT acquisition tracking and pointing subsystem is rejecting spacecraft disturbance with a hybrid passive-ac-tive isolation system described in [19,20]. In the meantime, the MOC will alert the ground laser receiver (GLR) to prepare for downlink acquisition using ephemeris predicts. Upon being illuminated by the downlink, a sequence will be initiated to temporally, spatially, and spectrally acquire the downlink signal. At this stage, both the FLT and GLR have acquired
2 See also [12], page 63.
12
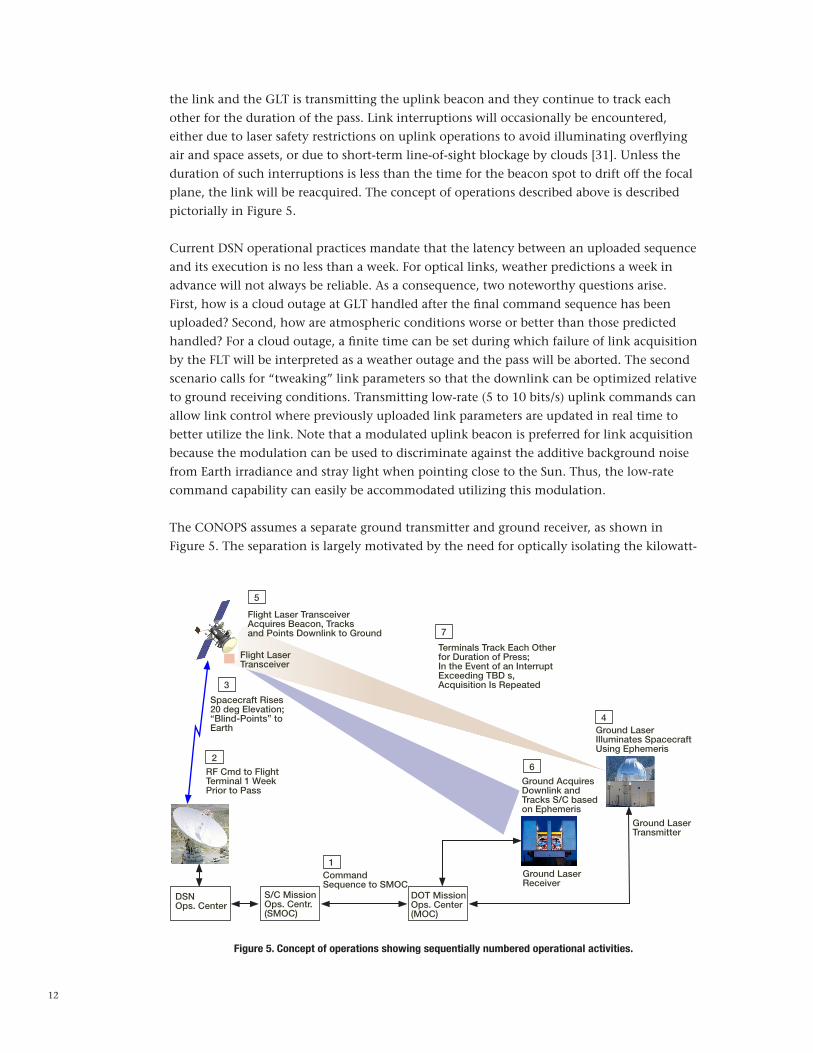
the link and the GLT is transmitting the uplink beacon and they continue to track each other for the duration of the pass. Link interruptions will occasionally be encountered, either due to laser safety restrictions on uplink operations to avoid illuminating overflying air and space assets, or due to short-term line-of-sight blockage by clouds [31]. Unless the duration of such interruptions is less than the time for the beacon spot to drift off the focal plane, the link will be reacquired. The concept of operations described above is described pictorially in Figure 5.
Current DSN operational practices mandate that the latency between an uploaded sequence and its execution is no less than a week. For optical links, weather predictions a week in advance will not always be reliable. As a consequence, two noteworthy questions arise. First, how is a cloud outage at GLT handled after the final command sequence has been uploaded? Second, how are atmospheric conditions worse or better than those predicted handled? For a cloud outage, a finite time can be set during which failure of link acquisition by the FLT will be interpreted as a weather outage and the pass will be aborted. The second scenario calls for “tweaking” link parameters so that the downlink can be optimized relative to ground receiving conditions. Transmitting low-rate (5 to 10 bits/s) uplink commands can allow link control where previously uploaded link parameters are updated in real time to better utilize the link. Note that a modulated uplink beacon is preferred for link acquisition because the modulation can be used to discriminate against the additive background noise from Earth irradiance and stray light when pointing close to the Sun. Thus, the low-rate command capability can easily be accommodated utilizing this modulation.
The CONOPS assumes a separate ground transmitter and ground receiver, as shown in Figure 5. The separation is largely motivated by the need for optically isolating the kilowatt-
Figure 5. Concept of operations showing sequentially numbered operational activities.
Ground AcquiresDownlink andTracks S/C basedon Ephemeris
Flight Laser TransceiverAcquires Beacon, Tracksand Points Downlink to Ground
Flight LaserTransceiver
DSNOps. Center
S/C MissionOps. Centr.(SMOC)
CommandSequence to SMOC
DOT MissionOps. Center(MOC)
Ground LaserReceiver
1
2
3
4
5
6
7
Ground LaserTransmitter
Ground LaserIlluminates SpacecraftUsing Ephemeris
Terminals Track Each Otherfor Duration of Press;In the Event of an InterruptExceeding TBD s,Acquisition Is Repeated
RF Cmd to FlightTerminal 1 WeekPrior to Pass
Spacecraft Rises20 deg Elevation;“Blind-Points” toEarth
13
level uplink transmitter signal from the downlink receiver. Single photon-sensitive receivers used for detecting the faint downlink signal from space make the need for the optical isola-tion to be >150 dB [15]. Point-ahead considerations further complicate use of a common aperture.
Since the entire Earth disc is imaged by the spacecraft FOV, as pointed out above, the separate GLR and GLT do not necessarily need to be co-located. We can take advantage of this fact especially in designing deep-space optical link demonstrations, where cost savings can be realized by using existing assets, separated by hundreds of kilometers. Larger GLR and GLT angular separations on Earth will result in longer time gaps between the spacecraft rising or setting over either station. Since simultaneous line of sight to the spacecraft from both GLT and GLR are needed in order to maintain the link, larger angular separations translate into reduced contact time. For future IOC, having clear weather simultaneously at both the GLR and GLT sites is highly desirable in order to maintain highest possible avail-ability, so either co-locating or locating them in known correlated weather cells will be an important consideration.
Variations in the nominal CONOPS described above may result when a real mission is selected. For example, if mission science restricts the spacecraft from assisting the coarse pointing of the FLT, then a gimbaled flight terminal will be implemented so that the FLT also controls its own coarse pointing. We have not elaborated further on this implementa-tion in this article.
B. Flowdown of System-Level Requirements
The flowdown of system requirements from Level 1 requirements presented in Section II is divided into the following categories:
• Performance
• Operational
• Implementation
System Performance
The maximum downlink data rate flows directly out of requirement L1.2 (see Section II) where a 10× increase relative to the MRO Ka-band link-limited performance is sought. The DOT maximum downlink data rate required is at least 250 Mb/s from 0.42 AU. The DOT system was also required to close the link out to distances of 2.7 AU at SEP/SPE angles down to 5 deg/3 deg.
L1.1.1 requires retiring the risk for future IOC with an extensible flight terminal architec-ture. Future optical deep-space IOC described in the SCaN ADD calls out uplink data rates and ranging capabilities in addition to high-rate downlink [1]. Therefore, uplink data rates and precision ranging were included as DOT system requirements. An uplink data rate requirement of at least 200 kb/s at 0.42 AU and precision ranging of 30 cm were articulated. These data rates and ranging precision were derived in order to advance the technology significantly without overburdening the DOT design. Thus, the uplink data rate capabil-

14
ity would retire the risk of implementing future higher uplink data rates of 2 Mb/s at 1 AU called for in the SCaN ADD.
In addition to instantaneous data rates, the capability of the DOT system to return substan-tial data volume was also added to the performance requirements. A maximum downlink data volume of 2.8 Tb per pass for two passes was required. Downlink at the maximum data rate for approximately 3 hr could satisfy this requirement, for example. Likewise, for uplink a maximum data volume of 2 Gb per pass was required.
DOT Operational Requirements
A key question in deriving requirements was: how often must the DOT link operate in order to retire the risk for IOC? While performing more links provides experience for NASA, it will also drive the operations cost up. Therefore, we approached this question from the standpoint of the minimum number of successful links required for a “worthwhile technol-ogy demonstration.” We defined the latter as one that samples the diverse operating condi-tions at least twice. The rationale for repeating links under more or less identical conditions is to measure the variance in link performance. The frequency of occurrence of the different conditions could be determined independently without the link operating, and with these two pieces of information future mission designers could make reasonable estimates of the volume of information that could be returned. Following this logic, we proposed 10 links under the worst (farthest range and minimum SEP/SPE angles) link conditions and four links under the best link (maximum data rate) conditions. In addition, at least two link op-portunities at other representative operating points were proposed. This added up to a total of 34 link opportunities, as shown in Table 3. Note that during cruise, the planet Mars is
Mission/Dates
Table 3. List of the minimum set of link opportunities deemed necessary for a
complete technology demonstration.
Days/%
Mars Range ±0.12, AU
Min SEP, deg
Max SEP, deg
SPE, deg
% Earth Lit
% Mars Lit
Min Links Targeted
Mars Cruise Mission
Nov 2018 15 d 0.54 122 135 34 15–20 NA 2
Jan 2018 15 d 0.9 101 110 40 30–45 NA 2
Mar 2019 20 d 1.38 80 84 37 50 NA 2
Mars Orbit Mission
Jul–Oct 2019 25% 2.56 5 18 3-10 98–100 99 10
Nov–Dec 2019 10% 2.33 18 45 11-36 75–98 95–99 2
Dec’19–Jan’20 7% 2.10 45 55 36 75–80 94 2
Jan–Feb 2020 7% 1.87 55 62 36 55–75 91 2
Feb–Mar 2020 7% 1.64 62 70 36–40 50–55 90 2
Mar–Apr 2020 7% 1.42 70 80 40–43 50 87–90 2
Apr–May 2020 7% 1.19 80 90 43–46 40–50 86–87 2
May–Jun 2020 8% 0.96 90 110 44–46 10–40 86 2
Jun–Aug 2020 8% 0.73 110 130 33–44 4–10 86–91 2
Aug–Oct 2020 14% 0.50 130 179 3–33 0–4 91–94 2
TOTAL 34
15
not in the line of sight and not applicable (NA) is listed for the percent of Mars illuminated in Table 3.
A requirement for near-real-time link control was derived based on the discussion presented under the concept of operations (see Section IV.A). Operational requirements for logging and monitoring all system and channel parameters were also included.
DOT Implementation
The DOT implementation requirements are driven by the Level 1 parents L1.1.2, L1.1.3, and L1.3, which articulate a mission lifetime of five years, compatibility with a maximal set of launch vehicles, and comparable mass and power to the Ka-band system flown on MRO.
The mission lifetime requirement is carried over verbatim in the system-level requirements and will be used to flow down mission assurance requirements, such as mission class in ac-cordance with NASA NPR 8705.4 [32] and parts selection.
A system requirement was derived in order to meet the loads associated with Atlas-V, Delta-IV, Ariane-5, Soyuz, and Zenit launch vehicles. Further analysis is needed in order to validate the placekeeper system requirement on launch compatibility; specifically, a better understanding of the mass-acceleration curve as it applies to the FLT, the acoustic environ-ments, and whether special shake testing will be required for small parts of the FLT [33]3.
A spacecraft body-mounted FLT was presumed. The MRO Ka-band system was not body mounted but articulated by a gimbal. Including the gimbal, the mass and power of the Ka-band system flown on MRO was 82 kg and 118 W, while without the gimbal these were 37 kg and 100 W. Based on the above, a mass and power requirement of 38 kg and 110 W was levied on the DOT FLT. If our assumption of a body-mounted FLT is wrong and a gim-bal has to be added to maintain pointing of the laser back to Earth, the FLT mass and power allocation would be increased to 45 kg and 120 W.
C. Role of Spacecraft and Interface Assumptions
The DOT FLT is planned as a technology demonstration; its primary purpose is not to downlink mission data and telemetry, though interfaces for accomplishing this on an ad hoc basis will be designed. However, there will be no demands on spacecraft memory for buffering data that could not be transmitted over the optical link due to weather outage.
The coarse pointing accuracy by the spacecraft, mentioned earlier, is specified in accordance with requirements for a high-gain RF antenna. However, we recognize that there may be boresight misalignment between the FLT and the RF high-gain antenna. In fact, it is reason-able to expect such a misalignment, because at the time of launch the RF antenna boresight will not be properly known. In order to accommodate this uncertainty, a requirement lev-ied on the DOT system design is a ±5-mrad steering capability for the FLT, so that any static misalignment can be corrected by the FLT. We expect that with this flexibility, the FLT will
3 R. F. Tillman, “Notes on the Usage of the Mass Acceleration Curve,” JPL Interoffice Memorandum 3541-93-114 (internal document), Jet Propulsion Laboratory, Pasadena, California, May 28, 1993, revised May 12, 1995.
16
be able to utilize link opportunities whenever the spacecraft points the RF antenna back to Earth.
A draft of interface assumptions and a set of FLT environmental requirements with some to- be-determined (TBD) items were presumed for guiding the FLT design, even though a mission was not identified for the DOT concept study.4 The key assumptions are briefly mentioned here without elaboration.
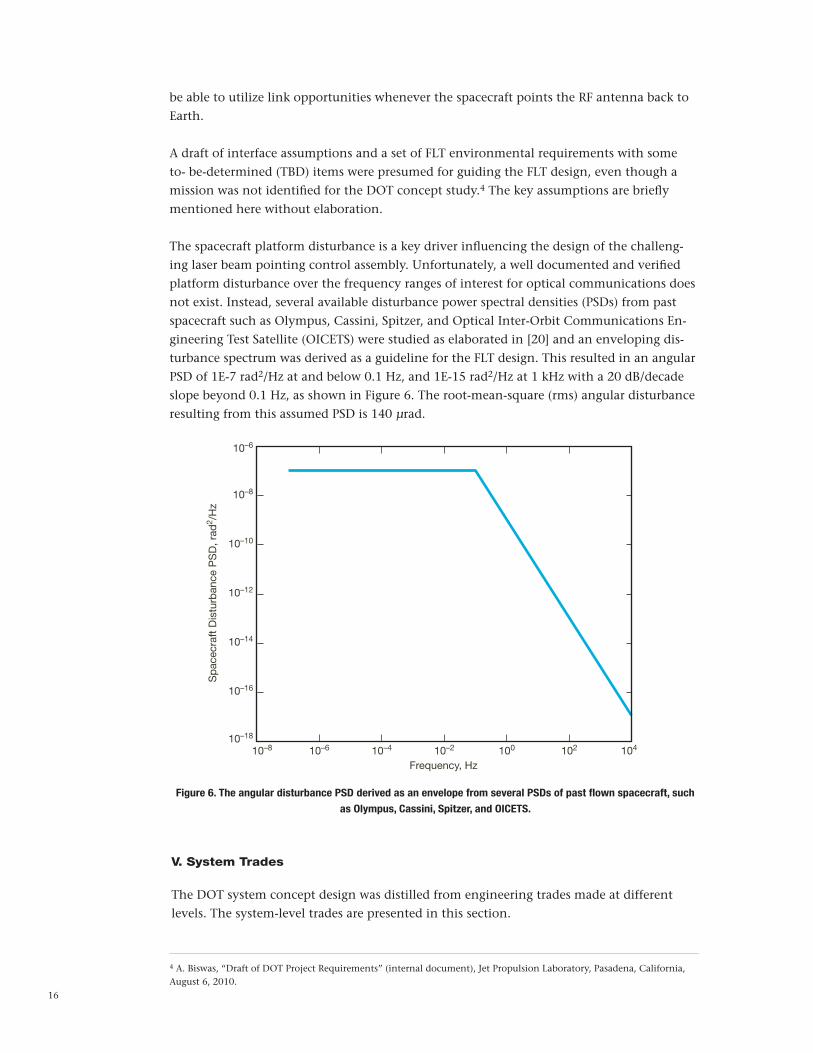
The spacecraft platform disturbance is a key driver influencing the design of the challeng-ing laser beam pointing control assembly. Unfortunately, a well documented and verified platform disturbance over the frequency ranges of interest for optical communications does not exist. Instead, several available disturbance power spectral densities (PSDs) from past spacecraft such as Olympus, Cassini, Spitzer, and Optical Inter-Orbit Communications En-gineering Test Satellite (OICETS) were studied as elaborated in [20] and an enveloping dis-turbance spectrum was derived as a guideline for the FLT design. This resulted in an angular PSD of 1E-7 rad2/Hz at and below 0.1 Hz, and 1E-15 rad2/Hz at 1 kHz with a 20 dB/decade slope beyond 0.1 Hz, as shown in Figure 6. The root-mean-square (rms) angular disturbance resulting from this assumed PSD is 140 µrad.
4 A. Biswas, “Draft of DOT Project Requirements” (internal document), Jet Propulsion Laboratory, Pasadena, California, August 6, 2010.
Figure 6. The angular disturbance PSD derived as an envelope from several PSDs of past flown spacecraft, such
as Olympus, Cassini, Spitzer, and OICETS.
10–8 10–6
10–6
10–8
10–10
10–12
10–14
10–16
10–18
10–4 10–2 100 102 104
Frequency, Hz
Sp
acec
raft
Dis
turb
ance
PS
D, r
ad2 /
Hz
V. System Trades
The DOT system concept design was distilled from engineering trades made at different levels. The system-level trades are presented in this section.
17
A. Signaling and Laser Trades
The end-to-end bidirectional signaling scheme, including the laser carrier wavelengths that overarch the DOT system, were traded first.
Signaling
The objective of the signaling trade was to achieve maximum power efficiency (bits/pho-ton) while preserving ease of implementation and operations for the DOT system. The major signaling decisions were to select the detection method, range of slot widths, modu-lation, error-correction code, and synchronization markers. A detailed summary of these trades was discussed in a presentation to the Instrument Concept Review (ICR) Board.5 We summarize those decisions in the following sections on the downlink and uplink.
Downlink Signaling Trades
The primary functions of the downlink signaling are to support the range of targeted down-link data rates (including the maximum data rate >0.25 Gb/s at 0.42 AU) with high power efficiency while aiding downlink temporal acquisition and supporting ranging.
Direct and coherent detection were considered. Atmospheric turbulence causes degradation of the downlink wavefront reaching the ground with atmospheric coherence length, r0, of tens of centimeters at best. In order to utilize coherent detection, either the distorted wave-front must be corrected using adaptive optics [34], or a collecting aperture diameter of the order of r0, i.e., approximately 5 to 10 cm, must be used. The latter approach was recently demonstrated using the strong signal from a LEO spacecraft [35,36]; however, the limited aperture diameter size would not be viable for the weak signals from deep space. Tradi-tional adaptive optics techniques for correcting the downlink are not feasible for detect-ing a deep-space optical communication downlink, either because of the lack of a reliable reference or the large PA angles that exceed the anisoplanatic angle. Moreover, for the DOT operating regime, direct detection with photon counting is more power efficient, leading to the selection of direct detection with photon counting (DD-PC). In general, narrower slot widths support more efficient signaling. However, slot widths below 50 ps are prohibited by photon-counting detector jitter limitations [37]. In order to maintain a low implementation risk for the flight avionics, a minimum slot width of 0.5 ns was chosen. All Level 1 require-ments could be met with this selection. Discussion of the maximum downlink slot width is deferred to the end of this section. PPM was selected over alternatives, as it provides near-optimum power efficiency at the targeted operating regime (given a DD-PC detector) and has low implementation complexity [16]. The PPM orders were determined by data rate requirements and peak power limitations of the laser transmitter, which limits the maxi-mum supportable PPM order. For DOT, the maximum PPM order was 128.
Synchronization (sync) markers would be embedded in the signal to facilitate robust, low-complexity timing acquisition at all operating points. Two options were considered for sync markers: the periodic insertion of fixed PPM symbols (essentially a pilot tone) or the appending of empty “guard-time” slots to each PPM symbol. The guard-time approach was selected (with duration 25 percent of the PPM symbol time) due to lower implementa-
5 B. Moision, K. Quirk, A. Biswar, and S. Piazzolla, “Signaling, Modulation, and Coding (Downlink and Uplink),” presen-tation to ICR Board, August 10, 2010.

18
tion complexity. Candidate error-correction codes (ECCs) focused on modern, iteratively decoding techniques, which provide high power efficiency. Serially concatenated PPM (SCPPM) [38] was selected, as it is the most power-efficient solution known for the expected operating points. Three user-selectable discrete code rates of 0.33, 0.5, and 0.66 were also implemented. The plane defined by the detected signal and noise photoelectron flux is shown in Figure 7 and can be distilled down to 26 downlink rates, each one separated by approximately 1.5 dB and spanning data rates from 13 kb/s to 267 Mb/s.
Each line partitioning the space in Figure 7 is labeled with an achievable data rate in Mb/s. Operating points to the right of a partition line can achieve the data rate indicated. A data rate is said to be achievable if the capacity of the ideal Poisson PPM channel exceeds the data rate for that signal and noise power. A set of practically achievable points would require shifting the axes by non-ideal ground receiver losses (bookkept as a loss of 2.7 dB in signal power). To the left of the 0.057 Mb/s line, 0.013 Mb/s can be achieved as long as adequate signal-to-noise ratio (SNR) for link acquisition is achieved. Note that in order to achieve the discrete data rates within the PPM order, guard-time overhead, and code rates, slot widths up to of 256 ns are needed. The maximum laser pulse width is 8 ns for reasons elaborated in [20]. Slot widths larger than the maximum laser pulse width are effectively implemented by repeating symbols. It is worth noting that while the maximum laser pulse
Figure 7. Partitioning of the detected signal and noise photoelectron flux (pe/s) plane with throughput curves
derived from Poisson channel capacity using DD-PC and other signaling constraints. Each line is labeled with an
achievable data rate in Mb/s. Operating points to the right of any partition can achieve the data rate indicated.
Detected Signal Power, dB pe/s
Det
ecte
d N
oise
Pow
er, d
B p
e/s
45 50 55 60
90
85
80
75
70
65
6065 70 75 80 85
167
200
267
43.8
58.3
75 100
125
0.14
0.22
80.
365
0.60
80.
911
1.22
1.82
2.43
3.65
4.86
7.29
9.72
14.6
21.9
29.2
0.05
70.
0868
19
width does not restrict low data rates because of the relatively painless symbol repetition scheme, the availability of longer-pulse-width lasers would aid acquisition. This remains an area of exploration for future research.
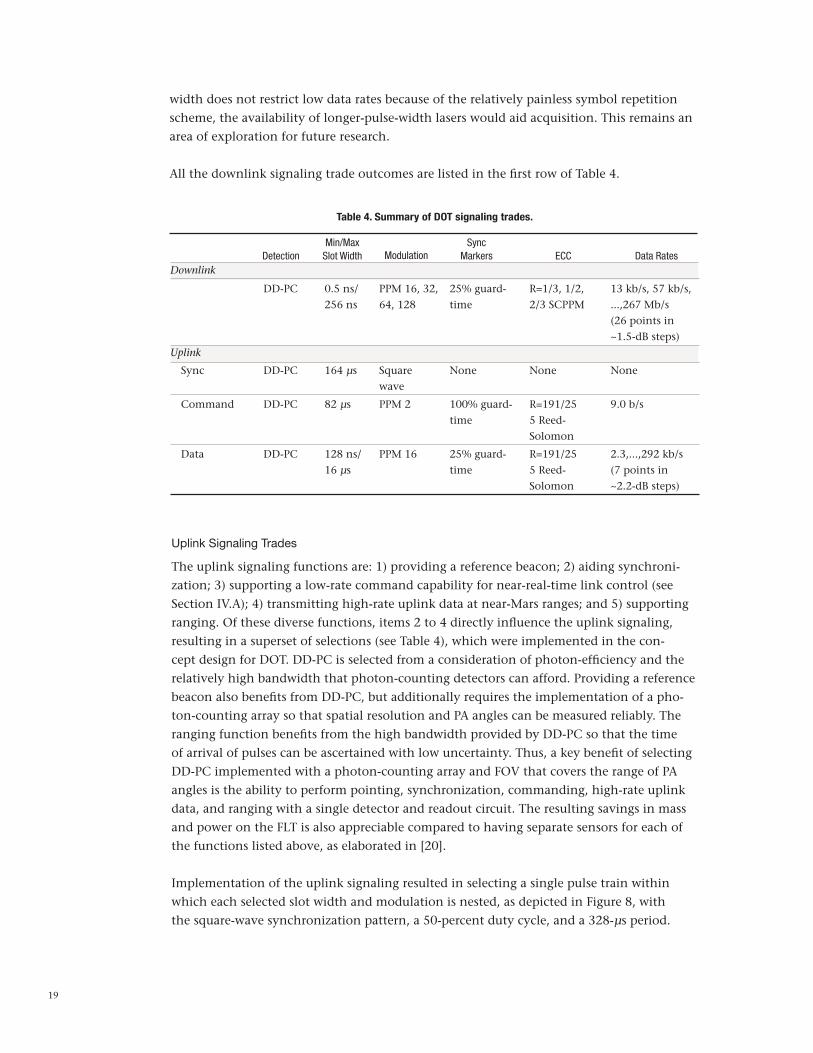
All the downlink signaling trade outcomes are listed in the first row of Table 4.
Table 4. Summary of DOT signaling trades.
Detection
Min/MaxSlot Width
Modulation
Sync Markers
ECC
Data Rates
Downlink
DD-PC 0.5 ns/ PPM 16, 32, 25% guard- R=1/3, 1/2, 13 kb/s, 57 kb/s, 256 ns 64, 128 time 2/3 SCPPM ...,267 Mb/s (26 points in ~1.5-dB steps)Uplink
Sync DD-PC 164 µs Square None None None wave
Command DD-PC 82 µs PPM 2 100% guard- R=191/25 9.0 b/s time 5 Reed- Solomon
Data DD-PC 128 ns/ PPM 16 25% guard- R=191/25 2.3,...,292 kb/s 16 µs time 5 Reed- (7 points in Solomon ~2.2-dB steps)
Uplink Signaling Trades
The uplink signaling functions are: 1) providing a reference beacon; 2) aiding synchroni-zation; 3) supporting a low-rate command capability for near-real-time link control (see Section IV.A); 4) transmitting high-rate uplink data at near-Mars ranges; and 5) supporting ranging. Of these diverse functions, items 2 to 4 directly influence the uplink signaling, resulting in a superset of selections (see Table 4), which were implemented in the con-cept design for DOT. DD-PC is selected from a consideration of photon-efficiency and the relatively high bandwidth that photon-counting detectors can afford. Providing a reference beacon also benefits from DD-PC, but additionally requires the implementation of a pho-ton-counting array so that spatial resolution and PA angles can be measured reliably. The ranging function benefits from the high bandwidth provided by DD-PC so that the time of arrival of pulses can be ascertained with low uncertainty. Thus, a key benefit of selecting DD-PC implemented with a photon-counting array and FOV that covers the range of PA angles is the ability to perform pointing, synchronization, commanding, high-rate uplink data, and ranging with a single detector and readout circuit. The resulting savings in mass and power on the FLT is also appreciable compared to having separate sensors for each of the functions listed above, as elaborated in [20].
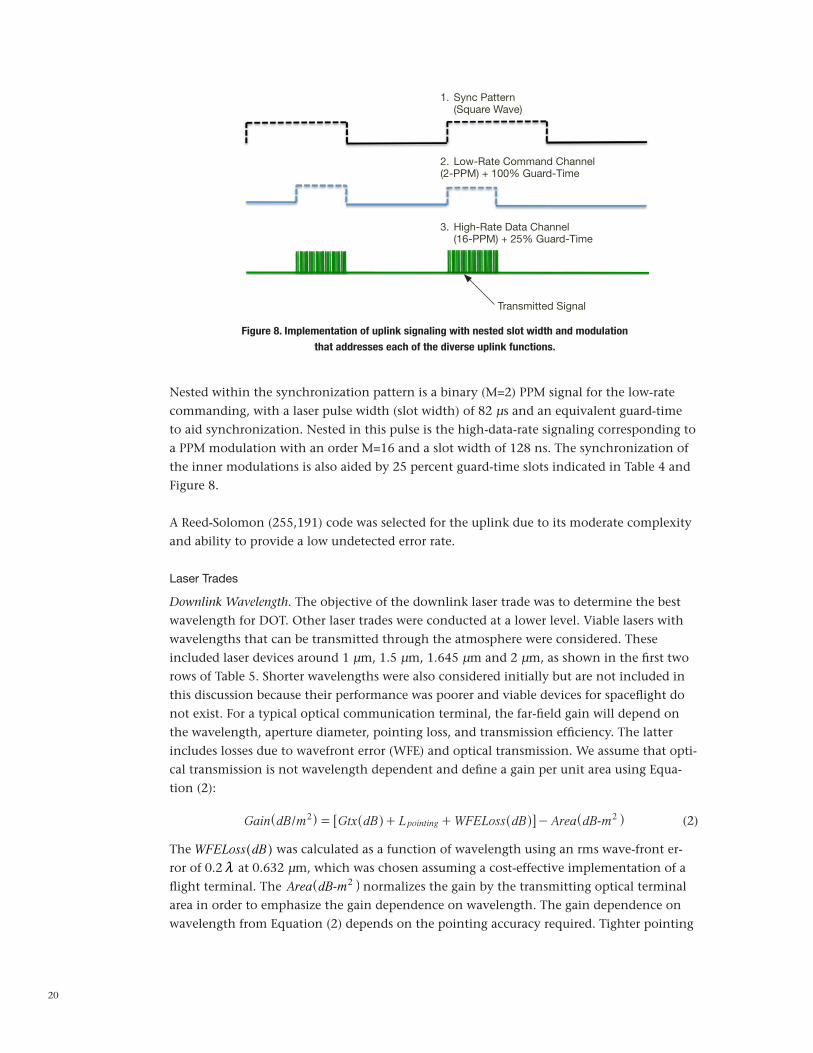
Implementation of the uplink signaling resulted in selecting a single pulse train within which each selected slot width and modulation is nested, as depicted in Figure 8, with the square-wave synchronization pattern, a 50-percent duty cycle, and a 328-µs period.
20
Figure 8. Implementation of uplink signaling with nested slot width and modulation
that addresses each of the diverse uplink functions.
Nested within the synchronization pattern is a binary (M=2) PPM signal for the low-rate commanding, with a laser pulse width (slot width) of 82 µs and an equivalent guard-time to aid synchronization. Nested in this pulse is the high-data-rate signaling corresponding to a PPM modulation with an order M=16 and a slot width of 128 ns. The synchronization of the inner modulations is also aided by 25 percent guard-time slots indicated in Table 4 and Figure 8.
A Reed-Solomon (255,191) code was selected for the uplink due to its moderate complexity and ability to provide a low undetected error rate.
Laser Trades
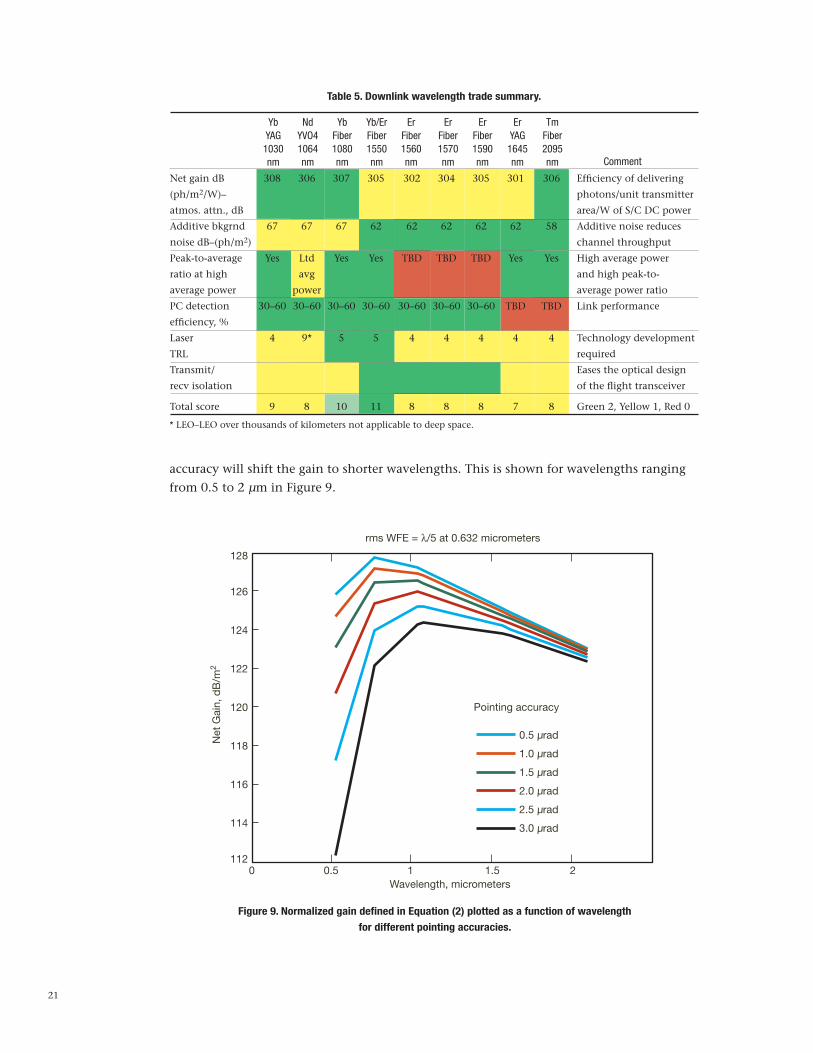
Downlink Wavelength. The objective of the downlink laser trade was to determine the best wavelength for DOT. Other laser trades were conducted at a lower level. Viable lasers with wavelengths that can be transmitted through the atmosphere were considered. These included laser devices around 1 µm, 1.5 µm, 1.645 µm and 2 µm, as shown in the first two rows of Table 5. Shorter wavelengths were also considered initially but are not included in this discussion because their performance was poorer and viable devices for spaceflight do not exist. For a typical optical communication terminal, the far-field gain will depend on the wavelength, aperture diameter, pointing loss, and transmission efficiency. The latter includes losses due to wavefront error (WFE) and optical transmission. We assume that opti-cal transmission is not wavelength dependent and define a gain per unit area using Equa-tion (2):
m/Gain dB m Gtx dB L WFELoss dB Area dBpointing
2 2= + + -^ ^ ^ ^h h h h6 @
The WFELoss dB^ h was calculated as a function of wavelength using an rms wave-front er-ror of 0.2 m at 0.632 µm, which was chosen assuming a cost-effective implementation of a flight terminal. The Area dB m2^ h normalizes the gain by the transmitting optical terminal area in order to emphasize the gain dependence on wavelength. The gain dependence on wavelength from Equation (2) depends on the pointing accuracy required. Tighter pointing
(2)
1. Sync Pattern (Square Wave)
2. Low-Rate Command Channel(2-PPM) + 100% Guard-Time
3. High-Rate Data Channel (16-PPM) + 25% Guard-Time
Transmitted Signal
-
-
21
accuracy will shift the gain to shorter wavelengths. This is shown for wavelengths ranging from 0.5 to 2 µm in Figure 9.
* LEO–LEO over thousands of kilometers not applicable to deep space.
Table 5. Downlink wavelength trade summary.
YbYAG1030nm
NdYVO41064nm
YbFiber1080nm
Yb/ErFiber1550nm
ErFiber1560nm
ErFiber1570nm
ErFiber1590nm
ErYAG1645nm
TmFiber2095nm Comment
Net gain dB 308 306 307 305 302 304 305 301 306 Efficiency of delivering
(ph/m2/W)– photons/unit transmitter
atmos. attn., dB area/W of S/C DC power
Additive bkgrnd 67 67 67 62 62 62 62 62 58 Additive noise reduces
noise dB–(ph/m2) channel throughput
Peak-to-average Yes Ltd Yes Yes TBD TBD TBD Yes Yes High average power
ratio at high avg and high peak-to-
average power power average power ratio
PC detection 30–60 30–60 30–60 30–60 30–60 30–60 30–60 TBD TBD Link performance
efficiency, %
Laser 4 9* 5 5 4 4 4 4 4 Technology development
TRL required
Transmit/ Eases the optical design
recv isolation of the flight transceiver
Total score 9 8 10 11 8 8 8 7 8 Green 2, Yellow 1, Red 0
Figure 9. Normalized gain defined in Equation (2) plotted as a function of wavelength
for different pointing accuracies.
Wavelength, micrometers
rms WFE = l/5 at 0.632 micrometers
Pointing accuracy
0.5 µrad
1.0 µrad
1.5 µrad
2.0 µrad
2.5 µrad
3.0 µrad
128
126
124
122
120
118
116
114
1120 0.5 1 1.5 2
Net
Gai
n, d
B/m
2

22
For the present trade, a pointing accuracy of 2.5 µrad (3-sigma) was chosen. A net gain ex-pressed in dB-ph/m2/W was derived by scaling the gain with the wall-plug efficiency of the lasers considered. Furthermore, the atmospheric loss was also added to the net gain and the results of this are shown in the first row of Table 5, where a relative color scheme of green (favored) yellow (acceptable) and red (not acceptable or not known) is used.
In the second row of Table 5, the additive background noise in dB-(ph/m2) for near-Sun pointing with an SEP angle of 5 deg was estimated as a function of wavelength. In the third row, the all-important peak-to-average power ratio at high average power (2 to 10 W) was compared. For some laser devices, this is not known since pulsed lasers have not been reported to the best of our knowledge, and these are marked red with a TBD. The photon-counting detection efficiency hDetEff^ h at the different wavelengths is compared, as is the technology readiness level (TRL). Finally, an important design consideration is transmit–receive–wavelength isolation at the FLT. Since a faint signal is being detected and several watts are being transmitted out of the same telescope, poor wavelength isolation could make uplink detection problematic by possible spillover of the downlink transmitter signal. The relative difficulty of obtaining high-power 1550-nm lasers for uplink, coupled with the availability of high-power 1-micrometer lasers, favors the choice of 1550 nm for downlink and 1 micrometer for uplink to help transmit–receive wavelength isolation. At other higher wavelengths, like 1645 and 2095 nm, the feasibility of receiving 1-micrometer lasers was not explored in detail and are marked yellow. In order to complete the trade, a score of 2 was assigned to green entries, 1 was assigned to yellow entries, and red entries were assigned 0. The scores represent a relative comparison and are semiquantitative at best. Notwithstanding this fact, a tally of the scores in the last row of Table 5 favors the 1550-nm device based on a ytterbium-erbium (Yb:Er)–doped fiber laser and the Yb-doped fiber laser at 1080 nm. However, 1550 nm is favored by transmit–receive isolation consid-erations, with the caveat that if electrical wall-plug efficiency at the spacecraft were given a higher weight, 1080 nm would be favored. As our remaining trades will show, this was not the case for DOT; furthermore, the uplink trades favor a 1030-nm uplink laser because of the high power demands, and given this choice 1550 nm is favored on the downlink for transmit–receive isolation purposes.
Uplink Laser. The uplink laser trades were carried out in order to determine the wavelength, beam divergence, and the number of beams to be transmitted in order to mitigate the atmospheric turbulence–induced fades. The uplink laser functions are to deliver an absolute pointing reference signal to the FLT, to support high-rate data, low-rate commands, syn-chronization, and ranging. The laser modulation will follow the uplink signaling scheme presented above.
Viable uplink wavelengths are determined by the availability of high-power lasers and transmission through the atmosphere. Figure 10 shows atmospheric transmission loss in decibels versus wavelength at 70 deg zenith angle from a location 2 km above sea level, with red diamonds representing potential laser lines for uplink labeled across the top of the plot.
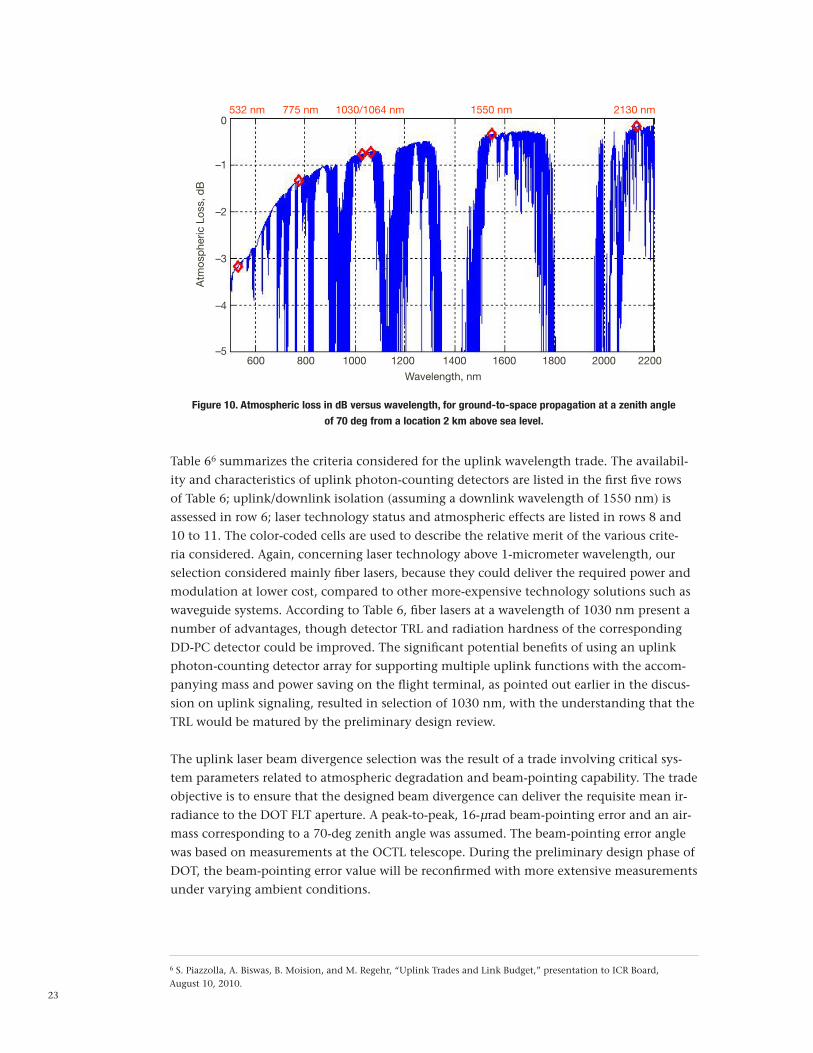
23
Figure 10. Atmospheric loss in dB versus wavelength, for ground-to-space propagation at a zenith angle
of 70 deg from a location 2 km above sea level.
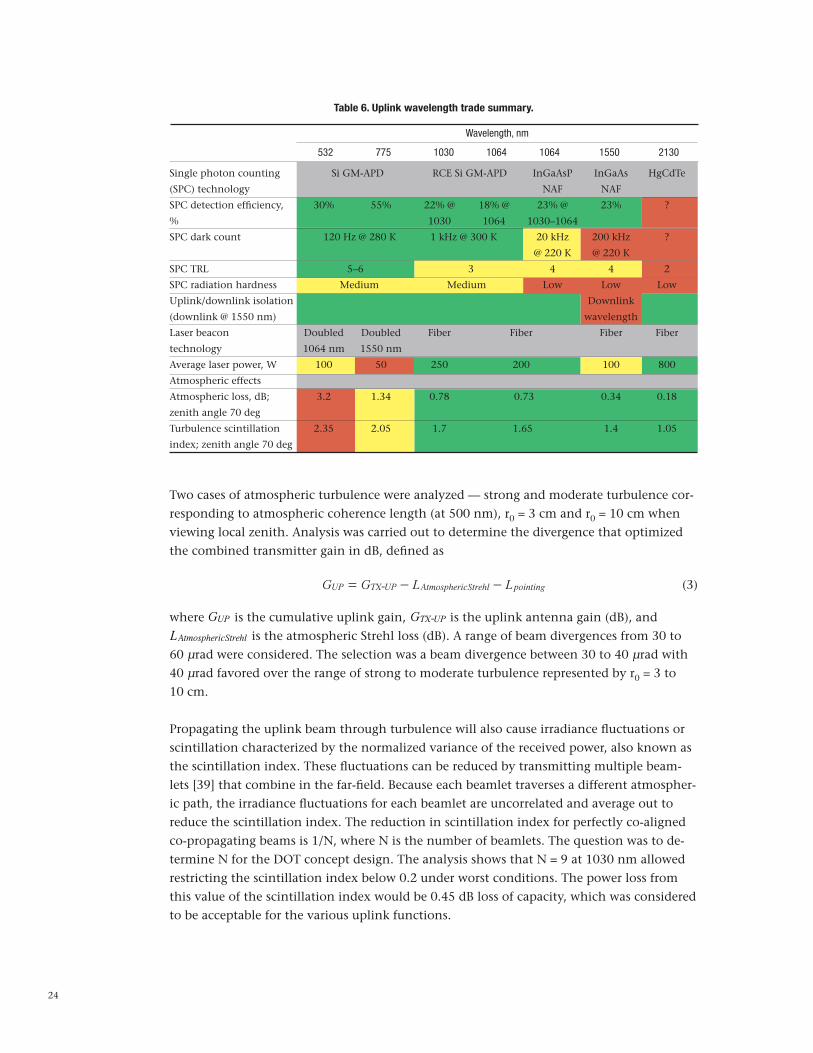
Table 66 summarizes the criteria considered for the uplink wavelength trade. The availabil-ity and characteristics of uplink photon-counting detectors are listed in the first five rows of Table 6; uplink/downlink isolation (assuming a downlink wavelength of 1550 nm) is assessed in row 6; laser technology status and atmospheric effects are listed in rows 8 and 10 to 11. The color-coded cells are used to describe the relative merit of the various crite-ria considered. Again, concerning laser technology above 1-micrometer wavelength, our selection considered mainly fiber lasers, because they could deliver the required power and modulation at lower cost, compared to other more-expensive technology solutions such as waveguide systems. According to Table 6, fiber lasers at a wavelength of 1030 nm present a number of advantages, though detector TRL and radiation hardness of the corresponding DD-PC detector could be improved. The significant potential benefits of using an uplink photon-counting detector array for supporting multiple uplink functions with the accom-panying mass and power saving on the flight terminal, as pointed out earlier in the discus-sion on uplink signaling, resulted in selection of 1030 nm, with the understanding that the TRL would be matured by the preliminary design review.
The uplink laser beam divergence selection was the result of a trade involving critical sys-tem parameters related to atmospheric degradation and beam-pointing capability. The trade objective is to ensure that the designed beam divergence can deliver the requisite mean ir-radiance to the DOT FLT aperture. A peak-to-peak, 16-µrad beam-pointing error and an air-mass corresponding to a 70-deg zenith angle was assumed. The beam-pointing error angle was based on measurements at the OCTL telescope. During the preliminary design phase of DOT, the beam-pointing error value will be reconfirmed with more extensive measurements under varying ambient conditions.
6 S. Piazzolla, A. Biswas, B. Moision, and M. Regehr, “Uplink Trades and Link Budget,” presentation to ICR Board, August 10, 2010.
Wavelength, nm
Atm
osp
heric
Los
s, d
B
600
532 nm 775 nm 1550 nm 2130 nm1030/1064 nm0
–1
–2
–3
–4
–5800 1000 1200 1400 1600 1800 2000 2200
24
Table 6. Uplink wavelength trade summary.
532 775 1030 1064 1064 1550 2130
Wavelength, nm
Single photon counting Si GM-APD RCE Si GM-APD InGaAsP InGaAs HgCdTe
(SPC) technology NAF NAF
SPC detection efficiency, 30% 55% 22% @ 18% @ 23% @ 23% ?
% 1030 1064 1030–1064
SPC dark count 120 Hz @ 280 K 1 kHz @ 300 K 20 kHz 200 kHz ?
@ 220 K @ 220 K
SPC TRL 5–6 3 4 4 2
SPC radiation hardness Medium Medium Low Low Low
Uplink/downlink isolation Downlink
(downlink @ 1550 nm) wavelength
Laser beacon Doubled Doubled Fiber Fiber Fiber Fiber
technology 1064 nm 1550 nm
Average laser power, W 100 50 250 200 100 800
Atmospheric effects
Atmospheric loss, dB; 3.2 1.34 0.78 0.73 0.34 0.18
zenith angle 70 deg
Turbulence scintillation 2.35 2.05 1.7 1.65 1.4 1.05
index; zenith angle 70 deg
Two cases of atmospheric turbulence were analyzed — strong and moderate turbulence cor-responding to atmospheric coherence length (at 500 nm), r0 = 3 cm and r0 = 10 cm when viewing local zenith. Analysis was carried out to determine the divergence that optimized the combined transmitter gain in dB, defined as
G G L LUP TX UP AtmosphericStrehl pointing= - -
where GUP is the cumulative uplink gain, GTX UP is the uplink antenna gain (dB), and LAtmosphericStrehl is the atmospheric Strehl loss (dB). A range of beam divergences from 30 to 60 µrad were considered. The selection was a beam divergence between 30 to 40 µrad with 40 µrad favored over the range of strong to moderate turbulence represented by r0 = 3 to 10 cm.
Propagating the uplink beam through turbulence will also cause irradiance fluctuations or scintillation characterized by the normalized variance of the received power, also known as the scintillation index. These fluctuations can be reduced by transmitting multiple beam-lets [39] that combine in the far-field. Because each beamlet traverses a different atmospher-ic path, the irradiance fluctuations for each beamlet are uncorrelated and average out to reduce the scintillation index. The reduction in scintillation index for perfectly co-aligned co-propagating beams is 1/N, where N is the number of beamlets. The question was to de-termine N for the DOT concept design. The analysis shows that N = 9 at 1030 nm allowed restricting the scintillation index below 0.2 under worst conditions. The power loss from this value of the scintillation index would be 0.45 dB loss of capacity, which was considered to be acceptable for the various uplink functions.
(3)
-
-

25
B. System Implementation Trades
Downlink Implementation
With the trade selections described above, the link equation — Equation (1) — was used for determining net system gain required to achieve the maximum downlink data rate of 267 Mb/s from 0.42 AU. The gain was partitioned between flight and ground subsystems by shifting the maximum possible burden to the ground. The remaining gain was allocated to the EIRP of the flight terminal. The EIRP was optimized relative to the available mass and power (Level 2 Requirement) in order to identify an aperture diameter and laser transmitter power for the FLT.
The means of achieving the maximum possible ground aperture (gain) for the DOT system included relying on the use of existing astronomical telescopes. First, this provides a cost-effective means of conducting a technology demonstration; and second, it offsets the risk of implementing a large-diameter optical communication telescope in time to support a 2018 Mars mission, both from a budget and schedule standpoint. Furthermore, the nighttime sky conditions at Earth when the range to a Mars mission spacecraft is 0.42 AU favored the use of astronomical telescopes. It should also be noted that the use of existing astronomi-cal telescopes was not viable for near-Sun pointing daytime links, also required by the DOT Level 1 requirements. Viable large-diameter telescopes identified were the Large Binocular Telescope (LBT), Mount Graham, Arizona, and the Keck Telescopes at Mauna Kea, Hawaii. The LBT provides twin 8.4-m-diameter apertures on a single mount and the Keck consists of two separate 10-m-diameter telescopes. Arraying both the apertures together would provide an equivalent di-ameter of 14.1 m with Keck and 11.8 m with LBT. Based on considerations detailed in [28], the LBT was selected. Discussions with the caretakers of the LBT confirmed the viability of this arrangement.
A net gain — GR # hR from Equation (1) — of 142 dB was allocated for the LBT. The EIRP was determined by rearranging the terms in Equation (1):
EIRPL L G L
n
space atm R R hc impl
DetEffs
# # # # #h
h= m
An additional term for implementation loss, Limpl, has also been introduced into Equa-tion (4). Implementation losses of 5.7 dB were allocated to account for receiver and decoder signal processing losses, as well as including a 3-dB link margin; nshDetEff was determined from the partitioning curve corresponding to 267 Mb/s in Figure 7, with hDetEff of 50 per-cent. The corresponding background noise, contributed by the sunlit planet Mars, the detector dark noise and unextinguished laser light, after spectral filtering by a 0.17-nm noise equivalent bandwidth (NEB) spectral filter was 78 dB-pe/s. An EIRP of 114 dB-W was determined from Equation (4). Equation (1a) can be further expanded to express the EIRP as
EIRP P D L2
av tx pointingmr h= ; E
(4)
(5)

26
The mass dependence of the telescope diameter, D, and the laser average power, Pav, in Equation (5) are shown in Figure 11. The telescope mass dependence used Optical Research Associates (ORA) models communicated to JPL under a study contract. The laser mass dependence was obtained using a limited database of compiled vendor data and can be considered to be a placekeeper needing further refinement.
Figure 11. Mass dependence of (a) aperture diameter D that affects the transmitter gain Gtx ; (b) laser power.
Aperture Diameter, cm
K = 0.00181 M = 1.152P + 3.168
Laser Power, W
Mas
s, k
g
Mas
s, k
g
(a)
10 1 2 3 415
12 14
10 12
810
68
4
62
4020 25 30
(b)
(5a)
Using the assumed mass dependence of the FLT aperture diameter D and the laser power, the EIRP can be expressed as
..
EIRPK
M ML
1 1523 168
2opt Laser
Tx pointing2.571
mr h=
-c m= ;G E
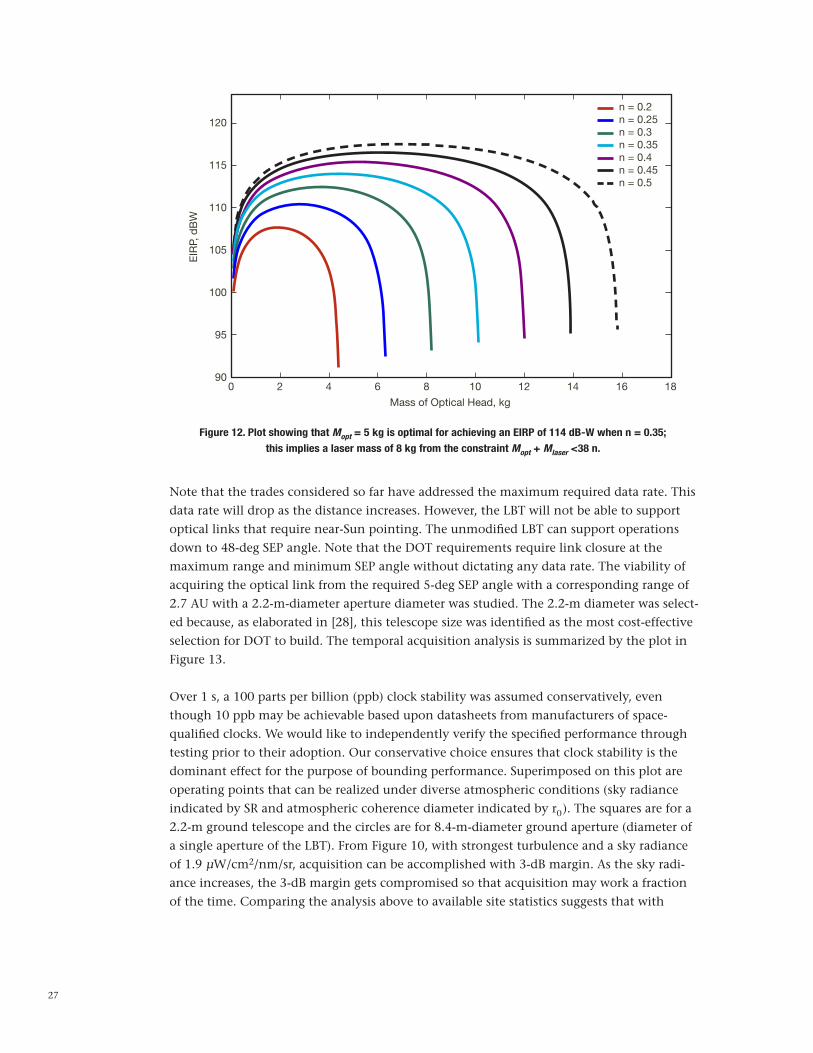
where Mopt and Mlaser represent the mass of the telescope (optical head) and laser in kilo-grams. Recalling the implementation requirement (Section IV.B) where 38 kg was allocated for the entire FLT mass, we introduce the constraint, Mopt + Mlaser <38 n, representing the allocated fraction of 38 kg for optical head and laser with 0 ≤ n ≤ 1. Figure 12 shows a plot of EIRP dependence on Mopt for a number of values of n ranging from 0.2 to 0.5. From Figure 12, the EIRP of 114 dB-W is optimal for n = 0.35, the cyan-colored curve. The corresponding Mopt = 5 kg corresponds to a 22-cm-diameter optical head; see Figure 11(a). From our earlier constraint, Mopt + Mlaser <38 n; with n = 0.35, the estimated Mlaser is an 8-kg laser, corresponding to an average power of 4 W. The above allocations afford a mass-optimized method of achieving the required EIRP with the caveat that the remaining mass allocated to all other assemblies of the FLT is approximately 16 kg, allowing for a 30 percent mass reserve, required by JPL design principles.
The 4-W laser would require 40 to 50 W of electrical power based upon the expected 8 to 10 percent laser wall-plug efficiency. In other words, approximately half the allocated power of 110 W (see Section IV.B) will be required to power the laser assembly. Splitting the available electrical power for the FLT between the laser assembly and the remaining pow-ered assemblies (acquisition–tracking–pointing and electronics processing) is considered to be reasonable, based upon our current understanding of the power requirements for the FLT functions. In other words, the allocation dictated by optimizing the EIRP against mass holds.
27
Figure 12. Plot showing that Mopt = 5 kg is optimal for achieving an EIRP of 114 dB-W when n = 0.35;
this implies a laser mass of 8 kg from the constraint Mopt + Mlaser <38 n.
Mass of Optical Head, kg
EIR
P, d
BW
0 2 4 6 8 10 12 14 16 18
120
n = 0.2n = 0.25n = 0.3n = 0.35n = 0.4n = 0.45n = 0.5
115
110
105
100
95
90
Note that the trades considered so far have addressed the maximum required data rate. This data rate will drop as the distance increases. However, the LBT will not be able to support optical links that require near-Sun pointing. The unmodified LBT can support operations down to 48-deg SEP angle. Note that the DOT requirements require link closure at the maximum range and minimum SEP angle without dictating any data rate. The viability of acquiring the optical link from the required 5-deg SEP angle with a corresponding range of 2.7 AU with a 2.2-m-diameter aperture diameter was studied. The 2.2-m diameter was select-ed because, as elaborated in [28], this telescope size was identified as the most cost-effective selection for DOT to build. The temporal acquisition analysis is summarized by the plot in Figure 13.
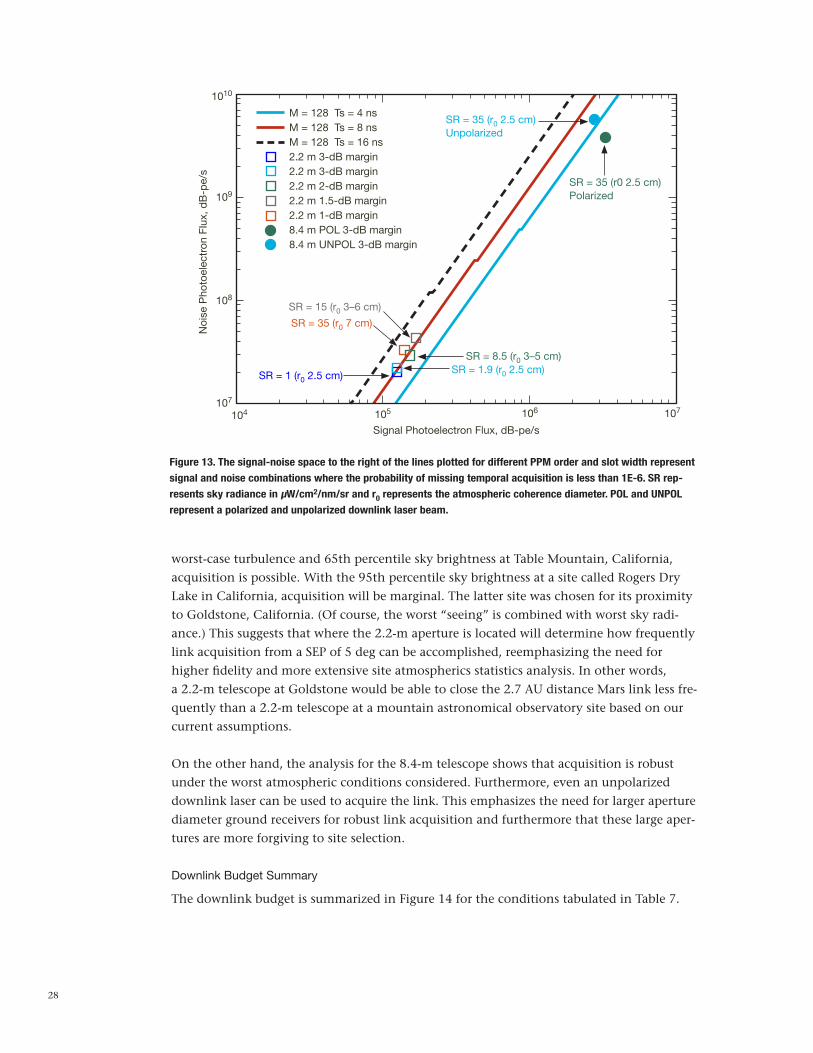
Over 1 s, a 100 parts per billion (ppb) clock stability was assumed conservatively, even though 10 ppb may be achievable based upon datasheets from manufacturers of space-qualified clocks. We would like to independently verify the specified performance through testing prior to their adoption. Our conservative choice ensures that clock stability is the dominant effect for the purpose of bounding performance. Superimposed on this plot are operating points that can be realized under diverse atmospheric conditions (sky radiance indicated by SR and atmospheric coherence diameter indicated by r0 ). The squares are for a 2.2-m ground telescope and the circles are for 8.4-m-diameter ground aperture (diameter of a single aperture of the LBT). From Figure 10, with strongest turbulence and a sky radiance of 1.9 µW/cm2/nm/sr, acquisition can be accomplished with 3-dB margin. As the sky radi-ance increases, the 3-dB margin gets compromised so that acquisition may work a fraction of the time. Comparing the analysis above to available site statistics suggests that with
28
Figure 13. The signal-noise space to the right of the lines plotted for different PPM order and slot width represent
signal and noise combinations where the probability of missing temporal acquisition is less than 1E-6. SR rep-
resents sky radiance in µW/cm2/nm/sr and r0 represents the atmospheric coherence diameter. POL and UNPOL
represent a polarized and unpolarized downlink laser beam.
Signal Photoelectron Flux, dB-pe/s
SR = 35 (r0 7 cm)
SR = 1 (r0 2.5 cm)
Noi
se P
hoto
elec
tron
Flu
x, d
B-p
e/s
104
1010
109
108
107
105 106 107
SR = 8.5 (r0 3–5 cm)SR = 1.9 (r0 2.5 cm)
SR = 35 (r0 2.5 cm)Unpolarized
SR = 15 (r0 3–6 cm)
SR = 35 (r0 2.5 cm)Polarized
M = 128 Ts = 4 nsM = 128 Ts = 8 nsM = 128 Ts = 16 ns2.2 m 3-dB margin2.2 m 3-dB margin2.2 m 2-dB margin2.2 m 1.5-dB margin2.2 m 1-dB margin8.4 m POL 3-dB margin8.4 m UNPOL 3-dB margin
worst-case turbulence and 65th percentile sky brightness at Table Mountain, California, acquisition is possible. With the 95th percentile sky brightness at a site called Rogers Dry Lake in California, acquisition will be marginal. The latter site was chosen for its proximity to Goldstone, California. (Of course, the worst “seeing” is combined with worst sky radi-ance.) This suggests that where the 2.2-m aperture is located will determine how frequently link acquisition from a SEP of 5 deg can be accomplished, reemphasizing the need for higher fidelity and more extensive site atmospherics statistics analysis. In other words, a 2.2-m telescope at Goldstone would be able to close the 2.7 AU distance Mars link less fre-quently than a 2.2-m telescope at a mountain astronomical observatory site based on our current assumptions.
On the other hand, the analysis for the 8.4-m telescope shows that acquisition is robust under the worst atmospheric conditions considered. Furthermore, even an unpolarized downlink laser can be used to acquire the link. This emphasizes the need for larger aperture diameter ground receivers for robust link acquisition and furthermore that these large aper-tures are more forgiving to site selection. Downlink Budget Summary
The downlink budget is summarized in Figure 14 for the conditions tabulated in Table 7.

29
Figure 14. Downlink performance summary for nominal and worst conditions using the 11.8-m LBT
(blue squares and red dots) and a 2.2-m telescope (green and magenta squares).
The link-limited Ka-band performance (red line) is included for reference.
Table 7. Summary of the conditions under which downlnk analysis was performed.
Nominal Worst Nominal Worst
Zenith Atmospheric Attenuation at 1550 nm, dB
Zenith Angle, deg
Sky Radiance, W/cm2/sr/mm
Atmospheric Coherence Diameter r0, cm, at
500 nm zenith
Mars Radiance, W/cm2/sr/mm
Surface Cleanliness, CL*
Surface Roughness, nm**
0.97
60
—
15.4
8.9E-04
—
—
0.9
70
8.50E-03
5
8.90E-04
1000
3
0.93
40
1.90E-03
3
8.90E-04
1000
3
0.93
70
—
7.9
8.90E-04
—
—
Nighttime Daytime
*Defined per MIL-STD 1246C. ** Root-mean-square (rms) surface roughness.
Distance, AU
Dat
a R
ate,
Mb
/s
0 0.5
103
102
101
100
10–1
10–2
1 1.5 2 2.5 3
11.8 m Nom Atm > 3-dB Margin11.8 m Worst Atm > 2-dB Margin2.2 m Nom Atm > 3-dB Margin2.2 m Worst Atm > 2-dB MarginLink-Limited MRO Ka-band
Note that the optical data rate performance versus distance to Mars does not follow an in-verse-square distance dependence as does the Ka-band, because with increasing distance the SEP angles get smaller and the additive background noise penalty on the link throughput increases. The data rates are shown at all distances for both the 11.8-m and 2.2-m telescope. Note that the 2.2-m telescope currently does not exist but is proposed to be built, and can be used at any time except when the highest data rate required by DOT has to be demon-strated. A sample of the rolled-up downlink point design is shown in Table 8.

30
Table 8. Rolled-up version of the downlink budget.
Link Parameter dB Other dB Other Units
Signaling
PPM Order 16 16
Laser Transmitter
Average Laser Power 6.02 4 watts 6.02 4
Transceiver
Far-Field Antenna Gain 112.98 7.0 µrad 112.98 7.0 µrad
Transmitter Efficiency –5.47 –5.88
Range and Atmosphere
Space Loss –354.14 0.42 AU –354.14 0.42 AU
Atmospheric Transmission Loss –0.26 –0.91
Ground Receiver
Receiver Gain 147.52 11.8 m 147.52 11.8 m
Receiver Efficiency –5.27 –6.07
Detection/Implementation
Detection/Implementation Losses –5.71 –5.7103
Mean Signal Flux 1.22E+08 phe/s 1.42E+08 ph/s
Background, Noise, and Atmospherics
Mean Background Flux 70.8279 1.21E+07 phe/s 76.18 4.15E+07 phe/s
Link Performance
Poisson Channel Capacity 2.96E+08 b/s 3.45E+08 b/s
Throughput 267.00 Mb/s 267.00 Mb/s
Link Margin 4 2
UnitsNominal Worst
A 3-dB reduction in background flux by using a polarization-controlled laser transmitter is presumed in Table 8.
Uplink Budget
Uplink budgets were analyzed at the nearest and farthest Mars range. Tables 9(a) and 9(b) show the uplink budget. Table 9(a) shows the uplink budget for achieving 292 kb/s at a range of 0.42 AU. PPM-16 with Reed-Solomon is used for the inner modulation and error-correction code. The spot size is assumed to cover a 2 × 2 pixel subarray of the uplink photon-counting detector array with an instantaneous field of view (IFOV) of 8-µrad per pixel. With 1.2 kW of laser power transmitted from the ground, a data rate of 292 kb/s with a 3-dB margin is achieved.
Table 9(b) shows the budget that satisfies acquisition and tracking at 2.7 AU by illuminat-ing the FLT aperture with a mean irradiance of 4.9 pW per square meter at a laser wave-length of 1030 nm. An average laser power of 5 kW transmitted from the ground satisfies the targeted mean irradiance with a 3-dB margin.
Ranging
Viable options for satisfying the 30-cm precision ranging requirement were traded. The two contending methods were paired one-way and two-way [40,41]. Paired one-way ranging

31
Table 9(a). Uplink budget for 292 kb/s at 0.42 AU.
Wavelength, nm 1030
Average Signal Power, W 1200
Tx Average Signal, dBW 30.70
Tx Combined Gain, dB 96.89 40 µrad divergence
Tx Optical Loss, dB –3.00 Estimated
Atmospheric Loss, dB –0.78 Zenith angle = 70 deg
Range Loss, dB –357.69 0.42 AU
Average Signal IRR at FLT, pW/m2 49.09
Rx Aperture Gain, dB 116.53 22-cm aperture
Rx Optical Loss, dB –3.00 Estimated
Rx Receiver Loss, dB –1.40 Implementation loss
Facing Loss, dB –0.45 0.2 SI
Interleaver Loss, dB –0.63 41 kb interleaver penalty
Link Margin, dB –3.00
Detection Efficiency, dB –6.58 D.E. = 22%
Photon Energy, –dBJ 187.15
Average Photoelectron Flux, dB phe/s 54.83 FLT focal plane signal
Average Photoelectron Flux, phe/s 304550 FLT focal plane flux
Average Signal Photoelectron Flux, phe/s 282160 Flux with 30 dB ex. ratio
Noise Count
Radiance Photoelectron Flux, phe/s 9748.00 3 deg from Sun CL = 300
Dark Count, phe/x 4000.00 4 pixels
Ex. Ratio Signal BG, phe/s 22390.00 Due to 30 dB ex. ratio
Total Background, phe/s 36329.00 Total noise count
Data Rate, kb/s 292.59 200 kb/s required
Slot Width, ns 128.00 Inner modulation slot
Laser Peak Power, kW 88.9
can be implemented without adding processing burden to the FLT design and without real-time processing. The only consequence with paired one-way ranging is that time has to be transferred over the downlink signal. Two-way ranging, on the other hand, adds relatively higher processing burden and requires real-time processing but does not require time trans-fer over the link. Paired one-way was selected for DOT. Figure 15 is a pictorial depiction of paired one-way ranging. The transmit and receive times of pulses at the ground and space ends of the link need to be recorded with an rms accuracy of 0.7 ns in order to achieve the 30-cm ranging precision. At the GLT, this entails monitoring the outgoing pulse waveform. At the FLT, the received/transmitted signal is used to measure these times. At the GLR, the received signal provides the time measurement.
C. Reference Design
The system-level trades culminating in the link budgets were used to define a reference design for the subsystems of DOT. This reference design was used to levy Level 3 require-ments on the FLT, GLR, and GLT. A composite block diagram of the reference design is
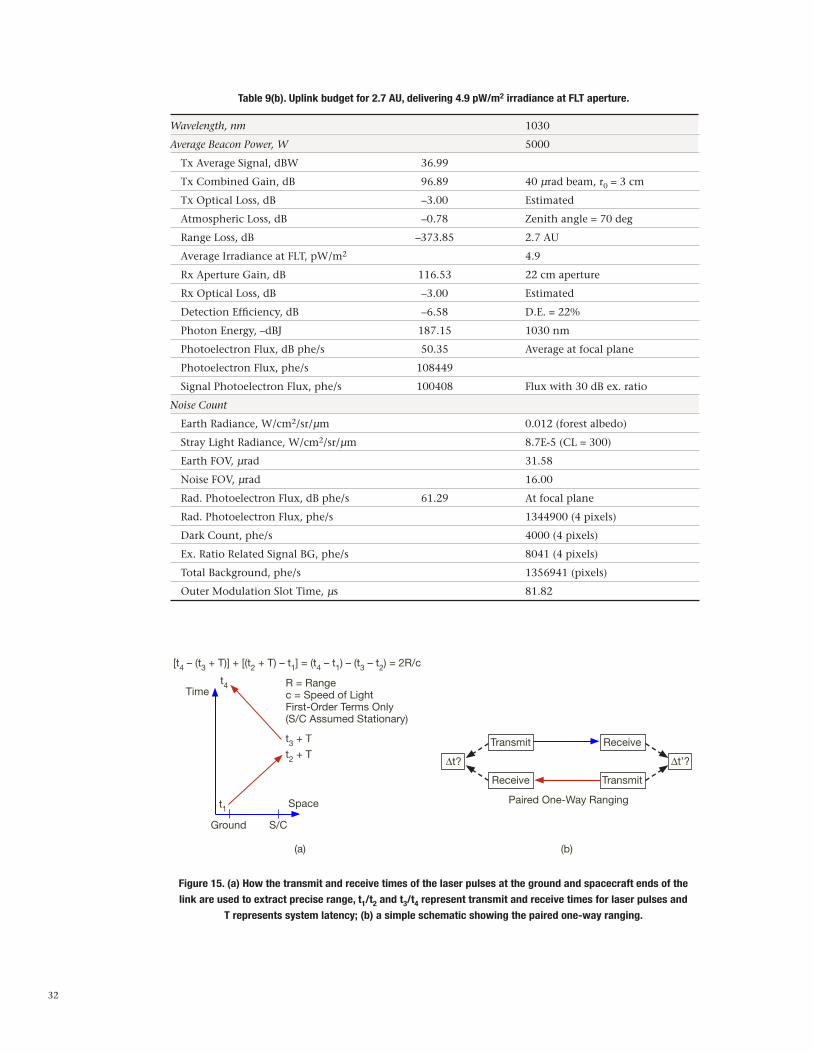
32
Table 9(b). Uplink budget for 2.7 AU, delivering 4.9 pW/m2 irradiance at FLT aperture.
Wavelength, nm 1030
Average Beacon Power, W 5000
Tx Average Signal, dBW 36.99
Tx Combined Gain, dB 96.89 40 µrad beam, r0 = 3 cm
Tx Optical Loss, dB –3.00 Estimated
Atmospheric Loss, dB –0.78 Zenith angle = 70 deg
Range Loss, dB –373.85 2.7 AU
Average Irradiance at FLT, pW/m2 4.9
Rx Aperture Gain, dB 116.53 22 cm aperture
Rx Optical Loss, dB –3.00 Estimated
Detection Efficiency, dB –6.58 D.E. = 22%
Photon Energy, –dBJ 187.15 1030 nm
Photoelectron Flux, dB phe/s 50.35 Average at focal plane
Photoelectron Flux, phe/s 108449
Signal Photoelectron Flux, phe/s 100408 Flux with 30 dB ex. ratio
Noise Count
Earth Radiance, W/cm2/sr/µm 0.012 (forest albedo)
Stray Light Radiance, W/cm2/sr/µm 8.7E-5 (CL = 300)
Earth FOV, µrad 31.58
Noise FOV, µrad 16.00
Rad. Photoelectron Flux, dB phe/s 61.29 At focal plane
Rad. Photoelectron Flux, phe/s 1344900 (4 pixels)
Dark Count, phe/s 4000 (4 pixels)
Ex. Ratio Related Signal BG, phe/s 8041 (4 pixels)
Total Background, phe/s 1356941 (pixels)
Outer Modulation Slot Time, µs 81.82
Figure 15. (a) How the transmit and receive times of the laser pulses at the ground and spacecraft ends of the
link are used to extract precise range, t1/t2 and t3/t4 represent transmit and receive times for laser pulses and
T represents system latency; (b) a simple schematic showing the paired one-way ranging.
(a) (b)
Time
Ground
Space
S/C
R = Rangec = Speed of LightFirst-Order Terms Only(S/C Assumed Stationary)
[t4 – (t3 + T)] + [(t2 + T) – t1] = (t4 – t1) – (t3 – t2) = 2R/c
t3 + T
t2 + T
t4
t1Paired One-Way Ranging
∆t? ∆t’?
Transmit
Receive Transmit
Receive

33
shown in Figure 16. The MOC is shown in Figure 16, although the flowdown of Level 3 requirements for this subsystem is still pending.
VI. Conclusions
An overview of the system engineering performed in order to arrive at a conceptual refer-ence design and Level 3 subsystem requirements was provided in this article. This concep-tual design satisfies all the Level 1 requirements. The Level 3 requirements were used as a basis of further trades at the subsystem level in order to distill out a conceptual design for each subsystem. These trades are reported separately.
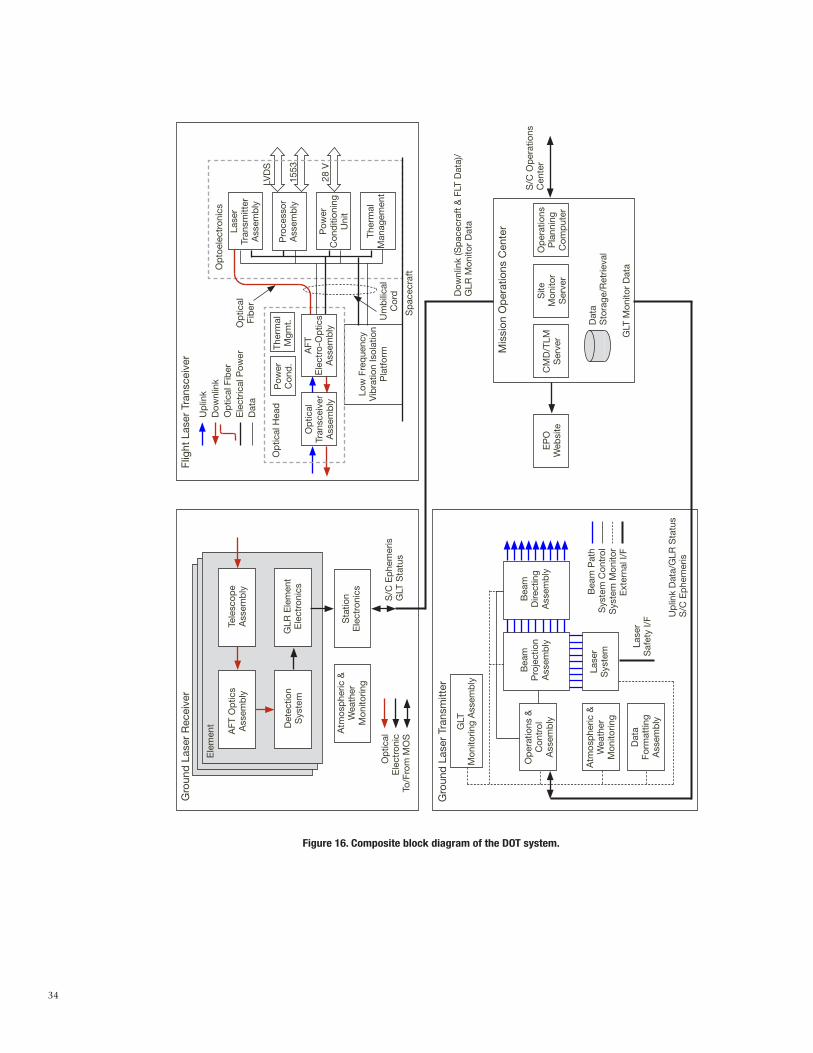
34
Figure 16. Composite block diagram of the DOT system.
Ele
men
t
AFT
Op
tics
Ass
emb
lyTe
lesc
ope
Ass
emb
ly
Det
ectio
nS
yste
m
GLT
Mon
itorin
g A
ssem
bly
Op
erat
ions
&C
ontr
olA
ssem
bly
Bea
m P
ath
Sys
tem
Con
trol
Sys
tem
Mon
itor
Ext
erna
l I/F
Atm
osp
heric
&W
eath
erM
onito
ring
Dat
aFo
rmat
ting
Ass
emb
ly
EP
OW
ebsi
teC
MD
/TLM
Ser
ver
Site
Mon
itor
Ser
ver
Op
erat
ions
Pla
nnin
gC
omp
uter
S/C
Op
erat
ions
Cen
ter
Dat
aS
tora
ge/R
etrie
val
GLT
Mon
itor
Dat
a
Sp
acec
raft
Mis
sion
Op
erat
ions
Cen
ter
Flig
ht L
aser
Tra
nsce
iver
Op
toel
ectr
onic
s
Op
tical
Fib
er
Op
tical
Hea
dP
ower
Con
d.
Ther
mal
Mgm
t.
Low
Fre
que
ncy
Vib
ratio
n Is
olat
ion
Pla
tfor
mU
mb
ilica
lC
ord
LVD
S
1553
28 V
Dow
nlin
k (S
pac
ecra
ft &
FLT
Dat
a)/
GLR
Mon
itor
Dat
a
Lase
rS
yste
m
Bea
mD
irect
ing
Ass
emb
ly
Bea
mP
roje
ctio
nA
ssem
bly La
ser
Saf
ety
I/F U
plin
k D
ata/
GLR
Sta
tus
S/C
Ep
hem
eris
GLR
Ele
men
t E
lect
roni
cs
Gro
und
Las
er R
ecei
ver
Gro
und
Las
er T
rans
mitt
er
Atm
osp
heric
&W
eath
erM
onito
ring
Sta
tion
Ele
ctro
nics
S/C
Ep
hem
eris
GLT
Sta
tus
Op
tical
Ele
ctro
nic
To/F
rom
MO
S
Pow
erC
ond
ition
ing
Uni
t
Ther
mal
Man
agem
ent
Pro
cess
orA
ssem
bly
Lase
rTr
ansm
itter
Ass
emb
ly
Up
link
Dow
nlin
kO
ptic
al F
iber
Ele
ctric
al P
ower
Dat
a
AFT
Ele
ctro
-Op
tics
Ass
emb
ly
Op
tical
Tran
scei
ver
Ass
emb
ly
35
References
[1] National Aeronautics and Space Administration, Space Communications and Navigation
(SCaN) Integrated Network Architecture Definition Documents (ADD), Volume 1: Executive Summary, Revision 1, January 4, 2010.
[2] D. M. Boroson, A. Biswas, and B. L. Edwards, “MLCD: Overview of NASA’s Mars laser Communications Demonstration System,” Proceedings of SPIE, Free-Space Laser Commu-
nication Technologies XIV, vol. 5338, pp. 16–28, 2004.
[3] A. Biswas, D. M. Boroson, and B. L. Edwards, “Mars Laser Communications Demonstra-tion: What It Could Have Been,” Proceedings of SPIE, Free-Space Laser Communications
Technologies XVI, vol. 6105, pp. 610502-1–6105052-12, 2006.
[4] W. D. Williams, M. Collins, D. M. Boroson, J. Lesh, A. Biswas, R. Orr, L. Schuchman, and O. S. Sands, “RF and Optical Communications: A Comparison of High Data Rate Returns from Deep Space in the 2020 Timeframe,” paper K000083, Proceedings of 12th
Ka and Broadband Communications Conference, Naples, Italy, September 2006.
[5] K. E. Wilson, J. R. Lesh, K. Araki, and Y. Arimoto, “Overview of the Ground-to-Orbit Lasercom Demonstration,” Proceedings of SPIE, Free-Space Laser Communication Technolo-
gies IX, vol. 2990, January 1997.
[6] J. Keller, “Optical Links Are Key to Next-Generation Military Communications Satel-lites,” Military Aerospace Electronics, vol. 15, no. 4, April 1, 2004.
[7] T. Tolkeer-Nielsen and Gotthard Oppenhauser, “In-Orbit Test Results of an Operational Inter-Satellite Link Between ARTEMIS and SPOT4, SILEX,” Proceedings of SPIE, Free-Space
Laser Communication Technologies IX, vol. 3615, pp. 31–42, April 1999.
[8] H. Hemmati, editor, Near-Earth Laser Communications, p. 24, Florida: CRC Press, 2009.
[9] M. Toyoshima et al., “Results from Phase-1, Phase-2, and Phase-3 Kirari Optical Com-munication Demonstration Experiments with the NICT Optical Ground Station (KODEN),” 25th AIAA International Communications Satellite System Conference, AIAA 2007-3228, 2007.
[10] L. Vaillon, G. Planche, V. Chorvilli, and L. Le Hors, “Optical Communications Be-tween an Aircraft and a GEO Relay Satellite: Design and Flight Results of the LOLA Demonstrator,” Proceedings of the 7th International Conference on Space Optics (ICSO), ESTEC, 2008.
[11] B. Smutny, R. Lange, H. Kämpfner, D. Dallmann, G. Mühlnikel, et al., “In-Orbit Verifi-cation of Optical Inter-Satellite Communication Links Based on Homodyne BPSK,” Pro-
ceedings of SPIE, Free-Space Laser Communication Technologies XX, vol. 6877, pp. 687702-1–687702-6, 2008.
[12] J. Taylor, L. Sakamoto, and C.-J. Wong, “Cassini Orbiter/Huygens Probe Telecommu-nications,” Deep Space Communication and Navigation Center of Excellence (DESCANSO)
Design and Performance Summary Series, Jet Propulsion Laboratory, Pasadena, California, January 2002.

36
[13] J. Taylor, D. K. Lee, and S. Shambayati, “Mars Reconnaissance Orbiter Telecommuni-cations,” Deep Space Communication and Navigation Center of Excellence (DESCANSO)
Design and Performance Summary Series, Jet Propulsion Laboratory, Pasadena, California, September 2006.
[14] B. J. Klein and J. J. Degnan, “Optical Antenna Gain I: Transmitting Antenna,” Applied
Optics, vol. 13, pp. 2134–2141, September 1974.
[15] H. Hemmati, editor, Deep Space Optical Communications, New Jersey: John Wiley & Sons, Interscience, p. 217, 306, 2006.
[16] J. Hamkins, “Pulse Position Modulation,” Handbook of Computer Networks, H. Bidgoli, editor, New York: Wiley, 2007.
[17] D. M. Boroson, R. S. Bondurant, and J. J. Scozzofava, “Overview of High-Rate Deep-Space Laser Communications Options,” Proceedings of SPIE, Free-Space Laser Communica-
tion Technologies XIV, vol. 5338, pp. 37–49, 2004.
[18] J. W. Burnside, D. V. Murphy, F. K. Knight and F. I. Khatri, “A Hybrid Stabilization Ap-proach for Deep-Space Optical Communications Terminals,” Proceedings of the IEEE, vol. 95, no. 10, pp. 2070–2081, October 2007.
[19] C.-C. Chen, H. Hemmati, A. Biswas, G. Ortiz, W. Farr, N. Pedreiro, “Simplified Laser-com System Architecture Using a Disturbance-Free Platform,” Proceedings of SPIE, Free-
Space Laser Communication Technologies XVIII, vol. 6105, 610505–610505-6, 2006.
[20] W. H. Farr, M. W. Regher, M. W. Wright, A. Sahasrabudhe, J. W. Gin, and D. H. Nguy-en, “Overview and Trades for DOT Flight Laser Transceiver,” to be published in The
Interplanetary Network Progress Report, vol. 42-184, Jet Propulsion Laboratory, Pasadena, California, February 15, 2011.
[21] L. C. Andrews and R. L. Phillips, Laser Beam Propagation through Random Media, pp. 253, Chapter 9, Bellingham, Washington: SPIE Optical Press, 1998.
[22] C. C. Chen and J. R. Lesh, “Overview of the Optical Communications Demonstrator,” Proceedings of SPIE, vol. 2123, pp. 85–94, 1994.
[23] A. Biswas, F. Khatri, and D. Boroson, “Near-Sun Free-Space Optical Communications from Space,” IEEE Aerospace Conference, Big Sky, Montana, 2006. doi:10.1109/AERO.2006.1655849
[24] J. J. Scozzofava, D. M. Boroson, R. S. Bondurant, A. D. Pillsbury, J. W. Burnside, N. W. Spellmeyer, P. L. Ward, F. K. Knight, M. L. Stevens, and D. R. Bold, “The Mars Lasercom Terminal,” 2005 Digest LEOS Summer Topical Meeting 2005, Paper MA1.2.
[25] W. T. Roberts, H. L. Petrie, A. J. Pickles, R. P. Thicksten and C. Echols, “Feasibility of Utilizing the 200-inch Hale Telescope as a Deep-Space Optical Receiver,” Proceed-
ings of SPIE, Free-Space Laser Communications IV, J. C. Ricklin and D. G. Voelz, editors, vol. 5550, pp. 320–335, 2004.
[26] G. S. Wojcik, H. L. Szymczak, R. J. Aliss, R. P. Link, M. Craddock, and M. L. Mason, “Deep-Space to Ground Laser Communications in a Cloudy World,” Proceedings of SPIE, Free-Space Laser Communications V, vol. 5892, pp. 589203-1–589203-11, 2005.

37
[27] W. T. Roberts and M. W. Wright, “Deep-space Optical Terminals (DOT) Ground Laser Transmitter (GLT) Trades and Conceptual Point Design,” The Interplanetary Network
Progress Report, vol. 42-183, Jet Propulsion Laboratory, Pasadena, California, pp. 1–15, November 15, 2010. http://ipnpr.jpl.nasa.gov/progress_report/42-183/183C.pdf
[28] K. M. Birnbaum, J. R. Charles, W. H. Farr, J. Gin, K. J. Quirk, W. T. Roberts, J. A. Stern, and Y.-H. Wu, “DOT Ground Laser Receiver: Overview and Major Trades,” The Inter-
planetary Network Progress Report, vol. 42-182, Jet Propulsion Laboratory, Pasadena, California, pp. 1–16, August 15, 2010. http://ipnpr.jpl.nasa.gov/progress_report/42-182/182C.pdf
[29] S. E. Egner, E. Masciadri, and D. McKenna, “Generalized SCIDAR Measurements at Mount Graham,” Publications of the Astronomical Society of the Pacific, vol. 119, pp. 669–686, June 2007.
[30] http://www.esa.int/SPECIALS/Mars_Express/SEMC785V9ED_0.html
[31] K. E. Wilson, W. T. Roberts, V. Garkanian, F. Battle, R. Leblanc, H. Hemmati, and P. Robles, “Plan for Safe Laser Beam Propagation from the Optical Communications Telescope Laboratory,” The Interplanetary Network Progress Report, vol. 42-152, October–December 2002, Jet Propulsion Laboratory, Pasadena, California, pp. 1–17, February 15, 2003. http://ipnpr.jpl.nasa.gov/progress_report/42-152/152G.pdf
[32] National Aeronautics and Space Administration, “Risk Classification for NASA Pay-loads,” NASA Procedural Requirements NPR 8705.4, June 14, 2004. http://nodis3.gsfc.nasa.gov
[33] Ryan Simmons, Scott Gordon, Bob Colonado, “Basics of Miles’ Equation,” The FEMCI
Book, NASA Goddard Space Flight Center, May 2001. http://FEMCI.gsfc.nasa.gov/femcibook.html
[34] R. K. Tyson, Principles of Adaptive Optics, second edition, Academic Press, 1998.
[35] R. Lange, “Coherent Inter-satellite and Satellite-to-Ground Links,” Proceedings of SPIE, Free-Space Laser Communication Technologies XXIII, vol. 7923, in press.
[36] R. A. Fields, M. Gregory, B. Wandernoth, D. Kozlowski, H. T. Yura, et al., “5.625 Gbps Bidirectional Laser Communications and Ranging Measurements Between the NFIRE Satellite and an Optical Ground Station,” Proceedings of SPIE, Free-Space Laser Communi-
cation Technologies XXIII, vol. 7923, in press.
[37] B. Moision and W. Farr, “Communication Limits Due to Photon Detector Jitter,” IEEE Photonics Technology Letters, vol. 20, no. 9, pp. 715–717, April 2008.
[38] B. Moision and J. Hamkins, “Coded Modulation for the Deep-Space Optical Channel: Serially Concatenated Pulse-Position Modulation,” The Interplanetary Network Progress
Report, vol. 42-161, Jet Propulsion Laboratory, Pasadena, California, pp. 1–25, May 15, 2005. http://ipnpr.jpl.nasa.gov/progress_report/42-161/161T.pdf

38
[39] A. Biswas, M. W. Wright, J. Kovalik, and S. Piazzolla, “Uplink Beacon Laser for Mars Laser Communication Demonstration (MLCD),” Proceedings of SPIE, Free-Space Laser
Communication Technologies XVII, vol. 5712, pp. 93–100, 2005.
[40] J. J. Degnan, “Asynchronous Laser Transponders for Precise Interplanetary Ranging and Time Transfer,” Journal of Geodynamics, vol. 34, issues 3–4, pp. 551–594, October–No-vember 2002.
[41] K. M. Birnbaum, Y. Chen, and H. Hemmati, “Precision Optical Ranging by Paired One-Way Time of Flight,” Proceedings of SPIE, Free-Space Laser Communication Technologies
XXII, vol. 7587, 75870A, February 2010.