decompression theory - neo-haldane...
TRANSCRIPT
DECOMPRESSION THEORY - NEO-HALDANEMODELS
This section describes the Haldane or neo-Haldane decompression theories. Oneach dive the divers body takes up inert gasses, like Nitrogen. After the divethe divers body is ’supersaturated’ with inert gas and has to get rid of this ex-cess gas (decompression). Decompression theories predict the inert gas uptakeby the body (divided in hypothetical tissue compartments). Furthermore, theydefine limits (M-values) which apply to the supersaturation of each tissue com-partment. If supersaturation values exceed these limits, decompression sickness(DCS) symptoms develop. The modeling of the gas uptake and these limits en-able calculation of diving tables, decompression profiles and simulation by divingcomputers.
History
In modern diving, tables and schedules are used for estimating no- decompres-sion limits, decompression profiles and saturation levels. Use of a diving com-puter during the dive is most common nowadays. Tables and computers arebased on decompression theory, which describes inert gas uptake and satura-tion of bodily tissue when breathing compressed air (or other gas mixtures).The development of this theory was started in 1908 by John Scott Haldane c.s.Haldane, an English physiologist, described the Nitrogen saturation process byusing a body model which comprises several hypothetical tissue ’compartments’.A compartment can be characterized by a variable called ’half-time’, which is ameasure for the rate of inert gas uptake. Theory was further developed duringthe years ’50 and ’60 by U.S. Navy. The concept of ’M-values’ was developedby Robert D. Workman of the U.S. Navy Experimental Diving Unit (NEDU).In the early ’70s Schreiner applied the theory to changing pressure (ascend-ing/descending). Recently Buhlmann improved the theory and developed ZH-12L and ZH-16L model, which are quite popular in current diving computers.At this moment a lot is still unknown about the exact processes which take placeduring saturation and decompression. Most of the theory presented has beenfound empirically, i.e. by performing tests on human subjects in decompressionchambers and from decompression accident statistics. Recently, a more physicalapproach resulted in bubble theories. These theories physically describe whatis happening during decompression.
Inert gas saturation and supersaturation
When you breathe a breathing gas that contains an inert gas (gasses which donot take part in the oxidative metabolism and are not ’used’ by the body) likeNitrogen (N2) or Helium (He2), this gas is dissolved in the blood by means of
1
gas exchange in the lungs. Blood takes the dissolved gas to the rest of the bodilytissue. Tissue takes up dissolved gas from the blood. Gas keeps on dissolvingin blood and tissue until the partial pressure of the dissolved gas is equal tothe partial pressure of the gas breathed in, throughout the entire body. Thisis called saturation. Rates of saturation vary with different parts of the body.The nervous system and spine get saturated very fast (fast tissues), whereas fatand bones saturate very slowly (slow tissues).
When staying at sea level for a long time, like most of us do, and breathingair, again like most of us do, the entire body is saturated with Nitrogen, whichmakes up the air for 78%. Since at sea level air pressure is roughly 1 bar (wecan neglect barometric air pressure variations, which are expressed in milli-bar), the partial pressure of the dissolved Nitrogen thoughout the entire bodyis 1 bar * 78%=0.78 bar (actually it is a bit less, as we will see later, but forthe moment this will do). If a diver dives to 20 meter, he breathes air at 3bar. Partial Nitrogen pressure in the air he breathes is 3 bar * 78% = 2.34bar. If the diver sits down and wait for quite a long time, the diver’s body getssaturated with Nitrogen at a partial pressure of 2.34 bar (the fastest tissuessaturate in 25 minutes, the slowest take two and a half day to saturate). Sofar, so good (at least if our diver has enough air supply). If the diver goes backto the surface, however, he arrives with his body saturated with Nitrogen at apartial 2.34 bar pressure, whereas the air he breathes at the surface has a partialNitrogen pressure of 0.78 bar. The body is supersaturated. Dissolved Nitrogenin the tissue and blood will go back to the free gas phase, in order to equalizethe pressures. The Nitrogen forms micro bubbles, which are transported bythe blood and removed from the body by the respiratory system. However, ifto much Nitrogen goes back to the free phase, micro bubbles grow and formbubbles that may block veins and arteries. The diver gets bent and will developdecompression sickness (DCS) symptoms.
A certain amount of supersaturation is allowed, without getting bent (at leastwith low risk of getting bent). In fact, supersaturation (a pressure gradient) isneeded in order to decompress (get rid of the excess Nitrogen). The amount ofallowed supersaturation is different for various types of tissue. This is the reasonthe body is divided in hypothetical tissue ’compartments’ in most decompres-sion models. Each compartment is characterized by its half-time. This is theperiod the tissue takes a partial inert gas pressure which is half way betweenthe partial pressure before and after a pressure change of the environment. Hal-dane suggested two compartments, recent theories (like ZH-16L) use up to 16compartments. Decompression theory deals with two items:
1. Modeling the inert gas absorption in the bodily tissue
2. Estimate limits of supersaturation for each tissue, beyond which decom-pression sickness (DCS) symptoms develop
If these items are known, one can fill in tables, estimate no-decompression times,calculate decompression profiles, plan dives, etc.
2
Calculating inert gas absorption by the tissue
In this section we will derive the equations which describe inert gas uptake bybodily tissue. If you get frightened by a bit of mathematics, please skip thederivation, but have a look at the end result in the high lighted boxes (equation8 and 13). The rate a particular tissue (compartment) takes up inert gas (i.e.the rate of change in partial pressure of that gas in the tissue) is proportionalto the partial pressure difference between the gas in the lungs and the dissolvedgas in the tissue. We can express this mathematically by:
dPt(t)
dt= k[Palv(t) − Pt(t)] (1)
Pt(t) Partial pressure of the gas in the particular tissue (bar)Palv(t) Partial pressure of the gas in the breathing mix. To be precise:
Gas exchange takes place in the lungs (alveoli). Hence, we haveto consider the gas alveolar partial pressure. This pressure maybe changing with time, if the diver changes depth (bar)
k A constant depending on the type of tissue (min−1)t Time (min)
This is a differential equation which is quite familiar in physics and which appliesto many processes like diffusion and heat transfer. Solving this equation requiresfollowing steps:
Step 1: Write the equation 1 to the familiar form (a.k.a. the inhomogenousdifferential equation):
dPt(t)
dt+ kPt(t) = kPalv(t) (2)
Step 2: Solve the homogenous equation 3 by trying Pth(t) = C0e−λt and solve
for λ.
dPth(t)
dt+ kPth(t) = 0 (3)
The ’h’ in Pth denotes that we are dealing with the homogenous equation.Substituting the solution in 3 results in λ = k. So the homogenous solution ofthe equation 3 is:
Pth(t) = C0e−kt (4)
Step 3: Find the particular solution for the inhomogenous equation 1 and solveconstants using boundary conditions. In order to solve this equation, we haveto know more about the partial gas pressure Palv(t). Two useful situations
3
described in literature are a situation in which Palv(t) is constant (correspondingto remaining at a certain depth) and a situation in which Palv(t) varies linearlywith time (corresponding to ascending/descending with constant speed). Wewill have a look at both situations.
Situation 1: constant ambient pressure
We look at the situation in which the alveolar partial pressure of the gas remainsconstant: Palv(t) = Palv0. This corresponds to a diving situation in which thediver remains at a certain depth. Equation 2 becomes:
dPt(t)
dt+ kPt(t) = kPalv0 (5)
We ’try’ the solution:
Pt(t) = C0e−kt + C1 (6)
If we subsitute solution 6 in equation 5 the e’s cancel out and we are left withC1 = Palv0. Now we have to think of a boundary condition, in order to findC0. We assume some partial pressure in the tissue Pt(0) = Pt0 at t = 0. If wesubstitute this into equation 6 we find that C0 = [Pt0 − Palv0]. So we are leftwith the following equation for the partial pressure in a specific type of tissue(characterized by the constant k):
Pt(t) = Palv0 + [Pt0 − Palv0]e−kt (7)
Pt(t) Partial pressure of the gas in the particular tissue (bar)Pt0 Initial partial pressure of the gas in the tissue at t = 0 (bar)Palv0 Constant partial pressure of the gas in the breathing mix in the
alveoli (bar)k A constant depending on the type of tissue (min−1)t Time (min)
This equation is known in literature as the Haldane equation. We can rewrite ita bit so that it corresponds to a form which is familiar in decompression theoryliterature:
Pt(t) = Pt0 + [Palv0 − Pt0](1 − e−kt) (8)
Situation 2: linearly varying ambient pressure
Very few divers plunge into the deep and remain at a certain depth for a longtime. For that reason we will look at the situation in which the diver ascendsor descends with constant speed. This means the partial pressure of the gas hebreathes varies linearly with time. Going back to equation 1 this means Palv
4
can be writen as Palv = Palv0+Rt. Palv0 is the initial partial pressure of the gasin the breathing mixture at t = 0, and R is the change rate (in bar/minute) ofthe partial pressure of this gas in the alveoli. Note: R is positive for descending(pressure increase) and negative for ascending (pressure decrease). Substitutingthis in equation 1 gives us:
dPt(t)
dt+ kPt(t) = kPalv0 + kRt (9)
We ’try’ the solution:
Pt(t) = C0e−kt + C1t+ C2 (10)
Substituting solution 10 in equation 9 leaves us with:
[kC1 − kR]t+ [C1 + kC2 − kPalv0] = 0 (11)
To find a solution for C1 and C2 that hold for every t we have to make bothparts between the square brackets in equation 11 equal to 0. This results inC1 = R and C2 = Palv0 −R/k. In this way we find:
Pt(t) = C0e−kt +Rt+ Palv0 −
R
k(12)
Again we use as boundary condition Pt(0) = Pt0 at t = 0 in order to find C0.Substituting this in 12 we find C0 = Pt0 − Palv0 + R/k. So for the ultimatesolution we find:
Pt(t) = Palv0 +R
[t− 1
k
]−
[Palv0 − Pt0 −
R
k
]e−kt (13)
Pt(t) Partial pressure of the gas in the particular tissue (bar)Pt0 Initial partial pressure of the gas in the tissue at t = 0 (bar)Palv0 Initial (alveolar) partial pressure of the gas in the breathing mix
at t=0 (bar)k A constant depending on the type of tissue (min−1)R Rate of change of the partial inert gas pressure in the breathing
mix in the alveoli (bar/min) R = QRamb, in which Q is thefraction of the inert gas and Ramb is the rate of change of theambient pressure.
t Time (min)
This solution was first proposed by Schreiner and hence known as the Schreinerequation. If we set the rate of change R to 0 (remaining at constant depth),the equation transforms in the Haldane equation 7. The Schreiner equation is
5
excellent for application in a simulation as used in diving computers. The diveis split up in measurement (time) intervals. In an interval the depth is regardedto vary linearly. With the same frequency of measuring of the environmentalpressure and performing the calculation, applying the Schreiner equation givesa more precise approximation of the actual pressure profile in the bodily tissuethan the Haldane equation.
Half-times
So we see an exponential behavior. When we look at the first situation (constantdepth) we have a tissue with in initial partial pressure Pt0. Eventually thepartial pressure of gas in the tissue will reach the partial pressure of the gasin the breathing mixture Palv0. We can calculate how long it takes for thepartial pressure to get half way in between, i.e. e−kτ = 1/2. The variableτ (tau) is called the ’half-time’ and is usually used for characterizing tissue(compartments). Rewriting: −kτ = ln(1/2) = −ln(2). So the relation betweenk and the half-time τ is:
τ =ln(2)
k(14)
k =ln(2)
τ(15)
The alveolar partial pressure
So far we did not worry about the values of Palv. We will have a closer lookat this alveolar partial pressure of the inert gas and how it is related to theambient pressure. The pressure of the air (or gas mixture) the diver breathesis equal to the ambient pressure Pamb surrounding the diver. The ambientpressure depends on the water depth and the atmospheric pressure at the watersurface. To be precise: it is equal to the atmospheric pressure (1 bar at sealevel) increased with 1 bar for every ten meters depth. The partial pressure ofthe inert gas in the alveoli depends on several factors:
• The partial pressure (fraction Q) of the inert gas in the air or gas mixturebreathed in
• The water vapor pressure. The dry air breathed in is humidified com-pletely by the upper airways (nose, larynx, trachea). Water vapor dilutesthe breathing gas. A constant vapor pressure at 37 degrees Celsius of0.0627 bar (47 mm Hg) has to be subtracted from the ambient pressure
• Oxygen O2 is removed from the breathing gas by respiratory gas exchangein the lungs
6
• Carbon Dioxide CO2 is added to the breathing gas by gas exchange inthe lungs. Since the partial pressure of CO2 in dry air (and in commonbreathing mixtures) is negligible, the partial pressure of the CO2 in thelungs will be equal to the arterial partial pressure. This pressure is 0.0534bar (40 mm Hg).
The process of Oxygen consumption and Carbon Dioxide production is char-acterized by the respiratory quotient RQ, the volume ratio of Carbon Dioxideproduction to the Oxygen consumption. Under normal steady state conditionsthe lungs take up about 250 ml of Oxygen, while producing about 200 ml ofCarbon Dioxide per minute, resulting in an RQ value of about 200/250=0.8.Depending on physical exertion and nutrition RQ values range from 0.7 to 1.0.Schreiner uses RQ = 0.8, US Navy uses RQ = 0.9 and Buhlmann uses RQ = 1.0.
The alveolar ventilation equation gives us the partial pressure of the inert gaswith respect to the ambient pressure:
Palv = [Pamb − PH2O − PCO2 + ∆PO2]Q (16)
Palv =
[Pamb − PH2O +
1 −RQ
RQPCO2
]Q (17)
Palv Partial pressure of the gas in the alveoli (bar)Pamb Ambient pressure, i.e. the pressure of the breathing gas(bar)PH2O Water vapor pressure, at 37 degrees Celsius 0.0627 bar (47 mm
Hg)PCO2 Carbon Dioxide pressure, we can use 0.0534 bar (40 mm Hg)∆PO2 Decrease in partial Oxygen pressure due to gas exchange in the
lungsRQ Respiratory quotient: ratio of Carbon Dioxide production to
Oxygen consumptionQ Fraction of inert gas in the breathing gas. For example N2
fraction in dry air is 0.78
The Schreiner RQ value is the most conservative of the three RQ values. Underequal circumstances using the Schreiner value results in the highest calculatedpartial alveolar pressure and hence the highest partial pressure in the tissuecompartments. This leads to shorter no decompression times and hence to lessrisk for DCS.
Examples
We will have a look at our diver who plunges to 30 m and stays there for awhile. The diver breathes compressed air and did not dive for quite a whilebefore this dive. So at the start of the dive, all his tissue is saturated with
7
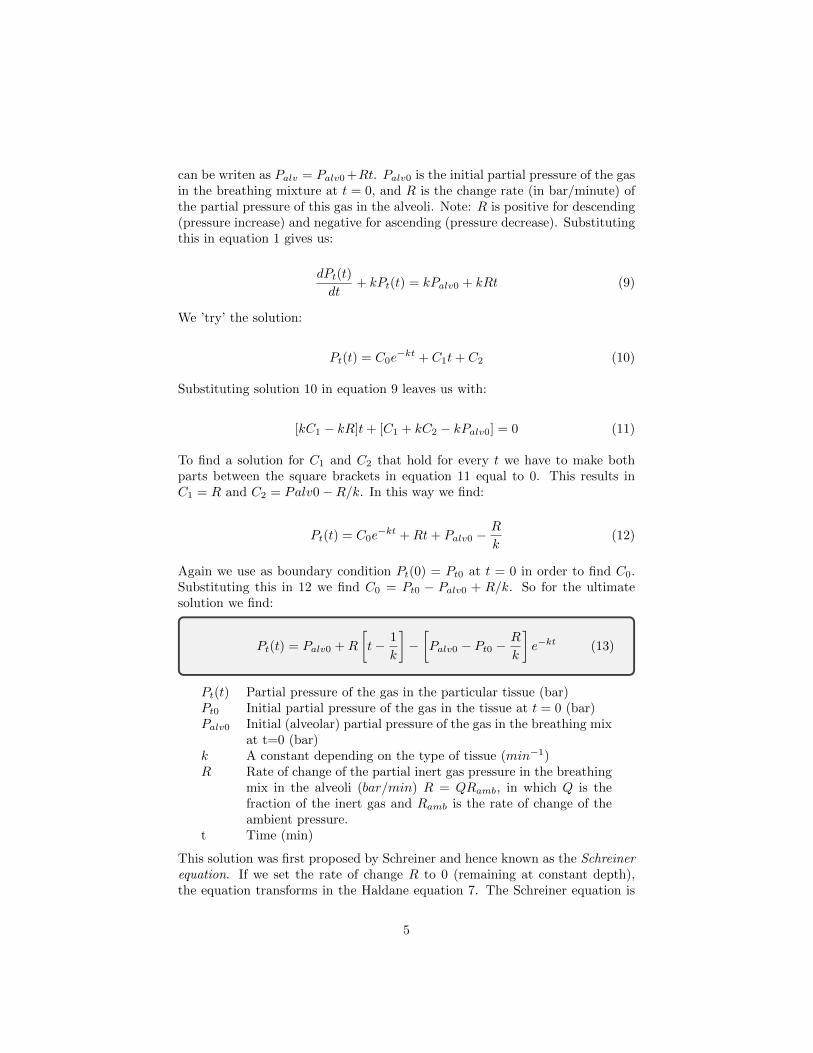
Nitrogen at a level that corresponds to sea level. We neglect the period ofdescending. In particular, we will look at two types of tissue in his body witha half time of 4 minutes (the fastest tissue) resp. 30 minutes (medium fasttissue). The ambient pressure at 30 meters is 4 bar. Equation 17 gives us apartial alveolar N2 pressure of 3.08 bar at 30 meters and 0.736 bar at sea level,using the RQ = 0.9 value of the US Navy. Substituting these values in equation7 result in 18, predicting the partial pressure in the tissues. This pressure isshown in figure 1:
Pt4(t) = 3.08 + [0.736 − 3.08]e−ln(2)
4 t (18)
Pt30(t) = 3.08 + [0.736 − 3.08]e−ln(2)30 t (19)
Figure 1: Partial Nitrogen pressure in tissue with half-times 4 and 30 minutes
Apparently, the faster tissue saturates much faster than the medium fast tissue.Usually, after 6 half-times the tissue is called saturated.
After 20 minutes at 30 meter our diver decides to head back to the surface ata very slow speed of -3 meter per minute (negative, since he is ascending). Ittakes 10 minutes to swim to the surface. The rate of change of partial alveolarpressure R is related to the change in ambient pressure Ramb and the fractionQ of the inertial gas by:
R = RambQ (20)
In our example the ambient pressure drops -(4-1)=-3 bar in 10 minutes. Thiscorresponds to Ramb = −0.3bar/min. The partial pressure change of the alve-
8
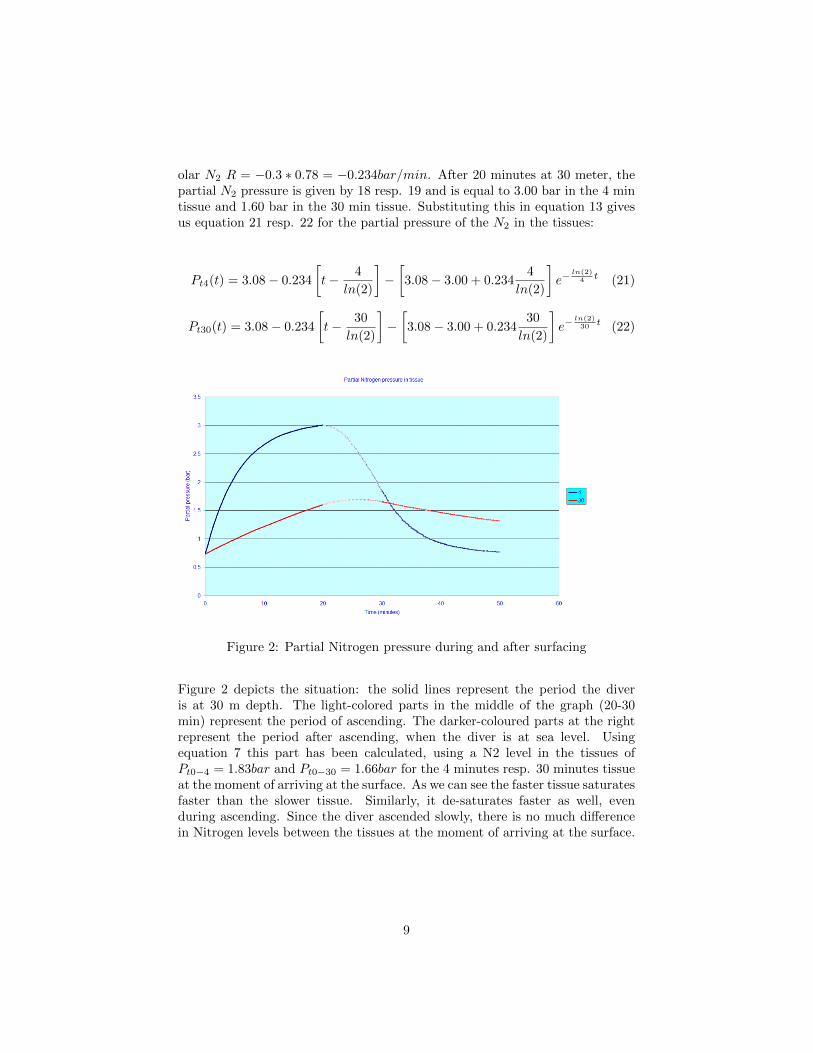
olar N2 R = −0.3 ∗ 0.78 = −0.234bar/min. After 20 minutes at 30 meter, thepartial N2 pressure is given by 18 resp. 19 and is equal to 3.00 bar in the 4 mintissue and 1.60 bar in the 30 min tissue. Substituting this in equation 13 givesus equation 21 resp. 22 for the partial pressure of the N2 in the tissues:
Pt4(t) = 3.08 − 0.234
[t− 4
ln(2)
]−[3.08 − 3.00 + 0.234
4
ln(2)
]e−
ln(2)4 t (21)
Pt30(t) = 3.08 − 0.234
[t− 30
ln(2)
]−
[3.08 − 3.00 + 0.234
30
ln(2)
]e−
ln(2)30 t (22)
Figure 2: Partial Nitrogen pressure during and after surfacing
Figure 2 depicts the situation: the solid lines represent the period the diveris at 30 m depth. The light-colored parts in the middle of the graph (20-30min) represent the period of ascending. The darker-coloured parts at the rightrepresent the period after ascending, when the diver is at sea level. Usingequation 7 this part has been calculated, using a N2 level in the tissues ofPt0−4 = 1.83bar and Pt0−30 = 1.66bar for the 4 minutes resp. 30 minutes tissueat the moment of arriving at the surface. As we can see the faster tissue saturatesfaster than the slower tissue. Similarly, it de-saturates faster as well, evenduring ascending. Since the diver ascended slowly, there is no much differencein Nitrogen levels between the tissues at the moment of arriving at the surface.
9
Supersaturation limits and M-Values
So we are now able to calculate inert gas levels and the amount of supersatura-tion in all tissue compartments of the diver. As we stated a certain amount ofsupersaturation is allowed, without developing DCS symptoms. In this sectionwe will summarize various limits applying to supersaturation levels. As we willsee these limits depend on:
• Type (half-time) of the tissue
• Ambient pressure, i.e. the pressure of the breathing gas (depending ondepth and atmospheric pressure)
Limits according to Haldane
In 1908 Haldane presented the first model for decompression. He noticed thatdivers could surface from a depth of 10 meter, without developing DCS. Heconcluded that the pressure in the tissue can exceed the ambient pressure by afactor of 2. (Actually the factor the partial pressure of the Nitrogen in the bodyexceeds the ambient pressure is 0.78*2=1.56, as Workman concluded)
Haldane used this ratio to construct the first decompression tables. Up to 1960ratio’s were used. Different ratio’s were defined by various scientists. In thatperiod most of the US Navy decompression tables were calculated using thismethod.
Workman M-values
At longer and deeper dives, the ratio limits did not provide enough safety. Fur-ther research into supersaturation limits was performed by Robert D. Workmanaround 1965. Workman performed research for the U.S. Navy ExperimentalDiving Unit (NEDU). He found that each tissue compartment had a differentpartial pressure limit, above which DCS symptoms develop. He called this limit-ing pressure M. He found a linear relationship between this M-value and depth.Hence he defined this relationship as:
M = M0 + ∆Md (23)
M Partial pressure limit, for each tissue compartment (bar)M0 The partial pressure limit at sea level (zero depth), defined for
each tissue compartment (bar)∆M Increase of M per meter depth, defined for each compartment
(bar/m)d Depth (m)
10
The actual Workman M-values are shown in the M-Values tables. Workmanfound that M values decrease with increasing half-time of the tissue compart-ment, indicating fast tissues can tolerate a higher supersaturation level. Using23 we can calculate (for each tissue compartment) the minimum tolerated depthdmin the diver should stay at during a decompression stop, depending on theamount of supersaturation:
dmin =Pt −M0
∆M(24)
In order to estimate the actual depth the diver should stay below, we have tocalculate the depth dmin for each compartment, and take the deepest depth asthe limiting depth. The tissue that defines this depth is the limiting tissue.
The Buhlmann models
Buhlmann performed research to decompression from 1959 up to 1993. LikeWorkman he suggested a linear relationship between supersaturation limits andambient pressure. However, his definition is somewhat different:
Pt.tol.ig = M =Pambb
+ a (25)
Pt.tol.ig Partial pressure limit, for each tissue compartment, equals M(bar)
Pamb The ambient pressure, i.e. the pressure of the breathing gas(bar)
b 1/b is the increase of the limit per unit ambient pressure (di-mensionless)
a The limit value at (theoretical) absolute 0 ambient pressure(bar)
The big difference (actually, the minor difference) between the Workman defini-tion and the Buhlmann definition is that Workman relates M to ambient depthpressure (diving from sea level), whereas Buhlmann relates to absolute zero am-bient pressure. However, in both cases, the partial pressure limit is related toambient pressure by a linear relationship. Conversions between both definitionscan be easily made, resulting in the following relationships:
Pt.tol.ig = M (26)
∆M =1
b(27)
11
M0 = a+Pamb sealevel
b(28)
In 1985 Buhlmann proposed the ZH-L12 model (ZH stands for Zurich, L for’limits’ or ’linear’, and 12 for 12 pairs of M-values). In 1993 book he proposedthe ZH-L16 model, which is quite popular as basis for diving computers. Thecoefficients of both models are presented in the tables in M-value style.
For the ZH-L16 model Buhlmann used a emperical relation for the a and bcoefficient as function of the half-time τ for Nitrogen N2:
a = 2barτ−13 (29)
b = 1.005 − τ−12 (30)
This results in the A-series coefficients. However, these coefficients were notconservative enough, as was empirically established. So he developed the B-and C-series of coefficients for table calculations and computer calculations re-spectively. All three sets are presented in the tables.
Other models
DCAP (Decompression and Analysis Program) uses the M11F6 M-values, es-tablished by Bill Hamilton for the Swedish Navy. This set of M-values is usedin many decompression tables used in trimix and technical diving.
The PADI Recreational Dive Planner TM uses the set of M-values developed byRaymond E. Rogers and Michael R. Powell from Diving Science and TechnologyCorp (DSAT). These values were extensively tested and verified, using divingexperience and Doppler-monitoring (a way to detect silent bubbles in tissue).
The Recreational Dive Planner TM is a table used for no-decompression divesonly. This means that for the calculation of table values no decompression stopsare included: the diver can return to the surface any time. The only relevantlimit M is the limit at sea level, M0. For this model ∆M is not needed.
A comparison between the models
In the graphs below the limit M for the partial pressure of Nitrogen is plottedas function of the half-time for the different models. As we can see the limitsaccording to the different models are comparable to each other.
12
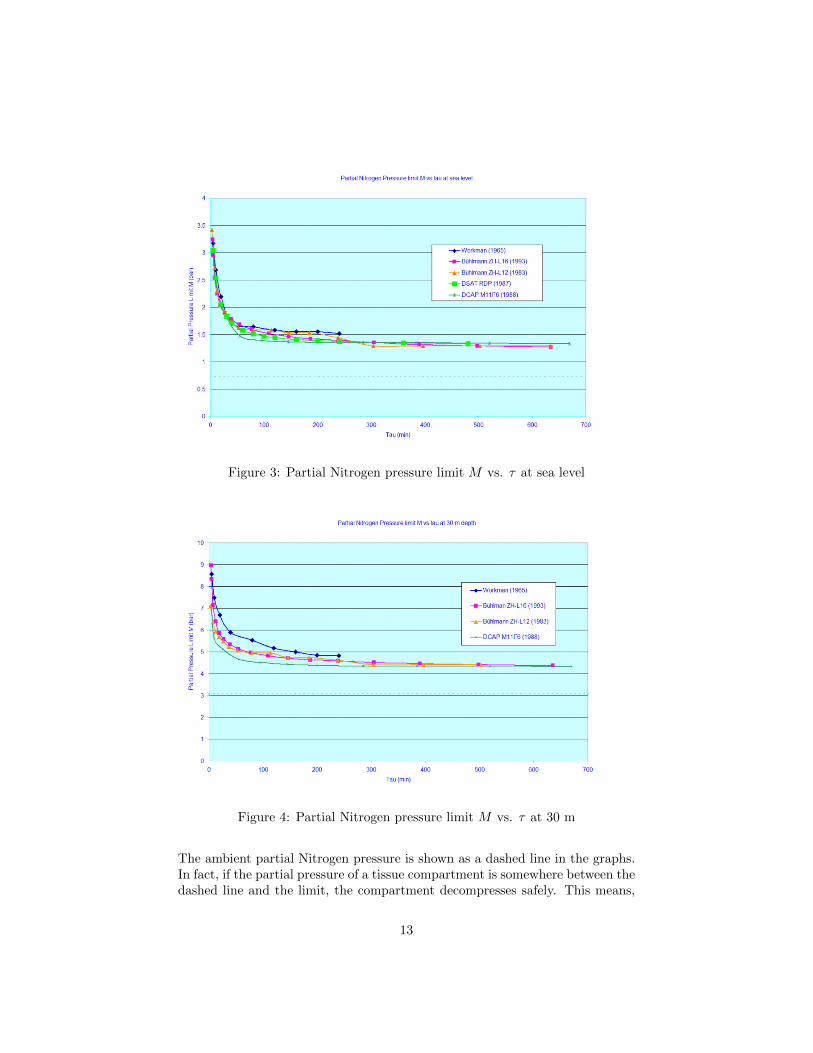
Figure 3: Partial Nitrogen pressure limit M vs. τ at sea level
Figure 4: Partial Nitrogen pressure limit M vs. τ at 30 m
The ambient partial Nitrogen pressure is shown as a dashed line in the graphs.In fact, if the partial pressure of a tissue compartment is somewhere between thedashed line and the limit, the compartment decompresses safely. This means,
13
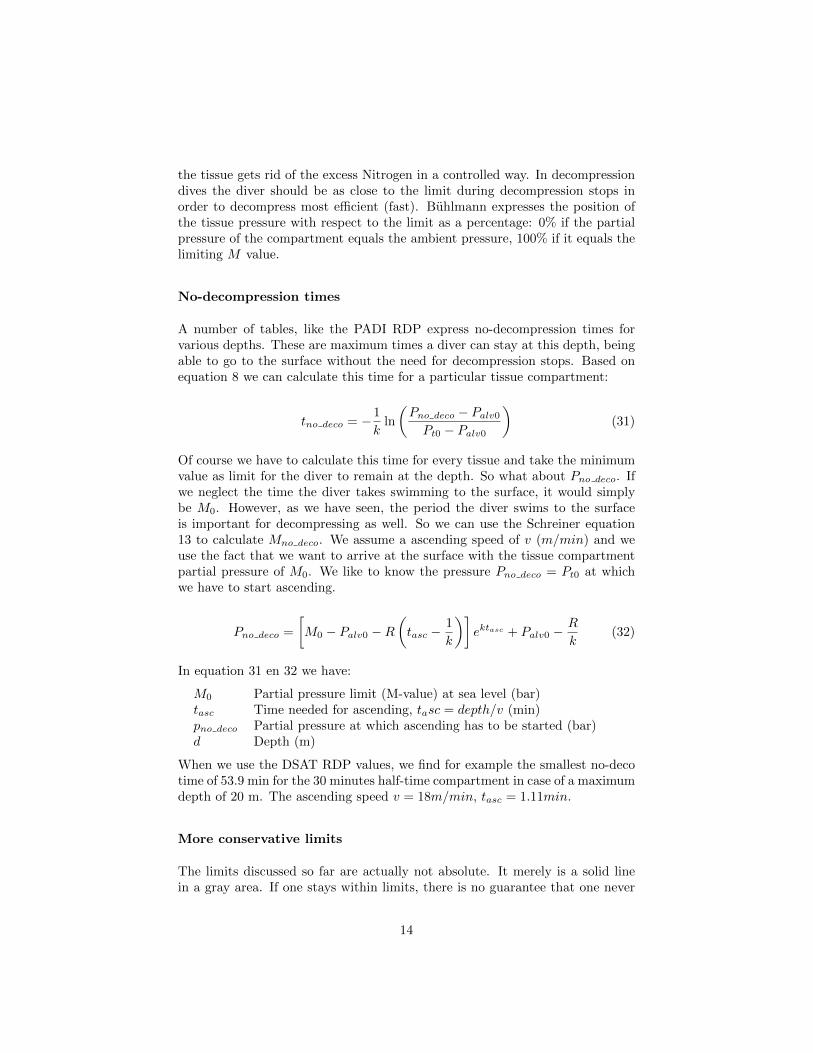
the tissue gets rid of the excess Nitrogen in a controlled way. In decompressiondives the diver should be as close to the limit during decompression stops inorder to decompress most efficient (fast). Buhlmann expresses the position ofthe tissue pressure with respect to the limit as a percentage: 0% if the partialpressure of the compartment equals the ambient pressure, 100% if it equals thelimiting M value.
No-decompression times
A number of tables, like the PADI RDP express no-decompression times forvarious depths. These are maximum times a diver can stay at this depth, beingable to go to the surface without the need for decompression stops. Based onequation 8 we can calculate this time for a particular tissue compartment:
tno deco = −1
kln
(Pno deco − Palv0Pt0 − Palv0
)(31)
Of course we have to calculate this time for every tissue and take the minimumvalue as limit for the diver to remain at the depth. So what about Pno deco. Ifwe neglect the time the diver takes swimming to the surface, it would simplybe M0. However, as we have seen, the period the diver swims to the surfaceis important for decompressing as well. So we can use the Schreiner equation13 to calculate Mno deco. We assume a ascending speed of v (m/min) and weuse the fact that we want to arrive at the surface with the tissue compartmentpartial pressure of M0. We like to know the pressure Pno deco = Pt0 at whichwe have to start ascending.
Pno deco =
[M0 − Palv0 −R
(tasc −
1
k
)]ektasc + Palv0 −
R
k(32)
In equation 31 en 32 we have:
M0 Partial pressure limit (M-value) at sea level (bar)tasc Time needed for ascending, tasc = depth/v (min)pno deco Partial pressure at which ascending has to be started (bar)d Depth (m)
When we use the DSAT RDP values, we find for example the smallest no-decotime of 53.9 min for the 30 minutes half-time compartment in case of a maximumdepth of 20 m. The ascending speed v = 18m/min, tasc = 1.11min.
More conservative limits
The limits discussed so far are actually not absolute. It merely is a solid linein a gray area. If one stays within limits, there is no guarantee that one never
14

would develop DCS. Actual calculations can be made more conservative (includemore safety) by adding extra depth, simulating asymmetrical tissue behaviour(a longer half-time for de-saturation than for saturation), adding surplus ofNitrogen, assuming a higher ascending speed, etc. Uwatec uses a Buhlmannmodel ZH-L8 ADT (ADT stands for adaptive), which uses 8 tissue compartmentand takes into account the water temperature and the amount of work the diverperforms (measured from the amount of air he uses). If the water is cold thehalf-time for de-saturation is longer than the half-time for saturation.
15