decomposition analysis of spanish life expectancy at · pdf filedemographic research –...
TRANSCRIPT

Demographic Research a free, expedited, online journal of peer-reviewed research and commentary in the population sciences published by the Max Planck Institute for Demographic Research Konrad-Zuse Str. 1, D-18057 Rostock · GERMANY www.demographic-research.org
DEMOGRAPHIC RESEARCH VOLUME 13, ARTICLE 20, PAGES 521-546 PUBLISHED 17 NOVEMBER 2005 http://www.demographic-research.org/Volumes/Vol13/20/ DOI: 10.4054/DemRes.2005.13.20 Research Article
Decomposition analysis of Spanish life expectancy at birth: Evolution and changes in the components by sex and age
Rosa Gómez-Redondo
Carl Boe
This article is part of Demographic Research Special Collection 4, “Human Mortality over Age, Time, Sex, and Place: The 1st HMD Symposium”. Please see Volume 13, publications 13-10 through 13-20. © 2005 Max-Planck-Gesellschaft.
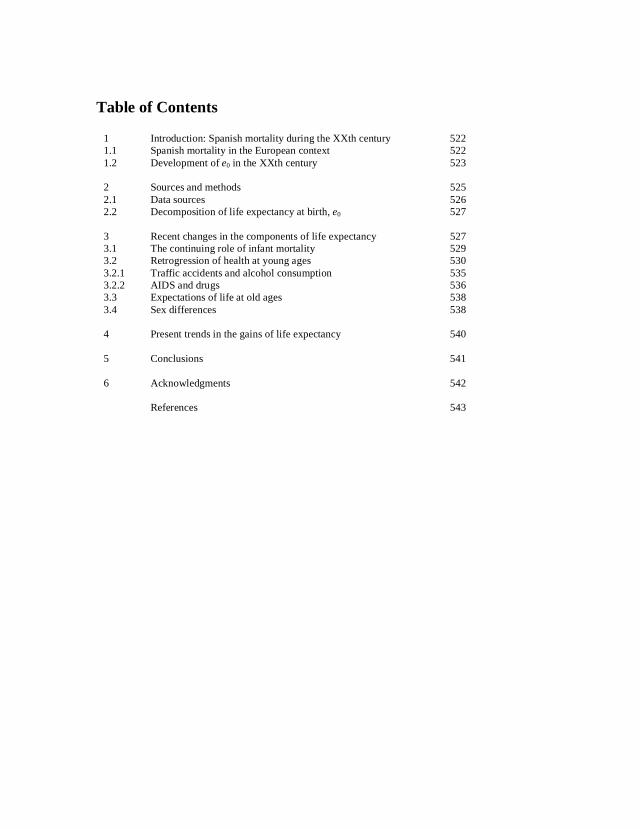
Table of Contents
1 Introduction: Spanish mortality during the XXth century 522 1.1 Spanish mortality in the European context 522 1.2 Development of e0 in the XXth century 523 2 Sources and methods 525 2.1 Data sources 526 2.2 Decomposition of life expectancy at birth, e0 527 3 Recent changes in the components of life expectancy 527 3.1 The continuing role of infant mortality 529 3.2 Retrogression of health at young ages 530 3.2.1 Traffic accidents and alcohol consumption 535 3.2.2 AIDS and drugs 536 3.3 Expectations of life at old ages 538 3.4 Sex differences 538 4 Present trends in the gains of life expectancy 540 5 Conclusions 541 6 Acknowledgments 542 References 543
Demographic Research– Volume 13, Article 20a research article
Decomposition analysis of Spanish life expectancy at birth: Evolutionand changes in the components by sex and age.1
Rosa Gomez-Redondo2
Carl Boe3
Abstract
Using data from the Human Mortality Database (HMD), the paper analyzes the increasein the life expectancy of the Spanish population during three decades, 1970–2001, in orderto ascertain which age and sex groups have made the most progress in terms of increasinglife expectancy. Within the theoretical context of the Health Transition, the authors pro-vide a brief description of the Spanish mortality during the XXth century across severalindexes. The study uses a decomposition technique to separate changes in Spanish lifeexpectancy at birth (e0) into age, sex, and time components. The most important com-ponents of change are found in the elderly, in young people, and in the evolution of sexdifferences in human mortality.
This article is part of Demographic Research Special Collection 4,“Human Mortality over Age, Time, Sex, and Place: The 1st HMD Symposium”.Please see Volume 13, Publications 13-10 through 13-20.
1This paper is an elaboration of a presentation made during the The 1st HMD Symposium, “Human Mortalityover Age, Time, Sex, and Place”, June 18-19, 2004, at the Max Planck Institute for Demographic Research(MPIDR) in Rostock, Germany.
2Facultad de CCPP y Sociologıa,UNED, Obispo Trejo, s/n. 28040 Madrid (Spain), [email protected] on the Economics and Demography of Aging, Dept. of Demography, University of California,Berkeley 94720 (USA), [email protected]
http://www.demographic-research.org 521
Gomez-Redondo and Boe: Decomposition analysis of Spanish life expectancy at birth
1. Introduction: Spanish mortality during the XXth century
Spanish population has one of the highest life expectancies in the world although itsMortality Transition started later than many other countries in Europe (Nadal, 1976). TheSpanish Mortality Transition started over two centuries ago, but most of the progress hasoccurred in the XXth century. What began as a steady and measured change acceleratedsharply after the turn of the century as the mortality regime moved into its final health-transition stage (Lerner, 1973; Olshansky and Ault, 1986; Caldwell, 1990; Frenket al.,1991; Mesléand Vallin, 2002 ).
1.1 Spanish mortality in the European context
Prior to World War II, Spain and many other countries in Southern Europe showed aslower rate of demographic change as compared to Northern Europe. At the end ofthe War, Europe’s mortality showed a North-South intensity gradient (Caselli and Egidi,1981; Caselli, 1993; Vallin, Mesle and Valkonen, 2001). The post-war period saw thebeginning of a process of rapid change, which further accelerated in the 1970s, and whichled Spain to catch up and join the top echelon of those Western countries with high lifeexpectancies. At the same time that this rapid improvement was happening in SouthernEurope, the political crises in Eastern Europe produced a downturn in mortality improve-ments, creating a new East-West division of the continent with respect to survival (Mesleand Hertrich, 1997). We have chosen in our analysis to focus on the last three decadesof the XXth century, the time when Spain compares favorably with other low-mortalitycountries and a time of interesting mortality change throughout Europe.
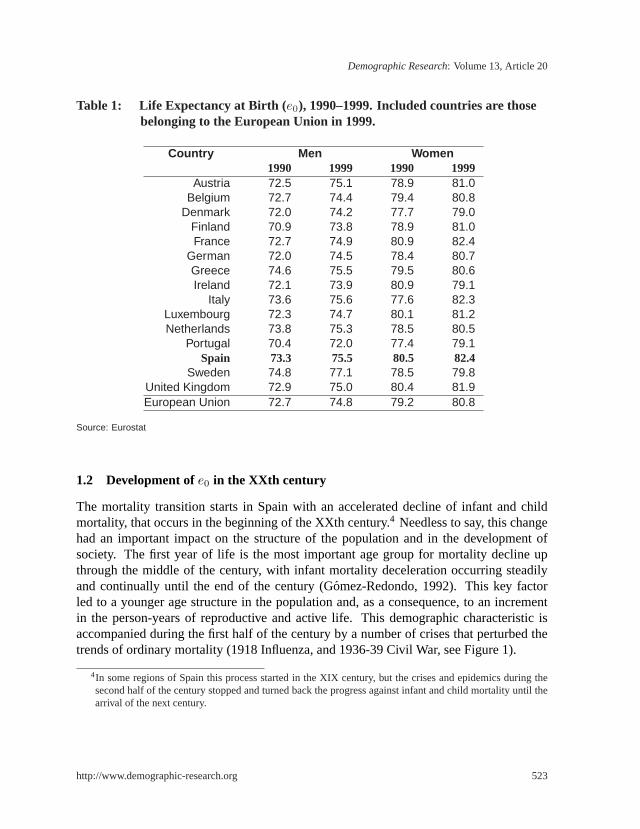
Within the European context, Spain and France have the highest — and still growing— life expectancy for women, followed by Sweden; the male population is in a secondtier together with Italy and Holland, just below Sweden (Table 1). The Spanish numbersin 1999 for women are almost 83 years, 7 years higher than for their male counterparts(almost 76 years). To be at the forefront of European demography means the same as to beat a world record level, as only Japan ranks higher in longevity than the above mentionedcountries, with a life expectancy in 1999 of 84 years for women and 77 years for men(Human Mortality Database, 2004). In any case, current life expectancies in all of theabove-mentioned countries have no historical precedence.
522 http://www.demographic-research.org
Demographic Research: Volume 13, Article 20
Table 1: Life Expectancy at Birth (e0), 1990–1999. Included countries are thosebelonging to the European Union in 1999.
Country Men Women1990 1999 1990 1999
Austria 72.5 75.1 78.9 81.0Belgium 72.7 74.4 79.4 80.8
Denmark 72.0 74.2 77.7 79.0Finland 70.9 73.8 78.9 81.0France 72.7 74.9 80.9 82.4
German 72.0 74.5 78.4 80.7Greece 74.6 75.5 79.5 80.6Ireland 72.1 73.9 80.9 79.1
Italy 73.6 75.6 77.6 82.3Luxembourg 72.3 74.7 80.1 81.2Netherlands 73.8 75.3 78.5 80.5
Portugal 70.4 72.0 77.4 79.1Spain 73.3 75.5 80.5 82.4
Sweden 74.8 77.1 78.5 79.8United Kingdom 72.9 75.0 80.4 81.9European Union 72.7 74.8 79.2 80.8
Source: Eurostat
1.2 Development ofe0 in the XXth century
The mortality transition starts in Spain with an accelerated decline of infant and childmortality, that occurs in the beginning of the XXth century.4 Needless to say, this changehad an important impact on the structure of the population and in the development ofsociety. The first year of life is the most important age group for mortality decline upthrough the middle of the century, with infant mortality deceleration occurring steadilyand continually until the end of the century (Gomez-Redondo, 1992). This key factorled to a younger age structure in the population and, as a consequence, to an incrementin the person-years of reproductive and active life. This demographic characteristic isaccompanied during the first half of the century by a number of crises that perturbed thetrends of ordinary mortality (1918 Influenza, and 1936-39 Civil War, see Figure 1).
4In some regions of Spain this process started in the XIX century, but the crises and epidemics during thesecond half of the century stopped and turned back the progress against infant and child mortality until thearrival of the next century.
http://www.demographic-research.org 523

Gomez-Redondo and Boe: Decomposition analysis of Spanish life expectancy at birth
Figure 1: Development of Life Expectancy at Birth (e0) in Spain, XXth Century.
Source: Human Mortality Database.
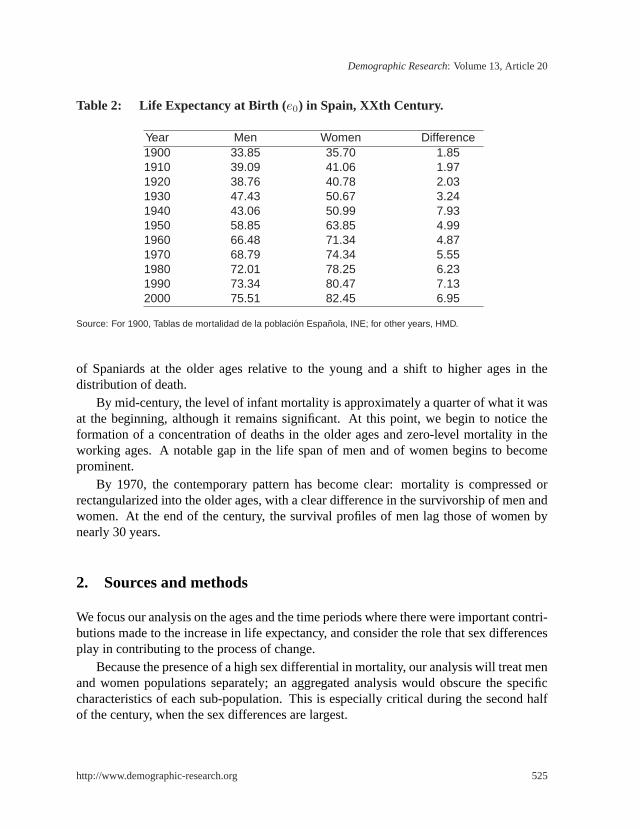
Figure 1 reveals that the change in life expectancy during the XXth century has beensizable. While the steep trend levels out slightly in recent years, there is no evidence thatthe process has stabilized or reached a plateau. The graph also shows that the differencebetween the sexes has been increasing. Table 2 quantifies this sex-specific evolution oflife expectancy for the Spanish population. As is evident from both the graph and thetable, other than at times of war, a sex difference of this order of magnitude (5–7 years oflife) does not occur until quite recently. At the beginning of the century, the sex differencereflects mostly differences of a biological nature. Once the trend of the mortality declinestabilizes after the 1950s (overcoming the effects of the Civil War and the post-war periodthat differentially affected men), the divergence widens from 1960 onward.
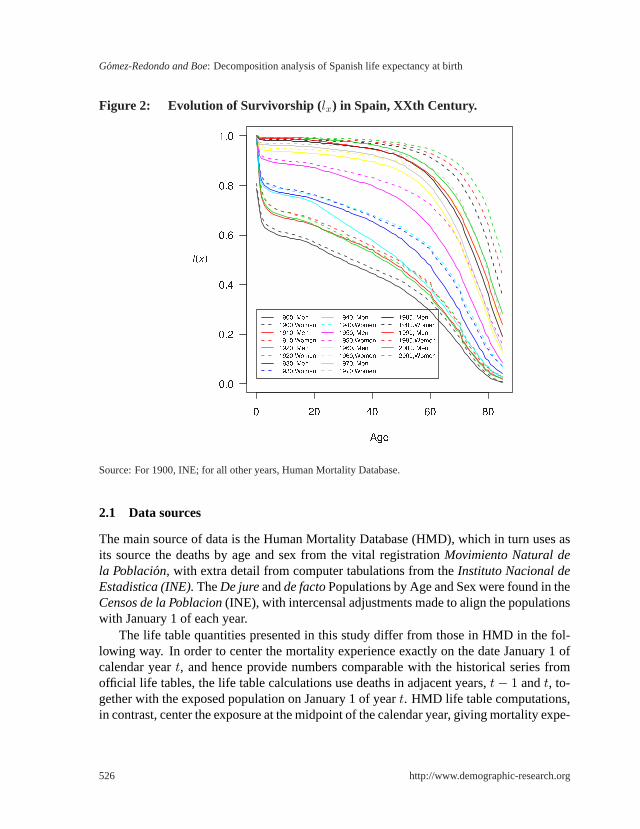
During the XXth Century, the structure of mortality changes as does the profile of theSpanish survival curves (Figure 2). At the beginning of the century, there are two relevantfactors for the ensuing epidemiological-health transition: (1) a high concentration (40%)of deaths at the youngest ages, due to infant mortality, with deaths across the adult agesdistributed evenly; (2) the presence of crises, notably the influenza epidemic in 1918and the Civil War, 1936–1939 together with the social chaos of the post-war period. Asthese factors lose strength over the course of the century, there is an increasing presence
524 http://www.demographic-research.org
Demographic Research: Volume 13, Article 20
Table 2: Life Expectancy at Birth (e0) in Spain, XXth Century.
Year Men Women Difference1900 33.85 35.70 1.851910 39.09 41.06 1.971920 38.76 40.78 2.031930 47.43 50.67 3.241940 43.06 50.99 7.931950 58.85 63.85 4.991960 66.48 71.34 4.871970 68.79 74.34 5.551980 72.01 78.25 6.231990 73.34 80.47 7.132000 75.51 82.45 6.95
Source: For 1900, Tablas de mortalidad de la poblacion Espanola, INE; for other years, HMD.
of Spaniards at the older ages relative to the young and a shift to higher ages in thedistribution of death.
By mid-century, the level of infant mortality is approximately a quarter of what it wasat the beginning, although it remains significant. At this point, we begin to notice theformation of a concentration of deaths in the older ages and zero-level mortality in theworking ages. A notable gap in the life span of men and of women begins to becomeprominent.
By 1970, the contemporary pattern has become clear: mortality is compressed orrectangularized into the older ages, with a clear difference in the survivorship of men andwomen. At the end of the century, the survival profiles of men lag those of women bynearly 30 years.
2. Sources and methods
We focus our analysis on the ages and the time periods where there were important contri-butions made to the increase in life expectancy, and consider the role that sex differencesplay in contributing to the process of change.
Because the presence of a high sex differential in mortality, our analysis will treat menand women populations separately; an aggregated analysis would obscure the specificcharacteristics of each sub-population. This is especially critical during the second halfof the century, when the sex differences are largest.
http://www.demographic-research.org 525
Gomez-Redondo and Boe: Decomposition analysis of Spanish life expectancy at birth
Figure 2: Evolution of Survivorship ( lx) in Spain, XXth Century.
Source: For 1900, INE; for all other years, Human Mortality Database.
2.1 Data sources
The main source of data is the Human Mortality Database (HMD), which in turn uses asits source the deaths by age and sex from the vital registrationMovimiento Natural dela Poblacion, with extra detail from computer tabulations from theInstituto Nacional deEstadistica (INE).TheDe jureandde factoPopulations by Age and Sex were found in theCensos de la Poblacion(INE), with intercensal adjustments made to align the populationswith January 1 of each year.
The life table quantities presented in this study differ from those in HMD in the fol-lowing way. In order to center the mortality experience exactly on the date January 1 ofcalendar yeart, and hence provide numbers comparable with the historical series fromofficial life tables, the life table calculations use deaths in adjacent years,t− 1 andt, to-gether with the exposed population on January 1 of yeart. HMD life table computations,in contrast, center the exposure at the midpoint of the calendar year, giving mortality expe-
526 http://www.demographic-research.org
Demographic Research: Volume 13, Article 20
rience dated July 1. The study looks at the final three decades for which data is available,from 2000–2001 back to 1970–1971.
2.2 Decomposition of life expectancy at birth,e0
The study uses a classic demographic technique, the decomposition of the difference ina summary measure (Kitagawa, 1955), in order to understand the role that age- and sex-specific death rates have had in shaping the evolution of Spanish mortality. In this casewe examine life expectancy at birth(e0) as the summary measure of mortality experience.The method assumes that the summary measuree0 depends smoothly upon the underly-ing age-specific death rates so that the difference in life expectancy,e0(t2) − e0(t1) fortimest1 andt2 may be expressed as a Taylor expansion around the deaths rates pertainingat t1. There are many variants published for how to perform the decomposition: discrete(Arriaga, 1982; Andreev, 1982; Andreev, Shokolnikov, and Begun, 2002), continuous(Keyfitz, 1977; Pollard, 1982,1988; Vaupel and Canudas-Romo, 2003), general numericformulations (Horiuchi, Wilmoth and Pletcher, 2000; Canudas Romo, 2002), and formu-las specific to life expectancy differences. We follow the development of Pollard(1988).
The difference in life expectancies may be expressed exactly as the sum of age-specificeffects:
∆e0 = e0(t2)− e0(t1) =∫ ∞
0
[µx(t1)− µx(t2)] T xdx =∫ ∞
0
cxdx
whereT x = [lx(t2)ex(t1) + lx(t1)ex(t2)]/2 is a weight of average future years lived be-yond agex that tells how much influence the mortality rate differential,∆µx = (µx(t1)−µx(t2)), has on the life expectancy differential, andcx are the age-specific decompositioncomponents. Empirically, single-year central death rates substitute forµx in the calcula-tion.
The decompositions are made separately for each decade during the 30-year periodunder study, and separately by sex so that comparisons may be made in the age and sexpattern of contributions to∆e0 over time. In this context, the componentscx are given theinterpretation of the attributable gain in life expectancy contributed by each agex duringthe period.
3. Recent changes in the components of life expectancy
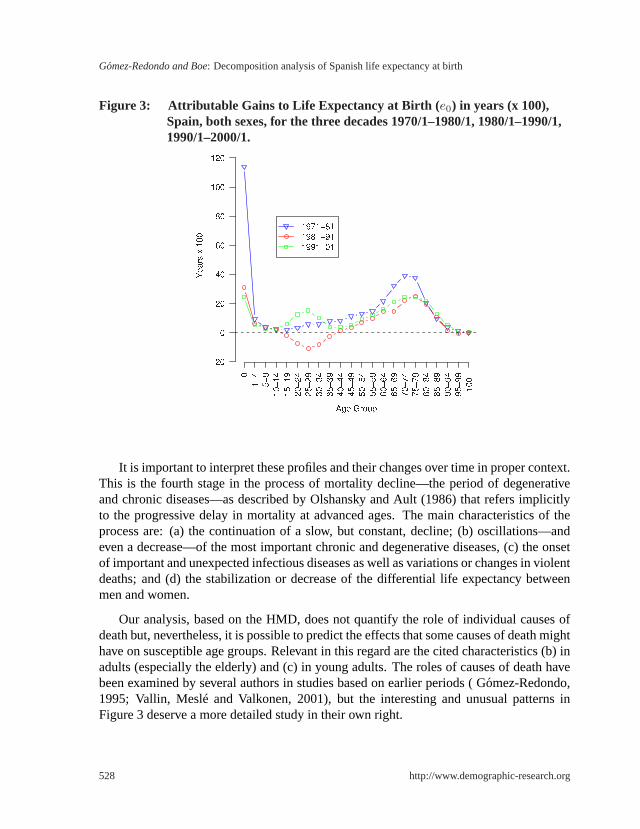
The period 1971-2001 under consideration is a critical time for the change in the structureof Spanish mortality. Over the entire period, the elderly have experienced the biggestgains in life expectancy. However, the age-sex component profilecx is quite different foreach decade (Figure 3).
http://www.demographic-research.org 527
Gomez-Redondo and Boe: Decomposition analysis of Spanish life expectancy at birth
Figure 3: Attributable Gains to Life Expectancy at Birth ( e0) in years (x 100),Spain, both sexes, for the three decades 1970/1–1980/1, 1980/1–1990/1,1990/1–2000/1.
It is important to interpret these profiles and their changes over time in proper context.This is the fourth stage in the process of mortality decline—the period of degenerativeand chronic diseases—as described by Olshansky and Ault (1986) that refers implicitlyto the progressive delay in mortality at advanced ages. The main characteristics of theprocess are: (a) the continuation of a slow, but constant, decline; (b) oscillations—andeven a decrease—of the most important chronic and degenerative diseases, (c) the onsetof important and unexpected infectious diseases as well as variations or changes in violentdeaths; and (d) the stabilization or decrease of the differential life expectancy betweenmen and women.
Our analysis, based on the HMD, does not quantify the role of individual causes ofdeath but, nevertheless, it is possible to predict the effects that some causes of death mighthave on susceptible age groups. Relevant in this regard are the cited characteristics (b) inadults (especially the elderly) and (c) in young adults. The roles of causes of death havebeen examined by several authors in studies based on earlier periods ( Gomez-Redondo,1995; Vallin, Meslé and Valkonen, 2001), but the interesting and unusual patterns inFigure 3 deserve a more detailed study in their own right.
528 http://www.demographic-research.org
Demographic Research: Volume 13, Article 20
3.1 The continuing role of infant mortality
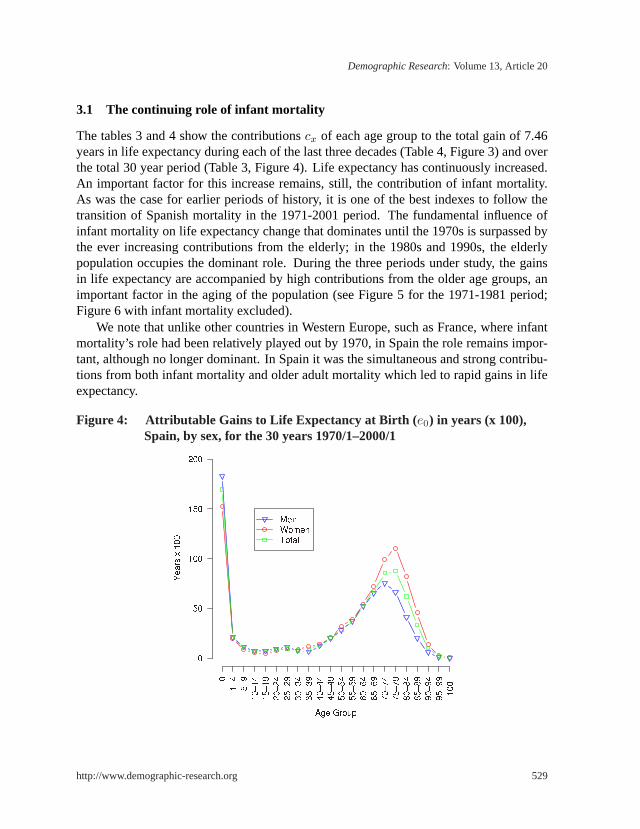
The tables 3 and 4 show the contributionscx of each age group to the total gain of 7.46years in life expectancy during each of the last three decades (Table 4, Figure 3) and overthe total 30 year period (Table 3, Figure 4). Life expectancy has continuously increased.An important factor for this increase remains, still, the contribution of infant mortality.As was the case for earlier periods of history, it is one of the best indexes to follow thetransition of Spanish mortality in the 1971-2001 period. The fundamental influence ofinfant mortality on life expectancy change that dominates until the 1970s is surpassed bythe ever increasing contributions from the elderly; in the 1980s and 1990s, the elderlypopulation occupies the dominant role. During the three periods under study, the gainsin life expectancy are accompanied by high contributions from the older age groups, animportant factor in the aging of the population (see Figure 5 for the 1971-1981 period;Figure 6 with infant mortality excluded).
We note that unlike other countries in Western Europe, such as France, where infantmortality’s role had been relatively played out by 1970, in Spain the role remains impor-tant, although no longer dominant. In Spain it was the simultaneous and strong contribu-tions from both infant mortality and older adult mortality which led to rapid gains in lifeexpectancy.
Figure 4: Attributable Gains to Life Expectancy at Birth ( e0) in years (x 100),Spain, by sex, for the 30 years 1970/1–2000/1
http://www.demographic-research.org 529

Gomez-Redondo and Boe: Decomposition analysis of Spanish life expectancy at birth
Table 3: Gains in life expectancy at birth (e0) in years (x 100) and proportion oftotal gains attributable to each age group, in Spain, 1971-2001.
1970/1-2000/1Age Group Men % Women % Both %
0 182.66 26.57 152.71 18.77 169.37 22.691-4 21.22 3.09 19.55 2.40 20.52 2.755-9 11.22 1.63 8.46 1.04 9.98 1.34
10-14 7.48 1.09 5.27 0.65 6.47 0.8715-19 7.51 1.09 4.38 0.54 5.98 0.8020-24 9.40 1.37 7.40 0.91 8.44 1.1325-29 10.91 1.59 9.09 1.12 9.79 1.3130-34 7.23 1.05 8.84 1.09 7.70 1.0335-39 6.46 0.94 11.76 1.45 8.80 1.1840-44 12.48 1.82 14.24 1.75 13.26 1.7845-49 19.82 2.88 20.46 2.51 20.10 2.6950-54 28.04 4.08 31.50 3.87 28.81 3.8655-59 37.02 5.38 38.77 4.76 36.77 4.9360-64 51.93 7.55 54.44 6.69 52.52 7.0465-69 64.98 9.45 72.20 8.87 67.67 9.0770-74 75.19 10.94 99.24 12.20 85.71 11.4875-79 66.24 9.63 110.51 13.58 87.32 11.7080-84 41.02 5.97 81.89 10.06 61.74 8.2785-89 20.00 2.91 45.94 5.65 33.39 4.4790-94 5.99 0.87 13.80 1.70 10.00 1.3495-99 0.78 0.11 2.31 0.28 1.55 0.21100+ 0.01 0.00 0.95 0.12 0.50 0.07
TOTAL 687.59 100.00 813.71 100.00 746.39 100.00Source: HMD.
3.2 Retrogression of health at young ages
Curiously enough, the 1980s show a loss rather than a gain in the contributions attributableto young and young-adult ages (Table 4), especially for men (Figure 7). This is a con-sequence of AIDS, drugs, and violent deaths (particularly traffic accidents), causes ofdeath that strongly affect young adults, as described in previous studies (Gomez-Redondo,1995; Vallin, Meslé, Caselli, 2001). We have to take into account that these are causes re-lated to individual behavior and, thus, are potentially avoidable. Deaths from these causeshave had a social, demographic, and economic impact beyond their numbers, as they havereduced the active/working and reproductive-age populations.
530 http://www.demographic-research.org

Demographic Research: Volume 13, Article 20
Tabl
e4:
Gai
nsin
Life
Exp
ecta
ncy
(e0)
inye
ars
(x10
0),S
pain
,for
the
30ye
ars,
byde
cade
,for
mal
es,f
emal
es,a
ndbo
thse
xes
com
bine
d.Va
lues
show
nar
eth
eco
ntrib
utio
nc xof
each
age
grou
pto
the
tota
lcha
nge
ine0
over
the
indi
cate
dtim
epe
riod.
1970
/1-1
980/
119
80/1
-199
0/1
1990
/1-2
000/
1
Men
Wom
enB
oth
Men
Wom
enB
oth
Men
Wom
enB
oth
012
1.08
105.
1011
3.97
35.0
125
.77
30.9
426
.57
21.8
424
.46
1-4
9.30
8.96
9.16
6.53
5.33
6.01
5.39
5.26
5.35
5-9
4.38
3.24
3.85
3.77
2.94
3.42
3.07
2.28
2.71
10-1
42.
512.
102.
312.
151.
451.
842.
821.
722.
3215
-19
2.39
1.95
2.14
−3.4
7−0
.59
−2.2
08.
593.
026.
0420
-24
2.54
4.13
3.41
−11.
97−1
.85
−7.5
218
.83
5.12
12.5
525
-29
5.86
5.71
5.68
−17.
79−2
.80
−11.
0422
.84
6.18
15.1
530
-34
6.04
5.66
5.75
−14.
03−0
.53
−7.9
115
.22
3.71
9.86
35-3
97.
558.
337.
85−6
.11
0.95
−2.9
05.
022.
483.
8540
-44
6.95
9.46
8.14
0.51
2.63
1.39
5.02
2.15
3.73
45-4
910
.75
11.9
211
.30
2.12
5.34
3.52
6.95
3.20
5.28
50-5
411
.70
16.4
313
.04
6.43
7.09
6.86
9.91
7.98
8.91
55-5
913
.39
18.8
414
.85
9.65
10.3
09.
9913
.98
9.63
11.9
360
-64
20.2
021
.84
21.7
214
.53
18.0
814
.66
17.2
014
.52
16.1
465
-69
28.6
034
.16
32.1
312
.48
20.5
614
.63
23.9
017
.48
20.9
170
-74
31.9
546
.32
39.1
617
.42
26.3
522
.18
25.8
226
.57
24.3
775
-79
27.3
047
.77
37.8
518
.86
30.6
725
.15
20.0
832
.07
24.3
280
-84
14.2
426
.10
20.5
412
.74
26.6
519
.43
14.0
429
.14
21.7
785
-89
5.70
13.2
09.
726.
6714
.88
10.7
67.
6317
.86
12.9
190
-94
2.18
4.85
3.57
0.67
1.83
1.27
3.14
7.12
5.16
95-9
90.
751.
110.
92−0
.63
−0.3
1−0
.47
0.66
1.51
1.10
100+
−0.1
70.
07−0
.05
−0.0
20.
080.
030.
200.
800.
52TO
TAL
335.
1939
7.25
367.
0195
.52
194.
8214
0.04
256.
8822
1.64
239.
34
http://www.demographic-research.org 531
Gomez-Redondo and Boe: Decomposition analysis of Spanish life expectancy at birth
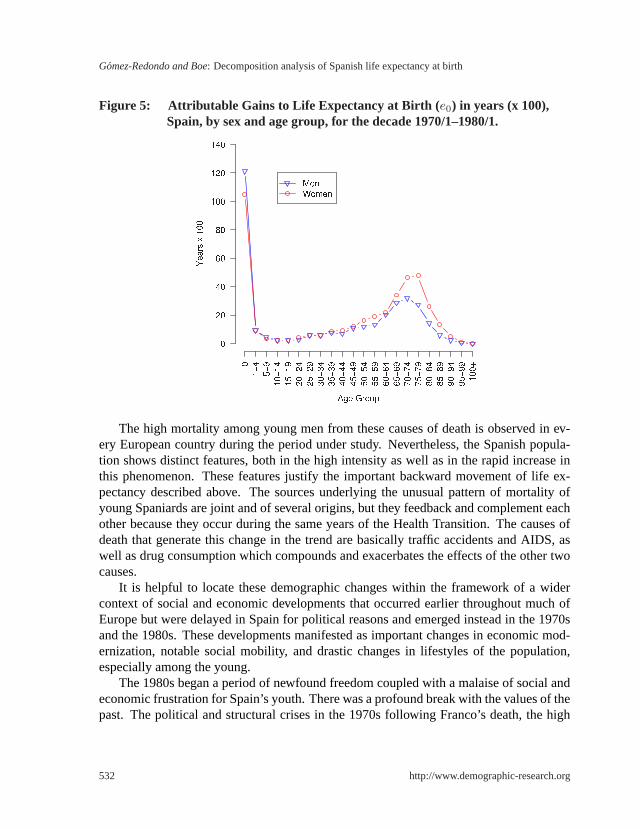
Figure 5: Attributable Gains to Life Expectancy at Birth ( e0) in years (x 100),Spain, by sex and age group, for the decade 1970/1–1980/1.
The high mortality among young men from these causes of death is observed in ev-ery European country during the period under study. Nevertheless, the Spanish popula-tion shows distinct features, both in the high intensity as well as in the rapid increase inthis phenomenon. These features justify the important backward movement of life ex-pectancy described above. The sources underlying the unusual pattern of mortality ofyoung Spaniards are joint and of several origins, but they feedback and complement eachother because they occur during the same years of the Health Transition. The causes ofdeath that generate this change in the trend are basically traffic accidents and AIDS, aswell as drug consumption which compounds and exacerbates the effects of the other twocauses.
It is helpful to locate these demographic changes within the framework of a widercontext of social and economic developments that occurred earlier throughout much ofEurope but were delayed in Spain for political reasons and emerged instead in the 1970sand the 1980s. These developments manifested as important changes in economic mod-ernization, notable social mobility, and drastic changes in lifestyles of the population,especially among the young.
The 1980s began a period of newfound freedom coupled with a malaise of social andeconomic frustration for Spain’s youth. There was a profound break with the values of thepast. The political and structural crises in the 1970s following Franco’s death, the high
532 http://www.demographic-research.org
Demographic Research: Volume 13, Article 20
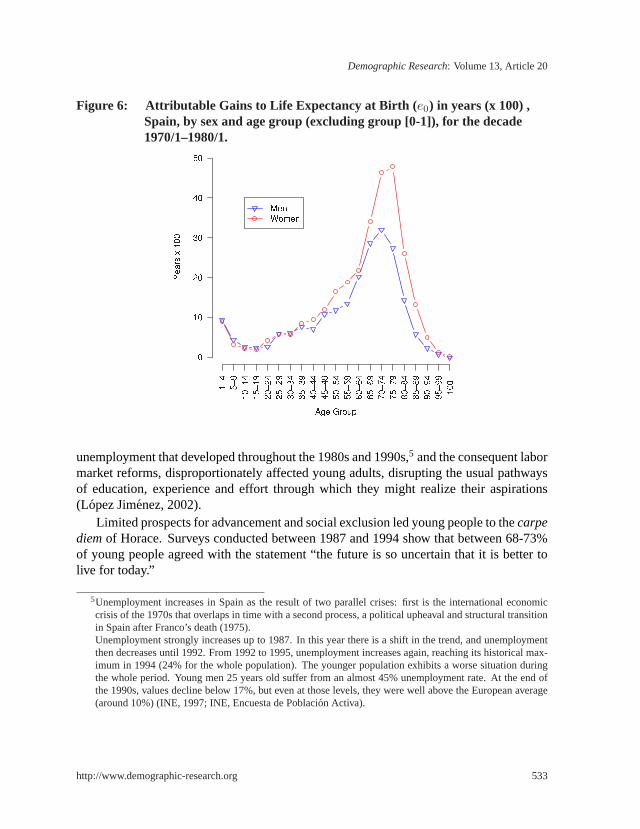
Figure 6: Attributable Gains to Life Expectancy at Birth ( e0) in years (x 100) ,Spain, by sex and age group (excluding group [0-1]), for the decade1970/1–1980/1.
unemployment that developed throughout the 1980s and 1990s,5 and the consequent labormarket reforms, disproportionately affected young adults, disrupting the usual pathwaysof education, experience and effort through which they might realize their aspirations(Lopez Jimenez, 2002).
Limited prospects for advancement and social exclusion led young people to thecarpediemof Horace. Surveys conducted between 1987 and 1994 show that between 68-73%of young people agreed with the statement “the future is so uncertain that it is better tolive for today.”
5Unemployment increases in Spain as the result of two parallel crises: first is the international economiccrisis of the 1970s that overlaps in time with a second process, a political upheaval and structural transitionin Spain after Franco’s death (1975).Unemployment strongly increases up to 1987. In this year there is a shift in the trend, and unemploymentthen decreases until 1992. From 1992 to 1995, unemployment increases again, reaching its historical max-imum in 1994 (24% for the whole population). The younger population exhibits a worse situation duringthe whole period. Young men 25 years old suffer from an almost 45% unemployment rate. At the end ofthe 1990s, values decline below 17%, but even at those levels, they were well above the European average(around 10%) (INE, 1997; INE, Encuesta de Poblacion Activa).
http://www.demographic-research.org 533

Gomez-Redondo and Boe: Decomposition analysis of Spanish life expectancy at birth
Figure 7: Attributable Gains to Life Expectancy at Birth ( e0) in years (x 100),Spain, by sex and age group, for the decade 1980/1–1990/1.
The focus on the present and the disillusion with the future have generated subgroupsof frustration and social isolation whose behavior involves alcohol and drug use:
. . . the social exclusion from the process of emancipation, occurring duringthe day, the night brings new company, mixing its rhythms, nostalgias, anddreams. . . The young people are the tireless pilgrims of the city night. Theyare generating a seething mass of liturgies which commemorate the vital pre-dominance of the group over the individual. . . . (Lopez Jimenez, 2002, pp.126-127)
Part of this ritual involves frequent movement from one bar-discotheque to the next, oftendriving a car across the city or between villages, at night, and often while intoxicated,with frequent automobile fatalities as a result.
Taking into account this background of social unrest, lack of opportunity, and the ad-vent of new personal freedom, we can understand how the co-evolution of two importantcauses of death among young people (traffic accidents and HIV/AIDS) generates a sur-prising retrogression during the 1980s and first part of 1990s, and a subsequent recoveryin the following decade. Although this study does not address the analysis of causes ofdeath, we will focus on these two important ones in these age groups.
534 http://www.demographic-research.org
Demographic Research: Volume 13, Article 20
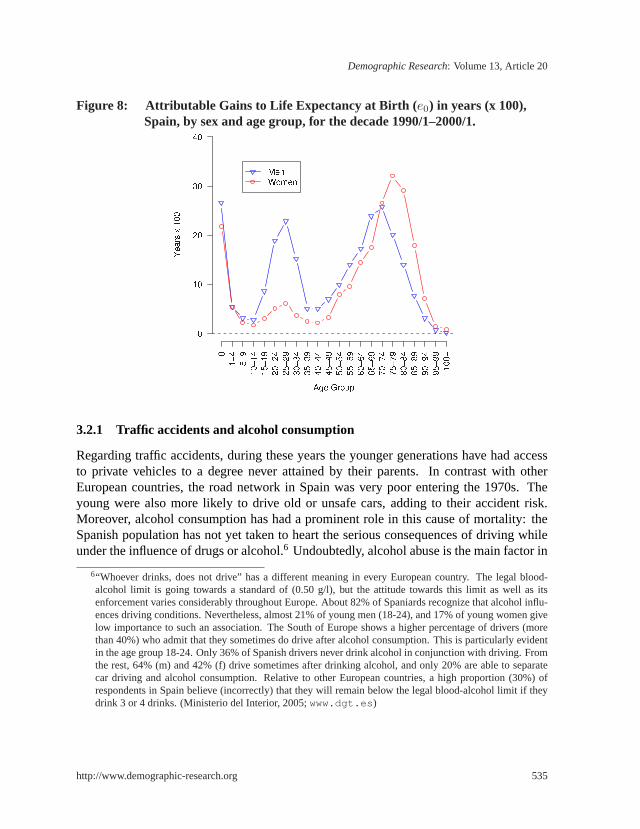
Figure 8: Attributable Gains to Life Expectancy at Birth ( e0) in years (x 100),Spain, by sex and age group, for the decade 1990/1–2000/1.
3.2.1 Traffic accidents and alcohol consumption
Regarding traffic accidents, during these years the younger generations have had accessto private vehicles to a degree never attained by their parents. In contrast with otherEuropean countries, the road network in Spain was very poor entering the 1970s. Theyoung were also more likely to drive old or unsafe cars, adding to their accident risk.Moreover, alcohol consumption has had a prominent role in this cause of mortality: theSpanish population has not yet taken to heart the serious consequences of driving whileunder the influence of drugs or alcohol.6 Undoubtedly, alcohol abuse is the main factor in
6“Whoever drinks, does not drive” has a different meaning in every European country. The legal blood-alcohol limit is going towards a standard of (0.50 g/l), but the attitude towards this limit as well as itsenforcement varies considerably throughout Europe. About 82% of Spaniards recognize that alcohol influ-ences driving conditions. Nevertheless, almost 21% of young men (18-24), and 17% of young women givelow importance to such an association. The South of Europe shows a higher percentage of drivers (morethan 40%) who admit that they sometimes do drive after alcohol consumption. This is particularly evidentin the age group 18-24. Only 36% of Spanish drivers never drink alcohol in conjunction with driving. Fromthe rest, 64% (m) and 42% (f) drive sometimes after drinking alcohol, and only 20% are able to separatecar driving and alcohol consumption. Relative to other European countries, a high proportion (30%) ofrespondents in Spain believe (incorrectly) that they will remain below the legal blood-alcohol limit if theydrink 3 or 4 drinks. (Ministerio del Interior, 2005;www.dgt.es )
http://www.demographic-research.org 535
Gomez-Redondo and Boe: Decomposition analysis of Spanish life expectancy at birth
traffic accidents classified as “human faults.” This kind of mortality is high from middle1970s and even relatively remains high, even now. The peak in the trend occurs betweenthe middle 1980s and 1991, with a decrease from that point to the present.
The dramatic increase of accidents in the 1980s was so serious a problem that theSpanish Senate appointed a special commission on road safety, resulting in aSocialAgreement on Road Safety, that was signed in 1994 by central and regional authorities.The number killed diminished by 28% in only two years. Spain was one of several coun-tries in Europe that experienced marked declines in traffic-related mortality in the mid-1990s, but Spain had by far the largest decrease in road accident fatality rate over the1991-1996 period (SARTRE2, 1998, p. 7).
Men aged 18-29 have the highest incidence of accidents and injuries per accidentand they present the highest profile of risk on a variety of behaviour measures relatedto automobile accidents (SARTRE2). During the last years, there has been a clearlydecreasing trend in these incidence rates, although the rates have not stabilised yet; thecurrent rates are similar to those prevailing in the mid-1990s. In the age group 15-29,the mortality rate from traffic fatalities is 35 per 100,000 in men, while it is 9 in women.It is still early to confirm the stabilization of this trend. In the last decade, the wholepopulation rate decreased from 22.7 to 14.3 per 100,000 in 4 years only. Only Portugal(18.4) presents higher rates than Spain now.
3.2.2 AIDS and drugs
HIV/AIDS is the second leading cause of death in young people, and it first appears inSpain, as in the rest of the western world, in 1981. Mortality due to this cause increasesup to the middle 1990s among Spanish youth. Initially, most AIDS deaths appear in theyoung ages. However, as the generation of infected but surviving individuals ages, the agedistribution of HIV/AIDS deaths shifts upward toward the young-adult group. In 1995-1997, HIV/AIDS mortality begins to decline with the advent of effective pharmacologicaltherapies and with better preventive measures which lower the disease incidence.
The impact (incidence) of AIDS in Spain has been higher than the rest of Europethroughout almost the entire period.7 AIDS cases at the beginning of the 1980s showedan increase until 1995. Since then the number of cases decreased to the point that in 2000,the values were about half of those existing just 5 years before (INE, Anuario Estadıstico,2004).
7With up to 188 per million affected inhabitants, Spain has very high incidence, exceeding other high inten-sity countries in Europe, such as France, Switzerland, Italy and Portugal. Portugal’s AIDS incidence ratehas recently overtaken that of Spain (INE, Inebase).
536 http://www.demographic-research.org
Demographic Research: Volume 13, Article 20
Drug use had a very prominent role in this cause of death. AIDS in Spain mainly istransmitted intravenously by the sharing of contaminated heroin needles, and this clearlyinfluences the evolution of this epidemic.
During the 1980s heroin use becomes epidemic. Before that time, drug consumptionin Spain was very low, and heroin became fashionable for certain societal groups as a wayto break with the cultural models of the past. Unfortunately, neither consumers nor theauthorities were able to understand and anticipate the consequences of this consumption.This context explains why during the 1980s the major transmission pathway of AIDSwas through intravenous drugs (Elzoet al., 1999). The social alarm generated by heroinaddiction drove the following young generations to focus their interests instead on to more“aseptic drugs” such as ecstasy, inhaled cocaine, amphetamines, or to legally accepteddrugs such as alcohol.
The standardized death rate by AIDS in 1995 was 14 per 100,000 inhabitants, butin men these values balloon up to 25 (WHO, 2004). In the following three years, ratesdecreased rapidly to the point that in 1998 the rate was 5 for the whole population andless than 10 for men. The steep rate of decrease has leveled off in more recent years.
The highest AIDS mortality rates are found predominantly in young adults males.Peak values occur in the group 30-34, followed by the adjacent age groups, 25-30 and35-40. In 1993, there were 76 deaths among males aged 30-34 representing around 34%of the total deaths in that age group. The rates in adjacent age groups totaled 44 (21% oftotal deaths). In those years HIV/AIDS was the leading cause of death for the population25-44 years old (Ministerio de Sanidad y Consumo, 1997).
The subsequent change in drug consumption habits (to other, non-intravenous, ones),the use of disposable needles, together with other preventive measures to fight the disease,have resulted in a decrease in AIDS-related mortality.8, 9
In summary, the superposition in time of the two important causes—traffic accidentsand AIDS—produced the rapid upswing in mortality and consequently a decade of im-
8The pattern of HIV/AIDS mortality among young Spanish men can be related also to Spain’s proximityto the North of Africa and to its role as a natural gateway for South American drug trafficking. Spainis therefore a choice route for distributing drugs to the rest of Europe. Complimenting this situation of areadily available supply of drugs is the socio-economic point of view: the process of development and mod-ernization creates a byproduct of transitional and marginal living areas, especially in poor urban outskirts,where drugs circulate easily among young people. These youth are often the children of immigrant fami-lies who moved to the cities in the 1950s and 1960s with great expectations, but whose lack of education,opportunity, or skills in the current economy have encouraged poverty and unemployment.
9The context described above and the cultural and socio-economic atmosphere in which Spanish youth findthemselves is consistent with the subjective life expectancy of these generations of young people, whichis much lower than that shown by statistics. They believe that they will not reach old age and they fearearly death from cancer, AIDS, traffic accidents, etc. This view encourages risky behavior and discountsthe perceived utility of prevention (Lopez Jimenez, 2002).
http://www.demographic-research.org 537

Gomez-Redondo and Boe: Decomposition analysis of Spanish life expectancy at birth
portant losses in years of life of young men. Finally, the subsequent and simultaneousdecline in these causes produced a positive contribution at young ages to the increment oflife expectancy in the Spanish population.
3.3 Expectation of life at old ages
The profiles of contributions in Figures 5-8 and Tables 3,4 show that the most importantcontributions to changes in life expectancy at birth (e0) come from the elderly. We nowexamine the contributions made to changes in life expectancy at older ages. The ageprofile of the components of change in remaining life expectancy of the elderly followproportionately the same age profile as the change components of life expectancy at birth,for all ages greater than age 65. The same decompositioncx from section 2.2 may thus beused for insight into which age groups most influence a time change ine65. Primarily, thecontributions to a change ine65 are concentrated at ages less than 90 years; gains after thatage contribute little, but matter for the growth and age structure of the elderly populationin general. For men, we find the highest gains in life expectancy at age 65 to come fromthe “younger old” group. For women, the peak in contributions occurs for both “youngold” and “old old” ages, occurs at higher ages than for men, and the level of gains exceedthose of men at ages 70 and above. In the most recent decade, contributions from ages90+ have an upward trend. The oldest-old is a faster growing segment of the population inmost developed countries than in Spain, and role of the age 90+ contributions will becomeincreasingly important with time. This tendency started in Spain at the end of the periodunder study.
The mortality rates prevailing in the older ages groups are the consequence of severalprocesses that combine age and cohort effects. The generations born at the beginningof the XXth century experienced conditions early in their life cycle very different fromthose characteristic of industrialized societies today. These generations lived amid fre-quent epidemics, wars, and economic crises, experiences which select out the strong tosurvive to old age. Now in their senior years, these cohorts, affected mostly by chronicand degenerative diseases further benefit from advances in medicine, public health, andwelfare state.
3.4 Sex differences
Differential mortality by sex translates into 6-7 years of higher life expectancy for womencompared to men (Vallin, 2002; Table 2). In the notation of section 2.2, the changebetween decades in the sex difference in life expectancy at birth may be computed as thedifference between the change components for women and the change components formen,∆fe0 − ∆me0. But, most importantly, the age patterns of attributed gains in life
538 http://www.demographic-research.org
Demographic Research: Volume 13, Article 20
expectancy begin to diverge between the sexes during the 1980s and 1990s (Figures 7,8).It is worthwhile to point out that although we do not measure directly the contribution ofbeing ‘male’ or being ‘female’ to changes in combined-sex life expectancy, we do havean indirect measure, since we can see the groups by sex and age that have contributedthe largest gains to life expectancy change, with each sex taken separately. Actually, thehighest contributions to the increment in life expectancy for the Spanish population are inold age groups from cohorts who experience the most dramatic differences between menand woman during their life cycles.
It is noteworthy that half or more of the contributions to the life expectancy time-differential comes from groups over 50 years old, and, for women is primarily concen-trated in ages above 70 (cf. Table 4). Thus when comparing the ‘male’ and ‘female’patterns of contribution, the pattern for women should be given more weight at the higherages than the pattern for men. Because sex differentials in mortality are large at the olderages, the larger proportion of those surviving to older ages are women, leading to a “fem-inization” of the adult and elderly population.
This observation is related to the idea that the concept of health and risk are socialconstructs. In particular, this applies to high-risk behavior, and is especially relevant inthe case of male groups from cohorts who experience important changes in their socialcontext.
An exception to the importance of contributions beyond age 50 and behavior as acause of sex differentials is that of the group below 1 year. Infant mortality continuesto decline for both sexes, which raises the overall life expectancy and hence magnifiesany absolute sex differences in that life expectancy over time. However, a large share ofinfant mortality is determined by biological differences between male and female infantsthat remain fixed over time.
As final consideration, we might considersexa biological characteristic, but usegen-der as a social manifestation. It is an organizing principle in every society and it varieswith time and in space.
Further work to study the gender differentials in mortality and their role in contribut-ing to life expectancy changes should employ longitudinal analysis. Interpretation ofpatterns in cross-sectional age groups, as done here, is a crude guide to understanding theforces at work in cohorts. In a longitudinal framework we can construct homogeneousgroupings of cohorts which share similar environmental, economic, and historical con-texts, allowing consideration of the impact of life styles and social roles in the analysis.
http://www.demographic-research.org 539
Gomez-Redondo and Boe: Decomposition analysis of Spanish life expectancy at birth
4. Present trends in the gains of life expectancy
During the period 1990-2001 the average life of Spaniards increased by more than 2 years,both in men and in women (Table 4). This figure encompasses important changes in theage groups and sex which contribute to this life expectancy increment (Figure 8).
The positive increase in life expectancy contributionscx at all age groups is speciallynoteworthy in the elderly, and, more specifically, between 70 and 90 years of age. Thishas been the situation up until recently, but there is a new small shift in the age profiletoward the 95 years group in the last decade.
An indirect observation derived from the analysis of the changes in the components ofthe life expectancy is that the limits for human longevity in Spain are further away everyday (Gomez-Redondo and Boe, 2004). Every available index, including those discussedbefore as well other measures of central tendency, rectangularization, and compression(inter-quartile range, standard deviation, median of distribution) points to an irreversibletrend from the 1970s on.
An important change in the trend is caused by the disappearance of the high mortalityof young men due to avoidable causes that was a signature phenomenon during the 1980s.
Absent this mortality, in the 1990s the recovered gains show up in young and young-adult men. In general terms, the years of life contributed by men at each age are importantand higher than those from women, with only one exception. This exception is for womenover 70 years old. These women still contribute 40% of the increment of the Spanishlife expectancy for women, increasing the number of the oldest old. Do men’s highercontributions mean that we are currently seeing the onset of a convergence in sex-specificlife expectancy trends? Or is it just a transient period limited to recovering the lossesof men during the 1980s? It is too early to answer this question, but the change is atleast inducing a movement toward stability, and a narrowing of the gap between men andwomen.
It is probably worthwhile to mention here that we are describing gains and not intensi-ties, as differential mortality by sex continues to benefit women. They continue recoveringfrom the century a lost biological advantage that, together with healthier behavior and dif-ferent life conditions, have also guaranteed a social advantage in front of death (Waldron,1983, Vallin, 2002).
There are indications for a possible new trend of convergence in gains by sex, that, upto now, was based on men adopting the survival strategies of women. It is neverthelessa possibility that in the future a different and regressive profile may arise since Spanishwomen have incorporated during the second half of the XXth Century the habits and lifestyles characteristic of men, and they have adopted these customs later than women inmost other European countries. These factors, which regulate differential mortality bygender, might emerge as undesirable outcomes in future women’s mortality.
540 http://www.demographic-research.org
Demographic Research: Volume 13, Article 20
Looking to the future, after the gains in life expectancy from the decline of diseasesof the circulatory system in the 1970s and 1980s, future increments will depend uponprogress against cancers in this population, except for the contingency of the appearanceof new diseases, as it happened with the AIDS pandemic. This is relevant in Spain fortwo reasons. First, the Spanish population has a lower incidence of diseases of Circu-latory System and Neoplasms than the European average. Second, according to severalauthors (Peto,et al., 1994; Pampel, 2002a,b; Lopez, 1983,1995), lung cancer and its evo-lution will be a decisive factor in life expectancy. Unfortunately the habits of the femalepopulation as depicted by Health and Drug Consumption Surveys suggest an undesirabletransition toward increased mortality in Spanish women (Gomez Redondo,et. al., 2002).These habits were introduced into the female population, after a time lag compared toother countries. Accordingly, this will delay their effects in Spain compared with thosecountries.
5. Conclusion
The Spanish population is characterized by high Life Expectancy and high Longevity.Spain reached this situation by undergoing important structural changes in its mortalityregime. Mortality at the beginning and at the end of the XXth century shows very differ-ent profiles. Even if we consider only the last 30 years of this period, when we examinethe age- and sex-specific gains to the average life lived, it is evident that there are presentdemographic processes of socio-demographic importance: aging at the top of the popu-lation age pyramid, owing to the gains at older ages, as well as the “feminization” of theelderly, as a consequence of the sex differential in the contributions to life expectancy.
Other important aspects to take into account are (a) the permanence of infant mortalityas a factor of prime importance in the gains to life expectancy, together with (b) theappearance or disappearance of unexpected or avoidable causes of death related to thebehavior of young adults, such as the epidemic of “anticipated” deaths during the 1980s.
Finally, over and above the continuous incremental gains in life expectancy, Spain hasmanaged to push longevity for the majority of its people up to the limits possible in thecurrent economic, social, and scientific context. Spain is currently in the last period of theHealth-Epidemiological Transition and the Spanish population’s mortality is character-ized by a slow but continous decline, together with a stabilization of the difference in thelife expectancy between men and women, as described above. The Spanish case supportsthe theory that, contrary to biological predeterminism, human longevity is malleable. Wealso share the view with Wilmoth (1997, 2000) that, even if there were an upper limit forhuman life, there are no indications that the limit is near.
http://www.demographic-research.org 541

Gomez-Redondo and Boe: Decomposition analysis of Spanish life expectancy at birth
6. Acknowledgments
We wish to thank John Wilmoth for helpful comments with an early draft.
542 http://www.demographic-research.org
Demographic Research: Volume 13, Article 20
References
Andreev, E.M..(1982). “Method Komponent v Analize Prodoljitelnosty Zjizni” (TheMethod of Components in the Analysis of Length of Life).Vestnik Statistiki9:42–47.
Andreev, E. M., V. Shokolnikov, And A.Z. Begun (2002) “Algorithm for Decompositionof Differences Between Aggregate Demographic Measures and Its Application toLife Expectancies, Gini Coefficients, Health Expectancies, Parity-Progression Ra-tios and Total Fertility Rates.”Demographic Research7: 499–522.www.demographic-research.org
Arriaga, E. (1982) “A note on the use of temporary life expectancies for analyzingchanges and differentials of mortality” Manila ed. Geneva: World Health Orga-nization.
Caldwell, J. C. (1990)Introductory thoughts in health transitions,in Caldwell, JohnC.; Findley, Sally; Caldwell, Pat; Santow, Gigi; Cosford, Wendy; Braid, Jennifer;Broers-Freeman, Daphne. (ed.), What we Know about health transition: the cul-tural, social and behavioural determinants of health, p.VI-XIII.- Canberra, HealthTransition Centre, Australian National University: vol 1 (2) : XIX + 1499
Canudas Romo, V. (2003) Decomposition Methods in Demography. Ph.D. dissertation.,Rijksuniversiteit Groningen.
Caselli, G. (1993) National Differences in the Health Transition in Europe, The Historyof Registration of Causes of Death Conference. Indiana Memorial Union IndianaUniversity, November, 11-14, 1993.
Caselli, G.; Egidi, V. (1981) Nouvelles tendences de la moralite en EuropeEtudes de-mographiques, 5, Conseil de l’Europe, Strasbourg
Elzo, J., Orizo, F.A; Gonzalez-Anleo, J, Blasco, P.G., Laespada, M.T, Salazar, L., (1999),Jovenes Espanoles,Fundacion Santa Marıa, S.M., Madrid
Frenk, J.; Bobadilla, J.L.; Stern, C,; Frejka, T.; Lozano, R. (1991) “Elements for aTheory of the Health Transition,”Health Transition Review,1 (1): 21–38.
Gomez Redondo, R. (1992) La mortalidad infantil espanola en el siglo XX, Centro deInvestigaciones Sociologicas – Ed. Siglo XXI, Madrid.
http://www.demographic-research.org 543

Gomez-Redondo and Boe: Decomposition analysis of Spanish life expectancy at birth
Gomez Redondo, R.(1995) “Vejez prolongada y juventud menguada. Tendencias en laevolucion de la esperanza de vida de la poblacion espanola, 1970–1990.”RevistaEspanola de Investigaciones Sociologicas,71:79–108
Gomez-Redondo,R.; Jimenez-Aboitiz, R.; Callejo, J.; Robles, E. (2002) “Ocupacion ySalud. Un analisis de la desigualdad social”,Sistema, 168-169 : 195-220
Gomez-Redondo, R.; Boe, C. (2004) “Tendencias de mortalidad en la poblacion espanola:Longevidad creciente, juventud recuperada y hacia la convergencia por sexo,” Fun-dacion Abril Martorell, p. 101-129
Horiuchi, S.; Wilmoth, J. R.; Pletcher , S. D. (2000)A General Method of DecompositionAnalysis.Manuscript.
Human Mortality Database. University of California, Berkeley (USA), and Max PlanckInstitute for Demographic Research (Germany). Available atwww.mortality.org
or www.humanmortality.de (data downloaded June, 2004)
Instituto Nacional de Estadıstica, Inebase:www.ine.es/Inebase/index.html
Instituto Nacional de Estadıstica (2001) Proyecciones de la poblacion de Espana cal-culadas a partir del Censo de Poblacion de 1991. Evaluacion y revision. TotalNacional 1990-2050. Comunidades Autonomas y provincias, 1990-2005
Instituto Nacional de Estadıstica (2001, 2003) Anuario Estadıstico 2001, 2003 (edi-ciones CD-Rom), Madrid
Instituto Nacional de Estadıstica (2001) Indicadores Sociales de Espana, Madrid.
Instituto Nacional de Estadıstica, (various years) Defunciones segun la causa de muerte,Movimiento Natural de la Poblacion. Resultados Nacionales. Madrid
Instituto Nacional de Estadıstica (various years) Tablas de Mortalidad de la PoblacionEspanola, Madrid.
Keyfitz, N. 1977.Applied Mathematical DemographyNew York: Wiley.
Kitagawa, E.M. (1955) “Components of a difference between two rates”,Journal of TheAmerican Statistical Associationvol. 50, 272:1168-1194.
Lerner, M. (1973) “Modernization and health: a model of the health transition”, AnnualMeeting, American Public Health Association, San Francisco.
544 http://www.demographic-research.org

Demographic Research: Volume 13, Article 20
Lopez, A.D. (1983) “The sex mortality differential in developed countries” In Lopezand Ruzicka (eds.), Sex Differentials in Mortality:Trends, Determinants and Con-sequences. Canberra: Australian National University.
Lopez, A. D. (1995) “The lung cancer epidemic in developed countries: From Descrip-tion to Explanation.” In Lopez, A.; Caselli, G. and Valkonen, T. Adult Mortality inDeveloped Countries, Oxford: Clarendon Press.
Lopez Jimenez, A. (2002) “Youth in the 1990s and Youth in the 1960s in Spain: Intergen-erational dialogue and struggle” in Edmunds and B.S. Turner (eds.), GenerationalConsciousness, narrative, and politics, Rowman and Littlefield, Maryland.
Mesle F.; Hertrich, V. (1997) “Evolution de la mortalite en Europe : la divergences’accentue entre l’Est et l’Ouest,” in :International Population Conference, Beijing1997. p. 479-508. Liege, IUSSP.
Meslé, F., Vallin,J. (2002) “La transition sanitaire: tendances et perspectives”, in Caselli,G., Vallin, J. and Wunsch, G.,Demographie: Analyse et synthese. Les Determinantsde la Mortalite. Vol. III, Ch. 57, Institut d’Etudes Demographiques, Paris
Nadal, J. (1976) La Poblacion Espanola (siglos XVI a XX), Barcelona, Ed. Ariel
Olshansky, S. J.; Ault, A. B. (1986) “The fourth stage of the Epidemiological Transition:the age of delayed degenerative diseases,”The Milbank Quarterly, vol. 64, 3: 355-391
Pampel, F. C. (2002a) “Cigarette Use and the Narrowing Sex Differential in Mortality,”Population and Development Review, vol. 28, 1: 77-104.
Pampel, F. C. (2002b) “Inequality, Diffusion, and the Status Gradient in Smoking,”So-cial Problems, vol. 49, 1: 35-57.
Peto , R.; Lopez,A.D.; Boreham, J.; Thun, M.; and Heath, C. Jr. (1994) Mortality fromSmoking in Developed Countries 1950-2000: Indirect Estimates from National Vi-tal Statistics. Oxford University Press.
Pollard, J. H. (1982) “The Expectation of Life and its Relationship to Mortality,”Journalof the Institute of Actuaries109, 225-240.
Pollard, J. H. 1988. On the decomposition of changes in expectation of life and differ-entials in life expectancy.Demography25, no. 2:265-276.
http://www.demographic-research.org 545
Gomez-Redondo and Boe: Decomposition analysis of Spanish life expectancy at birth
SARTRE2 (1998)Part 1: Report on Principal Results. The attitude and behaviour ofEuropean car drivers to road safetySocial Attitudes to Road Traffic Risk in Europe(SARTRE).sartre.inrets.fr/documents-pdf/repS2V1E.pdf
Vallin, J.; Meslé, F.; Valkonen, T. (2001) Tendances en matiere de mortalite et mortalitediff erentielle, Etudes demographiques, 36, Council of Europe, Editions du Conseilde l’Europe, Strasbourg
Vallin,J. (2002) “Mortalite, Sexe et Genre,” in Caselli, G., Vallin, J. and Wunsch, G.,Demographie: Analyse et synthese. Les Determinants de la Mortalite. Vol. III, Ch.53, Institut d’Etudes Demographiques, Paris
Vaupel, J.W.; Canudas-Romo, V. (2003) Decomposing change in life expectancy: abouquet of formulas in honour of Nathan Keyfitz’s 90th birthday.Demography40,no. 2:201-216.
Waldron, I. (1983) “Sex differences in Human Mortality: The role of genetic factors,”Social Science and Medicine,vol 17, 6:321-333
Wilmoth, J. (1997) “In search of limits” in Wachter, K.; Finch, C.E. (eds.),Between Zeusand the Salmon: The Biodemography of Longevity,National Research Council,National Academy Press, Washington, D.C, 1997
Wilmoth, J.; Deegan, L.; Lundstrom, H.; Horiuchi, S. (2000) “Increase of MaximumLife-Span in Sweden, 1861-1999,”Science, vol. 289, pp. 2266-2368.
World Health Organization, Regional Office for Europe (2004). Burden of disease,Highlights on health, Spain, 2004.www.euro.who.int/eprise/main/WHO/Progs/ CHHSPA/burden/
20050308 8
546 http://www.demographic-research.org