declaration - university of nairobichss.uonbi.ac.ke/sites/default/files/chss/final project...
TRANSCRIPT

THE RELATIONSHIP BETWEEN CORPORATE BOARD
STRUCTURE AND FINANCIAL PERFORMANCE OF COMPANIES
LISTED AT NAIROBI SECURITIES EXCHANGE
JARED ONGOSO
A RESEARCH PROJECT SUBMITTED IN PARTIAL FULFILLMENT OF THE
REQUIREMENT FOR THE AWARD OF THE DEGREE OF MASTER OF
SCIENCE IN FINANCE, SCHOOL OF BUSINESS, UNIVERSITY OF NAIROBI
SEPTEMBER, 2014

DECLARATION
This research project is my original work and has not been presented for any degree
award in any University.
Signature:…………………………………..Date:……………………….……
JARED ONGOSO
D63/79286/2012
This research project has been submitted for examination with my approval as University
supervisor.
Signature:……………………………….Date: ……………..…….……….
Mr. Cyrus Mwangi Iraya
Lecturer, Department of Finance and Accounting
School of Business, University of Nairobi
ii

DEDICATION
This project work is dedicated to my family for their encouragement and support and for
bearing with me during the many months that I was absent from home.
iii

ACKNOWLEDGEMENTS
My appreciation goes to the Almighty God for granting me courage, good health and
inspiration that was essential for this demanding study. Special thanks go to my
supervisor, Mr. Cyrus Mwangi Iraya, who despite his busy schedule was always readily
available to advice and guide me professionally throughout the study. I would also like to
acknowledge the guidance and advice from Mr. Herick Ondigo, The chairman,
department of Finance and Accounting and all the lecturers at the University of Nairobi.
iv

ABSTRACT
Boards of directors have been largely criticized for the decline in shareholders’ wealth and corporate failure. Thus, corporate governance affects firms’ financial performance as companies with better corporate governance guarantee the payback to the shareholder and limit the risk of the investment. This study examined the relationship between corporate board structure and the financial performance of companies listed at the NSE. It investigated the composition of boards of directors in the listed firms and analyses whether board structure has an impact on financial performance, as measured by return on assets (ROA). The study took a causal research design approach and focused on the firms listed between 2009 and 2013. The study used secondary source data collected from the firm’s financial reports filed at the NSE and CMA library. It specifically looked at four board characteristics (board independence, board size, gender of the board of directors and number of board committees) which were set as the independent variables. The Ordinary Least Squares (OLS) regression was used to estimate the relationship between corporate performance measures and the independent variables. Findings from the study show that there is strong positive association between board size and corporate financial performance. Evidence also exists that there is a positive association between board independence and corporate financial performance. Good positive association was observed between number of the board committee and gender of the board members, and firm financial performance. The study suggests that large board size should be encouraged and the composition of outside directors as members of the board should be sustained and improved upon to enhance corporate financial performance.
v
TABLE OF CONTENTS
DECLARATION...............................................................................................................iiDEDICATION..................................................................................................................iiiACKNOWLEDGEMENTS.............................................................................................ivABSTRACT........................................................................................................................vLIST OF TABLES..........................................................................................................viiiLIST OF ABREVIATIONS.............................................................................................ixCHAPTER ONE................................................................................................................1INTRODUCTION..............................................................................................................1
1.1 Background of the Study...........................................................................................11.1.1 Corporate Board Structure..................................................................................21.1.2 Financial Performance........................................................................................31.1.3 Effect of Board Structure on Financial Performance..........................................61.1.4 Nairobi Securities Exchange...............................................................................9
1.2 Research Problem....................................................................................................111.3 Objectives of the Study............................................................................................141.4 Value of the Study...................................................................................................14
CHAPTER TWO.............................................................................................................16LITERATURE REVIEW...............................................................................................16
2.1 Introduction..............................................................................................................162.2 Theoretical Review..................................................................................................16
2.2.1 Agency Theory..................................................................................................162.2.2 Stewardship Theory..........................................................................................182.2.3 Restitution Theory............................................................................................202.2.4 The Control Theory...........................................................................................21
2.3 Determinants of Financial Performance..................................................................232.4 Empirical Literature.................................................................................................252.5 Summary of the Literature Review..........................................................................29
CHAPTER THREE.........................................................................................................31RESEARCH METHODOLOGY...................................................................................31
3.1 Introduction..............................................................................................................31
vi
3.2 Research Design.......................................................................................................313.3 Population of the Study............................................................................................313.4 Data Collection Techniques.....................................................................................323.5 Data Analysis Techniques........................................................................................32
3.5.1 Analytical Model..............................................................................................323.5.2 Diagnostic Test.................................................................................................33
4.1 Introduction..............................................................................................................344.2 Descriptive Statistics................................................................................................344.3 Diagnostic Tests for Regression Assumptions........................................................354.4 Pearson’s Correlation Coefficient Analysis for Corporate Board Structure and Firms’ Financial Performance........................................................................................374.5 Regression Analysis.................................................................................................38
4.5.1 Regression Model Summary.............................................................................39CHAPTER FIVE.............................................................................................................43SUMMARY, CONCLUSION AND RECOMMENDATIONS....................................43
5.1 Introduction..............................................................................................................435.2 Summary..................................................................................................................435.3 Conclusion...............................................................................................................465.4 Policy Recommendations.........................................................................................475.5 Limitations of the Study...........................................................................................485.6 Suggestions for Further Research............................................................................50
REFERENCES.................................................................................................................53APPENDICES.....................................................................................................................i
Appendix i: Companies listed on the NSE as at 31st December 2013..............................iAppendix ii: Raw Data.....................................................................................................v
vii
LIST OF TABLES
Table 4.1: Descriptive Statistics Results...........................................................................32
Table 4.2: Diagnostic Tests...............................................................................................34
Table 4.3: Correlation Analysis Results............................................................................35
Table 4.4: Regression Coefficients of the Corporate Board Structure Variables and Firm’s
Financial Performance Indicators......................................................................................36
Table 4.5: Regression Model Summary of Corporate Board Structure Variables and
Financial Performance Indicators......................................................................................38
Table 4.6: Regression Results............................................................................................38
Table 4.7: Analysis of Variance (ANOVA)......................................................................39
viii

LIST OF ABREVIATIONS
CBK -Central Bank of Kenya
CDSC -Central Depository and Settlement Corporation
CEO -Chief Executive Officer
CMA -Capital Markets Authority
DPS -Dividends Per Share
EPS -Earnings Per Share
GoK -Government of Kenya
IFC -International Finance Corporation
IPO -Initial Public Offer
NEDs -Non Executive Directors
NSE -Nairobi Securities Exchange
ROA -Return OnAssets
ROAM -Return On Assets Managed
ROCE -Return On Capital Employed
ROE -Return On Equity
ROS -Return On Sales
TMT -Top Management Teams
USA -United States of America
ix
CHAPTER ONE
INTRODUCTION
1.1 Background of the Study
The corporate board is made up of three important characters namely the CEO, the inside
directors who are in most cases senior managers of the firm, and outside directors, and all
these have the knowledge of what a good and a bad project is. The main responsibility of
the board is to offer vision and direction for any corporate entity. Indeed, the board is
about the one most important constituency of a corporate entity. Every corporate board
has at least one outside director. All outside director’s benefit from enhanced
performance of the firm. The fundamental question that has escaped the needed attention
is what determines a corporate board structure and its composition. The structure, role
and impact of Board on Firm performance has been studied by scholars from different
disciplines such as law, economics, finance, sociology, and organizational theory (Kiel,
2010) resulting to a number of contrasting theories and greater the difficulty of co-
ordination and this adversely affects a firm’s performance.
The board of directors is charged with oversight of management on behalf of
shareholders. Agency theorists argue that in order to protect the interests of shareholders,
the board of directors must assume an effective oversight function. It is assumed that
board performance of its monitoring duties is influenced by the effectiveness of the board
structure. Firms are regarded as consisting of cognitive, normative and regulative
structures and activities that give meaning to social behaviour (Ayogo, 2005). Societal
norms have been seen to influence Board decisions regarding CEO selection and
1

executive compensation (Klein, 2008) and how Boards explain the adoption of CEO
incentive plans to shareholders. Institutional theory argues that Board composition will be
determined largely by the prevailing institutionalized norms in the organizational field
and society.
1.1.1 Corporate Board Structure
According to Mayer (2007), corporate governance is concerned with ways of bringing the
interests of (investors and managers) into line and ensuring that firms are run for the
benefit of investors. Corporate governance is therefore, concerned with the relationship
between the internal governance mechanisms of companies and society’s conception of
the scope of corporate accountability (Deakin and Hughes, 2007). It has also been
defined by Keasey, Thompson and Wright (1997) to include ‘the structures, processes,
cultures and systems that engender the successful operation of organizations. Corporate
governance is also seen as the whole set of measures taken within the social entity that is
an enterprise to favour the economic agents to take part in the productive process, in
order to generate some organizational surplus, and to set up a fair distribution between
the partners, taking into consideration what they have brought to the organization (Maati,
2009).
In a dynamic environment, however, boards become very important for smooth
functioning of organizations. Boards are expected to perform different functions, for
example, monitoring of management to mitigate agency costs Eisenhardt (2009), Shleifer
& Vishny (2007), Roberts McNulty & Stiles (2005). The board is also the initiator of
measures to steer the organization from a foreseeable bad times ahead. A study by
2
Mangenelli& Klein (1994), Jack & Keller (2002) found out that the board in response to
the external pressures, resort to different strategic responses such as restructuring,
downsizing, business process reengineering, benchmarking, total quality management,
management by objectives and other interventions mechanisms; to improve and sustain
their competitive positions in the industry.
The core reason for undertaking this study is because internationally there is a growing
recognition of the importance of boards for the success of a firm. Several countries have
issued guidelines and recommendations for best governance practices and board
composition Cadbury, (2002), OECD Principles (2009), ICGN Principles (2009), Preda
Code (2002), Higgs Report, (2003), Combined Code (2003). However, whether firms
following the best practice recommendations regarding board structure will indeed
perform better is a question to be examined empirically in the Kenyan context. Indeed
these failures are a manifestation of a number of structural reasons why corporate
governance has become more important for economic development and more
importantly, for policy issues in many countries (Rashid, De Zoysa, Lodh, and Rudkin,
2010).
1.1.2 Financial Performance
Finance is always being disregarded in financial decision making since it involves
investment and financing in short-term period. Further, it also acts as a restrain in
financial performance, since it does not contribute to return on equity (Rafuse, 2006). A
well designed and implemented financial management is expected to contribute
positively to the creation of a firm’s value (Padachi, 2006). The dilemma in financial
3
management is to achieve the desired trade-off between liquidity, solvency and
profitability (Lazaridis, 2006).The subject of corporate financial performance has
received significant attention from scholars in the various areas of business and strategic
management. It has also been the primary concern of business practitioners in all types of
organizations since financial performance has implications to organization’s health and
ultimately its long term survival. High performance reflects management effectiveness
and efficiency in making use of company’s resources and this in turn contributes to the
country’s economy at large (Naser and Mokhtar, 2011).
There have been various measures of financial performance. For example return on sales
reveals how much a company earns in relation to its sales, return on assets determines an
organization’s efficiency in ability to make use of its assets and return on equity reveals
the return investors expect to earn for their investments. The advantages of financial
measures are the simplicity of calculation and also that their definitions are agreed
worldwide. Traditionally, the success of a company has been evaluated by the use of
financial measures (Tangen, 2012).
Liquidity measures the ability of the business to meet financial obligations as they fall
due, without disrupting the normal, ongoing operations of the business. Liquidity can be
analyzed both structurally and operationally. Structural liquidity refers to balance sheet
measures of the relationships between assets and liabilities and operational liquidity
refers to cash flow measures. Solvency measures the amount of borrowed capital used by
the business relative to the amount of owner’s equity capital invested in the business. In
4

other words, solvency measures provide an indication of the business’ ability to repay all
indebtedness if all its assets were sold. Solvency measures also provide an indication of
the business’ ability to withstand risks by providing information about the operation’s
ability to continue operating after a major financial adversity (Harrington and Wilson,
2009).
Profitability measures the extent to which a business generates a profit from the factors of
production: labor, management and capital. Profitability analysis focuses on the
relationship between revenues and expenses and also on the level of profits relative to the
size of investment in the business. Four useful measures of profitability are the rate of
return on assets (ROA), the rate of return on equity (ROE), operating profit margin and
net income (Hansen, Holthausen and Mowen, 2005). Repayment capacity measures the
ability to repay debt from both operating and non-operating income. It evaluates the
capacity of the business to service additional debt or to invest in additional capital after
meeting all other cash commitments. Measures of repayment capacity are developed
around an accrual net income figure. The short-term ability to generate a positive cash
flow margin does not guarantee long-term survival ability (Jelic and Briston, 2011).
Financial efficiency measures the degree of efficiency in using labor, management and
capital. Efficiency analysis deals with the relationships between inputs and outputs.
Because inputs can be measured in both physical and financial terms, a large number of
efficiency measures in addition to financial measures are usually possible (Tangen,
2012).
5

1.1.3 Effect of Board Structure on Financial Performance
There is mixed evidence in the empirical literature linking board structure to corporate
performance. Large boards could provide the diversity that would help companies to
secure critical resources and reduce environmental uncertainties (Pfeffer, 2007). But, as
Yermack (2006) said, coordination, communication and decision-making problems
increasingly impede company performance when the number of directors increases.
Thus, as an extra member is included in the board, a potential trade-off exists between
diversity and coordination. Jensen (2003) appears to support Lipton and Lorsch (2002)
who recommend a number of board members between seven and eight. However, board
structure recommendations tend to be industry-specific, since Adams and Mehran (2003)
indicate that bank holding companies have board structure significantly larger than those
of manufacturing firms.
Researchers have investigated the usefulness of a board of directors as a monitoring
devise as they communicate the shareholders’ objectives and interests to managers. They
posit that external board membership ensures proper management supervision and limit
managerial opportunism (Munter and Kren, 2005). Empirical research has found that
increased outsiders on the board are likely to promote decisions that are in the interests of
external shareholders (Brickley et al., 2007). This view has however been challenged by
managerial hegemony theory, which views boards as passive instruments who hold
allegiance to the managers who select them, lack knowledge about the firm and depend
on top executives for information (Coles et al., 2001).
6
Bathala and Rao (2005) and Hutchinson (2002) found a negative relationship between the
proportion of outside directors and the firm’s growth rate. In contrast, Hossain et al.
(2000) found that the percentage of outside directors is positively related to firms’
investment opportunities. Anderson et al. (2003) found that growth firms incurred higher
monitoring costs (in terms of directors and auditors fees) than non-growth firms.
Board composition refers to the number of independent non-executive directors on the
board relative to the total number of directors. An independent non-executive director is
defined as an independent director who has no affiliation with the firm except for their
directorship (Clifford and Evans, 1997). There is an apparent presumption that boards
with significant outside directors will make different and perhaps better decisions than
boards dominated by insiders. A number of studies, from around the world, indicate that
non-executive directors have been effective in monitoring managers and protecting the
interests of shareholders, resulting in a positive impact on performance, stock returns,
credit ratings, auditing, etc. A study by O’ Sullivan (2000) examines a sample of 402 UK
quoted companies and suggests that non-executive directors encourage more intensive
audits as a complement to their own monitoring role while the reduction in agency costs
is expected. However, there is also a fair amount of studies that tend not to support this
positive perspective. Some of them report a negative and statistically significant
relationship with Tobin’s Q (e.g. Agrawal and Knoeber, 1996; Yermack, 1996) while
others find no significant relationship between accounting performance measures and the
proportion of non-executive directors (e.g. Vafeas and Theodorou, 1998; Weir, Laing and
mcKnight, 2002; Haniffa and Hudaib, 2006).
7

Furthermore, based on a large survey of firms with non-executive directors in the
Netherlands, Hooghiemstra and van Manen (2004) conclude that stakeholders are not
generally satisfied with the way non-executives operate.
The effect of managerial or board ownership on board structure is generally explained by
the “incentive alignment argument” Board ownership reduces manager–shareholder
conflicts in stock ownership by board members (both executive and non-executive). To
the extent that executive board members own part of the firm, they develop shareholder-
like interests and are less likely to engage in behavior that is detrimental to shareholders.
Therefore, managerial ownership is inversely related to agency conflicts between
managers and shareholders. In contrast to this notion, Demsetz and Lehn (1985) find no
link between ownership structure and firm performance, and assert that there is little
support for the divergence of interests between managers and shareholders. In empirical
contrast to the Demsetz and Lehn (1985) findings, and in line with the beneficial effects
of ownership, Morck, Shleifer and Vishny (1988) find that firm performance first rises as
ownership increases up to 5%, then falls as ownership increases up to 25% and then rises
slightly at higher ownership levels. They support the theory that managers tend to
allocate the firm’s resources in their own best interests, which may conflict with those of
shareholders.
A review of the empirical evidence on the impact of board size on performance shows
mixed results. Dehaeneet al. (2001) find that board size is positively related to company
performance. However, the results of Haniffaet al.(2006) are inconclusive.
8
Using a market return measure of performance, their results suggest that a large board is
seen as less effective in monitoring performance, but when accounting returns are used,
large boards seem to provide the firms with the diversity in contacts, experience and
expertise needed to enhance performance.Yermack the (1996) finds an inverse
relationship between board size and firm value; in addition, financial ratios related to
profitability and operating efficiency also appear to decline as board size grows.
Connelly and Limpaphayom (2004) argued that board size does not have any relation
with firm performance.
Healy (2003) studying firms in developing world identified a number of prominent
disadvantages, among them included; Lack of commitment by directors to creation of
shareholder wealth, Remuneration mainly linked to size of the company rather than its
performance, Lack of adequate institutional shareholder activism, High proportion of
dividend payments rather than reinvestment in research and development.
1.1.4 Nairobi Securities Exchange
NSE was formed in 1954 as a voluntary organization of brokers and today it is one of the
most active markets in Africa. It has played a very vital role in championing the increase
in investor confidence by modernizing its infrastructure. It has led to promotion and
enhancement of culture of thrift and saving by providing alternatives avenues for
investment and assists in the transfer of these savings to investment in productive
enterprises and quoted stocks.
9
The Kenyan government realized the need to design and implement policy reforms to
foster sustainable economic development with an efficient and stable financial system in
the 1980s.It set out to enhance the role of the private sector in the economy, reduce the
demand for public enterprise on the exchequer, rationalize operations of the public
enterprise sector to broaden the base of ownership and enhance capital market in the
formation of a regulatory body “the capital market authority” in 1989, to assist in the
creation of an environment conclusive to the growth and development of country’s
capital markets (Statistical Abstract, 2000).
The NSE is poised to play an increasing role in the Kenyan economy and that is why the
Government of Kenya (GOK), the Capital Market Authority (CMA) and the Central
Bank of Kenya (CBK) have over the years played a principal role in developing and
strengthening the NSE to enable it take up the various roles and functions. Measures
taken include enactment of legislation, rules, policies and guidelines, adjustment in
macroeconomic variables such as taxation rates, interest rates, exchange rates and
working towards managing inflation in the economy, setting up institutions such as
Central Depository and Settlement Corporation (CDSC) and Investor Compensation
Fund (ICF).
In 2006 the NSE initiated the automated trading systems which have resulted in high
trading volumes. The implementation of automated trading system provided for longer
trading hours, increased trading efficiency and price discovery (Economic Survey, 2007).
The growth of NSE in the past five years has been attributed to positive growth rate
10

registered by the Kenyan economy and the changing international perception of Kenya as
a secure investment destination. The effect of post-election violence of the 2008 election
outcome that led to slower economic growth and reduced investment has not hampered
the growth of NSE. In the beginning of 2010, the NSE introduced the NSE All–share
index which is complementary to NSE 20 share index in an effort to provide investors
with a comprehensive measure of the performance of the stock market. Nairobi Securities
Exchange is one of the leading developing markets in the world and investing in stocks
has been hyped so much that the mention of the initial public offer ( IPO) reflexively
elicits expectation of more money.
The regulatory and CG framework influences the way boards function and how effective
the board engage with the company shareholders. The regulatory framework for
companies at the NSE is centred on the company’s act, capital markets authority act and
securities exchange regulations. The companies act is the principal legislation regulating
companies and it includes the framework surrounding the formation and duties of
directors. The listing rules deal with the requirements for listing and quotation, market
information, trading and supervisory matters. These rules apply to all companies listed at
the securities exchanges. The Codes of Corporate Governance (CCG) compliments the
statutory law requirements and it gives guidelines on reporting and encourages a “comply
or explain” type of reporting.
1.2 Research Problem
According to Klapper and Love (2003), corporate governance affects the financial
performance of the firm. Brown and Caylor (2004) provide insights to relationships
11
between corporate structure and corporate performance. Research indicates that
companies with better corporate governance guarantee the payback to the shareholder
and limit the risk of the investment. The association between quality of corporate
governance and firms' profitability is a main focus in corporate governance studies, but
one cannot predict much on the direction due to contrasting views on the results. Jensen
and Meckling (1976) have proven that better-governed firms might have more efficient
operations, resulting in a higher expected future cash-flow stream. Klapper and Love
(2003) used return on assets as measure for performance found evidence that firms with
better governance have higher operating performance. A well-functioning corporate
board is an indication of the overall effectiveness of corporate governance system.
Boards of directors have been largely criticized for the decline in shareholders’ wealth
and corporate failure (Uadiale, 2010). According to Uadiale, they have been in the
spotlight for the fraud cases that had resulted in the failure of major corporations, such as
Enron, WorldCom and Global Crossing. In Nigeria, a series of widely-publicized cases of
accounting improprieties have been recorded (Wema Bank, NAMPAK, Finbank and
Spring Bank) (Uadiale, 2010).The placement of Uchumi under receivership in 2006 and
eventual delisting from the NSE is just but an example in Kenya. The responsibility for
collapse of Uchumi then was placed right under the board of directors who were accused
of ignoring governance structures and engaging in malpractices. When a new board of
directors was appointed to the board of Uchumi the company has witnessed improved
financial performance and has been listed again at the NSE.
12
This emphasizes the important role board structure plays in company financial
performance and hence my interest in the effect of board structure on financial
performance of companies listed in the NSE (Ongore and K’Obonyo, 2011).
There are some studies that have been conducted in Kenya on stock market focusing on
various aspects of corporate governance of listed companies. For instance, Mwangi
(2007), looked at corporate governance in developing countries, Gitobu (2000), studied
the relationship between corporate governance and firm’s performance, Munene (2007),
did a study of the relationship between board structure and firms performance, a case
study of the NSE while Munga (2012), examined the impact of board diversity on
Nairobi Security Exchange and Kenya’s manufacturing firms among others.
Majority of the studies have examined the composite stock indices in relation to board
structure of companies listed at the Nairobi Securities Exchange and examined whether
companies incorporate available information, but did not determine what tasks the
companies respond to in relation to board structure and to how important these tasks are
to the financial performance of firms listed in Nairobi Securities Exchange and also did
not establish the direction and magnitude of the interaction between board structure tasks
and firms financial performance at the Nairobi Securities Exchange. In spite of all these
alternative studies that have been carried out, a gap in the literature relating examining
the effect of board structure on financial performance of firms listed in Nairobi Securities
Exchange exist because there are still no conclusive results that have been arrived at.
13

Therefore, this study sought to fill this gap by critically evaluating the effect of board
structure and firms’ financial performance of companies listed at the Nairobi Securities
Exchange and determining what tasks in relation to board structure the companies
respond to and how important these tasks are to the financial performance of firms listed
at Nairobi Securities exchange by answering the following research question: What is the
relationship between corporate board structure and financial performance of companies
listed at Nairobi Securities Exchange?
1.3 Objectives of the Study
The general objective of the study was to establish the relationship between corporate
board structure and financial performance of companies listed in Nairobi Securities
Exchange. The specific objectives were
a) To establish the relationship between the board size and corporate financial
performance.
b) To determine the relationship between gender and corporate financial
performance.
c) To establish the effect of the number of board committees on corporate financial
performance.
d) To establish the relationship between board independence and corporate financial
performance.
1.4 Value of the Study
This study sought to provide an understanding of the linkage between board structure and
financial performance in Nairobi Securities Exchange listed companies which is
paramount to the need to have a robust team of decision makers with a broad range of
14

perspectives and abilities, crucial to their financial success and in building trust among
companies’ stakeholders.
To policymakers, the findings of the study provides a basis upon which relevant decision
and policymakers in the listed companies may re-evaluate and adjust their board
membership to meet the fundamentals of firm management for improved financial
performance, sustainability and longevity of the unique roles the sector plays in providing
a sense of calmness amidst vast economic uncertainties. studies may build on the
findings of this study as a source of empirical information regarding the relationship
between board structure and the financial performance in the Nairobi Securities
Exchange listed companies in Kenya.
15

CHAPTER TWO
LITERATURE REVIEW
2.1 Introduction
This chapter is organized into four parts. Section 2.2 discusses the theoretical literature
specifically discussing the theories the study is based on. Section 2.3 details empirical
literature on the board structure and seek to establish the effect of board structure on
corporate financial performance in NSE listed firms in Kenya. Lastly section 2.4 presents
a summary of the literature review.
2.2 Theoretical Review
The following theories guided the relationship between board structure and corporate
financial performance literature.
2.2.1 Agency Theory
Separation of control from ownership implies that professional managers manage a firm
on behalf of the firm’s owners (Kiel & Nicholson, 2003). Conflicts arise when a firm’s
owners perceive the professional managers not to be managing the firm in the best
interests of the owners. According to Eisenhardt (1989), the agency theory is concerned
with analyzing and resolving problems that occur in the relationship between principals
(owners or shareholders) and their agents or top management. The theory rests on the
assumption that the role of organizations is to maximize the wealth of their owners or
shareholders (Blair, 1995).
16

The agency theory holds that most businesses operate under conditions of incomplete
information and uncertainty. Such conditions expose businesses to two agency problems
namely adverse selection and moral hazard. Adverse selection occurs when a principal
cannot ascertain whether an agent accurately represents his or her ability to do the work
for which he or she is paid to do. On the other hand, moral hazard is a condition under
which a principal cannot be sure if an agent has put forth maximal effort (Eisenhardt,
1989). According to the agency theory, superior information available to professional
managers allows them to gain advantage over owners of firms. The reasoning is that a
firm’s top managers may be more interested in their personal welfare than in the welfare
of the firm’s shareholders (Berle& Means, 1967). Donaldson and Davis (1991) argue that
managers will not act to maximize returns to shareholders unless appropriate governance
structures are implemented to safeguard the interests of shareholders. Therefore, the
agency theory advocates that the purpose of corporate governance is to minimize the
potential for managers to act in a manner contrary to the interests of shareholders.
Proponents of the agency theory belief that a firm’s top management becomes more
powerful when the firm’ stock is widely held and the board of directors is composed of
people who know little of the firm. The theory suggests that a firm’s top management
should have a significant ownership of the firm in order to secure a positive relationship
between corporate governance and the amount of stock owned by the top management
(Mallin, 2004). Wheelen and Hunger (2002) argue that problems arise in corporations
because agents (top management) are not willing to bear responsibility for their decisions
unless they own a substantial amount of stock in the corporation.
17
The agency theory also advocates for the setting up of rules and incentives to align the
behaviour of managers to the desires of owners (Hawley & Williams, 1996). However, it
is almost impossible to write a set of rules for every scenario encountered by employees.
Consequently, the Australian Stock Exchange Corporate Governance Council (2003)
associates good corporate governance with people of integrity.
Carpenter and Westpal (2001) argue that the agency theory is mainly applied by boards
of profit making organizations to align the interests of management with those of
shareholders. Dobson (1991) argues that the demands of profit making organizations are
different from those of stakeholders such as shareholders, local communities, employees
and customers. The conflicting demands can be used to justify actions that some may
criticize as immoral or unethical depending on the stakeholder group.
According to this theory, people are self-interested rather than altruistic and cannot be
trusted to act in the best interests of others. On the contrary, people seek to maximize
their own utility. The agency theory presents the relationship between directors and
shareholders as a contract (Adams, 2002). This implies that the actions of directors,
acting as agents of shareholders, must be checked to ensure that they are in the best of the
shareholders.
2.2.2 Stewardship Theory
The stewardship theory, also referred to as the stakeholders’ theory, adopts a different
approach from the agency theory. It starts from the premise that organizations serve a
broader social purpose than just maximizing the wealth of shareholders.
18

The stakeholders’ theory holds that corporations are social entities that affect the welfare
of many stakeholders where stakeholders are groups or individuals that interact with a
firm and that affect or are affected by the achievement of the firm’s objectives
(Donaldson & Preston, 1995; Freeman, 1984). Successful organizations are judged by
their ability to add value for all their stakeholders. Some scholars consider the natural
environment to be a key stakeholder (Starik & Rands, 1995; Dunphy et al., 2003).
Stakeholders can be instrumental to corporate success and have moral and legal rights
(Donaldson & Preston, 1995; Ulrich, 2008). When stakeholders get what they want from
a firm, they return to the firm for more (Freeman, 1984; Freaman & McVea,
2001).Therefore, corporate leaders have to consider the claims of stakeholders when
making decisions (Blair, 1995) and conduct business responsibly towards the
stakeholders (Manville & Ober, 2003; White, 2009). Participation of stakeholders in
corporate decision-making can enhance efficiency (Turnbull, 1994) and reduce conflicts
(Rothman & Friedman, 2001).
According to Kaptein and Van Tulder (2003), corporations adopt reactive or proactive
approaches when integrating stakeholders’ concerns in decision making. A corporation
adopts a reactive approach when it does not integrate stakeholders into its corporate
decision making processes. This results into a misalignment of organizational goals and
stakeholder demands (Mackenzie, 2007). Some authors attribute scandals such as those
of Enron and WorldCom to the failure to consider stakeholder concerns in decision
making (Currall& Epstein, 2003; Turnbull, 2002; Watkins, 2003; Zandstra, 2002).
Following these scandals, some governments set up new regulations to align the interests
19
of stakeholders with corporate conduct. For example, the Sarbanes-Oxley Act (SOX) was
passed as a result of the Collapse of Enron and WorldCom.
Adams (2002) argues that the stewardship theory remains the theoretical foundation for
much regulation and legislation. A proactive approach is used by corporations that
integrate stakeholders’ concerns into their decision-making processes and that establish
necessary governance structures (de Wit et al., 2006).
In summary, the stewardship theory suggests that a firm’s board of directors and its CEO,
acting as stewards, are more motivated to act in the best interests of the firm rather than
for their own selfish interests. This is because, over time, senior executives tend to view a
firm as an extension of themselves (Clarke, 2004; Wheelen & Hunger, 2002). Therefore,
the stewardship theory argues that, compared to shareholders, a firm’s top management
cares more about the firm’s long term success (Mallin, 2004)
2.2.3 Restitution Theory
Diane Gossen (2004), developed the restitution by integrating the concepts of Reality
Therapy by Glasser (2006) with the science of Perceptual Control Theory by Powers
(2005) his theory is based upon creating an environment free of fear, anger, and guilt to
self-evaluate problems. Internal Control Theory is based on the belief that all behavior is
internally motivated. When management maintains a business environment that
emphasizes an appropriate level of control consciousness, a company is likely to have an
effective internal control system. According to Bedard and Chi (1993), the internal
control environment is reflected by management’s policies that have control implications.
20

Examples of such policies are: a well-publicized statement on corporate conduct,
enforcement of corporate policies, tight budgetary controls, support of an effective
internal auditing function and practices for hiring personnel with competence and
integrity. Top management, the board of directors, and its audit committee are influential
in creating an appropriate internal control environment through effective organization
structure, sound management practices, adherence to appropriate standards of ethical
conduct, and compliance with applicable laws and regulations (PCAOB, 2004).
2.2.4 The Control Theory
According to Bierstaker (1999), the basics of control theory is that for business or system
to stand, one individual should authorize the purchase and the selling of products, while
another should take custody of the sale and the third individual should account for the
number of products sold. (Bierstaker, 1999). The better the running of a system
operations, the less the cost and greater the benefit associated with.
Likely course of events, but deviations from the most likely outcome. The advantage of
planning is that it forces management to take account of possible decisions from
anticipated path. According to the AICPA Audit Committee Toolkit (2004), it will be
found that while all of an organization’s people are an integral part of internal control,
certain parties merit special mention. This management, the board of directors (including
the audit committee), internal auditors, and auditors. The primary responsibility for the
development and maintenance of internal control rests with an organization’s
management.
21
Bierstaker and Wright (2004), says that, with increased significance placed on the control
environment, the focus of internal control has changed from policies and procedures to an
overriding philosophy and operating style within the organization. Emphasis on these
intangible aspects highlights the importance of top management’s involvement in the
internal control system. If internal control is not a priority for management, then it will
not be one for people within the organization either. As an indication of management’s
responsibility, top management at a publicly owned organization will include in the
organization’s annual financial report to the shareholders a statement indicating that
management has established a system of internal control that management believes is
effective. The statement may also provide specific details about the organization’s
internal control system (Bierstaker 1999).
According to Kopp and Bierstaker (2006), internal control must be evaluated in order to
provide management with some assurance regarding its effectiveness. Internal control
evaluation involves everything management does to control the organization in the effort
to achieve its objectives. Internal control would be judged as effective if its components
are present and function effectively for operations, financial reporting, and compliance.
The board of directors and its audit committee has responsibility for making sure the
internal control system within the organization is adequate. This responsibility includes
determining the extent to which internal controls are evaluated. Two parties involved in
the evaluation of internal control are the organization’s internal auditors and their
external auditors (Roth, 1997).
22
According to Bonner (1990), internal auditors’ responsibilities typically include ensuring
the adequacy of the system of internal control, the reliability of data, and the efficient use
of the organization’s resources. Internal auditors identify control problems and develop
solutions for improving and strengthening internal control& 1nternal auditors are
concerned with the entire range of an organization’s internal controls, including financial
statement audit. In contrast to internal auditors, external auditors focus primarily that
affect financial reporting.
2.3 Determinants of Financial Performance
There are various measures of financial performance. For example return on assets
(ROA) determines an organization’s efficiency in ability to make use of its assets and
return on equity (ROE) reveals the return investors expect to earn for their investments
and return on sales (ROS) reveals how much a company earns in relation to its sales. The
advantages of financial measures are the simplicity of calculation and also that their
definitions are agreed worldwide. Traditionally, the success of a company has been
evaluated by the use of financial measures (Tangen, 2003).Four useful measures of
profitability are the rate of return on assets (ROA), the rate of return on equity (ROE),
operating profit margin and net income (Hansen and Mowen, 2005).
Liquidity measures the ability of the business to meet financial obligations as they fall
due, without disrupting the normal, ongoing operations of the business. Liquidity can be
analyzed both structurally and operationally. Structural liquidity refers to balance sheet
measures of the relationships between assets and liabilities and operational liquidity
refers to cash flow measures.
23
Solvency measures the amount of borrowed capital used by the business relative to the
amount of owner’s equity capital invested in the business. In other words, solvency
measures provide an indication of the business’ ability to repay all indebtedness if all its
assets were sold. Solvency measures also provide an indication of the business’ ability to
withstand risks by providing information about the operation’s ability to continue
operating after a major financial adversity (Harrington and Wilson, 1989).
Profitability measures the extent to which a business generates a profit from the factors of
production: labor, management and capital. Profitability analysis focuses on the
relationship between revenues and expenses and also on the level of profits relative to the
size of investment in the business.
Repayment capacity measures the ability to repay debt from both operating and non-
operating income. It evaluates the capacity of the business to service additional debt or to
invest in additional capital after meeting all other cash commitments. Measures of
repayment capacity are developed around an accrual net income figure. The short-term
ability to generate a positive cash flow margin does not guarantee long-term survival
ability (Jelic and Briston, 2001).
Financial efficiency measures the degree of efficiency in using labor, management and
capital. Efficiency analysis deals with the relationships between inputs and outputs.
Because inputs can be measured in both physical and financial terms, a large number of
24
efficiency measures in addition to financial measures are usually possible (Tangen,
2003).
2.4 Empirical Literature
Parker, Peters and Turetsky, (2002) Investigated various corporate governance attributes
and financial survival 176 financially stressed firms 1988-1996 were sampled and
analysed using Regression analysis. The findings showed that Firms that replaced their
CEO with an outside director were more than twice as likely to experience bankruptcy.
Larger levels of insider ownership are positively associated with the likelihood of firm
survival. Kiel and Nicholson
(2003) Examine the relationship between board demographics and performance 348
public listed companies using ASX 1996 SPSS analysis Tobin’s Q the results showed
positive relationship between the proportion of inside directors and the market-based
measure of firm performance. Board size is positively correlated with firm value.
O’Sullivan and Diacon (2003) examined whether mutual insurers employ stronger board
governance than their proprietary counterparts and also examined the impact of board
composition on the performance of proprietary(stock) and mutual companies using
regression analysis among 53 life insures operating in the UK over the period 1984-199
the results showed that mutual insurers had greater non-executive representation on their
boards and that there is lack of consistent evidence on non-executive monitoring and
impact on performance.
25

Dulewicz and Herbert (2004) investigated whether there is any relationship between
board composition and behaviour, and company performance using data based on
original study of 134 responses from a cross-section of companies. Follow up data based
on 86 listed companies (1997-2000) using SPSS analysis CFROTA (cash flow return on
total assets) ratio used for performance analysis. The findings indicated that board
practices on identified tasks not clearly linked to company performance Limited support
that companies with independent boards are more successful than others. Uzun, Szewcyz
and Varma (2004) examined the relationship between fraud and board composition,
board size, board chair, committee structure and frequency of board meetings by
constructed database for a sample of 266 companies (133that were accused of committing
fraud and 133 no-fraud) during the period 1978-2001 using regression analysis. The
findings showed that board composition and structure of oversight committees are
significantly related to the incidence of corporate fraud. A higher proportion of
independent directors indicated a less likelihood of fraud. Dalton, Daily, Ellstr and
Johnson (1998) reviewed research on the relationships between board composition,
leadership structure and financial performance using meta-analysis of 54 empirical
studies of board composition, 31empirical studies of board leadership structure. No
meaningful relationship between board composition, leadership structure and financial
performance.
Millstein and Macavoy (1998) on directors and performance focus on board behavior
Empirical study of 154 firms based on 1991-1995 data. The study showed substantial and
statistically significant correlations between an active board and corporate performance.
26

Further Muth and Donaldson, (1998) examined board independence and performance
based on agency stewardship theory. 145 listed companies1992-1994 using statistical
analysis. Empirical results inconclusive that board independence has a positive effect on
performance. Lawrence and Stapledon (1999) examined the relationship between board
composition and corporate performance. Examined whether independent directors have a
positive influence on executive remuneration. Empirical studies – data sample selected
from ASX listed companies in 1995 using regression analysis on 700 directors sampled.
No statistically significant relationship between the proportions of NED’s and adjusted
shareholder returns.
Li and Ang (2000) investigated the impact of the number of directorships on directors
performance. Empirical studies- sample consisted of121 listed firms and
1195directors1989-1993 using regression analysis. The findings negligible affect on the
firm’s share value based on number of directorships- considering just the number of
appointments may not reflect how a director performs in corporate monitoring. Rhoades,
Rechner and Sundaramurthy (2000) examined the insider/outsider ratio of boards and
company performance using 37 studies across 7644 organizations based on initial search
of 59 reports with quantitative data on monitoring and performance1966-1994. Overall
conclusions are that there is a small positive relationship between board composition and
financial performance. Board and their director quality needs to be further addressed in
considering managerial implications of board composition monitoring. Bhagat and Black
(2002) examined whether there is any relationship between board composition, board
size, board independence and firm performance on 934 firms using data form 1985-1995.
27
The findings indicated low-profitability firms increase the independence of their boards.
Firms with more independent boards do not perform better than other firms.
Local studies have also concentrated on the influence of board structure on financial
performance. According to Ayogo, (2005) in his study on Corporate Governance in
Kenya and the Record and Policies for good Governance” argued that corporate
governance is concerned with the relationship between the internal governance
mechanisms of corporations and society’s conception of the scope of corporate
accountability. Many researchers, such as Musila (2007), in his study on Leadership
Structure: Separating the CEO and Chairman of the Board” have argued that the erosion
of investor confidence in Kenya has been brought about by companies’ board structure
standards and a lack of transparency in the financial system.
Murage (2010), in his study on the Relationship between Corporate Governance and
Financial performance of Parastatals in Kenya, concluded that large boards enhanced
corporate performance and that when such boards were dominated by non-executive
directors, it enhanced firm value. While the CEO duality did not significantly impact on
financial performance measure of ROA, in his study, it had a positive relationship with
financial performance in conflict with other studies. Ongore and K’Obonyo (2011), in
their study on Effects of Selected Corporate Governance Characteristics on Firm
Performance concluded that the role of boards was found to be of very little value, mainly
due to lack ofadherence to board member selection criteria.
28

Rashid, (2011) in his study on Board Structure Board Leadership Structure and Firm
Performance: states that “corporate governance literature debated within two extreme
streams of board practices examining whether the board structure in the form of
representation of outside independent directors and structural dependence of the board
influence the firm financial performance. He further argues that board structure and
corporate performance jointly influence each other rather the board structure influencing
corporate performance or corporate performance influencing board structure. He noted
that board structure and financial performance influence each other but the effect is not
immediate.
Aosa and Machuki, (2012) in their study on Board Diversity and Performance of
Companies Listed in Nairobi Stock Exchange concluded that when using the Ordinary
Least Squares (OLS) regression, their results show that there is a weak positive
association between board diversity and financial performance. On overall, their results
indicate a statistically not significant effect of board diversity on financial performance
except for the independent effect of board study specialization on dividend yield.
2.5 Summary of the Literature Review
The available literature on the relationship between the board structure and firm
performance reflects mixed results. The idea of endogenous relationship between board
structure and corporate financial performance was advanced by Hermalin & Weisbach
(2010), that is, board structure and corporate performance jointly influence each other
rather the board structure influencing corporate performance or corporate performance
29

influencing board structure. Davidson & Rowe (2004) note that board structure and
financial performance influence each other but the effect is not immediate.
There are some studies that have been conducted in Kenya on stock market focusing on
various aspects of corporate governance of companies listed companies. They include
Munga (2004), Mwangi (2007), Gitobu (2000), Munene (2007) among others. In spite of
all these alternative studies that have been carried out, a gap in the literature relating
examining the effect of board structure on financial performance of firms listed on
Nairobi Securities Exchange exist because there are still no conclusive results that have
been arrived at. Majority of these studies have examined the composite stock indices in
relation to board structure of companies listed at the Nairobi Securities Exchange and
examined whether companies incorporate available information, but did not determine
what tasks the companies respond to in relation to board structure and to how important
these tasks are to the financial performance of firms listed on Nairobi Securities
Exchange and also did not establish the direction and magnitude of the interaction
between board structure tasks and firms financial performance at the Nairobi Securities
Exchange. Therefore, this study sought to fill these gaps.
30
CHAPTER THREE
RESEARCH METHODOLOGY
3.1 Introduction
This chapter presents the research methods that the researcher employed to facilitate
execution of the study to satisfy study objectives. These steps include; research design,
population of interest, sample and sampling techniques, data collection instruments,
procedures and data analysis.
3.2 Research Design
Research design is the plan and structure of investigation so conceived as to obtain
answers to research questions. The plan is the overall scheme or program of the research
(Robson, 2002). A descriptive research design was used in this study. The major purpose
of descriptive research design provides information on characteristics of a population or
phenomenon (Mugenda& Mugenda, 2003). Descriptive research was used as a pre-cursor
to quantitative research designs as it provides the general overview giving some valuable
pointers as to what variables are worth testing quantitatively.
3.3 Population of the Study
A population is an entire group of individuals, events or objects having common
characteristics that conform to a given specification (Mugenda& Mugenda, 2003). The
population of interest in this study constituted all listed companies quoted at the NSE for
the period of five years from 2009 to 2013. The study was limited to listed companies
due to lack of readily available data from private companies not listed in NSE. By
December 2013there were a total of sixty three firms listed in NSE (Apendix1).
31

3.4 Data Collection Techniques
Secondary financial data sources was used for the study, where annual financial reports
of individual listed firms’ were analysed over the five year period where profitability was
extracted and used as a measure of financial performance. Board structure data was
obtained from corporate governance disclosure of individual listed firms in NSE. The
data is filed by NSE and CMA library that also files details of the board of directors like
the age, name, position and whether independent or dependent director was obtained
which is a requirement by the companies listed to file with them is readily accessible and
reliable.
3.5 Data Analysis Techniques
Being a comparative study, multivariate and univariate analysis models were used.
Univariate analysis involved summary or descriptive statistics such as mean, frequencies,
test of normality, mode, median, quartiles among others. This basically helps in
characterizing different board structure across listed firms. Test of significance, R2,
ANOVA and T-test was used to establish the significance of the difference in financial
performance means between the boards over the five-board term period.
3.5.1 Analytical Model
Despite several weaknesses in both financial and market-based measures, more and more
studies now rely on market-based measures. For instance, Demsetz et al. (1985) used
accounting measures, but Demsetz et al. (2001) shifted to market-based measures. As a
result, there is a that believe higher reliance on market-based measure is justifiable for
two reasons. First, market-based measure is less prone to accounting variations, and
secondly, it reflects investor perceptions about the firm’s future prospects. The study used
32

multiple linear regression model which sought to establish the relationship between board
structure and performance measured by return on equity. The regression model was:
ROA = α + β1log (BS) + β2(Ratio) + β3(G) +β4(BC) +[β5(FZ) +β6(FA)]+εi
Whereby α is the y-intercept, β1 – β4 are the coefficients of the independent variables and
εi is the model significance established by the f-significance from Analysis of Variance
(ANOVA).
ROA - return on assets; measure of net profit after tax divided by total assets of firm
BS - board size; number of the company’s board
Ratio - Board independence (ratio of non-executive to executive directors)
Gender- gender of the board of directors
BC - number of board committees of the firm
[β5 (FZ) + β6 (FA)]-represents the influence of control variables on the model where
FZ-Firm size
FA-Age of the firm
The study used the regression coefficients to test the magnitude of the relationship
between board structure and firm performance. The study applied F and t-significance
from ANOVA and regression to establish the significances of such relationships.
3.5.2 Diagnostic Test
Diagnostic tests determine the goodness of the multiple linear regression models. Thus,
the regression model was preceded by diagnostic tests. The diagnostic tests included:
Durbin Watson (DW) test, multicollinearity tests, Breusch-Pagan test for
heteroskedasticity and White Heteroskedasticity Test (LM) for constant variance of
residual over time.
33

CHAPTER FOUR
DATA ANALYSIS, PRESENTATION AND INTERPRETATION
4.1 Introduction
The current chapter presents the outcome of data analysis and findings in line with the
objectives of the Study. The data were analyzed using the Statistical Program for Social
Sciences (SPSS) version 18, by use of both descriptive and inferential statistics. Descriptive
statistics such as mean, median, maximum, minimum, standard deviation, Skewness and
Kurtosis were used. The regression model was preceded by diagnostic tests.
4.2 Descriptive Statistics
Table 4.1 gives the summary statistics of the main variables that have been included in
the model including: minimum, maximum, mean, standard deviation, skewness, kurtosis
and Jarque-Bera test for normality.
Table 4.1: Descriptive Statistics Results
ROA Tobin’s Q
Board Size
Board independence
Gender Board committee
Size Age
Mean 0.11 1.53 8.00 0.4994 2.043 3.319 391.64 13.44 Median 0.12 1.22 9.00 0.913 0.646 1.213 36.97 12.00 Maximum 0.38 7.35 12.00 0.312 4.831 4.183 8,881.52 37.00 Minimum -0.47 0.43 7.00 0.191 0.000 1.224 0.91 0.00 Std. Dev. 0.12 1.07 2.62 0.331 0.078 0.238 6.71 9.44 Skewness 0.453 0.651 0.045 0.829 0.9979 0.698 0.787 0.877 Kurtosis 2.045 3.004 2.034 3.223 3.567 2.314 3.312 3.456 Jarque-Bera
6.754 5.523 4.582 13.311 20.416 11.488 10.474 12.413
Observations
315 315 315 315 315 315 315 315
34

Table 4.1 above reports summary statistics for the sample, ROA is the ratio of operating
profit before depreciation and provisions divided by total assets. Tobin’s Q is book value
of total assets plus market value of equity minus book value of equity divided by book
value of total assets. The results showed that board size had a mean of 8.00 with a
minimum of 7.00, a maximum of 12.00, skewness 0.045 and kurtosis of +2.034.
Comparatively, Board independence had a mean of .4994, minimum of .312, maximum
of .191, skewness of 0.829 and kurtosis of +3.223. Gender had a mean of 2.043,
minimum of 0.000, maximum of 4.831, skewness of 0.698 and kurtosis of +3.567. Board
committee had a mean of 3.319, minimum of 1.224, maximum of 4.183, skewness of
0.698 and kurtosis of +2.314.
Analysis of skewness shows that all the variables are asymmetrical to the right around its
mean. Additionally, ‘gender and board independence’ are highly peaked compared to
other regressors. Jarque-Bera is a test statistic for testing whether the series is normally
distributed. It measures the difference of the skewness and kurtosis of the series with
those from the normal distribution using the null hypothesis of a normal distribution. A
small probability value leads to the rejection of the null hypothesis of a normal
distribution. Jarque-Bera test for normality shows that all variables are normally
distributed.
4.3 Diagnostic Tests for Regression Assumptions
The preferred regression model was subjected to a number of diagnostic tests to evaluate
the validity of the model. The diagnostic tests included: Breusch-Pagan test for
heteroskedasticity and White Heteroskedasticity Test (LM) for constant variance of
35
residual over time, the ARCH (Autoregressive conditional heteroscedasticity) test which
detects the problem of heteroscedasticity and Ramsey RESET test for the specification of
the regression. Further regression and correlation analysis were used to establish the
relationship between the independent and the dependent variables. Control variables i.e.
age and size of the firm were incorporated to determine the changes in coefficient of
determination (R2 change).The results were presented in Table 4.2 below.
Table 4.2: Diagnostic Tests
Test F-statistics ProbabilityRamsey RESET Test: 1.760507 0.163014
White Heteroskedasticity Test: 2.125333 0.079932
ARCH Test: 1.185552 0.324352
Breusch-Pagan Test for HeteroskedasticityLM Test: 1.12472 0.573265
Table 4.2 shows that the parameters of the regression analysis were stable and the model
can be used for estimation at 5 percent confidence level. The Ramsey RESET Test for
model specification, ARCH Test and White Heteroskedasticity Test for constant variance
of residuals and Breusch-Godfrey Serial Correlation LM Test for serially correlated
residuals used the null hypothesis of good fit (specification, heteroskedasticity, and non-
auto correlated against the alternative hypothesis of model mis-specification,
heteroskendasticity, and auto correlated respectively. All the probability values were less
than F-statistics coefficients at 5 percent level of significance and therefore the null
hypothesis was not rejected. The diagnostic test outcomes were therefore satisfactory.
36

4.4 Pearson’s Correlation Coefficient Analysis for Corporate Board Structure and
Firms ‘Financial Performance
Correlation analysis was used to measure the degree of association between different
variables under consideration. In this section, the study measured the degree of
association between the corporate board structure variables and firms financial
performance i.e. if the board structure proxies (board size, board independence, and
gender and board committee) and firm’s financial performance. From the a priori stated
in the previous chapter, a positive relationship is expected between the measures of
corporate board structure and firms financial performance. Table 4.3 and 4.4 presents the
correlation coefficients for all the variables considered in this study.
Table 4.3: Correlation Analysis Results
Board independence
Board size
Gender Board committee
ROA
Board independence
Pearson Correlation
1
Sig. (2-tailed)N 315
Board size Pearson Correlation
.624(**) 1
Sig. (2-tailed) .000N 315 315
Gender Pearson Correlation
-.447(**) .409(**) 1
Sig. (2-tailed) .000 .001N 315 315 315
Board committee
Pearson Correlation
.528(**) -.496(**) -.225 1
Sig. (2-tailed) .000 .000 .076N 315 315 315 315
ROA Pearson Correlation
.669(**) .657(**) .132(**) .453(**) 1
Sig. (2-tailed) .000 .000 .032 .005N 315 315 315 315 315
** Correlation is significant at the 0.01 level (2-tailed).
Source: computed by researcher using data extracted from annual reports of listed firms
37
From the correlation result for the study model in table 4.3, board independence has a
strong positive correlation with ROA (.669, p=.000), the study further indicated that
board size has also a strong and positive relationship with ROA (.654, p=0.000). The
study also indicated that gender has a weak insignificant relationship with ROA (.132,
p=0.32). Further the results indicates that board committee has a moderate and significant
relationship with ROA (.453, p=0.21). This implies that board independence and board
size influences performance of firms strongly, board committee influences firm
performance to a moderate extent whereas gender has insignificant influence on firm’s
financial performance.
4.5 Regression Analysis
Regression analysis was used to determine the impact of the corporate board structure
variables on firms’ financial performance.
Table 4.4: Regression Coefficients of the Corporate Board Structure Variables and
Firm’s Financial Performance Indicators
Unstandardized Coefficients
Standardized Coefficients
B Std. Error
Beta t Sig.
(Constant) 7.13 0.443 4.335 .000Board size 0.444 0.254 0.021 3.993 .000Board independence 0.738 0.262 0.022 3.446 .002Gender 0.612 0.372 0.038 4.937 .000
Board committees 0.223 0.242 0.032 1.931 .003
Source: Research Findings
The regression model
ROA = α + β1 (BS) + β2(BI) + β3(G) +β4(BC) +εi
Becomes ROA = 7.13 + 0.444BS + 0.738BI + 0.612G + 0.223BC
38

According to the regression equation established, taking all factors into account (board
size, board independence, gender and board committee financial performance measured
by ROA is 7.13. The Standardized Beta Coefficients give a measure of the contribution
of each variable to the model. A large value indicates that a unit change in this predictor
variable has a large effect on the criterion variable. The t and Sig (p) values give a rough
indication of the impact of each predictor variable – a big absolute t value and small p
value suggests that a predictor variable is having a large impact on the criterion variable.
At 5% level of significance and 95% level of confidence, board size had a 0.000 level of
significance, board independence had a 0.002 level of significance, gender had a 0.000
level of significance and board committees had a 0.003 level of significance.
4.5.1 Regression Model Summary
From the results shown in Table 4.5, the model shows a goodness of fit as indicated by
the coefficient of determination (R2) with a value of 0.7338. This implies that the
independent variables gender of the board of directors; Board independence, board size
and board committee explain 73.38 percent of the variations of financial performance of
companies listed on NSE.
The study therefore identifies gender of the board of directors; Board independence,
gender distribution and board committee as critical factors for enhancing financial
performance of the companies listed on NSE.
39
Table 4.5: Regression Model Summary of Corporate Board Structure Variables and
Financial Performance Indicators
Model Summary
Model R R Square Adjusted R Square Std. Error of the
Estimate
1 0.8566 0.7338 0.7011 0.7638
Source: Research Findings
Predictors: (Constant), gender of the board of directors; Board independence, board size
and board committee.
The study then incorporated in the effect of control variables i.e. age of the firm and size
of the firm. The results are summarized in Table 4.6.
a) The Goodness-of-fit
Table 4.6: Regression Results
a) The Goodness-of-fit
R R Square
Std. Error of the Estimate
Change StatisticsR2 Change
F Change Df 1 Df 2 Sig. F Change
1 .653(a) 0.856 0.7338 .0358 .730 19.241 3 2 .0002 .873(b) .901 .811 .0234 .081 31.554 1 2 .000Predictors
a. Gender of the board of directors; Board independence, board size and board committee.
b. Gender of the board of directors; Board independence, board size, board committee, age
and size.
40
The results in Table 4.6 show that corporate board structure explain 73% of the variation
in firms financial performance (R2 =.7330). At step 2, age and size of the firm adds
significantly to the corporate board structure towards firms financial performance as the
variation increased from .730 to .811 (R2 change=.081 p-value=.000). The results reveal
that the variance explained by age and size of the firm as control variables is significant
(F=12.313, p-value=.001). The results revealed that the regression coefficients for
corporate board structure increased from .653 to .873 when age and size of the firm were
added to the regression suggesting that age and size of the firm are exerting a strong
control effect.
Table 4.7: Analysis of Variance (ANOVA)
Sum of Squares df Mean
Square
F F-statistics Significance
Regression 52.55 4 14.93 18.33 88.33 0.00
Residual 3.34 19 4.22
Total 55.89 23
NB: F-critical Value 88.33 (statistically significant if the F-value is less than 88.33: from
table of F-values).
a. Predictors: (Constant), board size, board independence, gender and board committee.
The value of the F statistic, 18.33 indicates that the overall regression model is significant
hence it has some explanatory value i.e. there is a significant relationship between the
predictor board size, board independence, gender and board committee (taken together)
and financial performance of companies listed at the NSE.
41

4.5 Chapter Summary
This chapter presented data analysis and interpretation, Descriptive statistics such as
mean, median, maximum, minimum, standard deviation, Skewness and Kurtosis were
used. The regression model was preceded by diagnostic tests of regression assumption
which included the Ramsey RESET Test for model specification, ARCH Test and White
Heteroskedasticity Test for constant variance of residuals and Breusch-Godfrey Serial
Correlation LM Test for serially correlated residuals used the null hypothesis of good fit
(specification, heteroskedasticity, and non-auto correlated against the alternative
hypothesis of model mis-specification, heteroskendasticity, and auto correlated
respectively. Further correction and regression analysis were performed to determine if
the variables were significant in explaining the dependent variable financial performance.
ANOVA was also used to determine if the model has explanatory value i.e. the influence
of the independent variables on the dependent variable.
42
CHAPTER FIVESUMMARY, CONCLUSION AND RECOMMENDATIONS
5.1 Introduction
This chapter summarizes the study and makes conclusion based on the results. The
implications from the findings and areas for further research are also presented. This
section presents the findings from the study in comparison to what other scholars have
said as noted under literature review.
5.2 Summary
The main objective of the study was to establish the effect of corporate board structure on
financial performance of companies listed in Nairobi Securities Exchange. Therefore a
descriptive research design was used to study whether there is an effect of corporate
board structure on financial performance of firms listed in Nairobi Securities Exchange.
The population of interest in this study constituted all listed companies quoted at the NSE
for the period of five years from 2009 to 2013. Secondary financial data sources was used
for the study, where annual financial reports of individual listed firms ‘was used over the
five year period where profitability was extracted and used as a measure of financial
performance.
The findings showed that corporate board structure variables considered in the model are
significantly associated with financial performance as indicated by the positive mean
values and their respective standard deviations. From skewness, the study observed that
all the variables are positively skewed which clarified that the variables are asymmetrical.
43
Skewness value of all the variables is very near to zero so it is relatively symmetrical.
Kurtosis values indicated that all variables have platy-kurtic distribution and it is
concluded that variables are normally distributed.
The descriptive statistics of the variables used in the analysis of the sample was very
crucial for the study. The study presents the descriptive statistics of the variables used in
the analysis: gender of the board of directors; Board independence, board size, board
committee and return on asset ratio (ROA). The findings show that corporate board
structure is significantly associated with firm’s financial performance as indicated by the
positive mean values and their respective standard deviations. From skewness, the study
revealed that all the variables are positively skewed which clarified that the variables are
asymmetrical. Skewness value of all the variables is very near to zero so it is relatively
symmetrical. Kurtosis values indicated that all variables have platy-kurtic distribution
and it is concluded that variables are normally distributed.
The study further determined the correlation between the independent variables used in
the study i.e. corporate board structure variables and firms financial performance
indicators. For this analysis Pearson correlation was used to determine the degree of
association within the independent variables and also between independent variables and
the dependent variable. The analysis of these correlations seems to support the
hypothesis that each independent variable in corporate board structure has its own
particular informative value in the ability to explain firm’s financial performance. The
significance of the coefficients was calculated at the level of 95%.
44

The study findings indicate that corporate board structure variables i.e. board
independence, board size and board committee are statistically significance to firms’
financial performance indicators as indicated by the positive and strong Pearson
correlation coefficients whereas gender is statistically insignificant with financial
performance indicators as indicated by their weak Pearson correlation coefficients. This
implies that gender distribution may not influence financial performance of companies
listed on NSE.
According to the regression equation established, taking all factors into account (gender
of the board of directors; Board independence, board size and board committee financial
performance measured by ROA will be 7.13. The Standardized Beta Coefficients gave a
measure of the contribution of each variable to the model. A large value indicated that a
unit change in this predictor variable has a large effect on the criterion variable. The t and
Sig (p) values gave a rough indication of the impact of each predictor variable – a big
absolute t value and small p value suggests that a predictor variable is having a large
impact on the criterion variable.
From the results, the model showed a goodness of fit as indicated by the coefficient of
determination R2 (0.7338). This implies that the independent variables gender of the
board of directors; Board independence, board size and board committee explain 73.38
percent of the variations of financial performance of companies listed on NSE. The study
therefore identified these as critical factors for enhancing financial performance of the
companies listed on NSE.
45
Further the study carried out the hypothesis testing between corporate board structure
variables and financial performance. A Pearson coefficient measure showed a strong,
significant, positive relationship between corporate board structure and financial
performance of companies listed on NSE in Kenya. Therefore basing on these findings
the study rejected the null hypothesis that there is no relationship between corporate
board structure and financial performance of companies listed on NSE in Kenya and
accepted the alternative hypothesis that there exists a relationship between corporate
board structure and financial performance of companies listed on NSE in Kenya.
5.3 Conclusion
The analysis of the correlations results seemed to support the hypothesis that each
independent variable in corporate board structure has its own particular informative value
in the ability to explain financial performance. The significance of the coefficients was
calculated at the level of 95%. The study findings indicate that corporate board structure
variables i.e. gender, board independence and board committee are statistically
significant to firms’ financial performance indicators as indicated by the positive and
strong Pearson correlation coefficients whereas gender is statistically insignificant with
financial performance indicators as indicated by their weak Pearson correlation
coefficients.
According to the regression equation established, taking all factors into account (gender
of the board of directors; Board independence, board size and board committee, financial
performance measured by ROA will be 7.13.A Pearson coefficient measure showed a
46
strong, significant, positive relationship between corporate board structure and financial
performance of companies listed on NSE in Kenya. Therefore basing on these findings
the study rejected the null hypothesis that there is no relationship between corporate
board structure and financial performance of companies listed on NSE in Kenya and
accepted the alternative hypothesis that there exists a relationship between corporate
board structure and financial performance of companies listed on NSE in Kenya.
The findings showed that corporate board structure variables considered in the model are
significantly associated with financial performance as indicated by the positive mean
values and their respective standard deviations. From skewness, the study observed that
all the variables are positively skewed which clarified that the variables are asymmetrical.
Skewness value of all the variables is very near to zero so it is relatively symmetrical.
Kurtosis values indicated that all variables have platy-kurtic distribution and it is
concluded that variables are normally distributed.
5.4 Policy Recommendations
The study recommends that stakeholders in listed companies should take in to account
the corporate board structure variables i.e. gender, board size, board independence and
board committee when electing board of directors. That is the body should have equal
distribution in terms of gender, board size, board committee and board independence to
minimize stakeholders conflicts and improve on overall firm performance.
The study recommends that corporate board structure should be based on skills,
experience and professional qualifications to steer managerial functions as opposed to
47
gender as it is insignificant in explaining firms financial performance. Requirements for
one to be elected to the board of directors should be well stipulated in terms of gender
balance. This will facilitate satisfaction in management and therefore improved
management of the NSE listed companies in Kenya.
The variables considered in the study explained 73% of the variation in firm financial
performance implying that there are other important factors not included in the model and
therefore the study recommends that the management should put in to consideration such
factors in order to enhance the effectiveness of corporate governance index.The study
also recommends that policy makers should set an index on corporate governance to act
as a base to all companies listed at the NSE so that the efficiency of governance
committees can be enhanced. This will create a management momentum among the
committees mandated for corporate governance issues.
There should be continuous revision of policies governing the committees on the
corporate governance boards so that the ineffective clauses can be improved since the
governance index keep on changing as a result of prevailing economic conditions. This
will enable policy makers in the listed firms to decide on the possible best guidelines that
will enhance the overall management issues as far as corporate governance is concerned.
5.5 Limitations of the Study
Although this study helped to shed light on the dynamics of corporate governance on
financial performance of companies listed at the NSE, it was subject to a number of
limitations.
48

These mainly related to the setup of the study relative to the resources available within
the research period. As such the constraints influenced the scale of the study but did not
affect the conduct of the research once the design was arrived at.
The findings of this study may not be generalized to all listed firms but can be used as a
reference to listed firms in developing countries since they face almost the same
challenges due to the same prevailing economic situations as opposed to listed firms in
developed countries. The results thus cannot be generalized to all listed companies in
NSE. This is because different companies may have different strategies for managing
corporate board structure issues.
Since the main purpose of this study is to identify the relationship between corporate
board structure and financial performance of NSE listed companies in Kenya, NSE
considered some information sensitive and confidential and thus the researcher had to
convince them that the purpose of information is for academic research only and may not
be used for any other intentions.
Corporate board structure keep on changing from period to period depending on
prevailing economic situations and demand on the capital market. The findings therefore
may not reflect the true effect of corporate board structure across the companies listed for
a period of 5 years since some companies are delisted and listed again depending on their
performance on NSE.
Due to time, cost and operational constraints the study used a cross-sectional research
design and focused on all listed companies at the NSE. Data were collected from the
companies’ publications at the NSE and capital market authority.
49
This is helpful in getting insight about the dynamics of the study variables at a particular
point in time. For this reason there are opportunities for longitudinal and wider studies in
the same area of research. The study focused on a limited number of variables and
constructs but firm’s financial performance is influenced by many more factors. Other
variables can provide additional insights and explanations concerning the performance
indicators in the companies.
5.6 Suggestions for Further Research
The study suggests that more studies to be carried out taking in to account the prevailing
macroeconomic variables as the control variables since they play major roles in decision
making among the board of directors. More studies should also be carried out taking in to
account other performance variables such as leverage and Return on equity as opposed to
the current study which only considered Return on Assets as a measure of financial
performance. A similar study should also be carried out on relationship between firms’
financial performance and corporate board structure in Kenya incorporating more
corporate governance variables as opposed to the current study which took into
consideration only four corporate board structure.
The findings add to the existing conceptual and empirical evidence that corporate
governance influences firms financial performance. In addition, the findings add to the
existing conceptual and empirical evidence that this relationship is controlled by other
factors such as size and age of the respective firms. The inclusion of additional factors
not covered in this study could bring more insights into the corporate governance and
financial performance of the firms listed at the NSE. The factors used to measure the
50
study variables, namely; board size, board independence, board committee and gender on
firm’s financial performance are not exhaustive. A further review of both corporate
governance and firm’s financial performance would identify additional factors that
contribute to the concept of firms performance. The additional factors could enhance the
robustness of the study models and generalizability and validity of the results.
Future studies on corporate governance on firm financial performance should use both
subjective and objective measures of performance so that the relationship between the
two can be investigated. Balakrishnan (1996) contends that there is a strong relationship
between subjective and objective measures of firm financial performance; however, this
relationship has not been tested in the context of the all the listed firms at the NSE. It may
be useful for future studies to develop constructs that combine both subjective and
objective firm financial performance measures.
The replication of this study in other sectors of the economy such as private sector, other
firms in the service industry, the manufacturing sector can give a more detailed view of
the nature of the relationship identified in the study. It would be appropriate to study the
relationship between corporate governance and firm’s financial performance of the
different company categories. The replication of this study in other countries especially in
the Sub-Saharan region would demonstrate the universality and significance of the
corporate governance relationship in general and on the financial performance of
companies in particular.
With only secondary data, triangulating the data is complex. Future research should
consider combining both secondary and primary data. Finally, examining the relationship
51

between corporate governance and other strategic business orientations, marketing and
competitive strategies would contribute to a better understanding of the determinants of
firms’ financial performance.
52
REFERENCES
Abidin, Z. Z., Nurmala Mustaffa Kamal, N. M., & Jusoff, K. (2009). Board Structure and
Corporate Performance in Malaysia. International Journal of Economics and Finance, 1,
150-164.
Adam, R. B., & Mehran, H. (2003). Is Corporate Governance Different for Bank Holding
Companies? Economic Policy Review – Federal Reserve Bank of New York, 9(1), 123–
142.
Aduda, J; Chogii,R & Magutu, P.O. (2013). An Empirical Test of competing corporate
Governance Theories on the performance of Firms Listed at The Nairobi Securities.
Exchange, European Scientific Journal, 13, 1857-7881.
Anderson, K., Hossain, M. & Adams, M. (2006). The Effects of Board Composition and Board
Size on the Informativeness of Annual Accounting Earnings.Corporate Governance: An
International Review, 5, 418-431.
Ayogo, M. (2005). Corporate Governance in Kenya: The Record and Policies for good
Governance. African Development Bank, Economic Research Paper, 66.
Bathala, B., & Rao, R. (2005). The composition of boards of directors and strategic control:
Effects oncorporate strategy. Academy of Management Review, 15, 1, 72-87.
Baums, T (2004).Corporate Governance in Harmony-system & Recent Developments, in
Aspects of corporate Governance, Stockholm: Jurist.
Bhagat, S. & Black, B. (2000). Board independence and long-term firm performance.
Stanford Law School Working Paper No. 188.
Bhagat, S., & Black, B. (2002). The Non-Correlation between Board Independence and
Long-Term Firm Performance. Journal of Corporation Law, 27, 231-273.
Bhagat, S., & Black, B. (2007). Do independent directors matter? Unpublished working paper.
New York: Columbia University.
Bierstaker, J.L., & Thibodeau, J.A. (2006). The effect of format and experience on internal
control evaluation. Managerial Auditing Journal, 21, 9-877 - 891
Brennan, N. (2006). Boards of Directors and Firm Performance: is there an expectations gap?
Corporate Governance: An International Review, 14, 6, 577-593.
53
Brickley, J. A., Coles, J. L., & Jarrell, G. (2007). Leadership structure: Separating the CEO and
Chairman of theBoard. Journal of Corporate Finance, 3, 189-220.
Byrd, J. W. and Hickman, K.A. (2002), Do Outside Directors Monitor Managers? Evidence from
Tender Offer Bids, Journal of Financial Economics, 32 (2): 195-222.
Cadbury, M. (2002). Succession as a socio-political process: Internal impediments to outsiders
election. Academy of Management Journal,
Capital Markets Act. (2002). Gazette Notice 3362. Guidelines on Corporate governance
practices by public listed companies in Kenya.
Capital Markets Authority, CEO. (2009). CMA Kenya. Retrieved from Restriction of trading of
bob Mathews stock brokers Limited.
Carpenter, M.A. & Westpal, J.D. (2001). The strategic context of external network ties:
Examining the impact ofdirector appointments on board involvement in strategic
decisionmaking, Academy of Management Journal, 44 (4),639-990.
Carter, C.B., Lorsch, J.W. (2004), Back to the Drawing Board: Designing Corporate Boards for a
Complex World, Harvard Business School Press, Boston, MA.
Clifford, P. & Evans, D. (1997). The Effect of Board Composition on the Informativeness and
Quality of Annual Earnings: Empirical Evidence from Greece.Research in International
Business and Finance, 24, 190-205.
CMA (2009): Stock Markets in Developing Countries: Key Issues and a Research Agenda,
World Bank Working Papers, WPS 515.
Coles, J.W., V.B. McWilliams, & N. Sen, (2001). An Examination of the Relationship of
GovernanceMechanisms to Performance. Journal of Management, 27, 1, 23-
50.Combined Code on Corporate Governance (2003). Financial Reporting
Council,London.
Cotter, J, Shivdasani, A & Zenner, M (2007): “Do Independent Directors Enhance Target
Shareholder Wealth during Tender Offers?” Journal of Financial Economics, 43.
Dagsson S.W. J. (2011). Shareholder wealth effects of CEO departures: Evidence from the UK.
Journal of Corporate Finance, 8, 1, 81-104.
Dalton, V., & Daily, H. (2009). Corporate Performance and Board Structure in Belgian
Companies. Long Range Planning, 34, 3, 383-398
54
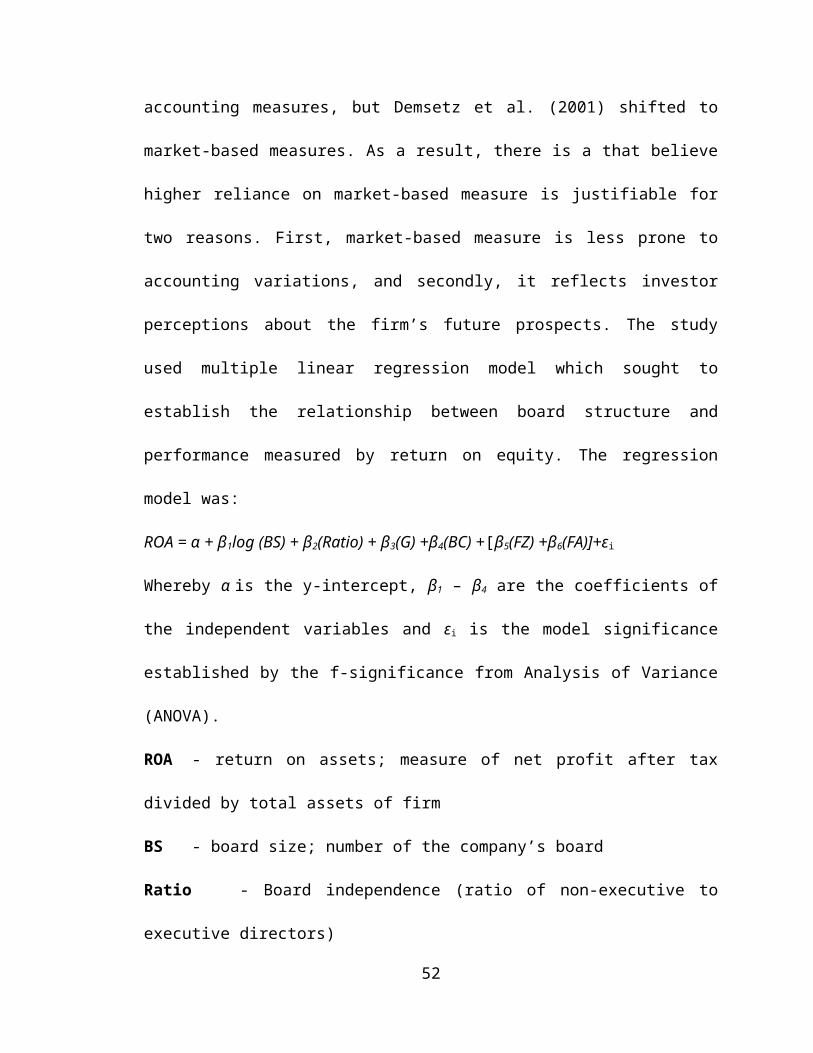
Davidson III, W. N. & Rowe, W. (2004), Intertemporal Endogeneity in Board Structure and
Financial Performance, Corporate Ownership and Control, 1 (4): 49-60.
Deakin, S., & Hughes, A. (2007). Comparative Corporate Governance: An Interdisciplinary
Agenda.in Enterprise and Community: New Directions in Corporate Governance,
Deakin, S. & Hughes, A. (Eds.), Blackwell Publishers, Oxford, UK.
Dezso, J., & Ross, P. (2008). Did J. P. Morgan's Men Add Value? An Economist's Perspective
on Financial Capitalism," in Peter Temin, ed., Inside the Business Enterprise: Historical
Perspectives on the Use of Information (Chicago, IL: University of Chicago Press)
Dwyer, J., Richard, F., &Chadwick, L. (2003). Toward a stewardship theory of management.
Academy of Management Review, 22, 1, 20-47.
Eisenhardt, K. (2009). Agency theory: An assessment and review. Academy of Management
Review, 14(1), 57-74.
Eklund, J. E, Palmberg, J. & Wiberg, D. (2009). Ownership Structure, Board Structure and
Investment Performance. CESIS Electronic Working Paper Series, Paper no. 172.
Fama, E.F. 2000. Agency problems and the theory of the firm. Journal of Political Economy,
88(2, April): 288–307.
Farrar, J. (2005).Corporate Governance: Theories, Principles and Practice, 2nd Edition, South
Melbourne, VIC: Oxford University Press.
Fields, M. A., & Keys, P.Y (2003). The Emergence of Corporate Governance from Wall St. to
Main St.: Outside Directors, Board Diversity and Earnings Management, and Managerial
Incentive to Bear Risk, The Financial Review, 38 (1): 1-24.
Finkelstein, S. & Hambrick, D.C. (1996).Strategic Leadership: Top Executives and TheirEffects
on Organization, West Publishing Company, Minneapolis/St. Paul.
Forbes, M.C., &Milliken, W. (2009). Theory of the Firm: Managerial behaviour, agency costs
and ownership structure. Journal of Financial Economics, 3(4), 305–360.
Geneen, S. (2008) Corporate Performance and Board Structure in Belgian Companies. Long
Range Planning, 34, 3, 383-398.
Gitobu M. N (2000). Relationship between Corporate Governance and Firms performance.
Unpublished MBA Project Report, Strathmore University.
Golden, K., & Zajac, W. (2011). The effect of Board size and Diversity on Strategic Change.
Strategic Management Journal, 15, 3, 241-250.
55
Gossen, D. (2004). It’s all about us: Rethinking discipline using restitution. Saskatoon: Chelsom
Consultants.
Grand, W. (2010). Mars Group Kenya. Retrieved September 20, 2009, from Government Eyes
NSE Ownership Stake. June 19, 2010, www.multimedia.marsgroupkenya.org.
Hambrick, D., & Jackson, E. (2000). Outside directors with a stake: the linchpin in improving
governance" California Management Review, 42. 108-27.
Hambrick, R., & Mason, M. (2004). Corporate Governance Structure and Performance
ofMalaysian Listed Companies. Journal of Business Finance & Accounting,
Hansen, J., Holthausen, J., &Mowen, D. (2005). Corporate governance, chief executive officer
compensation and firm performance. Journal of Financial Economics, 51, 371–406.
Harrington, G., &Wilson, R. (2009). Governance and banks’ valuations. Journal of
Financial Intermediation, 16, 584-617.
Hermalin, B. E. and Weisbach, M.S. (2003). Board of Directors as an Endogenously Determined
Institution: A Survey of the Economic Literature, Economic Policy Review, 9 (1): 7-26.
Hermalin, B.E., & weisbach, M.S. (2006). The market for corporate Control. Journal of
Financial Economics, 11(1-4), 5-50.
Higgs Report. (2003). Review of the role and effectiveness of non-executive directors.London:
Department of trade and industry, HMSO.
Hossain, M., Cahan, F. and Adams, B. (2000). The Investment Opportunity Set and the
Voluntary Use of Outside Directors: New Zealand Evidence.Accounting and Business
Research, Vol. 30, pp. 263-273.
Bhojraj, S., & Sengupta, P. (2003). Effect of Corporate Governance on Bond Ratings and Yields:
The Role ofInstitutional Investors and Outside Directors. The Journal of Business, 76, 3,
455-475.
Hutchinson, M (2002): An Analysis of the Association between Firms’ Investment
Opportunities, Board Structure, and Firm Performance, Asia Pacific Journal of
Accounting and Economics, 9, 17-39.
Jack, R., & Keller, M. (2002). The black box of board process: Gaining access to a difficult
subject. Corporate Governance: An International Review, 15(5), 843-851.
Jelic, E., &Briston, M. (2001). The separation of ownership and control. Journal of Law and
Economics, 26, 301 – 325.
56
Jensen, M. C., & W. J. Meckling (2006), Theory of the Firm: Managerial Behavior, Agency
Costs and Ownership Structure, Journal of Financial Economics, 3 (4): 305-360.
Jensen, M.C. (2001). Value maximization, stakeholder theory, and the corporate objective
function. Working Paper No. 01-01, Harvard Business School.
Jensen, M.C. (2003). The Modern Industrial Revolution, Exit, and the Failure of Internal Control
Systems.Journal of Finance, 48, 3, 831-880
Jesover, F. and Krikpatrick, G. (2005), The Revised OECD Principles of Corporate Governance
and their Relevance to the Non-OECD Countries, Corporate Governance: An
International Review, 13 (2): 127-136.
John, K & Senbet, L.W. (2008). Corporate Governance and Board Effectiveness. Journal of
Banking and Finance.
Johnson, S. (2006). Bankruptcy, boards, banks and blocks holders: Evidence on changes on
corporate ownership and control when firms default. Journal of Financial Economics, 27:
355–387.
Keasey, K, Thompson, S and Wright, M (1997): “Introduction: The Corporate Governance
Problem-Competing Diagnoses and Solutions” In Keasey, K., Thompson, S. and Wright,
M. (Eds.), Corporate Governance: Economics, Management, and Financial Issues.
Oxford University Press, Oxford, UK.
Kesner, I.F., Victor, B., &Lamont, B.T. (2006). Board Structure and Commission of Illegal Acts:
An Investigation of Fortune 500 Companies, Academy of Management Journal, 29(4):
789-799.Leblanc, R. W. (2004), What’s Wrong with Corporate Governance: A Note,
Corporate Governance: An International Review, 12 (4): 436-441.
Klein, S.B. (1998). A limited rationality model of interlocking directorates. Academy of
Management Review, 8. 206–217.
Klein, S.B. (2008). The shock doctrine: The rise of disaster capitalism. New York, NY:
Metropolitan Books.
Kiel, N. (2010). The separation of ownership and control. Journal of Law and Economics, 26,
301 – 325.
Lazaridis, D. (2006). Factors affecting the number of outside directorships held by CEOs.
Journal of Financial Economics. 40. 81-104.
57
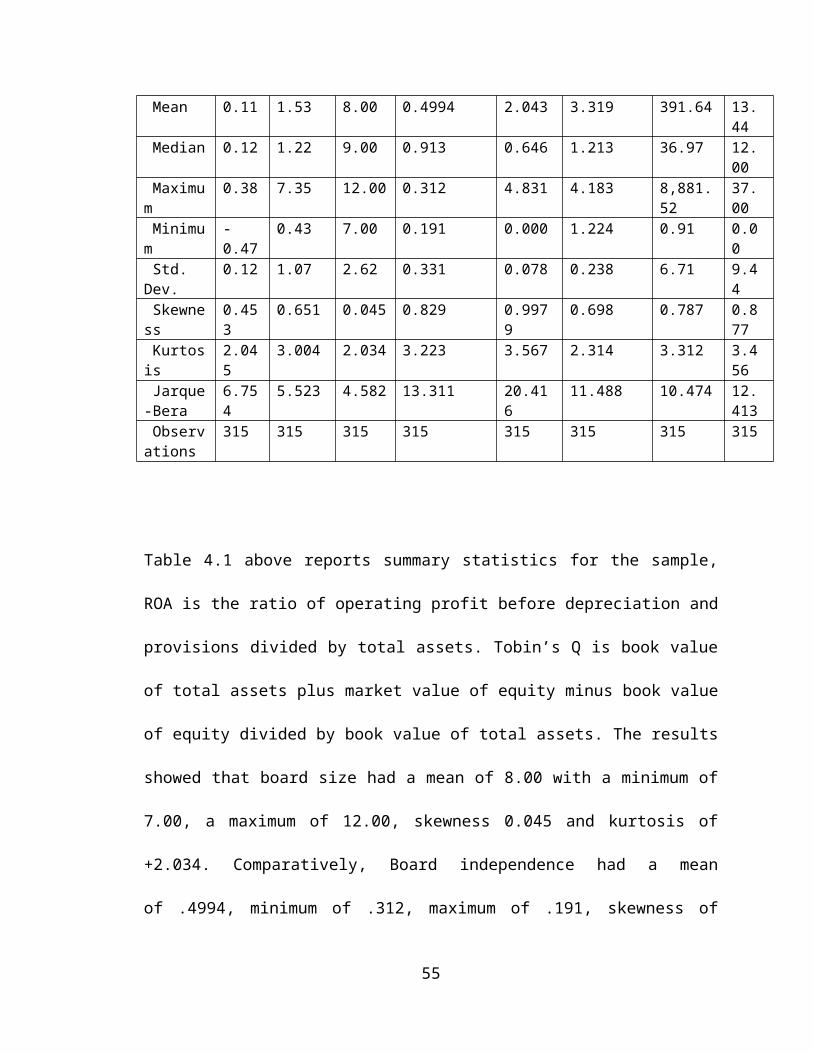
Letting.N,Aosa.E & Machuki.V(2012).Board Diversity and Performance of Companies Listed in
Nairobi Stock ExchangeInternational Journal of Humanities and Social Science Vol. 2 No.
11; June 2012
Kopp, L.S., & Bierstaker, J.L. (2006). Auditors’ memory of internal control information, the
effect of documentation preparation versus review, in Vicky Arnold, B. Douglas Clinton,
Peter Luckett, Robin Roberts, Chris Wolfe, Sally Wright (ed.) Advances in Accounting
Behavioral Research (Advances in Accounting Behavioral Research, No.9), 27 – 50.
Lipton, I., & Lorsch, N. (2002). Corporate Governance and Firm Performance in Russia:An
Empirical Study. Journal of World Business, 38, 4, 385-396.
Mangenelli, T., &Klein, S.B. (1999). Strategists on the board. Organisation Studies, 20, 47-74.
Maati, F. (2009). Corporate Governance, Competition, and Performance.New Directions in
Corporate Governance, 3(2), 23-71.
Mayer, C. (2007). Developing the Rules for Corporate Governance. Business Daily, August 01,
2007.
Marinova, A, Adjasi, K D C & Abor J (2006), Corporate Governance and Firm Performance:
Evidence from Ghanaian Listed Firms”, Journal of Corporate Ownership and Control,
4(1): 123-132.
Mbaru, J (2008): The Role of Regulatory Bodies in Capital Market Development: The Kenyan
Experience presented at an International Conference on "Promoting of Capital
Markets ", Beijing, China, 16-19 December.
Mugenda, A. & Mugenda, O (2003). Research Methods: Qualitative and Quantitative
Approaches. Nairobi: Acts Press.
Mugenda, A. &Mugenda,O. (2009). Research Methods: Qualitative and Quantitative
Approaches. Nairobi: Acts Press.
Munene M. P (2007), “The Relationship between Board structure and firms performance – A
Case Study of the NSE”, Unpublished MBA Project Report, Kenyatta University.
Munga K. S (2012). The impact of Board diversity on Nairobi stock exchange and Kenya's
manufacturing firms. Unpublished MBA dissertation, School of Business, Moi
University.
58
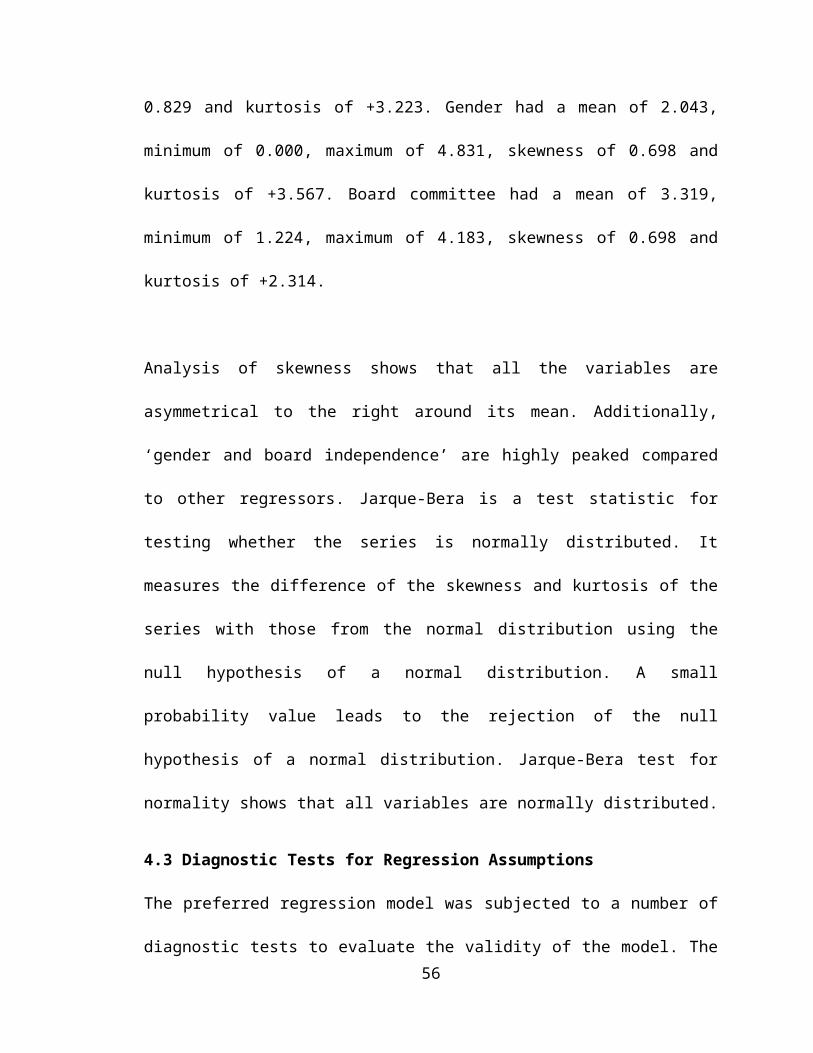
Munter, R., & Kren, H. (2005). Is Corporate Governance Different for Bank Holding
Companies? EconomicPolicy Review, 9, 123-142.
Murage, H.N. (2010), Relationship between Corporate Governance and Financial performance of
Parastatals in Kenya, unpublished MBA project.
Musila, G (2007). Leadership Structure: Separating the CEO and Chairman of the Board.
Journal of Corporate Finance, 3(3), 189-220.
Mwangi, B.M. (2007). Corporate governance practices in developing countries, a case of Kenya.
International journal of Business Administration, 2(1), 14-40.
Naser, K. & Mokhtar, S. (2011). Emerging Economies, Institutional Voids, and the Role of Busy
Boards in Firm Performance. Purdue University (Unpublished)
Ongore. V.O, A. & K’Obonyo P.O. (2011). Effects of Selected Corporate
GovernanceCharacteristics on Firm Performance: Empirical Evidence from
Kenya.InternationalJournal of Economics and Financial Issues 1. 3. 2011, 99-122.
O’Sullivan, N. (2000). The Impact of Board Composition and Ownership on Audit Quality:
Evidence fromLarge UK Companies. The British Accounting Review, 32, 397-414.
Ozawa A. (2006). Contests for Corporate Control. Corporate Governance and Economic
Performance in the United States and Germany, (New York: Oxford University Press)
Padachi, C.B. (2006). Elite Directors and Firm Performance. Unpublished Master’s Thesis,
Stockholm School of Economics.
Park, Y. W., & Shin, H. H. (2003). Board Structure and Earning Management in Canada.
Journal of Corporate Finance, 185, 1-27.
Pearce, J. A. & Zahra, S.A (2002). Board Structure from a Strategic Management. Perspective.
Journal of Management Studies, 29 (4), 411 – 438.
Pfeffer, J. (2007). Organizational demography. In L. L. Cummings, & B. M. Staw (Eds.),
Research inorganizational behaviour, 5, 299-357. Greenwich, CT: JAI Press.
Powers, William T. (2005). Behavior. The control of perception. New Canaan. Benchmark
Publications. Chinese tr. (2004) Guongdong Higher Learning Education Press,
Guangzhou, China.
59

Preda Code (2002). Self Regulatory Code. Committee for the Corporate Governance ofListed
Companies. Borsa Italiana
Private Sector Initiative for Corporate Governance. (2009). Principles for Corporate
Governance in Kenya and a Sample Code for best Practice for Corporate Governance.
Nairobi: Private Sector Corporate Governance Trust.
Rafuse, M.E. (2006). Working capital management: Anurgent need to refocus. J. Manage.
Decis., 34(2):59-63.
Rashid, A. (2011). Board Structure Board Leadership Structure and Firm Performance: Evidence
from Kenya. A Paper for Inclusion in the Accounting and Finance Association Australia
and New Zealand Annual Conference Adelaide, July 5-7th.
Rashid, A; De Zoysa, A; Lodh, S; & Rudkin, K; (2010). Board structure and Firm performance:
Evidence from Kenya, Australian Accounting Business and Finance Journal 4(1), 2010,
76-95.
Roberts, J., McNulty, T., & Stiles, P. (2005). Beyond agency conceptions of the work of the non-
executive director: Creating accountability in the boardroom. British Journal of
Management, 16(5), 26.
Robson, G. (2000). Business Ethics and Coporate Governance in Africa. Johannesburg.
Rose, D. (2007). Outside Directorships and corporate performance. Journal of Financial
Economics, 27, 389–410.
Roth, Alvin E (1997).Turnaround Time and Bottlenecks in Market Clearing: Decentralized
Matching in the Market for Clinical Psychologists. Journal of Political Economy, 105(2):
284-329, April.
Sahin, K., Basfirinci, C. S., & Ozsalih, A. (2011). The impact of board structure on
coporatefinancial and social responsibility performance :Evidence from public-listed
companies in Turkey.African Journal of Business Management, 5(7): 2959-2978.
Shleifer, A., & Vishny, R. (2007). A survey of corporate governance. The Journal of Finance,
52, 737-783.
Senbet, T. (2005). Corporate Governance Mechanisms and Firm Financial Performance in
Nigeria. AERC Research Paper, No. 149.
Smith, A. (2006). CEO involvement in the selection of new board members: An empirical
analysis, Journal of Finance 54, 1829-1853.
60

Tangen, M.S. (2003). An empirical analysis of the relation between the board of director’s
structure and financial statement fraud. The Accounting Review, 71, 443-465.
Thomas, A., & Ely, D. (2006), CEO involvement in the selection of new board
members: An empirical analysis, Journal of Finance 54, 1829-1853.United Nations
Economic Commission for Africa (UNECA) (2008): The African Economie in
Perspective presented at an International Conference on "Promoting Capital Markets in
Africa", Abuja, Nigeria, 11-13 November.
Wegge, M. (2008). “Outside directors and CEO turnover”. Journal of Financial Economics, 20:
431–60.
Weidenbaum, M. L. (2006), Updating the Corporate Board, Journal of Business Strategy, 7 (1):
77-83.
Weisbach, M. (2008). “Outside directors and CEO turnover”. Journal of Financial Economics,
20: 431–60.
William Glasser Institute. (2006). Quality schools. Retrieved June 15, 2007:
William Glasser, Schools Without Failure (New York: Harper & Row, 1969),
Yermack, D. (1996). Higher market valuation of companies with a small board of directors.
Journal ofFinancial Economics, 40, 2, 185–211
Zahra, L. & Pearce, P. (2009). Corporate governance.in Peter Newman (ed.), The New Palgrave
Dictionary of Economics and the Law, London: Macmillan, 497-502.
61
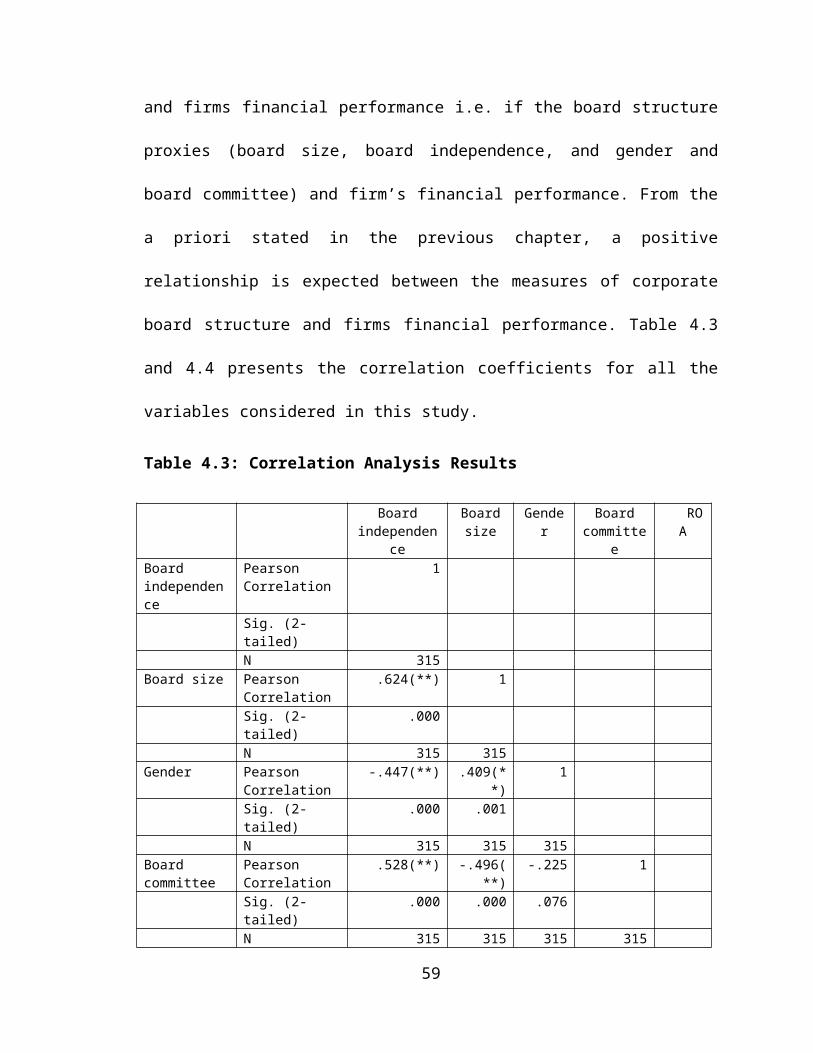
APPENDICES
APPENDIX I: COMPANIES LISTED ON THE NSE AS AT 31ST DECEMBER
2013
Kapchorua Tea Co. Ltd
Kakuzi
Limuru Tea Co. Ltd
Rea Vipingo Plantations Ltd
Sasini Ltd
Williamson Tea Kenya Ltd
COMMERCIAL AND SERVICES
Express Ltd
Kenya Airways Ltd
Nation Media Group
Standard Group Ltd
TPS Eastern Africa (Serena) Ltd
Scangroup Ltd
Uchumi Supermarket Ltd
Hutchings Biemer Ltd
TELECOMMUNICATION AND TECHNOLOGY
AccessKenya Group Ltd
i

Safaricom Ltd
AUTOMOBILES AND ACCESSORIES
Car and General (K) Ltd
CMC Holdings Ltd
Sameer Africa Ltd
Marshalls (E.A.) Ltd
BANKING
Barclays Bank Ltd
CFC Stanbic Holdings Ltd
Diamond Trust Bank Kenya Ltd
Housing Finance Co Ltd
Kenya Commercial Bank Ltd
National Bank of Kenya Ltd
NIC Bank Ltd
Standard Chartered Bank Ltd
Equity Bank Ltd
Co-operative Bank of Kenya Ltd.
INSURANCE
Jubilee Holdings Ltd
Pan Africa Insurance Holdings Ltd
Kenya Re-Insurance Corporation Ltd
ii

INVESTMENT
City Trust Ltd
Olympia Capital Holdings ltd
Centum Investment Co Ltd
MANUFACTURING AND ALLIED
B.O.C Kenya Ltd
British American Tobacco Kenya Ltd
Carbacid Investments Ltd
East African Breweries Ltd
Mumias Sugar Co. Ltd
Unga Group Ltd
Eveready East Africa Ltd
Kenya Orchards Ltd
A.Baumann CO Ltd
CONSTRUCTION AND ALLIED
Athi River Mining
Bamburi Cement Ltd
Crown Berger Ltd
E.A.Cables Ltd
E.A.Portland Cement Ltd
iii

ENERGY AND PETROLEUM
KenolKobil Ltd
Total Kenya Ltd
KenGen Ltd
Kenya Power & Lighting Co Ltd
Source, NSE report, 2013
iv
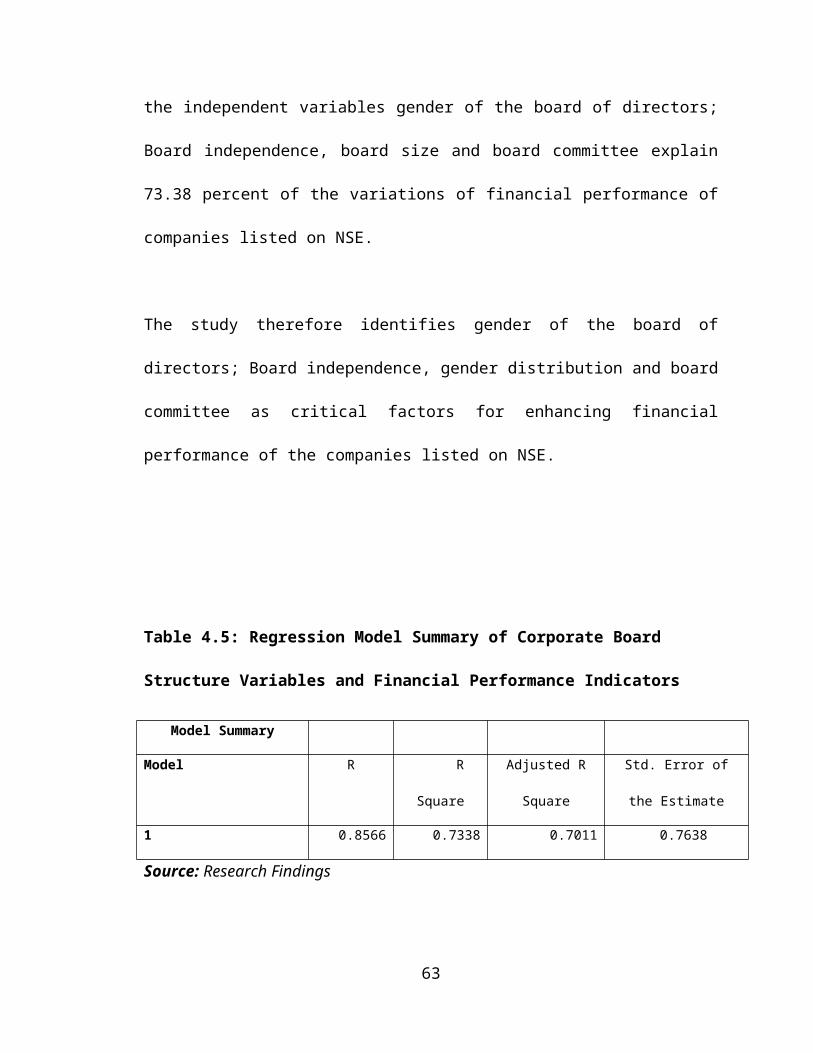
APPENDIX 1I: RAW DATA
Data collection sheet for the relationship between corporate board structure and
financial performance of companies listed at Nairobi security exchange
Board
independenceGender Board Size Board Committee ROA
Eaagads Ltd
NSE 4
34.05
8 3 0.321
Kapchorua Tea Co.
Ltd
NSE 3
34.05
7 3
0.422
Kakuzi
NSE 2
39.85
9 30.212
Limuru Tea Co. Ltd
NSE 5
34.94
9 20.321
Rea Vipingo
Plantations Ltd
NSE 4
32.23
8 4
0.512
Sasini Ltd
NSE 4
44.25
6 3 0.412
Williamson Tea Kenya
Ltd
NSE 3 49.10 6 3
v
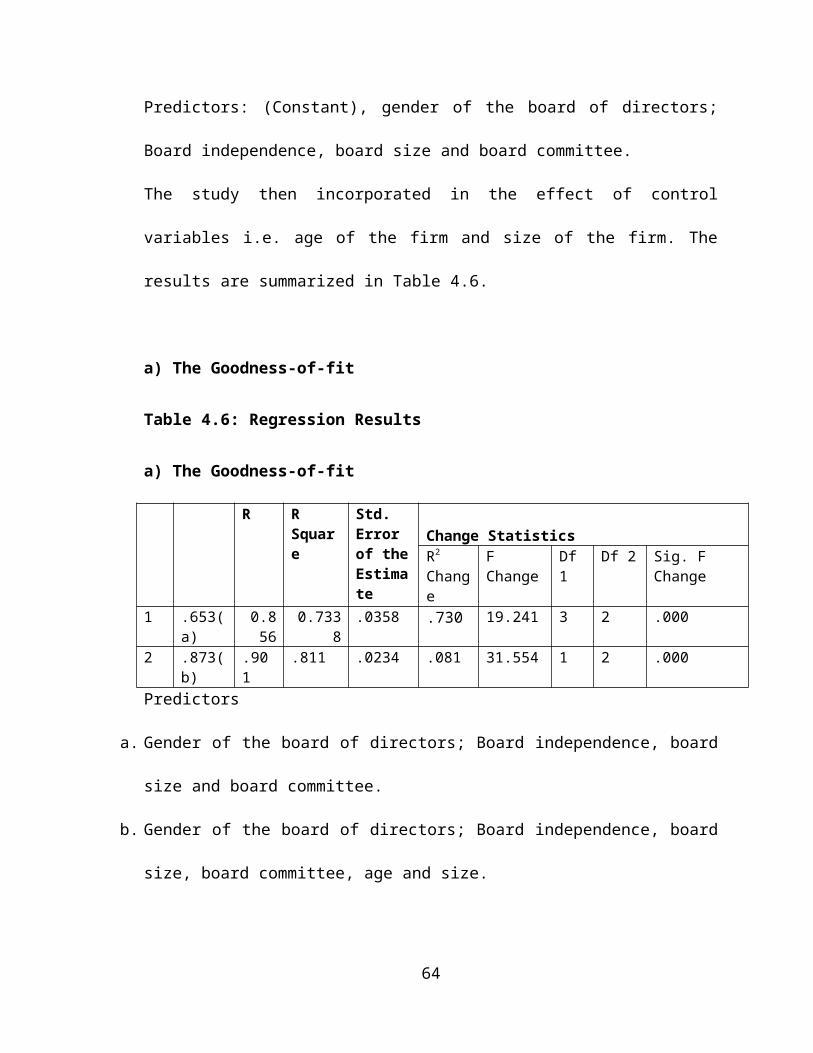
0.232
Express Ltd
NSE 5
30.94
9 3 0.613
Kenya Airways Ltd
NSE L 3
37.90
8 4
0.413
Nation Media Group
NSE 4
31.99
9 30.372
Standard Group Ltd
NSE 3
32.025
9 40.321
TPS Eastern Africa
(Serena) Ltd
NSE 5
38.69
9 3
0.421
Scangroup Ltd
NSE 3
34.05
7 30.562
Uchumi Supermarket
Ltd NSE 6
34.05
7 3 0.622
Hutchings Biemer Ltd
NSE 5
39.85
6 2 0.342
AccessKenya Group
Ltd NSE 3
34.94
9 3 0.421
Safaricom Ltd NSE 3
32.23
9 3 0.312
vi
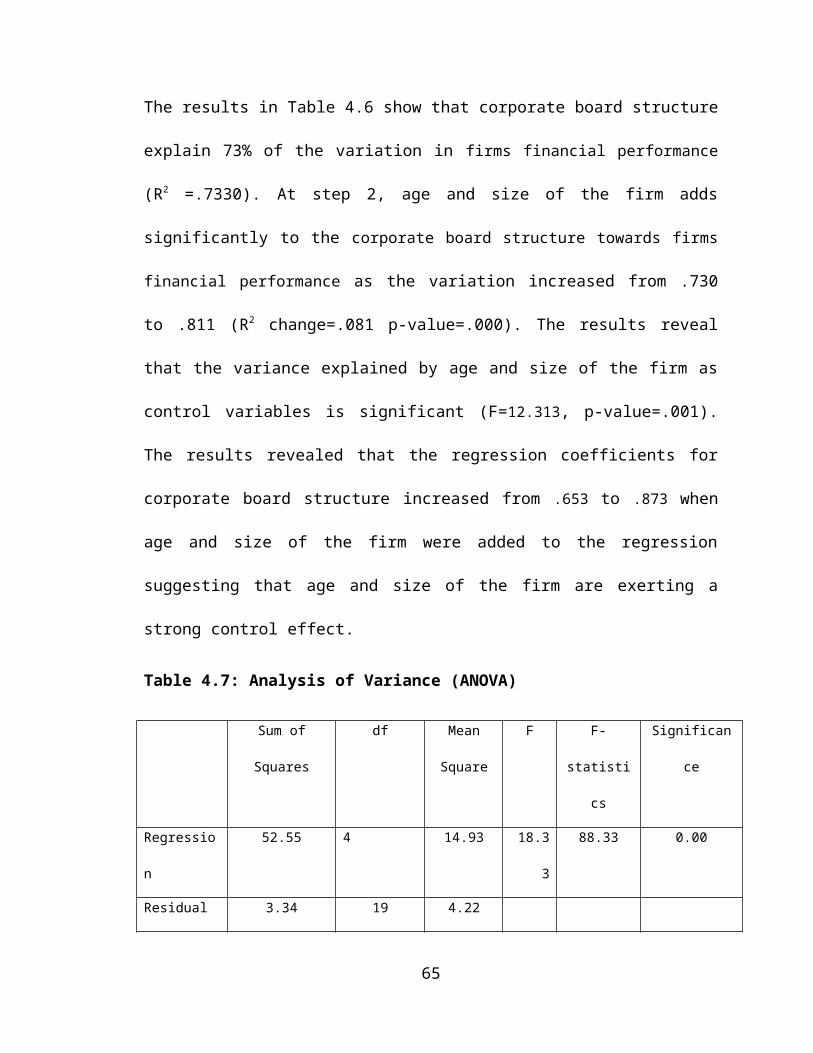
Car and General (K)
Ltd NSE 2
38.01
7 3
0.289
CMC Holdings Ltd
NSE 2
43.32
6 20.812
Sameer Africa Ltd
NSE 5
39.04
7 2 0.415
Marshalls (E.A.) Ltd
NSE 5
32.29
8 4 0.321
Barclays Bank Ltd
NSE 5
9
9 4 0.413
CFC Stanbic Holdings
Ltd
NSE 4
32.77
9 2
0.423
Diamond Trust Bank
Kenya Ltd
NSE 2
36.35
8 3
0.321
Housing Finance Co
Ltd
NSE 5
34.40
9 3
0.321
Kenya Commercial
Bank Ltd NSE 2
40.74
9 3 0.413
National Bank of
Kenya Ltd
NSE L 4
43.60
9 3
0.324
vii
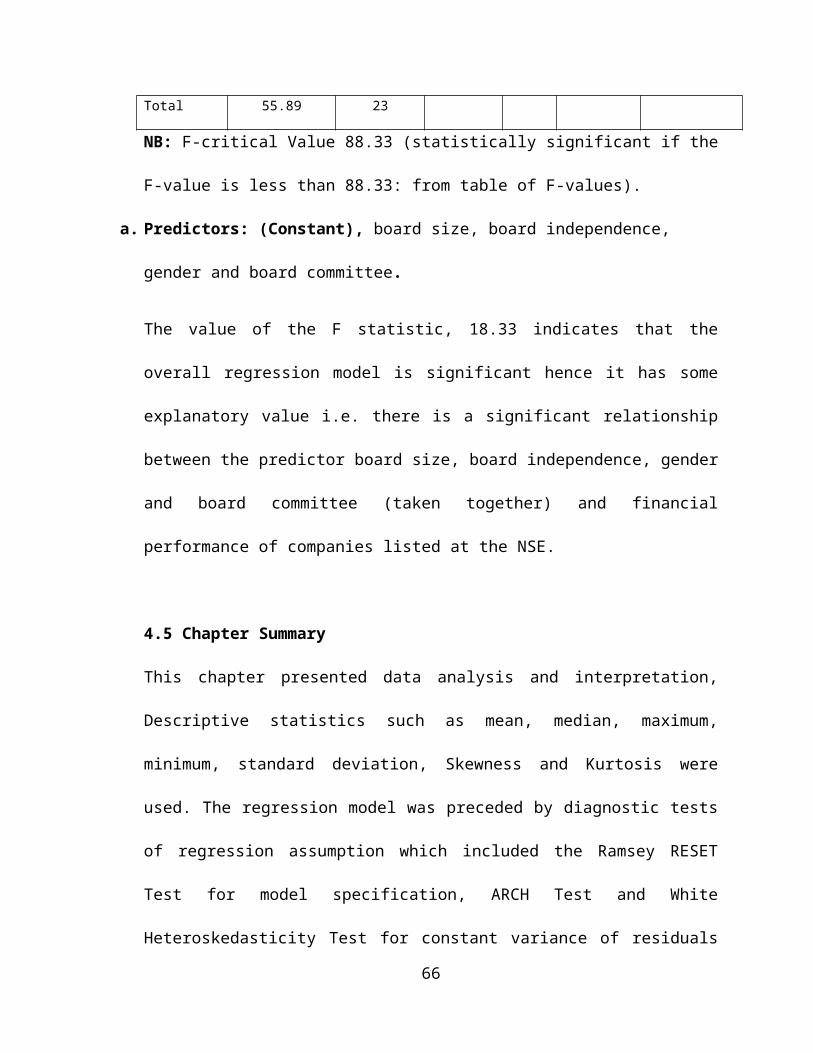
NIC Bank Ltd
NSE 5
39.02
7 8 0.413
Standard Chartered
Bank Ltd
NSE 3
35.46
6 9
0.378
Equity Bank LtdLOCAL 3
37.54
4 9 0.423
Co-operative Bank of
Kenya Ltd. NSE 4
38.65
4 9 0.372
Athi River Mining
NSE 4
32.58
5 80.423
Pan Africa Life
Assurance Company NSE 6
36.67
5 8 0.315
B.O.C Kenya LtdNSE 5
41.10
5 8 0.432
British American
Tobacco Kenya Ltd
NSE 2
43.82
5 7
0.423
Carbacid Investments
Ltd
NSE
5
41.77
4 6
0.267
East African Breweries
Ltd
NSE
4
38.83
6 8
0.415
Mumias Sugar Co. LtdNSE
5
38.51
7 9 0.534
viii
Unga Group LtdNSE
4
37.02
6 9 0.325
Eveready East Africa
Ltd
NSE
3
34.25
4 7
0.462
Kenya Orchards Ltd
A.Baumann CO Ltd
NSE
6
30.64
5 6
0.432
Bamburi Cement LtdNSE
6
31.72
7 9 0.392
Crown Berger LtdNSE
2
43.02
6 7 0.423
Source, NSE report, 2013
ix