december 2011 status update ed quitoriano
DESCRIPTION
GUNS The Illegal Trade in Small Arms and Light Weapons. December 2011 Status Update Ed Quitoriano. Hypothesis of the Study. Illegal trade and proliferation of firearms undermine state building and prolong the duration of conflicts - PowerPoint PPT PresentationTRANSCRIPT

December 2011 Status UpdateEd Quitoriano
GUNSThe Illegal Trade in Small Arms and Light
Weapons

Hypothesis of the Study
• Illegal trade and proliferation of firearms undermine state building and prolong the duration of conflicts
• Sub-hypothesis 1: illegal trade and proliferation of firearms undermines state function in providing protection and policing against crime
• Sub-hypothesis 2: illegal trade and proliferation of firearms undermines state functions in providing welfare to its citizens

Research Questions
• How illegal trade in firearms shaped and is shaped by the conflict
• Link of illegal trade in firearms to state building
• Violence and protection and the functions of illegal and licensed firearms
• Illegal trade in firearms and state functions in protection and citizens’ welfare

Theoretical Framework
• Kalyvas (2006) theory of civil war violence (selective violence)• The importance of collaboration and corresponding
dilemmas when sovereignty is fragmented (mutual presence of state and non-state armed actors)
• The importance of control to maintain collaboration and prevent defection
• The role of selective violence in maintaining control• Local cleavages and individual agency in selective violence
(privatization of violence)• Role guns in reinforcing selective violence and fragmentation
of sovereignty
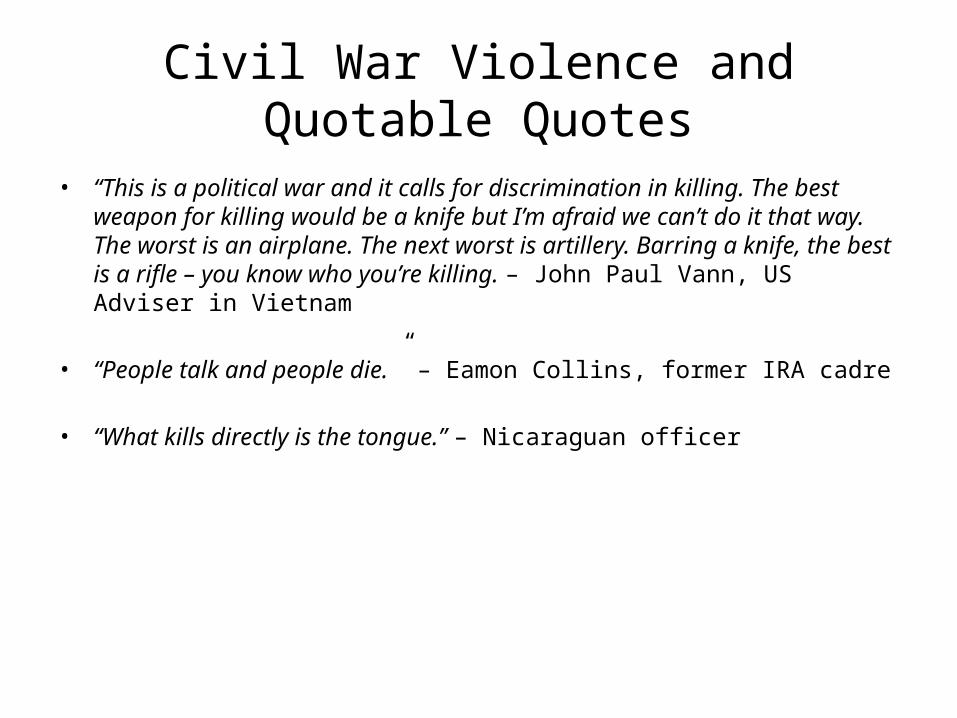
Civil War Violence and Quotable Quotes
• “This is a political war and it calls for discrimination in killing. The best weapon for killing would be a knife but I’m afraid we can’t do it that way. The worst is an airplane. The next worst is artillery. Barring a knife, the best is a rifle – you know who you’re killing. – John Paul Vann, US Adviser in Vietnam
• “People talk and people die.” – Eamon Collins, former IRA cadre
• “What kills directly is the tongue.” – Nicaraguan officer

Methods Applied
• Literature review• Secondary data collection (statistical data)• Life history – ‘conversations’; but in actual field
conduct ‘mediated conversations’ due to issues of trust and security; also, “no names” preconditions of the life history tellers
• The researcher mobilized third parties who are previously known to and trusted by the life history tellers
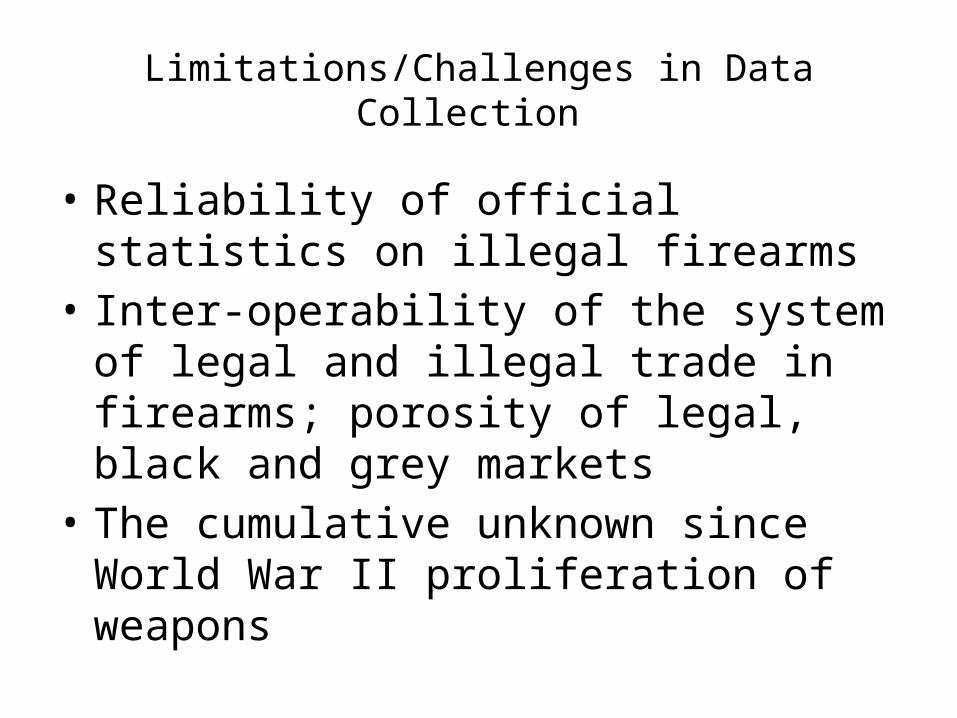
Limitations/Challenges in Data Collection
• Reliability of official statistics on illegal firearms
• Inter-operability of the system of legal and illegal trade in firearms; porosity of legal, black and grey markets
• The cumulative unknown since World War II proliferation of weapons

Collected Data (1)
• Life histories: broker, facilitator-transporter, gun collector, legal traders/importers, media-observer, gun shop owners
• Registered/Licensed Firearms: 1990-2007 and 2010 (national figures)
• 1990-2007 trend in legal purchases (highest during 1996 peace agreement, lowest during 2000 war in Mindanao)
• 2010 regional distribution of licensed and loose firearms
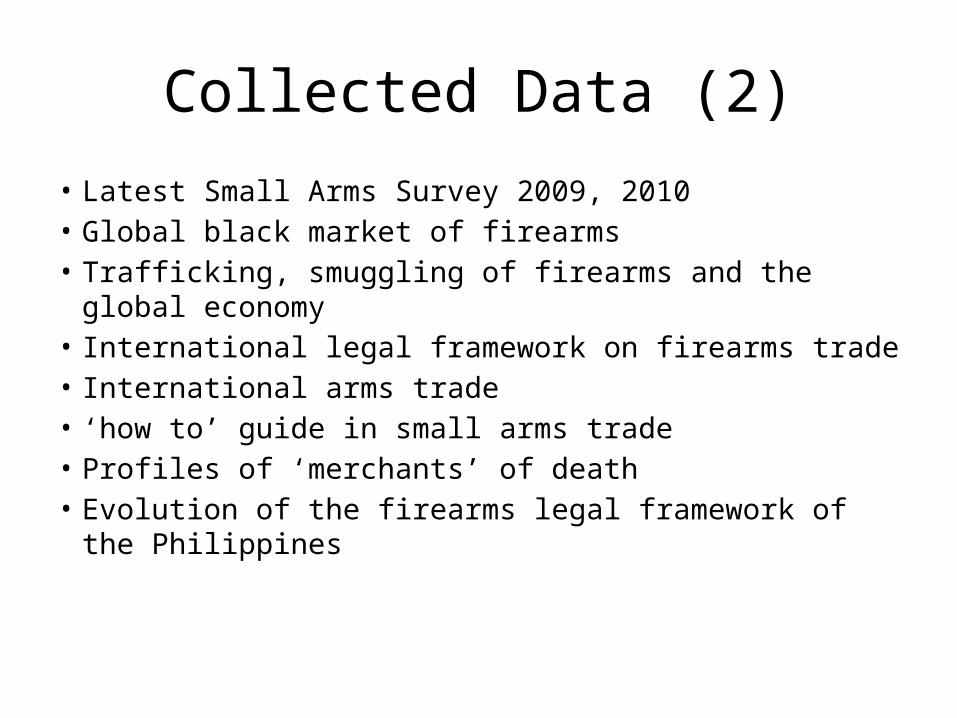
Collected Data (2)
• Latest Small Arms Survey 2009, 2010• Global black market of firearms• Trafficking, smuggling of firearms and the global economy• International legal framework on firearms trade• International arms trade• ‘how to’ guide in small arms trade• Profiles of ‘merchants’ of death• Evolution of the firearms legal framework of the Philippines

End Users
Trader
Supplier
Supply Side
Demand Side
Trader’s Intermediary
Freelance Intermediary
Buyer’s Intermediary
Structure of the Illegal Trade in Firearms(Gathered from Life Histories)
Non-Hierarchical Bargaining Field

Legal and Illegal Structures of Protection
Legal Inventory
Illegal Inventory
Illegal Supply Black &
GreyMarkets
Brokers
MILF
Politicians
Business Elites
Crime Syndicates
CPP-NPA
Conflict Fields
Private Individuals
Security Agencies
System of the Illegal Trade in Firearms
(Gathered from Life Histories)
Financial Incentives
Profit Margins and Rents from Protection
Multifunctional and Multi-directional Demand Structure

The Function-Based Incentive Structure in Illegal Firearms Trade
(Gathered from Life Histories)
Black & Grey Markets
Supply Side
Demand Side
Rents from protectionCash conversion of inventoryRecycling of recovered loose firearmsForce multiplier for state security functionsStrengthen power of local elitesIncremental price gains in transactions
private protectionPower projection Leverage in political bargainingEnhancement of belligerency claim Economic protectionMilitary (force) multiplierFill gaps in state protection

Registered/Licensed Firearms, 1990-2008PNEMO 6= Presidential National Emergency Memorandum Order No. 6 of 1990; PNEMO 6 cancelled licenses of all registered firearms. The 1994 Amnesty Program offered to legitimize all loose firearms.
19901991
19921993
19941995
19961997
19981999
20002001
20022003
20042005
20062007
20080
50,000
100,000
150,000
200,000
250,000
300,000
350,000
400,000
450,000
500,000
Firearms Data (1990-2008)
Registered before PNEMO 6
Licensed under Amnesty Program
Licensed, Purchased from Gun DealersWhere have they gone?

Licensed Guns Purchased from Gun Dealers, 1990-2007Cumulative Total:752,752
19901991
19921993
19941995
19961997
19981999
20002001
20022003
20042005
20062007
20080
10,000
20,000
30,000
40,000
50,000
60,000
70,000
80,000
90,000
100,000
Licensed and Purchased from Gun Dealers
GRP-MNLF Peace Agreement
GRP All Out War against the MILF

Distribution of Loose and Licensed Firearms, Philippines, as of 2010
1.39 million (73%)(1.1 million or 80% in NCR)
148,900 (8%)
358,250 (19%)
Loose Firearms:1,905,679 (67.3%)
Licensed Firearms:929,034 (32.7%)
675,26972.6%( 270,822 or 30% in NCR)
119,747(12.8%)
134,018(14.4%)
Total Firearms:2,834,713
2.06 million
268,647
492,268

Increasingly armed population (Philippines): Licensed firearms density, 1990, 1995, 2000, 2005, 2008
Philippines
0 50 100 150 200 250 300 350 400
19901995200020052008129:1 76:1
65:1
61:1
56:1

Loose Firearms and Crime, Philippines, as of 2010
3,030 (99.6%)
1,321 (99.6%)
1,528 (98.4%)
Loose Firearms Used:6,035 (99.3%)
Licensed Firearms Used: 40
11
5
25
Crime Incidents: 5,779Firearms Used: 6,075
Crime Incidents: 2,997
Firearms Used: 3,041
Crime Incidents: 1,292
Firearms Used:1,326
Crime Incidents: 1,490
Firearms Used:1,553

Distribution of Loose and Licensed Firearms in Mindanao, as of 2010
32%
17%
14%
12%13%
12%
20,203 FAs
42,231 Fas(61% of total in the region)
62,718 Fas(74% of total in the region)
Philippines 2010: 1 Loose Firearm per 49 persons
Licensed:134,018(27%)
Loose:358,250(73%)
Total:492,268
114,189 Fas(85% of total in the region)
26,514 FAs
22, 210 FAs
R10 Total:68,745
ARMM Total:134,392
R12 Total:84,928
44.5% of all firearms in Mindanao are in ARMM and Central Mindanao

Citizens’ Access to Firearms in Mindanao
Northern Mindanao
Central Mindanao
ARMM
102:1
65:1
31:1
164:1
184:1
176:1
Population : Firearm Ratio (2010)
Loose Licensed

How and where else to buy?
By SMS or Mobile Phone Online

Initial Findings (1)• Illegal firearms density bigger than what is officially known (unknown
cumulative effect since World War II)• Sub-national (regional) bias in illegal firearms distribution; at national
level, concentration in NCR; at Mindanao level, concentration in ARMM
• Tolerance of the legal and institutional framework to gun possession and illegal trade in firearms
• Close association between legal and illegal trade through the black and grey markets
• Significant role of hidden structures within the state in the proliferation of the illegal trade in firearms
• Weak, if not absent, legislative oversight on firearms trade (legal and illegal)

Initial Findings (2)• Crimes and Guns: 99% of gun-related crimes are with the use of loose firearms
(both at national and sub-national levels)• Dichotomy in guns: licensed gun to protect; unlicensed gun to kill• The volume of firearms in the hands of the civilian population (2.8 million
firearms) is 5 times bigger than the firearms in the hands of the security forces• At the national level, there are 2 loose firearms for every licensed firearm• At the Mindanao level, there are 2.6 loose firearms for every licensed firearm• At the ARMM level, there are 5.6 loose firearms for every licensed firearm• In the ARMM, the total number of firearms (licensed and illegal) could arm 10
Army Divisions• At the national level, the firearms in the hands of citizens could equip an army of
2.8 million combatants

Initial Findings (3)• Illegal firearms: 73% in Luzon Island; • In Mindanao, 50% of illegal firearms in Central Mindanao and
ARMM• From life histories: system and structure of the illegal firearms
trade based on non-hierarchical bargaining structure• From life histories: function incentive structure in the illegal
firearms trade (supply and demand side)• From 1990-2008 official statistics on legal gun purchases: increasing
density of licensed firearms to population – from 1:129 to 1:56• From 2010 official statistics on loose firearms: differently armed
populations – 1:49 national average; 1:102 in Northern Mindanao, 1:31 in ARMM

Perplexing Data: Crime, Conflict and Firearms - between Conflict-Prone and Less Conflict-Prone Regions
Source: PNP-FED 2010
2008 2009 2010
Crimes 113 265 418
Loose Firearms Used 118 280 436
Licensed Firearms Used 1 1 0
25
75
125
175
225
275
325
375
425
475
Crime Incidents and Firearms Used
Region 10, 2008-2010
2008 2009 2010
Crimes 144 134 82
Loose Firearms Used 155 135 86
Licensed Firearms Used 0 3 2
10
30
50
70
90
110
130
150
170
Crime Incidents and Firearms Used
ARMM 2008-2010

Low ARMM Index Crime Volume (2009): effective deterrent or “smoothening” of data?
NCR
Region 9
Region 10
Region 11
Region 12
CARAGA
ARMM
40969
9612
27240
18652
12337
7966
1228
Reported Index Crimes in Selected Regions, 2009

Index & Non-Index Crime Ratios, 2001-2009: high crime ratio in the center of power and law enforcement
2001 2002 2003 2004 2005 2006 2007 2008 2009
Phils
48.5 54.6 52.1 51.1 51.6 47.8 41.8 40.4 327.1
NCR
78 90.6 97 90.9 90 89 80.1 81.9 359.3
Outside NCR
44.1 49.2 45.6 45.3 38.4 34.1 32.6 33.5 217.9
2575
125175225275325
Index Crime Ratio per 100,000 Population, 2001-2009
2001 2002 2003 2004 2005 2006 2007 2008 2009
Phils
49.5 52.4 50.1 41.4 69 78.5 75.6 73 164.1
NCR
68.1 96 103 75.7 69 78.5 75.6 73 164.1
Outside NCR
46.7 46 42.3 36.4 34 27.5 26.2 27.8 225.5
2575
125175225275325
Non-Index Crime Ratio per 100,000 Population, 2001-2009

Very low Under 5 child mortality rate in the ARMM: efficient service delivery or “smoothening” of data?
1998 1999 2000 2001 2002 2003 2004 2005 2006
Phils 55 42 22 22 21 20 18 18 19
NCR 39 31 31 30 27 26 24 25 25
10 Northern M 65 49 15 16 16 15 14 14 15
ARMM 98 72 24 6 7 7 6 7 6
5
15
25
35
45
55
65
75
85
95
Mortality Rate (under 5 y/o) in the Philippines & Selected Regions, 1998-2006
per 1
,000
live
birt
hs
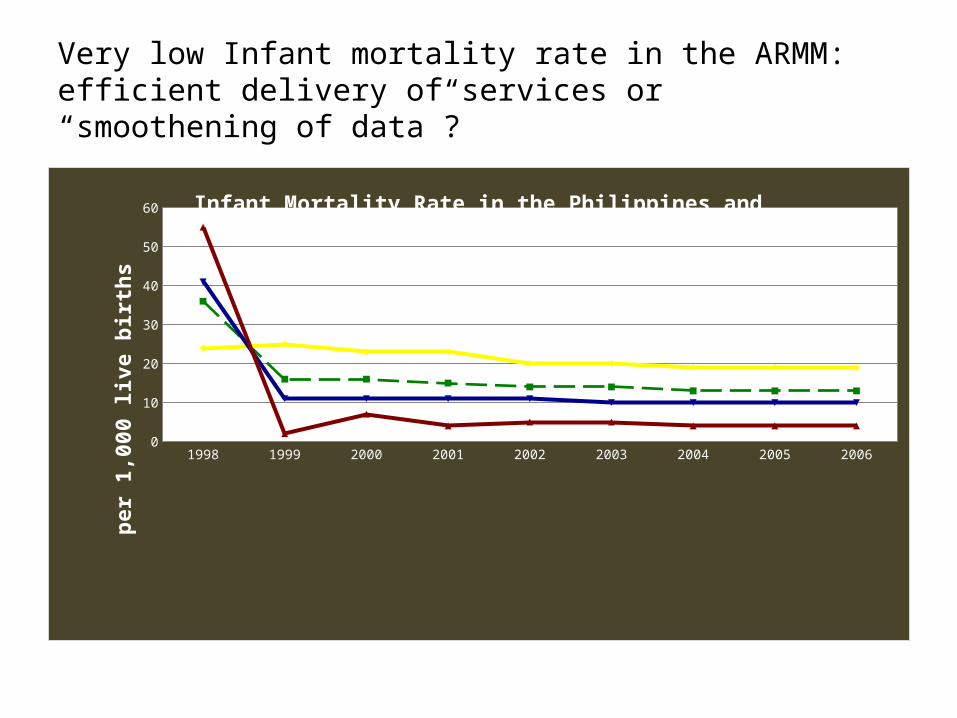
Very low Infant mortality rate in the ARMM: efficient delivery of services or “smoothening of data”?
1998 1999 2000 2001 2002 2003 2004 2005 2006
Philippines 36 16 16 15 14 14 13 13 13
NCR 24 25 23 23 20 20 19 19 19
Region 10 41 11 11 11 11 10 10 10 10
ARMM 55 2 7 4 5 5 4 4 4
5
15
25
35
45
55
Infant Mortality Rate in the Philippines and Selected Regions, 1998-2006
per 1
,000
live
birt
hs

Male-Female Life Expectancy, 2000-2010
Phils NCR Region 9 Region 10
Region 11
Region 12
Region 13
ARMM
70.14
73.15
68.18 68.61 67.91 68.8466.99
59.3
71.64
74.35
70.18 70.61 69.9170.84
69.29
61.82
Life Expectancy - Female2000-2005 2005-2010
Phils NCR Region 9 Region 10
Region 11
Region 12
Region 13
ARMM
64.11
66.11
62.61 63.38 63.62 63.9161.94
55.5
66.1167.61
64.6165.38 65.62 65.91
63.94
57.99
Life Expectancy - Male2000-2005 2005-2010

Next steps
• Continue with literature review• Iterate life history collection • Collect 10-year panel data on loose firearms • Generate data on other state functions (quality
and costs of services) such as policing (gun related crimes), health, education and promotion of tourism; compare performance of high firearms density (ARMM, Central Mindanao) and low firearms density (Northern Mindanao)

Thank You!